Embed Size (px)
Citation preview
Visibility Labora tory University of California
Scripps Institution of Oceanography San Diego, California 92152
AN IMAGE RESTORATION EXPERIMENT ON
TURBULENCE-DEGRADED IMAGES
by Benjamin L. McGlamery
July 1966 Bureau of Ships Contract NObs-92058, Task 4
SIO Ref. 66-10 Advanced Resea rch Projects Agency Order No. 152
TABLE O F C O N T E N T S
P a g e
INTRODUCTION 1
E X P E R I M E N T A L P R O C E D U R E 5
E X P E R I M E N T A L R E S U L T S 9
DISCUSSION OF R E S U L T S 11
CONCLUSIONS 15
ACKNOWLEDGMENTS 15
l i
AN IMAGE RESTORATION EXPERIMENT ON
TURBULENCE-DEGRADED IMAGES
by
Benjamin L. McGlamery
INTRODUCTION
The t r ansmiss ion of an image through turbulent media degrades
the quality of the final image formed by an optical sys tem. This
degradation causes a loss of the information contained in the image
(in the context of information theory) and an increased difficulty of
extract ion of the remaining information by the human obse rve r . The
information-content loss is i r r e t r i evab le . However, the image can be
p rocessed so that the remaining information is more easily in terpre ted
by the human visual sys tem. The Visibility Labora tory of the Univer
sity of California is engaged in a r e s e a r c h p rogram to find suitable
methods of process ing images degraded by turbulent media . This r e
sea rch is sponsored by the Advanced Resea rch Projec ts Agency through
contract NObs-92058 between the University of California and the Bureau
of Ships.
The work descr ibed here is a continuation of that repor ted by
H a r r i s . Specifically this repor t deals with the process ing of turbu
lence degraded images formed in the laboratory for the case in which
J. L. H a r r i s , Restorat ion of Atmospherical ly Distorted Images, P r o g r e s s Report (Scripps Institution of Oceanography, San Diego, SIO Ref. 63-10.)
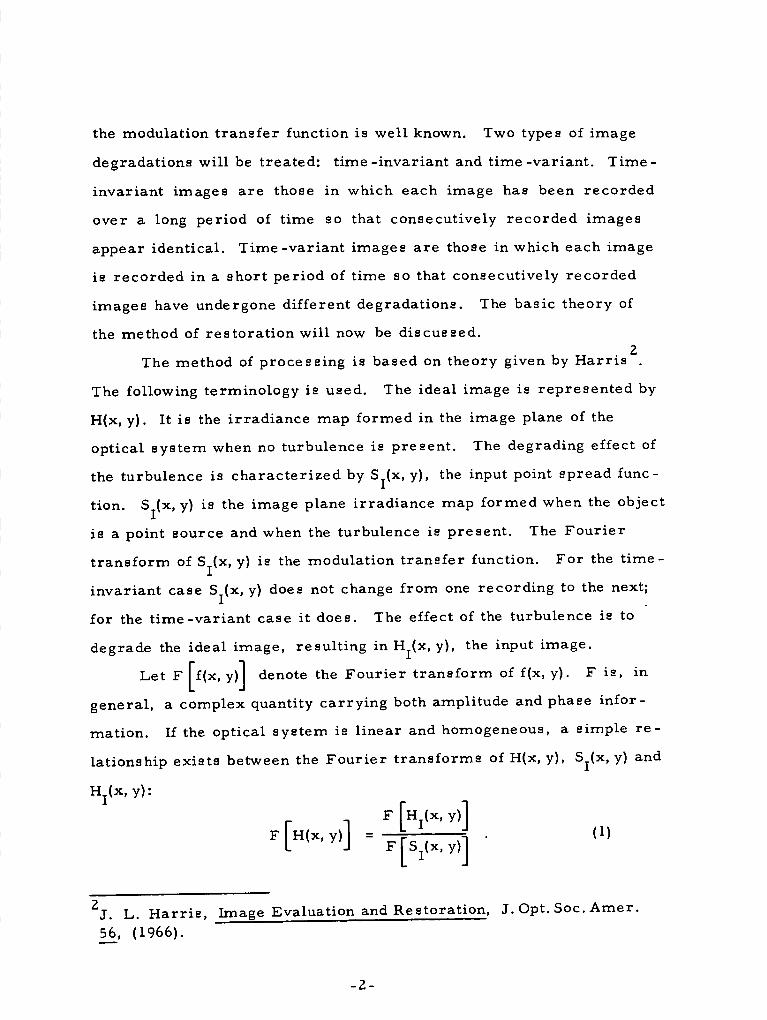
the modulation t ransfer function is well known. Two types of image
degradations will be t rea ted: t ime- invar iant and t ime-var ian t . T i m e -
invariant images a re those in which each image has been recorded
over a long period of time so that consecutively recorded images
appear identical . T ime-var ian t images a r e those in which each image
is recorded in a short period of time so that consecutively recorded
images have undergone different degradat ions. The basic theory of
the method of res to ra t ion will now be discussed. 2
The method of process ing is based on theory given by Har r i s .
The following terminology is used. The ideal image is r epresen ted by
H(x, y). It is the i r rad iance map formed in the image plane of the
optical sys tem when no turbulence is p resen t . The degrading effect of
the turbulence is charac te r ized by S (x, y), the input point spread func
tion. S (x, y) is the image plane i r radiance map formed when the object
is a point source and when the turbulence is p resen t . The Four ie r
t ransform of S (x, y) is the modulation t ransfer function. For the t i m e -
invariant case S (x, y) does not change from one recording to the next;
for the t ime-var ian t case it does. The effect of the turbulence is to
degrade the ideal image, resul t ing in H (x, y), the input image.
Let F |f(x, y) denote the Four i e r t ransform of f(x, y). F i s , in
general , a complex quantity carrying both amplitude and phase infor
mation. If the optical system is l inear and homogeneous, a simple r e
lationship exis ts between the Four i e r t ransforms of H(x, y), S^x, y) and
Hjfx.y):
F [H (x, y)l
2 J . L. H a r r i s , Image Evaluation and Restorat ion, J. Opt. Soc. Amer .
56, (1966).
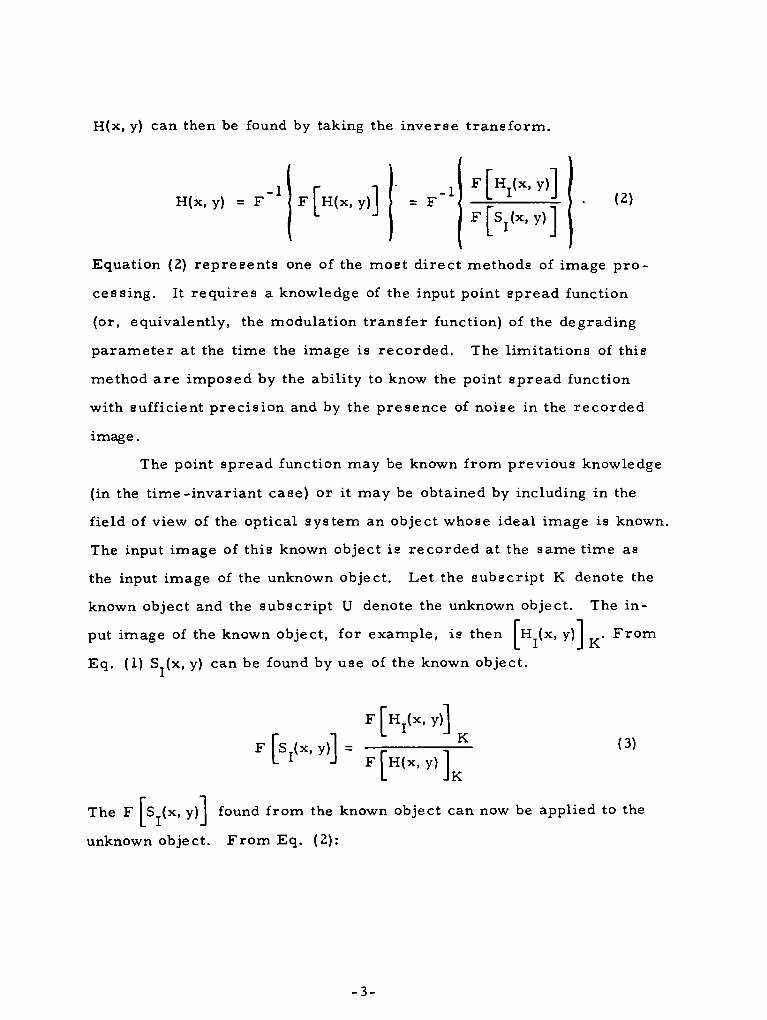
H(x, y) can then be found by taking the inverse t ransform.
'[^(x.y)] H(x, y) = F " 1 F [ H ( X , y)]
-1 = F
[ S ^ x . y ) ! (2)
Equation (2) r epresen t s one of the most d i rect methods of image p r o
cess ing. It requi res a knowledge of the input point spread function
(or, equivalently, the modulation t ransfer function) of the degrading
pa rame te r at the time the image is recorded . The limitations of this
method a r e imposed by the ability to know the point spread function
with sufficient prec is ion and by the presence of noise in the recorded
image.
The point spread function may be known from previous knowledge
(in the t ime- invar ian t case) or it may be obtained by including in the
field of view of the optical system an object whose ideal image is known.
The input image of this known object is recorded at the same time as
the input image of the unknown object. Let the subscr ipt K denote the
known object and the subscr ipt U denote the unknown object. The in
put image of the known object, for example, is then H (x, y) . F rom
Eq. (1) S (x, y) can be found by use of the known object.
[ H J ( X , y)]
[Sl(x, y)] = - 4 - 1*- (3) [H(x, y ) l
IK
The F S (x, y) found from the known object can now be applied to the
unknown object. F rom Eq. (2):
- 3 -
F [H (x, yj] [ H ^ T ^ - F " 1 U IS. 1 J U ^ r S j t x . y ) !
I F IH^X, y)l F |"H(X, y)l
fH^x.y)! = F-{-^ ^ — - = K l ( 4)
K
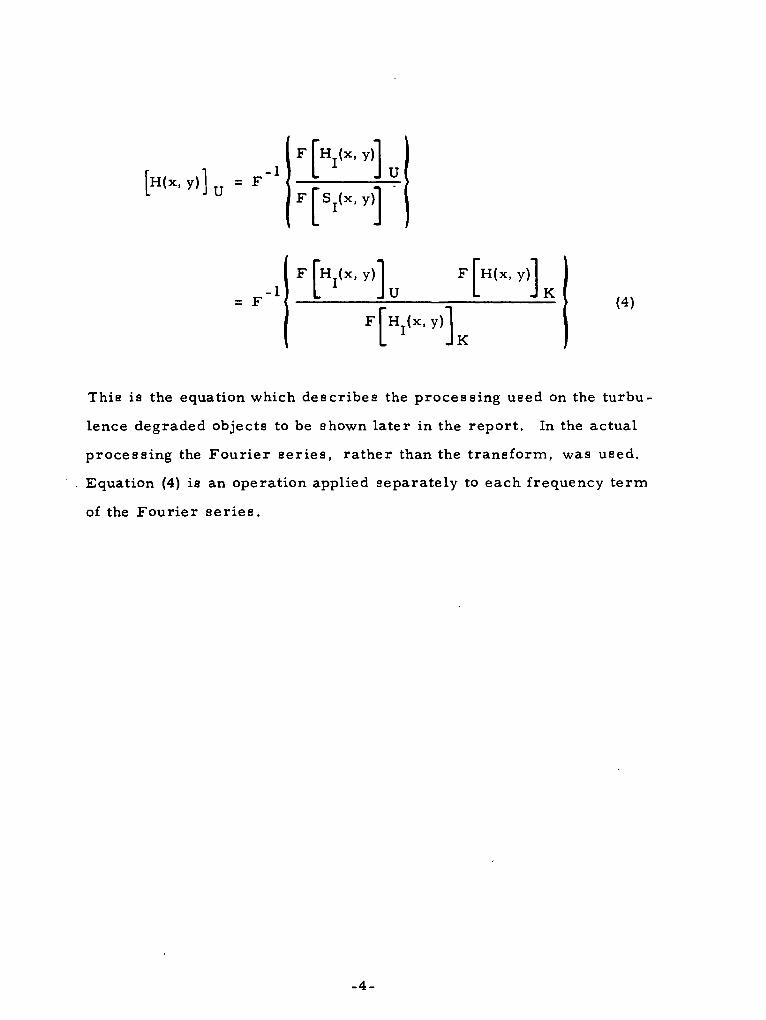
This is the equation which descr ibes the process ing used on the turbu
lence degraded objects to be shown la ter in the repor t . In the actual
p rocess ing the Four i e r s e r i e s , ra ther than the t ransform, was used.
Equation (4) is an operation applied separate ly to each frequency t e rm
of the Four i e r s e r i e s .
- 4 -
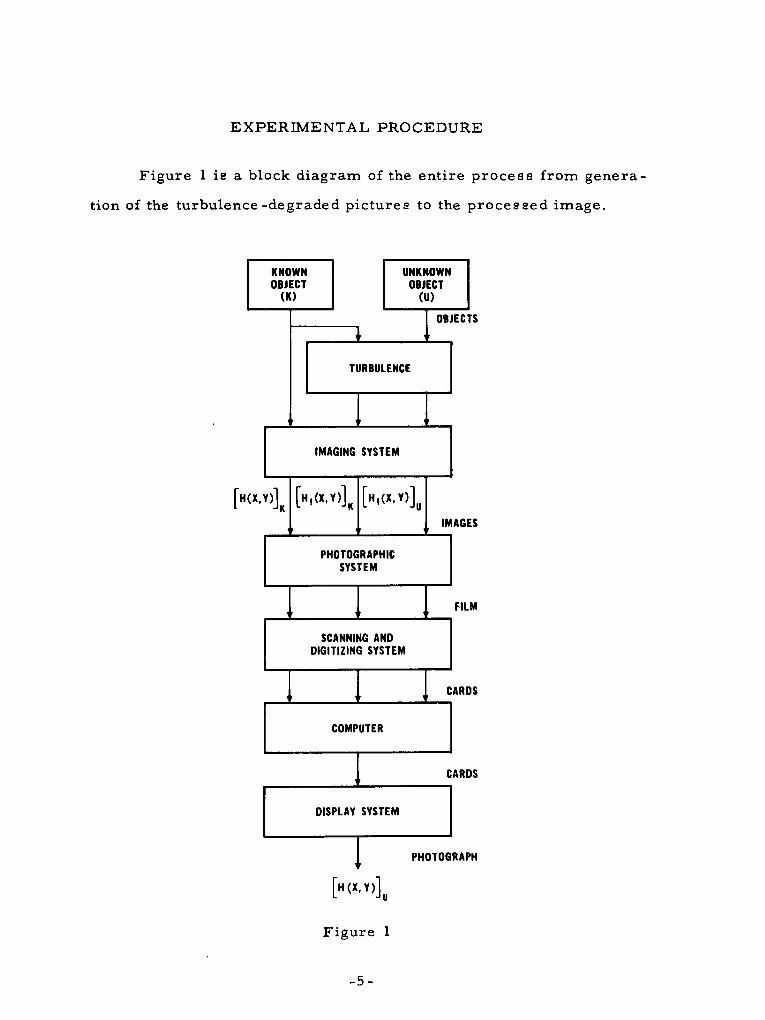
EXPERIMENTAL PROCEDURE
Figure 1 is a block diagram of the ent i re p rocess from genera
tion of the turbulence-degraded pictures to the p rocessed image.
KNOWN OBJECT
(K)
UNKNOWN OBJECT
(U)
OBJECTS
TURBULENCE
IMAGING SYSTEM
[H(X.Y)] [H,<X,Y>] [H . (X .Y ) ]
IMAGES
PHOTOGRAPHIC SYSTEM
FILM
SCANNING AND DIGITIZING SYSTEM
CARDS
COMPUTER
CARDS
DISPLAY SYSTEM
[H(X,Y>]
Figure 1
PHOTOGRAPH
- 5 .
Turbulence Focal Plane Object Plane C o l l i m a t o r - \ Area ^ O b j e c t i v e Shutter Image Plane
Ilium
Reducing lene Heater
Magnifying Lens
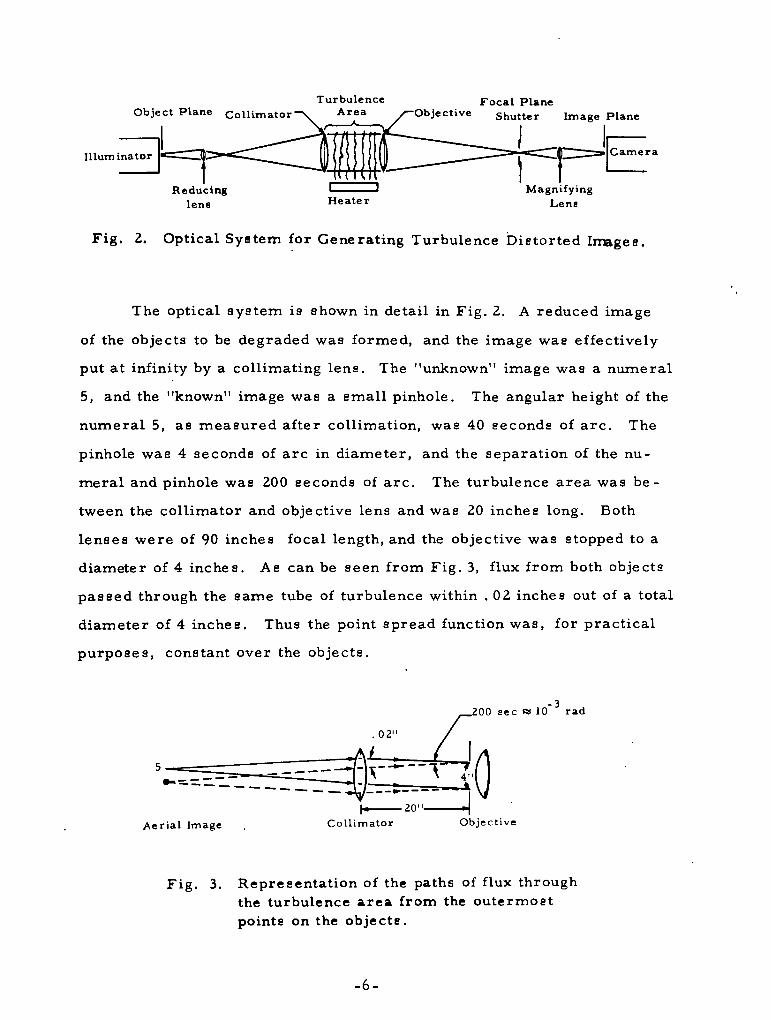
Fig. 2. Optical System for Generating Turbulence Distorted Images.
The optical sys tem is shown in detail in Fig. 2. A reduced image
of the objects to be degraded was formed, and the image was effectively
put at infinity by a collimating lens . The "unknown" image was a numera l
5, and the "known" image was a smal l pinhole. The angular height of the
numera l 5, as m e a s u r e d after collimation, was 40 seconds of a r c . The
pinhole was 4 seconds of a rc in d iameter , and the separat ion of the nu
mera l and pinhole was 200 seconds of a r c . The turbulence a r ea was b e
tween the coll imator and objective lens and was 20 inches long. Both
lenses were of 90 inches focal length, and the objective was stopped to a
diameter of 4 inches. As can be seen from Fig. 3, flux from both objects
passed through the same tube of turbulence within . 02 inches out of a total
d iameter of 4 inches. Thus the point spread function was, for p rac t ica l
purposes , constant over the objects.
Aer ia l Image Col l imator
.200 sec w 10 rad
Objective
Fig. 3. Representa t ion of the paths of flux through the turbulence a r ea from the outermost points on the objects .
- 6 -
The objective lens formed the degraded images in its focal plane
from which they were imaged with a magnification of four onto the film
plane of a 35 mm camera . The t ime- invar ian t images were recorded
on Plus-X film at one-minute exposure t imes . The t ime-var ian t images
were recorded on TRI-X film at 5 mi l l i seconds . Flux levels were ad
justed for optimum exposures in both ca se s . In addition, gray scales
were printed onto the film for determinat ion of the film H and D curve.
Following photographic process ing, the t ransparenc ies were
scanned by a system which recorded the two-dimensional t r ansmiss ion
cha rac te r i s t i c s on punched ca rds . The t r ansmiss ion values were
m e a s u r e d at intervals . 1mm apar t . The recorded unknown object in
the absence of degradation was about 2. Omm high on the t ransparency .
Thus there were about 20 resolut ion elements ac ross the image. The
H and D curve was also obtained by scanning the gray scale t r a n s
parency.
The card decks were p rocessed on a CDC 3600 computer . The
f i rs t step was to t ransform the data via the H and D curve into data r e p r e
senting positive images . A two-dimensional Four i e r analysis was then
per formed on the three positive images, represent ing: the known ideal
image, the known degraded or input image, and the unknown degraded
or input image. The modulation t ransfer function was found from the
f i rs t two and applied as cor rec t ion factors to the unknown degraded image.
An inverse Four i e r t ransformat ion was then made, and a deck of cards
represent ing the luminance values of the r e s to red unknown image was
punched out. These cards were read by a system which produced a photo
graphic pr int of the r e s to red images . The scanning and reconst ruct ion
sys tems a re descr ibed in more detail in references 1 and 2 J .
- 7 -
In making the res tora t ions the number of t e r m s of the Four i e r
se r i e s used in the reconst ruct ion process was var ied to produce pictures
whoae maximum spatial frequencies were 2, 3, and 5 cycles per mi l l i
m e t e r . This was done for the following reason. The potential ability
to distinguish fine detail inc reases as higher spatial frequencies a re
used in the r e s to red image. However, in the degraded images the
attenuation and phase shift of spatial frequencies due to turbulence tends
to increase with increasing spatial frequency, result ing in higher co r
rect ion factors for the higher frequencies. Noise, which is p resen t in
some degree in the original input images , is more great ly amplified at
the higher spatial frequencies in the r e s to red image. In this system the
noise is due to film graininess and fluctuations in the scanner sys tem.
Therefore , the gain in resolving power obtained by adding higher spatial
frequencies is gradually offset by the increase of spurious components
(noise) in the final p ic ture . By reconstruct ing the picture for various
maximum values of spatial frequency a compromise between resolving
capability and noise can be subjectively chosen.
- 8 -
E X P E R I M E N T A L R E S U L T S
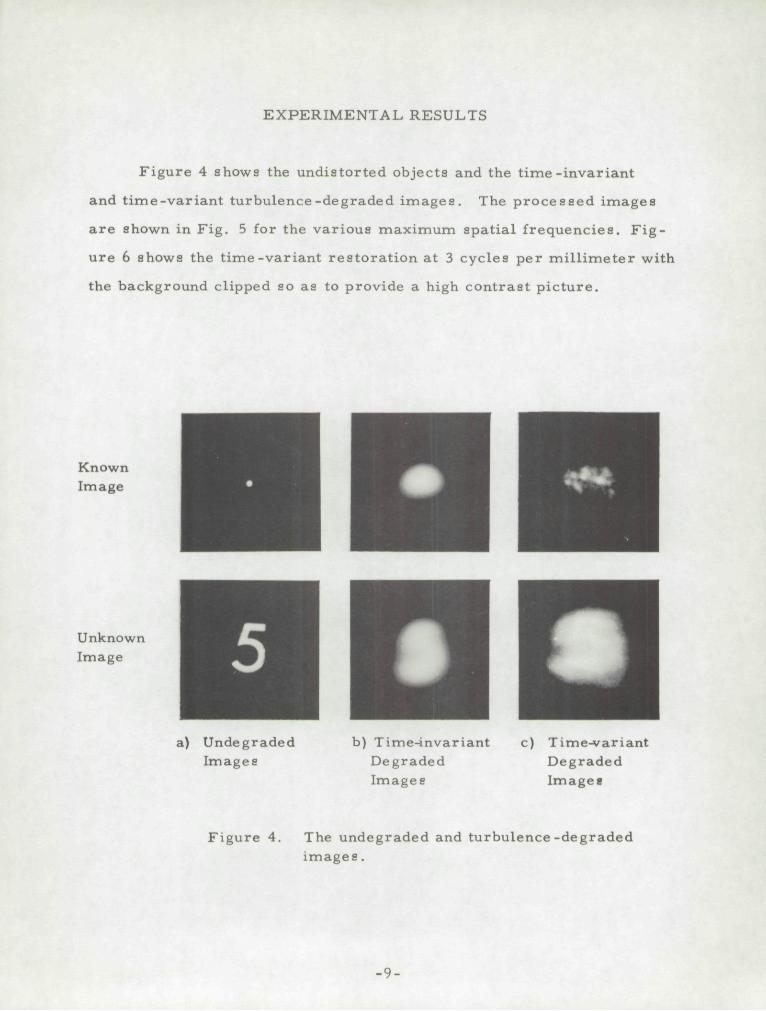
F i g u r e 4 shows the u n d i s t o r t e d ob jec t s and the t i m e - i n v a r i a n t
and t i m e - v a r i a n t t u r b u l e n c e - d e g r a d e d i m a g e s . The p r o c e s s e d i m a g e s
a r e shown in F i g . 5 for the v a r i o u s m a x i m u m s p a t i a l f r e q u e n c i e s . F i g
u r e 6 shows the t i m e - v a r i a n t r e s t o r a t i o n a t 3 c y c l e s p e r m i l l i m e t e r wi th
the b a c k g r o u n d c l ipped so as to p r o v i d e a h igh c o n t r a s t p i c t u r e .
Known Image
Unknown Image
a) U n d e g r a d e d I m a g e s
b) T i m e - i n v a r i a n t D e g r a d e d I m a g e s
c) T i m e - v a r i a n t D e g r a d e d I m a g e s
F i g u r e 4. The u n d e g r a d e d and t u r b u l e n c e - d e g r a d e d i m a g e s .
- 9 -
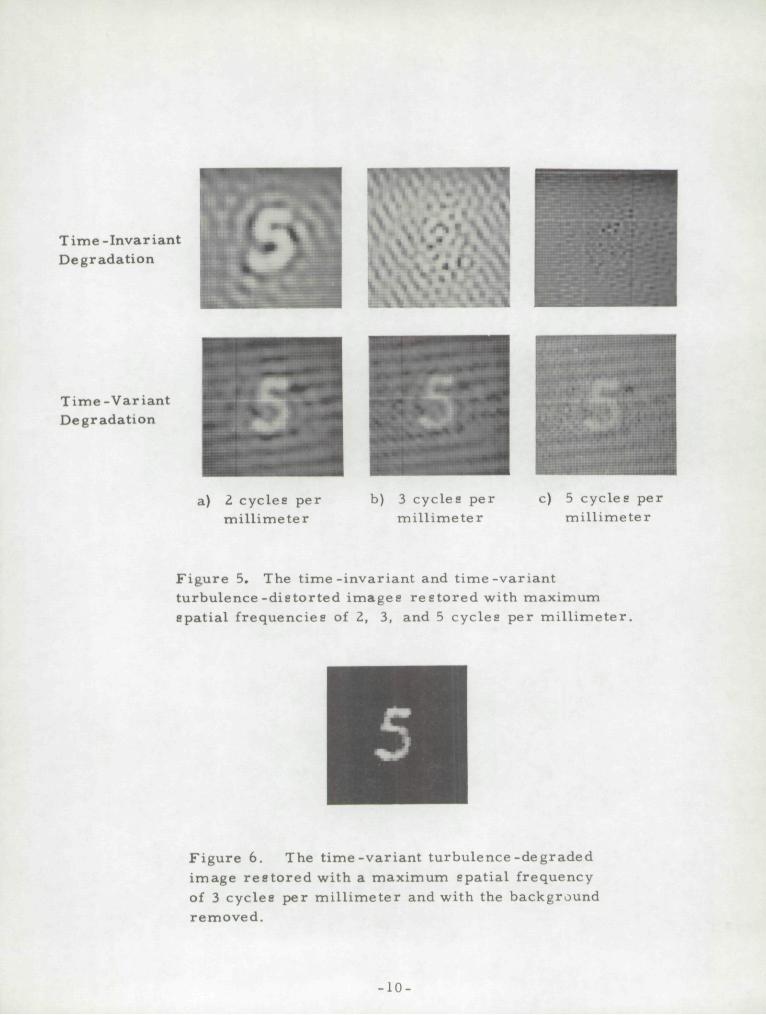
T i m e - I n v a r i a n t D e g r a d a t i o n
T i m e - V a r i a n t D e g r a d a t i o n
a) 2 c y c l e s p e r m i l l i m e t e r
b) 3 c y c l e s p e r m i l l i m e t e r
c) 5 c y c l e s p e r m i l l i m e t e r
F i g u r e 5. The t i m e - i n v a r i a n t and t i m e - v a r i a n t t u r b u l e n c e - d i s t o r t e d i m a g e s r e s t o r e d wi th m a x i m u m s p a t i a l f r e q u e n c i e s of 2, 3, and 5 c y c l e s p e r m i l l i m e t e r .
F i g u r e 6. The t i m e - v a r i a n t t u r b u l e n c e - d e g r a d e d i m a g e r e s t o r e d wi th a m a x i m u m s p a t i a l f r equency of 3 cyc l e s p e r m i l l i m e t e r and wi th the b a c k g r o u n d r e m o v e d .
- 1 0 -
DISCUSSION OF RESULTS
Comparison of Fig . 4 and Fig. 5 show that the process ing resul ted
in a significant improvement of the quality of the unknown image. Fo r
the res tora t ions having a maximum frequency of 2 cycles per mi l l imeter
the resu l t s for the t ime-var ian t and t ime- invar iant cases a re approxi
mately equivalent. At 3 cycles per mi l l imete r the t ime-var ian t r e s t o r a
tion is obviously super ior . At 5 cycles per mi l l imete r , which is the
maximum reproducible frequency due to the scanning p r o c e s s , the t ime-
invariant res tora t ion is completely obscured while the t ime-var ian t
r es to ra t ion is quite c lear . The reason for these differences can be under
stood by considering the amplitude and phase correc t ions applied to the
spect ra of the dis torted images . These a re shown in Fig. 7 and Fig. 8.
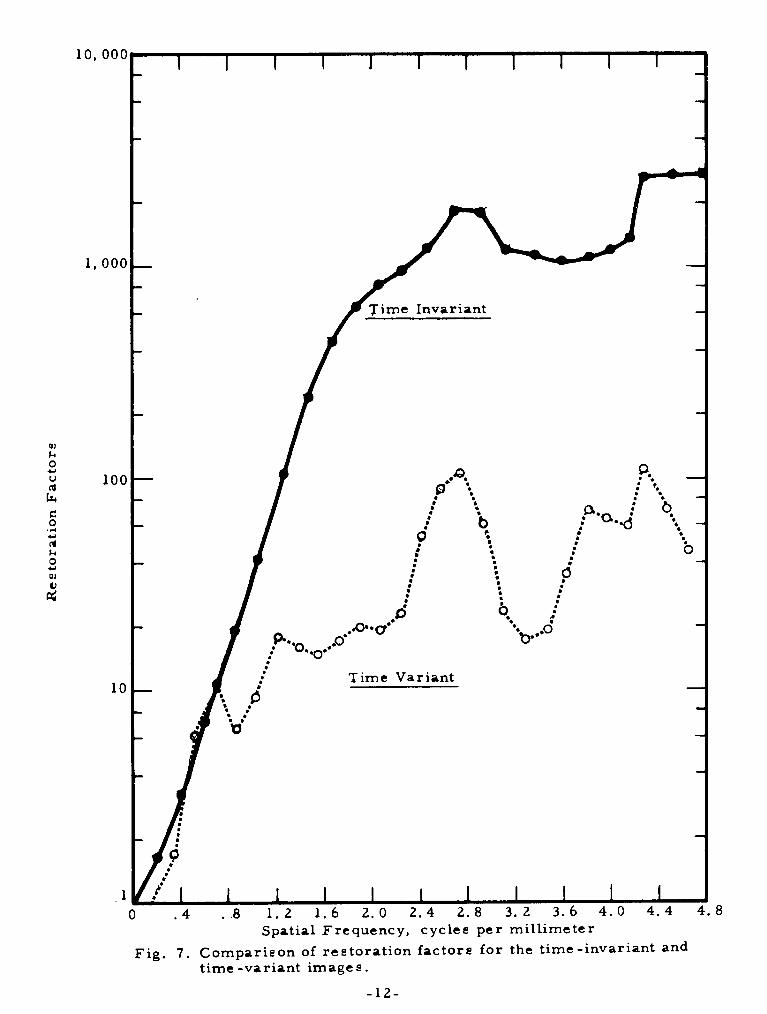
F igure 7 shows the amplitude res tora t ion factors applied to the
horizontal frequencies of the degraded unknown images . These factors
a r e the rec ip roca l of the amplitude of the modulation t ransfer function.*
Compar ison of the two curves shows that for increas ing spatial frequencies
the t ime- invar ian t case requi red much higher res tora t ion factors than did
the t ime-var ian t case . For the res tora t ions at 5 cycles per mi l l imete r the
t ime- invar ian t case had factors up to 2600, while the t ime-var ian t case
factors were up to only 110. Thus the t ime- invar ian t res tora t ions were
*A non-l ineari ty , probably in the correc t ion for the film H and D c h a r
ac t e r i s t i c s , caused the fundamental frequency of the modulation t ransfer
function for the t ime-var ian t case to have a value grea te r than unity. A
par t ia l correc t ion was made by normalizing this frequency to unity. T h e r e
fore, the res to ra t ion factors for the t ime-var ian t case shown in Fig . 7
should be considered to be approximate values .
- 1 1 -
10, 000
1, 000
01 u o u
u, c o
4-* (4
O + J oj V
100
10
i—r i — i — r
Time Variant
. 8 1.2 1.6 2.0 2.4 2.8 3.2 3.6 4. Spatial Frequency, cycles per mi l l imete r
Fig . 7. Compar ison of res to ra t ion factors for the t ime- invar iant and t ime-var ian t images .
12-
. 4 1.2 1.6 2.0 2.4 2.8 3.2 3.6 4 .0 4 .4 4 .8 5.2 5.6 Spatial Frequency, cycles per mi l l imete r
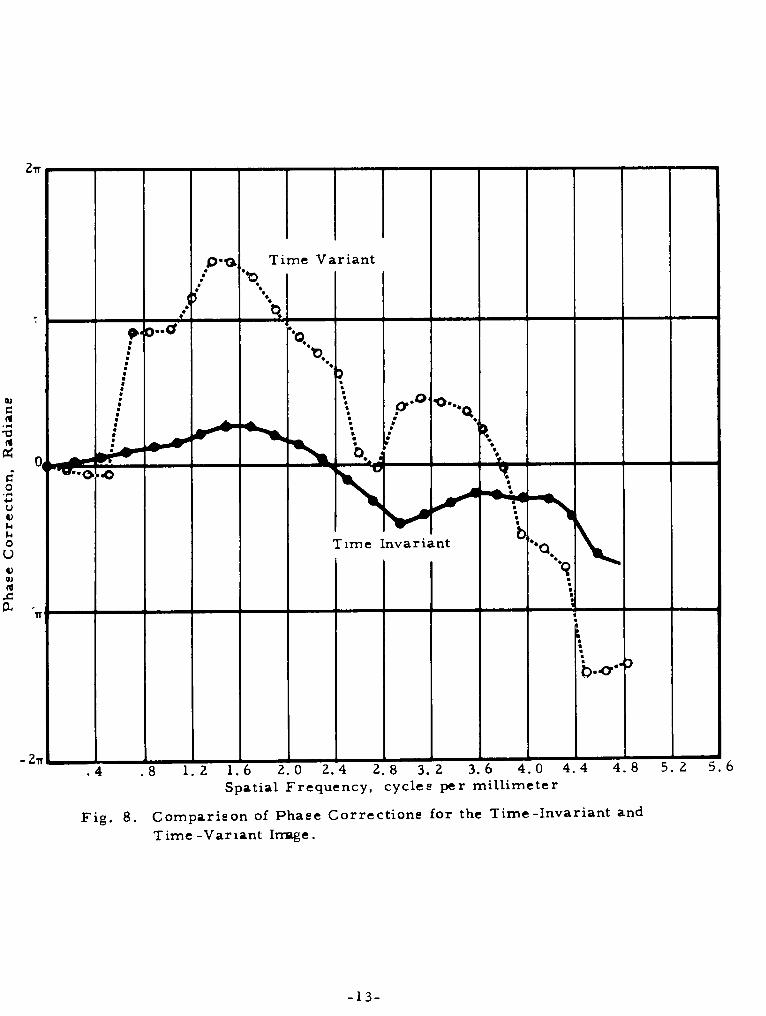
F ig . 8. Compar ison of Phase Correc t ions for the Time-Invar iant and Time-Var ian t Image.
- 1 3 -
much more susceptible to the effects of noise.
F igure 8 shows the correc t ions applied to the phases of the h o r i
zontal frequencies. These a r e the negatives of the phases of the modu
lation t ransfer function. In general , the t ime- invar ian t case had phase
shifts much smal le r than that of the t ime-var ian t case .
F igures 7 and 8 point out an important change in the type of image
degradation due to turbulence when exposure time is var ied. Specifically,
the effect of the turbulence for short exposures can be to cause moderate
amplitude attenuations and large phase shifts while for long exposures
the effect is to cause high amplitude attenuations and relat ively low
phase shifts. This resu l t can be explained by considering a single
frequency of the modulation t ransfer function for the t ime-var ian t case .
The amplitude and phase of this frequency can be represen ted by a
vector . If the behavior of this vector as a function of time could be
observed, its amplitude and phase would be found to fluctuate. If many
of these vectors were added together, corresponding to recording an
image over a longer period of t ime, and if the vector sum were divided
by the number of vectors added together, then the resul tant vector would
have a length shor te r than the mean length of the individual vec to rs .
The division by the number of individual vectors corresponds to ma in
taining a constant exposure . Thus the effect of increasing the exposure
t ime is to cause a reduction in the amplitude of the modulation t ransfer
function. If the exposure t ime is increased sufficiently to approach the
t ime- invar iant case, then the phase of the resul tant vector will approach
the mean of the individual vec to r s .
In t e rms of s ignal- to-noise ra t io a smal l amplitude attenuation and
a large phase shift is more favorable than a large amplitude attenuation
and a smal l phase shift. Thus for a given optical system with a fixed
-14-
entrance pupil, the e'xposure time should be as short as possible, con
sistent with flux requi rements for good recording. In the case where
the entrance pupil d iameter and the exposure time a re both variable and
a l imited amount of flux is available, then the choice of the optimum
pupi l -d iameter - t ime combination becomes more complex, since there
is a spatial integration effect over the entrance pupil which also affects
the modulation t ransfer function.
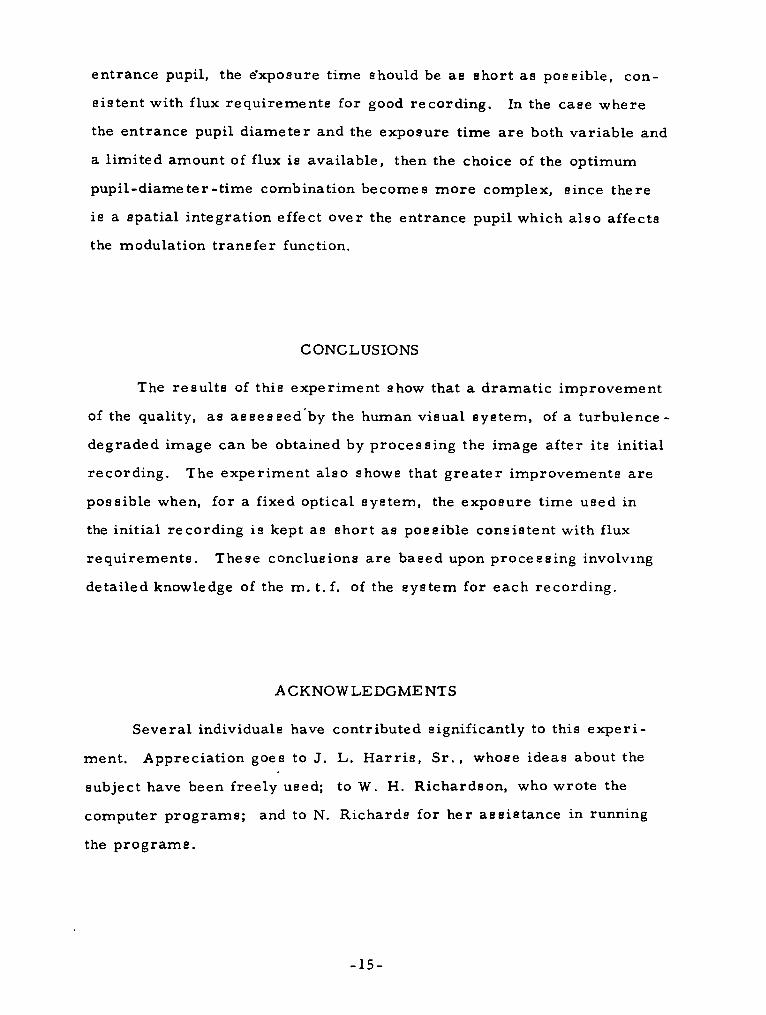
CONCLUSIONS
The resu l t s of this exper iment show that a dramat ic improvement
of the quality, as a s s e s s e d by the human visual system, of a turbulence -
degraded image can be obtained by process ing the image after its initial
recording. The exper iment also shows that g rea te r improvements are
possible when, for a fixed optical system, the exposure time used in
the initial recording is kept as short as poseible consistent with flux
r equ i remen t s . These conclusions are based upon process ing involving
detailed knowledge of the m. t. f. of the system for each recording.
ACKNOWLEDGMENTS
Several individuals have contributed significantly to this expe r i
ment. Appreciation goes to J. L. H a r r i s , Sr . , whose ideas about the
subject have been freely used; to W. H. Richardson, who wrote the
computer p rograms ; and to N. Richards for her ass is tance in running
the p r o g r a m s .
- 1 5 -
Unclassified Security Classification
DOCUMENT CONTROL DATA - R & D (Security classification of tltto, body of abstract and indexing annotation musl be entered when the overall report Is classified)
1 O R I G I N A T I N G A C T I V I T Y (Corporate author)
Visibility Labora tory Universi ty of California San Diego. California 92152
Za. R E P O R T S E C U R I T Y C L A S S I F I C A T I O N
U n r l a s f l i f i e d 26. GROUP
3 R E P O R T T I T L E
An Image Restora t ion Exper iment on Turbulence-Degraded Images
4 D E S C R I P T I V E N O T E S (Type of report and Inclusive dates)
S AUTHOR(S) (First name, middle Initial, last name)
McGlamery, Benjamin L.
6 R E P O R T D A T E
June 1966 7a. TOTAL NO OF PASES
17 76. NO OF REFS
C O N T R A C T OR G R A N T NO 9a. O R I G I N A T O R ' S R E P O R T NUMBER(S)
NOba-92058 6. P R O J E C T NO
86. O T H E R R E P O R T NOIS) (Any other numbers that may be assigned this report)
10 D I S T R I B U T I O N S T A T E M E N T
I I S U P P L E M E N T A R Y N O T E S 12 SPONSORING MIL I TARY A C T I V I T Y
Advanced Resea rch Projec ts Agency Washington, D . C .
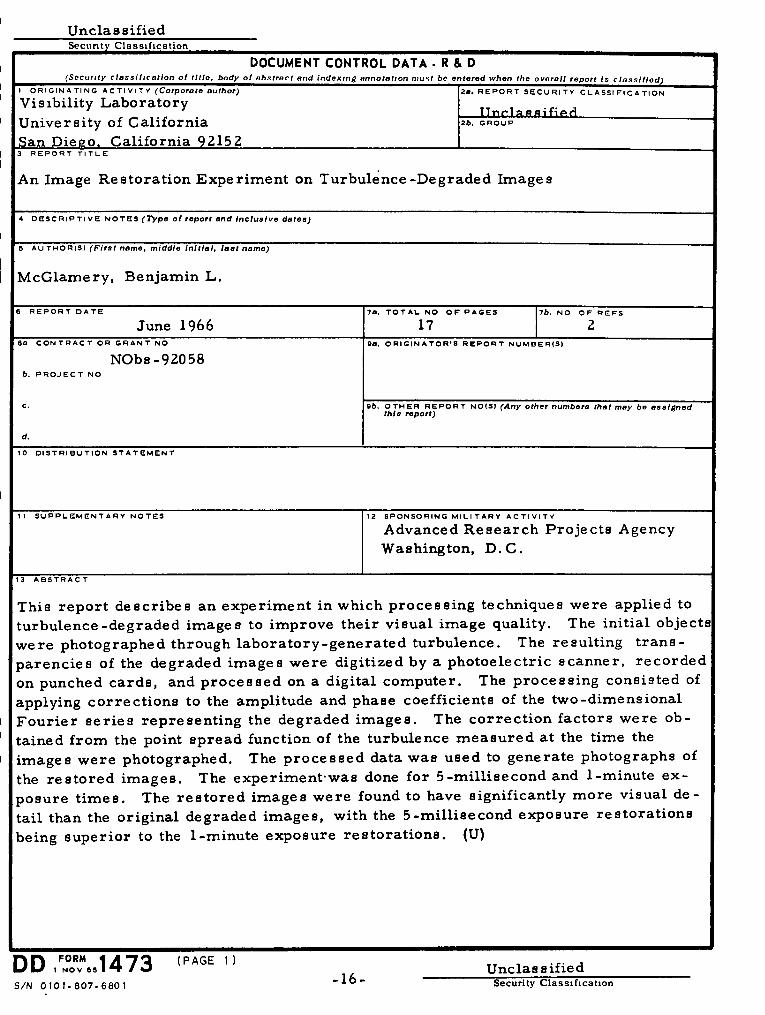
13 A B S T R A C T
This repor t descr ibes an exper iment in which process ing techniques were applied to turbulence-degraded images to improve their visual image quality. The initial objects were photographed through labora tory-genera ted turbulence. The result ing t r a n s parencies of the degraded images were digitized by a photoelectr ic scanner , recorded on punched cards , and p rocessed on a digital computer . The process ing consisted of applying correc t ions to the amplitude and phase coefficients of the two-dimensional Fou r i e r se r ies represent ing the degraded images . The cor rec t ion factors were obtained from the point spread function of the turbulence m e a s u r e d at the time the images were photographed. The p roces sed data was used to generate photographs of the r e s to red images . The experiment-was done for 5-mil l isecond and 1-minute ex posure t imes . The r e s to r ed images were found to have significantly more visual d e tail than the original degraded images , with the 5-mill isecond exposure res tora t ions being superior to the 1-minute exposure r e s to ra t ions . (U)
DD,FN°oRvM
981473 S/N 0 1 0 1 - 8 0 7 - 6 8 0 1
(PAGE 1)
• 16-Unclassified
Security Classification

Unclassified Security Classification
K EY W O R D S
Image Restorat ion Image Process ing Image Evaluation Turbulence Computer P rocess ing Image Reconstruct ion
DD ,F,r,.1473 (BACK, (PAGE 2) -17 -
Unclassified Security Classification