Embed Size (px)
Citation preview
,
Research Report onTart Cherry Objective Yield Surveys
by
Richard P. Small
Research and Development Branch
Standards and Research Division
Statistical Reporting Service
Compiled June 196.4-
Distributed Dec~er 1961
'')
I'
1TART CHERRY OBJECTIVE YIELD
FORECASTING SURVEYS
I. NATURE OF SURVEYS
Introduction: Tart cherry objective yield studies were begun in Michigan duringthe 1958 season. The project was financed jointly under matching arrangementswith funds provided by the Michigan Cherry Producers Association, MichiganState Department of Agriculture and the Department, including the AgriculturalMarketing Act and the Statistical Reporting Service. In 1962, the program wasextended to include pilot sample programs in New York, Pennsylvania, andWisconsin, with a view to developing sampling and forecasting procedures forthese States. The Great Lakes Cherry Marketing Association helped financethis extension of the program.
Procedures in 1958 and 1959 were directed especially to developingworkable and efficient field sampling techniques and obtaining measures ofvariability for sample design. Procedures have been essentially unchangedsince the 1960 study. Statistics and procedures contained in this reportcover the 1960, 1961, and 1962 seasons. The principal changes effected withthe 1960 program were to increase the number of orchards sampled and to reducethe amount of sampling done in each orchard.
The sampling program for tart cherry objective yield surveys was arrangedas two distinct parts:
(1) Development Surveys: a series of frequent visits to a few orchardsto observe major growth and development characteristics in order to determinetheir relationship with yield per tree.
(2) Yield Surveys: four large-sample surveys to obtain acceptablyprecise estimates of peak bloom date, number of fruit per tree, and weightper cherry.
Development Surveys: Observations were made two to three times weekly throughouteach season in two representative orchards in each of three Michigan districts.In 1962, development observations were also made for New York, Pennsylvania,and Wisconsin in four or five orchards in each State. In each sample orchard,two adjacent trees were chosen and in each tree four branches were selectedto give representation on four sides of the tree so as to take into accountpossible differences of exposure to the sun. These branches were marked withtags.
Samples of 24 fruited spurs (any spur,possessing one or more flower budsor blossoms) were marked with numbered tags on the east and west branches ofone tree, and the north and south branches of the other tree. These tagswere attached during the period of bloom development, as soon as fruit budscould be distinguished from leaf buds.
Development observations were begun as soon as fruit buds opened, andcontinued two or three times weekly until the sample trees were harvested.
Five(1)(2)(3)(4 )(5 )
different aspectsBloom developmentFruit droppageShuck split
.Cherry weightPit hardening
of tart cherry development were observed:
:1·
2
The first three of these aspects was observed !'rom the set of taggedspurs, whereby the progress of deve1opmentcqu1d be seen from the same setof spurs and cherries. Cherry weight and hardness of pit were determined frolJlsamples of.cherries picked !'romthe other two selected branches of each sampletree .. ,
Observation procedures and results are disoussed later in this report .. "
Yield Surveys:. The four yield survey.~rw~~e conducted in all orchards sampledto obtain estimates with acceptable precision for use in forecasting. Thesesurveys will be referred to throughout this report by the following names:
1. Bloom2. Mid-June3. Tuly 14. Pre-HarvestResults of the yield surveys provide the data for the current-year
averages of peak bloom date, cherries per tree, and weight per cherry ~hichare the base.s of forecas'ts of yield per tree.
The Bloom Survey visit is made as closely as<possible to .the time ofpeak blooming in each orchard.
The Mid-June and July 1 Surveys are scheduled to meet forecasting dead-lines. The schedule of the Crop Reporting Board includes foreca.stsfo:r tartcherry production as of June 15 and July 1. The June 15 forecasting date isa departure !'romthe usual CRB·sched\.lleof forecasts as of the 1st day 'of themonth. This is..desirable because of the extremely short development periodfor tart cherries, and because it is a highly perishable crop for which .timelydata on supply are of special value to the industry .. Harvesting has begun in .most years before the July 1 forecast.pecomes available on July 10.
The field work for these forecasting surveys is completed in as short atime as feasible - generally within a five day perioq.. For the Mid-JuneSurvey the average survey date is June 13, and for the ,July 1 Survey the averageis June 28 .• '
The Pr~-Harvest Survey provides the necessary follow-up information ofactual results. Observations are made in each orchard as near as possibleto actual time of harvest. It is information from this survey which makespossible, an evaluation of the forecasting program. Also data from thissurvey·prov1de the only bases for making reliable estimates of forecastingparameters.
t•
.I
. ,
)
3Sub-Sampling Procedure ror Trees: The portion or the cherry tree actuallychosen for counting represents about 9nly one-twentieth of the entire tree.Cherries counted on a tree part are eXpanded to a "whole tree" basis bymultiplying by the reciprocal of the probability of selection for the partsampled. The need for the sub-sampling procedure arises from the prohibitivecost of counting entire trees for a sufficiently large sample of trees.Although it is not possible to obtain acceptable estimates of total cherriesfor an individual tree, the statistical efficiency of this procedure is fargreater than for counts on entire trees, for any given cost .
Tree parts are randomly selected by using measurements of limb size forprobabilities of selection. Consider, for example, a tree which has threeprimary limbs. Each of these is measured at its base with a speciallycalibrated tape which converts circumference to cross-sectional area. If thelimbs measured 10, 5, and 15 inches, their probabilities for selection based oncross-sectional area would be 10/30, 5/30, and 15/30, respectively. Afterchoosing one of these limbs by a random process with probabilities based oncross-sectional area, it may be desired to choose a still smaller part ofthe tree for counting purposes. The selection procedure may be repeated again,by choosing from sub-limbs which branch from the previously chosen limb.This may be continued over as many stages of selection as are required tochoose a sample limb of suitable size for counting purposes. The resultingprobability of selection for the sample part (limb) is the product ofprobabilities over all selection stages. For example, if the probabilitieswere 15/30 for stage 1, 9/16 for stage 2, and 2/9 for stage 3, the finalstage of selection, then the probability of selection for the sample partis 15/30 x 9/16 x 2/9 = 1/16. The factor by which the cherry count onthe sample part is then eXPanded to a "whole tree" basis is 1 ~ 1/16 = 16.
For the selected sample tree part all fruited spurs (i.e. sub-units)are counted on the sample part by only a sub-sample of these, one-tenth ormore, is selected and marked with numbered tags. Estimates of cherries perspur are obtained entirely from the sub-sampled spurs which were tagged.
Seasonal Sampling Pattern: Throughout a given season the four yield surveyshave been conducted in the same sample orchards on a set of three trees,randomly chosen, per orchard.
The sampling pattern is nearly standard throughout the period of the4 survey visits. During the first visit, for the Bloom Survey, the samplebranch of tree 1 is used, with all fruited spurs counted, and a sub-sampleof these marked with numbered tags. Bloom counts are made for each taggedspur.
During the Mid-June Survey, a return visit is made to tree 1, and allfruit on tagged spurs is counted and picked, with the picked sample retainedfor weighing and other lab observations. Tree 2 is also observed, withfruited spurs on the sample branch counted, a sub-sample of spurs selectedand tagged. Fruit counts are made for each taggea spur. Tree 3 is also visited,with fruited spurs on the sample branch counted, and a sub-sample tagged, but nofruit counts per spur are made on tree 3 at this time.
For the July 1 Survey, tree 2 is visited a second time, with fruitcounted and picked from tagged spurs for weighing and other lab observations.Then tree 3 is visited a second time, with fruit counts made for tagged spurs.
4
During the Pre-Harvest Sl,lrVey,tree 3 is visited for a 3rd time. Cherrieson tagged spurs are counted, then pick~d for weight and other determinations.All remaining cherries on the samp1e.1imo are then pickeddsnd counted.
The foregoing procedure limits bias in sample results which might occurfrom excessive handling of cherries and spurs.
By use of the above schedule,~trees 1 and 2 receive two visits. Tree 3receives 3 visits but these occur later in the season when fruit is set morefirmly on the tree .
. ,.,
"
1
l'
5II • TART CHERRY DEVELOPMENT AND ITS REIATION TO A FORECASTING PROGRAM '
General Problems: The period of development for the tart cherry, from thepetal-fall phase of bloom development to attainment of mature size and weight,is approximately 58 days. There are some seasonal variations for the durationof within-season stages of development, whereby a shortened period for anystage may be partially offset by an extended period for other stages.
Objective yield surveys have not adequately estimated this period,primarily because of problems in conducting the Pre-Harvest Survey. Over10 percent of these samples are lost due to the orchard having been pickedbefore the enumerator makes his visit to take the samples. Also, this visithas generally preceeded actual harvest by an undetermined amount of time.Finally, there is probably no constant relationship between date of maturityand date of harvest because the harvesting date is subject to variations inlabor supply and other economic conditions.
The use of sample data in preparing forecasts of cherry yields requiresthat sample values be adjusted according to expected changes (forecastingparameters) for the period from forecasting survey to harvest.
For tart cherries, these adjustments are large and vary greatly, de-pending on the"relative stage of cherry development or maturity. As'-later sections describe, the prin~ipal relative stage of maturity has beenmeasured as time elapsed from Peak Bloom Date, which in turn is ascertainedby observations in a few selected orchards and counts in a much largerprobability sample of orchards. Survey observations have been made forlater stages based on time of pit hardening or frdt color change. Theseare also subsequently discussed.
Time of forecasting sufveys has been dicta~ed by the need to make fore-casts as of June 15 and July 1. During the period of this research work, theMid-June average survey date occured as early as 13 days past bloom in thelatest developing Michigan (Northwest) district, and as late as 37 days pastbloom in the earliest ~~chigan (Southwest) district.
PEAK BLOOM DATE,Estimates of Peak Bloom Date have utilized data from both the development
observations made frequently in a few representative orchards, and fromma or bloom surveys conducted in a probability sample of orchards.
Development surveys provide data for determining a starting date for themajor bloom survey, as well as adjustments for estimates of the number ofdays duration between phases of bloom development. The Bloom Surveyresults, adjusted by development data, furnish the estimate of Peak BloomDate.
Development Surveys:In the Development Surveys, the sample of fruiting spurs is selected
and tagged as soon as fruit buds are distinguishable from leaf buds.Return visits are made every two or three days, and tagged spurs aretallied as one of the following phases, according to the predominantphase of blooms on the spur:
(1) Flower bud not open - Fruit bud cluster has opened. Flower budshave emerged out of the fruit bud. White petals mayor may not beshowing. Flower may be partially open, but is still somewhat bell-shaped.
(2)
(3)
(4 )
(5)
6
Flower bud open .•.petals have fallen.back so that petal is separatedand could be easily counted. Flower is no longer bell-shaped.Petals falling - one or more petals from individual flowers havefallen.Flower withered - All petals have fallen or are drying and thestamens are dried and browning. No green cherries are protrudingbeyond the shuck.Green cherries showing - Some green cherries are protruding beyondshuck. If any bloom has reached this phase, the sPUr is recordedas being in this phase.
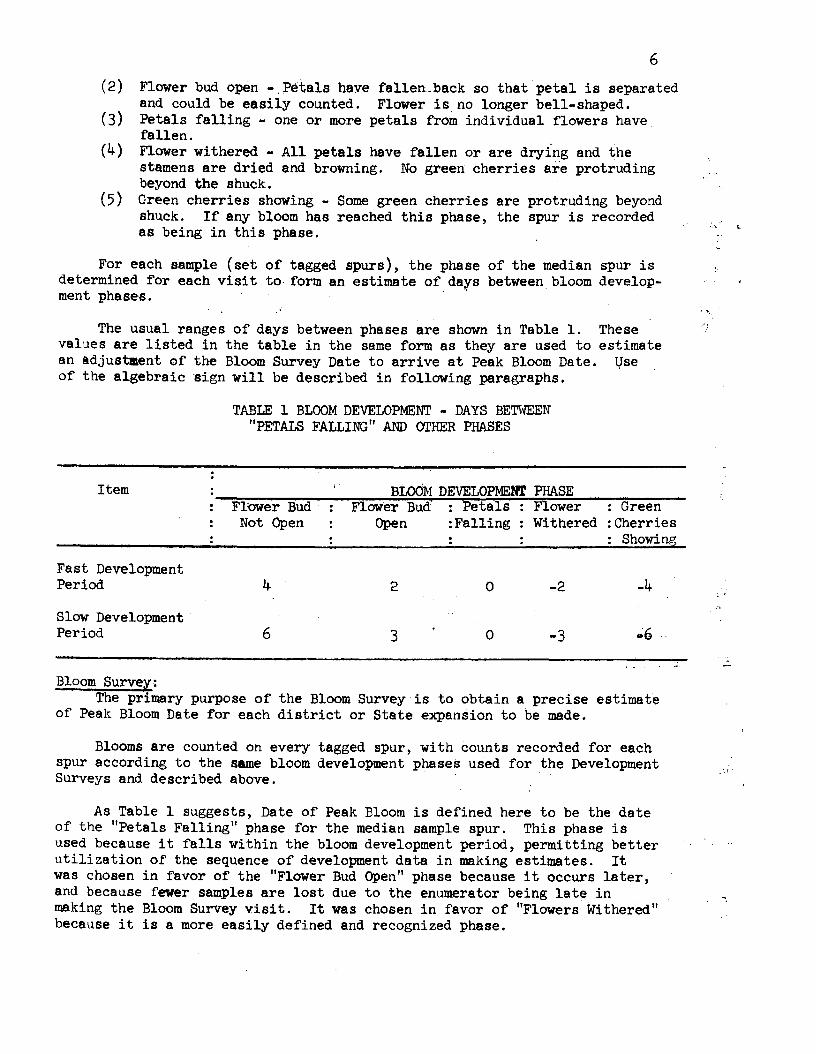
For each sample (set of tagged spurs), the phase of the .median spur isdetermined for each visit to· form an estimate of da~s between bloom develop-ment phases.
The usual ranges of days between phases are shown in Table 1. Thesevalues are listed in the table in the same form as they are used to estimatean adjustment of the Bloom Survey Date to arrive at Peak Bloom Date. Useof the algebraic sign will be described in following paragraphs.
TABLE I BLOOM DEVELOPMENT - DAYS BETWEEN"PETALS FALLING" AND orHER PHASES
ItemFl'Ower Bud
Not Open
BLOOM DEVELOPMENT PHASEFlower Bud : Petals Flower : Green
Open :Falling Withered :Cherries: Showing
Fast DevelopmentPeriod
Slow Development .Period
4
6
2
3
o
o
-2
-3
-4
Bloom Survey:The primary purpose of the Bloom Survey is to obtain a precise estimate
of Peak Bloom Date for each district or State expansion to be made.
Blooms are counted on every tagged spur, with counts recorded for eachspur according to the same bloom development phases used for the DevelopmentSurveys and described above.
As Table 1 suggests, Date of Peak Bloom is defined here to be the dateof the "Petals Falling" phase for the median sample spur. This phase isused because it falls within the bloom development period, permitting betterutilization of the sequence of develOPment data in making estimates. Itwas chosen in favor of the "Flower Bud Open" phase because it occurs later,and because fewer samples are lost due to the enumerator being late inmaking the Bloom Survey visit. It was chosen in favor of "Flowers Withered"because it is a more easily defined and recognized phase.
.,'
7
Peak Bloom Date is estimated for each sam,le orchard by calculating anadjustment period to be added to the Bloom Survey Date for the given orchard.The adjustment is the weighted average of days between development phases,such as appear in Table 1 above. The weights used are the number of spurscounted for each development phase. As an example, suppose that spurs wereclassified such that five were in "Flower Bud Open", ten in "Petals Falling",eight in "Flowers Withered", two in "Green Cherries Shwwing", and that in-terval estimates obtained from the Development Survey were as for the shortdevelopment period shown in Table 1. The days to add to Bloom Survey dateare then:
5 x 2 + 10 x 0 + 8 x (-2) + 2 x (-4) ~ (5+10 + 8+2) = -1425 = -.56
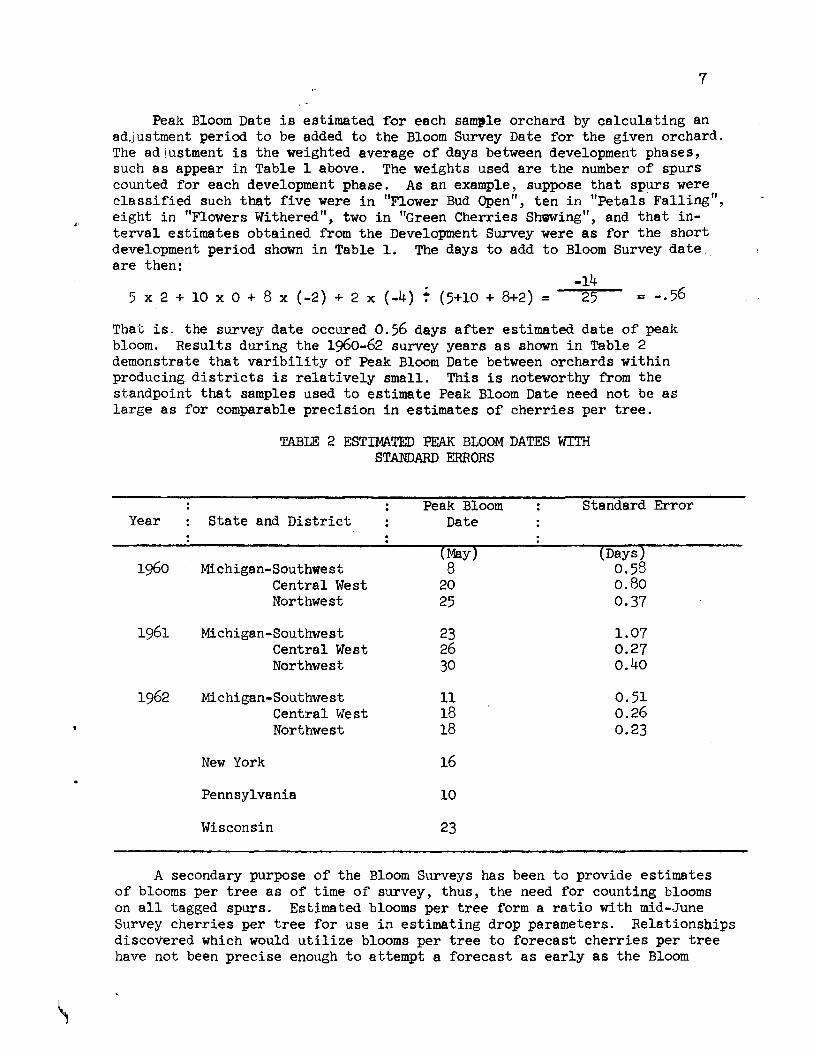
That is, the survey date occured 0.56 days after estimated date of peakbloom. Results during the 1960-62 survey years as shown in Table 2demonstrate that varibility of Peak Bloom Date between orchards withinproducing districts is relatively small. This is noteworthy from thestandpoint that samples used to estimate Peak Bloom Date need not be aslarge as for comparable preciSion in estimates of cherries per tree.
TABLE 2·ESTIMATED PEAK BLOOM DATES WITHSTANDARD ERRORS
YearPeak Bloom Standard Error
State and District Date
(May) (Days)Michigan-Southwest 8 0.58
Central West 20 0.80Northwest 25 0.37
Michigan-Southwest 23 1.07Central West 26 0.27Northwest 30 0.40
Michigan-Southwest 11 0.51Central West 18 0.26Northwest 18 0.23
New York 16Pennsylvania 10Wisconsin 23
A secondary purpose of the Bloom Surveys has been to provide estimatesof blooms per tree as of time of survey, thus, the need for counting bloomson all tagged spurs. Estimated blooms per tree form a ratio with mid-JuneSurvey cherries per tree for use in estimating drop parameters. Relationshipsdiscovered which would utilize blooms per tree to forecast cherries per treehave not been precise enough to attempt a forecast as early as the Bloom
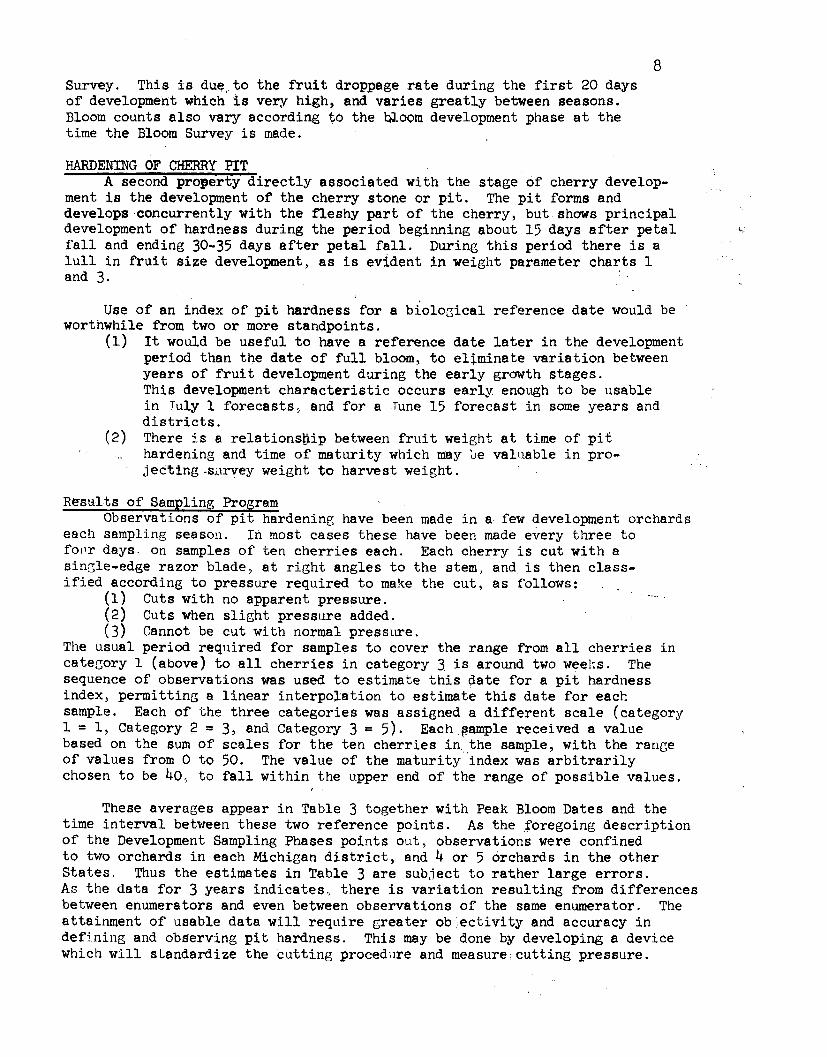
8Survey. This is due, to the fruit droppage rate during the first 20 daysof development which is very high, and varies greatly between seasons.Bloom counts also vary according to the bloom development phase at thetime the Bloom Survey is made.
HARDENING OF CHERRY PITA second property directly associated with the stage of cherry develop-
ment is the development of the cherry stone or pit. The pit forms anddevelops ·concurrently with the fleshy part of the cherry, but shows principaldevelopment of hardness during the period beginning about 15 days after petal ~.fall and ending 30-35 days after petal fall. During this period there is alull in fruit size development, as is evident in weight parameter charts 1and 3.
Use of an index of pit hardness for a biolo~ical reference date would beworthwhile from two or more standpoints.
(1) It would be useful to have a reference date later in the developmentperiod than the date of full bloom, to eliminate variation betweenyears of fruit development during the early growth stages.This development characteristic occurs early enough to be usablein ruly 1 forecasts ~ and for a .Tune 15 forecast in some years anddistricts.
(2) There is a relationsp.ip between fruit weight at time of pithardening and time of maturity which may he valuable in pro-jecting-sllrvey weight to harvest weight.
R~s~lts of Sampling ProgramObservations of pit hardening have been made in a few development orchards
each sampling season. ln most cases these have been made every three tofopI' days. on samples of ten cherries each. Each cherry is cut with asinGle-edge razor blade, at right angles to the stem, and, is then class-ified according to pressure required to make the cut, as follows:
(1) Cuts with no apparent pressure.(2) Cuts when slight pressure added.(3) Cannot be cut with normal pressure.
The usual period required for samples to cover the range from all cherries incategory 1 (above) to all cherries in category 3. is around two weel:s. Thesequence of observations was used to estimate this date for a pit hardnessindex, permitting a linear interpo~ation to estimate this date for eachsample. Each of the three categories was assigned a different scale (category1 = 1, Category 2 = 3, and Category 3 = 5). Each.~ample received a valuebased on the sum of scales for the ten cherries in. the sample, with the rangeof values from 0 to 50. The value of the maturity"index was arbitrarilychosen to be 40~ to fall within the upper end of the range of possible values.
, .These averages appear in Table 3. together with Peak Bloom Dates and the
time interval behleen these two reference points. As the foregoing descriptionof the Development Sampling Phases points out, observations were confinedto two orchards in each Michigan district, and 4 or 5 orchards in the otherStates, Thus the estimates in Table 3 are subject to rather large errors.As the data for 3. years indicates, there is variation resulting from differencesbetween enumerators and even between observations of the same enumerator. Theattainment of usable data will require greater objectivity and accuracy indefining and obserVing pit hardness. This may be done by developing a device'\'lhichwill standardize the cutting procedure and measure; cutting pressure.
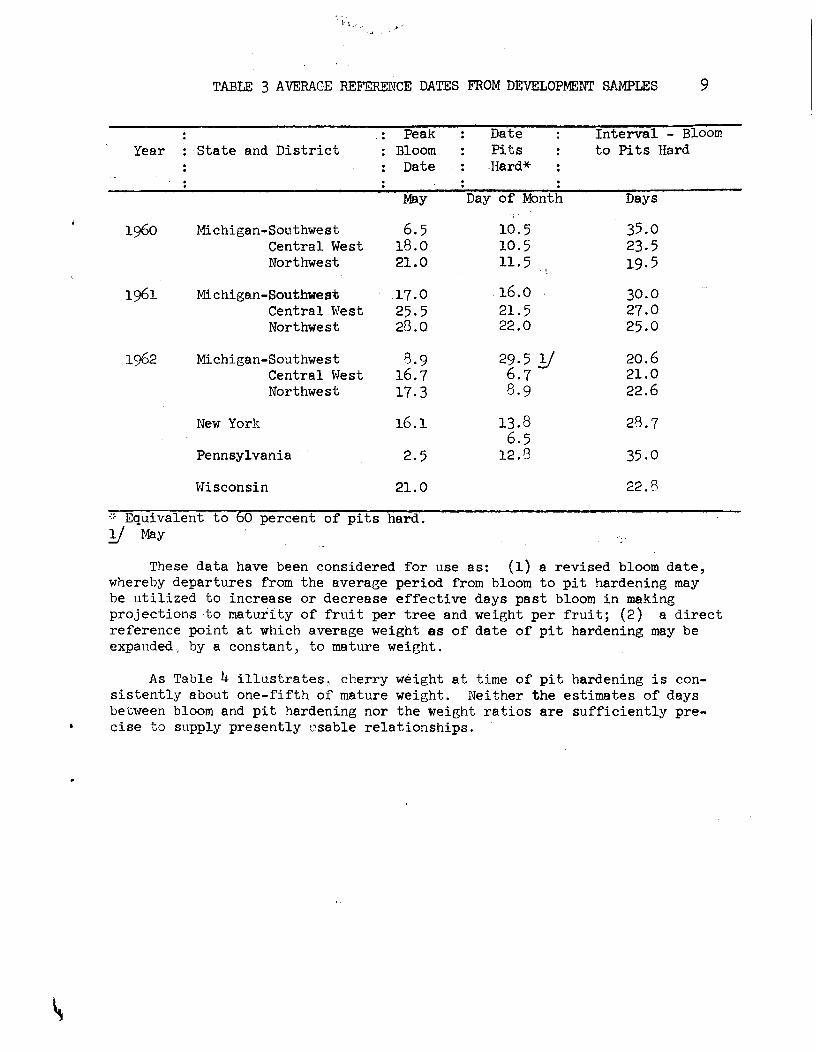
TABLE 3 AVERAGE REFERENCE DATES FROM DEVELOPMENT SAMPLES 9
. Peak Date Interval - BloomYear State and District Bloom Pits to Pi ts Hard
Date .. Hard*
May Day of Month Days
1960 ~uchigan-Southwest 6.5 10.5 35.0Central West 18.0 10.5 23.5Northwest 21.0 11.5 19·5
1961 Michigan-Southwest 17.0 16.0 30.0Central ~vest 25.5 21.5 27.0Northwest 28.0 22.0 25.0
1962 Michigan-Southwest 8.9 29.5 Y 20.6Central vlest 16.7 6.7 21.0Northwest 17.3 8.9 22.6
New York 16.1 13.8 28.76.5
Pennsyl varda 2.5 12.8 35.0Vlisconsin 21.0 22.8
.".Equivalent to 60 percent of pits hard.Y May
These data have been considered for use as: (1) a revised bloom date,whereby departures from the average period from bloom to pit hardening maybe utilized to increase or decrease effective days past bloom in makingprojections to maturity of fruit per tree and weight per fruit; (2) a directreference point at which average weight as of date of pit hardening may beexpanded, by a constant, to mature weight.
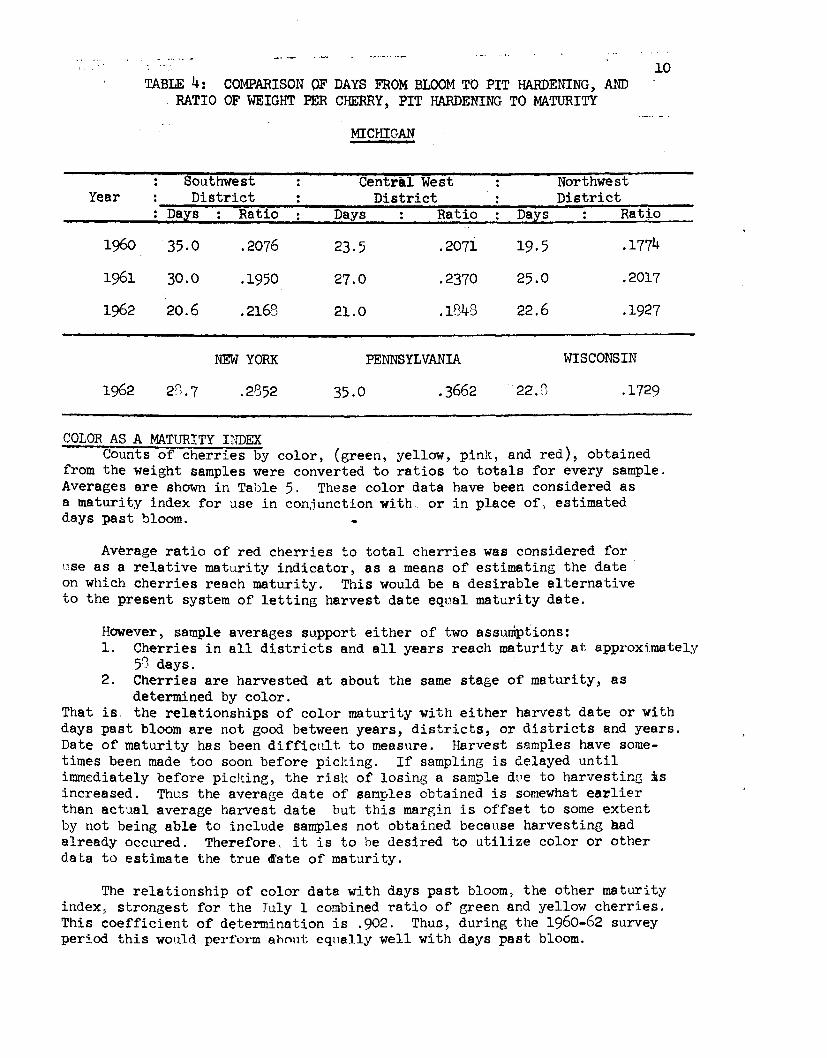
As Table 4 illustrates., cherry weight at time of pit hardening is con-sistently about one-fifth of matLrre weight. Neither the estimates of daysbetween bloom and pit hardening nor the weight ratios are sufficiently pre-cise to supply presently usable relationships.
lOTABLE 4: COMPARISON OF DAYS FROM BLOOM TO PIT HARDENING, AND
RATIO OF WEIGHT PER CHERRY, PIT HARDEr..rrNGTO MATURITY
MICHIGAN
Southwest Central West NorthwestYear District District District
Days Ratio Days Ratio Days Ratio
1960 35.0 .2076 23.5 .2071 19.5 .17741961 30.0 .1950 27.0 .2370 25.0 .20171962 20.6 .2163 21.0 .1848 22.6 .1927
NEW YORK· PENNSYLVANIA WISCONSIN
1962 2G.7 .2852 35.0 .3662 ·22.G .1729
COLOR AS A MATURITY INDEX~ Counts of cherries by color, (green~ yellow, pinlc~ and red), obtained
from the weight samples were converted to ratios to totals for every sample.Averages are shown in Table 5. These color data have been considered asa maturity index for use in conjunction with or in place of, estimateddays past bloom.
Average ratio of red cherries to total cherries was considered foruse as a relative maturity indicator, as a means of estimating the dateon which cherries reach maturity. This would be a desirable alternativeto the present system of letting harvest date equal maturity date.
However, sample averages support either of two assumptions:1. Cherries in all districts and all years reach maturity at approxi.mately
50 days.2. Cherries are harvested at about the same stage of maturity, as
determined by color.That is. the relationships of color maturity with either harvest date or withdays past bloom are not good between years, districts, or districts and years.Date of maturity has been difficult to measure. Harvest samples have some-times been made too soon before picl:ing. If sampling is delayed untilimmediately before picldne;, the risk of losing a sample dl1e to harvesting isincreased. Thus the average date of samples obtained is somewhat earlierthan actual average harvest date but this margin is offset to some extentby not being able to include samples not obtained because harvesting Badalready occured. Therefore., it is to be desired to utilize color or otherdata to estimate the true ~ate of maturity.
The relationship of color data with days past bloom, the other maturityindex~ strongest for the July I combined ratio of green and yellow cherries.This coefficient of determination is .902. ThuG, during the 1960-62 surveyperiod this would perform shout eqnslly well with days past bloom.
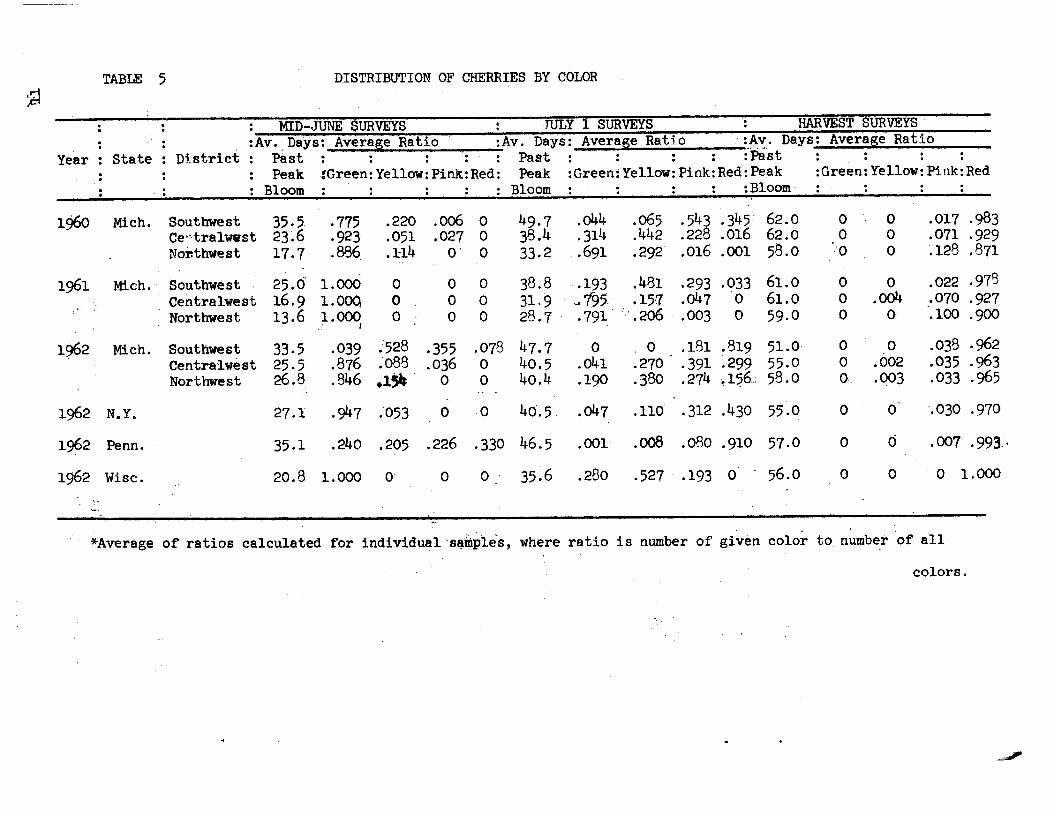
TABLE 5 DISTRIBUTION OF CHERRIES BY COLOR%1
MID-JUNE SURVEYS JULY 1 SURVEYS HARVEST SURVEYS:Av.,Days: Average Ratio :Av. Days: Average Ratio '~A~. Days: Average Ratio
Year State : Di.striet Past Past : . . :Past. .Peak :Green:Yellow: Pink:Red: Peak :Green:Ye11ow: Pink:Red: Peak :Green:Ye11ow:Pink:Red. Bloom Bloom :Bloom ,, .
1960 Mich . Southwest 35.5, .775 .220 .006 0 49.7 .044 .065 .543 .345 62.0 0 0 .017 .983Ce,·,tralwvst 23.6 ·923 .051 .027 0 38.4 .314 .442 .228 .016 62.0 0 0 .071 ·929Nor.thwest 17.7 .886, .1:14 O' 0 33.2 .691 .292 .016 .001 58.0 '0 0 ~128 .871
1961 Mich. Southwest 25.0- 1.000 0 0 0 38.8 '.193 .481 .293 .033 61.0 0 0 .022 .978Centralwest 16.9 1.000 0 0 0 31.9 ' ~195, .15-7 .047 0 61.0 0 .004 .070 .927Northwest 13.6 1.000 0 0 0 28 ..7 ' .791 ','.206 .003 0 59·0 0 0 .100 .900
j
1962 Mich . Southwest 33.5 .039 "528 .355 .078 47.7 0 0 .181 .819 51.0 0 0 .038 ·962Centralwest 25.5 .876 .088 .036 0 40.5 .041 .270 .391 .299 55.0 0 .002 .035 .963Northwest 26.8 .846 .l~ . 0 0 40.4 .190 .380 .274 ,~156, 58.0 0 .003 .033 .965
1962 N.Y. 27.1 .947 .053 0 0 46.5, .047 .110 .312 .430 55.0 0 0 .030 .970
1962 Penn . 35.1 .240 .205 .226 .330 46.5 .001 .008 .080 .910 51.0 0 (j .007 .993.-
1962 Wise. 20.8 1.000 0 0 0 35.6 .280 .527 .193 0 56.0 0 0 0 1.000
*Average of ratios calculated for individual's~mpl~s, where ratio is number of given color to,number of 811colors.
· 12A weaker:relationship.(r2 = .400) was found for green cherries and days
past bloom for the Tune 15 surveys. Color data was poorly related for o.thercolor survey combinations.
SHUCK SPLITThe shuc!;:is the sepal or base of the bloom, and as the cherry grows the
shucl;:is forced up and pulled away from the stem. During Development Surveystazged spurs were classified in the following 4 categories:
(1) No shucks separated from stems(2) Some, but less than half, separited(3) Half or over half~ but not all, separated(4) All shucks separated
Results have indicated a difficulty in'making objective observations.This stage occurs soon after bloom, but appears to be an inferior measureof a development stage in all respects.
III. SANPLE FRAME FOR TREE SELECTION
The frame used to select the initial sample of 25 orchards in 1958 wasa list developed by the Michigan Department of Agriculture in COQlunctionwith a fruit fly inspection proc;ram. Although the list was not 100 percentcomplete it was deemed adequate for the small pilot sample survey. Theprimary sampling unit in 1958 and all subsequent surveys is the block, acontiguous planting of tart cherry trees. basically of a single age and,'variety. Blocks were arrayed by age group wi thin county. Sample blocJ".swere drawn systematically with selection probabilities proportional tototal tree numbers.
The sampling frame for orchards drawn in 1959 and all sl~bsequent yearswas obtained from area segments reporting tart cherries in a 1958,area sampleslrrvey designed to estimate fruit tree numbers in Michigan. For the selectionof sample orchards the number of tart cherry trees of all ages reported foreach bloc'~ in each 1958 area sample sec;ment was weighted by the s~gment expan-sion factor (reciprocal of the selection probability for the segme'1t).Expanded block values were arrayed by age within county. The yield sampleof orchards or blocks was selected systematically with repl~cement. withprobabilities of selection proportional to the expanded number of trees inthe block.
TIle yield sample is stratified geographically by the three principalproducing districts of Michigan: Northwest, Central West. and Southwest.The counties contained in each are listed in the footnotes for Table 6.
Allocation of samples to strata has been roughly proportional to districtor stratum number of trees of all ae;es, except for the small sample used in 1958.
Sample sizes and estimates of tree numbers, by district strata, areshown in Table 6. The 25 samples used in 1958 were again sampled in 1959,together with 40 newly chosen blocks. In 1960 an additional 95 h19~~~were chosen and the 1958 blocks dropped, so that the 1960 ggmI':les~ze was135. For 1961., 45 more blocks were drawn brinrrinrr.•..,;.,0 .•..,...~••l. to -IBO. Thesesame 180 blocks also served as the sample for 1962. Of course, the effective~~ple sizes are somewhat smaller due to orchards removed, growers' refusalto t;""-nerate,lof' samples:.otherwise lost.
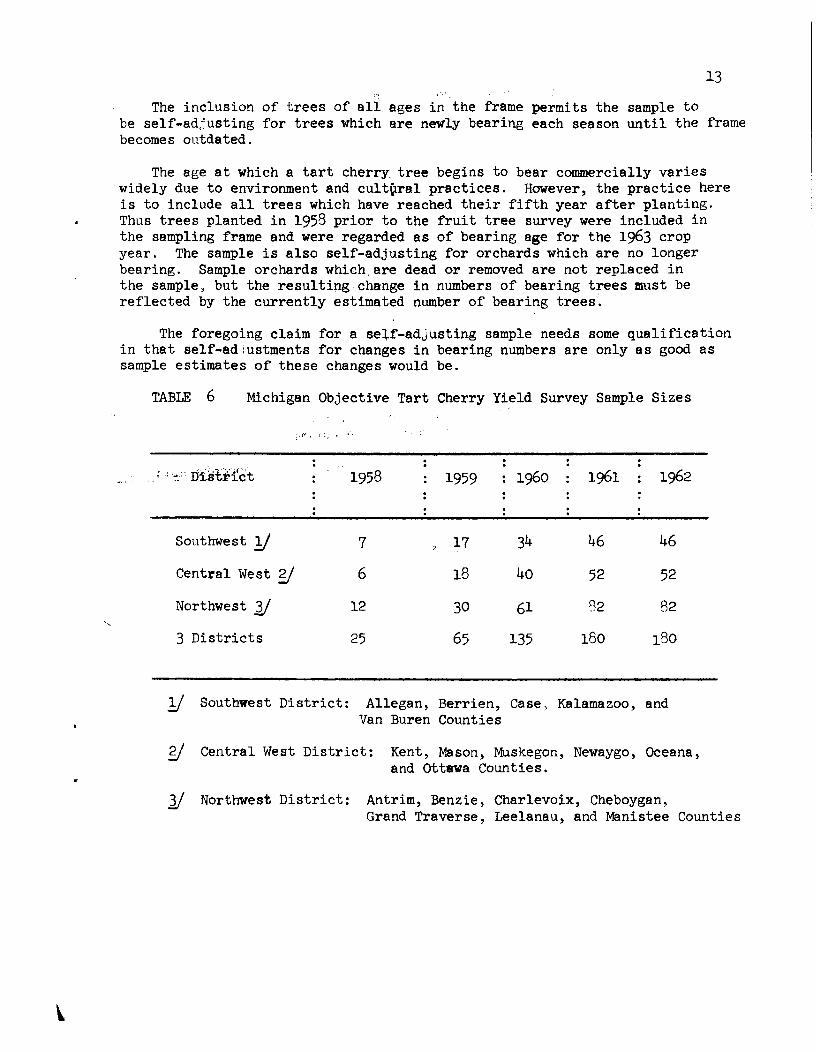
13The inclusion of trees of all ages in the frame permits the sample to
be self-adjusting for trees which are newly bearing each season until the framebecomes outdated.
The age at which a tart cherry tree begins to bear commercially varieswidely due to environment and cult~ral practices. However, the practice hereis to include all trees which have reached their fifth year after planting.Thus trees planted in 1958 prior to the fruit tree survey were included inthe sampling frame and were regarded as of bearing age for the 1963 cropyear. The sample is also self-adjusting for-orchards which are no longerbearing. Sample orchards which,are dead or removed are not replaced inthe sample) but the resulting change in numbers of bearing trees must bereflected by the currently estimated number of bearing trees.
The foregoing claim for a self-adjusting sample needs some qualificationin that self-ad!ustments for changes in bearing numbers are only as good assample estimates of these changes would be.
TABLE 6 Michigan Objective Tart Cherry Yield Survey Sample Sizes
Southwest yCentral West yNorthwest ]j
3 Districts
1958
7
6
12
25
1959
171830
65
34
40
61135
465232
180
46
52
82180
\.
y Southwest District: Allegan, Berrien, Casel Kalamazoo, andVan Buren Counties
gj Central West District: Kent, Mason, Muskegon, Newaygo, Oceana,and Ottawa Counties.
]j Northwest District: Antrim, Benzie, Charlevoix, Cheboygan,Grand Traverse, Leelanau, and Manistee Counties
14IV. CHERRIES PER TREE:
The most important component of tart cherry reprOduction, the one whichvaries most widely over seasons and producing districts, is the number ofcherries per tree.
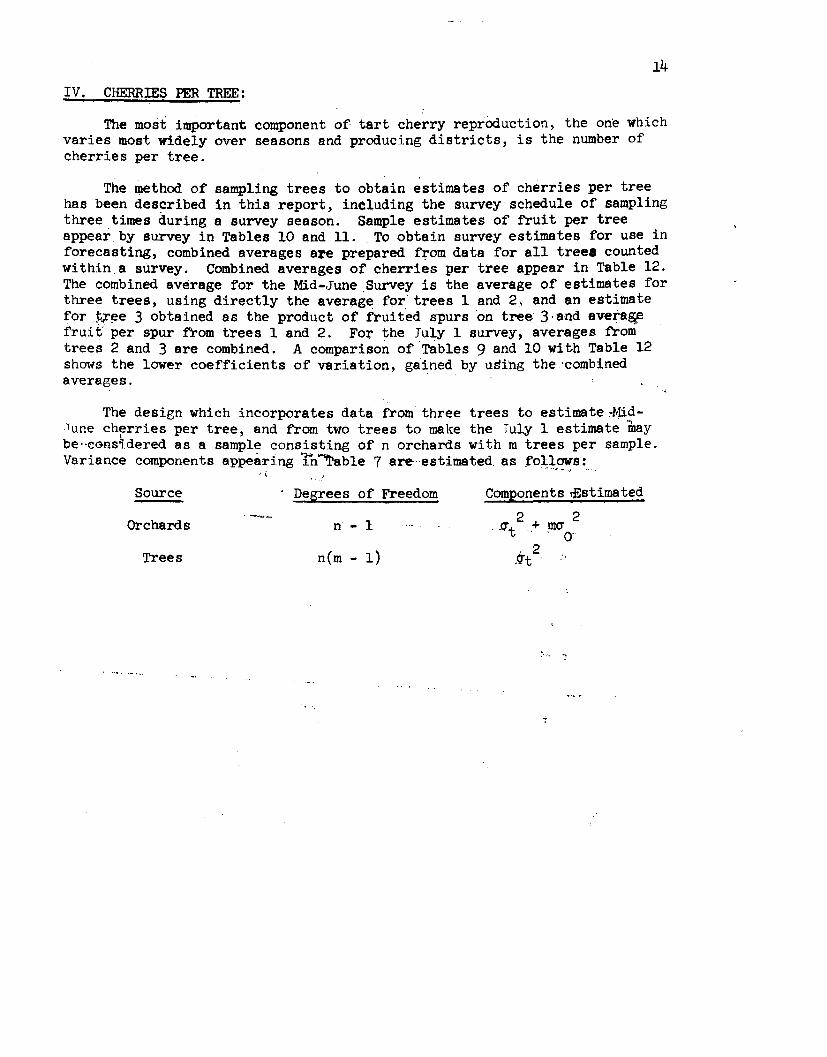
The ~thod of sampling trees to obtain estimates of cherries per treehas been des~ribed in this report, ineludin~ the survey schedule of samplingthree time.s during a survey season. Sample estimates of fruit per treeappear by survey in Tables 10 and 11. To obtain survey estimates for use inforecasting, combined averages are prepared crom data for all trees countedwithin. a survey. Combined averages of cherries per tree appear in Table 12.The combined average for the Mid-June ,Survey is the average of estimates forthree trees, using directly the average fqr trees 1 and 2~ and an estimatefor j;)'~e3 obtained as the product of fruited spurs 'on tree 3,and averagefruit" per spur from trees 1 and 2. For the July 1 survey, averages fromtrees 2 and 3 are combined. A comparison ofT8bles 9 and 10 with Table 12shows the lower coefficients of var.iation, gained by using the 'combinedaverages.
The design which incorporates data from three trees to estimate .-Mid-Tune cherries per tree, and from two trees to make the iu1y 1 estimate rtJaybe',cGRsidered as a sample consisting of n orchards with m trees per sample.Variance components appear:tng 'fh"'1'ab1e7 are-'estimated as fo1).ows:~.-'." ~"
!.t
Source
Orchards
Trees
. Degrees of Freedom
n - 1
n(m 1)
',. "
Components ,f;stimated2 2
,!]t .+ mer, . O·, 2
.O"t
15~.', ' '. .'
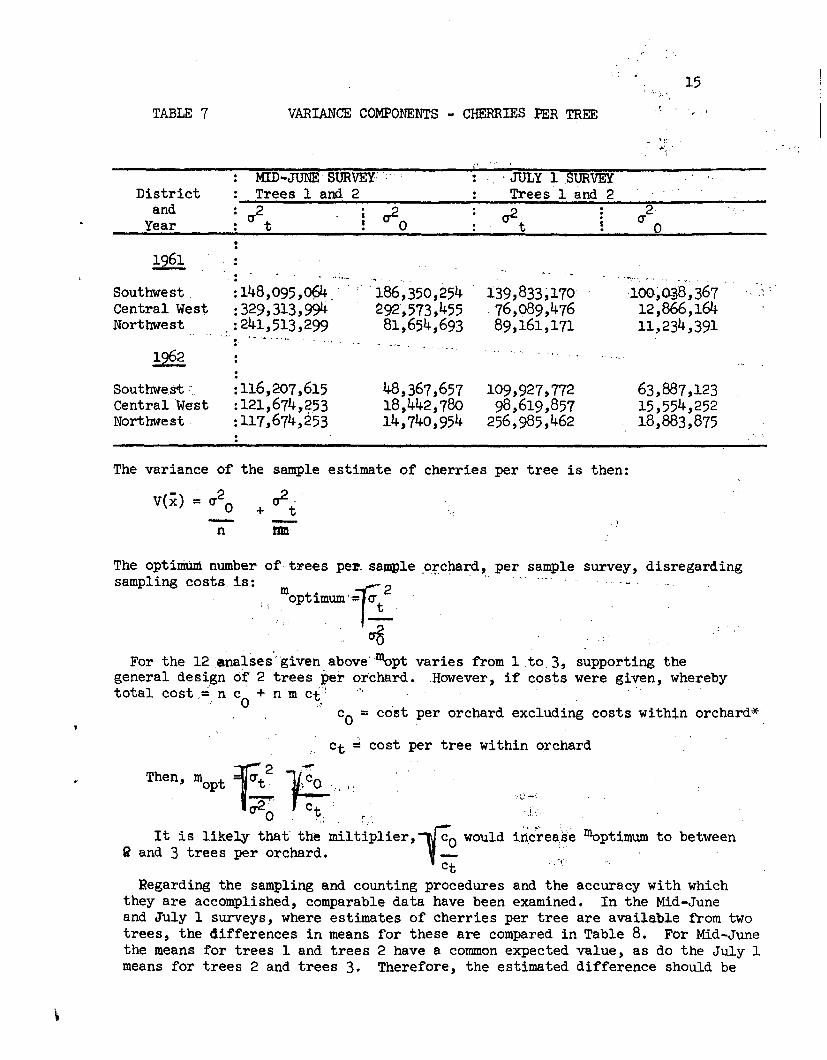
TABLE 7 VARIANCE COMPONENTS - CHERRIES PER TREE ;. ,
. JULY 1 .SURVEYTrees 1 and 2District
andYear
MID-JUNE' SURVEYTrees 1 and 2
<It 020
.,,..cr2
t $. 2(1' 0
1961SouthwestCentral WestNorthwest
Southwe,st.~.Central WestNorthwest
·;148,095,094:329,313,994-
.:241,513,299·.'··:116,207,615:121,674,253:117,674,253
'186,350,254~92',573 ,455
81,654,693
48,367,65718,442,78014,740,954
1.39,833;17076,089,47689,161,171
109,927,77298,619,857
256,985,462
·100~o.]8,36712,866,16411,234,391
63,887,12315,554,25218,883,875
The variance of the sample estimate of cherries per tree is then:V(x) - (1'2 r?-,- 0 + t .,-n ran
The optimum number of trees pe~ sample~~chard~ per sample survey, disregardingsampling costs,is: m •. ~ 2, opt~mum "= (1'
'i t, -
, ~., 0
For the 12 enalses',given above,mopt varies from 1to 3, supporting thegeneral design of 2 trees per oI'chard.However, if costs were given, wherebytotal costd n c + nm Ct:~ ,-, .
" 0" Co = cost per orchard excluding cost,swithin orchard*.Ct = cost per tree within orchard
Then, mopt ;;u;< 1:;0, ',_,1;20 Ct " '.1,.,
It is likely that'the'milt~P1ier,~0 would ihctease IDoptimum to betweenRand 3 trees per orchard. _Ct ,.or
Regarding the sampling and counting procedures and the accuracy with whichthey are accomplished, comparable data have been examined. In the Mid-Juneand July 1 surveys, where estimates of cherries per tree are available from twotrees, the differences in means for these are compared in Table 8. For Mid-Junethe means for trees 1 and trees 2 have a common expected value, as do the July 1means for trees 2 and trees 3. Therefore, the estimated difference should be
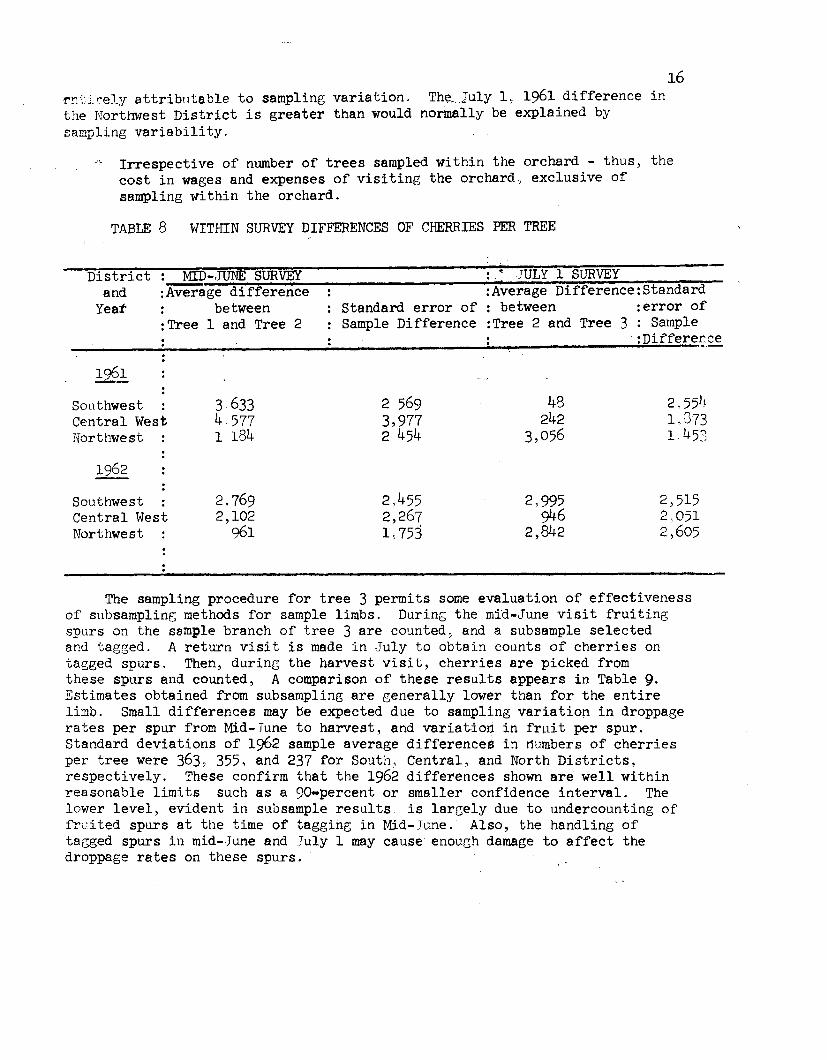
16'!'!;"l::LreJyattributable to sampling variation. The_July l~ 1961 difference inthe Northwest District is greater than would normally be explained bysampling variability.
Irrespective of number of trees sampled within the orchard - thus~ thecost in wages and expenses of visiting the orchard, exclusive ofsampling within the orchard.
TABLE 8 WITHIN SURVEY DIFFERENCES OF CHERRIES PER TREE
Districtand
Yeat
MID-.JUNE SURVEY:Average difference
between:Tree 1 and Tree 2
.~ JULY 1 SURVEY:A~erage Difference:Standard
Standard error of : between :error ofSample Difference :Tree 2 and Tree 3 : Sample
:Di ffere;:.S!.
SouthwestCentral WestNorthwest
1962SouthwestCentral WestNorthwest
3 63345771.184
2,7692,102
961
2 5693,9772 454
2,4552,2671,753
48242
3,056
2,995946
2,842
2,5541,3731 453
2,5152 ..0512,605
The sampling procedure for tree 3 permits some evaluation of effectivenessof subsampling methods for sample limbs. During the mid-June visit fruitingspurs on the sample branch of tree 3 are counted, and a subsample selectedand tagged. A return visit is made in July to obtain counts of cherries ontagged spurs. Then, during the harvest visit, cherries are picked fromthese spurs and counted, A comparison of these results appears in Table 9.Estimates obtained from subsampling are generally lower than for the entirelimb. Small differences may tie expected due to sampling variation in droppagerates per spur from Mid-Tune to harvest, and variation in fruit per spur.Standard deviations of 1962 sample average difference~ in rtumbers of cherriesper tree were 363, 355, and 237 for South, Central, and North Districts,respectively. These confirm that the 1962 differences shown are well withinreasonable limits such as a 90-percent or smaller confidence interval. Thelower level~ evident in subsample results is largely due to undercounting offr0ited spurs at the time of tagging in t~d-June. Also, the handling oftagged spurs in mid-June and July 1 may cause enouc;h damage to affect thedroppage rates on these spurs.
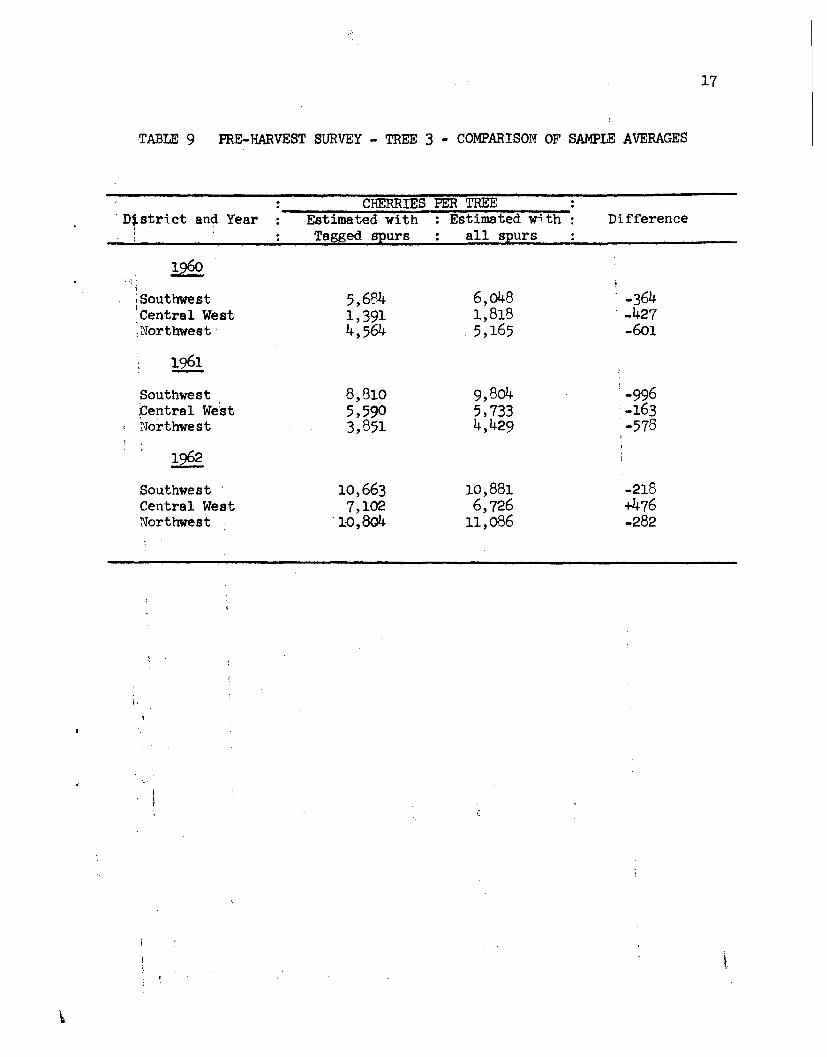
TABLE 9 PRE- HARVEST SURVEY - TREE 3 - COMPARISON OF SAMPLE AVERAGES
CHERRIES PER TREE,D~strict and Year Estimated with Estimated with Difference
, Tagged spurs all spurs1960
\;
;Southwest 5,684 6,048 . -364ICentral West 1,391 1,818 ' -427Northwest' 4, 564 5,165 -601
1961Southwest 8,810 9,804 :·996pentra1 We:st 5,590 5,733 '-163
, Northwest 3,851 4,429 -5781962-
Southwest 10,663 10,881 -218Central West 7,102 6,726 +476Northwest '10,804 11,086 -282
\.
17
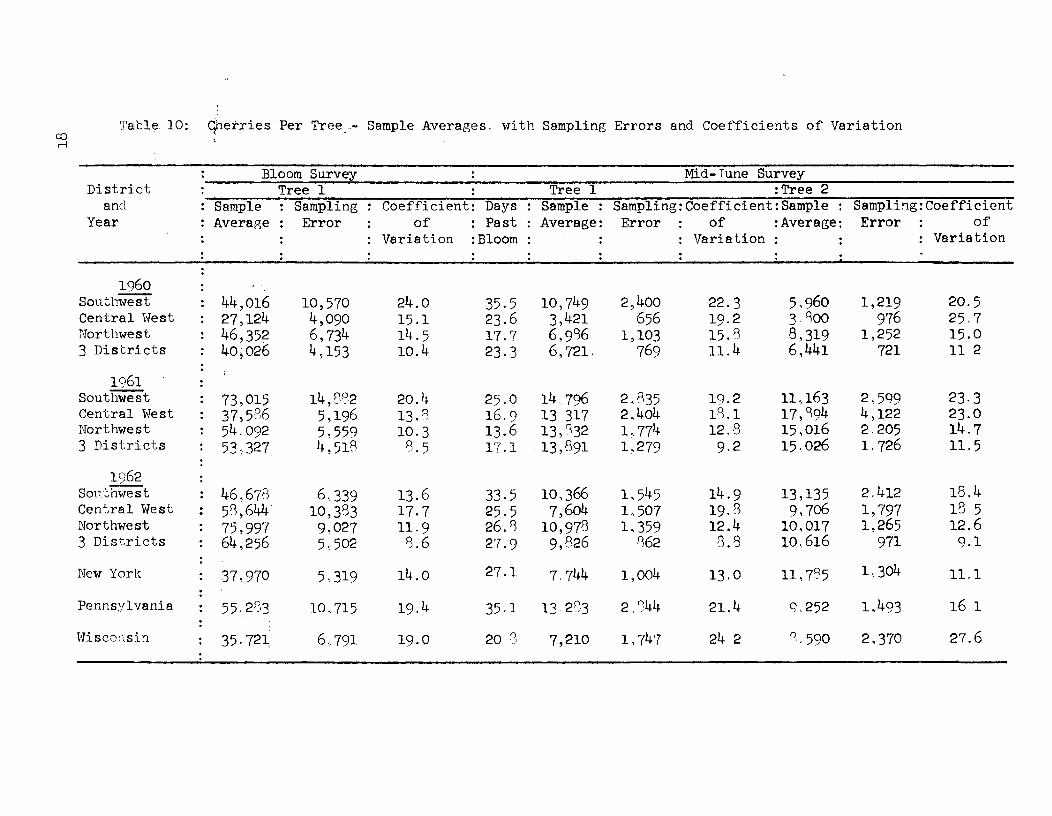
Table 10: qhe:tries Per Tree,.- Sample Averages, with Sampling Errors and Coefficients of Variationcor-l
Bloom Survey Mid-Tune SurveyDistrict Tree 1 Tree 1 :Tree 2
and Sample Sampling Coefficient: Days Sample : Sampling: Coefficient: Sample Sampling: CoefficientYear Average Error of Past Average: Error of :Average: Error of
Variation :Bloom Variation Variation
1960Southwest 44,016 10,570 24.0 35.5 10,749 2,400 22.3 5,960 1,219 20.5Central Hest 27,124 4,090 15.1 23.6 3,421 656 19·2 3.800 976 25.7Northwest 46,352 6,734 14.5 17.7 6,986 1,103 15.8 8,319 1,252 15.03 Districts 40,026 4,153 10.4 23.3 6,721. 769 11.4 6,441 721 112
1961Southwest 73,015 14, [',e,2 20.4 25.0 14 796 2,835 19.2 11,163 2,599 23·3Central West 37,5·36 5,196 13.8 16.9 13 317 2,404 IS.1 17,S94 4,122 23.0Northwest 54.092 5,559 10·3 13.6 13,0,32 1,774 12.8 15,016 2.205 14.73 Districts 53,327 4,518 8.5 17.1 13,891 1,279 9·2 15.026 1.726 11.5
1962Son('h~est 46,678 6,339 13.6 33.5 10,366 1,545 14.9 13,135 2,412 18.4Central West 53,644 10,383 17.7 25.5 7,604 1,507 19.8 9,706 1,797 18 5Northwest 75,997 9,027 11.9 26.8 10,978 1,359 12.4 10,017 1,265 12.63 Dist.ricts 64,256 5.502 8.6 27.9 9,826 862 8.8 10.616 971 9.1New York 37,970 5,319 14.0 27.1 7,744 1,004 13·0 11,785 1·.304 11.1Pennsylvania 55.283 10,715 19.4 35.1 13 20,3 2 '344 21.4 Q,.252 1.493 16 1~Visc(msin 35.721, 6 ..791 19.0 20 :) 7,210 1,747 24 2 0, . 590 2,370 27.6
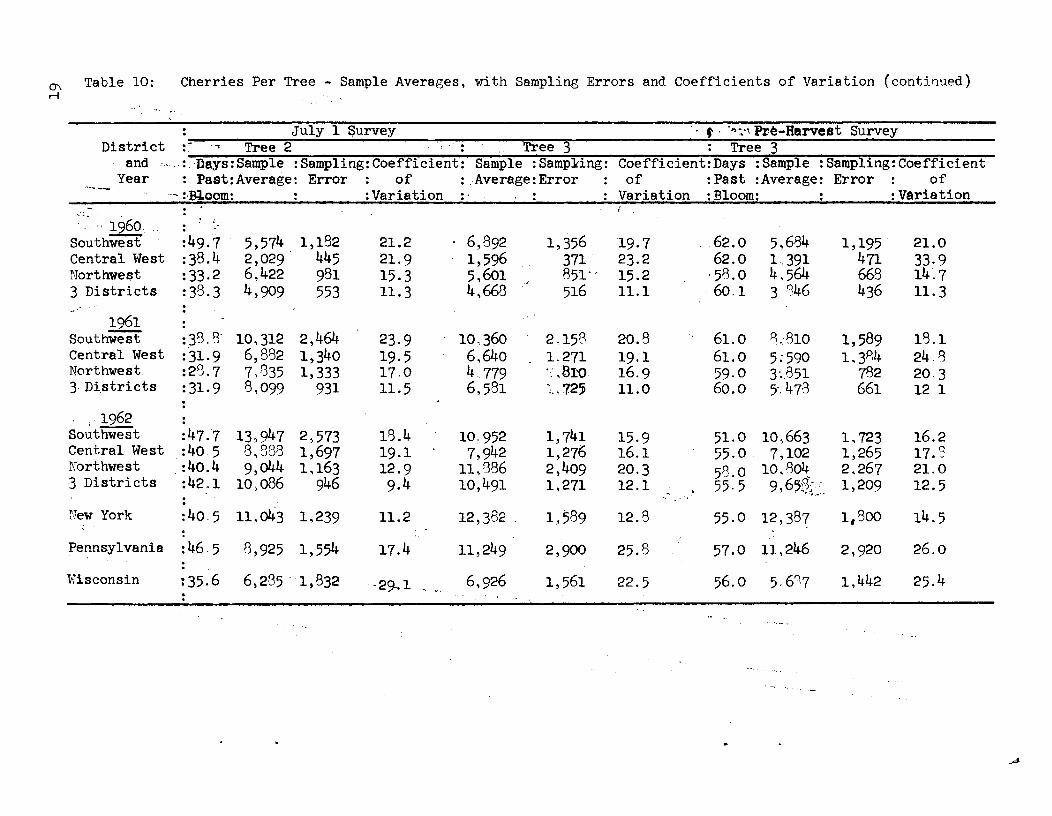
0\ Table 10: Cherries Per Tree - Sample Averages, with Sampling Errors and Coefficients of Variation (continued)r-l
July 1 $urvey '. t .'-"::."Pr.e-Barvest SurveyDistrict · ... Tree 2 ",. '. Tree 3 Tree 3.. . .
and .:.'Days:Sample :Sampling: Coefficient: Sample :Samp:Hng: Coefficient: Days :Sample :Sampling: CoefficientYear : Past: Average: Error of ::Average :Error of :Past :Average: Error of
....~..• -- . - :·Bloom: :Variation Variation :Bloom: :Variation..." . :
'0 '; 1960. ,:
Southwest :49.7 5,574 1,182 21.2 6,892 1,356 19·7 62.0 5,684 1,195 21.0Central West :38.4 2,029 445 21.9 1,596 371 23.2 62.0 1·,391 471 33.9Northwest :33.2 6,422 981 15.3 5,601 851'. 15.2 '58.0 4,564 668 14.73 Districts :38.3 4,909 553 11.3 4,668 516 11.1 60.1 3 846 436 11.3
1961 :Southwest :38.8' 10,312 2,464 23.9 10,360 2 ..158 20.8 61.0 8;810 1,589 18.1Central West :31·9 6,882 1,340 19·5 6,640 1,271 19.1 61.0 5;590 1,384 24.8Northwest :28.7 7,835 1,333 17.0 4.779 .:J~ro 16.9 59·0 3'..851 782 20·33·Districts :31.9 8,099 931 11.5 6.581 1...72~ 11.0 60.0 5.478 661 12 1
1962 :'- :47.7 13,947Southwest 2,573 18.4 10·952 1,741 15.9 51.0 10,663 1,723 16.2Central West :40 5 8,838 1,697 19.1 7,942 1,276 16.1 55.0 7,102 1,265 17.3Northwest :40.4 9,044 1,163 12.9 11.886 2,409 20.3 58.0 10,804 2,267 21.03.Districts :42.1 10,086 946 9.4 10,491 1.271 12.1 55·5 9658" 1,209 12.5- , . "" ..~..•.....
: ., .. ..
New York :40·5 11,043 1,239 11.2 12,382 . 1,589 12.8 55.0 12,387 11800 14.5:
Pennsylvania :46·5 8,925 1,554 17.4 11,249 2,900 25.8 57.0 11,246 2,920 26,0··K1sconsin :35.6 6,285 . 1,832 .29-.1 6,926 1,561 22.5 56.0 5·60,7 1,442 25.4
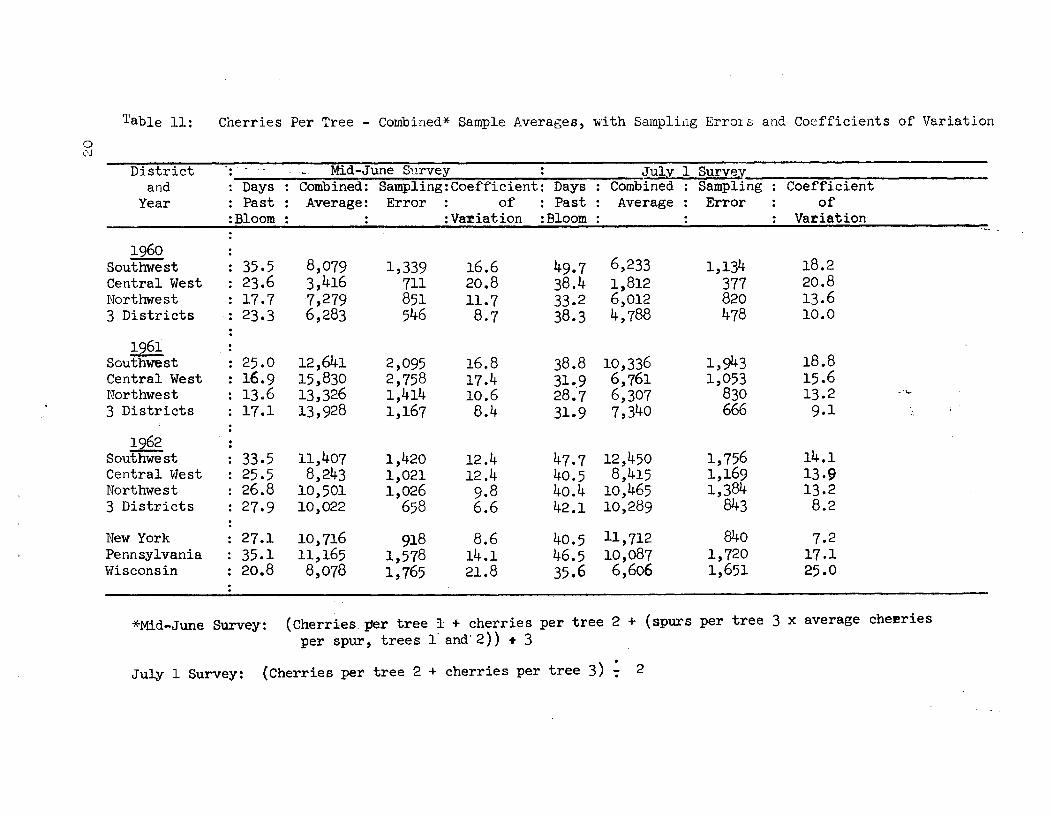
Table 11: Cherries Per Tree - Combined* Sample Averages, w'ith Sampling Err01S and Coefficients of Variationa('J
District Mid-June Survey July 1 Surveyand Days Combined: Sampling:Coefficient: Days Combined Sampling Coefficient
Year Past Average: Error of Past Average Error of:Bloom :Variation :Bloom Variation
19608,079 6,233 1,134 18.2Southwest 35.5 1,339 16.6 49.7
Central West 23.6 3,416 711 20.8 38.4 1,812 377 20.8Northwest 17.7 7,279 851 11.7 33.2 6,012 820 13.63 Districts 23.3 6,283 546 8.7 38.3 4,788 478 10.0
1961Sout'hWest 25.0 12,641 2,095 16.8 38.8 10,336 1,943 18.8Central West 16.9 15,830 2,758 17.4 31.,9 6,761 1,053 15.6Northwest 13.6 13,326 1,414 10.6 28.7 6,307 830 13.23 Districts 17.1 13,928 1,167 8.4 31.9 7,340 666 9·1 c,
~ 11,407 1,756 14.1Southwest 33.5 1,420 12.4 47.7 12,450Central West 25.5 8,243 1,021 12.4 40.5 8,415 1,169 13.9Northwest 26.8 10,501 1,026 9.8 40.4 10,465 1,384 13.23 Districts 27.9 10,022 658 6.6 42.1 10,289 843 8.2New York 27.1 10,716 918 8.6 40.5 11,712 840 7.2Pennsylvania 35.1 11,165 1,578 14.1 46.5 10,087 1,720 17.1Wisconsin 20.8 8,078 1,765 21.8 35.6 6,606 1,651 25.0
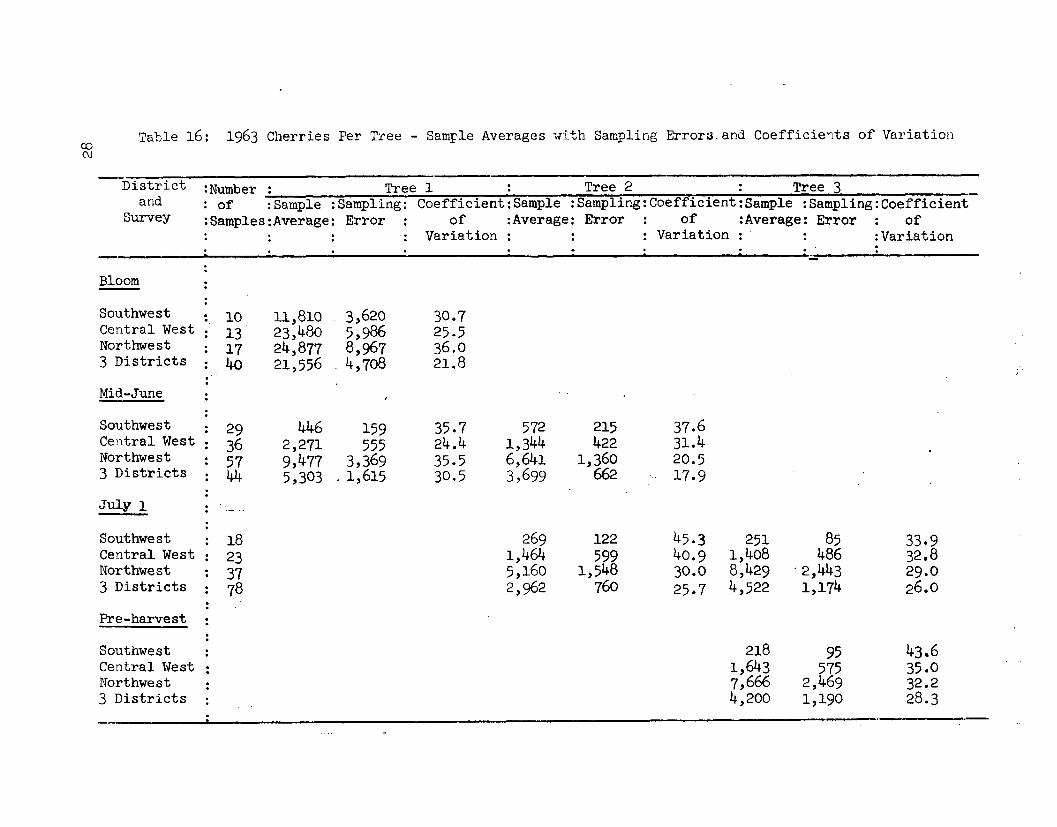
*Mid-June Survey: (Cherri-esper tree 1 + cherries per tree 2 + (spurs per tree 3 x average cherriesper spur, trees 1-and'2» + 3
July 1 Survey: (Cherries per tree 2 + cherries per tree 3) ';' 2
... , ."
~ t ,.~ ~••• ,,'j
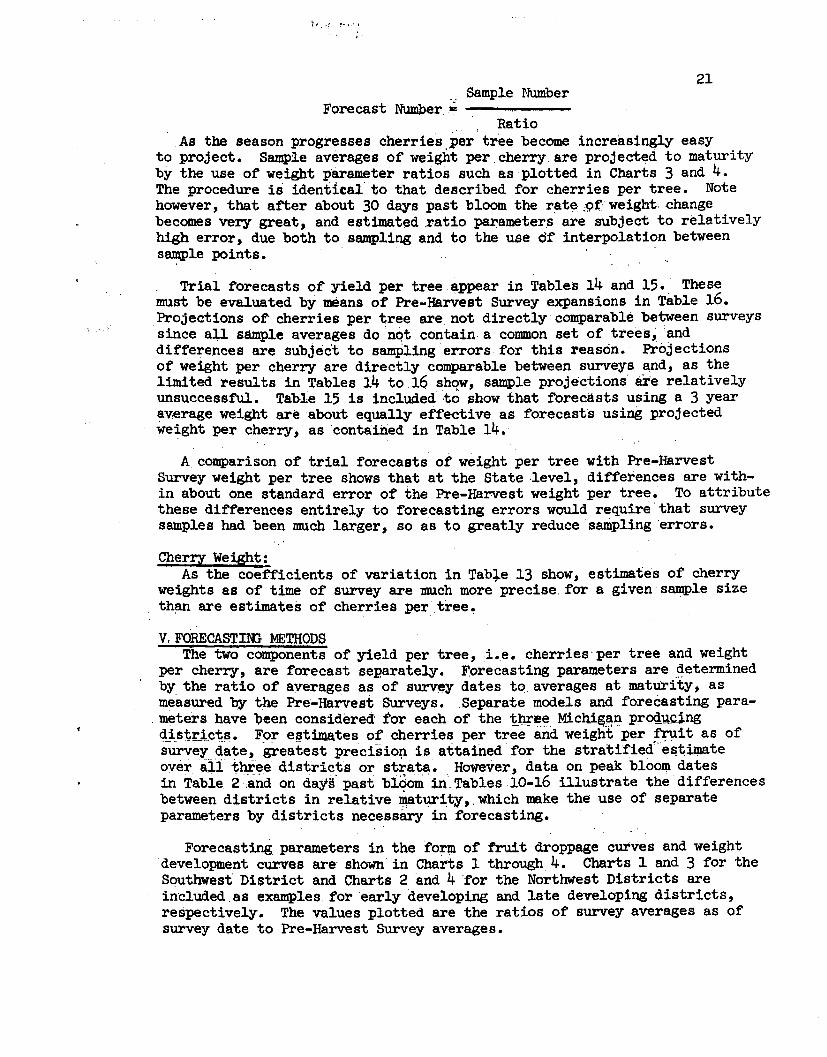
21Sample Number
Forecast Number~ ------------, " Ratio
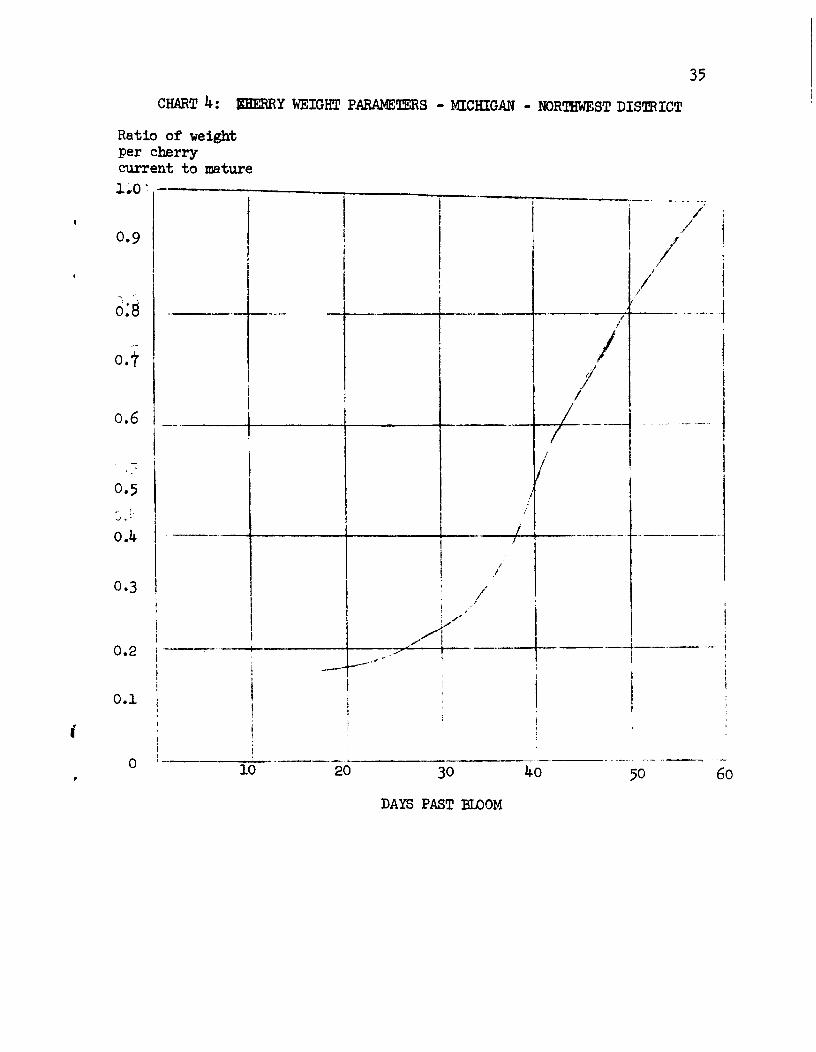
,As the season progresses cherries per tree become increasingly easyto project. Sample averages of weight per, cherry. are projected to maturityby the use of weight parameter ratios such as plotted in Charts 3 and 4.The procedure is identical'to that described for cherries per tree. Notehowever, that after about 30 days past bloom the rate:.;Qf:weight, changebecomes very great, and estimated ratio ~ameter~' are subject to relativelyhigh error, due both to sampling and to the use df interpolation betweensample points.' ,. Trial forecasts of yield p~r tree appear in Tables 14 and 15., Thesemust be evaluated by means of Pre-Harvest Survey expansions in Table 16.Projections o~ cherries per tree are not directly comparable betWeen surveyssince aU sample averages donqtcontaina common set of trees; anddifferences are subjec't to samPling' errors for this reason. Projectionsof weight per cherry are directly comparable between surveys and, as thelimited results in Tables 14 to 16 shqw, sample projections are relativelyunsuccessful. Table 15 is included to show that forecasts using a 3 year~w~rage weight are about equally effective as forecasts using projectedweight per cherry, ascontairied in Table 14.
A comparison of trial forecasts of weight per tree with Pre-HarvestSurvey weight per tree shows that at the State ,level, differences are with-in about one standard error of the Pre-Harvest weight per tree. To attributethese differences entirely to forecasting errors would require'that surveysamples had been much larger, so as to greatly reduce sampling 'errors.Cherry Wei.ghtt
As the coefficients of variation in Tab+e 13 show, estimates of cherryweights as of time of survey are much more precise. for a given sample sizethan are estimates of cherries per tree ~V,FORECASTIJ.IUMETHODS
The two components of yield per tree, i.,e.cherries' per tree and weightper cherry, are forecast sep.arately. Forecasting parameters are ~eterminedby the ratio of averages as of surv~y dates to,averages at maturity, asmeasured by the Pre~Harvest Surveys. Separate models and forecasting para-
,meters have been considered tor each of the ~~~e Michi~~~p~Qducing<;A~t:rJ~ts. Fo! estimates of cherries per tree and weight' per ~i t as ofsurvey,date, ,greatest precisio~ is attained for the stratified" es1{imateover.li),ithree districts or strata. However, data on peak bloom datesin Table 2,a.nd on day~' past b1ooni'in',Tables 10-16 illustrate the differencesbetween districts in relative ~turity"which make the use of separateparameters by districts necessSrytn forecasting.
Forecasting parameters in the for~ of fruit droppage curves and weightdevelopment curves are' shown in Charts 1 through 4. Charts 1 and 3 for theSouthwest' District and Charts 2 and 4 for the Northwest Districts areincluded,as examples, for early developing and late developing districts,respectively. The values plotted are the ratios of survey averages as ofsurvey date to Pre-Harvest Survey averages.
22i
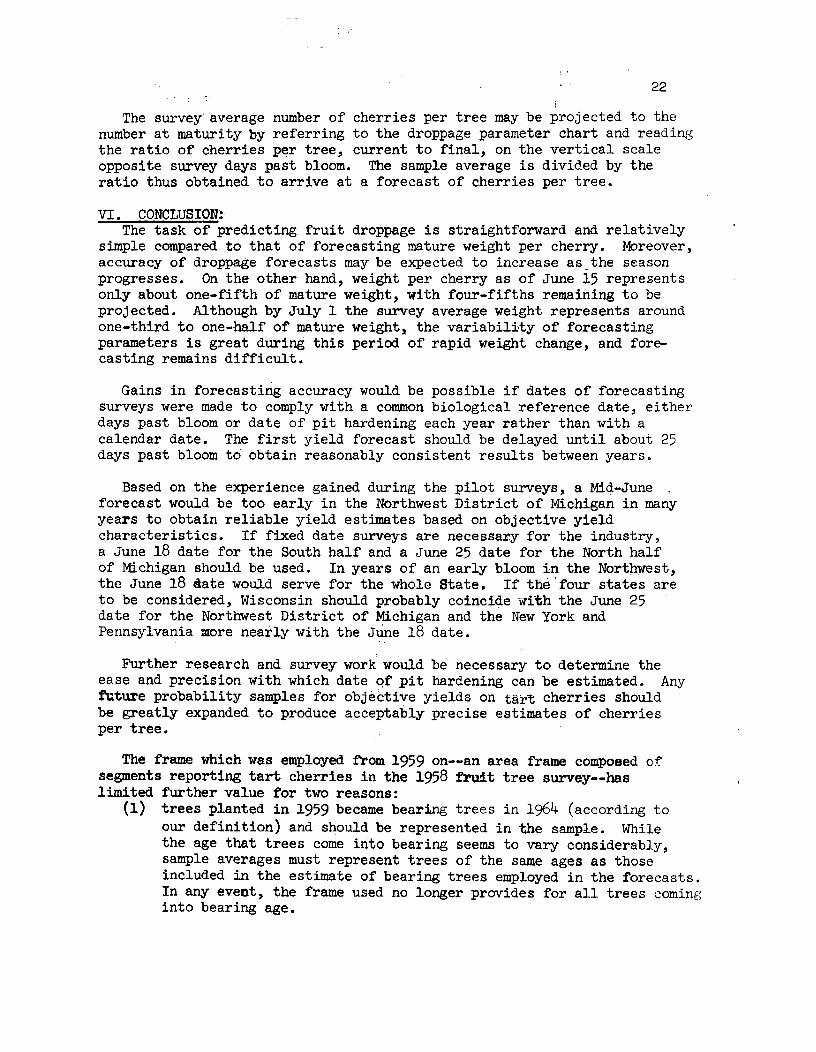
The survey average number of cherries per tree may be projected to thenumber at maturity by referring to the droppage parameter chart and readingthe ratio of cherries per tree, current to final, on the vertical scaleopposite survey days past bloom. The sample average is divided by theratio thus obtained to arrive at a forecast of cherries per tree.
VI. CONCLUSION:The task of predicting fruit droppage is straightforward and relatively
simple compared to that of forecasting mature weight per cherry. Moreover,accuracy of droppage forecasts may be expected to increase as the seasonprogresses. On the other hand, weight per cherry as of June 15 representsonly about one-fifth of mature weight, with four-fifths remaining to beprojected. Although by July 1 the survey average weight represents aroundone-third to one-half of mature weight2 the variability of forecastingparameters is great during this period of rapid weight change, and fore-casting remains difficult.
Gains in forecasting accuracy would be possible if dates of forecastingsurveys were made to comply with a common biological reference date, eitherdays past bloom or date of pit hardening each year rather than with acalendar date. The first yield forecast should be delayed until about 25days past bloom to obtain reasonably consistent results between years.
Based on the experience gained during the pilot surveys, a Mid-Juneforecast would be too early in the Northwest District of Michigan in manyyears to obtain reliable yield estimates based on objective yieldcharacteristics. If fixed date surveys are necessary for the industry,a June 18 date for the South half and a June 25 date for the North halfof Michigan should be used. In years of an early bloom in the Northwest,the June 18 sate would serve for the whole State. If the 'four states areto be considered, Wisconsin should probably coincide with the June 25date for the Northwest District of Michigan and the New York andPennsylvania more nearly with the Jtine 18 date.
Further research and survey work would be necessary to determine theease and precision with which date qf pit hardening can be estimated. Anyfuture probability samples for objective yields on tart cherries shouldbe greatly expanded to produce acceptably precise estimates of cherriesper tree.
The frame which was employed from 1959 on--an area frame composed ofsegments reporting tart cherries in the 1958 fruit tree survey--haslimited further value for two reasons:
(1) trees planted in 1959 became bearing trees in 1964 (according toour definition) and should be represented in the sample. Whilethe age that trees come into bearing seems to vary considerably,sample averages must represent trees of the same ages as thoseincluded in the estimate of bearing trees employed in the forecasts.In any event, the frame used no longer provides for all trees cominginto bearing age.
: 23!
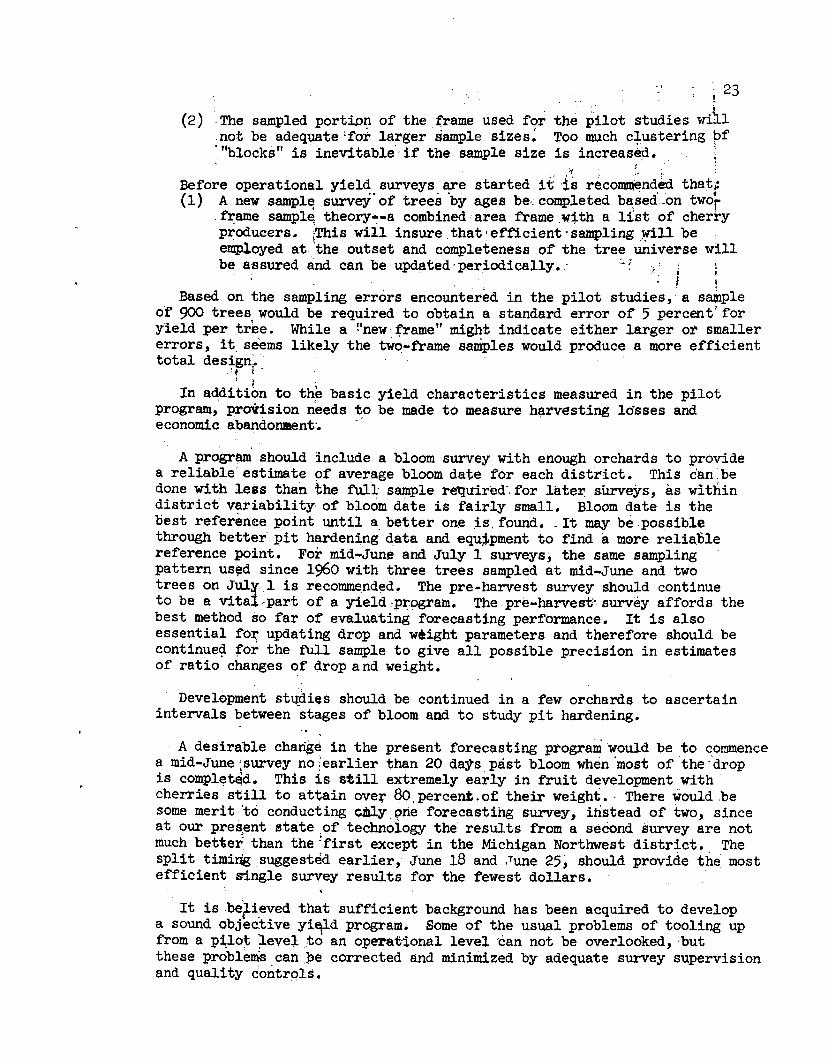
(2) ·The sampled portiP~ of the frame used fqr'the pilot studies wi~l.not be adequate 'for larger sample sizes. Too much cfustering pf'''b10cks''is inevitable'if the sample size is increased. '
" '.~~, ;Before operational yield surveys are started it is recommen~ed that;(1) A new sampl~ survey' of trees 'by ages be.:comPleted bff:sed..on twor
.frame samp1~ theory~-a combined'area frame.w;th a list of cherryproducers.iThis will insure that' efficient· sampling ,~ll be ,employed at:the outset and completeness of the tree universe willbe assured and can be updated' per,iod1cally •. :d, i
IBased on the sampling errors encountered in the pilot studies, a s~ple
of 900 trees would be required to obtain a standard error of 5 percent'foryield per tree. While a !'newframe" might indicate either larger or smallererrors, it,seems likely the two-frame samples would produce a more efficienttotal des~~nr.·
: j ,
In addition to th~ basic yield characteristics measured in the pilotprogram, pronsion needs to be made to measure h~rvesting losses andeconomic abandonment~
A program should include a bloom survey with enough orchards to providea reliable estimate of average bloom date for each district. This can.bedone with less than the full sample re'quired',for later- sUrveys, as withindistrict variability of bloom date is fairly small. Bloom date is thebest referenee point until a,better one is, found •. It may be.possiblethrough better pit hardening data andequ~pment to find a m0re reliao1ereference point. For mid-June and July 1 surveys:, the same samplingpattern us~d since 1960 with three trees sampled at mid-June and twotrees on Jul~ 1 is recomme,nded~ The pre~harvest survey should continueto be a vital ;part of a yield :program. The·pre-harvestt survey affords thebest method so far of evaluating forecasting performance. It is alsoessential for updating drop and weight parameters and therefore should becontinue~ for the full sample to give all possible precision in estimatesof ratio changes of drop and weight.
Development stqdies should be continued in a few orchards to ascertainintervals between stages of bloom and to study pit hardening.
A desirable change 1n the present forecasting program would be to ~ommencea mid-June;survey no:ear1ier than 20 dats past bloom when 'most of the-dropis completEid. This is still extremely early in fruit development withcherries still to attain ove~ ~O.percent.of their weight. ' There would .besome merit 'to conducting cJ!1ly.~rieforecasting survey, ihstead of two, sinceat our pre~ent /lltate,of technology the results from a second survey are notmuch better than the!first except in the Michigan Northwest district. Thesplit timing suggested earlier, June 18 and ,Tune 25~ should provide the mostefficient ~ngle survey results for the fewest dollars.
It is .be~~eved that sufficient background has been acquired to developa sound objective yi¥d program. Some of the usual problems of tOOling upfrom a pilot level to an operat'ional level 'can not be overlooked, 'butthese proble~canpe corrected and minimized by adequate survey supervisionand quality contrglS.
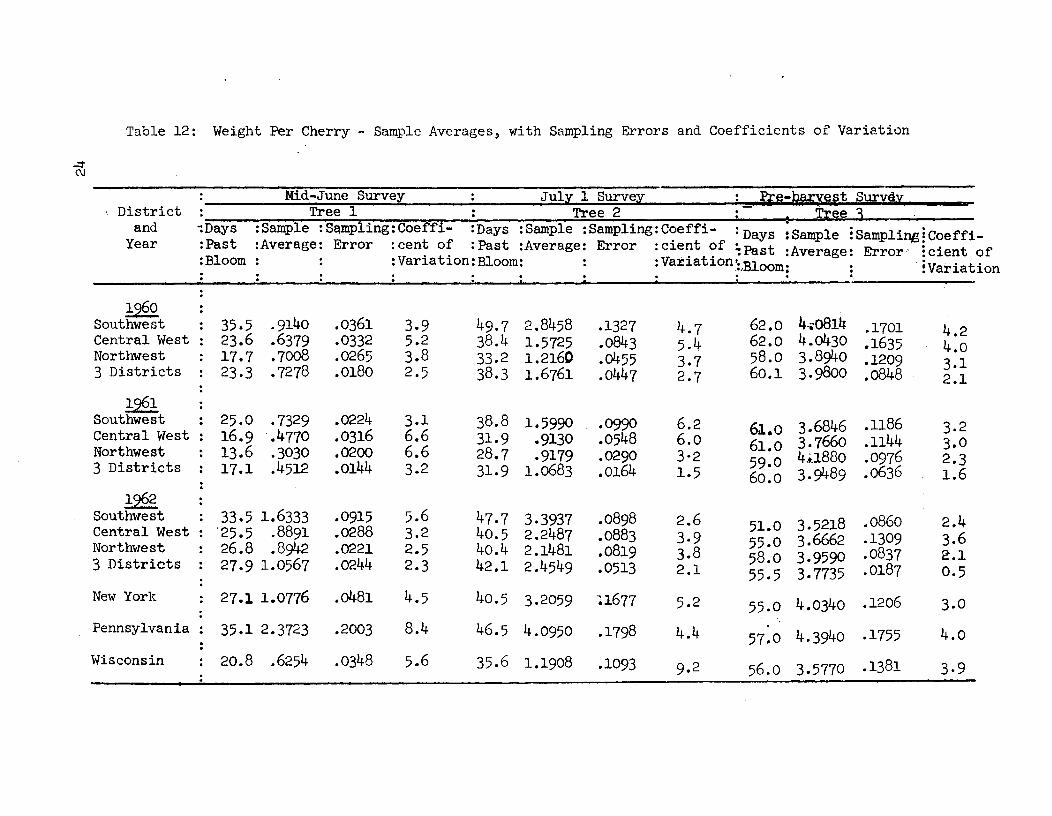
Table 12: Weight Per Cherry - Sample Averages, with Sampling Errors and Coefficients of Variation...::t(\J
Mid-June Survey July 1 Survey fle-~¥~~t SurvevDistrict Tree 1 Tree 2 I Tree 1and -:Days :Samp1e :Samp1ing:Coeffi- :Days :Sample :Sampling:C~effi- :Days :Samp1e :Samp1iqs Coeffi-Year :Past :Average: Error :cent of :Past :Average: Error :c1.entof ~Past :Average: Error' cient of:B1oom :Variation:Bloom: :Va1=iation':,Bloom: : Variation
12§.Q. .9140 .0361 3.9 49.7 2.8458 .1327 4.7 62.0 4-.0814 .1701Southwest 35.5 4.2Central West 23.6 .6379 .0332 5.2 38.4 1.5725 .0843 5.4 62.0 4.0430 .1635 4.0Northwest 17.7 .7008 .0265 3.8 33.2 1.2160 .0455 3.7 58.0 3 .8940 .1209 3·13 Districts 23.3 .7278 .0180 2.5 38.3 1.6761 .0447 2.7 60.1 3.9800 .0848 2.1~ .0224 3.1 38.8 .1186Southwest 25.0 .7329 1.5990 .0990 6.2 63..0 3.6846 3.2Central West 16.9 .4770 .0316 6.6 31.9 .9130 .0548 6.0 61.0 3 •7660 .1144 3.0Northwest 13.6 .3030 .0200 6.6 28.7 .9179 .0290 3'2 59.0 4,a880 .0976 2.33 Districts 17.1 .4512 .0144 3.2 31.9 1.0683 .0164 1.5 60.0 3.9489 .0636 1.6~ 33.5 1.6333 5.6 47.7 .0898 2.6 .0860 2.4Southwest .0915 3.3937 51.0 3.5218Central West '25.5 .8891 .0288 3.2 40.5 2.2487 .0883 3.9 55.0 3.6662 .1309 3.6Northwest 26.8 •8942 .0221 2.5 40.4 2.1481 .0819 3.8 58.0 3.9590 .0837 2.13 Districts 27.9 1.0567 .0244 2.3 42.1 2.4549 .0513 2.1 55.5 3.7735 .0187 0.5
New York 27.1 1.0776 .0481 4.5 40.5 3.2059 11677 5.2 55.0 4.0340 .1206 3·0Pennsylvania 35.1 2.3723 .2003 8.4 46.5 4.0950 .1798 4.4 57.0 4.3940 .1755 4.0Wisconsin 20.8 .6254 .0348 5.6 35.6 1.1908 .1093 9.2 56.0 3.5770 .1381 3·9
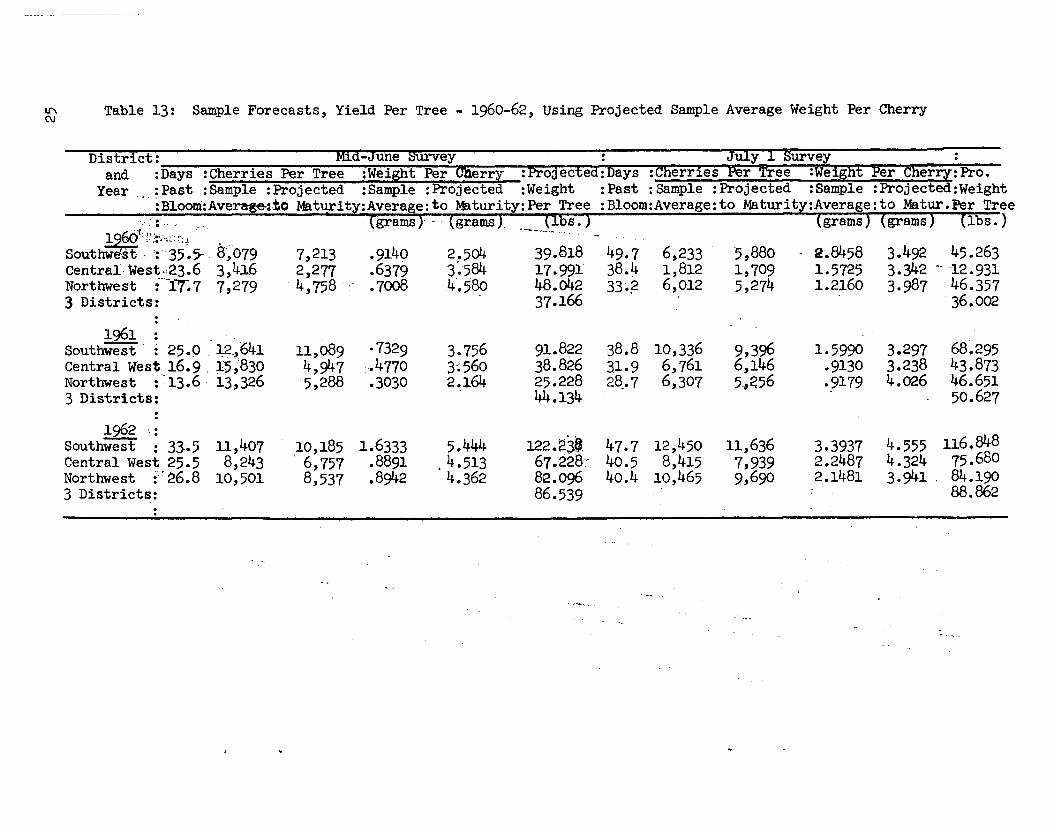
lI'\ Table 13: Sample Forecasts, Yield Per Tree - 1960-62, Using Projected Sample Average Weight Per CherryC\J
District: Mid-June burvey :and :Days :Cherries Per Tree :Weight Per Cherry :Projected: Days
Year :Past :Samp1e :Projected:B1oom:Average.2to Maturit
:.... ;" ", ~.
~f~L':'i: ...:-r,,· ..--.-,.......
. .. .•..... '-.":
8~079Southwest -.: 35.5- 7,213 .9140 2 •504 39.818 49.7 6,233 5,880 2.8458 3.492 45.263Central·West ,·23.6 3,4~6 2,277 .6379 3~584 17.991- 38.4 1,812 1,709 1.5725 3.342 -.-12.931Northwest :"--1'7.77,279 4,758 - .7008 4'.580 48.042 33.p 6,012 5,274 1.2160 3.987 46.3573 Districts: 37.166 36.002
:!2§! ··Southwest : 25.9 1,2.,641 11,089 .7329 3.756 91.822 38.8 10,336 9,396 1.5990 3.297 68.295
Central west 16.9 _1'5,830 4,947 -.4770 3~560 38.826 31.9 6,761 6,146 .9130 3.238 43.873Northwest ::13.6 13,326 5,288 .3030 2.164 25.228 28.•7 6,307 5,~56 .9179 4.026 46.6513 Districts: 44.134 50.627
··1962 :Southwest : 33.5 11,407 10,185 1.6333 5.444 122.~3$- 47.7 12,450 11,636 3.3937 4.555 116.848Central West 25.5 8,243 - 6,757 .8891 .4.513 67.228" 40.5 8,415 7,939 2.2487 4.324 75.680Northwest :'~6.8 10,501 8,537 .8942 4.362 82.096 40.4 10,465 9,690 2.1481 3.941 - 84.1903 Districts: 86.539 88.862
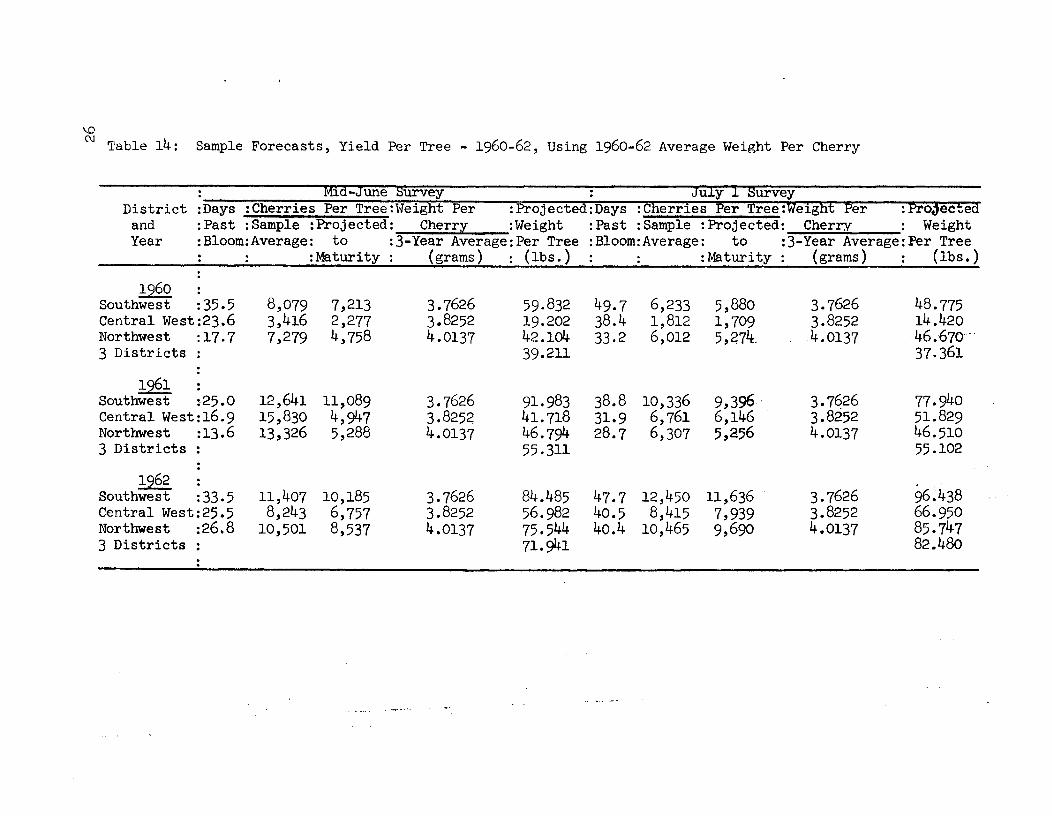
\.0C\l 'Iable14: Sample Forecasts, Yield Per Tree - 1960-62, Using 1960-62 Average Weight Per Cherry
Mid-June Survey July 1 SurveyDistrict :Days :Cherries Per Tree:Weight Per :Projected:Days :Cherries Per Tree:Weight Per :ProJected
and :Past :Sample :Projected: Cherry :Weight :Past :Sample :Projected: Cherry WeightYear :Bloom:Average: to :3-Year Average:Per Tree :Bloom:Average: to :3-Year Average:Fer Tree
:Maturity (grams) (lbs.) :Maturity (grams) (lbs.)1960
8,079 3.7626 59.832 49.7 6,233 5,880 3.7626 48.775Southwest :35.5 7,213Central West:23.6 3,416 2,277 3.8252 19.202 38.4 1,812 1,709 3.8252 14.420Northwest :17.7 7,279 4,758 4.0137 42 .104 33.2 6,012 5,~74. 4.0137 46.670'".3 Districts 39.211 37.361
l2§! 12,641 11,089 3.7626 91.983 38.8 10,336 9,396 3.7~26 77.940Southwest :25.0Central west:16.9 15,830 4,947 3.8252 41.718 31.9 6,761 6,146 3.8252 51.829Northwest :13.6 13,326 5,288 4.0137 46.794 28.7 6,307 5,256 4.0137 46.5103 Districts 55.311 55.102
196211,407 10,185 3.7626 84.485 47.7 12,450 11,636 3.7626 96~438Southwest :33.5
Central West:25.5 8,243 6,757 3.8252 56.982 40.5 8,415 7,939 3.8252 66.950Northwest :26.8 10,501 8,537 4.0137 75.544 40.4 10,465 9,690 4.0137 85.7473 Districts 71.941 82.480
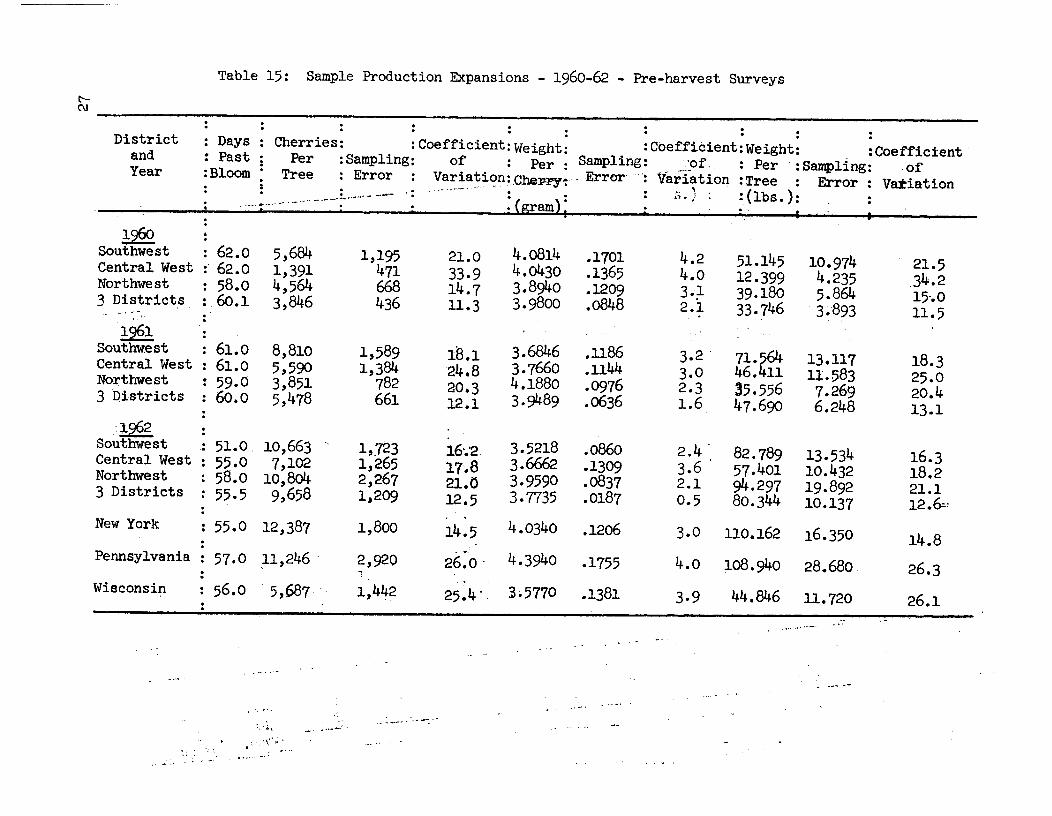
Table 15: Sample Production Expansions - 1960-62 - Pre-harvest Surveyst--C\J
: ..District Days Cherries: :Coefficient: Weight: :Coefficient: Weight: :Coefficientand : Past : Per :Sampling: of : Per : Sampling: _.;.~of. : Per ':Sampling: ofYear :Bloom : Tree · Error ~a:_~~~i<?n:.Chep.Py~. Error' ..". Variation :Tree : Error Variation· .· .. ~ :(lbs.):.. .,.-~.- -~.~p,~"~."- .•~-- :(gram):
1,"'). ,.-......•... -.~ : 62.0 5,684 4.0814 .1701 4.2 51.145 10.974SoutJ:1west 1,195 21.0 21.5Central West :'62.0 1,391 471 33.9 4.0430 .1365 4.0 12 •399 4.235 .34.2Northwe st 58.0 4,564 668 14.7 3.8940 .1209 3.;1- 39.180 5.864 15-.03 District.s. 60.1 3,846 436 11.3 3.9800 .0848 2.1 33.746 .3.-893 11.5·-, ·!2§l 61.0 8,810 1,589 1~.1 3.6846 .1l86 3.2 . 71.564 18.3Southwest 13.117Central West 61.0 5 ,590 1,384 24.8 3.7660 .1144 3.0 46.411 1!.583 25.0No:r:-thwest 59·0 3,851 782 20.3 4.1880 .0976 2.3 35.556 7.269 20.43 Districts 60.0 5,478 661 12.1 3.9489 .0636 1.6 47.690 6.248 13.1
:19623.5218 •0860 2.4 . 82.789 13.534Southwest · 51.0 10,663 1,.723 16'0'2 16.3..
Central West 55.0 7,102 1,265 17.8 3.6662 .1309 3.6 57.401 10.432 18.2Northwest 58.0 10,804 2,267 21.0 3.9590 .0837 2.1 94.297 19.892 21.13 Districts 55.5 9,658 1,209 12.5 3.7735 .0187 0.5 80.344 10.137 12.6:.,New York 55.0 12,387 1,800 14.5 4.0340 .1206 3.0 110.162 16.350 14.8
- .. 4.3940 4.0 108.940 28.680Pennsylvania 57.0 ,11,246 . 2,920 26.0 .' •1755 26.3"Wisconsin 56.0 5,687 1,4~2 25.4 . ;'.5770 .1381 3·9 44.846 ll. 720 26.1
. ..---
•...•...... -'0' :_ ••.•.•••• -: ."
co(\J
Table 16: 1963 Cherries Per Tree - Sample Averages with Sampling Errors, and Coefficients of Variation
Districtand
Survey:Number : Tree 1 Tree 2 Tree 3: of :Sample :Sampling: Coefficient:Samp1e :Sampling:Coefficient:Samp1e :Sampling: Coefficient:Samples :Average : Error of :Average: Error of :Average : Error of
Variation Variation :Variation---------------------------------------~._--------Bloom
SouthwestCentral WestNorthwest3 Districts
Mid-June
SouthwestCentral WestNorthwest3 Districts
July 1
SouthwestCentral WestNorthwest3 Districts
Pre-harvest
SouthwestCentral WestNorthwest3 Districts
10131740
29365744
18233778
11,81023,48024,87721,556
4462,2719,4775,303
3,6205,9868,9674 ,708
159555
3,369. 1,615
30.725.536.021.8
35.724.435.530.5
5721,3446,6413,699
2691,4645,1602,962
215422
1,360662
122599
1,548760
37.631.420.517.9
45.340.930.025.7
2511,4088,4294,522
2181,6437,6664,200
85486
.2,4431,174
95575
2,4691,190
33.932.829.026.0
43.635.032.228.3
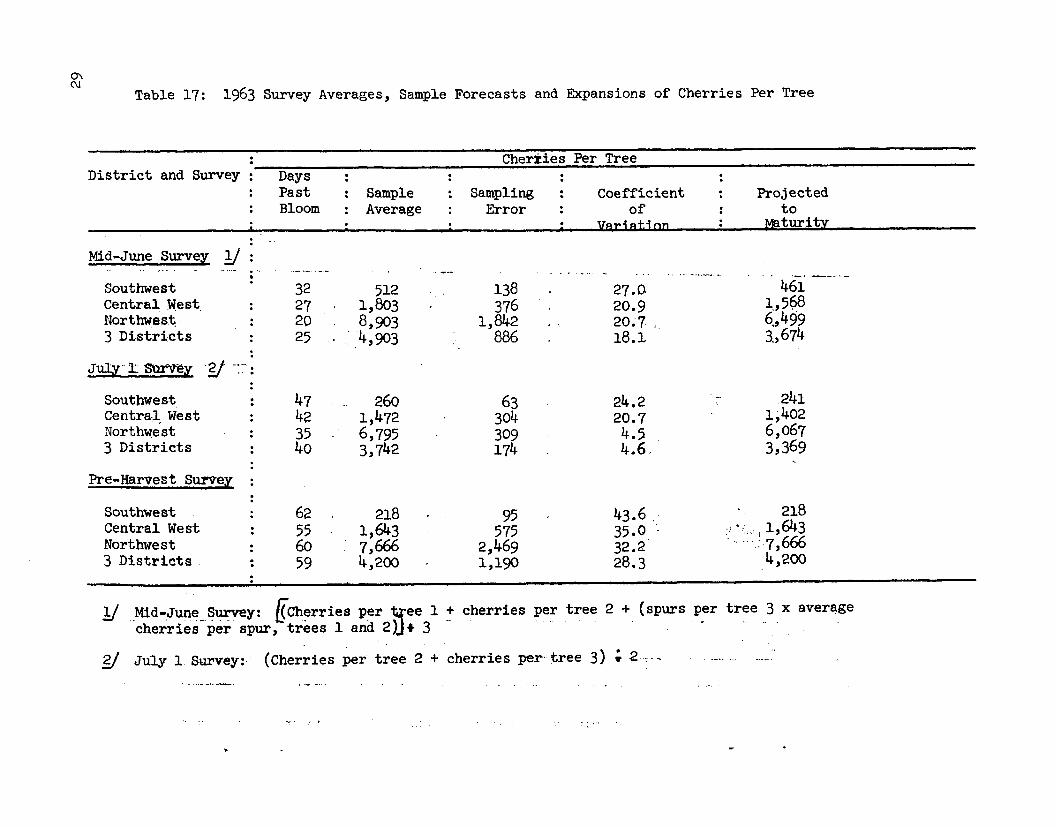
0'\(\J Table 17: 1963 Survey Averages, Sample Forecasts and Expansions of Cherries Per Tree
Cher~ies Per TreeDistrict and Survey Days
PastBloom
SampleAverage
SamplingError
Coefficientof
VA'riAtinn
ProjectedtoMiturity
Mid-June Survey ySouthwestCentral west.Northwes~3 Districts
...• '0. ~ •• __ ,~, •. --' '---'--32 512 138 27.0 461
27 1,803 376 20.9 1,,59820 . 8,903 1,842 20~7 , 6.,.49925 ·4 886 18.1 3.,674.. ,903
SouthwestCentra-l;westNorthwest3 Districts
Pre-Harvest SurveySouthwestCentral WestNorthwest3 Districts
47423540
62556059
2601,4726,7953,742
2181,6437,6664,200
63304309174
95575
2,4691,190
24.220.7
4.54.6
43.6 ..35.032.228.3
2411;4026,0673,369
218- ..~.:).1,643
~7,6664,200
Y_Mid-Jun~_,~~Y: lJCh~rries per ~ee 1 ~ cherries pe~ tree 2 + (spurs per tree 3 x aver~gecherries per spur, trees 1 and 2)Jt 3 -
Y July 1 Survey: (Cherries per tree 2 + cherries per'tree 3) ; 2,--
" ...•:...~:--._-..
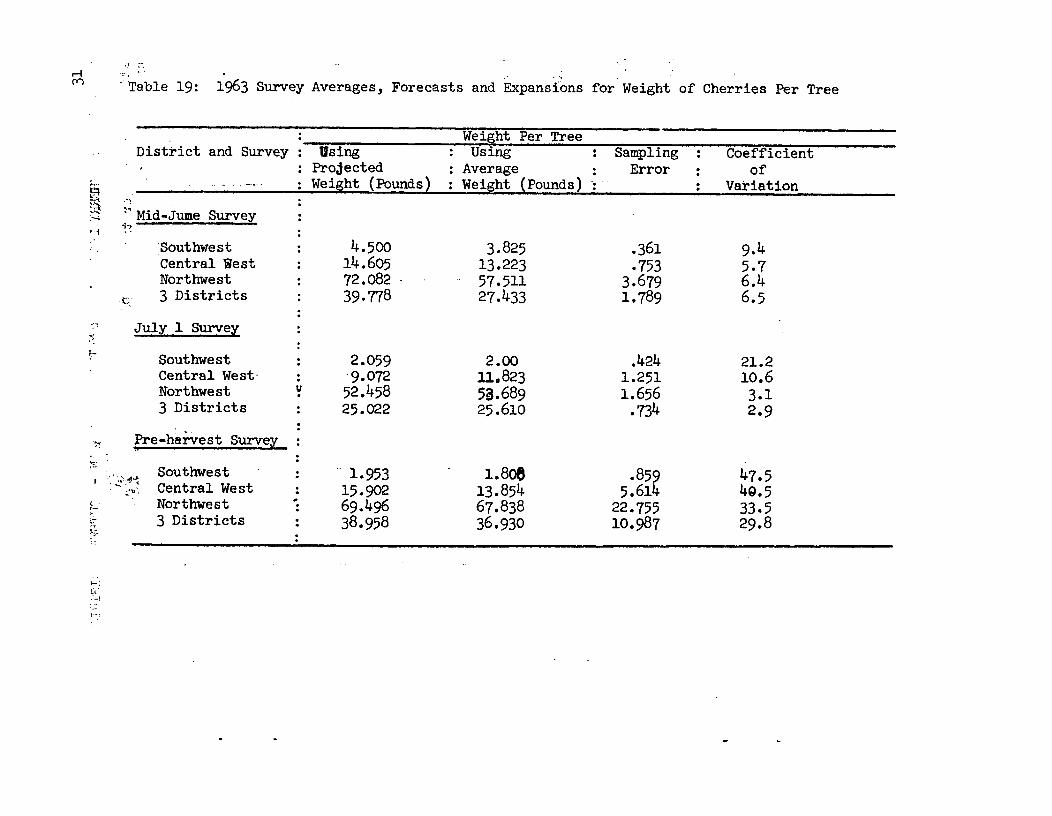
,'! :.-,r-I . , "-',(Y) .'rable 19: 1963 Survey Averages, Forecasts and Expansions for Weight of Cherries Per Tree
Weight Per TreeDistrict and Survey Using Using Sampling Coefficient
Projected Average Error of~
Weight (Pounds ) Weight (Pounds) ... Variation~ ..~'-" ~,Mid-Jume Survey;-i
'1 ~~Southwest 4. 500 3.825 .361 9.4Central West 14.605 13.223 .753 5.7Northwest 72.082 . 57.511 3.679 6.4
t: 3 Districts 39.778 27.433 1.789 6.5,- July 1 Surveyf:- Southwest 2.059 2.00 .424 21.2Central West· · 9.072 ll.823 1.251 10.6·Northwest u 52.458 5a.689 1.656 3.1·3 Districts 25.022 25.610 .734 2.9~; Pre-harvest Survey
,
-to::.-
1.808 47.5~.~\~~Southwest ..1.953 .859i Central West · 15.902 13.854 5.614 4Q.5•••.T;t', ·
}..;...' Northwest •. 69.496 67.838 22.755 33.5·, 3 Districts 38.958 36.930 10.987 29.8~.
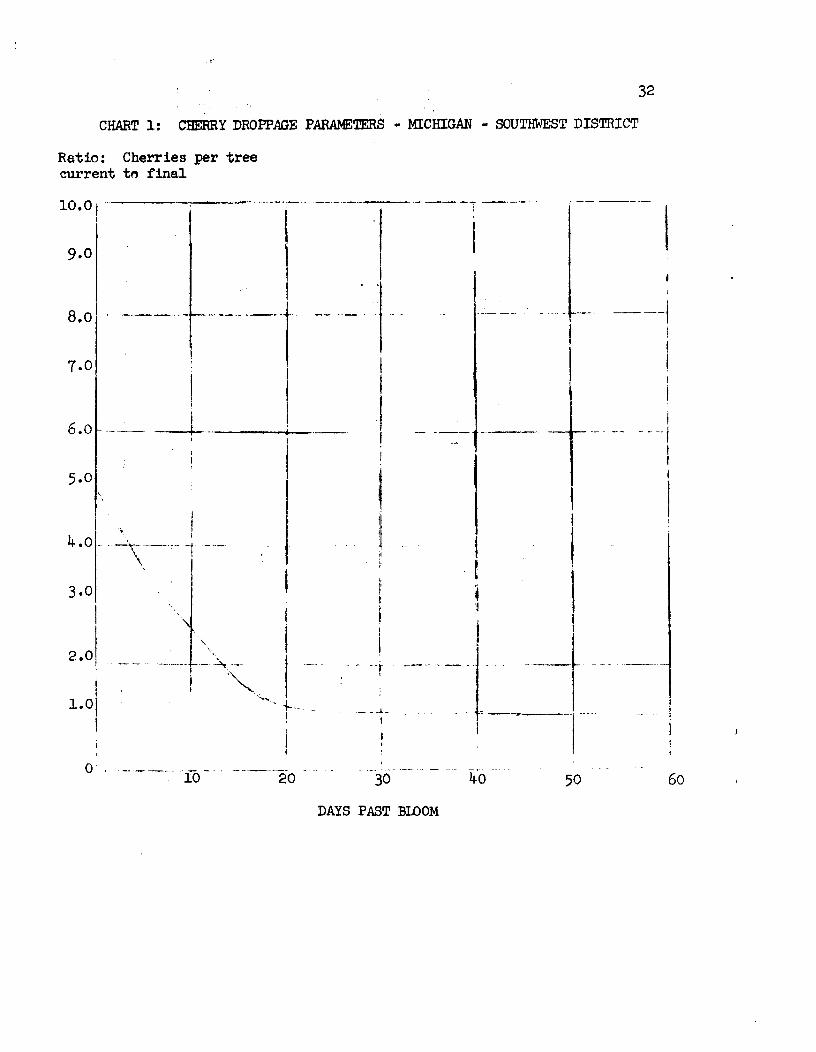
32CHART 1: CHERRY DROPPAGE PARAME1E.RS - MICHIGAN - SOUTHWESTDISTRICT
Ratio: Cherries per tree~rent t~ final
lO.Oj·---~~~-·-~-·-·-··-· -_.-._._--~---- ---- ... -...------.
I '1'9.0I
------!iIi
!I
II!
It3.0
I "
2 01 ·1"""• I .., - - ---- .-..--.., ---. I'
I ,'~I' I .•••••••..
1.Oj -'i-.- _I II
8.0
6.0 --- .---0.-
II
.\,!
- -.J...!
------1-....
I
t If II 'I j-----I ··--fI -~--l
,
--- ----I!III
II----tI
,-- -_ .•...---- ~--, -
30
DAYS PAST BlOOM
50 60
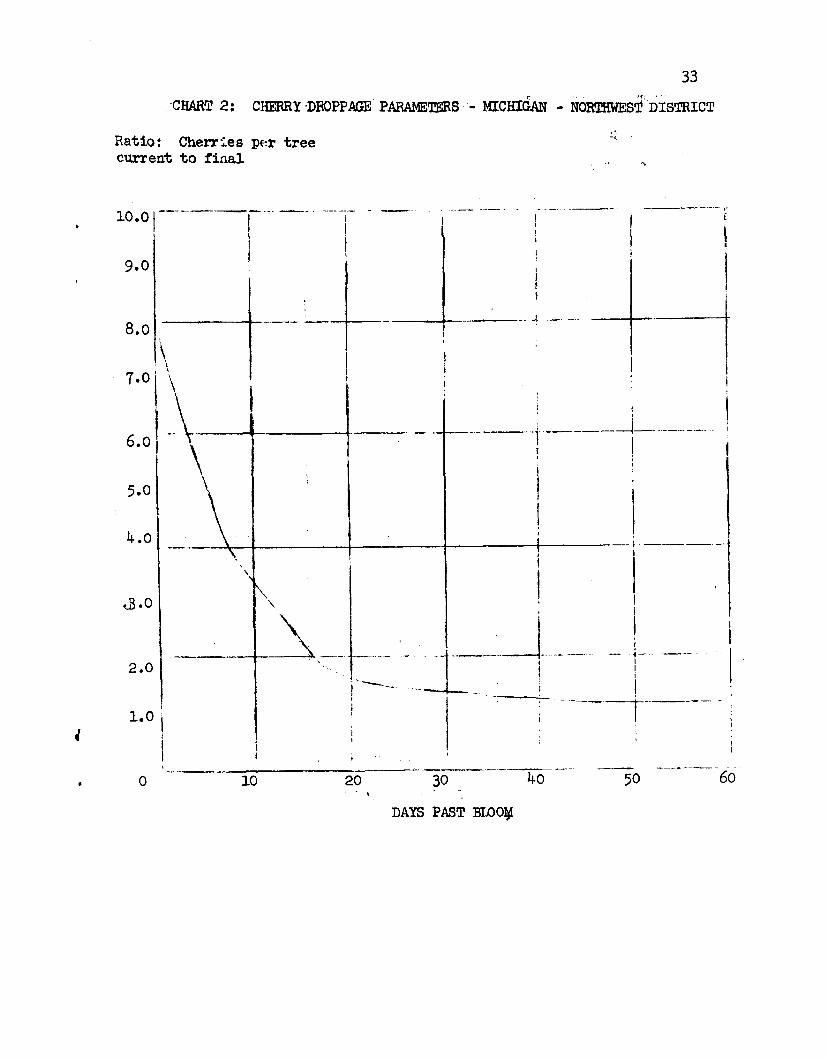
33f~ 1"1' • '.'
'CHART 2: CHERRY 'DROPPAGE" PARAMETERS - MICHIGAN - NORTHWEST'DISTRICT
Ratio: Cherr~es p~r treecurrentto final
"-,
,,II
II
: i III i
--·----t·----....J-- ..------.. :I I I, :,
10.0\--_·_,n·_--·"--r -._.1 I
::: I _. __: -t-----+--.-----+ . _,\ II
7.0' \
6.0 -\ -l-~.--.
. · ,r
E
----------------~ 30
-~-j..~----- ..
II,,
-r-+-- 1- ,----,------- - j
, ,
20.. \
o 10
2.0
4.0
DAYS PAST BlOO¥
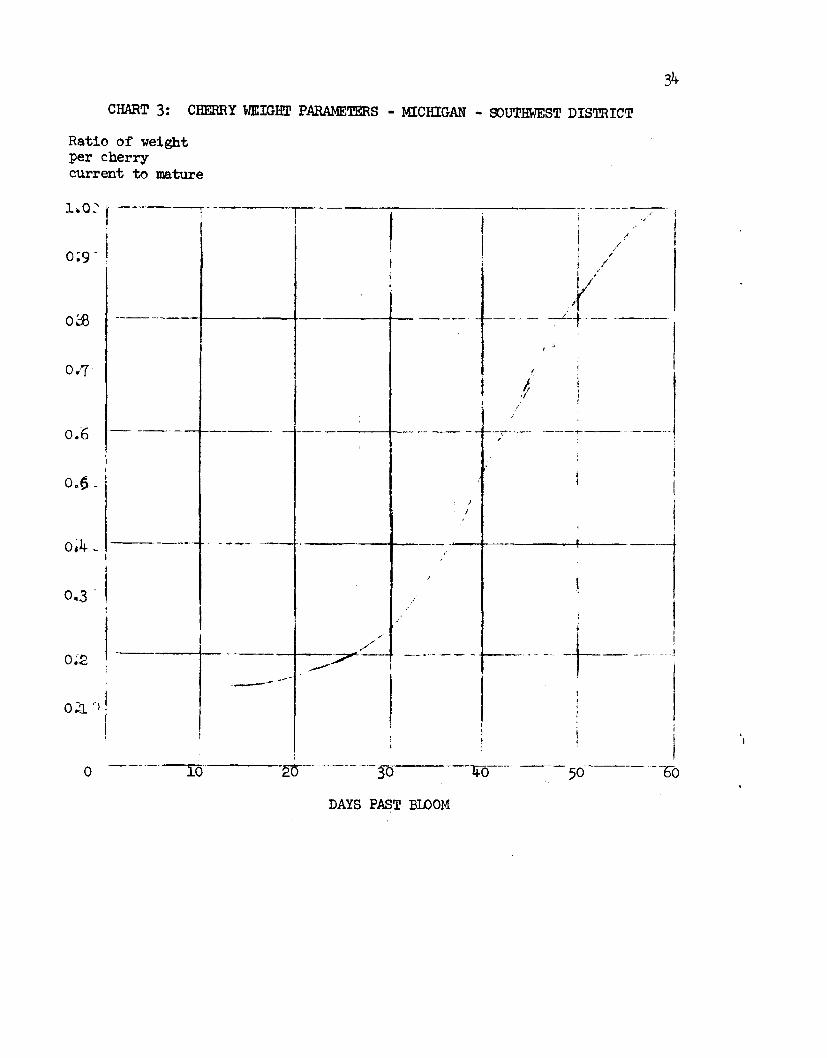
CHART 3: CHERRY WEIGHT PARAMETERS - MICHIGAN - OOUTHWEST DISTRICT
Ratio of weightper cherrycurrent to mature
1 •.0.:' r--------:,
0;9 - !
0d3,--
0'/1It
-I
0:6 - -- ---+------ - --- ---
0.:6 - I
0~4_ '----- ...--,I
0.3 -I
0;'1",
o - -----ro-
, _._._. -------
///
..-----t----;7-.----•..•.-~----.-
I~-- ----,- ,-- 30
DAYS PAST BWOM
35
CHART 4: BHERRY WEIGHT PARAMETERS - MICHIGAN - R:>RTBWEST DISTRICT
Ratio of weightper cherrycurrent to mature1•.0 ',------:---_--: . ...__;;
/0.9 / I
/1 !-----,..t----- .------1
!I
I.I
0.6
-0.5r. jo.....• -.
1-0.4I0.3 I
I./
I
----~,
II I
/
/__-+_--J----:I •I :
i
I II
i=A/
--_._-~--- ,-// !-
I
o.t .
0.1
0.2
.'o 10 ----~-------- ----_.---~._---~20 30 40 50 60
DA YS PAST BLOOM