Embed Size (px)
Citation preview
8/12/2019 19. Eng-Coarse Grains Distribution of the Natural Deposites-Alnos Aly E. Hegazy
http://slidepdf.com/reader/full/19-eng-coarse-grains-distribution-of-the-natural-deposites-alnos-aly-e-hegazy 1/8
Impact Factor(JCC): 1.5548 - This article can be downloaded from www.impactjournals.us
IMPACT: International Journal of Research in
Engineering & Technology (IMPACT: IJRET)
ISSN(E): 2321-8843; ISSN(P): 2347-4599 Vol. 2, Issue 5, May 2014, 153-160
© Impact Journals
COARSE GRAINS DISTRIBUTION OF THE NATURAL DEPOSITS IN ARID AREAS
ALNOS ALY E. HEGAZYAssociate Professor, Department of Civil Engineering, Benha Faculty of Engineering, Benha University,
Al Qalyubiyah, Egypt
ABSTRACT
In arid areas, the physical weathering is considered the main effect on formation of soil layers. Arar’s city is the
main city of Northern Border Region (NBR) at the north part of Saudi Arabia (KSA). In general, many Wadis and Sha’ibs
are surrounded Arar’s city. According to the urban development of Arar’s city, the knowledge about underlying soil
properties is strongly required. Wadis and Sha’ibs deposit were formed as a result of the water flow and wind movement in
the surrounding arid areas. The top deposits of Wadis and Sha’ibs are mature deposits. Sieve analysis tests were carried out
on soil deposit samples of many deposit locations around Arar’s city. The results show that the natural soil deposits are
classified intosilty sand (SM) as unified soil classification system (USCS). Also, the average contents of coarse and fine
grains are 70% and 30% respectively. Comparing of course grains distribution of the studied areas, it was found that the
average content of coarse and fine grains changes from 65% to 75% and from 35% to 25% respectively, while, the average
content of gravel is ranged from 10% to 20%. The discussion of results indicated that the soil deposit in Wadis and Sha’ibs
around Arar’s city is suitable as a structure soil and it is not suitable as a cementing material product.
KEYWORDS: Arid Area, Coarse Grains, Grain Size Distribution, Northern Part of KSA, USCS, Sieve Analysis,
Soil Deposit
INTRODUCTION
The originating sources for soils are rocks which solidified from molten material or magma. Although most
igneous activity occurred in past geological eras, active volcanoes are evidence that such activity continues, being
concentrated along weaker zones of the Earth’s crust at plate margins. Accordingly, residual soils are readily removed and
re-deposited through actions of wind, moving water, or glacial ice, to become sedimentary soils or sediments
(Handy and Spangler 2007; Mitchell and Soga 2005).
The studies of soil properties and use of soil as flexible pavement structures have increased steadily over the past
decade. USA alone spends several billion dollars annually to repair and maintain distress roads, and other structures built
on problem soils. Also, construction foundations in many countries face many geotechnical problems according to
undesirable changes of soil grains and soil particles. Unquestionably, soil grains size plays a main role for engineering
strength quality and behavior of underlying soil. Moreover, in many areas, the supply to high quality soil grains and
aggregates is becoming depleted requiring engineers to advantageously use construction techniques
(Handy 2011; Santamarina et al. 2001).
Many researchers have a systematic study of the distribution of particle sizes in gravel-road surfaced in relation to
road quality and performance. Their conclusions from these correlative studies provided the basis for research in granular
8/12/2019 19. Eng-Coarse Grains Distribution of the Natural Deposites-Alnos Aly E. Hegazy
http://slidepdf.com/reader/full/19-eng-coarse-grains-distribution-of-the-natural-deposites-alnos-aly-e-hegazy 2/8
154 Alnos Aly E. Hegazy
Index Copernicus Value: 3.0 - Articles can be sent to [email protected]
soil stabilization that now plays an important role in the design and construction of highways and airport runways.
Also, their tests and its derivatives are standards used in constructions of virtually all soil structures including earth
embankments, levees, earth dams, and subgrades for foundations or pavements (Calhoon 1998; Mitchell and Soga 2005;
ASTM 2010). Generally, the Unified Soil Classification System (USCS) is a soil classification system used in engineeringand geology to describe the texture and grain size of the sediment soil. The classification system can be applied to most
unconsolidated materials, and is represented by a two-letter symbol (ASTM 1986).
There are no enough studies available to show the soil type, soil classification and soil properties of northern part
of Kingdom of Saudi Arabia (Alghamdi and Hegazy, 2013). Also, Soliman and Alsubhi (2012) and Ahmed,
et al.(2011)stated that a few studies are dealt with most Wadis and Sha’ibs in KSA, mainly concerned with geological
mapping at various scales and stratigraphic classification in addition to description of the component rock varieties.
Accordingly, the present work is mainly focused on the coarse grains of sediment soil around Arar’s city. It is attempted to
portray grain size distribution of the sediment soil at the arid area of north part of KSA. Therefore, the studied areas are
carefully chosen to represent a key sector of soil grains content due to urban expansion in Arar’s city. Also, the present
study is concentrated on the parts of Wadis and Sha’ibs for probably used in future constructions.
STUDIED AREA
Depending upon Al-Khattabi, et al. (2010) and The Ministry of Municipal and Rural Affairs (2012), geological
and topographical maps of northern border region were used to adapt the studied areas of Wadis and Sha’ibs soil grains.
So, the studied areas were chosen to collect approximately full knowledge about soil size distribution around Arar’s city
and according to the future urbanization of Arar’s city, as shown in basic map, Figure 1. Where, the area is located between
Latitudes 30o45
’ N and 31
o00
’ N and Longitudes: 40
o30
’ E and 41
o 05
’ E. Accordingly, a network stations were designed to
cover the purpose of this study. Therefore, an experimental program was designed to study grains size properties of the
natural surface soil deposit at variant Wadis and Sha’ibs around Arar’s city.
Seven studied areas (A, B, C, D, E, F, G) of Wadis and Sha’ibs around Arar’s city were chosen for obtaining soil
samples as shown in Figure 1. So, seven cross-sections perpendicular on the path direction of the chosen Wadis and
Sha’ibs were adopted and renamed as studied area. Where, the grain size distribution is the reflection of the sedimentation
process and its environment deposits. Also, the probably changes of grains contents may be occurring at soil sediment
locations. Therefore, at each of studied area, the chosen cross-section was adopted according to: (a) the presence of
catchment area, or (b) the presence of meandering of Wadi path, or (c) the meeting area with other Wadis and Sha’ibs, and
or (d) quite straight path of Wadi. Where, the measured length of cross-sections at studied areas A, B, C, D, E, F and G are
about 1600, 1250, 1700,1900, 3000, 1500 and 2100 m respectively.
SAMPLING AND TESTING
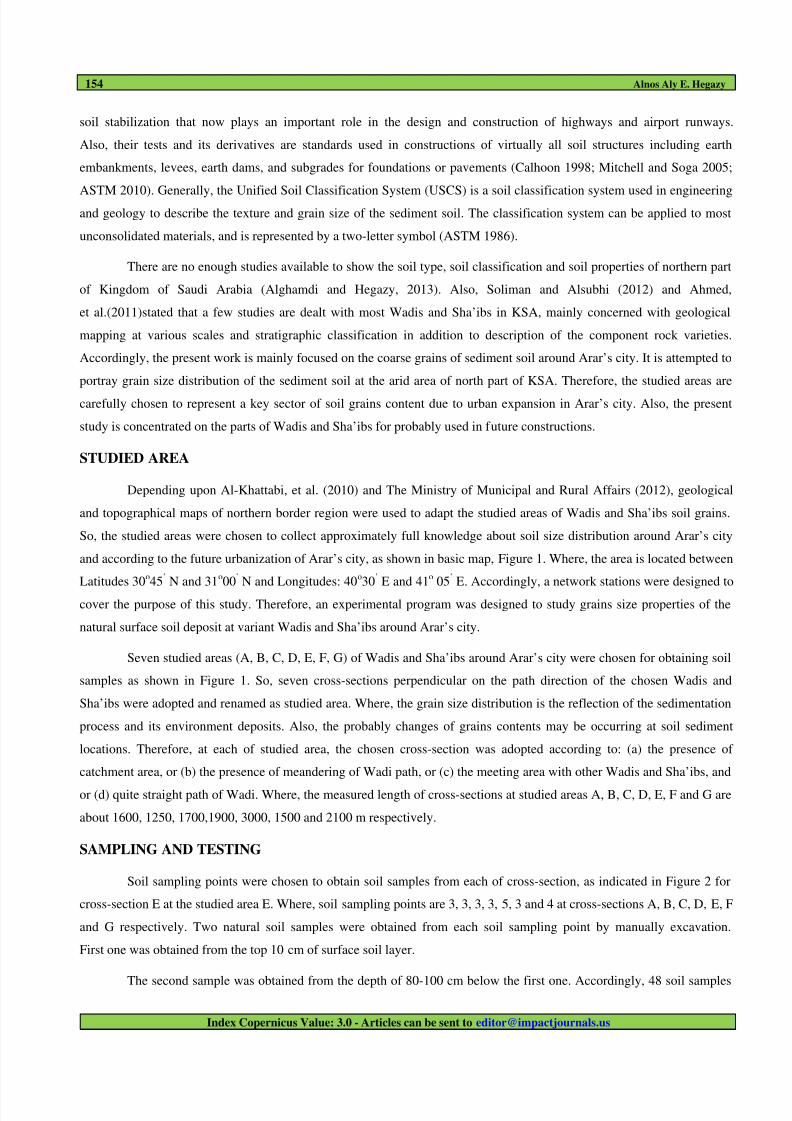
Soil sampling points were chosen to obtain soil samples from each of cross-section, as indicated in Figure 2 for
cross-section E at the studied area E. Where, soil sampling points are 3, 3, 3, 3, 5, 3 and 4 at cross-sections A, B, C, D, E, F
and G respectively. Two natural soil samples were obtained from each soil sampling point by manually excavation.
First one was obtained from the top 10 cm of surface soil layer.
The second sample was obtained from the depth of 80-100 cm below the first one. Accordingly, 48 soil samples
8/12/2019 19. Eng-Coarse Grains Distribution of the Natural Deposites-Alnos Aly E. Hegazy
http://slidepdf.com/reader/full/19-eng-coarse-grains-distribution-of-the-natural-deposites-alnos-aly-e-hegazy 3/8
Coarse Grains Distribution of the Natural Deposits in Arid Areas 155
Impact Factor(JCC): 1.5548 - This article can be downloaded from www.impactjournals.us
were obtained. Field reports contain coordinates of soil sampling point using GPS; also, visual inspection, color and odor
of soil samples were recorded. Coding reference for each soil sample includes studied areas as well as cross-sections
letters, number of sampling point and soil sample number. For example, sample E3-2 means that soil sample at studied
area or cross-section E and at soil sampling point 3, then, the soil sample number is 2. By the end of soil sampling, soilsamples were transported to soil mechanics and foundation engineering laboratory, faculty of engineering, Northern Border
University. Sieve analysis tests were carried out on soil samples based on the manner of testing and measuring in text
books, such as Bowels(1986)and international standard specifications for testing and measuring such as ASTM(2010).
Figure 1: Topographical Plan of the Studied Areas around Arar’s City
Figure 2: A Schematic Sectional Elevation of Cross-Section E and Soil Samples
RESULTS AND DISCUSSIONS
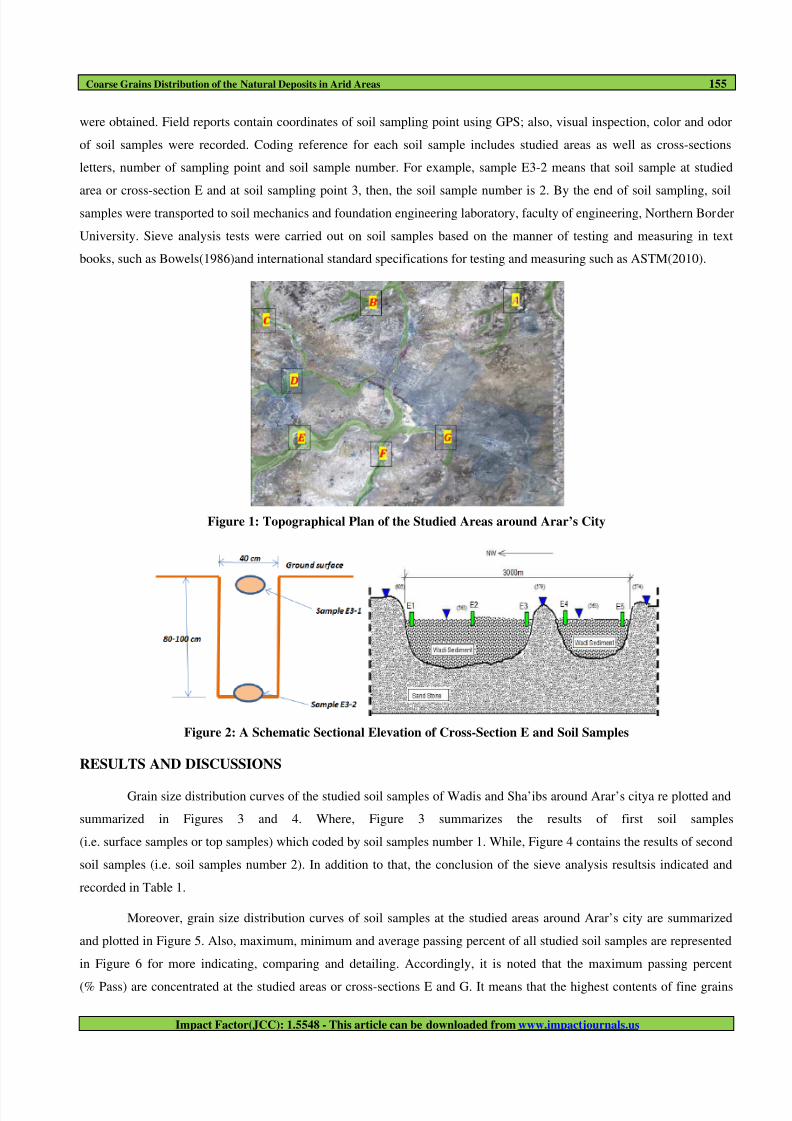
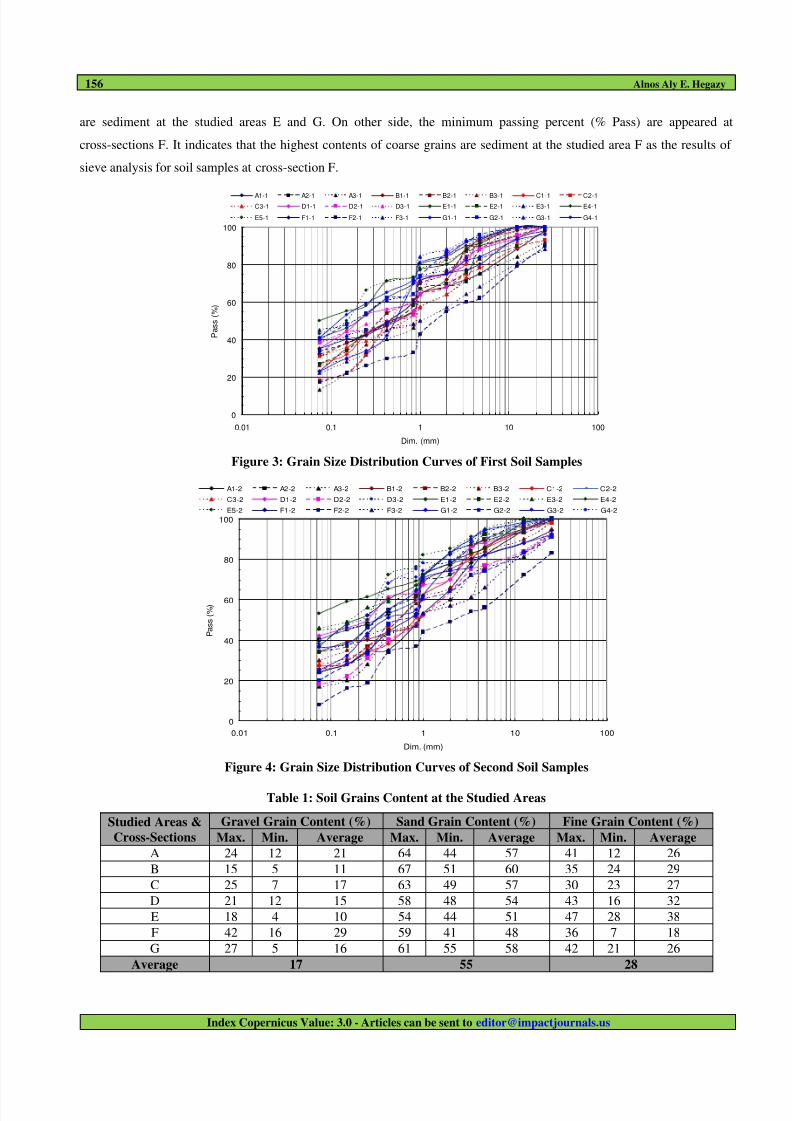
Grain size distribution curves of the studied soil samples of Wadis and Sha’ibs around Arar’s citya re plotted and
summarized in Figures 3 and 4. Where, Figure 3 summarizes the results of first soil samples
(i.e. surface samples or top samples) which coded by soil samples number 1. While, Figure 4 contains the results of second
soil samples (i.e. soil samples number 2). In addition to that, the conclusion of the sieve analysis resultsis indicated and
recorded in Table 1.
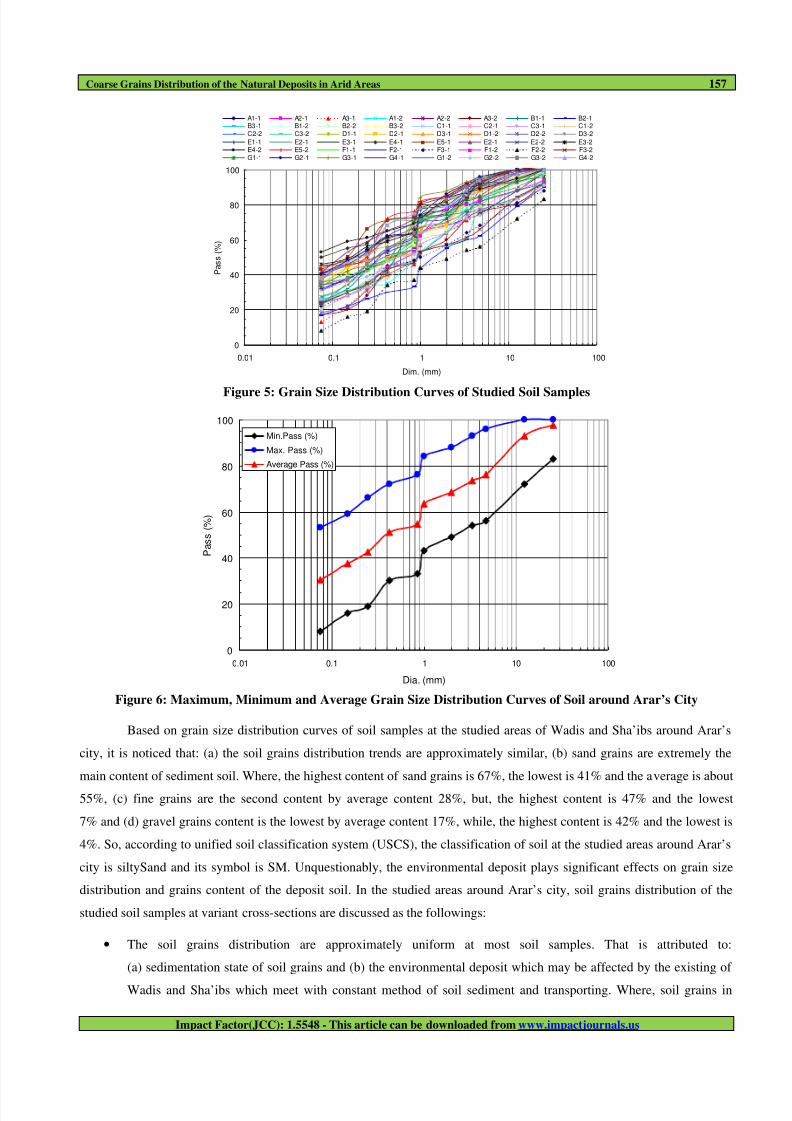
Moreover, grain size distribution curves of soil samples at the studied areas around Arar’s city are summarized
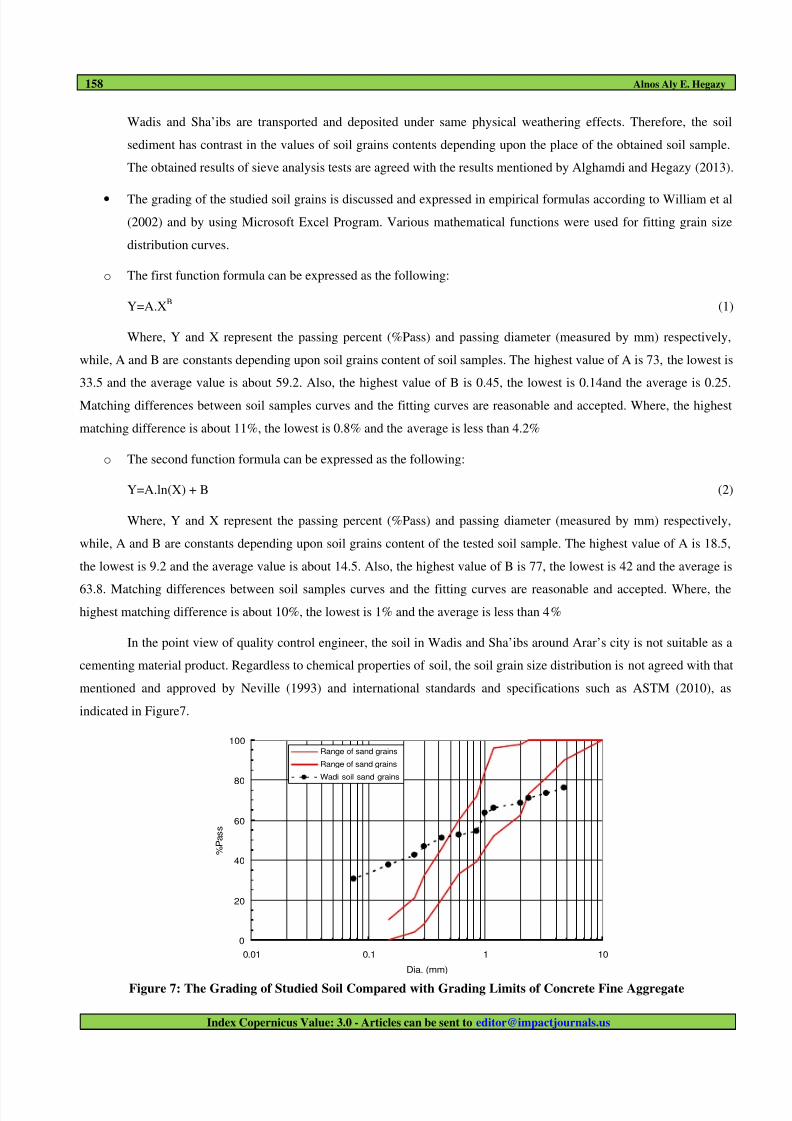
and plotted in Figure 5. Also, maximum, minimum and average passing percent of all studied soil samples are represented
in Figure 6 for more indicating, comparing and detailing. Accordingly, it is noted that the maximum passing percent
(% Pass) are concentrated at the studied areas or cross-sections E and G. It means that the highest contents of fine grains
8/12/2019 19. Eng-Coarse Grains Distribution of the Natural Deposites-Alnos Aly E. Hegazy
http://slidepdf.com/reader/full/19-eng-coarse-grains-distribution-of-the-natural-deposites-alnos-aly-e-hegazy 4/8
156 Alnos Aly E. Hegazy
Index Copernicus Value: 3.0 - Articles can be sent to [email protected]
are sediment at the studied areas E and G. On other side, the minimum passing percent (% Pass) are appeared at
cross-sections F. It indicates that the highest contents of coarse grains are sediment at the studied area F as the results of
sieve analysis for soil samples at cross-section F.
Figure 3: Grain Size Distribution Curves of First Soil Samples
Figure 4: Grain Size Distribution Curves of Second Soil Samples
Table 1: Soil Grains Content at the Studied Areas
Studied Areas &
Cross-Sections
Gravel Grain Content (%) Sand Grain Content (%) Fine Grain Content (%)
Max. Min. Average Max. Min. Average Max. Min. Average
A 24 12 21 64 44 57 41 12 26
B 15 5 11 67 51 60 35 24 29
C 25 7 17 63 49 57 30 23 27
D 21 12 15 58 48 54 43 16 32
E 18 4 10 54 44 51 47 28 38
F 42 16 29 59 41 48 36 7 18
G 27 5 16 61 55 58 42 21 26
Average 17 55 28
0
20
40
60
80
100
0.01 0.1 1 10 100
Dim. (mm)
P a s s ( % )
A1-1 A2-1 A3-1 B1-1 B2-1 B3-1 C1-1 C2-1C3-1 D1-1 D2-1 D3-1 E1-1 E2-1 E3-1 E4-1
E5-1 F1-1 F2-1 F3-1 G1-1 G2-1 G3-1 G4-1
0
20
40
60
80
100
0.01 0.1 1 10 100
Dim. (mm)
P a s s ( % )
A1-2 A2-2 A3-2 B1-2 B2-2 B3-2 C1-2 C2-2
C3-2 D1-2 D2-2 D3-2 E1-2 E2-2 E3-2 E4-2
E5-2 F1-2 F2-2 F3-2 G1-2 G2-2 G3-2 G4-2
8/12/2019 19. Eng-Coarse Grains Distribution of the Natural Deposites-Alnos Aly E. Hegazy
http://slidepdf.com/reader/full/19-eng-coarse-grains-distribution-of-the-natural-deposites-alnos-aly-e-hegazy 5/8
Coarse Grains Distribution of the Natural Deposits in Arid Areas 157
Impact Factor(JCC): 1.5548 - This article can be downloaded from www.impactjournals.us
Figure 5: Grain Size Distribution Curves of Studied Soil Samples
Figure 6: Maximum, Minimum and Average Grain Size Distribution Curves of Soil around Arar’s City
Based on grain size distribution curves of soil samples at the studied areas of Wadis and Sha’ibs around Arar’s
city, it is noticed that: (a) the soil grains distribution trends are approximately similar, (b) sand grains are extremely the
main content of sediment soil. Where, the highest content of sand grains is 67%, the lowest is 41% and the average is about
55%, (c) fine grains are the second content by average content 28%, but, the highest content is 47% and the lowest
7% and (d) gravel grains content is the lowest by average content 17%, while, the highest content is 42% and the lowest is
4%. So, according to unified soil classification system (USCS), the classification of soil at the studied areas around Arar’s
city is siltySand and its symbol is SM. Unquestionably, the environmental deposit plays significant effects on grain size
distribution and grains content of the deposit soil. In the studied areas around Arar’s city, soil grains distribution of the
studied soil samples at variant cross-sections are discussed as the followings:
• The soil grains distribution are approximately uniform at most soil samples. That is attributed to:
(a) sedimentation state of soil grains and (b) the environmental deposit which may be affected by the existing of
Wadis and Sha’ibs which meet with constant method of soil sediment and transporting. Where, soil grains in
0
20
40
60
80
100
0.01 0.1 1 10 100
Dim. (mm)
P a s s ( % )
A1-1 A2-1 A3-1 A1-2 A2-2 A3-2 B1-1 B2-1B3-1 B1-2 B2-2 B3-2 C1-1 C2-1 C3-1 C1-2C2-2 C3-2 D1-1 D2-1 D3-1 D1-2 D2-2 D3-2
E1-1 E2-1 E3-1 E4-1 E5-1 E2-1 E2-2 E3-2E4-2 E5-2 F1-1 F2-1 F3-1 F1-2 F2-2 F3-2G1-1 G2-1 G3-1 G4-1 G1-2 G2-2 G3-2 G4-2
0
20
40
60
80
100
0.01 0.1 1 10 100
Dia. (mm)
P a s s ( % )
Min.Pass (%)
Max. Pass (%)
Average Pass (%)
8/12/2019 19. Eng-Coarse Grains Distribution of the Natural Deposites-Alnos Aly E. Hegazy
http://slidepdf.com/reader/full/19-eng-coarse-grains-distribution-of-the-natural-deposites-alnos-aly-e-hegazy 6/8
158 Alnos Aly E. Hegazy
Index Copernicus Value: 3.0 - Articles can be sent to [email protected]
Wadis and Sha’ibs are transported and deposited under same physical weathering effects. Therefore, the soil
sediment has contrast in the values of soil grains contents depending upon the place of the obtained soil sample.
The obtained results of sieve analysis tests are agreed with the results mentioned by Alghamdi and Hegazy (2013).
• The grading of the studied soil grains is discussed and expressed in empirical formulas according to William et al
(2002) and by using Microsoft Excel Program. Various mathematical functions were used for fitting grain size
distribution curves.
o The first function formula can be expressed as the following:
Y=A.XB (1)
Where, Y and X represent the passing percent (%Pass) and passing diameter (measured by mm) respectively,
while, A and B are constants depending upon soil grains content of soil samples. The highest value of A is 73, the lowest is
33.5 and the average value is about 59.2. Also, the highest value of B is 0.45, the lowest is 0.14and the average is 0.25.
Matching differences between soil samples curves and the fitting curves are reasonable and accepted. Where, the highest
matching difference is about 11%, the lowest is 0.8% and the average is less than 4.2%
o The second function formula can be expressed as the following:
Y=A.ln(X) + B (2)
Where, Y and X represent the passing percent (%Pass) and passing diameter (measured by mm) respectively,
while, A and B are constants depending upon soil grains content of the tested soil sample. The highest value of A is 18.5,
the lowest is 9.2 and the average value is about 14.5. Also, the highest value of B is 77, the lowest is 42 and the average is
63.8. Matching differences between soil samples curves and the fitting curves are reasonable and accepted. Where, the
highest matching difference is about 10%, the lowest is 1% and the average is less than 4%
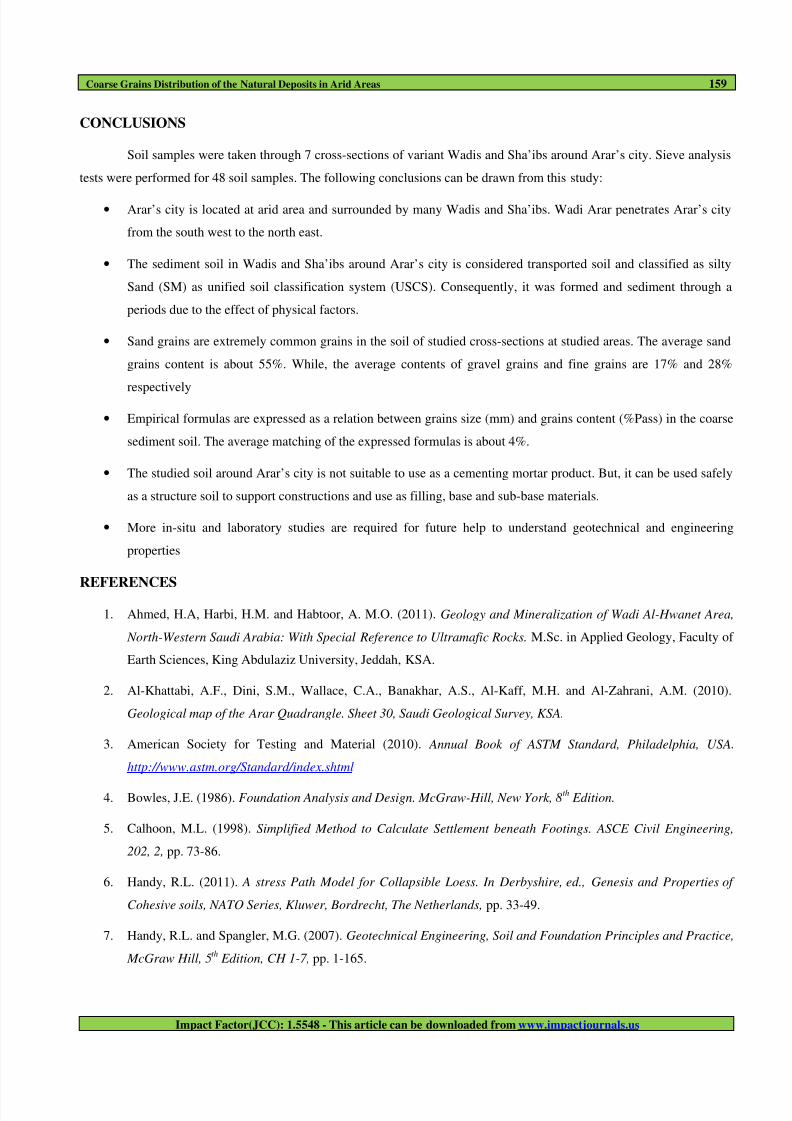
In the point view of quality control engineer, the soil in Wadis and Sha’ibs around Arar’s city is not suitable as a
cementing material product. Regardless to chemical properties of soil, the soil grain size distribution is not agreed with that
mentioned and approved by Neville (1993) and international standards and specifications such as ASTM (2010), as
indicated in Figure7.
Figure 7: The Grading of Studied Soil Compared with Grading Limits of Concrete Fine Aggregate
0
20
40
60
80
100
0.01 0.1 1 10
Dia. (mm)
% P a s s
Range of sand grains
Range of sand grains
Wadi soil sand grains
8/12/2019 19. Eng-Coarse Grains Distribution of the Natural Deposites-Alnos Aly E. Hegazy
http://slidepdf.com/reader/full/19-eng-coarse-grains-distribution-of-the-natural-deposites-alnos-aly-e-hegazy 7/8
8/12/2019 19. Eng-Coarse Grains Distribution of the Natural Deposites-Alnos Aly E. Hegazy
http://slidepdf.com/reader/full/19-eng-coarse-grains-distribution-of-the-natural-deposites-alnos-aly-e-hegazy 8/8
160 Alnos Aly E. Hegazy
Index Copernicus Value: 3.0 - Articles can be sent to [email protected]
8. Mitchell, J.K. and Soga, K. (2005). Fundamentals of soil Behavior”, 3rd Ed., John Wiley & Sons, New York,
USA, Ch. 1, pp. 1-16.
9. Mohamed A.M. Alghamdi and Alnos A.E. Hegazy(2013). Physical Properties of Soil Sediment in Wadi Arar,
Kingdom of Saudi Arabia”, International Journal of Civil Engineering (IJCE) ISSN (P): 2278-9987; ISSN (E):
2278-9995, Vol. 2, Issue 5, pp. 1-8.
10. Neville, A.M. (1993). Properties of Concrete. ELBS with Longman Singapore Publishers limited, Books Scheme,
3rd
Edition, London, UK.
11. Santamarina, J.C., Klein, K.A. and Fam, M.A. (2001). Soil and Waves”, John Wiley & Sons, New York, USA,
CH 3, pp. 105-146.
12. Soliman, M.A.M and Alsubhi, M.B. (2012). Geological and Structural Studies on Jabal Daf-Jabal Abu Bakr
Area, Wadi Fatima”, M.Sc. in Applied Geology, Faculty of Earth Sciences, King Abdulaziz University,
Jeddah, KSA.
13. The Ministry of Municipal and Rural Affairs, MOMRA.(2012). Public administration to coordinate projects.
Deputy Ministry for Urban Planning, KSA.
14. William, W.H., Douglas, M.G., David, M.G. and Connie, M.B. (2002). Probability and Statistics in
Engineering”, John Wiley & Sons, 4th Edition, USA.