Embed Size (px)
Citation preview
18
Moisture and Estimation of Moisture Generation Rate
Tao Lu, Xiaoshu Lu and Martti Viljanen Department of Civil and Structural Engineering,
Aalto University School of Science and Technology Finland
1. Introduction
Buildings are exposed to outside weather, which cannot remain free of water in liquid and vapour phases. “Except for structural errors, about 90% of all building construction problems are associated with water in some way.” by Lieff and Trechsel (Lieff & Trechsel, 1982). Moisture problem has become one of the most important factors decreasing indoor air quality (IAQ) and limiting the building service life. Over the last decade, moisture failures in building systems have reached billions of Euros in damages in Europe, many of which involved the deterioration of sheathing panels. Research has verified the existence of health problems in relation with moisture problems. In Finland, for example, it has been reported that 38% of detached houses and 25% of apartments had notable or significant moisture problems (Haverinen, 2002). The cost of repairing moisture damage that resulted in negative health effects was estimated as € 10 000 – 40 000 per case. Therefore, the prediction and control of moisture transport in buildings are import from both technical and health points of view. Moisture can migrate into a building in several ways, depending on vapour, liquid or ice/snow. In general, three major moisture sources can be identified: outdoors (e.g. air humidity, precipitation, moisture in the ground), the indoors (e.g. humans, water use), and wet construction materials (Rousseau, 1984). Moisture accumulation into building structures may lead to physical, biological or chemical deterioration of building materials as well as the growth of some microbial or chemical contaminations (Salthammer, 1999; Andersson, 1997). One major problem caused by moisture is mould. Moulds are the most typical form of fungus, which can be found anywhere. They can grow on virtually any organic substances as long as moisture and oxygen are present. Like other fungi, moulds reproduce through the production of spores. Mould spores continually waft through the air, both indoors and out-of-doors. Many types of moulds exist indoors, and almost all moulds could cause heath effects (through air), depending on the type and amount of mould present as well as the sensitivity of individual experiencing mould exposure. Certain health effects, such as irritation of eyes, nose and throat, dermatitis, exacerbation of asthma, and respiratory distress, have been reported to be associated with mould exposure (Verhoeff et al., 1995; Pope et al., 1993). Other effects such as fever, flu-like symptoms, fatigue, respiratory dysfunction, excessive and regular nose bleeds, dizziness, headaches, diarrhea, vomiting, liver damage, and impaired or altered inhalation have been
www.intechopen.com

Chemistry, Emission Control, Radioactive Pollution and Indoor Air Quality
486
identified in persons who have been exposed to mould (Croft et al., 1986; Jarvis, 1995; Smith & Moss, 1985). Some moulds even produce toxins (mycotoxins) (Jarvis, 1990; Burge, 1986; Yang, 1995). Indoor mould was reported worldwide. A series of studies conducted in European countries, Canada and the United States showed that at least 20% of buildings had one or more signs of visible mould growth indoors on walls, floors or ceilings (Institute of Medicine, 2004). Similar reports also come from other areas of the world. A survey in rural Taiwan and China showed that 30.1% of visited people reported the presence of visible mould inside their houses (Yang et al., 1997). In a study of 98 houses in Japan, 15.6% was reported to have visible mould (Saijo et al., 2004). In another study in three China cities (Beijing, Guangzhou and HongKong), about 11% of parents of 10 902 schoolchildren reported visible mould on the ceilings and walls (Wong et al., 2004). Indoor mould was also reported to occur in school buildings, day-care centres, offices and other buildings (Mudarri & Fisk, 2007). Excessive moisture is generally the cause of mould growth. Relevant experiments were committed to study the lowest moisture level for mould growth. Adan (Adan, 1994) found that moulds don’t grow below a relative humidity of 80%. In Viitanen and Ritschkoff’s work (Viitanen & Ritschkoff, 1991), they suggested relative humidity should be kept below 75% within a temperature range of 5-40 oC to avoid mould growth. This result was confirmed by Rowan et al. (Rowan et al., 1999). In a more detailed review work, Johansson et al. (Johansson et al., 2005) described that critical moisture conditions for mould growth were 75-90% for clean materials and 75-80% for contaminated or solid materials (Table 1).
Building material group Relative humidity (%)
Wood and wood-based materials 75-80
Paper on plasterboard 80-85
Mineral insulation materials 90-95
Extruded and expanded polystyrene 90-95
Concrete 90-95
Source: Johansson et al. (2005)
Table 1. Critical relative humidity for various groups of materials.
Therefore, indoor moisture becomes the major factor on the presence of mould. Indoor moisture was also linked to the growth of Bacteria (Heinz & Mark, 2009). Hence, control of indoor moisture level becomes essential concerning IAQ. It is not uncommon in some climates to have moisture loads in excess of over 20 kg per day (Kerestecioglu & Gu, 1990). The load mainly comes from indoor activities like occupants, washing and cooking etc. In residential buildings, the largest single moisture load is from people’s respiration and perspiration. However, methods of evaluating indoor moisture generation rates in buildings are generally lacking. The difficulty lies on the fact that the moisture generation rate has no clear relationship with the number of occupants. Factors like cleaning and plants have big effect (Hite & Bray, 1948). Large background contributions from the foundation and soil have been reported (TenWolde, 1994). Typically, a trial-and-error method is adopted in evaluating the indoor moisture generation rate in calculating building heat and moisture transfer. Values of
www.intechopen.com
Moisture and Estimation of Moisture Generation Rate
487
indoor moisture generation rate are adjusted in comparing the measured and the calculated moisture contents. The final selected value is based on the minimum difference of the moisture contents between the measured and the calculated. TenWolde (TenWolde, 1994) used this method and the mathematical model developed by the same author to analyse the indoor moisture generation rates for six manufactured houses during winter. Houses were occupied by one to two persons in each house and dimensions were varying from 4.3 × 20.1 to 4.9 × 23.2 m2. The estimated average values of moisture generation rates were 32×10−6 to 75×10−6 kg s−1 per person. Very often, an experimental value is used. In this chapter, a mathematical method in predicting indoor moisture generation rate is developed. The method is based on a series of measured indoor moisture contents. Using a Stirling interpolation fitting of the measured indoor moisture contents, the time-dependent indoor moisture generation rate can be determined. The moisture generation pattern can be obtained thereafter. The developed method provides an easy and concise way of determining indoor moisture generation levels, hence can be served as a useful tool in predicting building heat and moisture transfer. This chapter is trying to accomplish two objectives. The first is to apply the mathematical
method to predict the indoor moisture generation rate for a real test house. Results are
analysed by the heat and moisture transfer model developed by Lu (Lu, 2002; Viljanen et al.,
1999). With this model, the validation of the proposed mathematical method in deriving
indoor moisture generation rate is studied. The second objective is to study the effect of
indoor moisture generation patterns on the indoor moisture level using the developed heat
and moisture transfer model.
The chapter is organised as follows: Following the introduction is a brief description of
overall heat and moisture transfer model equations for the building system. The
mathematical method used in predicting indoor moisture generation rate is given in details
after the heat and moisture transfer model description. The validation of the developed
model is conducted for a real test house. Finally, simulation results are presented, which
mainly involve the study of the effect on indoor moisture behaviour of different moisture
generation patterns.
2. Model equations for a building system
A building system is divided into building envelopes such as walls, roof, floor, foundation
etc and building indoor air. The modelling work can be generalised as following main steps:
1) developing heat and moisture transfer model equations for building envelopes; 2)
developing heat and moisture transfer model equations for indoor air and 3) numerically
solving the system equations for building envelopes and indoor air at any time with outdoor
conditions expressed as boundary conditions. Hence the transient temperature and moisture
variations can be obtained for a building system under outdoor conditions. A complete heat
and moisture transfer model for a building system is described by Lu in (Lu & Viljanen,
2000; Viljanen et al., 1999).
2.1 Model equations for building envelopes
The fundamentals of heat and moisture transfer in porous media (building envelopes) can
be found in pioneering papers by Philip and DeVries (Philip & DeVries, 1957) and Whitaker
(Whitaker, 1977). In modelling heat and moisture transfer in building porous materials,
www.intechopen.com

Chemistry, Emission Control, Radioactive Pollution and Indoor Air Quality
488
Whitaker’s REV method (Whitaker, 1977) is adopted. The general approach is to start with
conservation equations, constitutive equations and state equations by means of the
thermodynamics of the Gibbs relation. The conservation equations include the mass, the
momentum and the energy conservation equations. In writing the heat and moisture transfer
model equations for building envelopes, simplifications have been made. These include
i. In considering moisture transfer for building envelopes, convection effect is not
included. Moisture transfer is described as Fick’s generalised diffusion equation with
water vapour concentration as a driving potential. This is justified by Liesen and
Pedersen (Liesen & Pedersen, 1999) for example. However, in the case of existence of
liquid phase, the transport of liquid by Darcy’s law can be taken into account.
ii. Local thermodynamic equilibrium is assumed at every point of the material.
iii. For all moisture transport coefficients, any hysteresis effect is not included.
iv. The flux of heat or moisture at the interface of contacted materials has a continuous
property.
v. Heat and moisture transfer equations are limited to one-dimensional for building walls
and roof and two-dimensional for building floor, foundation and soil.
vi. Soil is a homogeneous material.
vii. At a depth of 5 m of the soil ground, the temperature is constant equal to 5°C. At certain
depths, the relative humidity of soil is 100%.
Having the above assumptions the heat and moisture transfer equations for different components of building envelopes can be written down. For example, for building walls, we have
w w ww p w( )
T TC
t x xρ λ∂ ∂ ∂=∂ ∂ ∂ , (1)
w ww( )
c cD
t x x
∂ ∂ ∂=∂ ∂ ∂ . (2)
Boundary condition: The interfaces between layers are treated separately and the conditions of continuity assumption (iv) are applied. Thus we have for example
1wλ
1wT
x
∂∂ |interface = 2
wλ2
wT
x
∂∂ | interface, (3)
1wT | interface = 2
wT | interface, (4)
1wD
1wc
x
∂∂ |interface = 2
wD2
wc
x
∂∂ | interface, (5)
1wc | interface = 2
wc | interface. (6)
For surfaces exposed to the outdoor and indoor air, we have for example
λwwT
x
∂∂ |surface,out= out
T, wh (Tout-Tw| surface,out) + qw, (7)
www.intechopen.com

Moisture and Estimation of Moisture Generation Rate
489
Dwwc
x
∂∂ |surface,out= out
m, wh (cout-cw| surface,out) (8)
and
λwwT
x
∂∂ |surface,in = in
T, wh (Tw| surface,in- Tin), (9)
Dwwc
x
∂∂ |surface,in = in
m, wh (cw| surface,in- cin), (10)
where qw is the solar energy received by the exterior wall surface. Empirical values of the
surface heat and moisture transfer coefficients, outT, wh and in
T, wh , are taken from RIL 117 (RIL
117, 1979). Lewis relation can be used to determine outm, wh and in
m, wh . Currently, raining
effect is not included. Similar equations of Eqs. (1)–(10) for building floor, foundation and soil are given with two-dimensional. In writing the boundary conditions, the heat and moisture fluxes normal to the boundary surfaces which are selected as far as possible from the interest building are assumed to be 0 in soil ground. Assumption (vii) is also employed. We are not going to address the equations here for space limitation. More details can be referred to Viljanen et al. (Viljanen et al., 1999). For initial conditions for building envelopes, the temperature or the relative humidity is assumed at the steady state with indoor and outdoor temperatures or relative humidity. For soil, the initial temperature distribution is treated differently accounting for its big thermal capacity (Viljanen et al., 1999).
2.2 Model equations for building indoor air
The following physical condition is assumed for building indoor air: viii. Indoor air is well mixed. Indoor temperature and moisture content are uniformly
distributed. The well-mixed indoor air model is generally not valid, however, the resultant error may be
negligible depending on the model’s application. For a normal residential house for
example, the effect of the indoor air flow on the indoor temperature and moisture level is
normally small if the ventilation rate is not very big. Hence a well-mix indoor air model is a
good approximation of the practical situation.
The heat and moisture balance equations therefore can be written in the following forms:
VρininpC indT
dt= nVρin
inpC (Tout – Tin) + ΣQi, (11)
V indc
dt= nV(cout – cin) + G +ΣMi, (12)
where ΣQi is the sum of heat transfer rates between building envelopes and indoor air (W),
ΣMi is the sum of moisture transfer rates between building envelopes and indoor air (kg s-1)
and G is the indoor moisture generation rate (kg s-1).
www.intechopen.com
Chemistry, Emission Control, Radioactive Pollution and Indoor Air Quality
490
To have a closed system of heat and moisture equations for building system, all material property data have to be taken into account. These data are taken from RIL 117 (RIL 117, 1979), some of which are based on the experimental fittings (Viljanen et al., 1999). Moreover, the time-dependent indoor moisture generation rate G has to be given in order to solve the equations. A mathematical method of calculating G is given in the following section. The model partial differential equations, Eqs. (1)-(12), are discretized in space by the finite difference method. The resultant ordinary differential equations are discretized in time by the Crank-Nicolson scheme. The final algebraic equations are solved by the Newton iteration method. Transient temperatures and moisture contents for building envelopes and indoor air are then solved at any time under outdoor climatic conditions.
3. Calculation of indoor moisture generation rate
Eq. (12) gives the moisture generation rate as:
G = V indc
dt– nV(cout – cin) – ΣMi. (13)
To deduce G, the derivative of indoor moisture content cin versus time, indc
dt, is needed.
However, direct differentiation of the indoor moisture contents can be unstable even though the data show smooth and continuous properties. The moisture generation rate increases exponentially when the moisture source releases the moisture and decreases exponentially after the source stops the release. Bennett et al. (Bennett et al., 1996) developed an approach in estimating emission rate from concentration data for formaldehyde measurement. A Stirling interpolation polynomial fitting was used in constructing the derivatives of contaminant concentrations. Applying this idea, indoor moisture contents cin are interpolated by a Stirling polynomial, the derivatives can therefore be obtained by simply differentiating the smooth continuous polynomial. Stirling interpolation polynomial is based on the average of the backward and forward Gauss interpolation polynomials. It uses a diagonal difference table with three successive points. It is a symmetrical approximation for the given values. Relevant formulas are shown in the appendix. Similarly, a Bessel interpolation polynomial can be used also. It is based on a diagonal difference table and uses four points. It is able to interpolate with data that are not evenly spaced apart. More details can be seen in Kunz (Kunz, 1957). Another unknown value presented in Eq. (13) is the time-dependent moisture transfer rate
ΣMi between building envelopes and indoor air. In deriving the indoor moisture generation
rate G, it is customarily assumed that ΣMi is 0, for example in Bennett et al. (Bennett et al., 1996). However, it may affect the calculation accuracy. We propose two different methods in
calculating ΣMi here, namely the explicit and the numerical methods. For the explicit method, we assume a steady-state condition in Eq. (13) and ignore the thermal lag between the envelopes and indoor air, so the moisture transfer rate M for any building envelope can be approximated as
M = Aδ(cout-cin), (14)
where A and δ are the area and the overall moisture transfer coefficient of the building envelope respectively.
www.intechopen.com
Moisture and Estimation of Moisture Generation Rate
491
The implication behind the approximation Eq. (14) is that the moisture profile of the
building envelope is given by a linear combination of cout and cin. For a thin, uniform
construction material, the method can give a good estimation. However, for a general
situation, Eq. (14) gives a poor estimation. One way of modifying it is to introduce more
interpolation nodes for example cout, c1,…cn, cin. The Laplace transform can be used and Eq.
(14) is reduced to a first order time lag corresponding to cout and cin. As it involves tedious
basic mathematical manipulations, details are skipped here. More information can be found
in Underwood (Underwood, 1999), where an approximated heat conduction equation was
studied. It can be applied to moisture transfer equation.
For the numerical method, the developed program is adopted to predict ΣMi at any time.
One difficulty is that in calculating ΣMi, the time-dependent moisture generation rate G is
needed. Values of G can be approximated first by assuming ΣMi = 0.
3.1 Model validation criteria
The Normalized Mean Squared Error (NMSE) and the Correlation Coefficient (r) are accepted as two key criteria to evaluate the fit to the identification data.
[ ][ ]
2
12
1
N
i ii
N
i ii
x x
NMSE
x x
=
=
−=
−∑∑
&
(15)
1 1 1
2 2 2 2
1 1 1 1
( ( ) )( ( ) )
N N N
i i i ii i i
N N N N
i i i ii i i i
N z y z y
r
N z z N y y
= = =
= = = =
−=
− −∑ ∑ ∑
∑ ∑ ∑ ∑ (16)
where ix&
and ix are predicted value and the mean of measured ones ( ix ) respectively, N is
the number of samples, iz and iy are samples. By definition, the minimum of NMSE is zero,
indicating the exact match between actual and estimated values. The higher NMSE, the
worse is our estimation. The value of r is such that -1 < r < +1, where + and - signs are used
for positive linear correlations and negative linear correlations, respectively. An r value of
exactly +1 indicates a perfect positive fit while -1 means a perfect negative fit.
4. Simulation results and discussion
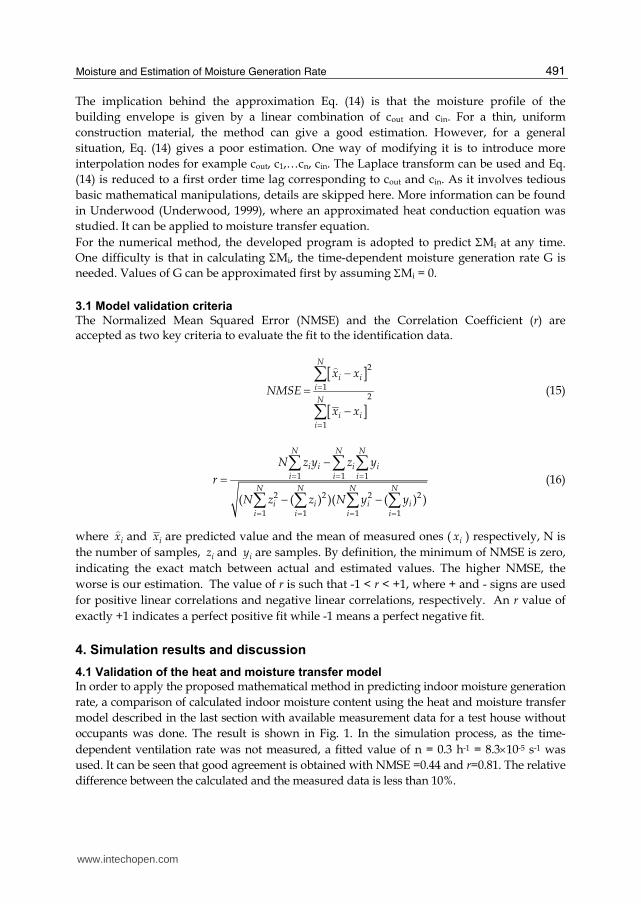
4.1 Validation of the heat and moisture transfer model
In order to apply the proposed mathematical method in predicting indoor moisture generation
rate, a comparison of calculated indoor moisture content using the heat and moisture transfer
model described in the last section with available measurement data for a test house without
occupants was done. The result is shown in Fig. 1. In the simulation process, as the time-
dependent ventilation rate was not measured, a fitted value of n = 0.3 h-1 = 8.3×10⁻⁵ s-1 was
used. It can be seen that good agreement is obtained with NMSE =0.44 and r=0.81. The relative
difference between the calculated and the measured data is less than 10%.
www.intechopen.com

Chemistry, Emission Control, Radioactive Pollution and Indoor Air Quality
492
Fig. 1. Comparison between calculated and measured indoor moisture contents. Validation of the heat and moisture transfer model.
4.2 Validation of the indoor moisture generation rate model
To perform a validation of the proposed mathematical method in predicting indoor
moisture generation rate, we measured a series of indoor temperatures and moisture
contents for a real test house. The measurement period was from 24th of November to 2nd
of December 1998 and the average ventilation rate was measured as 0.4 h-1= 1.1×10⁻⁴ s-1. The
test house is a one-storey detached house, a massive log house, with a dimension
7.6× 14.3× 2.5 m3 located near Helsinki of Finland (Lehtinen et al., 1998). The floor area is
about 110 m2. The inner and outer walls, roof and floor are mainly composed of wood,
mineral wool and concrete with thickness 200, 300 and 120 mm, separately. A schematic
picture of the house dimensions and constructions is given in Figs. 2 and 3. The house was
occupied by a family with two adults and a baby.
As reference figures, Figs. 4 and 5 display a comparison between the calculated and the
measured indoor moisture contents and relative humidity. Indoor moisture generation rate
was assumed to be 0. The measured indoor temperatures were used in the calculation, see
Fig. 6. It can be seen that the calculated levels of indoor moisture contents and relative
humidity are lower than those of the measured data. Indoor moisture generation rate has to
be taken into account.
Table 2 lists some of the measurement data including outdoor and indoor moisture contents.
The last column presents the calculated indoor moisture generation rate per unit volume
using the method described in the previous section, see the appendix. Here we assume
that the moisture transfer rate between building envelopes and indoor air is 0, i.e.
ΣMi = 0.
www.intechopen.com

Moisture and Estimation of Moisture Generation Rate
493
Fig. 2. Layout of cross-section view of the test house.
Fig. 3. Schematic picture of the constructions of the test house.
www.intechopen.com

Chemistry, Emission Control, Radioactive Pollution and Indoor Air Quality
494
Fig. 4. Comparison between calculated and measured indoor moisture contents for the test house. Indoor moisture generation rate is assumed to be 0.
Fig. 5. Comparison between calculated and measured indoor relative humidity for the test house. Indoor moisture generation rate is assumed to be 0.
www.intechopen.com

Moisture and Estimation of Moisture Generation Rate
495
Fig. 6. Measured indoor and outdoor temperatures for the test house.
Fig. 7. Measured indoor moisture contents and calculated indoor moisture generation rate for the test house.
www.intechopen.com

Chemistry, Emission Control, Radioactive Pollution and Indoor Air Quality
496
Fig. 7 shows the measured indoor moisture content and the calculated time-dependent indoor moisture generation rate for the test house. It can be seen that the trend of indoor moisture generation rate very much follows that of the indoor moisture contents. The rate
values vary from 0 to 2.6 gm-3 h-1 = 196 × 10-6 kg s-1. And the average rate value is 0.76 g m-3
h-1 = 57×10-6 kg s-1. These values fall within the range of moisture generation rate reported by other researchers. For example, TenWold (TenWold, 1994) estimated the moisture
generation rate in one- to two-person house between 63×10-6 kgs-1 and 75×10-6 kgs-1in winter period.
Time (24th, Nov.)
cin (gm-3) indc
dt(gm-3 h-1) cout (gm-3)
n(cout-cin) (gm-3 h-1)
G
V(gm-3 h-1)
12:00 am 5.67 0.2040 3.7521 -0.7672 0.9712
12:30 am 5.43 -0.5027 3.7260 -0.6816 0.1788
01:00 am 5.34 -0.0360 3.7096 -0.65214 0.6161
01:30 am 5.34 0.0160 3.7336 -0.6426 0.6586
02:00 am 5.34 0 3.7579 -0.6329 0.6329
02:30 am 5.34 -0.0270 3.774 -0.6264 0.5994
03:00 am 5.34 0.1350 3.7839 -0.6224 0.7575
03:30 am 5.43 0 3.7695 -0.6642 0.6642
04:00 am 5.34 -0.1350 3.7474 -0.6370 0.5020
04:30 am 5.34 0.0270 3.7226 -0.6470 0.6740
Table 2. Measured indoor moisture contents and calculated indoor moisture generation rate.
Fig. 8. Comparison between calculated and measured indoor moisture contents for the test house. Time-dependent moisture generation rate in Fig. 7 is applied.
www.intechopen.com

Moisture and Estimation of Moisture Generation Rate
497
Fig. 9. Comparison between calculated and measured indoor relative humidity for the test house. Time-dependent moisture generation rate in Fig. 7 is applied.
From the obtained time-dependent indoor moisture generation rate in Fig. 7 we can see that
the moisture generation pattern consists of different peaks, which are coincident with
occupants’ activities. Applying the result in Fig. 7, Figs. 8 and 9 present the results of the
comparison between the measured and the calculated indoor moisture contents and relative
humidity. Table 3 lists the model performances for results (Figs. 8 and 9). Good agreement is
obtained.
Model Normalized Mean
Squared Error (NMSE)
Correlation Coefficient (r)
acalculated measured
measured
−
Calculated indoor moisture content vs. measured indoor moisture content (Fig. 8)
0.71 0.55 Maximum = 15%; Average= 5%;
Calculated indoor relative humidity vs. measured indoor relative humidity (Fig. 9)
0.38 0.83 Maximum = 15%; Average = 6%;
a The range of errors between calculated and measured.
Table 3. Model performances between measured indoor moisture content and calculated indoor moisture generation rate.
www.intechopen.com

Chemistry, Emission Control, Radioactive Pollution and Indoor Air Quality
498
It is worth noting that the moisture generation rate in Fig. 7 was obtained by assuming the
moisture transfer rate ΣMi = 0. It seems this assumption influences the model accuracy in calculating indoor moisture content, which gives relatively low Correlation Coefficient (r=0.55). But, the error range is small and satisfactory (last column in Table 3). Using the program and the information of Fig. 7 we have calculated the moisture transfer rate per unit
area i
i
M
A
∑∑ . Values vary from 0.02×10⁻⁹ kg m-2 s-1 to 0.13×10⁻⁶ kg m-2 s-1. The average value is
0.03×10⁻⁶ kg m-2 s-1. Considering the magnitude of the moisture transfer rate, it is neglected in deducing the moisture generation rate. Calculations would not make any principle difference if the effect of moisture transfer rate were taken into account. TenWolde
(TenWolde, 1994) used a moisture transfer rate of 0.068×10⁻⁶ kg m-2 s-1 to match the calculated and the measured indoor relative humidity. One interesting phenomenon is that the model gives very good agreement for indoor
relative humidity (Table 3). As mentioned earlier, the model has assumed that the heat
transfer rates between building envelope and indoor air were assumed as zero (ΣQi,, Eq.
(11)). This assumption may have effects on model accuracy of both indoor temperature and
moisture content estimates which is beyond statistical explanation. This guess is further
proved by the following simulations (Section 4.3).
In the following, a number of simulations are conducted for the test house shown in Figs. 2
and 3. These calculations are concerned with the study of the effect on indoor moisture
contents of different moisture generation rate patterns.
4.3 Effect of moisture generation rate patterns
Consider a varied moisture generation pattern shown in Fig. 7 and a constant moisture
generation pattern. Figs. 10 and 11 present the calculated indoor moisture contents and
relative humidity. For the constant moisture generation pattern, the rate value of 57×10−6 kg
s−1 is assumed, which is predicted for the test house as an average rate value. It is observed
that the indoor moisture content with the constant moisture generation rate is an average
curve of that with the varied moisture generation rate in Fig. 10. Moreover, the difference is
so small that it can be neglected. This conclusion is applicable to the indoor relative
humidity in Fig. 11.
Next, assume that the test house is a commercial house with occupant activities existing
only for certain working hours, for example from 9:00 a.m. to 5:00 p.m. for 8 hours. The
moisture generation rate is assumed to be 171×10-6 kg s-1 during the working hours and 0
otherwise, which has a periodic pulse pattern. Note that the daily average moisture
generation rate is still 57×10-6 kg s-1 as in Figs. 10 and 11. Figs. 12 and 13 show the
comparison of the indoor moisture contents with these two different moisture generation
rate patterns. Table 4 illustrates model performances. The difference is within a very small
range, especially for indoor relative humidity.
Model performances are excellent in indoor relative humidity estimation. Results also show
consistency with ones in Section 4.2, which evidences our guess. Neglecting moisture
transfer between building envelope and indoor air can affect the model accuracy in
calculating indoor moisture content, but the impact is limited and very small normally
(Section 4.2). As such, the model may give relatively poor agreement for indoor moisture
content which may go beyond statistics, such as Correlation Coefficient, but in general
www.intechopen.com

Moisture and Estimation of Moisture Generation Rate
499
errors are small and acceptable (last columns in Tables 3 and 4). Furthermore, note that a
relationship between two variables must be approximately linear when applying
Correlation Coefficient. When the assumption of linearity is violated, the correlation will
underestimate the strength of the relationship. In addition, the developed model in this
Model Normalized Mean
Squared Error (NMSE)
Correlation Coefficient (r)
asimulated target
target
−
Constant moisture generation rate vs. time-dependent moisture generation rate (indoor moisture content, Fig. 10)
0.74 0.54 Maximum = 15%; Average= 3%;
Constant moisture generation rate vs. time-dependent moisture generation rate (indoor relative humidity, Fig. 11)
0.12 0.94 Maximum = 15%; Average = 3%;
Moisture generation rate with constant pattern vs. Moisture generation rate with periodic pulse pattern (indoor moisture content, Fig. 12)
0.69 0.56 Maximum = 9%; Average = 4%;
Moisture generation rate with constant pattern vs. Moisture generation rate with periodic pulse pattern (indoor relative humidity, Fig. 13)
0.14 0.93 Maximum = 10%; Average = 4%;
a The range of errors between simulated and target.
Table 4. Model performances for the effect of moisture generation rate patterns
www.intechopen.com

Chemistry, Emission Control, Radioactive Pollution and Indoor Air Quality
500
Fig. 10. Comparison of the effect on indoor moisture contents of different moisture generation patterns for the test house. Constant moisture generation rate and time-dependent moisture generation rate in Fig. 7 are applied.
Fig. 11. Comparison of the effect on indoor relative humidity of different moisture generation patterns for the test house. Constant moisture generation rate and time-dependent moisture generation rate in Fig. 7 are applied.
www.intechopen.com

Moisture and Estimation of Moisture Generation Rate
501
Fig. 12. Comparison of the effect on indoor moisture contents of different moisture generation patterns for the test house. Moisture generation rates with constant and periodic pulse patterns are applied.
Fig. 13. Comparison of the effect on indoor relative humidity of different moisture generation patterns for the test house. Moisture generation rates with constant and periodic pulse patterns are applied.
www.intechopen.com

Chemistry, Emission Control, Radioactive Pollution and Indoor Air Quality
502
paper (e.g. Eq. (13)) is physically verified in many related works (Lu, 2002). In this study, the differences between simulated and measurements are all in small margins (last columns in Tables 3 and 4), which further verify the model's usefulness in practice. This is an interesting result as it can greatly simplify the calculation procedure. Note that any moisture generation pattern function can be approximated by a combination of periodic pulse functions, so the result actually implies that a constant moisture generation rate pattern is always ‘enough’ in calculating the indoor moisture content, especially in deciding indoor moisture level. It is worth mentioning that Isetti et al. (Isetti et al., 1988) studied the effect on indoor relative humidity of three periodic pulse types of moisture generation patterns with different numbers of occupants in an office room. A similar result was obtained. A constant moisture generation pattern was not included in their paper.
5. Conclusion
The importance of the effect of the indoor moisture generation rate on accurately predicting moisture content for a building system has been demonstrated. Hence in studying the heat and moisture transfer for a building system, a method of precisely calculating indoor moisture generation rate is needed. To address the problem, this chapter proposes a mathematical method to derive time-dependent moisture generation rate function from a series of measured indoor moisture contents. The method incorporates the developed heat and moisture transfer model to calculate transient temperatures and moisture contents for building envelopes and indoor air exposed to any outdoor climatic conditions. The model is validated by a real test house. The effect on indoor moisture level of different moisture generation patterns is also investigated. Through simulation results, we can draw the following main conclusions:
• The performance of indoor moisture generation rate has a big effect on indoor moisture level. In conducting the simulation work, this aspect has to be considered.
• Given a series of measured indoor moisture contents, it is possible to calculate time-dependent moisture generation rate using the method proposed in this chapter.
• A constant moisture generation rate model is generally not valid, but the resultant error may be negligible. This has important implication for simplifying a simulation procedure.
Finally, it is stressed that the present model is based on the condition of well-mixed indoor air moisture from the moisture sources. For some special cases especially right after the moisture release from a big moisture release source, special attention must be paid. Moreover, for a heavy moisture content room like sauna or bathroom, the effect of different moisture generation rate patterns may be too big to be neglected.
6. Acknowledgement
This research was supported by the Finnish Academy.
7. Appendix
Table 5 presents a difference table used in interpolating a series of measured data by a Stirling polynomial.
www.intechopen.com

Moisture and Estimation of Moisture Generation Rate
503
With equal space h, at point x = x0, the approximation of the derivative of Stirling polynomial is give as (p127, Kunz, 1957):
[dy
dx]x=x0 =
1
h( 1 0
2
y y−Δ + Δ-
1
6
3 32 1
2
y y− −Δ + Δ+
1
30
5 53 2
2
y y− −Δ + Δ+…). (A.1)
Applying the above formula Eq. (A.1) to the indoor moisture content we get
[ indc
dt]t=t0 =
1
tΔ ( , 1 ,0
2
in inc c−Δ + Δ-
1
6
3 3, 2 , 1
2
in inc c− −Δ + Δ+
1
30
5 5, 3 , 2
2
in inc c− −Δ + Δ+…). (A.2)
Take Table 5 as an example, Eq. (A.2) gives the following result at time 2:30 am:
[ indc
dt]2:30am=
1
0.5(
0 0
2
+-
1
6
0 0.09
2
++
1
30
0.09 0.45
2
−) = -0.0270 g m-3 h-1. (A.3)
In Table 2, it shows that [ indc
dt]2:30am= -0.0270 g m-3 h-1.
index no.
Time cin Δcin Δ2cin Δ3cin Δ4cin Δ5cin
-5 12:00 am 5.67
-0.24
-4 12:30 am 5.43 0.15
-0.09 -0.06
-3 01:00 am 5.34 0.09 -0.03
0 -0.09 0.12
-2 01:30 am 5.34 0 0.09
0 0 -0.09
-1 02:00 am 5.34 0 0
0 0 0.09
0 02:30 am 5.34 0 0.09
0 0.09 -0.45
1 03:00 am 5.34 0.09 -0.36
0.09 -0.27 0.9
2 03:30 am 5.43 -0.18 0.54
-0.09 0.27
3 04:00 am 5.34 0.09
0
4 04:30 am 5.34
Table 5. Difference table.
Nomenclature
A area, m2 c vapour content, kg m-3
www.intechopen.com

Chemistry, Emission Control, Radioactive Pollution and Indoor Air Quality
504
Cρ specific heat, J kg-1 K-1 D moisture diffusion coefficient, m2 s-1 G moisture generation rate, kg s-1 hm surface moisture transfer coefficient, m s-1 hT surface heat transfer coefficient, W m-2 K-1 n ventilation rate, s-1 q solar heat flux, W m-2
Q heat transfer rate between envelope and indoor air, W
M moisture transfer rate between envelope and indoor air, kg s-1 t time, s T temperature, K V volume, m3 x space co-ordinate, m
Greek symbols
δ overall moisture transfer coefficient, m s-1 λ thermal conductivity, W m-1 K-1 ρ density, kg m-3
Superscripts
in indoor air out outdoor air
Subscripts
in indoor air interface interface out outdoor air surface surface w wall
8. References
Adan, OCG (1994). On the fungal defacement of interior finishes [thesis], Eindhoven, Eindhoven University of Technology,
Netherlands Bennett, JS., Feigley, CE., Underhill, DW., Drane, W., Payne, TA., Stewart, PA., Herrick, RF.,
Utterback, DF. & Hayes, RB. (1996). Estimating the contribution of individual work tasks to room concentration: method applied to embalming, American Industrial Hygiene Association Journal, Vol. 57, pp. 599-609, ISSN 1542-8117
Burge, HA. (1986). Toxigenic potential of indoor microbial aerosols, Fifth Symposium on the Application of Short-Term Bioassays in the Analysis of Complex Environmental Mixtures, pp. 391-397, ISBN 0306427729, Sheraton University Center, Durham, NC., USA
Croft, WA, Jarvis, BB. & Yatawara, CS. (1986). Airborne outbreak of trichothecene toxicosis, Atmos. Environ., Vol. 20, No. 3, pp. 549-552, ISSN 1352-2310
Haverinen, U. (2002). Modeling moisture damage observations and their association with symptoms [thesis], National Public Health Institute, Department of Environmental Health, University of Kuopio
www.intechopen.com

Moisture and Estimation of Moisture Generation Rate
505
Heinz, RT. & Mark, TB. (2009). Moisture Control in Buildings: The Key Factor in Mold Prevention, ASTM International, ISBN 978-0-8031-7004-9, West Conshohocken, Pennsylvania, USA
Hite, SC. & Bray, JL. (1948). Research in humidity control. Research Series No. 106, Purdue University, Engineering Experiment Station, Lafayette, USA
Institute of Medicine (2004). Damp indoor space and health, National Academies Press, ISBN 0-309-09246-9, Washington, DC, USA
Isetti, C., Laurenti, L. & Ponticiello, A. (1988). Predicting vapour content of the indoor air and latent loads for air-conditioned environments: Effect of moisture storage capacity of the walls, Energy and Buildings, Vol. 12, pp.141-148, ISSN 0378-7788
Jarvis, BB. (1990). Mycotoxins and indoor air quality, ASTM in Biological Contaminants in Indoor Environments, pp. 201-204, ISBN 0-8031-1290-4, ASTM Symposium, Boulder, CO, USA, July 16-19, 1989
Jarvis, BB. (1995). Mycotoxins in the air: keep your buildings dry or the bogeyman will get you, Proceedings from the International Conference: Fungi and Bacteria in Indoor Environments: Health Effects, Detection and Remediation, pp. 35-44, ISBN 978-0970991508, Saratoga Springs, N.Y., USA, October 6-7, 1994
Johansson,p., Samuelson, I., Ekstrand-Tobin,A., Mjörnell,k., Sandberg,PI. & Sikander, E. (2005). Microbiological growth on
building materials – critical moisture levels. State of the art, Report 2005:11, SP Swedish National Testing and Research
Institute, Borås, Sweden Kerestecioglu, A. & Gu, L. (1990). Theoretical and computational investigation of simultaneous
heat and moisture transfer in buildings: “Evaporation and condensation” theory, ASHRAE Transactions, Vol. 96, No. 1, pp. 455-464, ISSN 0001-2505
Kunz, K.S. (1957). Numerical analysis, McGraw-Hill, ISBN 0-07-035630-0, New York, USA Lehtinen, T., Viljanen, M., & Hänninen, J. (1998). Massiivihirsistä tehtyjen ulkoseinien käyttö
asuinrakentamisessa, TKK-TRT-95, ISBN 951-22-4419-5, Helsinki University of Technology, Espoo, Finland
Lieff, M., & Trechsel HR. (1982). Moisture migration in buildings : a symposium, Philadelphia, Pa., 6 Oct. 1980, ASTM special technical publication / American Society for Testing and Materials 779, ISBN 0-8031-0605-X, West Conshohocken, Pa., USA
Liesen, R. & Pedersen, C. (1999). Modelling the energy effects of combined heat and mass transfer in building elements: Part 1-Theory, ASHRAE Transactions, Vol. 105, No. 2, pp. 941-953, ISSN 0001-2505
Lu, X. & Viljanen, M. (2000). On controlling indoor thermal and moisture content for an occupied building, Proceedings of the 7th international conference on air distribution in rooms, pp. 951-956, ISBN 0080430171, Reading, UK, July 9-12, 2000
Lu, X. (2002). Modelling heat and moisture transfer in buildings – (I) model program, Energy and Buildings, Vol. 34, pp. 1033-1043, ISSN 0378-7788
Mudarri, D. & Fisk, WJ. (2007). Public health and economic impact of dampness and mold, Indoor air, Vol. 17, pp. 226-235, ISSN 0905-6947
Philip, JR. & DeVries, DA. (1957). Moisture movement in porous materials under temperature gradients, Trans. Am. Geophys. Union, Vol. 38, pp. 222-232, ISSN 0002-8606
www.intechopen.com

Chemistry, Emission Control, Radioactive Pollution and Indoor Air Quality
506
Pope, AM., Patterson, R. & Burge, H. (1993). Indoor Allergens. Assessing and Controlling Adverse Health Effects, National Academy Press, ISBN 978-0-309-04831-6, Washington, D.C., USA
RIL 117. (1979). Lämmön- ja kosteudeneristys, Suomen Rakennusinsinöörien Liitto, Finland Rousseau, MZ. (1984). Sources of moisture and its migration through the building enclosure,
ASTM Standardization News 1984, Vol. 12, No. 11, pp. 35-37, ISSN 1094-4656 Rowan, NJ., Johnstone, CM., McLean, RC., Anderson, JG. & Clarke, JA. (1999). Prediction of
toxigenic fungal growth in buildings by using a novel modelling system, Applied and Environmental Microbiology, Vol. 65, pp. 4814–4821, ISSN 0099-2240
Saijo, Y., Kishi, R., Sata, F., Katakura, Y., Urashima, Y., Hatakeyama, A., Kobayashi, S., Jin, K., Kurahashi, N., Kondo, T., Gong, YY. & Umemura, T. (2004). Symptoms in relation to chemicals and dampness in newly built dwellings, International Archives of Occupational and Environmental Health, Vol. 77, pp. 461-470, ISSN 0340-0131
Smith, JE. & Moss, MO. (1985). Mycotoxins Formation, Analysis, and Significance, John Wiley and Sons, ISBN 978-0471906711, NY., USA
Salthammer, T. (1999). Organic Indoor Air Pollutans, WILEY-VCH, ISBN 3-527-29622-0, NY., USA
Andersson MA., Nikulin M., Koljalg U., Andersson MC., Rainey F., Reijula K., Hintikka EL. and Sakinjoja-Salonen M. (1997). Bacteria, molds and toxins in water-damaged building materials, Applied and Environmental Microbiology, Vol. 63, pp. 387-393, ISSN 0099-2240
TenWolde, A. (1994). Ventilation, humidity, and condensation in manufactured houses during winter, ASHRAE Transactions, Vol. 100, No. 1, pp. 103-115, ISSN 0001-2505
Underwood, CP. (1999). HVAC Control Systems: Modelling, analysis and design, ISBN 978-0419209805, E & FN SPON, London, UK
Verhoeff, AP., Van Strien, RT., Van Wijjnen, JH. & Brunekreef B. (1995). Damp housing and childhood respiratory symptoms. The role of sensitization to dust mites and mold, Am.J. of Epidemiology, Vol. 141, No. 20, pp. 103-110, ISSN 0002-9262
Viitanen, H. & Ritschkoff, A.C. (1991). Mould growth in pine and spruce sapwood in relation to air humidity and temperature, Report No. 221, Swedish University of Agricultural Sciences, Department of Forest Products Uppsala, Sweden
Viljanen, M., Bergman, J., Grabko, S., Lu, X., & Yrjölä, R. (1999). Ensuring the long service life of unheated buildings, TKK-TRT-100, ISBN 951-22-4715-1, Helsinki University of Technology, Espoo, Finland
Whitaker, S. (1977). Simultaneous heat, mass and momentum transfer- A theory of drying, Adv. Heat Transfer, Vol. 13, pp. 119-203, ISSN 978-0-12-020033-7
Wong, GW, Ko, FW., Hui, DS., Fok, TF., Carr, D., von Mutius, E., Zhong, NS., Chen, YZ. & Lai, CK. (2004). Factors associated with difference in prevalence of asthma in children from three cities in China: multicentre epidemiological survey, British Medical Journal, Vol. 329, pp. 486-488, ISSN 0959-8138
Yang, CS. (1995). Understanding the biology of fungi indoors, Proceedings from the International Conference: Fungi and Bacteria in Indoor Environments: Health Effects, Detection and Remediation, pp. 131-137, ISBN 978-0970991508, Saratoga Springs, N.Y., USA, October 6-7, 1994
Yang, CY., Chiu, JF., Chiu, HF. & Kao, WY. (1997). Damp housing conditions and respiratory symptoms in primary school children, Pediatric Pulmonology, Vol. 24, pp. 73-77, ISSN 8755-6863
www.intechopen.com

Chemistry, Emission Control, Radioactive Pollution and Indoor AirQualityEdited by Dr. Nicolas Mazzeo
ISBN 978-953-307-316-3Hard cover, 680 pagesPublisher InTechPublished online 27, July, 2011Published in print edition July, 2011
InTech EuropeUniversity Campus STeP Ri Slavka Krautzeka 83/A 51000 Rijeka, Croatia Phone: +385 (51) 770 447 Fax: +385 (51) 686 166www.intechopen.com
InTech ChinaUnit 405, Office Block, Hotel Equatorial Shanghai No.65, Yan An Road (West), Shanghai, 200040, China
Phone: +86-21-62489820 Fax: +86-21-62489821
The atmosphere may be our most precious resource. Accordingly, the balance between its use and protectionis a high priority for our civilization. While many of us would consider air pollution to be an issue that themodern world has resolved to a greater extent, it still appears to have considerable influence on the globalenvironment. In many countries with ambitious economic growth targets the acceptable levels of air pollutionhave been transgressed. Serious respiratory disease related problems have been identified with both indoorand outdoor pollution throughout the world. The 25 chapters of this book deal with several air pollution issuesgrouped into the following sections: a) air pollution chemistry; b) air pollutant emission control; c) radioactivepollution and d) indoor air quality.
How to referenceIn order to correctly reference this scholarly work, feel free to copy and paste the following:
Tao Lu, Xiaoshu Lu and Martti Viljanen (2011). Moisture and Estimation of Indoor Moisture Generation Rate,Chemistry, Emission Control, Radioactive Pollution and Indoor Air Quality, Dr. Nicolas Mazzeo (Ed.), ISBN:978-953-307-316-3, InTech, Available from: http://www.intechopen.com/books/chemistry-emission-control-radioactive-pollution-and-indoor-air-quality/moisture-and-estimation-of-indoor-moisture-generation-rate