Embed Size (px)
Citation preview
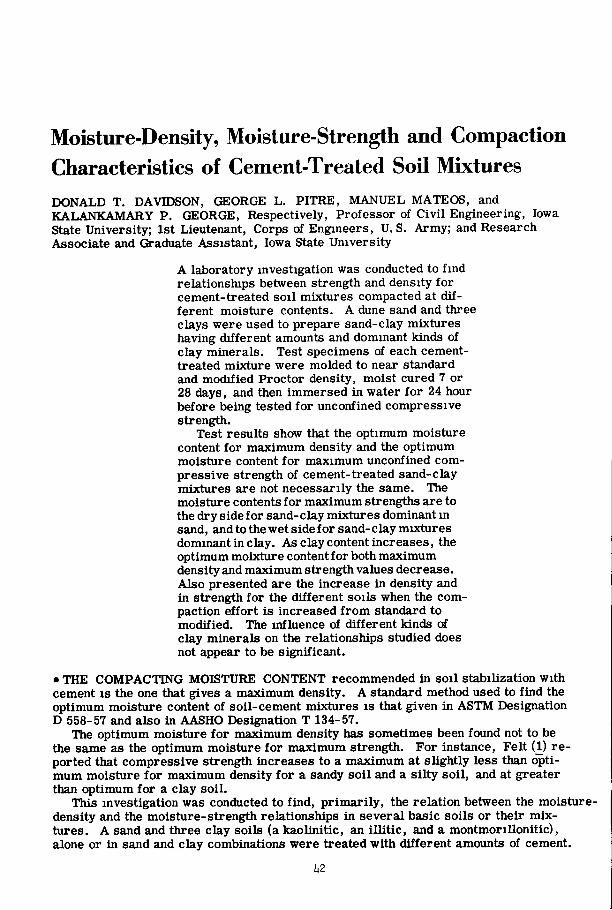
Moisture-Density, Moisture-Strength and Compaction Characteristics of Cement-Treated Soil Mixtures DONALD T. DAVIDSON, GEORGE L . P I T R E , MANUEL MATEOS, and KALANKAMARY P. GEORGE, Respectively, Professor of Civil Engineering, Iowa State University; 1st Lieutenant, Corps of Engineers, U.S. Army; and Research Associate and Graduate Assistant, Iowa State University
A laboratory investigation was conducted to find relationships between strength and density for cement-treated soil mixtures compacted at different moisture contents. A dune sand and three clays were used to prepare sand-clay mixtures having different amounts and dominant kinds of clay minerals. Test specimens of each cement-treated mixture were molded to near standard and modified Proctor density, moist cured 7 or 28 days, and then immersed in water for 24 hour before being tested for unconfined compressive strength.
Test results show that the optimum moisture content for maximum density and the optimum moisture content for maximum unconfined compressive strength of cement-treated sand-clay mixtures are not necessarily the same. The moisture contents for maximum strengths are to the dry side for sand- clay mixtures dominant in sand, and to the wet side for sand-clay mixtures dominant in clay. As clay content increases, the optimum moixture content for both maximum density and maximum strength values decrease. Also presented are the increase in density and in strength for the different soils when the compaction effort is increased from standard to modified. The influence of different kinds of clay minerals on the relationships studied does not appear to be significant.
• THE COMPACTING MOISTURE CONTENT recommended in soil stabilization with cement is the one that gives a maximum density. A standard method used to find the optimum moisture content of soil-cement mixtures is that given in ASTM Designation D 558-57 and also in AASHO Designation T 134-57.
The optimum moisture for maximum density has sometimes been found not to be the same as the optimum moisture for maximum strength. For instance. Felt (t) re ported that compressive strength increases to a maximum at slightly less than optimum moisture for maximum density for a sandy soil and a silty soil, and at greater than optimum for a clay soil.
This investigation was conducted to find, primarily, the relation between the moisture-density and the moisture-strength relationships in several basic soils or their mixtures. A sand and three clay soils (a kaollnitic, an illitlc, and a montmorillonitic), alone or in sand and clay combinations were treated with different amounts of cement.
h2
43
The soil-cement mixtures were compacted with the standard AASHO compaction and a few selected mixtures also with the modified AASHO compaction.
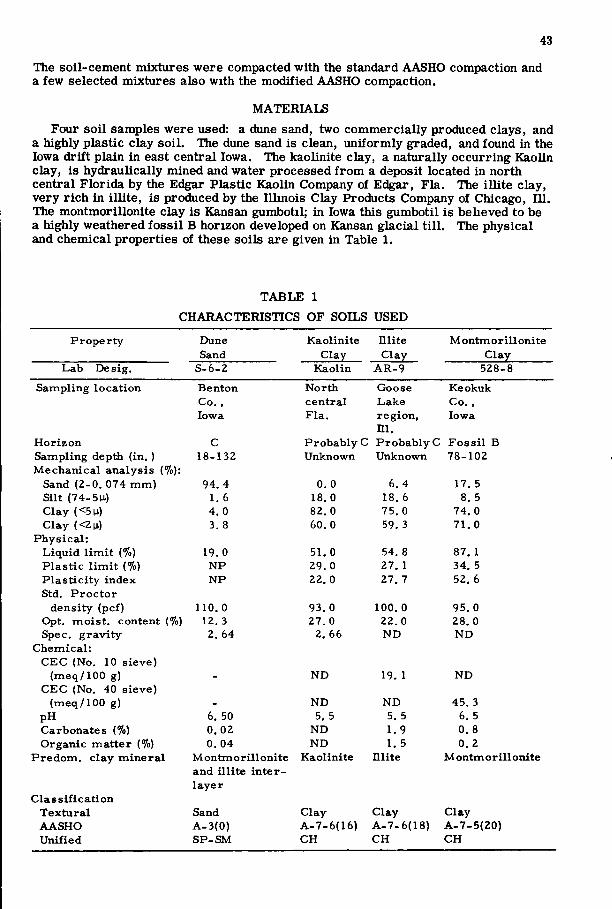
MATERIALS Four soil samples were used: a dune sand, two commercially produced clays, and
a highly plastic clay soil. The dune sand is clean, uniformly graded, and found in the Iowa drift plain in east central Iowa. The kaolinite clay, a naturally occurring Kaolin clay, is hydraulically mined and water processed from a deposit located in north central Florida by the Edgar Plastic Kaolin Company of Edgar, Fla. The illite clay, very rich in il l i te, is produced by the Illinois Clay Products Company of Chicago, 111. The montmorillonite clay is Kansan gumbotil; in Iowa this gumbotil is beheved to be a highly weathered fossil B horizon developed on Kansan glacial t i l l . The physical and chemical properties of these soils are given in Table 1.
TABLE 1 CHARACTERISTICS OF SOILS USED
P r o p e r t y Dune K a o l i n i t e I l l i t e M o n t m o r i l l o n i t e Sand C l a y C l a y C l a y
L a b O e s i g . S - 6 - 2 K a o l i n A R - 9 5 2 8 - 8
S a m p l i n g l o c a t i o n B e n t o n N o r t h G o o s e K e o k u k C o . , c e n t r a l L a k e C o . , I o w a F l a . r e g i o n ,
ni . I o w a
H o r i z o n C P r o b a b l y C P r o b a b l y C F o s s i l B S a m p l i n g depth ( in , ) 1 8 - 1 3 2 Unknown U n k n o w n 7 8 - 1 0 2 M e c h a n i c a l a n a l y s i s (%):
Sand ( 2 - 0 . 074 m m ) 94. 4 0. 0 6. 4 17. 5 S i l t ( 7 4 - 5 H) 1. 6 18. 0 18. 6 8. 5 C l a y (<5M,) 4. 0 82. 0 75 . 0 74 . 0 C l a y (<2\x) 3. 8 60. 0 59. 3 71 . 0
P h y s i c a l : L i q u i d l i m i t (%) 19. 0 51. 0 54. 8 87 . 1 P l a s t i c l i m i t (%) N P 29. 0 27 . 1 34 . 5 P l a s t i c i t y i n d e x N P 22. 0 27 . 7 52. 6 Std. P r o c t o r
d e n s i t y (pcf ) 1 1 0 . 0 93 . 0 100. 0 95 . 0 Opt. m o i s t , content (%) 12. 3 27 . 0 22 . 0 28 . 0 S p e c , g r a v i t y 2. 64 2. 66 N D N D
C h e m i c a l : C E C (No. 10 s i e v e )
( m e q / 1 0 0 g) - N D 19. 1 N D C E C (No. 40 s i e v e )
( m e q / 1 0 0 g) - N D N D 45 . 3 p H 6, 50 5. 5 5. 5 6. 5 C a r b o n a t e s (%) 0. 02 N D 1. 9 0. 8 O r g a n i c m a t t e r {%) 0. 04 N D 1. 5 0. 2
P r e d o m . c l a y m i n e r a l M o n t m o r i l l o n i t e a n d i l l i t e i n t e r -l a y e r
K a o l i n i t e I l l i t e M o n t m o r i l l o n i t e
C l a s s i f i c a t i o n T e x t u r a l Sand C l a y C l a y C l a y A A S H O A - 3 ( 0 ) A - 7 - 6 ( 1 6 ) A - 7 - 6 ( 1 8 ) A - 7 - 5 ( 2 0 ) U n i f i e d S P - S M C H C H C H
44
Type I normal portland cement, obtained from the Penn-Dixie Cement Corporation of Des Moines, Iowa, was used in this investigation. This type of cement was selected because it is commonly used in soil-cement construction. The water used in all mixtures and tests was distilled water.
LABORATORY PROCEDURES Proportioning of Mixtures
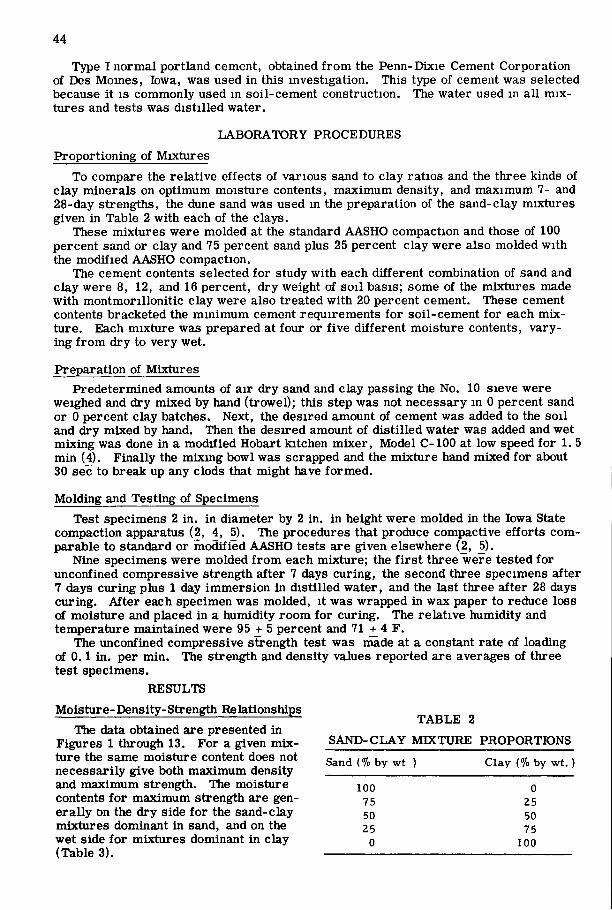
To compare the relative effects of various sand to clay ratios and the three kinds of clay minerals on optimum moisture contents, maximum density, and maximum 7- and 28-day strengths, the dune sand was used in the preparation of the sand-clay mixtures given in Table 2 with each of the clays.
These mixtures were molded at the standard AASHO compaction and those of 100 percent sand or clay and 75 percent sand plus 25 percent clay were also molded with the modified AASHO compaction.
The cement contents selected for study with each different combination of sand and clay were 8, 12, and 16 percent, dry weight of soil basis; some of the mixtures made with montmorillonitic clay were also treated with 20 percent cement. These cement contents bracketed the minimum cement requirements for soil-cement for each mixture. Each mixture was prepared at four or five different moisture contents, varying from dry to very wet.
Preparation of Mixtures Predetermined amounts of air dry sand and clay passing the No. 10 sieve were
weighed and dry mixed by hand (trowel); this step was not necessary in 0 percent sand or 0 percent clay batches. Next, the desired amount of cement was added to the soil and dry mixed by hand. Then the desired amount of distilled water was added and wet mixing was done in a modified Hobart kitchen mixer, Model C-100 at low speed for 1. 5 min (4). Finally the mixing bowl was scrapped and the mixture hand mixed for about 30 sec to break up any clods that might have formed.
Molding and Testing of Specimens Test specimens 2 in. in diameter by 2 in. in height were molded in the Iowa State
compaction apparatus (2, 4, 5). The procedures that produce compactive efforts comparable to standard or modified AASHO tests are given elsewhere (2, 5).
Nine specimens were molded from each mixture; the f i rs t three were tested for unconfined compressive strength after 7 days curing, the second three specimens after 7 days curing plus 1 day immersion in distilled water, and the last three after 28 days curing. After each specimen was molded, it was wrapped in wax paper to reduce loss of moisture and placed in a humidity room for curing. The relative humidity and temperature maintained were 95 + 5 percent and 71 + 4 F.
The imconfined compressive strength test was made at a constant rate of loading of 0.1 in. per min. The strength and density values reported are averages of three test specimens.
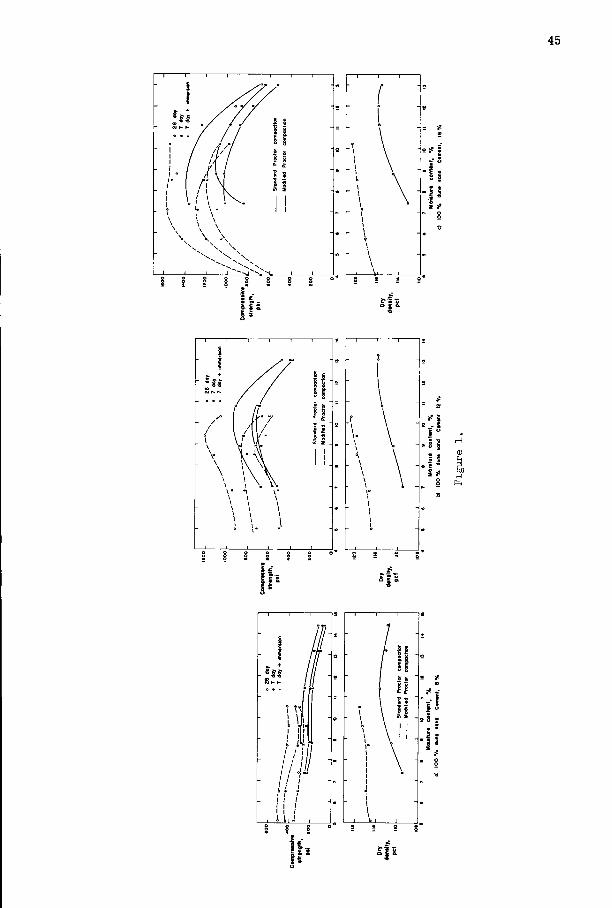
RESULTS Moisture-Density-Strength Relationships
TABLE 2 The data obtained are presented in
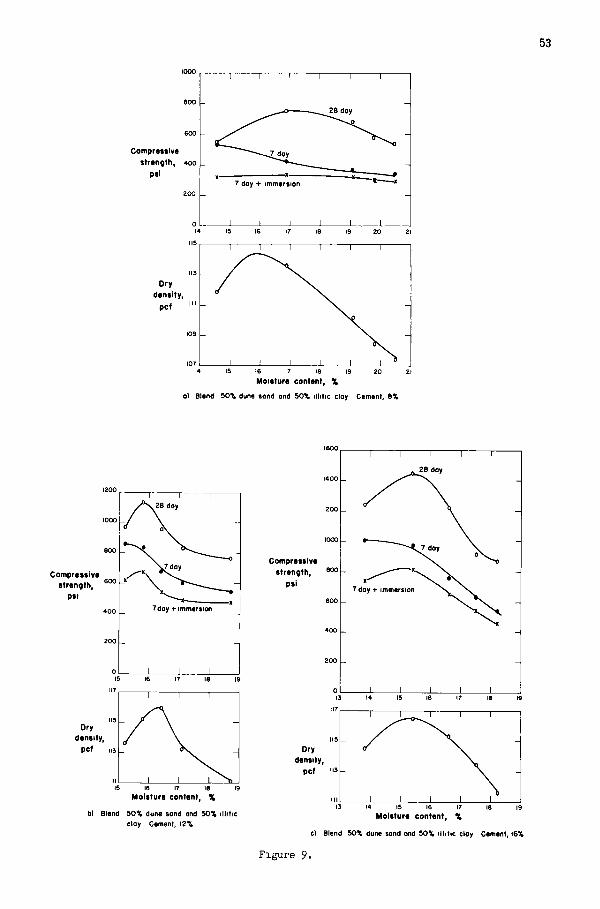
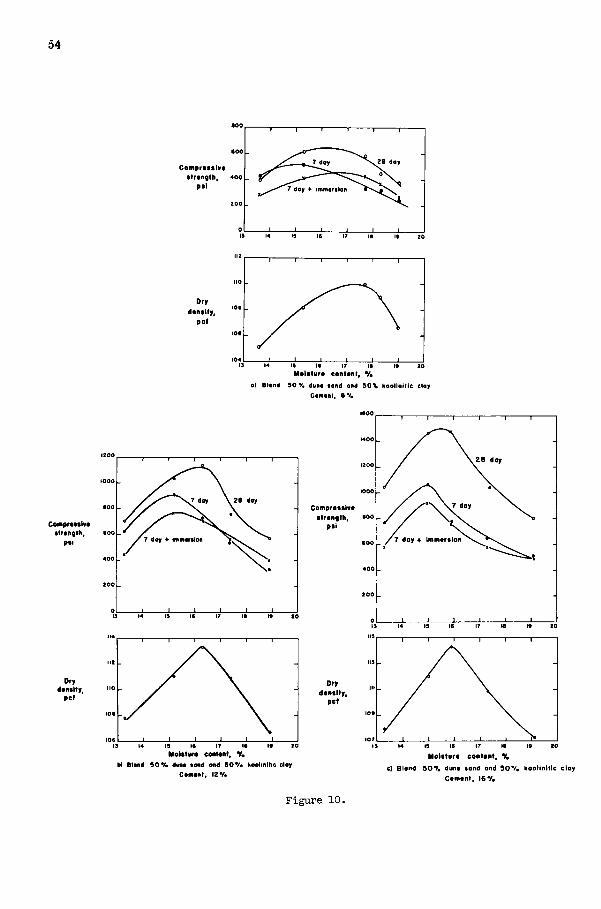
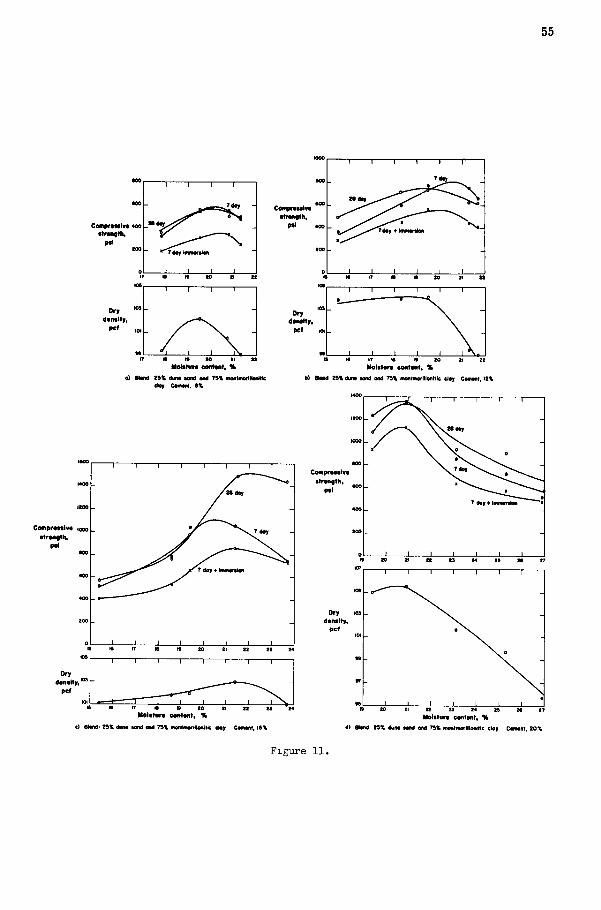
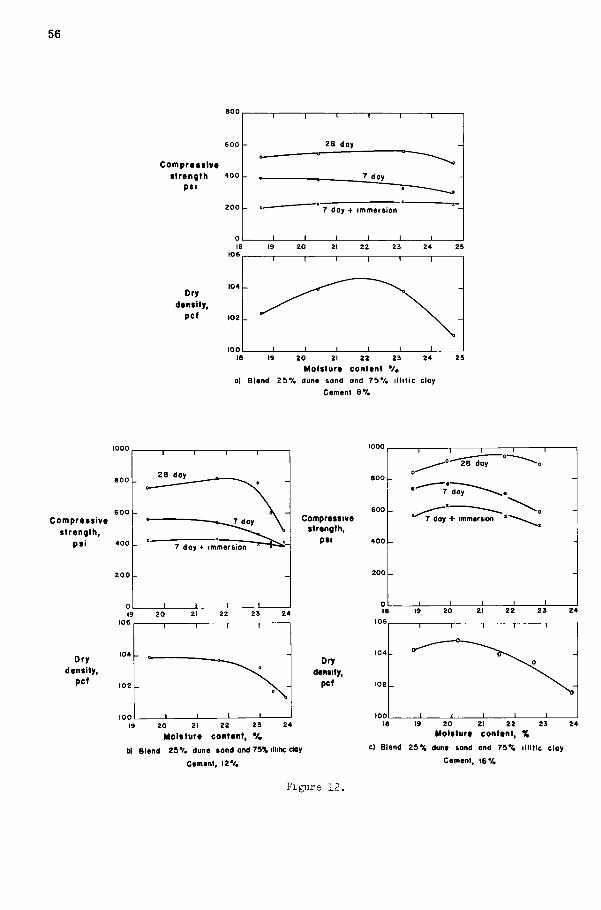
Figures 1 through 13. For a given mix- SAND-CLAY MIXTURE PROPORTIONS ture the same moisture content does not ^e^nd (% by wt ) Clay (% by wt.) necessarily give both maximum density and maximum strength. The moisture contents for maximum strength are generally on the dry side for the sand-clay mixtures dominant in sand, and on the wet side for mixtures dominant in clay (Table 3).
100 0 75 25 50 50 25 75
0 100
45
11'
46
Stondord Proctor coinpoctton
H M I f l a d Proctor aMwact iof i
C o t n p r n t i v t « o | _
• t r t f i « H i , > T d O T « i n i M n i o n • Tdoy o Z S d o y
I I
M O i t t u r t COTtOTl, %
0) I O O % ow imor l l lo i i i t l c clo> U M M , a %
C e n p r a n l v t
• t r M « M i ,
P t i
0 2 6 M >
Orir I t M i i ]
p c f
Mo ls t i i f t c o n t a n t , %
b) n O X monnioraoi i l t ic cloy C « M M . 12%
C e n v r M t n *
• t r M t l k ,
p D
I ' , ' - J . — I 1 L_
t O » t4 20 20
Dnr
p e l
d 1 0 0 % l o m l l l n l l l c d o * C O M M . W X
U 34
F i g u r e 2.
47
C9Mpr««i1«a
_ i I L L_ M M i i t . r7
—! 1 1 T"
l« la t im CMtMt, %
) 100% lllltlcetoy C«Mn( a%
_ J I (_
U tOO% iiiihc e>Br C«»««i iz%
- 1 1 1 -- r — \ n
t ) 100% HKtie clar CwMal, 16%
Figure 3.
48
C o m p r t M t v t • t r M g t h ,
pt t 400
Standord Proctor compoctlon
Modtflod Procter eompoction
4 T boy 4-immortion • 7 doy
~ ^ 0 28 doy
d m d t y
M o l i l u r t c o n t t i i t , X
0) 100% koolinitic cloy Cifflont, 8 %
I I I I
K 7 day + immcriion
• 7 doy
o 28 doy
M s i K u r t eontpnt
b) 1 0 0 % koolinitic doy Coioont, 1 2 %
C o m p r o M i v t • t r • n g t ^
p t i
. 2 8 doy » 7 doy • 7 doy + inmoriion
23 25 2T 29
d t m l t y
M o l t t u r t c o n l M t , %
d 100% koolinitic cloy Comont. 1 6 %
Figure h.
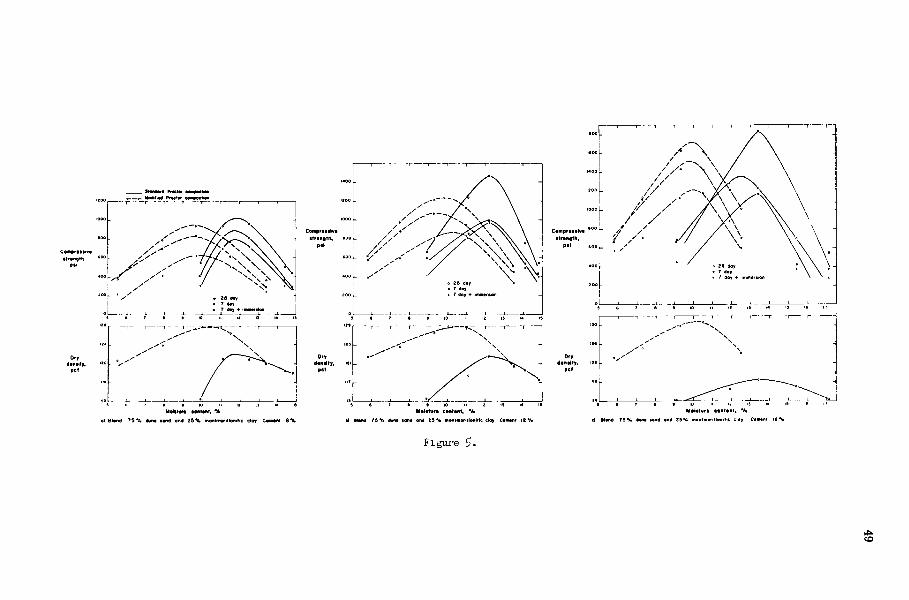
Figure 5.
to
o
N> 1 M Moiimn caiMiil. %
U O M ' 79% duM MMd and 23% dlil.G day Camwit 12% e) OlMMt: TS% d 1 29% illilic cloy CmntfH I
Figure 6.
/ / / /
. ! • Mr
-J J r i l l It II
I M l t w t « M t M r t . %
•) W W * T 5 % « M M M M « I » X kMlWtk titf CWMI CMlani. X
Figure 7.
52
Comprot t lvo • l i o o t t h , , 0 0
•••I
Or» dmol ly ,
o c l
28 day
Comprootlvo ttroflglh, too
Pfl
Dry dooally,
p e l
H o K l o r o C M I M I , y .
H BMnd: 9 0 V . OuM •onO OM 90 V . moMmorlllonic cloy C M I M I I , S V .
Hoit tur t eofiloiit, V .
H BIMd 9 0 V . dun* land dnd 5 0 V . montmonllonftle eldy CMidiit, 12 V .
Comprot t lvo . l r . . , » ,
P t I
Dry dootlty.
p e l
C e m p r i i i i v o
•iroMoth. p i l
Dry
O n i l l y ,
pcf
Motitoro cootoiit , %
BIMd 50 V . dim* tond and 50 V . MMtiMrtnoiiitic cloy
Cdmdiit, 1 0 %
Hoi l turo conlant , V . d) Blend 5 0 V . dunt land and 9 0 V . menlmorilldmtic clay
Camnnt, 2 0 %
Figure 8.
53
CompreMlve strength, 4 0 o
psi
200
T r-
28 day
7 day + immersion
deneity
16 16 17 IS 19 20
Moisture content, %
0) Blend 50% dune sand and bOX illitic cloy Cement, 8%
Compressive strengtti,
P«i 7doy + immersion
density,
Moisture content, %
bl Blend SOX duns sand and SOX illitic cloy Cement, 12 X
Compressive strength.
psi 7doy
density
15 16 17 18 19
Moisture content, %
c) Blend SOX dune sand ond SOX illitic cloy Cement, I6X
Figure 9.
54
• 0 0
C o f f l p r d t t l v t • t r t o g l h , 4 0 0
p t I
2 0 0
~ i I I 1 r -
28 doy
- J 1 1 I 1_ IS 14 19 It 17 IS l> 20
D r y
p e l
M o l t t u r t c o n l n l , V .
0) B lond 5 0 % dune tond ond 5 0 % k o o l i n i t i c cloy
C o m p r o M h r o t t r t n g t h , ooo
p t i
4 0 0
Dry d t n i l t y ,
p e l
_ J I I I 1 L_
C o m p r i i t i v t • t r o i i g t h , 000
p t i
M o U t a r a e o o t M t , V .
U e iMd 9 0 % dwio tond ond 9 0 V . koolinitic cloy
C o m a n t , i Z V .
D r y d o i i i l l y ,
• c l
~l 1 1 T"
M a l d l i i r o e o n t t p t , %
c) B l o n d 5 0 7 . d u n t f o n d and 5 0 * / . k o o l i n i t i c c l o y
C t m t n t , 1 6 %
Figure 10.
55
T 1 1 T
O r , d i m i t y ,
P C '
Coinpf#vt lv# 1000
• t r u g m ,
to M o l s t u n content) ^
t S X U n a aond aid r n
M o l l t u n c o n t M t , «
ej Btond- 2SX Son* Mod md T5X monlmonltonillc cl«y CWMnt, I6X
•MMIh,
_ l I I I L . I t to tl t t
Dry d m t l t y ,
pet n
_ l [_ I t I t IT I t I * to 21 22
Molt turt C M t M t . %
U Mtnd » X dura lond ond nx nonniiorilloiiltlc d o i CuraM. I2X
i«o
C o m p r n t l v d t t r t t igth,
PtI
Dry ddi i i l ty ,
p e t
Ms l i tu ra coMMit, %
d) B i M H X dura idiid Odd nx iraMmorilldnllc cloy
Figure 11.
56
Compretslv* strength *oo
psi
Dry density,
pcf
28 day
7 day
7 day + immersion
20 21 22 23 24 Moisture content ' / ,
o) Biend 25% dune sand ond 7 5 % i l l i t ic cloy Cement BV.
102 L
600 Compressive
strength, ps i «oo
19 106
Dry density,
pcf
100
28 day
7 doy + immersion
600 Compressive
strength, psi 400
Dry density,
pcf
19 20 21 22 23 Moisture content, */.
bl Blend 25V. dune sond and 75X illitic day
Cement, 12*/.
28 day
7 doy + immersion "
19 20 21 22 23 Moisture content, %
c) Blend 25% dune sond and 7S% ill i t ic cloy
Cement, I6V.
Figure 12.
57
Comprntlvt ttrtngth,
P»l
28 day
7doy t immoroion
dtntity.
Moit tur i content, %
0) Blend 25% duno sond and 75% koolinitic cloy Comont, 8%
Compratslvt strength,
pti
1 1 S ^ 8 doy 1
>_7day
7 day t » _
immtrsion
1 1 1 1 1
deneity, "
Compretilve strength,
ptI 4 0 0
21 22 2 3 24 29 26 27
Moisture content, X
b) Blond 25% dun« oand ond 75% kaolmitic cloy Cemont, 12%
density.
Moisture content, %
c) Bland 25% duno sond and 75% koolinitic clay Comont, 16%
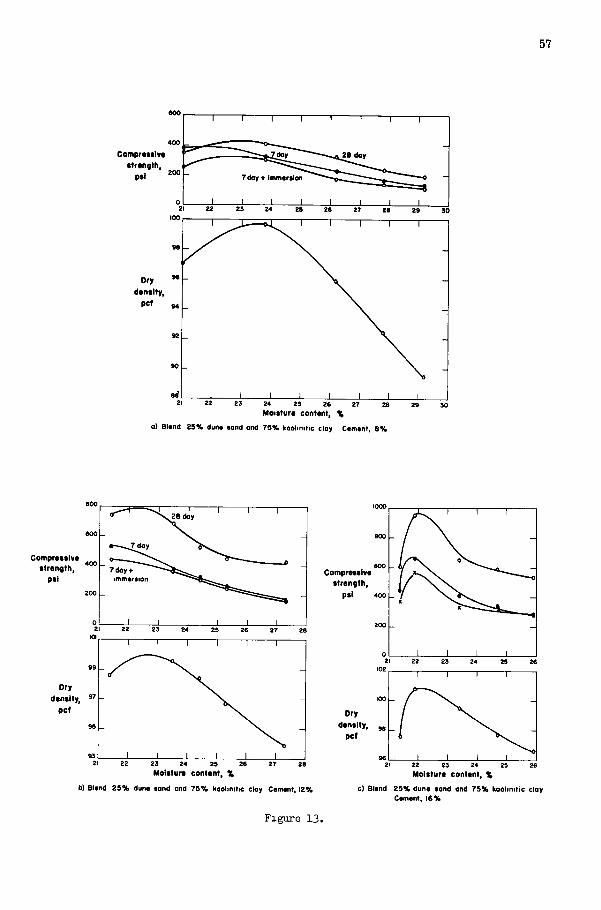
Figure 13.
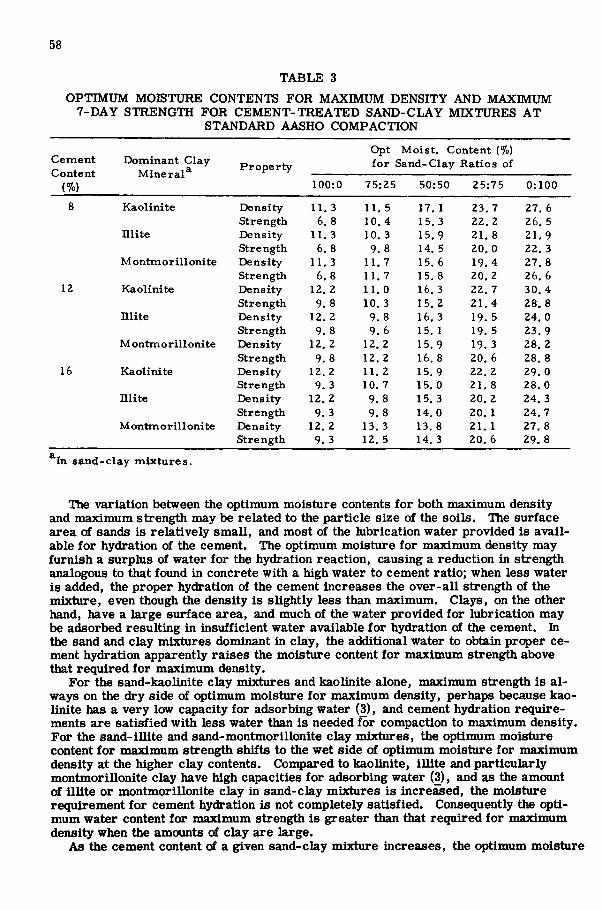
58
TABLE 3 OPTIMUM MOISTURE CONTENTS FOR MAXIMUM DENSITY AND MAXIMUM
7-DAY STRENGTH FOR CEMENT-TREATED SAND-CLAY MIXTURES AT STANDARD AASHO COMPACTION
C e m e n t C o n t e n t
D o m i n a n t Clay-M i n e r a l ^
Proper ty -
Opt M o i s t . C o n t e n t (%) f o r S a n d - C l a y R a t i o s of
(%) 100:0 75:25 50:50 25:75 0:100
8 K a o l i n i t e Density- 11. 3 11. 5 17. 1 23 . 7 27. 6 S t reng th 6. 8 10. 4 15. 3 22 . 2 26. 5
n i i t e D e n s i t y 11. 3 10. 3 1 5 . 9 21. 8 21. 9 S t reng th 6. 8 9. 8 14. 5 20, 0 22 . 3
M o n t m o r i l l o n i t e D e n s i t y 11. 3 11. 7 15. 6 19. 4 27, 8 S trength 6, 8 11, 7 15. 8 20. 2 26. 6
12 K a o l i n i t e D e n s i t y 12. 2 11. 0 16. 3 22 . 7 30. 4 S trength 9. 8 10. 3 1 5 . 2 21. 4 28 . 8
n i i t e D e n s i t y 12. 2 9. 8 16. 3 19. 5 24. 0 S t reng th 9. 8 9. 6 15. 1 19. 5 23 . 9
M o n t m o r i l l o n i t e D e n s i t y 12. 2 12. 2 15. 9 19. 3 28. 2 S t reng th 9. 8 12. 2 16. 8 20, 6 28. 8
16 K a o l i n i t e D e n s i t y 12. 2 11. 2 15. 9 22 . 2 29. 0 S t reng th 9. 3 10. 7 15, 0 21, 8 28. 0
n i i t e Density- 1 2 . 2 9 . 8 15. 3 20. 2 24. 3 S t reng th 9. 3 9. 8 14. 0 20, 1 24. 7
M ontm o r i l l onite D e n s i t y 12. 2 13. 3 13. 8 21 . 1 27. 8 S t r e n g t h 9. 3 12. 5 14. 3 20 . 6 29 . 8
In s a n d - c l a y m i x t u r e s .
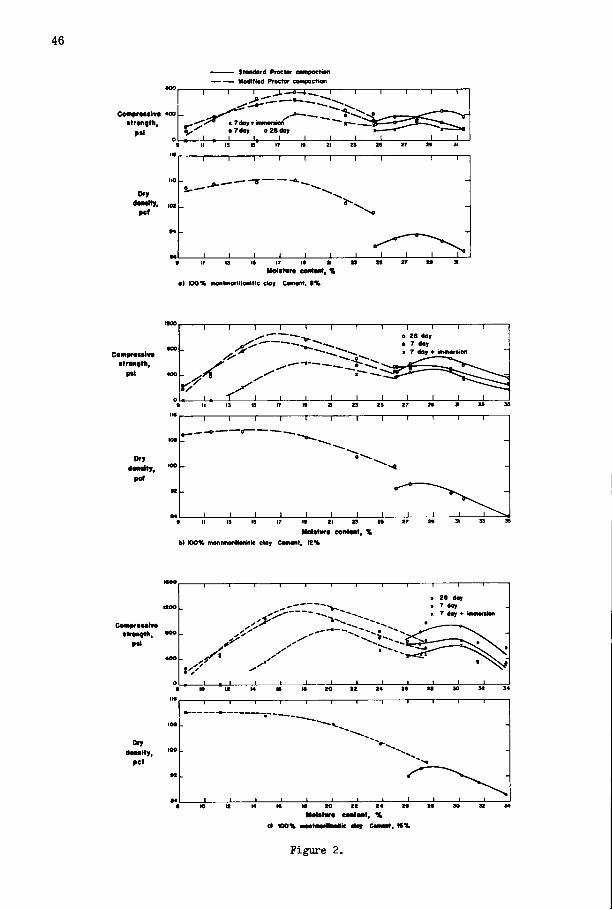
The variation between the optimum moisture contents for both maximum density and maximum strength may be related to the particle size of the soils. The surface area of sands is relatively small, and most of the lubrication water provided is available for hydration of the cement. The optimum moisture for maximum density may furnish a surplus of water for the hydration reaction, causing a reduction in strength analogous to that found in concrete with a high water to cement ratio; when less water is added, the proper hydration of the cement increases the over-all strength of the mixture, even though the density is slightly less than maximum. Clays, on the other hand, have a large surface area, and much of the water provided for lubrication may be adsorbed resulting in insufficient water available for hydration of the cement. In the sand and clay mixtures dominant in clay, the additional water to obtain proper cement hydration apparently raises the moisture content for maximum strength above that required for maximum density.
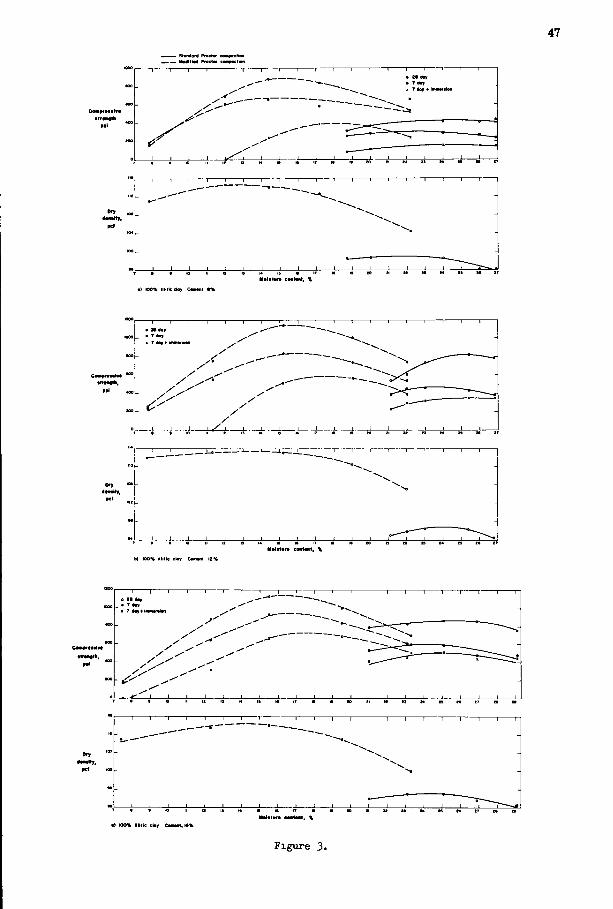
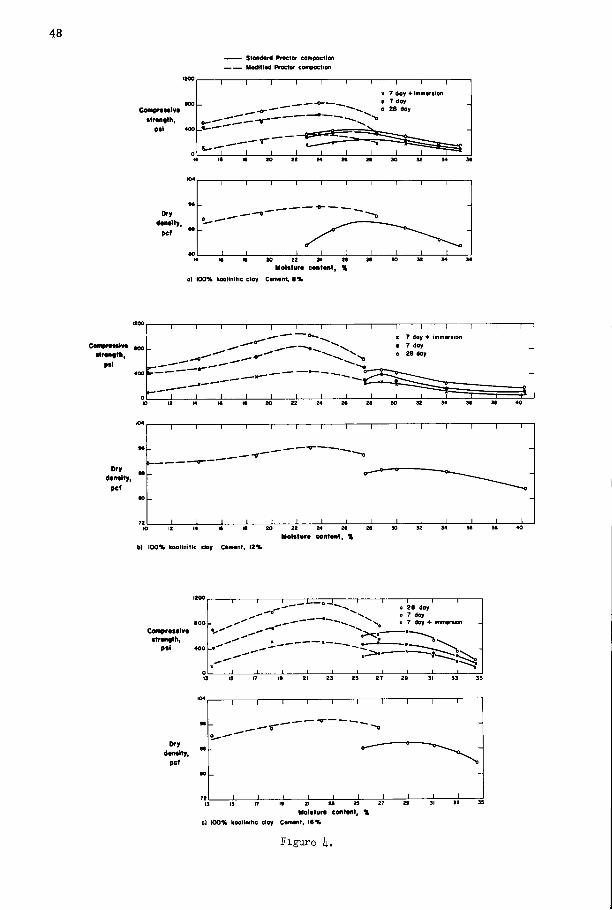
For the sand-kaolinite clay mixtures and kaolinite alone, maximum strength is always on the dry side of optimum moisture for maximum density, perhaps because kaolinite has a very low capacity for adsorbing water (3), and cement hydration requirements are satisfied with less water than is needed for compaction to maximum density. For the sand-illite and sand-montmorillonite clay mixtures, the optimum moisture content for maximum strength shifts to the wet side of optimum moisture for maximum density at the higher clay contents. Compared to kaolinite, illite and particularly montmorillonite clay have high capacities for adsorbing water (3), and as the amount of il l i te or montmorillonite clay in sand-clay mixtures is increased, the moisture requirement for cement hydration is not completely satisfied. Consequently the optimum water content for maximum strength is greater than that required for maximum density when the amounts of clay are large.
As the cement content of a given sand-clay mixture increases, the optimum moisture
59
for maximum density and the optimum moisture for maximum strength does not change much. This suggests that the water necessary for hydration of cement may be small in comparison with the amount needed to obtain a maximum density.
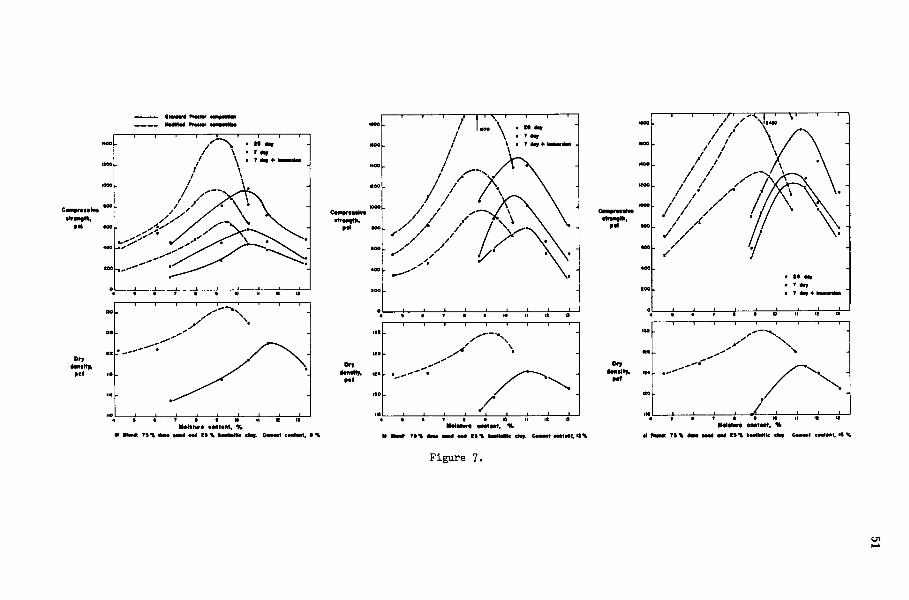
Strength Increase Between 7 and 28 Days The strength increase in the early curing period is important. The maximum
strengths at 28 days are 100 to 160 percent of those at 7 days (Figs. 1 to 13 and Tables 4 and 5). No definite relationship is found between the strength increase and type of clay or other factors. However, the strength increase of the montmorillonite clay mixtures is generally less than that shown by the ilUte or kaolinite clay mixtures. This may be due to the greater affinity for water of montmorillonite clay, and a resultant shortage of water for cement hydration reactions.
Immersed and Unimmersed Strengths Because stabilized soil courses in a pavement may become saturated, specimens
cured for 7 days were tested in both immersed and unimmersed conditions. The 2-by 2-in. specimens were at near saturation moisture content after immersion in distilled water for 24 hr.
The vmimmersed specimens have maximum strengths of from one to two times those of the corresponding immersed specimens (Figs. 1 to 13 and Tables 4 and 5). The ratio of unimmersed to immersed maximum strength vai-ies with the type and amount of clay in the mixture, cement content, and the kind of compaction. Every mixture tested gives a different ratio of unimmersed to immersed strength. However, with standard AASHO compaction, mixtures with illite clay are more susceptible to immersion than mixtures made with either of the other two clays.
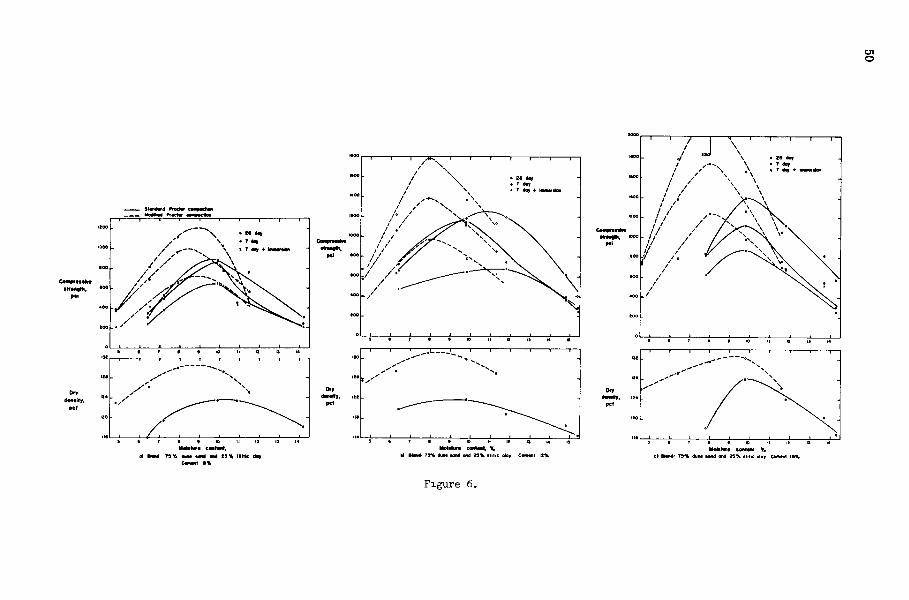
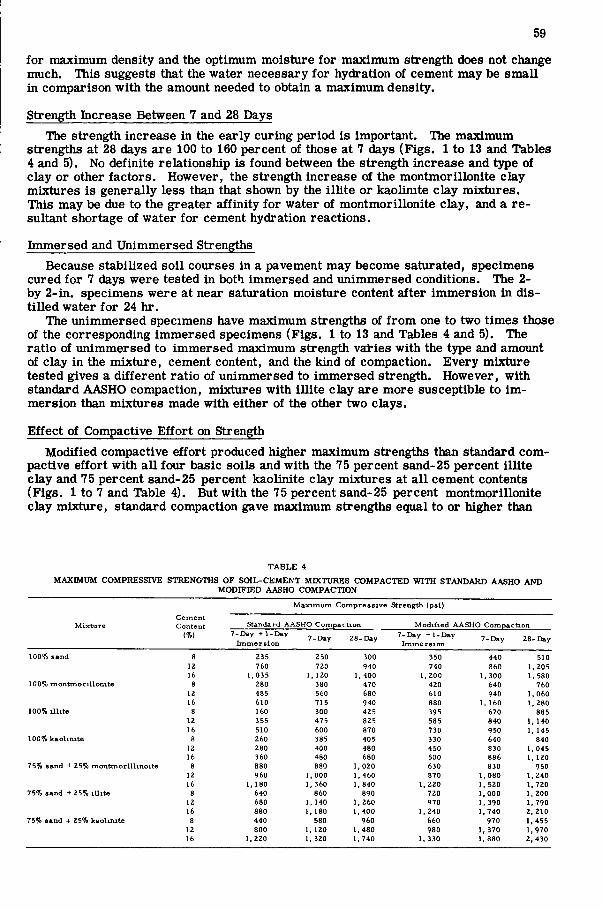
Effect of Compactive Effort on Strength Modified compactive effort produced higher maximum strengths than standard com
pactive effort with all four basic soils and with the 75 percent sand-25 percent illite clay and 75 percent sand-25 percent kaolinite clay mixtures at al l cement contents (Figs. 1 to 7 and Table 4). But with the 75 percent sand-25 percent montmorillonite clay mixture, standard compaction gave maximum strengths equal to or higher than
T A B L E 4
MAXIMUM COMPRESSIVE STRENGTHS OF SOIL-CEMENT MIXTURES COMPACTED WITH STANDARD AASHO AND MODIFIED AASHO COMPACTION
M a x i m u m C o m p r e s s i v e Strength (psi)
Cement Mixture Content Standard A A S H O C o m paction Modif ied A A S H O Comp action
(%) 7 -Day + 1-Day I m m e r s i o n
7 -Day 2 8 - D a y 7 . Day + 1-Day 7 -Day 2 8 - D a y 7 -Day + 1-Day
I m m e r s i o n 2 8 - D a y
I m m e r s i o n 7 -Day 2 8 - D a y
100% sand 8 235 250 300 350 440 510 12 760 720 940 740 860 1, 205 16 1,035 1, 120 1, 400 1, 200 1, 300 1, 580
100% montmori l loni te 8 280 380 470 420 640 760 12 485 560 680 610 940 1, 060 16 610 715 940 880 1, 160 1, 280
100% i l h t e 8 160 300 425 395 670 885 12 355 475 825 585 840 1, 140 16 510 600 870 730 950 1, 145
100% kaolinite 8 260 385 405 330 640 840 12 280 400 480 450 830 1, 045 16 360 480 680 500 886 1, 120
75% sand + 25% montmori l l ino i te 8 880 880 1, 020 630 830 950 12 960 1, 000 1, 460 870 1, 080 1, 240 16 1, 180 1, 360 1, 840 1, 220 1, 520 1, 720
75% sand + 25% i l l i te 8 640 860 890 720 1,000 1, 200 12 680 1, 140 1, 260 970 1, 390 1, 790 16 880 1, 180 1, 400 1, 240 1, 740 2, 210
75% sand + 25% kaolinite 8 440 580 960 660 970 1, 455 12 800 1, 120 1, 480 980 1, 370 1, 970 16 1, 220 1, 320 1, 740 1, 330 1, 880 2, 430
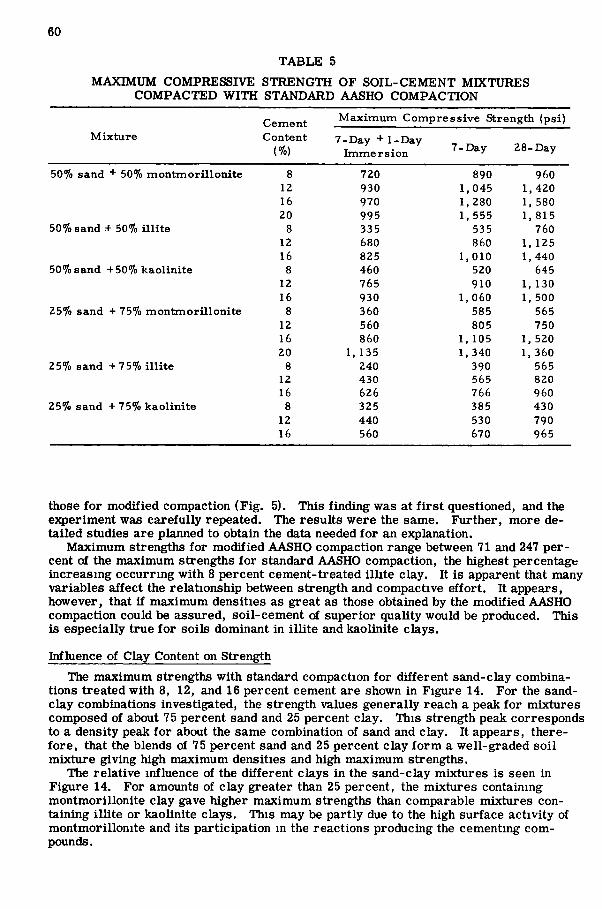
60
TABLE 5 MAXIMUM COMPRESSIVE STRENGTH OF SOIL-CEMENT MIXTURES
COMPACTED WITH STANDARD AASHO COMPACTION
Mixture Cement Content
(%)
Maximum Compress ive Strength (psi)
7-Day + 1-Day-Immers ion 7-Day 28-Day
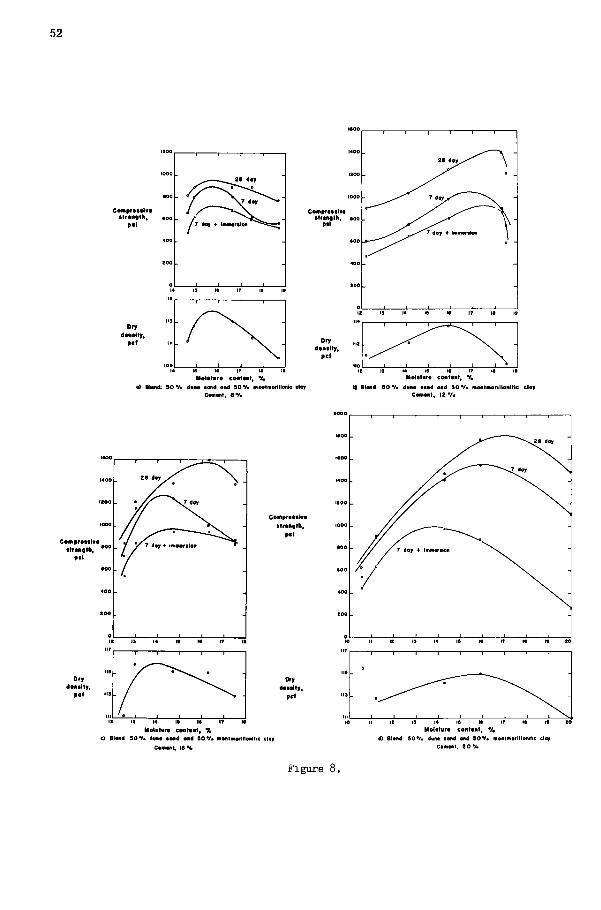
50% sand + 50% montmorillonite 8 720 890 960 12 930 1, 045 1, 420 16 970 1, 280 1, 580 20 995 1, 555 1, 815
50% sand + 50% illite 8 335 535 760 12 680 860 1, 125 16 825 1, 010 1, 440
50% sand +50% kaolinite 8 460 520 645 12 765 910 1, 130 16 930 1, 060 1, 500
25% sand + 75% montmorillonite 8 360 585 565 12 560 805 750 16 860 1, 105 1, 520 20 1, 135 1, 340 1, 360
25% sand + 75% il l ite 8 240 390 565 12 430 565 820 16 626 766 960
25% sand + 75% kaolinite 8 325 385 430 12 440 530 790 16 560 670 965
those for modified compaction (Fig. 5). This finding was at f i rs t questioned, and the experiment was carefully repeated. The results were the same. Further, more detailed studies are planned to obtain the data needed for an explanation.
Maximum strengths for modified AASHO compaction range between 71 and 247 percent of the maximum strengths for standard AASHO compaction, the highest percentage increasing occurring with 8 percent cement-treated illite clay. It is apparent that many variables affect the relationship between strength and compactive effort. It appears, however, that it maximum densities as great as those obtained by the modified AASHO compaction could be assured, soil-cement of superior quality would be produced. This is especially true for soils dominant in illite and kaolinite clays.
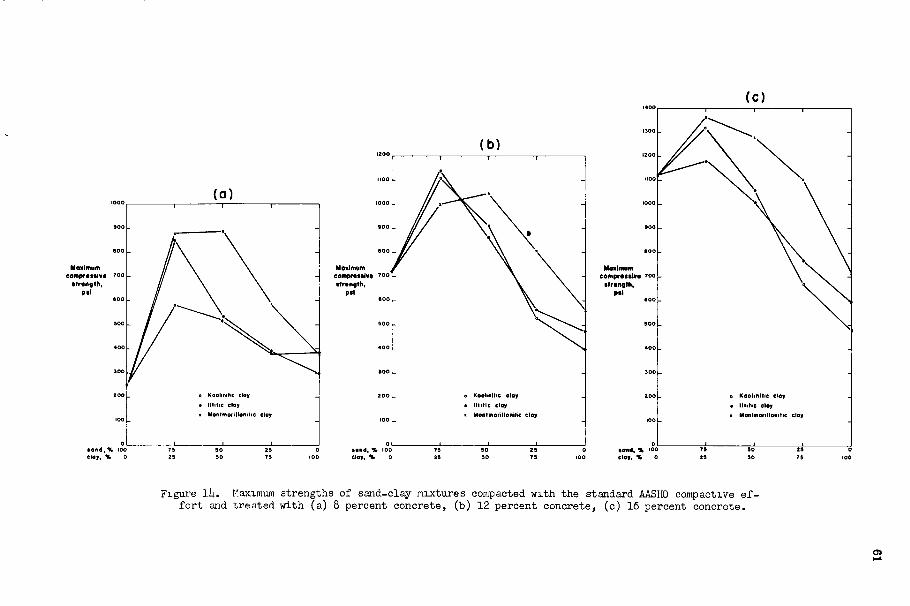
Influence of Clay Content on Strength The maximum strengths with standard compaction for different sand-clay combina
tions treated with 8, 12, and 16 percent cement are shown in Figure 14. For the sand-clay combinations investigated, the strength values generally reach a peak for mixtures composed of about 75 percent sand and 25 percent clay. This strength peak corresponds to a density peak for about the same combination of sand and clay. It appears, therefore, that the blends of 75 percent sand and 25 percent clay form a well-graded soil mixture giving high maximum densities and high maximum strengths.
The relative influence of the different clays in the sand-clay mixtures is seen in Figure 14. For amounts of clay greater than 25 percent, the mixtures containing montmorillonite clay gave higher maximum strengths than comparable mixtures containing illite or kaolinite clays. This may be partly due to the high surface activity of montmorillonite and its participation in the reactions producing the cementing compounds.
Moximunn comprttsiv* oo
ttrtngth, Pti
eoo
• o n d , % 100 Cloy. % 0
Koolinitte cloy IMittc cloy Monlffiorillonitic cloy
eoo
Moximum comprMtivt ^oo ttrtngth.
pti
Koolinltic cloy untie clay Montmorillonltic cloy
800
Moximum eompraitivt 7oo
•trvngth. PS)
600
Koolinltic cloy llhhc cloy Monlmorillonitic cloy
S O H d , % 100 Cloy. % o
*aii«, % 100 cloy, % o
Figure Ih. Kaximum strengths of sand-clay nixtures compacted with the standard AASHO compactive e f fort and treated with (a) 8 percent concrete, (b) 12 percent concrete, (c) 16 percent concrete-
62
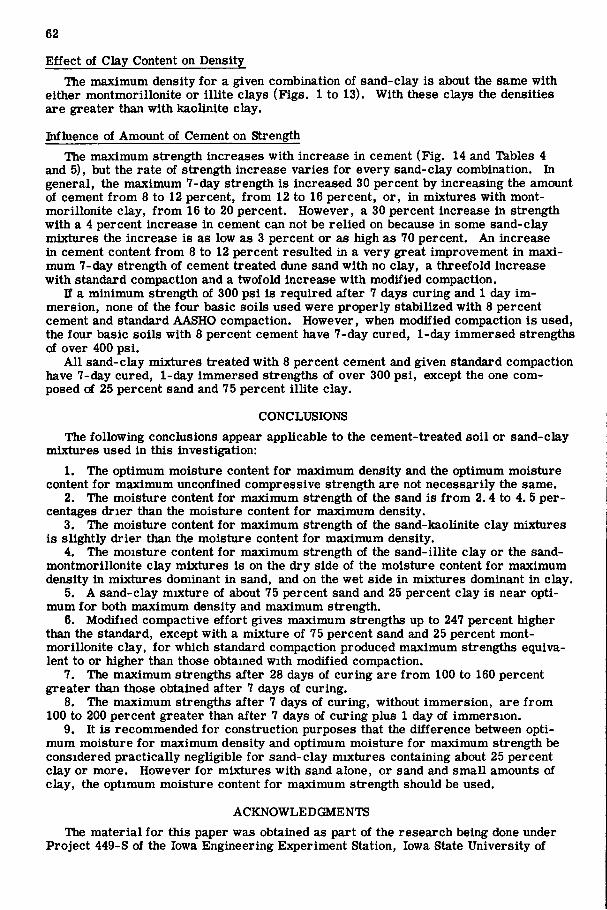
Effect of Clay Content on Density The maximum density for a given combination of sand-clay is about the same with
either montmorillonite or illite clays (Figs. 1 to 13), With these clays the densities are greater than with kaolinite clay.
faf luence of Amount of Cement on Strength The maximum strength increases with increase in cement (Fig. 14 and Tables 4
and 5), but the rate of strength increase varies for every sand-clay combination. In general, the maximum 7-day strength is increased 30 percent by increasing the amount of cement from 8 to 12 percent, from 12 to 16 percent, or, in mixtures with montmorillonite clay, from 16 to 20 percent. However, a 30 percent increase in strength with a 4 percent increase in cement can not be relied on because in some sand-clay mixtures the increase is as low as 3 percent or as high as 70 percent. An increase in cement content from 8 to 12 percent resulted in a very great improvement in maximum 7-day strength of cement treated dune sand with no clay, a threefold increase with standard compaction and a twofold increase with modified compaction.
H a minimum strength of 300 psi is required after 7 days curing and 1 day immersion, none of the four basic soils used were properly stabilized with 8 percent cement and standard AASHO compaction. However, when modified compaction is used, the four basic soils with 8 percent cement have 7-day cured, 1-day immersed strengths of over 400 psi.
Al l sand-clay mixtures treated with 8 percent cement and given standard compaction have 7-day cured, 1-day immersed strengths of over 300 psi, except the one composed of 25 percent sand and 75 percent illite clay.
CONCLUSIONS The following conclusions appear applicable to the cement-treated soil or sand-clay
mixtures used in this investigation: 1. The optimum moisture content for maximum density and the optimum moisture
content for maximum unconfined compressive strength are not necessarily the same. 2. The moisture content for maximum strength of the sand is from 2.4 to 4. 5 per
centages drier than the moisture content for maximum density. 3. The moisture content for maximum strength of the sand-kaolinite clay mixtures
is slightly drier than the moisture content for maximum density. 4. The moisture content for maximum strength of the sand-illite clay or the sand-
montmorillonite clay mixtures is on the dry side of the moisture content for maximum density in mixtures dominant in sand, and on the wet side in mixtures dominant in clay.
5. A sand-clay mixture of about 75 percent sand and 25 percent clay is near optimum for both maximum density and maximum strength.
6. Modified compactive effort gives maximum strengths up to 247 percent higher than the standard, except with a mixture of 75 percent sand and 25 percent montmorillonite clay, for which standard compaction produced maximum strengths equivalent to or higher than those obtained with modified compaction.
7. The maximum strengths after 28 days of curing are from 100 to 160 percent greater than those obtained after 7 days of curing.
8. The maximum strengths after 7 days of curing, without immersion, are from 100 to 200 percent greater than after 7 days of curing plus 1 day of immersion.
9. It is recommended for construction purposes that the difference between optimum moisture for maximum density and optimum moisture for maximum strength be considered practically negligible for sand-clay mixtures containing about 25 percent clay or more. However for mixtures with sand alone, or sand and small amounts of clay, the optimum moisture content for maximum strength should be used.
ACKNOWLEDGMENTS The material for this paper was obtained as part of the research being done under
Project 449-S of the Iowa Engineering Experiment Station, Iowa State University of

63
Science and Technology, Project 449-S is under contract with the Iowa Highway Research Board of the Iowa State Highway Commission as their Project HR-82.
REFERENCES 1. Felt, E.J . , "Factors Influencing Some of the Physical Properties of Soil-Cement
Mixtures." HRB Bull. 108, 138-162 (1955). 2. Goecker, W. L . , Moh, Z, C., Davidson, D. T. , and Chu, T. Y. , "Stabilization of
Fine and Coarse-Grained Soils with l ime-Fly Ash Admixtures." HRB Bull. 129, 63-82 (1956).
3. Grim, R.E. , and Cuthbert, F. L . , "The Bonding Action of Clays, " University of Illinois Engr, Exp, Sta, Bull, 50 (1945),
4. Ruff, C. G., and Davidson, D. T. , "Lime and Sodium Silicate Stabilization of Mont-morillonite Clay Soil." HRB Bull. 304, 76-92 (1961).
5. Viskochil, R. K . , Handy, R. L , , and Davidson, D. T., "Effect of Density on Strength of Lime-Fly Ash StabiUzed Soil, " HRB Bull, 183, 5-15 (1957),