Embed Size (px)
Citation preview

Experience Ingenuity.
Integrated Reporting | A New Erafor Public Sector Entities in South Africa
© Nkonki Proprietary 2015

SOC* Integrated Reporting Awards 2015
* Schedule 2 State Owned Companies in terms of the Public Finance Management Act 1 of 1999
Disclaimer
This document is proprietary to Nkonki and the information herein is confidential. It is supplied in confidence and should not be disclosed, duplicated or otherwise revealed in whole or in part to any third parties without the prior written consent of Nkonki.

Executive Summary
IIRC Foreword
Research Findings and Results
Chapter 1:
Global Learnings – Integrated Reporting In Public Sector Organisations
Chapter 2:
Applying the Nkonki Maturity Chart
Chapter 3:
A Practical Guide –The Roadmap to Excellent Integrated Reporting
Chapter 4:
Purpose and Research Methodology
Chapter 5:
Schedule 2 State Owned Companies Reports Analysed
Annexure A:
Glossary of Terms
Annexure B:
Bibliography
Annexure C:
5
1
9
19
25
31
39
41
42
43
Introduction 3

© Nkonki Proprietary 2015
Integrated Reporting – A New Era
| 1
Integrated Reporting – A New Era
These are all crucial attributes that public sector entities must develop if they are going to thrive in the 21st century. There are few that would disagree that changes to corporate reporting are necessary for improving performance in these areas, and the innovation of companies leading the way in evolving their reporting practices are beacons as others start the journey towards <IR>.
This is especially true in South Africa. Companies (public and private) look to leaders such as Transnet and Eskom as examples of how to develop reporting practices, and best reap the benefits by doing so. As this report articulates, <IR> is relatively new, so no company can be said to have totally and comprehensively implemented <IR>. But there are some that have certainly come a long way and companies in South Africa are very much at the forefront.
The International <IR> Framework was the culmination of three years’ development and consultation. It drew on the learnings of integrated reports in South Africa, and was piloted by many companies in South Africa and internationally who ensured that it was aligned to the needs of businesses, who have been let down by traditional reporting systems. Since 2010 companies listed on the Johannesburg Stock Exchange (JSE) have been required to prepare integrated reports because the principles of King III (which include the preparation of integrated reports) fall into the Listing Requirements on an apply or explain basis. Today, five years on, as this report demonstrates it is not only the listed companies that prepare integrated reports – unlisted, NGOs and state-owned enterprises prepare integrated reports as a discipline to ensure good governance and improved corporate reporting.
The acknowledged benefits of <IR> to companies in South Africa are widespread. There is no doubt that <IR> has significantly spurred integrated thinking, resulting in better decision-making and improved internal management. As others learn of the benefits this enhanced approach to corporate governance and reporting has brought to South African companies, more and more across the globe are moving towards <IR>.
The Public Sector Pioneer Network (Pioneer Network) has been initiated by the IIRC to explore why and how the public sector should be adopting <IR>. Participants include large public sector entities, such as the United Nations Development Programme, as well as entities such as hospitals and municipalities. The Pioneer Network was launched at a conference convened by the World Bank in November 2014. The World Bank are great advocates of <IR>, with Betrand Badré, Managing Director and World Bank Group Chief Financial Officer saying, “Public sector entities are one of the largest, if not the largest, reporting entities in the world, so the transparency of their financial information is of importance to us all. Integrated Reporting would enable governments and their stakeholders to gain a better understanding of resources available and help them to manage these more effectively.”
The international arena is also quickly recognising the benefits of <IR>, with the B20 – the business forum that advises G20 governments – stating its support for the IIRC to make “corporate reporting more conducive to infrastructure and other long-term investment.” Standard & Poor have warned of a $500 billion annual gap in infrastructure investment – a situation that will affect economies worldwide, and in order to be address it will need investment for the long-term. <IR> can provide the high-quality information in order to allocate efficiently and productively over longer time horizons.
Mark Carney, Chair of the Financial Stability Board and Governor of the Bank of England, has also put <IR> onto the agenda, “By improving reporting requirements for organizations, Integrated
IIRC FOREWORD
Thinking innovatively, communicating clearly, and being accountable.
IIRC FOREWORD

© Nkonki Proprietary 2015
2 |
Reporting can bring additional information, in particular about the longer-term costs of climate change, to feed into markets and inform decision-making and policy-formulation by institutions. If achieved, it will lead to better-informed and more sustainable long-term investment, for the benefit of society.”
I believe the benefits to society outlined by Carney, Badré and the B20 are very much achievable, but there are still a few hurdles that individual companies will need to overcome that equally apply across both the wider public and private sectors. This report has identified many of these – such as producing concise reports. As a recent article in the Wall Street Journal identified, General Electric’s Annual Report is 109,894 words long, which when you consider Harry Potter and the Philosopher’s Stone is 76,944 words, is verbose. General Electric’s Financial Chief himself said, “Not a retail investor on planet Earth could get through it, let alone understand it.” 1
Companies and public sector entities working towards <IR> are part of those that are bucking this trend for long and convoluted integrated reports in order to articulate a clear, concise and integrated story about how all of their resources are creating value over time. As Professor Judge Mervyn King, who spearheaded the development and adoption of <IR> in South Africa, and is the Chair of the IIRC said, “To be accountable and transparent that which we report needs to be understandable. To report in an incomprehensible manner on 99.9% of users of an annual report results in knowledge that is lost in a mass of information. And I’m afraid that’s what we’ve all been guilty of for decades.”
As suggested by the name of the Public Sector Pioneer Network, those involved are pioneers. They are examining the differences of applying <IR> with a public sector backdrop, and how the concepts need to be evolved to reflect the different operating environments.
Reports such as this are vital for keeping momentum up – evaluating and raising awareness of how companies, particularly those with strong links to the public, are developing their reporting practices year on year. It is clear by the response <IR> has garnered across the world that it is here to stay. Public sector entities that have not yet revaluated their reporting practices should take note before they are left behind.
Paul DruckmanCEO, International Integrated Reporting Council
1 http://blogs.wsj.com/cfo/2015/06/02/the-109894-word-annual-report/
“There is no doubt that <IR> has significantly spurred integrated thinking, resulting in better decision-making and improved internal management.”

© Nkonki Proprietary 2015
| 3
Integrated Reporting – A New Era
INTRODUCTION
The Awards were first launched in 2012 in order to understand how State Owned Companies (SOCs)1 in South Africa had embraced the principles of integrated reporting <IR>2 in their reports for the year ended 31 March 2011. The 2013 and 2014 research studies (based on 31 March 2012 and 2013 reports respectively) have followed that first, very successful process in order to not only track progress but to continue to map best practice.
Nkonki is therefore proud to release the results of the fourth annual SOC Integrated Reporting Awards report. The 2015 report provides insights into the extent to which South African SOCs have applied the International Integrated Reporting Council’s (IIRC) International <IR> Framework to their 2014 reports. It reveals both the successes achieved and mistakes made by these companies in the process of moving towards improved and more integrated reporting and disclosure and, as such, provides a standard for other companies, whether public sector or private sector, to follow.
We are confident that you will once again find the insights contained in this report useful, especially in providing guidance and support during the journey towards meeting the requirements of the International <IR> Framework.
Whilst this year’s report is based on the 2014 reports of South Africa’s major SOCs3, and the reports were scored using the same rigorous process of judging and adjudication used for the previous awards, the criteria differ substantially, as explained in the Executive Summary. Readers will also note a change in the structure of the report.
There can be no doubt that <IR> is here to stay, and Nkonki fully supports the adoption of <IR> on a global basis. To bring these global developments into context with South African developments, Nkonki has summarised its roadmap to <IR>
and included the Nkonki maturity chart in this report. While it’s impossible to review the exact road that every company follows to produce its integrated report, it is possible to do an assessment of how mature a company is in terms of this process, based on its current disclosure.
In the 2013 Awards report, we noted that SOCs were already stretching themselves to comply with the Framework, and that some such as Eskom SOC Limited and Transnet SOC Limited were playing a proactive role in influencing and shaping the future of <IR> globally, by participating in the IIRC pilot programme. Since then, the move towards <IR> by private and public sector companies alike has been bolstered by the release of the final International <IR> Framework by the IIRC in December 2013. The guidance provided by this Framework was much-anticipated, and as such there have been high expectations of the annual reports or integrated reports that have been produced since its release.
The SOC included in this report did not have the full benefit of time as they had just three months to become familiar with the International <IR> Framework as they all had March 2014 year-ends. It is not easy to adapt quickly to such a comprehensive change as that brought about by the Framework, with companies having had to prepare well ahead of its release. Companies would also have had to continuously strive for improved maturity – meaning that systems and procedures, controls and information flow would have had to be in place to allow for the production of an integrated report that met the requirements of the Framework.
The results of this year’s Awards are available in the Executive Summary and in Chapter 1, whilst the maturity chart is used in Chapter 3 to measure the maturity of the SOCs in terms of their integrated reports.
Readers should note that no SOC is regarded as fully mature as yet. This is partly due to the relatively short history of <IR> in this regard, as well as other internal factors within the SOCs themselves.
The Framework is also aspirational and so is open to constant and continuous improvement of the standards. Improved maturity should, therefore, always remain an objective.
INTRODUCTION

© Nkonki Proprietary 2015
4 |
Nkonki is grateful as always to the research team led by Anton du Toit and the Monash South Africa team. Their diligent efforts made this report possible. They had to work through all the SOC reports in detail, one of them being 296 pages in length (the previous year’s lengthiest report was 276 pages).
Thuto MasasaPartner
InterestingSTATISTICS
about the Schedule 2 SOCs surveyedAsset base:
2013: exceeded R1 trillion and a
turnover of more than R260 billion2014: exceeded R1.2 trillion and a
turnover of more than R320 billionLengthiest report:
2013: 418 pages | 2014: 296 pages
1 Those listed under Schedule 2 of the PFMA.
2 “<IR>” is the globally-accepted abbreviation for the term “integrated reporting” and is used throughout this publication.
3 Excluding SA Express whose annual report was not ready for assessment.
GUIDE TO THE RATINGS
80% – 100%
70% – 79%
60% – 69%
50% – 59%
0 – 49%
0 20 40 60 80 100
ABCDD
“It is clear that <IR> is here to stay, and Nkonki fully supports the adoption of <IR> on a global basis.”

© Nkonki Proprietary 2015
| 5
Integrated Reporting – A New Era
EXECUTIVE SUMMARY
“Nkonki is pleased to conclude that based on this year’s research results, the integrated reporting of SOCs continues to improve. Despite a much stricter mark plan and new criteria in line with the <IR> Framework, an average score of 54,2% was achieved this year.”
As explained in the Foreword, the final International <IR> Framework was launched in December 2013. There are therefore new global guidelines for developing an integrated report. This is voluntary, except in countries such as South Africa, where it is mandatory for JSE-listed companies.
The 31 March 2014 SOC annual reports were the first which could apply the final Framework. Prior to that, most of the guidance was supplied by the King III Code and Report (2009a and b) and this could only be evaluated through an assessment of how well a company had applied King III in its integrated report.
With this as background, Nkonki decided to change the assessment and mark plan for this year’s report substantially, using only the International <IR> Framework to measure the SOCs against. The 2014 SOC reports were assessed to ascertain whether minimum requirements in respect of the following were adhered to:
• Fundamental concepts• Guiding principles• Content elements• Capitals and business model• Governing stakeholder relationships
Overall the results reflect that, on average, the assessed SOCs exceeded 50% of the expected minimum requirements for 70% of the expected requirements. In simple terms, this means that out of the 11 expected requirements (see Graph 1), the SOCs achieved an average score of more than 50% for eight of the 11 expected requirements, and fell below 50% for three of the 11 expected requirements.
This is reflected in the average performance scores for each category of all the reports assessed as shown in Graph 1 (no comparatives can be provided as the mark sheet structure changed).
EXECUTIVE
SUMMARY
Graph 1 – Average Performance for State Owned Companies
Aver
age
Perf
orm
ance
0
20
40
60
80
100
Stra
tegi
c Fo
cus
71.7% 56.3% 66.9% 66.9% 41.3% 68.5% 100% 45% 55% 11.7% 61%
Conn
ectiv
ity o
f Inf
orm
atio
n
Mat
eria
lity
in Te
rms
of S
take
hold
er D
ealin
gs
Nat
ure
of D
ealin
gs w
ith S
take
hold
ers
Conc
isen
ess
Relia
bilit
y an
d Co
mpl
eten
ess
Cons
iste
ncy
and
Com
para
bilit
y
Conc
epts
: Bus
ines
s M
odel
; Cap
itals
Cont
ent E
lem
ents
: Ris
k, S
trat
egy,
Out
look
, etc
The
WO
W F
acto
r
Layo
ut, L
inka
ges,
Org
anis
atio
n of
Info
rmat
ion

© Nkonki Proprietary 2015
6 |
MEASURING SOC INTEGRATED REPORTING PERFORMANCE (2011 – 2014)
The results in 2013 were groundbreaking since the inaugural Awards, with 10 SOCs qualifying as finalists, and an overall scoring of 50.6%. This is evidenced by the comparison of the inaugural results launched in June 2012 (based on the 2011 reports), and the results of the second Awards in 2013 (based on the 2012 reports).
In 2014, the overall reporting did show some signs of improvement, with the average score improving by 3.6% from the previous year. When we compared those results (based on 2013 reports) to the inaugural results and the 2012 reports, we were pleased to note that there had been some commendable progress, the highlights of which are as follows:
• The number of qualifying finalists more than tripled from three SOCs, to seven SOCs, and finally ten SOCs (on 2011, 2012 and 2013 reports respectively).
• An increase in overall scoring from 40.2% and 46.4% to 50.6%.• A rise in the number of SOCs with GRI reports and declared Application Levels from three
SOCs in 2011 to five SOCs in 2012 and 2013.
Graph 2 – Comparison of 2011, 2012, 2013 and 2014 SOC Integrated Reports
In 2014, the overall reporting did show some signs of improvement with the
average score improving by
3.6%
Perc
enta
ge
0
10
20
30
40
50
60
2011 2012 2013 2014
40.2%46.4%
50.6%54.2%

© Nkonki Proprietary 2015
| 7
Integrated Reporting – A New Era
Whilst there was every expectation of improvement this year (based on the 2014 reports), given the anticipation created by the introduction of the final International <IR> Framework, the reality was that the average performance in the specific categories fluctuated widely.
The best level of performance was in the area of Consistency and Comparability (100%), which means that all 20 SOCs that were assessed did ensure consistency over time, enabling comparisons with other organisations (and with prior years of the same SOC) to the extent this is material to the organisation’s own ability to create value. The second best, with 71.7%, is the disclosure of the strategic focus the company had during the year.
Unfortunately, those results cannot not be directly compared to previous years, due to the changes in the format and allocation of the mark sheets. However, the scores were still relatively good, with an overall scoring of 54.2% and with 30% of the SOCs scoring a level C or higher.
THE WINNERS: We are proud to announce this year’s winners as:
The winners for the 2014 year-end assessed are:
EXECUTIVE SUMMARY
1st Place: Transnet SOC Limited with a B rating
2nd Place: Air Traffic and Navigation Services
Company SOC Limited with a B rating
A GLOBAL PERSPECTIVE
Given the change to the International <IR> Framework, it may well be too early to draw comparisons or conclusions for local SOCs as is noted in this report. However, we believe it does offer a unique opportunity to explore how public sector organisations in other parts of the world are embracing the <IR> Framework.
For this reason we have included in this year’s report examples of how these organisations have experienced the benefits of applying the <IR> Framework, as well as cited examples of their area(s) of excellence in the different elements of the Framework (Chapter 2). We believe this will assist South African SOCs and other entities in their journey towards <IR> as this information does provide some guidance on practical concepts.
3rd Place: Eskom SOC Limited with a B rating
With the release of the International <IR> Framework, <IR> is gaining extraordinary global momentum. The IIRC has formed a new <IR> Business Network supplemented by other groups, including the public sector pioneer network, which was launched in Washington in November 2014, where experts from organisations including the World Bank, United Nations Development Programme (UNDP), UK National Health Service (NHS), the Association of Chartered Certified Accountants (ACCA) and the International Public Sector Accounting Standards Board (IPSASB) gathered to explore why and how the public sector should be adopting <IR>.

© Nkonki Proprietary 2015
8 |
Eskom was the winner in all three years preceding this year, while Transnet has been second twice and in third place once. Telkom, the Industrial Development Corporation of South Africa and Denel have also been regulars in the Top Five since 2011 (see Chapter 1, the overall results table for more details).
All Top Three SOCs are worthy winners and in many instances leaders in the <IR>, financial reporting and sustainability reporting fields.
THE TOP TEN
In the inaugural Awards and in 2012, we had hoped to award the Top Ten winners, but only three SOCs in 2011 and seven in 2012 qualified for recognition as they attained at least 50% of the expected minimum disclosure requirements, and all other SOC’s were below the D rating.
In 2013 a list of the Top Ten finalists was included for the first time for those SOCs attaining at least 50% of the expected minimum disclosure requirements, and they all were rated between B and D (between 60% and 79%).
Those in fourth to tenth place deserve to be congratulated for exceeding the expected minimum disclosure requirements. In particular, the CEF, which improved by eight positions (from 18th to 10th) and Air Traffic and Navigation Services (from 10th to 2nd) should be commended. South African Airways and Broadband Infraco also moved up the ranks substantially, moving from 13th to 6th place and from 14th to 7th place respectively; and both the Airports Company of South Africa and Alexkor improved by four positions (from 12th to 8th and from 16th to 12th respectively).
Although there is no direct link between this year and prior years’ results due to the change in criteria, it would appear that some of the better SOCs in terms of <IR> in the past have deteriorated somewhat in their reporting, which is regrettable. The South African Nuclear Energy Corporation slipped from 8th to 14th position (six places); South African Forestry Company SOC Limited from 6th to 11th position (five places); and Denel SOC Limited from 4th to 9th position (also five places).
APPLICATION OF GRI LEVELS
While this survey focuses on the application of the International <IR> Framework by SOCs, it would be remiss of us not to
mention sustainability reporting. The most dominant reporting framework, guidelines and principles for sustainability reporting are the Global Reporting Initiative (GRI) G4 guidelines (May 2013) – these standards are considered as the most generally accepted (Ballou, Heitger & Landes 2006), and are used voluntarily by organisations for sustainability reporting.
In the previous set of guidelines, G3, there were three application levels – “A”, “B” and “C” (with a “+” sign indicating if some of the Key Performance Indicators (KPIs) in the sustainability report had been assured). The G4 guidelines only make provision for compliance at a “Core” or “Comprehensive” level.
While the International <IR> Framework is silent on the matter, an important point coming out of both the King III Report and the King III Code in Principle 9.3 (IoD, 2009b), is the recommendation that the sustainability report should be independently assured. A company would thus be well advised to follow best practice in this matter, and begin the journey towards having their sustainability report independently assured by starting to apply the GRI G4 guidelines.
Taking the above into account, it was disappointing when conducting this year’s research to find the following:
• Only five SOCs (2013:3 and 2012:3) had an independently-assured sustainability report – some with a declared Application Level and some not.
• Another three SOCs had internal assurance statements, such as from Internal Audit.
• Five of the SOCs mentioned the GRI and the fact that the guidelines were followed, or at least used the Index – there was no reference to any assurance provided on these.
• Six SOCs did not mention the GRI or the guidelines anywhere in their report – however, this is an improvement on the 10 of 2013.
• There is confusion about the use of G3, G3.2 or G4 amongst many of the SOCs. Some even referred to two of the three guidelines.
It is recommended that all the SOCs come to grips with the GRI and the G4 guidelines and also start to seriously consider external sustainability assurance. We also recommend that SOCs apply the latest GRI G4 guidelines to any reports published after 31 December 2015.
B rating
Telkom SA SOC Limited
The Development Bank of Southern
Africa
C rating
Industrial Development Corporation of
South Africa Limited
C rating
South African Airways SOC
Limited
D rating
Broadband Infrastructure
Company (Pty) Ltd
D rating
Airports Company of
South Africa SOC Limited
D rating
Denel SOC Limited
D rating
Central Energy Fund (CEF) SOC
Limited
4th Place(Shared)
5th Place
6th Place
7th Place
8th Place
9th Place
10th Place

© Nkonki Proprietary 2015
| 9
Integrated Reporting – A New Era
54.2%for this overall category of
indicates a good start.”
“For an initial application of the <IR> Framework, the
average score of
CHAPTER 1
1.1 The <IR> Framework Total Score Analysis
In addition there is a generally-accepted framework for disclosing sustainability, KPIs and sustainability assurance. Our findings on the SOCs application of the GRI G4 guidelines are outlined briefly in the Executive Summary as these are not material to this research.
Eleven of the SOCs (55%) scored higher than 50% of the final <IR> Framework requirements and the average mean is 54.2%. This means that there is respect for and some application of the International <IR> Framework.
The total score for the above is analysed in Graph 3.
RESEARCH
FINDINGS AND RESULTS
The elements of the <IR> Framework were scored as follows:
• Strategic focus 10 marks
• Connectivity of information 18 marks
• Materiality in terms of dealings with stakeholders 14 marks
• Nature of dealings with stakeholders 14 marks
• Conciseness 18 marks
• Reliability and completeness 18 marks
• Consistency and comparability 4 marks
• The fundamental concepts: business model and graphics, capitals, value creation 34 marks
• Content elements present: organisational overview, governance, business model, risks and opportunities, strategy and resource allocation, performance, outlook, and basis of preparation and presentation
34 marks
• The “wow” factor: any matter dealt with in a unique manner to enhance disclosure 18 marks
• Organisation: Presentation, layout and design of reports, including the integrated report; proper clickable links where needed 18 marks
TOTAL 200 marks

© Nkonki Proprietary 2015
10 |
Graph 3 – <IR> Framework and Business Model
Num
ber o
f com
pani
es
A rating B rating C rating D rating Below D rating0
2
4
6
8
10
A Rating80% – 100%
B Rating70% – 79%
C Rating60% – 69%
D Rating50% – 59%
Below D Rating0 – 49%
9
4
2
5
4 See the analysis of the disclosure of the business model and capitals in 1.2, as well as Chapter 4 on the roadmap to <IR> and the use of the maturity chart in Chapter 3.
The strategic focus
component scored an average of 71.7% with only one company scoring below a D rating.
The connectivity of information
component scored an average of 56.3%, which indicates that it should receive more attention in the future. Seven companies did not obtain a D rating or higher.
The materialityin terms of dealings with stakeholders scored an average of 66.9%. This is a good rating, but can improve. Five companies scored below a D rating.
The nature of dealings with stakeholders
was described adequately in many instances, but this also scored an average of 66.9%. Five companies scored below a D rating.
Conciseness
is such an important aspect, and will be applied properly if other factors are also in place, e.g. proper use of materiality and making use of abridged Annual Financial Statements (AFS). Conciseness scored a poor 41.3% and only seven SOCs obtained D ratings or higher. The average length of the reports surveyed was 181 pages (this excludes separate AFS or sustainability reports). The lengthiest report was 296 pages, while the shortest report was 104 pages – congratulations to the Air Traffic and Navigation Services Company SOC Limited on this achievement.
Reliability and completeness
scored an average of 68.5%. Only three reports were rated lower than D.
Consistency and comparability
scored an average of 100%.
The fundamental concepts
business model and graphics, capitals, value creation – this section was perhaps the most radical section in terms of moving towards the <IR> Framework, with many new items needing to be included. There is a long road ahead for many companies, including SOCs, particularly with respect to developing a proper business model, showing the value creation process and the input capital versus output capital. The average score achieved here was a low 45%, with only 10 SOCs scoring D or higher4.
The presence of the content elements
such as organisational overview, governance, business model, risks and opportunities, strategy and resource allocation, performance, outlook, basis of preparation, and presentation was not yet fully adopted, with an average score of 55%. Fifteen SOCs scored a D or higher.
The “wow” factor fared the worst, only being present to some extent in four reports, which is why the average is just 11.7%.
Organisation: Presentation and design
scored an average of 61%, leaving room for companies to reconsider the way in which their information is presented in the integrated report, as well as how the information links to other reports and other information on the web pages.

© Nkonki Proprietary 2015
| 11
Integrated Reporting – A New Era
Nineteen of the SOCs (95%) scored higher than a D rating and the average score was 71.7%.
Thirteen of the SOCs (65%) scored higher than a D rating and the average score was 56.3%.
1.1.2 STRATEGIC FOCUS
1.1.3 CONNECTIVITY OF INFORMATION
CHAPTER 1N
umbe
r of c
ompa
nies
A rating B rating C rating D rating Below D rating0
2
4
6
8
10
12
Num
ber o
f com
pani
es
A rating B rating C rating D rating Below D rating0
1
2
3
4
5
6
7
8
A Rating80% – 100%
4
6
2
12
6
1
1
1
7
B Rating70% – 79%
C Rating60% – 69%
D Rating50% – 59%
Below D Rating0 – 49%
A Rating80% – 100%
B Rating70% – 79%
C Rating60% – 69%
D Rating50% – 59%
Below D Rating0 – 49%

© Nkonki Proprietary 2015
12 |
Fifteen of the SOCs (75%) scored higher than a D rating and the average score was 66.9%.
Fifteen of the SOCs (75%) scored higher than a D rating and the average score was 66.9%.
1.1.4 MATERIALITY IN STAKEHOLDER DEALINGS
1.1.5 NATURE OF DEALINGS WITH STAKEHOLDERS
Num
ber o
f com
pani
es
A rating B rating C rating D rating Below D rating0
1
2
3
4
5
6
7
8
Num
ber o
f com
pani
es
A rating B rating C rating D rating Below D rating0
2
4
6
8
10
8
4
3
9
3
12
5
5
A Rating80% – 100%
B Rating70% – 79%
C Rating60% – 69%
D Rating50% – 59%
Below D Rating0 – 49%
A Rating80% – 100%
B Rating70% – 79%
C Rating60% – 69%
D Rating50% – 59%
Below D Rating0 – 49%

© Nkonki Proprietary 2015
| 13
Integrated Reporting – A New Era
CHAPTER 1
Seven of the SOCs (35%) scored higher than a D rating and the average score was 41.3%.
Seventeen of the SOCs (85%) scored higher than a D rating and the average score was 68.5%.
1.1.6 CONCISENESS
1.1.7 RELIABILITY AND COMPLETENESS
Num
ber o
f com
pani
es
A rating B rating C rating D rating Below D rating0
3
6
9
12
15
Num
ber o
f com
pani
es
A rating B rating C rating D rating Below D rating0
2
4
6
8
10
A Rating80% – 100%
B Rating70% – 79%
C Rating60% – 69%
D Rating50% – 59%
Below D Rating0 – 49%
A Rating80% – 100%
B Rating70% – 79%
C Rating60% – 69%
D Rating50% – 59%
Below D Rating0 – 49%
3
10
1
6
3
4
13

© Nkonki Proprietary 2015
14 |
All 20 SOCs (100%) scored higher than a D rating and the average score was 100%.
Ten of the SOCs (50%) scored higher than a D rating and the average score was 45%.
1.1.8 CONSISTENCY AND COMPARABILITY
1.1.9 THE FUNDAMENTAL CONCEPTS
Num
ber o
f com
pani
es
A rating B rating C rating D rating Below D rating0
5
10
15
20
Num
ber o
f com
pani
es
A rating B rating C rating D rating Below D rating0
2
4
6
8
10
A Rating80% – 100%
B Rating70% – 79%
C Rating60% – 69%
D Rating50% – 59%
Below D Rating0 – 49%
A Rating80% – 100%
B Rating70% – 79%
C Rating60% – 69%
D Rating50% – 59%
Below D Rating0 – 49%
2
4 4
10
20

© Nkonki Proprietary 2015
| 15
Integrated Reporting – A New Era
CHAPTER 1
Fifteen of the SOCs (75%) scored higher than a D rating and the average score was 55%.
All 20 of the SOCs (100%) scored lower than a D rating and the average score was 11.7%.
1.1.10 CONTENT ELEMENTS
1.1.11 THE “WOW” FACTOR
Num
ber o
f com
pani
es
A rating B rating C rating D rating Below D rating0
1
2
3
4
5
6
7
8
Num
ber o
f com
pani
es
A rating B rating C rating D rating Below D rating0
5
10
15
20
A Rating80% – 100%
B Rating70% – 79%
C Rating60% – 69%
D Rating50% – 59%
Below D Rating0 – 49%
A Rating80% – 100%
B Rating70% – 79%
C Rating60% – 69%
D Rating50% – 59%
Below D Rating0 – 49%
7
2
6
5
20

© Nkonki Proprietary 2015
16 |
Sixteen of the SOCs (80%) scored higher than a D rating and the average score was 61%.
It is disappointing to note that this component of the <IR> Framework was so weakly applied by most of the SOCs. Table 1 shows the full analysis.
1.1.12 ORGANISATION
1.2 THE FUNDAMENTAL CONCEPTS: BUSINESS MODEL AND GRAPHICS, CAPITALS, VALUE CREATION
Num
ber o
f com
pani
es
A rating B rating C rating D rating Below D rating0
2
4
6
8
10
A Rating80% – 100%
B Rating70% – 79%
C Rating60% – 69%
D Rating50% – 59%
Below D Rating0 – 49%
Number of SOCs
Business model graphic representation
Use of capitals in the business model Comments
1 Yes, full business model All six capitals part of business model Excellent
1 Very good business model graphic Showed only human capital and natural capital Strong on stakeholder engagement
3 Yes, full business model Capitals not part of business model Capitals dealt with elsewhere
2 Good picture of business model
No capitals in business model or elsewhere. One company presented capitals as enabling resources and had a value creation section. Not called a “business model”.
1Business model mentioned, but not presented
No capitals mentionedPicture of strategic goals is quite good, but still not a business model
3Business model mentioned, but not presented
No capitals mentioned
1Business model mentioned, but not presented
Capitals discussed elsewhere
2Some pictures, but not a business model
No capitals mentioned
6 No business model mentioned No capitals mentioned
5
9
2
4
Table 1 – Analysis of Disclosure
From the above, it is clear that only one SOC went all the way in terms of disclosing the fundamental concepts. The next six also showed some initiative, but this will need more work in future reports, especially with respect to introducing the capital inputs and outputs. The remainder of the SOCs, shown below the solid line in the table, are nowhere close to a proper presentation.

© Nkonki Proprietary 2015
| 17
Integrated Reporting – A New Era
CHAPTER 1
1.3 ADOPTION OF THE INTEGRATED REPORTING FRAMEWORK
1.4 OVERALL RATINGS AND RESULTS
The most common issue this year was that some of the SOCs simply did not follow the guidelines of the <IR> Framework. However, the Framework presents a complex set of new criteria to use, and for this reason we recommend that organisations apply the roadmap to <IR>, and the maturity chart as outlined in Chapters 3 and 4.
Most SOCs adopted the <IR> Framework and then did reasonably well in the scoring. Those SOCs that did not adopt the <IR>
Framework lost marks as the content elements were only partly disclosed and not always part of the integrated story that had to be told.
In such cases, there was usually a lack of one or more of the content elements: business model (if absent, usually the fundamental concepts were also not present) and in particular, the value creation process, strategy, stakeholders, risks and opportunities and outlook.
RankingsState Owned Company
Results
2011 2012 2013 2014 2011 2012 2013 2014
2 3 2 1 Transnet SOC Limited C C B B
18 15 10 2 Air Traffic and Navigation Services Company SOC Limited G F D B
1 1 1 3 Eskom Holdings SOC Limited B B B B
2 3 4 Telkom SA SOC Limited C B B
7 8 7 4 Development Bank of Southern Africa E E D B
16 4 5 5 Industrial Development Corporation of South Africa Ltd F D C C
11 11 13 6 South African Airways SOC Limited F E E C
12 13 14 7 Broadband Infraco SOC Limited F F E D
9 10 12 8 Airports Company of South Africa SOC Limited F E E D
3 5 4 9 Denel SOC Limited D D C D
14 17 18 10 CEF SOC Limited G G G D
Below D Rating
8 12 6 11 South African Forestry Company SOC Limited E E D E
6 10 11 12 Trans-Caledon Tunnel Authority E E E E
18 16 16 12 Alexkor SOC Limited F F F E
10 9 9 13 Land and Agricultural Development Bank of South Africa F E D E
5 6 8 14 South African Nuclear Energy Corporation SOC Limited E D D E
13 14 16 15 South African Broadcasting Corporation SOC Limited F F F E
13 16 Independent Development Trust F F
19 18 17 17 Armaments Corporation of South Africa SOC limited F G F F
4 7 18 South African Post Office Limited E D F

© Nkonki Proprietary 2015
18 |
1.5 CONCLUSION
Overall 55% of the SOCs reviewed scored above 50%, which is an improvement on the 50% in 2013, 37% in 2012 and 16% in 2011. As mentioned, these results are not directly comparable, due to the changes in the mark plan and moving away from the strong focus on the application of King III to the International <IR> Framework.
That being said, there is still a clear indication that many South African SOCs need to improve their <IR> efforts. Perhaps the new assessment used for this report is premature for the SOC market, but if the bar is not raised in awards such as this, it would take even longer before progress will be made. Companies should also begin to realise that sustainability information should best be disclosed using acknowledged and generally-accepted guidelines, such as those of the GRI.
This is an improvement on the
Overall
of the SOCs reviewed scored above 50%
55%
achieved in 2013, 37% in 2012 and
16% in 2011.
50%

© Nkonki Proprietary 2015
| 19
Integrated Reporting – A New Era
With over a third of global GDP being spent by the public sector, current reporting requirements generally give little guideline about how well a government or public service organisation is equipped to meet the challenges and obligations ahead in terms of delivering services and supporting communities. <IR> is a potential answer to breaking through the complexities in a concise way to meet stakeholder demands for increased transparency, improved stewardship and more meaningful disclosure.
With the release of the International <IR> Framework, <IR> is gaining extraordinary global momentum. The IIRC has formed a new <IR> Business Network supplemented by other groups, including the public sector pioneer network, which was launched in Washington in November 2014, where experts from organisations including the World Bank, United Nations Development Programme (UNDP), UK National Health Service (NHS), the Association of Chartered Certified Accountants (ACCA) and the International Public Sector Accounting Standards Board (IPSASB) gathered to explore why and how the public sector should be adopting <IR>.
It was reported that at this event there was much interest around how <IR> can help change the “internal wiring” of organisations – breaking down silos, joining up the dots between strategy, risk and performance through more integrated thinking – and how this can have profound effects on outcomes for organisations.
These include a more cohesive strategy, better execution and greater efficiencies.
As mentioned in the Foreword, as part of the development of the <IR> Framework, the IIRC also ran a three-year pilot programme for investors and over 100 businesses, including public sector organisations, from around the world to experiment with <IR> concepts. Both Eskom and Transnet participated in this. The experiences and views of these organisations, including two public consultations, informed the final <IR> Framework.
As highlighted in Black Sun survey5 of the pilot programme participants, which included 15% of the public sector organisations, saw the benefit and impact of <IR> at all levels of the organisation, starting at an operational level, to a board level including investors and other stakeholders.
CHAPTER 2
GLOBAL LEARNINGS ‒
INTEGRATED REPORTING IN PUBLIC SECTOR ORGANISATIONS
5 Realizing the benefits: The impact of Integrated Reporting © Black Sun Plc 2014

© Nkonki Proprietary 2015
20 |
2.1 THE BENEFITS OF APPLYING THE <IR> FRAMEWORK
The pilot programme participants saw value and benefits in the following areas:
Breakthroughs in understanding value creation
One of the most important and most common benefits organisations experience is a new and better understanding of how they create – or destroy – value
The Black Sun survey reported that developing a better understanding of value creation over time motivated 55% of public sector entities. However, 73% of public sector entities experienced this as a benefit of <IR>.
Improving what is measured
As organisations develop a better understanding of how they create value and begin changing the information they report internally and externally, measurement is a significant focus area for many.
Improving data quality was a motivation in moving towards <IR> for 68% of the organisations that participated in the research, with 100% of public sector entities having seen data improvements, compared with 85% of listed companies seeing current benefits in this area.
Improving management information and decision making
As organisations move toward <IR>, and approach value creation differently, many find that it is important to integrate internal management reporting.
74% of the respondents reported that performance information used to manage their organisations had changed during the move towards <IR>, and 84% of those that have issued integrated reports noted that the most important benefit they experienced was a change in conversations between the board and management, particularly public sector organisations.
A new approach to stakeholder relations
Organisations found that the process of moving toward <IR>, and publishing an integrated report, had an impact on relations with stakeholders. Reporters believe that providers of capital develop a better understanding of strategy and longer-term objectives.
The Black Sun survey indicated that most organisations felt that <IR> is useful in answering stakeholder inquiries, and many felt it was a significant improvement over previous reporting. As <IR> is relatively new, there can be a learning or adjustment process for report users. To engage stakeholders, a South American public sector organisation is looking for ways to use more accessible language in their <IR>. Other reporters are using technology, including interactive apps, to improve engagement and understanding.
Connecting departments and broadening perspectives
<IR> changes how organisations report, but also how they work and think about what they do, therefore greater collaboration and respect were seen as important benefits.
96% of the respondents indicated that the <IR> agenda has had an impact on internal engagement within their organisations. The survey showed that finance, sustainability, investor relations and the board have, in that order, the most active participation across all stages of the process. Risk management and internal audit are the least involved in the <IR> process, although many respondents anticipate greater participation of risk management in the future.

© Nkonki Proprietary 2015
| 21
Integrated Reporting – A New Era
CHAPTER 2
As noted in the Executive Summary and in Chapter 2, there has been improvement year on year by public sector organisations in South Africa as they begin to embrace <IR> as a new way of cor-porate reporting, and particularly the <IR> Framework. However, as the research shows, it may be too early to draw comparisons or conclusions based on the fact this is the first year that our SOCs have had the opportunity to implement the Framework’s recommendations.
This does, however, offer a unique opportunity to explore how public sector organisations in other parts of the world have em-braced the <IR> Framework. Below are specific examples of their areas of excellence in the different elements of the <IR> Frame-work as per the <IR> Database . We believe this will assist South African SOCs and other entities in their journey towards <IR> as it does provide some guidance on practical concepts.
2.2 EXAMPLES OF <IR> EXCELLENCE IN PUBLIC SECTOR ORGANISATIONS GLOBALLY
Public Sector Organisation, Industry and Region
Areas of Excellence
Organisation: HM Revenue & Customs (HMRC)
Industry: Public Sector
Region: Europe
IR Guiding Principles:
• Strategic focus and future orientation• Connectivity of information• Consistency and comparability
Key observations:HMRC measures its three strategic objectives of “maximising revenue”, “improving customer services”, and “reducing costs” with a number of KPIs. For each strategic objective, the organisation provides an overview of achievements, with key figures, year-on-year comparable data and future targets. In doing so, the report effectively connects strategy to performance, whilst linking past performance to future prospects. Brief people-based case studies, as well as more detailed case studies, supplement the narrative and help to give context as to how HMRC is fulfilling its objectives. Finally, at the end of the section a detailed summary of the KPIs that are used to measure each strategic objective is provided. In summary, this section provides both a review of performance and an insight into how this was achieved.
http://examples.integratedreporting.org/fragment/282
Organisation: JSC Afrikantov OKB Mechanical Engineering (OKBM)
Industry: Utilities
Region: Asia
IR Guiding Principles:
• Strategic focus and future orientation• Connectivity of information
Key observations:OKBM’s report provides an insightful overview of the company’s operating environment, the associated risks and how this changes. The discussion examines the business environment from different angles, including the impacts on the global macro-economy, the country and the business. A SWOT analysis, which frames the company’s strategic path, follows the discussion to provide context of how OKBM is positioned to operate within this environment. The report also indicates alternative scenarios (optimistic and conservative scenarios) that have been analysed according to the probability of the risk occurrence.
Along with this discussion, the company goes on to explain what the different risk areas are and the associated preventive measures in a structured and logical manner, making it easy for readers to understand what the future challenges to the company could be, and how the company strives to respond to them.
http://examples.integratedreporting.org/fragment/240
6 http://examples.integratedreporting.org/all_organisations

© Nkonki Proprietary 2015
22 |
Public Sector Organisation, Industry and Region
Areas of Excellence
Organisation: JSC Atomredmetzoloto
Industry: Basic Materials
Region: Asia
IR Guiding Principles:
• Connectivity of information• Stakeholder relationships• Reliability and completeness
Key observations:The business model is explained with a clear reference to other parts of the report for more detailed information. The model mainly consists of capitals, systems to optimise the use of capitals and value delivery. Value delivery is uniquely divided into two dimensions – (i) transformation of capitals (business activities) and (ii) results (products). Since the business relies heavily on mining reserves, the report identifies social and natural capitals as the critical capitals as well as the source of risks and opportunities. It also specifies the company's key aspects in sustaining this model. These key aspects are concisely summarised as integration to the group's value chain activities, employment of experience and technologies of the best quality throughout the value chain, project success and risk management. Readers are guided to further information on these key areas as they read through the report.
The report also deals with suggestions from the company’s stakeholders on a wide range of business issues in an open manner. The company’s responses to these suggestions are also discussed. The suggestions include reporting about the progress of critical projects, managerial system changes as a result of restructuring, and risks associated with political circumstances. This, together with a description of the company's active engagement with stakeholders, enables readers to understand how the company strives to disclose their balanced approach. JSC ARMZ's inclusion of the “statement of public assurance” is notable in conjunction with the company’s open tone. This assurance work is initiated by an inclusive group of people with multiple backgrounds. The accuracy of the content is not assured, but the materiality and completeness are within the scope of the assurance work.
http://examples.integratedreporting.org/fragment/245http://examples.integratedreporting.org/fragment/246
Organisation: NIAEP
Industry: Industrials
Region: Asia
IR Guiding Principles:
• Connectivity of information• Materiality
Key observations:The section titled “Strategy of the Company” sets the context for the company strategy. It does so through the review of the external challenges, supported by several interesting facts and figures that help readers understand how the future business portfolio of the company could be influenced.
The strategic targets of the business are then set out graphically, demonstrating in which areas the development of NIAEP will be most profound. The diagram also helps to demonstrate the extent to which the existing core business know-how can be utilised in other business areas.
Furthermore, another matrix diagram provides an analysis of the scale and difficulty in implementing some of the diversification activities. As a result of these processes, the report concludes three major business opportunities for the company in the long-term – “within core”, “growing around core” and “diversification beyond the core” of the business.
The report also provides insightful information about the company’s competitive advantage.
http://examples.integratedreporting.org/fragment/248

© Nkonki Proprietary 2015
| 23
Integrated Reporting – A New Era
CHAPTER 2
Public Sector Organisation, Industry and Region
Areas of Excellence
Organisation: New Zealand Post
Industry: Consumer Services
Region: Australasia
IR Guiding Principles:
• Reliability and completeness
Key observations:New Zealand Post’s report opens by covering the challenges facing the business as well as its positive performance, giving the reader confidence about the report’s completeness and reliability. The organisation’s performance, for example, is clearly dependent on the success of its financial services operations and growth in the parcels and logistics business, which support the mail business. In the report, management acknowledges the impact of rapid changes in the global marketplace, and recognises the need to innovate to meet these challenges.
There is also an open discussion of the difficult decisions taken to ensure ongoing financial and operational viability, including the significant restructuring of the network and reduced corporate support functions. The report also does not shy away from the negative consequences of the strategy, such as the projected 20% reduction in staff numbers.
The readers’ confidence in the completeness of information is assisted by the description of the detailed strategic assessment undertaken (including extensive stakeholder engagement and risk analysis) to review and identify issues that could impede the implementation of a new five-year strategic plan, or which could have an adverse effect on the value of the group’s capitals.
The report also presents a balanced insight into the group’s capitals. For example, several strategic initiatives for enhancing the group’s “networks capital” (its buildings and infrastructure) are discussed. Actions which prevent value being eroded by the negative outlook for the mail business and rising operational costs, are also clearly identified.
http://examples.integratedreporting.org/organisation/97
Organisation: Rosneft
Industry: Oil and Gas
Region: Asia
IR Guiding Principles:
• Strategic focus and future orientation• Stakeholder relationships• Materiality
Key observations:The report is structured logically and is easy to follow, providing an overview and understanding of the company’s scale and technological advantages. Starting with the section, “Strategy of Efficient Development” together with “Geography of Operation”, the discussion provides readers with a good understanding of what the company does and where the company operates, as well as its market position.
“Key medium-term value drivers” are identified in the report and this information conveys the strengths of the company. These drivers are common across all three major business activities and are thoroughly explained in the later chapters. These key drivers correspond to the International <IR> Framework’s capitals. While the company’s main focus is placed on financial capital (i.e. cost efficiency and capital discipline, liquidity and dividend), intellectual capital (i.e. capability, access to technology and license) and social and relationship capital (i.e. investor relations) are also acknowledged.
In addition, the opening pages provide an insight into the plans, progress made against these plans, with an indication of where the business is focusing future efforts. Putting this content into context, Rosneft provides an overview of how the business compares within its peer group.
Overall the report is designed to showcase the evidential facts that substantiate the viability of the company’s strategy and the progress which has been made.
http://examples.integratedreporting.org/organisation/109

© Nkonki Proprietary 2015
24 |
Public Sector Organisation, Industry and Region
Areas of Excellence
Organisation: The Crown Estate
Industry: Real Estate
Region: Europe
IR Guiding Principles
• Stakeholder relationships• Conciseness
Key observations:The Crown Estate’s 2014 Annual Report includes a section outlining the key resources and relationships which support the organisation’s value creation process. Here, The Crown Estate identifies the six financial and non-financial capitals, including an example for each of the six capitals to provide the reader with a better understanding of what these resources and relationships cover. The report also explains, with examples of how financial investment in people would affect other assets and how the six capitals are integrated in the strategic decision-making process of the organisation.
In addition, The Crown Estate takes steps to explain how the company measures and communicates the significant value it creates as the total contribution of the organisation. Progress and insights into future focus areas then follow this description.
http://examples.integratedreporting.org/organisation/43
2.3 CONCLUSION
From the examples included in this chapter, it is clear that organisations across the world are paying more attention to <IR> as whole, whilst many are also embracing
the International <IR> Framework. Traditionally, South Africa has been a front runner in this field, but it would appear that global organisations are now beginning to set
standards for best practice.
This supports the recommendation that it would behove South African companies, and in particular SOCs since they form the basis of our research, to move with some agility towards embracing not only <IR> as a whole, but also the International <IR> Framework as it gains traction in other countries. A first step in the right direction
would be testing the organisation against the Nkonki maturity chart.

© Nkonki Proprietary 2015
| 25
Integrated Reporting – A New Era
CHAPTER 3
An <IR> maturity chart was developed by Nkonki to assist Audit Committees, those tasked with <IR> as a function, those preparing integrated reports, and other relevant stakeholders in navigating the journey towards <IR>.
Essentially one has to determine how many aspects have been completed within each level. Once a level is “completed” (i.e. there is an ability to tick off all or most of the aspects in that level), the next level can then be attempted.
The maturity levels are as follows, and have been derived from the Dreyfus model of skill acquisition (Wikipedia, 2015):
APPLYING
THE NKONKI MATURITY CHART
5. <IR> Expert Company
1. Novice Company
2. Advance
d Beg
inne
r
3. Competent Role Player
4. The Company is
Profi cient in <IR>

© Nkonki Proprietary 2015
“To bring these global developments into context with
South African developments, Nkonki has summarised its
roadmap to <IR> and included the Nkonki maturity chart in
this report.”
26 |

© Nkonki Proprietary 2015
| 27
Integrated Reporting – A New Era
CHAPTER 3
AFS = Annual Financial Statements | KPI = Key Performance Indicator
<IR>
MATURITY CHART LEVELS
• There is a legal requirement to produce an integrated report, or a decision to produce an integrated report is made by the Board
• The Board or Audit Committee members (and other relevant committee members) have received basic governance and <IR> training
• A governance report is already being published
• Gap analysis has been done to determine the <IR> maturity level
• The Audit Committee has recommended the planning of an integrated report
• There is a strategy, vision and mission• There is a risk management system• There is a system of stakeholder
engagement
• A champion has been appointed• The company has decided on
resources available• It has decided on a strong team and
internal/ external members and writers
• Specific training on <IR> for internal team members has been conducted
• Gap analysis has been done to determine information to be gathered
• Gap analysis has been done in terms of the expertise available for <IR>
• Gap analysis has been done in terms of compliance to legislation and other guidelines
• There are terms of reference for the <IR> team (approved by the Audit Committee and the Board)
• A team has been appointed• There is full buy-in by the Board or
Audit Committee and management• A plan of the process (or project)
management is drafted and approved
• A workshop or brainstorming session has been held by the Board or Audit Committee and management, with the team or champion facilitating; each role player becomes competent in his/her contribution
• Planned actions are derived from goals• Strategy and risks, boundary, stakeholder
relationships, material matters, outlook and KPIs to be part of the integrated report have been determined as part of the workshop
• The assurance required has been decided upon
• The team decides on the information/content to be gathered
• The name of the report is “Integrated Report”
• Consideration is given to management pay and bonuses and related core KPIs
• All information and content are gathered• There is a business model as per the <IR>
Framework – with capitals and value creation
• The final layout is determined by the team• “Integrated thinking” is in the process of
being adopted in the entity• A gap analysis has been done of draft
against best practices and benchmarks• The <IR> process can now be executed• A draft is ready for next phase
Novice Company Advanced Beginner Competent Role Player
1 2 3

© Nkonki Proprietary 2015
28 |
• Resources are available for internal audit resources – at a minimum (internal assurance)
• “Integrated thinking” is embedded in the entity• The integrated report includes the full AFS with audit
report, if not too lengthy; otherwise the abridged AFS with relevant audit report
• A mature business model is included and proper wealth creation descriptions are applied
• The Audit Committee recommends a draft integrated report to the Board
• The Board or Audit Committee has approved the final integrated report
• The final integrated report is produced and published – print and web
• A post-implementation review is performed
• Resources are available for external assurance• An unqualified report on the AFS is desirable• There is a fully implemented Integrated Assurance
Model• The abridged AFS and relevant audit report are
available• An external assurer expresses an opinion on the
integrated report as a whole• “Integrated thinking” is embedded in the entity• A post-implementation review is performed
The Company is Proficient in <IR>
<IR> Expert Company
4 5

© Nkonki Proprietary 2015
| 29
Integrated Reporting – A New Era
CHAPTER 3
Table 2 – Maturity Levels Accorded to the 2014 SOC Annual Reports
Ranking Rating Maturity Level
2014 State Owned Company 2014
1 Transnet SOC Limited B 4 Proficient
2 Air Traffic and Navigation Services Company SOC Limited B 3 Competent Role Player
3 Eskom Holdings SOC Limited B 4 Proficient
4 Telkom SA SOC Limited B 3 Competent Role Player
4 Development Bank of Southern Africa B 3 Competent Role Player
5 Industrial Development Corporation of South Africa Ltd C 2 Advanced Beginner
6 South African Airways SOC Limited C 2 Advanced Beginner
7 Broadband Infraco SOC Limited D 2 Advanced Beginner
8 Airports Company of South Africa SOC Limited D 2 Advanced Beginner
9 Denel SOC Limited D 4 Proficient
10 CEF SOC Limited D 2 Advanced Beginner
Below D Rating
11 South African Forestry Company SOC Limited E 2 Advanced Beginner
12 Trans-Caledon Tunnel Authority E 1 Novice Company
12 Alexkor SOC Limited E 1 Novice Company
13 Land and Agricultural Development Bank of South Africa E 1 Novice Company
14 South African Nuclear Energy Corporation SOC Limited E 1 Novice Company
15 South African Broadcasting Corporation SOC Limited E 1 Novice Company
16 Independent Development Trust F 1 Novice Company
17 Armaments Corporation of South Africa SOC limited F 1 Novice Company
18 South African Post Office Limited F 1 Novice Company
The levels and their indicators are not cast in stone, and may be different for each individual entity wishing to embark on this journey. Although one can clearly see in Table 2 the correlation between the rankings of the SOC and how high on the maturity chart it is rated, there may be “mature” SOCs with a lower ranking according to the mark sheets. This means that the maturity level does not necessarily always imply how well a SOC has scored in this report – it simply gives an indication of how far the process has matured, not the quality of the maturation or disclosure.
The application of the maturity chart to the 20 SOCs assessed indicates the value of this chart. One should take into account, however, that the rating in the table is based solely on what has emerged in the <IR> disclosure process and in our assessment of the SOCs.
Table 2 shows all the SOCs, with their 2014 ranking and rating, as well as the best “guess” in terms of the maturity level based on reading and assessing the integrated reports (or annual reports in some cases).

© Nkonki Proprietary 2015
“<IR> is the new approach to corporate reporting that
demonstrates the integration of an organisation’s strategy,
governance and financial performance and the social,
environmental and economic context within which it
operates.“
30 |

© Nkonki Proprietary 2015
| 31
Integrated Reporting – A New Era
The roadmap towards <IR> comprises the ability to embrace the true spirit of <IR> (as contained in the <IR> Framework).
CHAPTER 4
A PRACTICAL GUIDE ‒
THE ROADMAP TO EXCELLENT INTEGRATED REPORTING
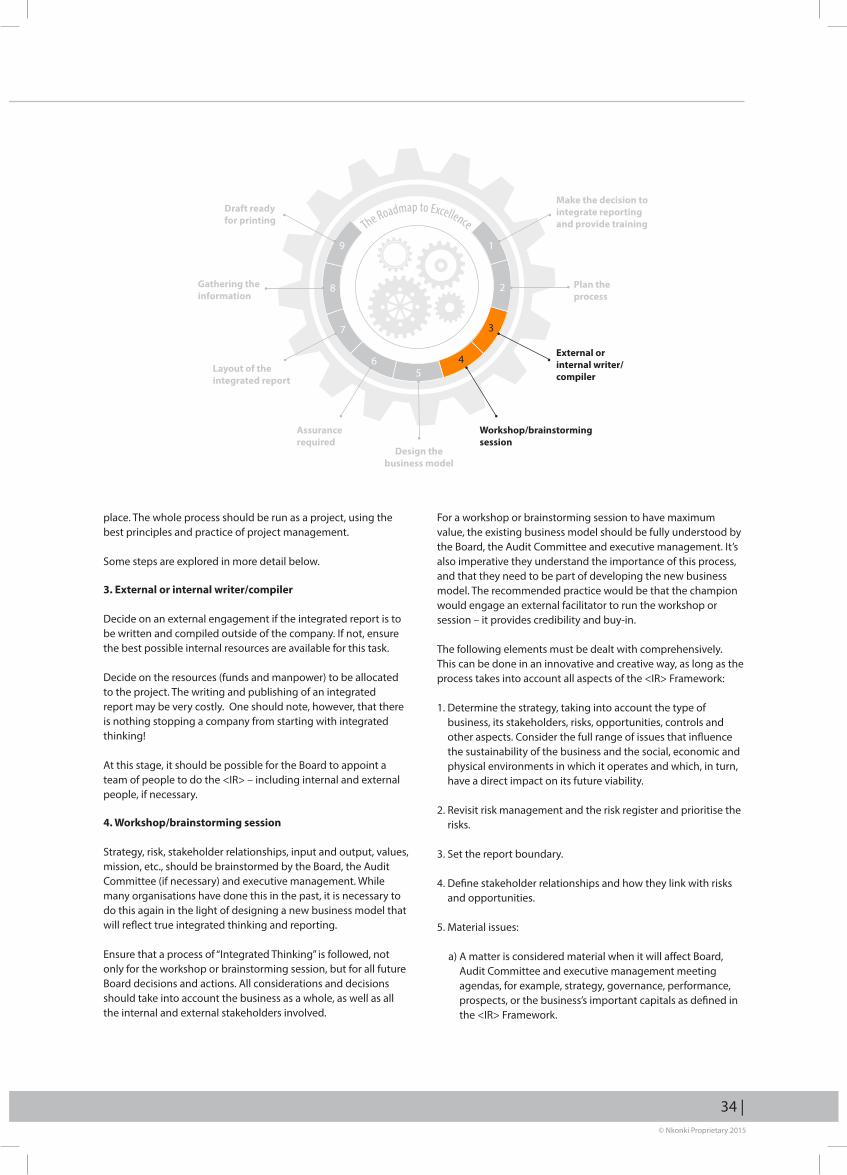
The Roadmap to Excellence
Make the decision to integrate reporting and provide training
19
28
37
65
4
Plan the process
External or internal writer/compiler
Workshop/brainstorming session
Design the business model
Assurance required
Layout of the integrated report
Gathering the information
Draft ready for printing

© Nkonki Proprietary 2015
32 |
1. Make the decision to integrate and provide training
The Board or Audit Committee as a unit should make the decision on when and how a business entity will be implementing <IR>. This might be voluntary or it might be compulsory (for example, in the case of listed companies in South Africa, the integrated report is a listing requirement). This should be followed by careful planning to have the first integrated report ready by a particular date.
The Board, Audit Committee members, and executive management may have to undergo relevant training on governance and <IR> before making an important decision like this. A vital tool in assisting a Board in deciding whether the business should start the <IR> process is the Nkonki maturity chart (see Chapter 4).
2. Plan the process
It could take more than a year to prepare for an integrated report, as the planning process must keep in mind the dates set for Board meetings and for Audit Committee meetings (where approvals need to be done). Bear in mind that some information that will form part of the integrated report will have to be gathered and recorded as the year progresses.
It is very difficult in the middle of a financial year to decide that certain performance indicators should be compiled and even audited, for example, when the subject matter (the underlying data) has never been recorded or validated up to that point. The integrated report should cover the same financial year as the AFS.
4.1 EMBRACING THE TRUE SPIRIT OF <IR>
According to the IIRC, “Integrated Reporting is an approach to corporate reporting that demonstrates the linkages between an organisation’s strategy, governance and financial performance and the social, environmental and economic context within which it operates” (2013a).
The sustainability reporting process defined by the GRI Sustainability Reporting Framework can help companies wanting to produce integrated reports, in three main ways:
• Identifying material issues – topics that express the core link between business goals and sustainability impacts
• Stakeholder engagement – dialogue to help determine material impacts and manage risks and opportunities
• Performance indicators – measuring, managing and reporting material issues using an internationally-accepted framework
In <IR>, there are a number of concepts that not all Audit Committee members, directors, managers or even fund managers are familiar with as yet. These concepts are not easily implemented in a business entity as they are fairly radical. This is the first mind-shift that Audit Committee members, directors and managers should make. The business world is changing dramatically and <IR> is certainly playing a big role in this change. Things will never be the same again. It will take personal time and effort from each individual to come to terms with this change.
The biggest questions remain: How do we tackle <IR>, and how do we get it embedded in the fibre of our business? The main objective for now would be to become familiar with the IIRC document, “<IR> The International <IR> Framework” and to think about how to apply that in the business entity. This chapter provides a suggested roadmap of how to move towards proper integrated thinking, followed by proper <IR>. The <IR> Framework is also not the only guide or framework – one should keep best business practice in mind at all times.
The Roadmap to Excellence
Make the decision to integrate reporting and provide training
19
28
37
65
4
Plan the process
External or internal writer/compiler
Workshop/brainstorming session
Design the business model
Assurance required
Layout of the integrated report
Gathering the information
Draft ready for printing

© Nkonki Proprietary 2015
| 33
Integrated Reporting – A New Era
CHAPTER 4
Make sure a champion is appointed to drive this process from beginning to end. It could be an internal person like the Chief Financial Officer (CFO) or the Chief Executive Officer (CEO), the company secretary, public relations (PR) or stakeholder engagement department, the compliance department, or the legal department. It could also be an external person from an advisory service such as an auditing consulting firm, a PR firm, or a graphic design firm, advertising agency or an investor relation consultancy.
The plan should be drafted in coordination with the CFO and other internal role players. The role of the CFO is very important as he/she is responsible for the AFS or the abridged AFS and traditionally he/she was responsible for publishing the annual report (where other teams only became involved by publishing a sustainability report later on– first separately and later included in the annual report). The Board, Audit Committee and executive management should be part and parcel of the process and should first buy into the process to adhere to all requests from the appointed champion.
The champion should present the detailed plan to the Board (often first to the Audit Committee) for authorisation. This should include each step to be taken in order to have an integrated report ready at the end of a particular financial year-end. For companies and corporations with a low maturity (refer to maturity chart in Chapter 4) in <IR>, the Board may decide to phase it in or stagger the implementation over two or three years (especially if a voluntary application to the <IR> Framework is sought).
Planning should incorporate the following steps:
• Decide in principle to do <IR>• Appoint a champion• Training – general background training for all Board members,
committee directors and senior executives
• Training – specific training on <IR> for other internal team members
• Use the maturity chart to determine how ready the company is – do a gap analysis
• Decide on the external or internal writer/compiler and teams to use
• Appoint the teams• Facilitate a workshop/brainstorming session by the Board
and senior executives (may have an external facilitator) to determine the following:
- Strategy and risk- Report boundary- Stakeholder relationships- Material matters- Business model (concept or draft)- Outlook- KPIs - Information/content required – full list to be compiled- Determine the assurance required- Decide on the resources to be allocated for <IR>
• Design the business model as a result of the workshop/brainstorming session
• Determine the assurance required and reliability of the information
• Decide on the layout of the integrated report• Gather the information/content• Get the draft ready for printing• Secure the approval/recommendations by the chairman, CEO,
Audit Committee, Social and Ethics Committee and finally the Board of Directors
• Print, publish and distribute the integrated report (including website)
These steps should be built into a matrix where timelines and responsibilities can be allocated for each step. The champion should control this worksheet and report to the Audit Committee and Board as to the progress whenever these meetings take
© Nkonki Proprietary 2015
34 |
place. The whole process should be run as a project, using the best principles and practice of project management.
Some steps are explored in more detail below.
3. External or internal writer/compiler
Decide on an external engagement if the integrated report is to be written and compiled outside of the company. If not, ensure the best possible internal resources are available for this task.
Decide on the resources (funds and manpower) to be allocated to the project. The writing and publishing of an integrated report may be very costly. One should note, however, that there is nothing stopping a company from starting with integrated thinking!
At this stage, it should be possible for the Board to appoint a team of people to do the <IR> – including internal and external people, if necessary.
4. Workshop/brainstorming session
Strategy, risk, stakeholder relationships, input and output, values, mission, etc., should be brainstormed by the Board, the Audit Committee (if necessary) and executive management. While many organisations have done this in the past, it is necessary to do this again in the light of designing a new business model that will reflect true integrated thinking and reporting.
Ensure that a process of “Integrated Thinking” is followed, not only for the workshop or brainstorming session, but for all future Board decisions and actions. All considerations and decisions should take into account the business as a whole, as well as all the internal and external stakeholders involved.
For a workshop or brainstorming session to have maximum value, the existing business model should be fully understood by the Board, the Audit Committee and executive management. It’s also imperative they understand the importance of this process, and that they need to be part of developing the new business model. The recommended practice would be that the champion would engage an external facilitator to run the workshop or session – it provides credibility and buy-in.
The following elements must be dealt with comprehensively. This can be done in an innovative and creative way, as long as the process takes into account all aspects of the <IR> Framework:
1. Determine the strategy, taking into account the type of business, its stakeholders, risks, opportunities, controls and other aspects. Consider the full range of issues that influence the sustainability of the business and the social, economic and physical environments in which it operates and which, in turn, have a direct impact on its future viability.
2. Revisit risk management and the risk register and prioritise the risks.
3. Set the report boundary.
4. Define stakeholder relationships and how they link with risks and opportunities.
5. Material issues:
a) A matter is considered material when it will affect Board, Audit Committee and executive management meeting agendas, for example, strategy, governance, performance, prospects, or the business’s important capitals as defined in the <IR> Framework.
The Roadmap to Excellence
Make the decision to integrate reporting and provide training
19
28
37
65
4
Plan the process
External or internal writer/compiler
Workshop/brainstorming session
Design the business model
Assurance required
Layout of the integrated report
Gathering the information
Draft ready for printing

© Nkonki Proprietary 2015
| 35
Integrated Reporting – A New Era
CHAPTER 4
b) The process involves the identification and evaluation of relevant matters based on their ability to affect value creation. These must then be prioritised based on their relative importance and a decision must be made on which issues will be disclosed and how. It should include both positive and negative issues.
6. Business model (concept or draft):
a) It is a massive challenge to design an organisation’s unique business model in concept or draft format. It should be a logical process, following the guidelines in the <IR> Framework. To do this properly, the team should understand the issues at hand as well as reading up on the subject. It should also make use of sources such as those provided in the bibliography of this report.
7. Outlook:
a) Future outlook is usually covered in either the chairman’s report or the CEO’s report, or in both. Some companies also require the operational divisions/departments/sections to report separately on future outlook.
8. KPIs:
a) For companies not yet following an accepted framework for reporting, such as the GRI G4 guidelines, this might be new ground. Such a company now has to decide which KPIs it must use in order to help measure performance in the future. These KPIs should be both financial and non-financial (financial could, for example, be the gross profit margin of the company, while non-financial could be the CO2
emissions or the carbon footprint).
9. Consideration should also be given to executive and management remuneration, bonuses and the performance indicators related thereto.
10. Information/content required – a full list needs to be compiled. This should enable the <IR> team to do an information gap analysis.
11. Assurance required:
a) When deciding on sustainability assurance, one should first consider if the information has been subjected to controls and would be auditable. If so, the cost/benefit ratio should be considered.
b) The next move will be towards a single integrated report, covering both the AFS and some of the sustainability or non-financial information. Standards still have to be developed in this regard.
12. Resources to be allocated for <IR>:
a) Although costs have been mentioned a few times, now would be the time to really determine if the company is mature enough for an integrated report, and, if so, what will be available to spend on the drafting, design, printing and publishing of the report. For listed companies, it is usually compulsory to have a printed annual report, so only the additional costs need be considered.
b) As mentioned, the workshop might not be the ideal place to make a final decision about costs. The <IR> team should investigate, and obtain quotes where required, and make recommendations to the relevant committee or to the Board.

© Nkonki Proprietary 2015
36 |
A company would be fortunate to have some activists amongst its shareholders, as they usually ask critical questions during the annual general meetings – questions which the Board should consider in the workshop/brainstorming session to see if these have any relevance to the process.
Remember that a company can have the best possible reports, the best possible application of governance and sustainability recommendations, and still fail to produce the correct image of itself in its integrated report. This happens when the truth is not told. If the Board, for example, thinks they are above governance rules and controls, then “sugar coating” in the integrated report would be considered dishonest and could signal impending danger for the sustainability of the entity. This scenario was evident in many of the business failures of the past 15 years, e.g. Enron.
5. Design the business model
The Board, Audit Committee and executive management should design the business model according to the results of the workshop. Make sure a logical business model is captured in a type of flow diagram, as suggested by the <IR> Framework. Note that the <IR> Framework is a high-level document. When actually designing a business model or a graphic representation thereof, the various aspects and components should be analysed in depth.
At this stage, the end result of the <IR> process should be a business model, the strategy, the risks and opportunities, an integrated management approach, performance indicators and future outlook.
6. Assurance required
Most typically the AFS are assured by external auditors. The issue here would be if and how some of the non-financial information
will be assured, e.g. by way of sustainability assurance. The level of assurance is also important, e.g. reasonable assurance versus limited assurance. The scope will be important, i.e. which non-financial performance figures or indicators will be externally assured.
Currently almost all businesses seem to regard external assurance only in terms of the sustainability information and the KPIs. In an integrated report, however, the financial and non-financial information should be integrated and as such a common or single integrated audit report should be issued. This is still in its infancy, but standards and processes will have to be developed in this regard. As the integrated report is the primary report of a business entity, it should be independently assured.
According to the IIRC, assurance is the key mechanism to ensure that integrated reports and the <IR> process are deemed to be credible and trustworthy. If not, the aims of <IR> are not likely to be achieved.
Reliable and trustworthy integrated reports are, however, also given credibility by sound leadership, robust internal systems (controls), Internal Audit involvement and stakeholder involvement.
7. Layout of the integrated report
Together with the step involving materiality, it would be appropriate to decide on the layout of the integrated report, including considering which chapters or sections will be available on the company website in more detail. These may include, for example:
• Introduction and reports of the chairman and CEO (and CFO)• Corporate governance (including the Board and governance
structures)
The Roadmap to Excellence
Make the decision to integrate reporting and provide training
19
28
37
65
4
Plan the process
External or internal writer/compiler
Workshop/brainstorming session
Design the business model
Assurance required
Layout of the integrated report
Gathering the information
Draft ready for printing

© Nkonki Proprietary 2015
Integrated Reporting – A New Era
CHAPTER 4
| 37
• Sustainability• The financial information (the AFS or summaries thereof )
The layout could even be structured around the business model, or even according to the six capitals (the inputs in the business model).
Whatever the decision is in this regard, all the elements of an integrated report as per the <IR> Framework should be included. There should be no separation between financial and non-financial performance (except for the audited AFS, which have to follow the accounting standards and are usually published as a separate series of pages/section). All functions and divisions of the business entity should share the same strategy.
8. Gathering the information
The next step should be to gather all the information as decided upon in point 10 of step 4 (the brainstorming session). This is a step-by-step collection of information by the champion and his/her team, with the relevant ticking off of items from the list. The AFS should be obtained in final format from the CFO or relevant person, the sustainability information from the relevant department(s), and so too the governance information, as well as the results (refined and approved) of the workshop or brainstorming session, especially material issues, the business
model and capitals, strategy, risk, stakeholder engagement, etc.It is not simply a matter of gathering and putting this information together – it’s crucial to make sure that the same language and tone is used throughout, and that the story is being told in sequence and with logical flow. The chairman’s report, the CEO’s report and the CFO’s report should also now be considered and their reports should form an integral part of the story.
9. Draft ready for printing
The draft must now be distributed and read by all the contributors: the CEO, the CFO, the chairman, the sustainability department, the company secretariat and governance department, the operational and/or divisional managers and all other relevant contributors. Once each person has signed it off, it can be called a final draft that must go to the Audit Committee members for recommendation to the Board for final approval. An organisation can also involve the finance committee and the Social and Ethics Committee if appropriate.
The final draft will now be designed with graphics and proper layout and made ready for printing and for publishing on the website. This should all be done taking into account the final deadline for distribution of the integrated report to all the shareholders, in time for the annual general meeting.
The Roadmap to Excellence
Make the decision to integrate reporting and provide training
19
28
37
65
4
Plan the process
External or internal writer/compiler
Workshop/brainstorming session
Design the business model
Assurance required
Layout of the integrated report
Gathering the information
Draft ready for printing

© Nkonki Proprietary 2015
38 |
“Buy-in by the Board and Audit Committee, as well as of executive management, is
critical to ensure a proper <IR> process.”

© Nkonki Proprietary 2015
Integrated Reporting – A New Era
| 39
CHAPTER 5
“Based on the results, Nkonki is excited at the opportunity to recognise and celebrate those SOCs that are taking a commendable lead in integrated reporting in South Africa.”
<IR> is the new approach to corporate reporting that demonstrates the integration of an organisation’s strategy, governance and financial performance and the social, environmental and economic context within which it operates. By reinforcing these connections, <IR> can help a business to take more sustainable decisions and enable investors and other stakeholders to understand how an organisation is truly performing.
The IIRC was formed in July 2010 and is currently chaired by Professor Mervyn King. The mission of the IIRC was to create a globally-accepted <IR> Framework, which brings together financial, environmental, social and governance information in a clear, concise, consistent and comparable format. The aim is to help with the development of more comprehensive and comprehensible information about organisations, prospective as well as retrospective, to meet the needs of a more sustainable global economy.
An important aspect of good corporate governance is to follow best practice and this report aims to support the continued effort and improvement of integrated reporting by SOCs. It also seeks to gain insights in order to provide guidance to others. Furthermore, it acknowledges those SOCs that do apply the true spirit of the <IR> Framework in corporate governance, financial disclosure, sustainability and <IR> categories.
This year’s report also forms a bridge from the old to the new, with the same purpose of encouraging improved <IR> by all relevant companies over a period of time. The companies that have not yet acted, should start immediately or will simply be left behind, which would be an enormous set-back in the progress shown to date, and no doubt will have serious consequences in terms of disclosure to shareholders and other stakeholders.
The weighting of the elements of the International <IR> Framework is provided in Chapter 1.
5.1 THE PROCESS
The annual or integrated reports of the 20 companies listed in Annexure A were used in the survey, with the most recent reports
obtained from their websites. The panel of experts prepared a grading sheet with weighting assigned to the respective guidelines of the <IR> Framework.
The companies which were rated in the top half the previous year, were then evaluated independently by two of the experts (the lower half were evaluated by one expert only), while the third and fourth experts acted as independent adjudicators, who also graded a representative sample of the annual reports, including those of the best-rated companies.
It must be stated that none of the companies surveyed entered a competition or submitted data to the panel and none had any knowledge of this evaluation process. In the spirit of true transparency the idea is to evaluate/survey/judge the information available to any citizen in the world (either via Internet access or via access to printed annual reports from registrars). Therefore, in the data collection process, the panel used all annual reports, integrated reports and sustainability reports openly available on the Internet.
The detailed grade sheets are not reproduced here, but they contain the full recommendations regarding integrated disclosure from the <IR> Framework.
Where <IR> by itself had a scoring of 47% of the total score in 2013, it made up just 35% in the years before that. It is now a full 100% and we believe that this change in scoring and awarding good disclosure comes at the perfect time.
Two experts awarded a score out 200 for each company and converted the scores into percentages for ease of comparison.
The adjudicator also awarded scores for a selection of the companies, as well as for the top scorers and potential winners. The scores were then further analysed and re-marked where necessary. Finally, the results were used to determine the ratings for the companies. It is unfortunate to report that, despite all efforts to obtain the annual report of SA Express, it could not be found in time to be assessed.
PURPOSE AND RESEARCH METHODOLOGY

© Nkonki Proprietary 2015
40 |
5.2 THE PANEL
1. Prof Anton du Toit, CA(SA), BA, B Compt, Hons B Compt, CTA, M Com, M.Inst.D., RA, is a corporate governance expert and director of companies. He was the Director of Accoun-tancy Studies at MSA (Monash South Africa), accredited with SAICA as a service provider for CTA, from 2006 to 2014. He is an adjunct professor at the University of Zululand. He held the position of Professor in Accounting at both the University of Johannesburg and North-West University for a total of 19 years, during which time he served on the senates of both universities. He is an accomplished computer auditor with research interests in business ethics, corporate governance and sustainability. Anton presented various seminars and conferences, both internationally and locally, on auditing concepts. He has evaluated numerous articles in accredited journals, and is a founding presenter of the newly-established Postgraduate Diploma in Management specialising in Corporate Governance at MSA.
Anton is on early retirement due to health reasons (paraplegic: limited mobility), but still consults privately and lectures part-time at MSA. He also serves on the Audit Committees of ICASA, Spectramed Medical Aid, the Tswane University of Technology (TUT), Tlokwe City Council, Capricorn District Municipality and Aganang Municipality. He is a non-ex-ecutive director of NG Welfare (NG Welsyn) and chairman of the Audit Committee. He served as member of the Audit Committee of the Gauteng Provincial Government. He serves on the Boards of three companies. He serves on various committees and interest groups in the profession. He is a past alternate Board member of the Independent Reg-ulatory Board of Auditors; past President of the Southern African Accounting Associa-tion; past Vice-President of the International Association for Accounting Education and Research; and past editor of Meditari, the accredited professional journal of accountancy.
Anton has been involved in audit and advisory services for many clients and in associa-tion with a variety of big audit firms. The largest clients include Workforce, Basil Read, Atlas Finance, IOM, SEW, International SOS and Rand Mutual Assurance. Previous clients include Afrox, Honda SA, BP, the JSE, Sappi, Mondi, South-West Coop, AGN of ABSA and Sanlam.
2. Blanche Steyn, B Com, B Compt (Honours), M Com, CA(SA), ACMA, CGMA, CISA and CIA. She focuses on research in accountancy education and governance. She has been an ac-ademic for more than 20 years and is currently a senior lecturer at MSA and the auditing subject leader responsible for teaching auditing at a third year level. She has presented various conferences, symposiums and workshops on auditing and related topics interna-tionally and locally. Blanche is the author of various articles on governance, accountancy education, internal and computer auditing for professional magazines and academic journals. She is an adjudicator for three academic journals and the chairperson of the Jo-hannesburg region of the South African Accounting Association. She was also a founding presenter of the newly-established Postgraduate Diploma in Management specialising in Corporate Governance at MSA.
3. Adrian Pilley – BCompt, BCompt (Honours) MCom, CA(SA) RA. Adrian has been lecturing taxation for seven years at Monash at third-year level and financial accounting for the last four years. Prior to lecturing, Adrian enjoyed a successful career in commerce and indus-try for over 15 years. His research interests are in the field of integrated reporting.
4. Rufaro Gweshe – LLB, LLM (UCT). Rufaro has been a part of academia since 2008. She has been lecturing business law for the past five years and has lectured students ranging from first to final year at MSA since 2013. Her research interests lie generally within the field of company law, and specifically in business rescue. Rufaro’s two publications and two conference papers lie within the fields of public and commercial law. She is also the former editorial assistant for the South African Journal of Criminal Justice.
“The independent research panel has years of combined expertise in the fields of integrated reporting, corporate governance, accounting and auditing, and are considered experts in their fields.”

Integrated Reporting – A New Era
© Nkonki Proprietary 2015
| 41
Annexure A: Schedule 2 State Owned Companies Analysed
ANNEXURES
Air Traffic and Navigation Services
Company SOC Limited
Airports Company of South Africa SOC
LimitedAlexkor SOC Limited
Armaments Corporation of South
Africa SOC Limited
Broadband Infraco SOC Limited CEF SOC Ltd
Denel SOC Limited Development Bank of Southern Africa
Eskom Holdings SOC Ltd
Independent Development Trust
Industrial Development
Corporation of South Africa Limited
Land and Agricultural Development Bank of
South Africa
South African Airways SOC Limited
South African Broadcasting
Corporation SOC Limited
South African Forestry Company
SOC Limited
South African Nuclear Energy Corporation
SOC Limited
South African Post Office SOC Limited
Telkom SA SOC Limited Trans-Caledon Tunnel Authority
Transnet SOC Limited

© Nkonki Proprietary 2015
42 |
Annexure B: Glossary of Terms
AFS: Annual Financial Statements
CEO: Chief Executive Officer
CFO: Chief Financial Officer
ESG: Environment, Social and Governance
GDP: Gross Domestic Product. The monetary value of all the finished goods and services produced within a country’s borders in a specific time period, though GDP is usually calculated on an annual basis.
GRI:
The Global Reporting Initiative is a network-based organisation that pioneered the world’s most widely used sustainability reporting framework. GRI is committed to the Framework’s continuous improvement and application worldwide. GRI’s core goals include the mainstreaming of disclosure on environmental, social and governance performance (https://www.globalreporting.org/information/about-gri/Pages/default.aspx, accessed on 15 March 2013).
G4: The GRI G4 Guidelines make provision for compliance at a Core or Comprehensive level. Companies should apply the latest GRI G4 guidelines applicable for reports published after 31 December 2015.
IRC: The Integrated Reporting Committee of South Africa
IIRC:
The International Integrated Reporting Council was formed in July 2010 and is currently chaired by Professor Mervyn King. The mission of the IIRC is to create a globally accepted <IR> Framework which brings together financial, environmental, social and governance information in a clear, concise, consistent and comparable format. The aim is to help with the development of more comprehensive and comprehensible information about organisations, prospective as well as retrospective, to meet the needs of a more sustainable, global economy.
Integrated thinking:
Is described in the <IR> Framework as “the active consideration by an organisation of the relationships between its various operating and functional units and the capitals that the organisation uses or affects” (IIRC, 2013c).
<IR>:
“Integrated Reporting” means a holistic and integrated representation of the company’s performance in terms of both its finance and its sustainability (IoD; 2009b). “Integrated Reporting (stylised by the IIRC as ‘<IR>’) is seen by the IIRC as the basis for a fundamental change in the way in which organisations are managed and report to stakeholders. A stated aim of <IR> is to support integrated thinking and decision-making.” (IIRC, 2013c).
JSE: Johannesburg Stock Exchange. The JSE Ltd (“JSE”) is licensed as an exchange under the Securities Services Act, 2004 and is Africa’s premier exchange.
King III: The King Report on Governance for South Africa 2009 and the King Code of Governance for South Africa 2009. Parktown, South Africa: The Institute of Directors (IoD) in Southern Africa.
KPI: Key Performance Indicator
PFMA: The Public Finance and Management Act that regulates the accountability of public entities (RSA, 1999)
RSA: Republic of South Africa
Sustainability:
Sustainability of a company means conducting operations in a manner that meets existing needs without compromising the ability of future generations to meet their needs. It means having regard to the impact that the business operations have on the economic life of the community in which it operates. Sustainability includes environmental, social and governance issues (IoD; 2009b).
SOC: The general term used in South Africa for State Owned Companies.

Integrated Reporting – A New Era
© Nkonki Proprietary 2015
ANNEXURES
Annexure C: Bibliography
Ballou, B, Heitger, DL & Landes, CE 2006: The future of corporate sustainability reporting, a rapidly growing assurance opportunity. Journal of Accountancy, 202, 6: 65-74.
Black Sun Plc 2014: Realizing the benefits: The impact of Integrated Reporting ©
GRI, 2013: The GRI Sustainability Reporting Guidelines, version 4. Amsterdam, The Netherlands. GR.
IoD, 2009a: The King Report on Governance for South Africa 2009. Parktown, South Africa: The Institute of Directors in Southern Africa.
IoD, 2009b: The King Code of Governance for South Africa 2009. Parktown, South Africa: The Institute of Directors in Southern Africa.
IIRC, 2013a: Consultation Draft of the International Integrated Reporting Framework.
IIRC, 2013b: International Integrated Reporting Framework (IIRC) (December 2013).
IIRC, 2013c: IIRC finalises its Framework for Integrated Reporting – 9 December 2013. International Integrated Reporting Council. Available at: http://www.iasplus.com/en/news/2013/12/iirc [Accessed 22 March 2015].
IIRC, 2014: Assurance on <IR> – An Introduction to the Discussion. International Integrated Reporting Council. Available at: http://www.theiirc.org/resources-2/assurance/ [Accessed 2 February 2015].
IRC, 2014: Preparing an Integrated Report – A starter’s guide. Integrated Reporting Committee of South Africa. Graymatter & Finch. Johannesburg
King, M. & Roberts, L., 2013: Integrate – Doing Business in the 21st Century. Juta, Cape Town.
RSA, 1999. Public Finance and Management Act, No1 of 1999. Pretoria: Government printer.
Wikipedia, 2015: Dreyfus model of skill acquisition. Available at: http://en.m.wikipedia.org/wiki/Dreyfus_model_of_skill_acquisition [accessed 10 April 2015].
| 43

© Nkonki Proprietary 2015
44 |
“<IR> is a journey to ensure the entire sustainability of an
entity – in a manner that meets its existing needs without
compromising the ability of future generations to meet their
needs.”

www.nkonki.com
Physical Address:
Nkonki House 1 Simba Road cnr. Nanyuki Road Sunninghill Johannesburg, 2157
Postal Address:
P.O. Box 1503 Saxonwold 2132
Contact details
Tel: +2711 517 3000 Fax: +2711 807 8630
www.nkonki.com
© Nkonki Proprietary 2015

![[PPT]VALUE CHAIN PLANNING Development Update Q1 …isdportal.oracle.com/sfdemo/SF_UPK/user2015/150608-bnault... · Web viewOpenWorld & Value Chain Summit SLM/SDH Update Highest attended](https://img.pdfslide.us/doc/110x75/5aa398037f8b9a436d8e5c91/pptvalue-chain-planning-development-update-q1-viewopenworld-value-chain-summit.jpg)