Embed Size (px)
Citation preview
(12) United States PatentOrtyn et al.
(54) EXTENDED DEPTH OF FIELD IMAGINGFOR HIGH SPEED OBJECT ANALYSIS
(75) Inventors: William Ortyn, Bainbridge Island, WA(US); David Basiji, Seattle, WA (US);Keith Frost, Seattle, WA (US); LuchuanLiang, Woodinville, WA (US); RichardBauer, Kirkland, WA (US); Brian Hall,Seattle, WA (US); David Perry,Woodinville, WA (US)
(73) Assignee: Amnia Corporation, Seattle, WA (US)
(*) Notice: Subject to any disclaimer, the term of thispatent is extended or adjusted under 35U.S.C. 154(b) by 735 days.This patent is subject to a terminal dis-claimer.
(21) Appl. No.: 12/132,394
(22) Filed: Jun. 3, 2008
(65) Prior Publication Data
US 2008/0234984 Al Sep. 25, 2008
Related U.S. Application Data
(63) Continuation of application No. 11/609,269, filed onDec. 11, 2006, application No. 12/132,394, which is acontinuation of application No. 11/123,610, filed onMay 4, 2005, now Pat. No. 7,450,229, and acontinuation-in-part of application No. 10/628,662,filed on Jul. 28, 2003, now Pat. No. 6,975,400, which isa continuation-in-part of application No. 09/976,257,filed on Oct. 12, 2001, now Pat. No. 6,608,682, whichis a continuation-in-part of application No.09/820,434, filed on Mar. 29, 2001, now Pat. No.6,473,176, said application No. 09/820,434 is acontinuation-in-part of application No. 09/538,604,filed on Mar. 29, 2000, now Pat. No. 6,211,955, whichis a continuation-in-part of application No.09/490,478, filed on Jan. 24, 2000, now Pat. No.6,249,341, said application No. 09/976,257 , saidapplication No. 11/123,610.
(60) Provisional application No. 60/748,888, filed on Dec.9, 2005, provisional application No. 60/567,911, filedon May 4, 2004, provisional application No.
(lo) Patent No.: US 8,009,189 B2(45) Date of Patent: *Aug. 30, 2011
60/240,125, filed on Oct. 12, 2000, provisionalapplication No. 60/117,203, filed on Jan. 25, 1999.
(51) Int. Cl.
GOIJ3128 (2006.01)
GOIJ3/51 (2006.01)(52) U.S. Cl . ............ 348/80; 356/326; 356/73; 356/419;
382/133(58) Field of Classification Search .................... 348/80,
348/79; 356/326, 73, 419; 382/133See application file for complete search history.
(56) References Cited
U.S. PATENT DOCUMENTS
3,497,690 A 2/1970 Bahr et al . ................. 250A61.2
(Continued)
FOREIGN PATENT DOCUMENTSEP 0 154 404 9/1985
(Continued)
OTHER PUBLICATIONS
Amann et al., "Fluorescent-Oligonucleotide Probing of Whole Cellsfor Determinative, Phylogenetic, and Environmental Studies inMicrobiology," Journal of Bacteriology vol. 172, No. 2: 762-770,Feb. 1990.
(Continued)
Primary Examiner Haresh N Patel(74) Attorney, Agent, or Firm Ronald M. Anderson
(57) ABSTRACT
A high speed, high-resolution flow imaging system is modi-fied to achieve extended depth of field imaging. An opticaldistortion element is introduced into the flow imaging system.Light from an object, such as a cell, is distorted by the dis-tortion element, such that a point spread function (PSF) of theimaging system is invariant across an extended depth of field.The distorted light is spectrally dispersed, and the dispersedlight is used to simultaneously generate a plurality of images.The images are detected, and image processing is used toenhance the detected images by compensating for the distor-tion, to achieve extended depth of field images of the object.The post image processing preferably involves de-convolu-tion, and requires knowledge of the PSF of the imaging sys-tem, as modified by the optical distortion element.
35 Claims, 15 Drawing Sheets
https://ntrs.nasa.gov/search.jsp?R=20110015423 2018-07-14T10:27:21+00:00Z
US 8,009,189 B2Page 2
U.S. PATENT DOCUMENTS 6,259,807 B1 7/2001 Ravkin .......................... 381/1336,330,081 B1 12/2001 Scholten ....................... 358/463
3,555,280 A 1/1971 Richards, Jr. """"""""' 250/201 6,330,361 B1 12/2001 Mitchell et al. 382/2113,586,760 A 6/1971 Dillenburger ................. 348/339 6,381,363 B1 4/2002 Murching et al. ............ 382/1643,922,069 A 11/1975 Kishikawa et al. ........... 359/633 6,473,176 B2 10/2002 Basiji et al.
""""""""356/326
"'4,313,734 A 2/1982 Leuverin g """""""""""' 23/230 6,507,391 B2 1/2003 Basiji et al.""""""""
356/28""'4,414,575 A 11/1983 Yamamoto et al. """""' 348/350 6,510,319 B2 1/2003 Baum et al.
""""""""455/442
"'4,635,293 A 1/1987 Watanabe """"""""""' 382/130 6,519,355 B2 2/2003 Nelson .......................... 382/1334,662,742 A 5/1987 Chupp ............................ 356/39 6,522,781 B1 2/2003 Norikaneetal.
"""""382/203
"'4,677,680 A 6/1987 Harima et al. """""""" 382/112 6,532,061 B2 3/2003 Ortyn et al.""""""""
356/28""'4,703,017 A 10/1987 Campbell et al.Camp """"""' 436/501 6,548,259 B2 4/2003 Ward et al.
""""""""435/6
""""4,737,932 A 4/1988 Baba ............ """"" 364/900""" 6,549,664 B1 4/2003 Daiber et al."""""""
382/232"'4,770,992 A 9/1988 Van den Engh et al. .......... 435/6 6,563,583 B2 5/2003 Ortyn et al . ................... 356/400
4,777,525 A 10/1988 Preston, Jr. """""""""' 348/111 6,580,504 B1 6/2003 Basiji etal.""""""""
356/338"'4,786,165 A 11/1988 Yamamoto et al. """"""' 356/23 6,583,865 B2 6/2003 Basiji et al.
""""""""356/73
""'4,845,197 A 7/1989 Petersen et al. """""""' 530/387 6,608,680 B2 8/2003 Basiji et al.""""""""
356/338"'4,857,453 A 8/1989 Ullman et al. """""""""" 435/7 6,608,682 B2 8/2003 Ortyn et al.
""""""""356/419
"'5,096,807 A 3/1992 Leaback """"""""""""" . 435/6 6,618,140 B2 9/2003 Frost et al. 356/3175,107,522 A 4/1992 Kita ama et al.Y 375/97 6620591 B1, , 9/2003 Dunl a Y et al. 435/7.25,122,453 A 6/1992 Martin et al . ............... 435/7.24 6,658,143 B2 12/2003 Hansen et al. ................ 382/1335,141,609 A 8/1992 Sweedler et al . ............. 204/452 6,671,044 B2 12/2003 Ortyn et al.
""""""""356/326
"'5,153,916 A 10/1992 gIna akietal. """""""" 382/151 6,671,624 B1 12/2003 DunlaY et al.""""""
702/19"""5,159,397 A 10/1992 Kosaka et al. 356/73 6,707,551 B2 3/2004 et .................. 356/338
5,159,398 A 10/1992 Maekawa et al ................ 356/73 6,716,588 B2 4/2004et
Sammak et al . .............Sam
435/7.235,159,642 A 10/1992 Kosaka """"""""""""' 382/134 6,727,066 B2 4/2004 Kaser ................................ 435/65,247,339 A 9/1993 Ogino ............................. 356/73 6,763,149 B2 7/2004 Rileytal.Y """"""""
382/294""5,247,340 A 9/1993 Ogino """""""""""""" . 356/73 6,778,263 B2 8/2004 Ortyn et al. .356/28
5,257,182 A 10/1993 Luck et al. """"""""' 364/413.1 6,875,9736,875,973 B2 4/2005 Ortyn et al. 250/201.35,272,354 A 12/1993 Kosaka ......................... 250/574 6,906,792 B2 6/2005 Ortyn et al. .................. 356/28.55,351,311 A 9/1994 Rogers et al . ................. 382/156 6,927,922 B2 8/2005 George et al.g """""""
359/708"'5,372,936 A 12/1994 Fraatz et al. """""""""" 435/34 6,934,408 B2 8/2005 Frost et al.
""""""""382/129
""5,422,712 A 6/1995 Oginog """""""""""""' .. 356/73 6,947,128 B2 9/2005 Basiji etal.""""""""
356/73""'5,436,144 A 7/1995 Stewart et al. """""""' 435/91.2 6,947,136 B2 9/2005 Ortyn et al.
""""""""356/338
"'5,444,527 A 8/1995 Kosaka """"""""""""" . 356/73 6,975,400 B2 12/2005 Ortyn et al.""""""""
356/419"'5,459,240 A 10/1995 Foxwell et al. """""""' 530/328 7,006,710 B2 2/2006 RileyY et al. """""""" 82/294""5,471,294 A 11/1995 Oginog """"""""""""""' 356/73 7,033,819 B2 4/2006 Kim et al.
"""""""""435/29
""'5,547,849 A 8/1996 Baer et al. """""""""" 435/7.24 7,042,639 B1 5/2006 McDowell""""""""
359/398""5,548,349 A 8/1996 g ucMizu hi et al. """""' 348/766 7,050,620 B2 5/2006 Heckman ...................... 382/133
5,548,395 A 8/1996 Kosaka ........................... 356/73 7,057,732 B2 6/2006 Jorgenson et al.g """"356/445
""5,568,315 A 10/1996 Shuman """""""""""" 359/487 7,079,708 B2 7/2006 Rileyt al.Y """"""""382/294
""5,596,401 A 1/1997 Kusuzawa ....................... 356/23 7087,877 B2 8/2006 Ortyn et al . ................ 250/201.25,621,460 A 4/1997 Hatlestad et al. """"""' 348/265 7,139,415 B2 11/2006 Finkbeiner .................... 382/1285,625,048 A 4/1997 Tsien et al . .................. 536/23.4 7,190,832 B2 3/2007 Frost et al.
""""""""382/173
""5,633,503 A 5/1997 Kosaka """""'""""" 250A58.1 ,221,457 B2 5/2007 et al. Jorgensong """"56/445
""5,644,388 A 7/1997 Maekawa et al. """"""" . 356/73 7,289,205 B2 10/2007 Yaroslaysky et al.......... 356/4175,674,743 A 10/1997 Ulmer ........................ 435/287.2 7,315,357 B2 1/2008 Ortyn et al ...................... 356/735,686,960 A 11/1997 Sussman et al . .............. 348/335 7,450,229 B2 * 11/2008 Ortyn et al.
""""""""356/326
"'5,695,934 A 12/1997 Brenner 435/6 7,567,695 B2 7/2009 Frost et al.""""""""
382/129""5,733,721 A 3/1998 Hemstreet, III et al. .......... 435/6 7/2001 Johnson .......................... 356/73
5,754,291 A 5/1998 Kain """"""""""""""' 356/3382001/0006416 A t2001/0012620 Al 8/2001 Rich
"""""""""""""435/7.1
""5,760,899 A 6/1998 Eismann """""""""""' 356/326 2002/0126275 Al 9/2002 Johnson""""""""""
356/3175,764,792 A 6/1998 Kenneal Y """"""""""" 382/133 2002/0146734 Al 10/2002 Ortyn et al.
"""""""""" 435/6"""'5,784,162 A 7/1998 Cabib et al. """""""""' 356/456 2002/0196980 Al 12/2002 Dowski, Jr. 382/232
RE35,868 E 8/1998 Kosaka ......................... 250/574 2003/0048931 At 3/2003 Johnson et al.""""""
382/128"'5,828,776 A 10/1998 Lee et al. """"""""""" 382/133 2003/0049701 At Muraca ........................ 435/7.23
5,831,723 A 11/1998 Kubota et al .................... 356/73 2003/0059093 At 3/2003 Rosania et al. 382/1285,844,670 A 12/1998 Morita et al. """"""""' 356/124 2003/0104439 At Finch """"""
"""""""""""""' 435/6""""5,848,123 A 12/1998 Strommer """""""""" 378/98. 8 2004/0093166 At Kil
""""""""""""""702/19
5,855,753 A 1/1999 Trauetal. """"""""""' 204/484 2004/0111220 Al 6/2004 Ochs et al. """ 702/19"""5,900,942 A 5/1999 S ierinp g """""""""""' 356/400 2004/0228005 Al 11/2004 Dowski Jr """""""", .
"""""""""' 359/671
5,926,283 A 7/1999 Ho kinsp """""""""""' 356/419 2004/0241759 Al 12/2004 Tozer et al. 435/7.25,929,986 A 7/1999 Slater et al. """""""""' 356/326 2005/0014129 Al 1/2005 Cliffel et al. """"""""
""""""""" 435/4""""5,959,953 A 9/1999 Alon """"""""""""" 369/44. 41 2006/0246481 Al 11/2006 Finch et al. 435/65,985,549 A 11/1999 Sin er et al.g """"""
435/6""""" 2006/0257884 At 11/2006
""""""""Brawle et al.Y """""""""'
"""'435/65,986,061 A 11/1999 Pestka ........................... 530/352
6,007,994 A 12/1999 Ward et al. 435/6 2007/0054350 At 3/2007 Walker, Jr . ...................... 435/34
6,007,996 A 12/1999 McNamara et al............ 435/6 2008/0240539 Al 10/2008 George et al .................. 382/1336,014,468 A 1/2000 McCarthy et al. 382/254 2009/0202130 At 8/2009 George et al .................. 382/1336,066,459 A 5/2000 Garini et al . ...................... 435/6 FOREIGN PATENT DOCUMENTS6,108,082 A 8/2000 Pettipiece et al . ............ 356/3016,115,119 A 9/2000 Sieracki et al . ............... 356/337 EP 0 280 559 8/19886,116,739 A 9/2000 Ishihara et al . ................. 353/31 EP 0 281 327 6/19936,156,465 A 12/2000 Cao et al ......................... 430/30 EP 0 372 707 3/19966,159,686 A 12/2000 Kardos et al ...................... 435/6 EP 0 950 890 10/19996,210,973 B1 4/2001 Pettit ............................. 436/172 EP 1 316 793 6/20036,211,955 B1 4/2001 Basiji et al . ................... 356/326 WO WO 88/08534 11/19886,229,913 B1 5/2001 Nayar et al . .................. 382/154 WO WO 90/10715 9/19906,249,314 B1 6/2001 Yamamoto et al. ........... 348/242 WO WO 95/20148 7/19956,249,341 B1 6/2001 Basiji et al . ..................... 356/73 WO WO 97/26333 7/19976,256,096 B1 7/2001 Johnson ........................ 356/335 WO WO 98/53093 11/1998
US 8,009,189 B2Page 3
WO WO 98/53300 11/1998WO WO 99/24458 5/1999WO WO 99/64592 12/1999WO WO 00/06989 2/2000WO WO 00/14545 3/2000WO WO 00/42412 7/2000WO WO 0 1/ 11341 2/2001WO WO 01/46675 6/2001WO WO 02/17622 2/2002WO WO 02/18537 3/2002WO WO 02/35474 5/2002WO WO 02/073200 9/2002WO WO 02/079391 10/2002
OTHER PUBLICATIONS
Arkesteijn et al., "Chromosome Specific DNA Hybridization in Sus-pension for Flow Cytometric Detection of Chimerism in Bone Mar-row Transplantation and Leukemia," Cytometry 19: 353-360, Apr.1995.Bains et al., "Flow Cytometric Quantitation of Sequence-SpecificmRNA in Hemopoietic Cell Suspension by Primer-Induced in Situ(PRINS) Fluorescent Nucleotide Labeling," Experimental CellResearch 208: 321-326, Sep. 1993.Callet-Bauchu et al., "Distribution of the cytogenetic abnormality+i(3)(g10) in persistent polyclonal B-cell lymphocytosis: aFICTIONstudy in three cases," British Journal of Haematology 99: 531-536,Dec. 1997.Ding et al., "Characterization and Quantitation of NF-KB NuclearTranslocation Induced by Interleukin-1 and Tumor Necrosis Factor-a," The Journal of Biological Chemistry vol. 273, No. 44: 28897-28905, Oct. 30, 1998.Dragowska et al., "Measurement of DNA repeat sequence by flowcytometry," Cytometry Supplement 7: 51, Oct. 1994.Fernandez-Lago et al., "Fluorescent Whole-Cell Hybridization with16S rRNA-Targeted Oligonucleotide Probes To Identify Brucellaspp. By Flow Cytometry," Journal of Clinical Microbiology vol. 38,No. 7: 2768-2771, Jul. 2000.Gordy et al., "Visualization of Antigen Presentation by Actin-Medi-ated Targeting of Glycolipid-Enriched Membrane Domains to theImmune Synapse of B cell APCs." Journal oflmmunology vol. 172,No. 4: 2030-2038, Feb. 15, 2004.Hultdin et al., "Telomere analysis by fluorescence in situ hybridiza-tion and flow cytometry," Nucleic Acids Research vol. 26, No. 16:3651-3656, Aug. 15, 1998.Lauzon et al., "Flow Cytometric Measurement of Telomere Length,"Cytometry 42: 159-164, Jun. 2000.Levron et al., "Sperm chromosome abnormalities in men with severemale factor infertility who are undergoing in vitro fertilization with
intracytoplasmic sperm injection," Fertility and Sterility vol. 76, No.3: 479-484, Sep. 2001.Majno et al., "Apoptosis, Oncosis, and Necrosis An Overview ofCellDeath,"American Journal ofPathology vol. 146, No. 1: 3-15, Jan. 1,1995.Patterson et al., "Detection of HIV-1 DNA and Messenger RNA inIndividual Cells by PCR-Driven in Situ Hybridization and FlowCytometry," Science 260: 976-979, May 14, 1993.Ried et al., "Simultaneous visualization of seven different DNAprobes by in situ hybridization using combinatorial fluorescence anddigital imaging microscopy," Proceedings of the National AcademyofSeiences: Genetics 89: 1388-1392, Feb. 1992.Robbins et al., "Aneuploidy in sperm of Hodgkin's disease patientsreceiving NOVP chemotherapy," The American Journal of HumanGenetics vol. 55, No. 3-Supplement: A68 (371), Sep. 1994.Rufer et al., "Telomere length dynamics in human lymphocytesubpopulations measured by flow cytometry," Nature Biotechnology16: 743-747, Aug. 1998.Wyrobek et al., "Smokers produce more aneuploid sperm than non-smokers," The American Society of Human Genetics, 45 `h AnnualMeeting, A131: 737, Oct. 24-28, 1995.Wyrobek et al., "Fluorescence in Situ Hybridization to Y Chromo-somes in Decondensed Human Sperm Nuclei," Molecular Reproduc-tion and Development 27: 200-208, 1990.Biggs, David S.C., and Mark Andrews. "Acceleration of iterativeimage restoration algorithms" Applied Optics vol. 36, No. 8. Mar. 10,1997.Ong, Sim Heng. 1985. Development of a System for Imaging andClassifying Biological Cells in a Flow Cytometer. Doctor of Philoso-phy Thesis. University of Sydney, School of Electrical Engineering.(August).Ong, S.H. et al. 1987. "Development of an Image Flow Cytometer."Analytical and Quantitative Cytology and Histology. wVth Interna-tional Conference on Medical and Biological Engineering and theVIIth International Conference on Medical Physics, Finland.(August): 375-382.Tucker, Sara C., W. Thomas Cathey and Edward R. Dowski, Jr."Extended depth of field and aberration control for inexpensive digi-tal microscope systems" Optics Express vol. 4, No. 11. May 24, 1999.pp. 467-474.Oberholzer et al., "Methods in quantitative image analysis."Histochem Cell Biol, vol. 105: 333-355, 1996.Ferraro et al., "Extended focused image in microscopy by digitalholography." Optics Express, vol. 13, No. 18: 6738-6749, 2005.
* cited by examiner
e nlarged
cells
— — — — — — — -
00.cc1
U
100
f 99
5B
CUVETTEMANIPULATOR
FIG. 1B
138/142 (TYP)
102
98
U.S. Patent Aug. 30, 2011 Sheet I of 15
US 8,009,189 B2
114
1038105 '-,
1
4114120
11 20120^0^1 20
0 0,0
120
118
103A
16
K---" 150
110
108
W3 106
104rl^^ V
FIG. ]A
U.S. Patent Aug. 30, 2011 Sheet 2 of 15
US 8,009,189 B2
cc-----------
-----------
C)IT
00 CD
(0M 00
LOC)
co
Cr)
(Y)
M C%4ce)
NC-4CN
< mU)
k(:,:)
ce)
C')
C)(Y)
co
(DLO
CY)
CD ^OLO C14
NcoLO ..00
C)
; " LO.......... CY)
------------ ;, •. 1.% 00A ----------
Lr)CNCO-----------
----------
- ----------
C%j
-0
U.S. Patent Sheet 3 of 15 US 8,009,189 B2Aug. 30, 2011
151SAMPLE if VOLUME/
FLOW CELL
152DISTORTION f
ELEMENT
X153COLLECTION,
DISPERSING ANDIMAGING OPTICS
154
DETECTOR
155
PROCESSOR
6:.
150 FIG. 3
157
FIG. 5
U.S. Patent Aug. 30, 2011 Sheet 4 of 15 US 8,009,189 B2
i----------------- START 160iii
DEFORM AN OPTICALWAVEFRONT OF LIGHT FROM AN 162
OBJECTiii
DISPERSE DEFORMED LIGHT 163iiii
USE DISPERSED LIGHT TOGENERATE DISPERSED IMAGE/ 164
i PLURALITY OF IMAGESiiii
GENERATE IMAGE DATA 166iiii ------------ --------------
i DETERMINE THE MODIFIED POINT SPREAD------ 168 FUNCTION OF THE IMAGING SYSTEM
DECONVOLVE THE IMAGE DATA., 170
GENERATE EXTENDED DEPTHOF FIELD IMAGE FOR OBJECT k72
DONE x.174
FIG. 4
z'/t
0.60
0.5!
0.51
0.4:
0.41
0.3
U.S. Patent Aug. 30, 2011 Sheet 5 of 15 US 8,009,189 B2
0.0 0.2 0.4 0.6 0.8
Sin O
FIG. 7
FIG. 8 (PRIOR ART)
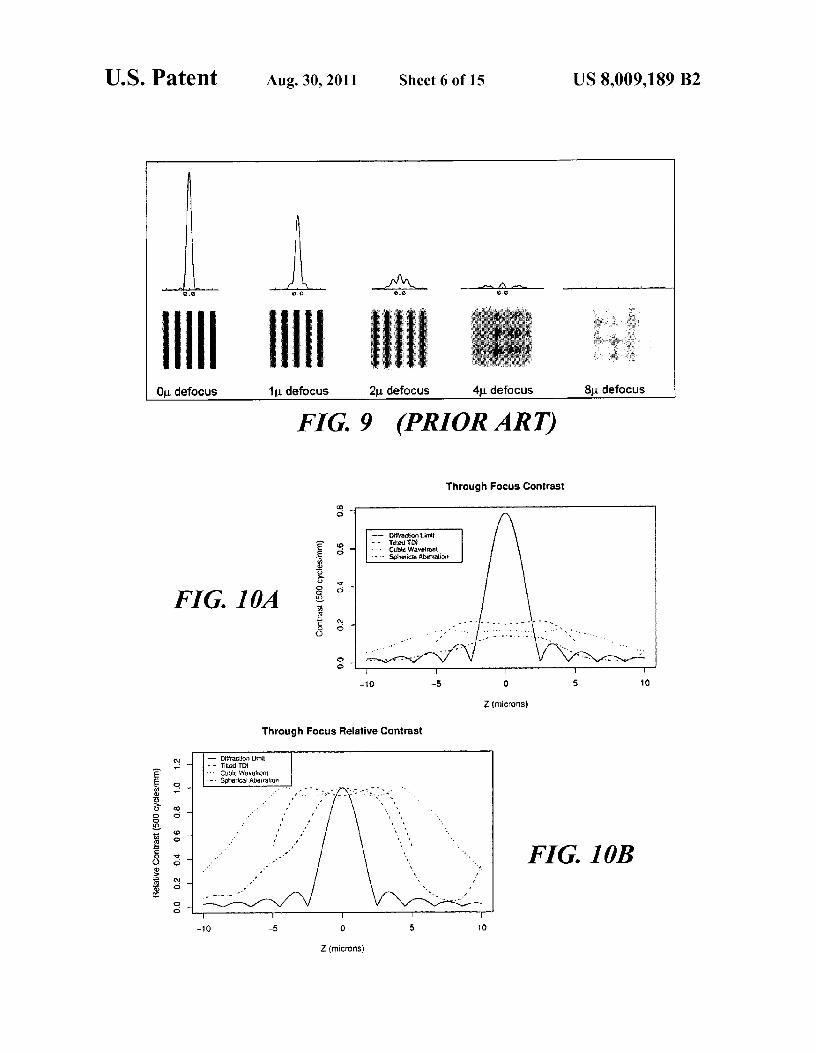
FIG. IOB
EE
maTVOO4]
N
ff
U.S. Patent Aug. 30, 2011 Sheet 6 of 15 US 8,009,189 B2
FIG. 9 (PRIOR ART)
Through Focus Contrast
CD0
E aE
mua.V V
FIG. I OAC NQ OCJ O
C
— Ui4rgd "gn limit
- - Timm tot^^- Cubk WavMrom--• $plrericul At^srrtition
-10 -5 0 5 10
Z (microns)
-10 -5 0 5 10
Z (microns)
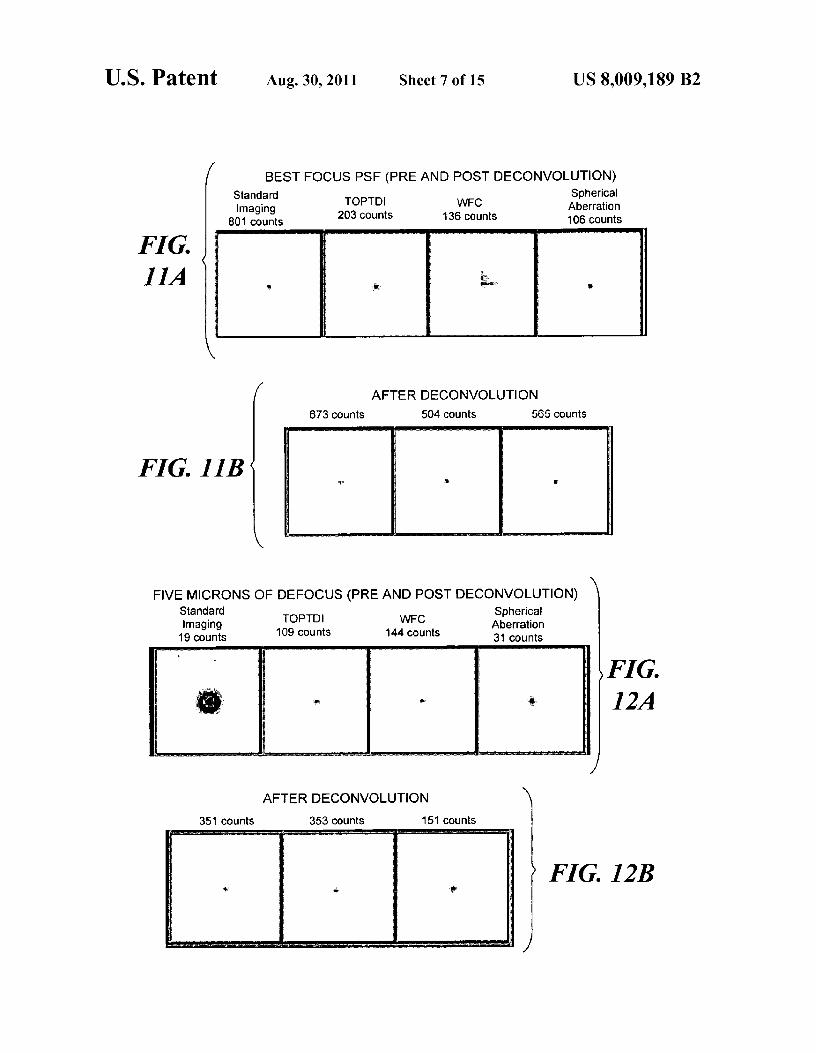
FIG.l2A
FIG. 12B
U.S. Patent Aug. 30, 2011 Sheet 7 of 15 US 8,009,189 B2
FIG.HA
BEST FOCUS PSF (PRE AND POST DECONVOLUTION)Standard SphericalImaging
TOPTDI WFC Aberration^01 counts
203 counts 136 counts 106 counts
AFTER DECONVOLUTION673 counts 504 counts 565 counts
FIG. I1B
FIVE MICRONS OF DEFOCUS (PRE AND POST DECONVOLUTION)Standard SphericalImaging
109 counts 144 countsAberration
19 counts 31 counts
AFTER DECONVOLUTION351 counts 353 counts 151 counts
U.S. Patent Aug. 30, 2011 Sheet 8 of 15
US 8,009,189 B2
o.
v; P1o.
a>!
CAM
ro NCD I
v
0 1 Y
ofra
o;Ln CD Ln CD
M
1^ r 0 NO N0)
M
t0 r v e- CY) N ti
I^
9n r M r O, N to
li(+7 r N ^- f^ N e!
M i
N OD r fL N r
M
U.S. Patent Aug. 30, 2011
Sheet 9 of 15 US 8,009,189 B2
STANDARD
Darkfield Fluoresencechannel i Chwwed 2 Charnel 3
100
10
303
30S
500
501
70
7o . r2
902
9031
201
g01
3Vp0
B130
7
1500
1
01
FIG. 14A(PRIOR ART)
EXTENDED DEPTH OF FIELD
Darkfield FluoresenceChancel1 ChwYel2 Channel3
100
101 i •
300 •
30
1 < •
500501
70070 • i1
s00 •
90 . ^1
11
p0 • •
110 •1130 •0130 •1150 10
350 ' +1
FIG. 14B
U.S. Patent Aug. 30, 2011
Sheet 10 of 15 US 8,009,189 B2
Standard Focus Pan: Intensity
700
600In Focus F:
N 500
400
300Q.
200- ` B um.Defocus
U-Bum Defocus.'
100
0 300 600 900 1.2e31.5e31.8e3Object Number
FL1 Peak Intensity
Median BackgroundNoise from all objects
6 = 0.97 counts
EDF Focus Pan: Intensity
700-y
600-Z 500-
fik In focus Pk:.2400-..
300f-! ' *; -Sum Defocus
200 8 um DefocusLL
100
0 300 600 900 1.2e31.5e31.8e3Object Number
FL1 Peak Intensity
Median BackgroundNoise from all objects
a = 1.3 counts
Population MeanAll 250.02-8 um Defocus 56.598 um Defocus 44.31In Focus Pk 641.98
Population MeanAll 437.07-bum Defocus 360.68 um Defocus 287.91In focus Pk 2 613.06
FIG. 15A -PRIOR ARTStandard Focus Pan: Area
600-Bum Def Area
500 +8 um Def Area
Ldt
0300- 0Co
200
100 x,'r Infocus Area YQ
r . ''-r'
300 600 900 ' 1 2 3 1 5 3 1 8`
FIG. 16AEDF Focus Pan: Area
0 . e . e . U. 0 300 600 900 1.2e3 1.5e3 1.8e3Object Number
Object Number
Area Morph Area Morph
Population MeanAll 53.26-8 um Area 24.87+8 um Area 32.35In Focus Area 23.47
FIG. 15B - PRIOR ART FIG. 16B
Population MeanAll 199.27•8um Def Area 437.25+8 um Def Area 412.44Infocus Area 32.35
U.S. Patent Aug. 30, 2011 Sheet 11 of 15 US 8,009,189 B2
Composde Composde Composde Composde Composde
2 2 2 2 44 5 5 7
55 , r 7 s; 5
FIG.17A 4 6 9 9 9
9 , , 5 5z h s s 2 a
Composite Composde Composde Composde Composite2 2 4 5 53 9 9 0 63 • 8 0 5 7
r ^ ^• ,a
•
FIG.17B6 7 7 9 s
2 , 4 3 83 5 2 r. 5 5
254
256
258
250
RAM
NOW
VOLATILEMEMORY
264
260 1 CPU
INPUTDEVICE
252
DATA LINK OUTPUTfl DEVICE
262
FIG. 24
4 Channel
a ,z'
8 Channel54^5^
Define Single 7 Channel
5
9e3
U.S. Patent Aug. 30, 2011 Sheet 12 of 15 US 8,009,189 B2
156
Population Count %Total %GatedAll 11001 1100 100
Cells 1595 159.4 159.4
5_Area
Population I Mean I Std. Dev.All 2926 11465
Cells 12846 1695.74
5—Aspect Ratio
Population I Mean Std. Dev.All 10.6128 0.2515Cells 10.7733 0.1174
Eliminate artifacts, cell fragments and cell aggregates
FIG. 18
8 Channel B Channel38 Channel3
9 9 9
(a) (b) (C)
Locate FISH spots, eliminate nonspecific binding segme nt ind ivi d ual probes
FIG. 19A FIG. 19B FIG. 19C
ma
2.a°
NAa _
q
a
of
a°o C d G N G O
A3uanbaij
n a:8Xo
COA_
aO
^po E
O°y C-̀
N v "'s W w
aLL N
y
_d U
b y ^
N b w r
H
onu a
c Cl0
aa°
6 U a Da
N`t
0m a
NI_
_ N Oq fn
LL
H
- o -0 00 0 =N Onha ^., a
U.S. Patent Aug. 30, 2011 Sheet 13 of 15
US 8,009,189 B2
C
c^CdC
d
EO
cn
o _am
mLLE
m qwK
E0
• • Y -
Nlsualul dead £
dN ^
u^oN Cai
O Ql° - x_
V U
C
dQ
b
N °^
^
0̂ cn
LL m aT
is Oa .6 to
- CJ D
LL
y o • lL K 0c
O °m n
•
a r
O OW
o6
P
oo
a •sa ^
viLL
i
0 0 0 0 0 0 00 0 0 ^ N o
Msualul WOd £
0rn w
Q
oaw to
^°o LL
MRyC
o -
o'a
Cd
EC)Cw
EOU)
OC
m^
O f 7
J
U n^
- N
CdEN
a m
O 1 _` m CY) a
C C)•N i b y m No ° dc w o o<
U Of d • C^LL
LL ° ^l C
CT O _
o o cc }
O
OO b
m G b N 9_ o•" c a
a y LL w0%
•1 y
••O
.•-j
IL CD 0
Wo -
. O .y
o 0 0 0 -0 o N
°O.
c
°a f
C
f fb e N
^ Nlsuwul dead £^c a o
glsualul Wad £
N
C
'a+
idE
C
WWNcoCL
N
a+
a 5 6
• ± • • a • 0 • s
3s
•
aasse a u
a
1
^
dRC i 0 0
& 0 a f
L S • 9
i'
U.S. Patent Aug. 30, 2011 Sheet 14 of 15 US 8,009,189 B2
4xovLex
fnrl+nY;
hmo411x
^aaw10x
Cmpalsex}
i^ ,
}
e
O
:
e
}
o i
s
1
ess
e
x } } x
q ^.e} .1. 3 0
e1 ^
e
Y } ] f
00
a 3
r O 0 y ) $.S '
} t 0 4 M 0 r A
Standard Mono Refined EDF Mono Refined
FIG. 22A
FIG. 23Ad E
e sq z €,: r e !
19 0 } e s
5 5 f e 3
0 0 0 0 •
e e 0 U p
a°
5 5 5 5 S
Standard Mono False Positive
FIG. 22B
001 o
x ) 9
1 ) 9 ^ e
. e! 9 } e}
} e e e 9
R } ) e }
x x xB 9 ]
s s e e} o } : e
EDF Mono False Positive
FIG. 23B
U.S. Patent Aug. 30, 2011 Sheet 15 of 15 US 8,009,189 B2
0
1
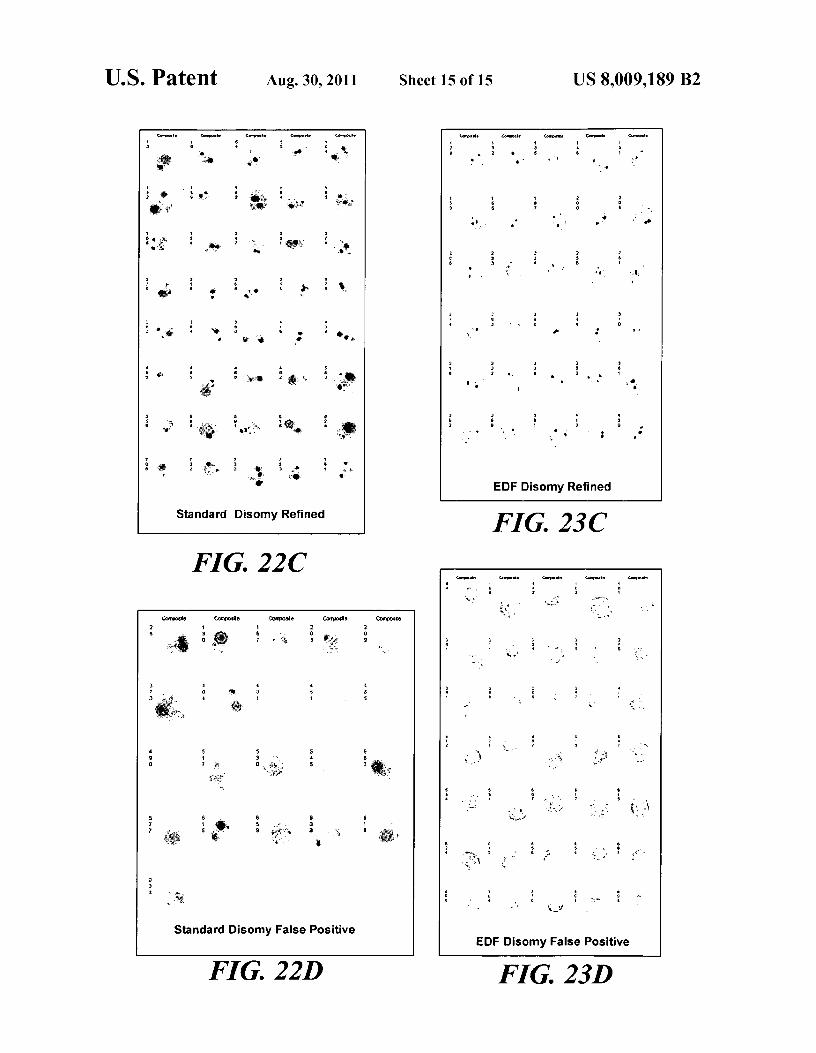
Standard Disomy Refined
I
EDF Disomy Refined
FIG. 23C
FIG. 22C
0 02 2
3
46
4
0 7 0 S 3
9 9 a
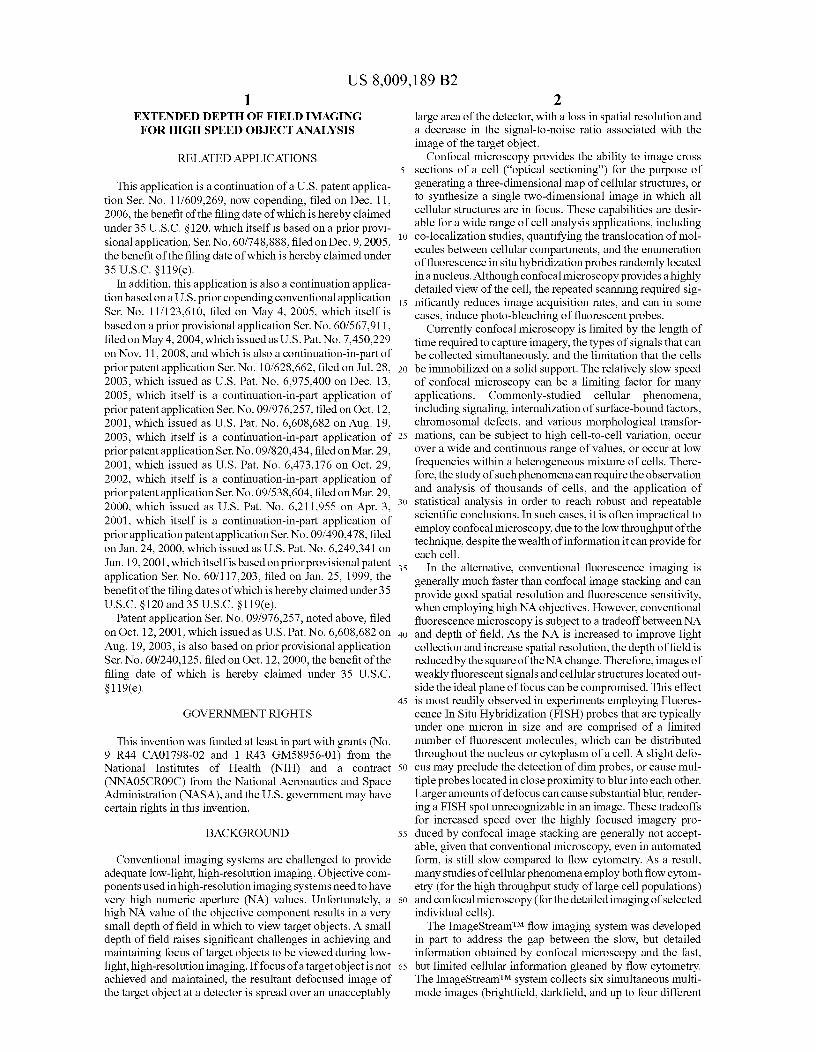
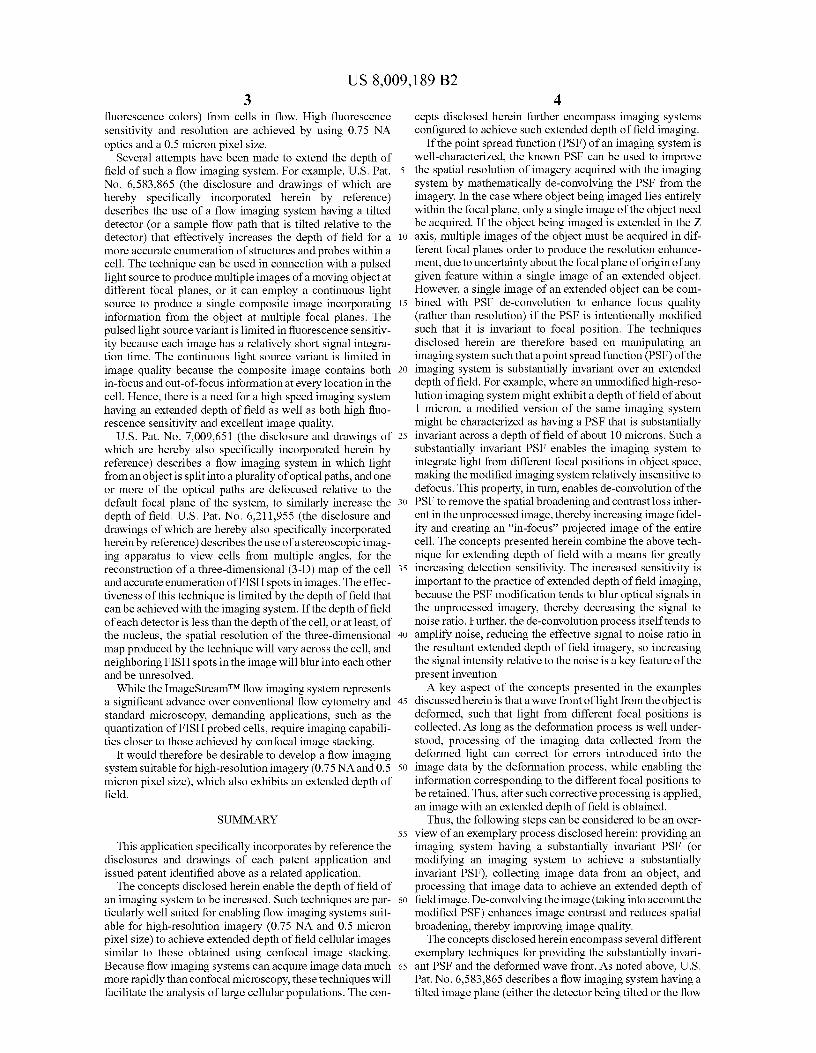
Standard Disomy False Positive
FIG. 22D
1
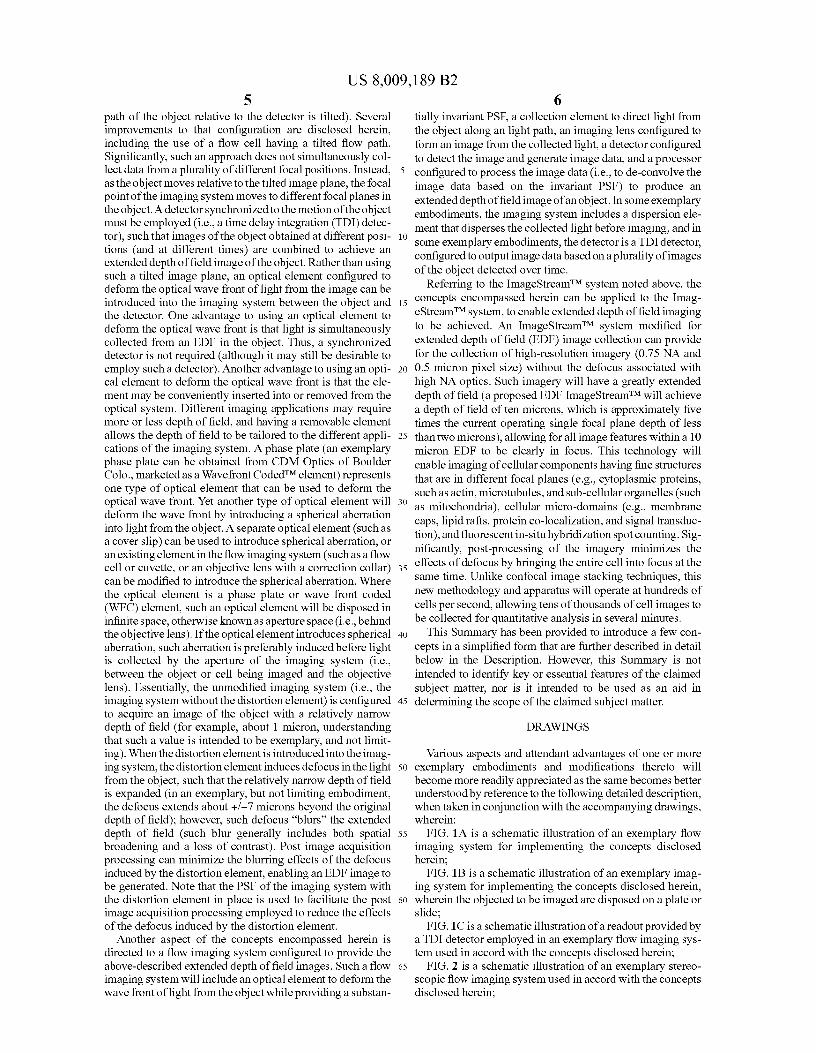
EDF Disomy False Positive
FIG. 23D
US 8,009,189 B21
EXTENDED DEPTH OF FIELD IMAGINGFOR HIGH SPEED OBJECT ANALYSIS
RELATED APPLICATIONS
This application is a continuation of a U.S. patent applica-tion Ser. No. 11/609,269, now copending, filed on Dec. 11,2006, the benefit of the filing date of which is hereby claimedunder 35 U.S.C. § 120, which itself is based on a prior provi-sional application, Ser. No. 60/748,888, filed on Dec. 9, 2005, 10
the benefit of the filing date of which is hereby claimed under35 U.S.C. §I19(e).
In addition, this application is also a continuation applica-tionbased on a U.S. prior copending conventional application 15
Ser. No. 11/123,610, filed on May 4, 2005, which itself isbased on a prior provisional application Ser. No. 60/567,911,filed on May 4, 2004, which issued as U.S. Pat. No. 7,450,229on Nov. 11, 2008, and which is also a continuation-in-part ofprior patent application Ser. No. 10/628,662, filed on Jul. 28, 202003, which issued as U.S. Pat. No. 6,975,400 on Dec. 13,2005, which itself is a continuation-in-part application ofprior patent application Ser. No. 09/976,257, filed on Oct. 12,2001, which issued as U.S. Pat. No. 6,608,682 on Aug. 19,2003, which itself is a continuation-in-part application of 25
prior patent application Ser. No. 09/820,434, filed on Mar. 29,2001, which issued as U.S. Pat. No. 6,473,176 on Oct. 29,2002, which itself is a continuation-in-part application ofprior patent application Ser. No. 09/538,604, filed on Mar. 29,2000, which issued as U.S. Pat. No. 6,211,955 on Apr. 3, 30
2001, which itself is a continuation-in-part application ofprior application patent application Ser. No. 09/490,478, filedon Jan. 24, 2000, which issued as U.S. Pat. No. 6,249,341 onJun. 19,2001, which itself is based on prior provisional patent 35
application Ser. No. 60/117,203, filed on Jan. 25, 1999, thebenefit of the filing dates of which is hereby claimed under 35U.S.C. §120 and 35 U.S.C. §119(e).
Patent application Ser. No. 09/976,257, noted above, filedon Oct. 12, 2001, which issued as U.S. Pat. No. 6,608,682 on 40
Aug. 19, 2003, is also based on prior provisional applicationSer. No. 60/240,125, filed on Oct. 12, 2000, the benefit of thefiling date of which is hereby claimed under 35 U.S.C.§ 119(e).
45
GOVERNMENT RIGHTS
This invention was funded at least in part with grants (No.9 R44 CA01798-02 and 1 R43 GM58956-01) from theNational Institutes of Health (NIH) and a contract 50
(NNA05CR09C) from the National Aeronautics and SpaceAdministration (NASA), and the U.S. government may havecertain rights in this invention.
BACKGROUND 55
Conventional imaging systems are challenged to provideadequate low-light, high-resolution imaging. Objective com-ponents used in high-resolution imaging systems need to havevery high numeric aperture (NA) values. Unfortunately, a 60
high NA value of the objective component results in a verysmall depth of field in which to view target objects. A smalldepth of field raises significant challenges in achieving andmaintaining focus of target objects to be viewed during low-light, high-resolution imaging. If focus of a target object is not 65
achieved and maintained, the resultant defocused image ofthe target object at a detector is spread over an unacceptably
2large area of the detector, with a loss in spatial resolution anda decrease in the signal-to-noise ratio associated with theimage of the target object.
Confocal microscopy provides the ability to image crosssections of a cell ("optical sectioning") for the purpose ofgenerating a three-dimensional map of cellular structures, orto synthesize a single two-dimensional image in which allcellular structures are in focus. These capabilities are desir-able for a wide range of cell analysis applications, includingco-localization studies, quantifying the translocation of mol-ecules between cellular compartments, and the enumerationof fluorescence in situ hybridization probes randomly locatedin a nucleus. Although confocal microscopy provides a highlydetailed view of the cell, the repeated scanning required sig-nificantly reduces image acquisition rates, and can in somecases, induce photo-bleaching of fluorescent probes.
Currently confocal microscopy is limited by the length oftime required to capture imagery, the types of signals that canbe collected simultaneously, and the limitation that the cellsbe immobilized on a solid support. The relatively slow speedof confocal microscopy can be a limiting factor for manyapplications. Commonly-studied cellular phenomena,including signaling, internalization of surface-bound factors,chromosomal defects, and various morphological transfor-mations, can be subject to high cell-to-cell variation, occurover a wide and continuous range of values, or occur at lowfrequencies within a heterogeneous mixture of cells. There-fore, the study of suchphenomena canrequirethe observationand analysis of thousands of cells, and the application ofstatistical analysis in order to reach robust and repeatablescientific conclusions. In such cases, it is often impractical toemploy confocal microscopy, due to the low throughput of thetechnique, despite the wealth of information it can provide foreach cell.
In the alternative, conventional fluorescence imaging isgenerally much faster than confocal image stacking and canprovide good spatial resolution and fluorescence sensitivity,when employing high NA objectives. However, conventionalfluorescence microscopy is subject to a tradeoff between NAand depth of field. As the NA is increased to improve lightcollection and increase spatial resolution, the depth of field isreducedby the square of the NA change. Therefore, images ofweakly fluorescent signals and cellular structures located out-side the ideal plane of focus can be compromised. This effectis most readily observed in experiments employing Fluores-cence In Situ Hybridization (FISH) probes that are typicallyunder one micron in size and are comprised of a limitednumber of fluorescent molecules, which can be distributedthroughout the nucleus or cytoplasm of a cell. A slight defo-cus may preclude the detection of dim probes, or cause mul-tiple probes located in close proximity to blur into each other.Larger amounts of defocus can cause substantial blur, render-ing a FISH spot unrecognizable in an image. These tradeoffsfor increased speed over the highly focused imagery pro-duced by confocal image stacking are generally not accept-able, given that conventional microscopy, even in automatedform, is still slow compared to flow cytometry. As a result,many studies of cellular phenomena employ both flow cytom-etry (for the high throughput study of large cell populations)and confocal microscopy (for the detailed imaging of selectedindividual cells).
The ImageStreamrM flow imaging system was developedin part to address the gap between the slow, but detailedinformation obtained by confocal microscopy and the fast,but limited cellular information gleaned by flow cytometry.The ImageStream rm system collects six simultaneous multi-mode images (brightfield, darkfield, and up to four different
US 8,009,189 B23
fluorescence colors) from cells in flow. High fluorescencesensitivity and resolution are achieved by using 0.75 NAoptics and a 0.5 micron pixel size.
Several attempts have been made to extend the depth offield of such a flow imaging system. For example, U.S. Pat. 5
No. 6,583,865 (the disclosure and drawings of which arehereby specifically incorporated herein by reference)describes the use of a flow imaging system having a tilteddetector (or a sample flow path that is tilted relative to thedetector) that effectively increases the depth of field for a 10
more accurate enumeration of structures and probes within acell. The technique can be used in connection with a pulsedlight source to produce multiple images of a moving object atdifferent focal planes, or it can employ a continuous lightsource to produce a single composite image incorporating 15
information from the object at multiple focal planes. Thepulsed light source variant is limited in fluorescence sensitiv-ity because each image has a relatively short signal integra-tion time. The continuous light source variant is limited inimage quality because the composite image contains both 20
in-focus and out-of-focus information at every location in thecell. Hence, there is a need for a high speed imaging systemhaving an extended depth of field as well as both high fluo-rescence sensitivity and excellent image quality.
U.S. Pat. No. 7,009,651 (the disclosure and drawings of 25
which are hereby also specifically incorporated herein byreference) describes a flow imaging system in which lightfrom an object is split into a plurality of optical paths, and oneor more of the optical paths are defocused relative to thedefault focal plane of the system, to similarly increase the 30
depth of field. U.S. Pat. No. 6,211,955 (the disclosure anddrawings of which are hereby also specifically incorporatedherein by reference) describes the use of a stereoscopic imag-ing apparatus to view cells from multiple angles, for thereconstruction of a three-dimensional (3-D) map of the cell 35
and accurate enumeration of FISH spots in images. The effec-tiveness of this technique is limited by the depth of field thatcan be achieved with the imaging system. If the depth of fieldof each detector is less than the depth of the cell, or at least, ofthe nucleus, the spatial resolution of the three-dimensional 40
map produced by the technique will vary across the cell, andneighboring FISH spots in the image will blur into each otherand be unresolved.
While the ImageStream rm flow imaging system representsa significant advance over conventional flow cytometry and 45
standard microscopy, demanding applications, such as thequantization of FISH probed cells, require imaging capabili-ties closer to those achieved by confocal image stacking.
It would therefore be desirable to develop a flow imagingsystem suitable for high-resolution imagery (0.75 NA and 0.5 50
micron pixel size), which also exhibits an extended depth offield.
SUMMARY55
This application specifically incorporates by reference thedisclosures and drawings of each patent application andissued patent identified above as a related application.
The concepts disclosed herein enable the depth of field ofan imaging system to be increased. Such techniques are par- 60
ticularly well suited for enabling flow imaging systems suit-able for high-resolution imagery (0.75 NA and 0.5 micronpixel size) to achieve extended depth of field cellular imagessimilar to those obtained using confocal image stacking.Because flow imaging systems can acquire image data much 65
more rapidly than confocal microscopy, these techniques willfacilitate the analysis of large cellular populations. The con-
4cepts disclosed herein further encompass imaging systemsconfigured to achieve such extended depth of field imaging.
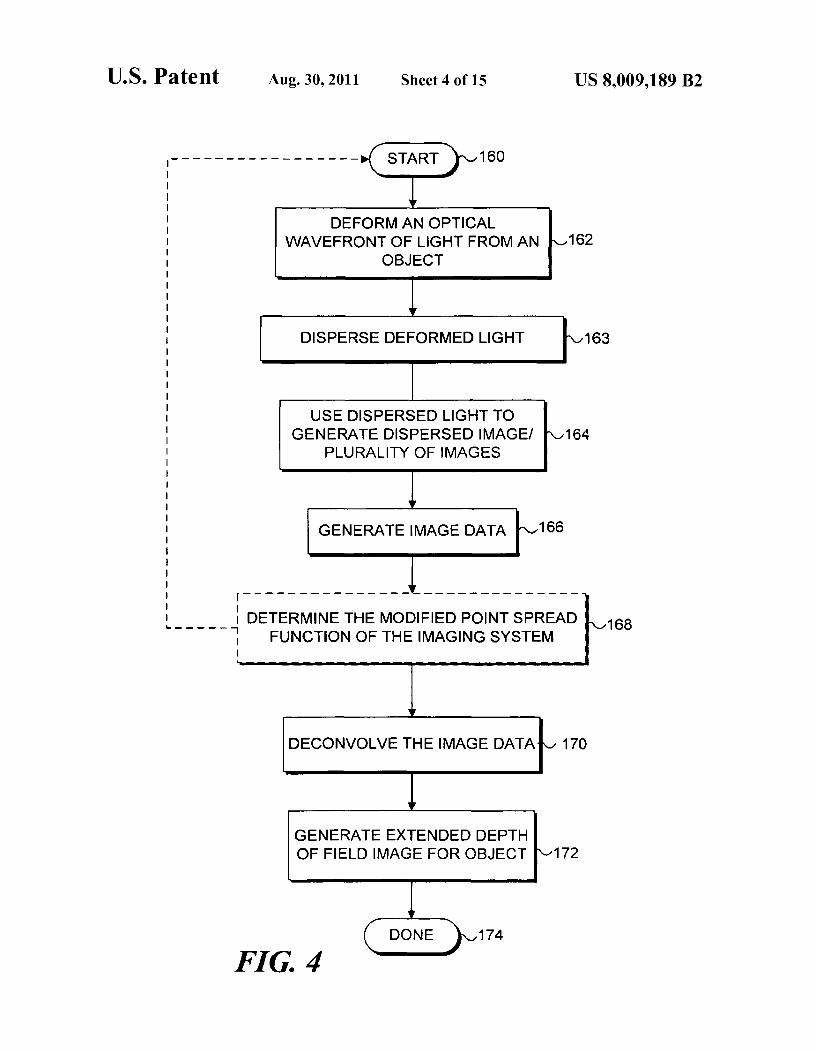
If the point spread function (PSF) of an imaging system iswell-characterized, the known PSF can be used to improvethe spatial resolution of imagery acquired with the imagingsystem by mathematically de-convolving the PSF from theimagery. In the case where object being imaged lies entirelywithin the focal plane, only a single image of the object needbe acquired. If the object being imaged is extended in the Zaxis, multiple images of the object must be acquired in dif-ferent focal planes order to produce the resolution enhance-ment, due to uncertainty about the focal plane of origin of anygiven feature within a single image of an extended object.However, a single image of an extended object can be com-bined with PSF de-convolution to enhance focus quality(rather than resolution) if the PSF is intentionally modifiedsuch that it is invariant to focal position. The techniquesdisclosed herein are therefore based on manipulating animaging system such that a point spread function (PSF) of theimaging system is substantially invariant over an extendeddepth of field. For example, where an unmodified high-reso-lution imaging system might exhibit a depth of field of about1 micron, a modified version of the same imaging systemmight be characterized as having a PSF that is substantiallyinvariant across a depth of field of about 10 microns. Such asubstantially invariant PSF enables the imaging system tointegrate light from different focal positions in object space,making the modified imaging system relatively insensitive todefocus. This property, in turn, enables de-convolution of thePSF to remove the spatial broadening and contrast loss inher-ent in the unprocessed image, thereby increasing image fidel-ity and creating an "in-focus" projected image of the entirecell. The concepts presented herein combine the above tech-nique for extending depth of field with a means for greatlyincreasing detection sensitivity. The increased sensitivity isimportant to the practice of extended depth of field imaging,because the PSF modification tends to blur optical signals inthe unprocessed imagery, thereby decreasing the signal tonoise ratio. Further, the de-convolution process itself tends toamplify noise, reducing the effective signal to noise ratio inthe resultant extended depth of field imagery, so increasingthe signal intensity relative to the noise is a key feature of thepresent invention
A key aspect of the concepts presented in the examplesdiscussed herein is that a wave front of light from the object isdeformed, such that light from different focal positions iscollected. As long as the deformation process is well under-stood, processing of the imaging data collected from thedeformed light can correct for errors introduced into theimage data by the deformation process, while enabling theinformation corresponding to the different focal positions tobe retained. Thus, after such corrective processing is applied,an image with an extended depth of field is obtained.
Thus, the following steps can be considered to be an over-view of an exemplary process disclosed herein: providing animaging system having a substantially invariant PSF (ormodifying an imaging system to achieve a substantiallyinvariant PSF), collecting image data from an object, andprocessing that image data to achieve an extended depth offield image. De-convolving the image (taking into account themodified PSF) enhances image contrast and reduces spatialbroadening, thereby improving image quality.
The concepts disclosed herein encompass several differentexemplary techniques for providing the substantially invari-ant PSF and the deformed wave front. As noted above, U.S.Pat. No. 6,583,865 describes a flow imaging system having atilted image plane (either the detector being tilted or the flow
US 8,009,189 B25
path of the object relative to the detector is tilted). Severalimprovements to that configuration are disclosed herein,including the use of a flow cell having a tilted flow path.Significantly, such an approach does not simultaneously col-lect data from a plurality of different focal positions. Instead,as the object moves relative to the tilted image plane, the focalpoint of the imaging system moves to different focal planes inthe object. A detector synchronized to the motion of the obj ectmust be employed (i.e., a time delay integration (TDI) detec-tor), such that images of the object obtained at different posi-tions (and at different times) are combined to achieve anextended depth of field image of the object. Rather than usingsuch a tilted image plane, an optical element configured todeform the optical wave front of light from the image can beintroduced into the imaging system between the object andthe detector. One advantage to using an optical element todeform the optical wave front is that light is simultaneouslycollected from an EDF in the object. Thus, a synchronizeddetector is not required (although it may still be desirable toemploy such a detector). Another advantage to using an opti-cal element to deform the optical wave front is that the ele-ment may be conveniently inserted into or removed from theoptical system. Different imaging applications may requiremore or less depth of field, and having a removable elementallows the depth of field to be tailored to the different appli-cations of the imaging system. A phase plate (an exemplaryphase plate can be obtained from CDM Optics of BoulderColo., marketed as a Wavefront CodedTM element) representsone type of optical element that can be used to deform theoptical wave front. Yet another type of optical element willdeform the wave front by introducing a spherical aberrationinto light from the object. A separate optical element (such asa cover slip) can be used to introduce spherical aberration, oran existing element in the flow imaging system (such as a flowcell or cuvette, or an objective lens with a correction collar)can be modified to introduce the spherical aberration. Wherethe optical element is a phase plate or wave front coded(WFC) element, such an optical element will be disposed ininfinite space, otherwise known as aperture space (i.e., behindthe objective lens). If the optical element introduces sphericalaberration, such aberration is preferably induced before lightis collected by the aperture of the imaging system (i.e.,between the object or cell being imaged and the objectivelens). Essentially, the unmodified imaging system (i.e., theimaging system without the distortion element) is configuredto acquire an image of the object with a relatively narrowdepth of field (for example, about 1 micron, understandingthat such a value is intended to be exemplary, and not limit-ing). When the distortion element is introduced into the imag-ing system, the distortion element induces defocus in the lightfrom the object, such that the relatively narrow depth of fieldis expanded (in an exemplary, but not limiting embodiment,the defocus extends about +/-7 microns beyond the originaldepth of field); however, such defocus "blurs" the extendeddepth of field (such blur generally includes both spatialbroadening and a loss of contrast). Post image acquisitionprocessing can minimize the blurring effects of the defocusinduced by the distortion element, enabling an EDF image tobe generated. Note that the PSF of the imaging system withthe distortion element in place is used to facilitate the postimage acquisition processing employed to reduce the effectsof the defocus induced by the distortion element.
Another aspect of the concepts encompassed herein isdirected to a flow imaging system configured to provide theabove-described extended depth of field images. Such a flowimaging system will include an optical element to deform thewave front of light from the object while providing a substan-
6tially invariant PSF, a collection element to direct light fromthe object along an light path, an imaging lens configured toform an image from the collected light, a detector configuredto detect the image and generate image data, and a processor
5 configured to process the image data (i.e., to de-convolve theimage data based on the invariant PSF) to produce anextended depth of field image of an object. In some exemplaryembodiments, the imaging system includes a dispersion ele-ment that disperses the collected light before imaging, and in
10 some exemplary embodiments, the detector is a TDI detector,configured to output image data based on a plurality of imagesof the object detected over time.
Referring to the ImageStreamTM system noted above, the15 concepts encompassed herein can be applied to the Imag-
eStreamTM system, to enable extended depth of field imagingto be achieved. An ImageStreamTM system modified forextended depth of field (EDF) image collection can providefor the collection of high-resolution imagery (0.75 NA and
20 0.5 micron pixel size) without the defocus associated withhigh NA optics. Such imagery will have a greatly extendeddepth of field (a proposed EDF ImageStream TM will achievea depth of field of ten microns, which is approximately fivetimes the current operating single focal plane depth of less
25 than two microns), allowing for all image features within a 10micron EDF to be clearly in focus. This technology willenable imaging of cellular components having fine structuresthat are in different focal planes (e.g., cytoplasmic proteins,such as actin, microtubules, and sub-cellular organelles (such
30 as mitochondria), cellular micro-domains (e.g., membranecaps, lipid rafts, protein co-localization, and signal transduc-tion), and fluorescent in-situ hybridization spot counting. Sig-nificantly, post-processing of the imagery minimizes the
35 effects of defocus by bringing the entire cell into focus at thesame time. Unlike confocal image stacking techniques, thisnew methodology and apparatus will operate at hundreds ofcells per second, allowing tens of thousands of cell images tobe collected for quantitative analysis in several minutes.
40 This Summary has been provided to introduce a few con-cepts in a simplified form that are further described in detailbelow in the Description. However, this Summary is notintended to identify key or essential features of the claimedsubject matter, nor is it intended to be used as an aid in
45 determining the scope of the claimed subject matter.
DRAWINGS
Various aspects and attendant advantages of one or more50 exemplary embodiments and modifications thereto will
become more readily appreciated as the same becomes betterunderstoodby reference to the following detailed description,when taken in conjunction with the accompanying drawings,wherein:
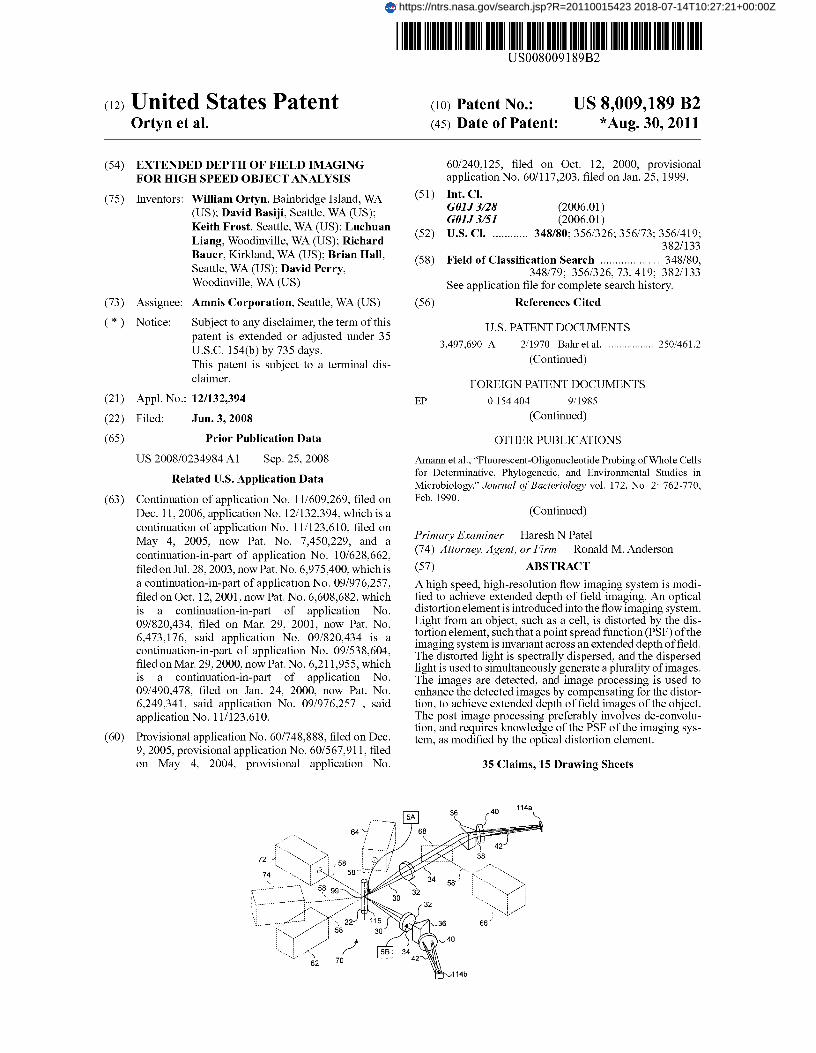
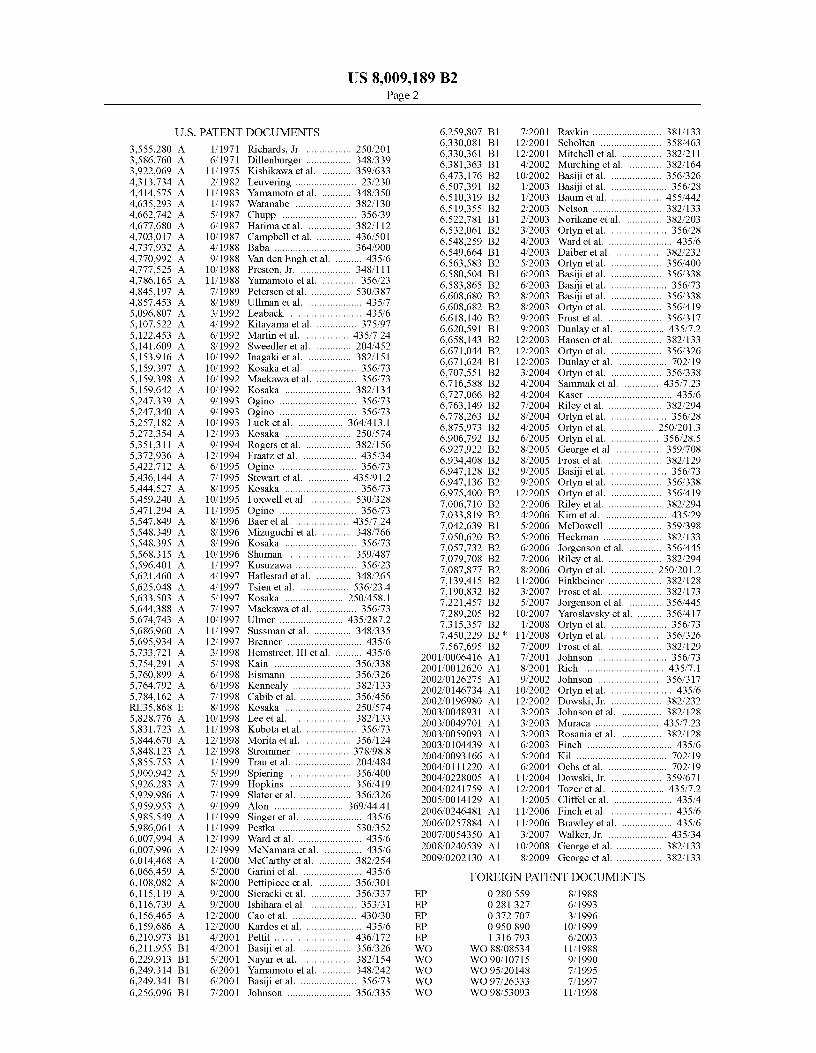
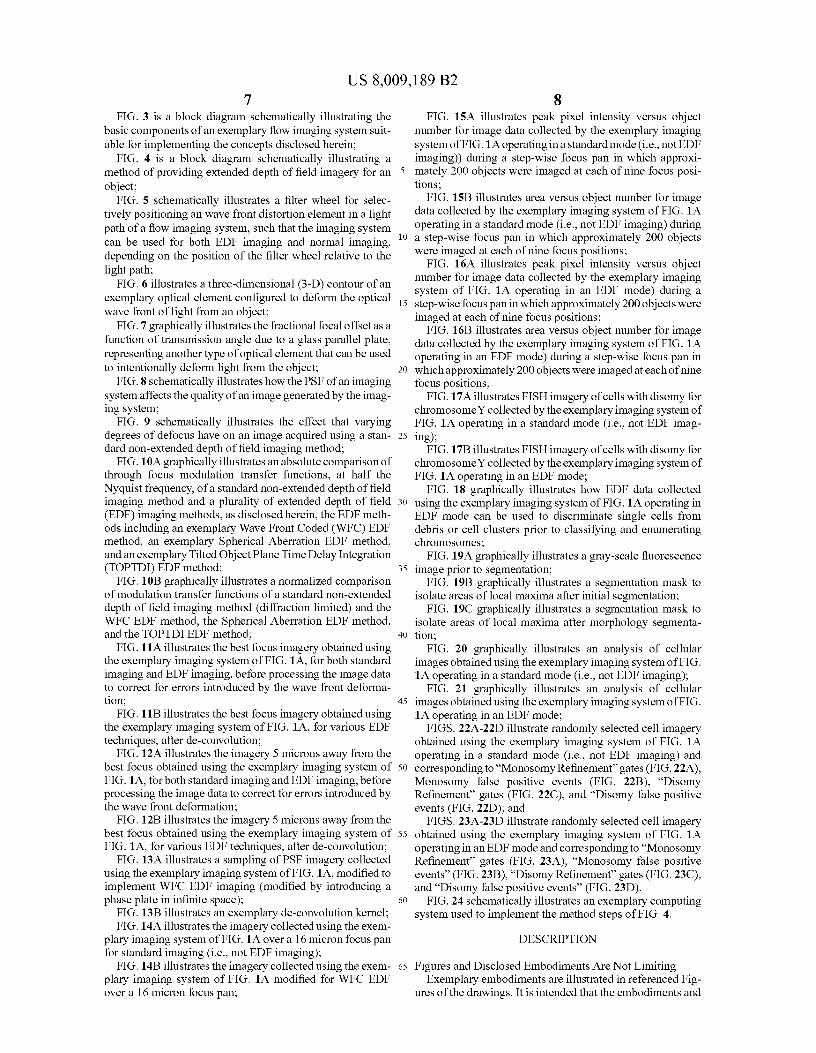
55 FIG. lA is a schematic illustration of an exemplary flowimaging system for implementing the concepts disclosedherein;
FIG. 1B is a schematic illustration of an exemplary imag-ing system for implementing the concepts disclosed herein,
60 wherein the objected to be imaged are disposed on a plate orslide;
FIG. 1C is a schematic illustration of a readout provided bya TDI detector employed in an exemplary flow imaging sys-tem used in accord with the concepts disclosed herein;
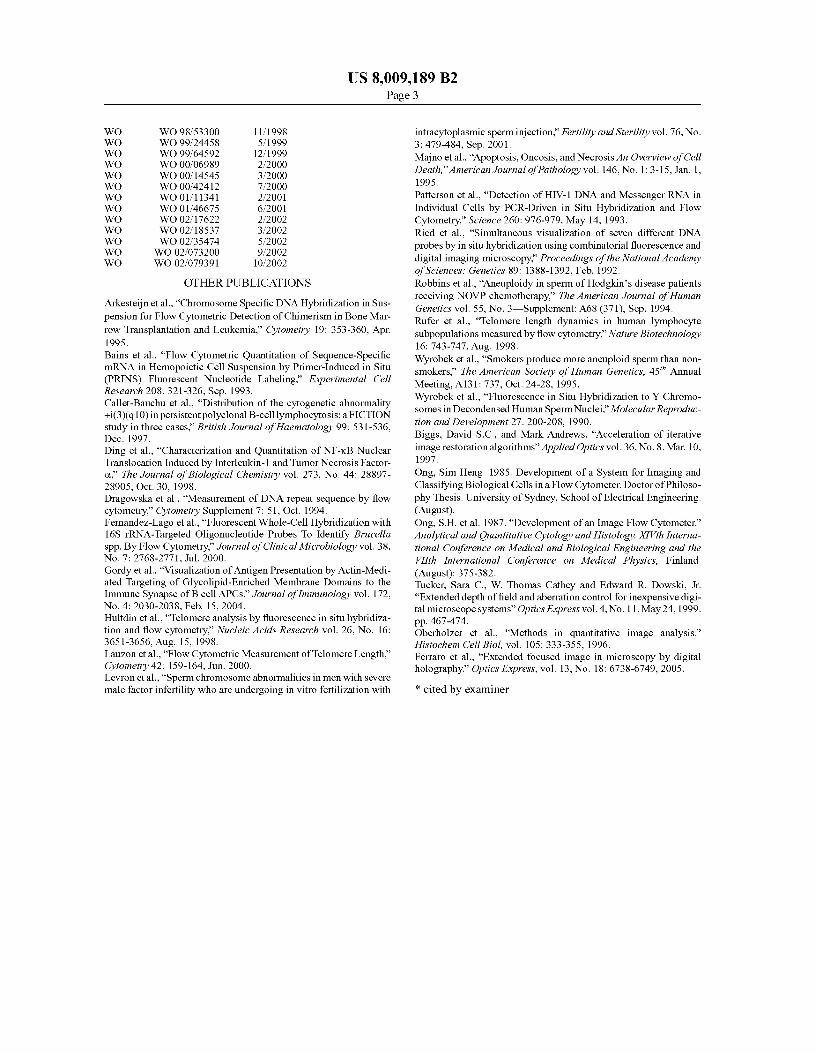
65 FIG. 2 is a schematic illustration of an exemplary stereo-scopic flow imaging system used in accord with the conceptsdisclosed herein;
US 8,009,189 B27
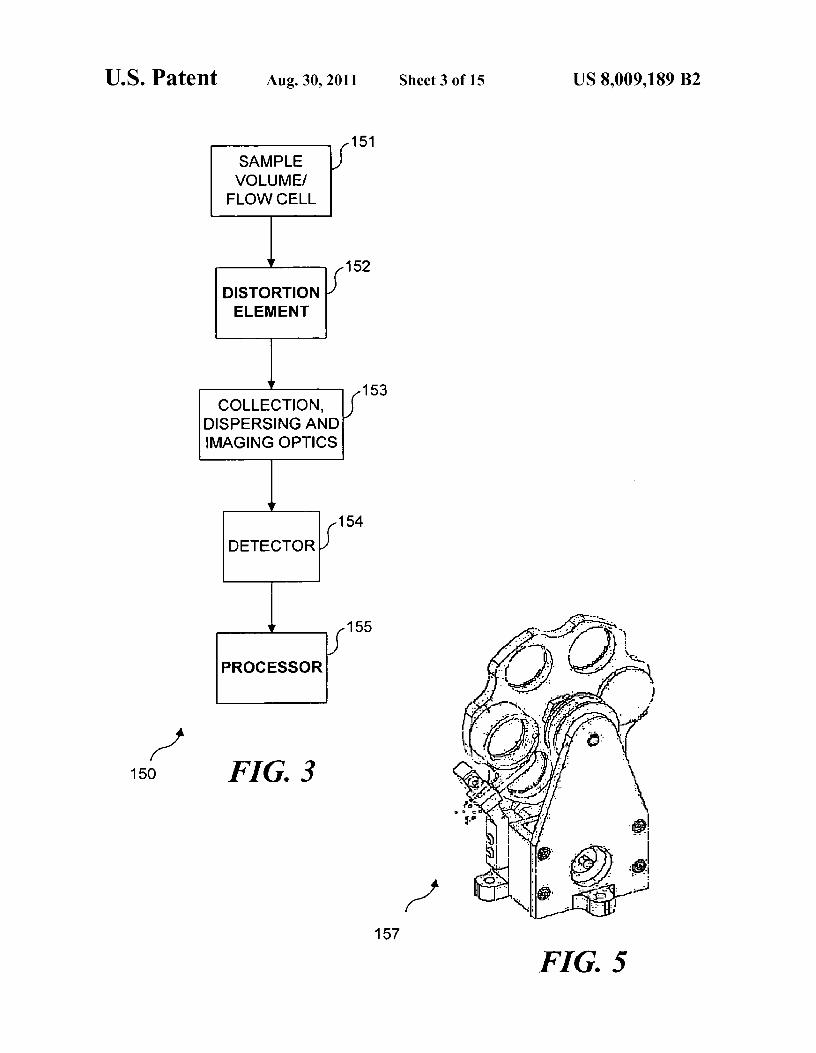
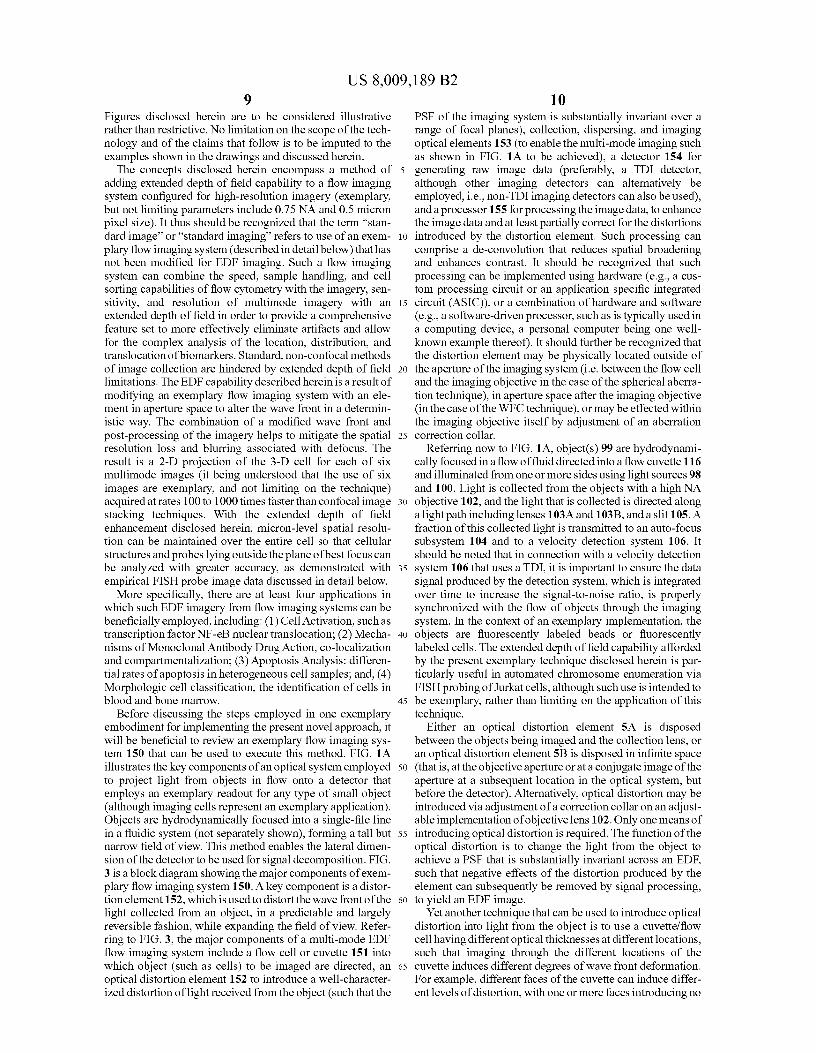
FIG. 3 is a block diagram schematically illustrating thebasic components of an exemplary flow imaging system suit-able for implementing the concepts disclosed herein;
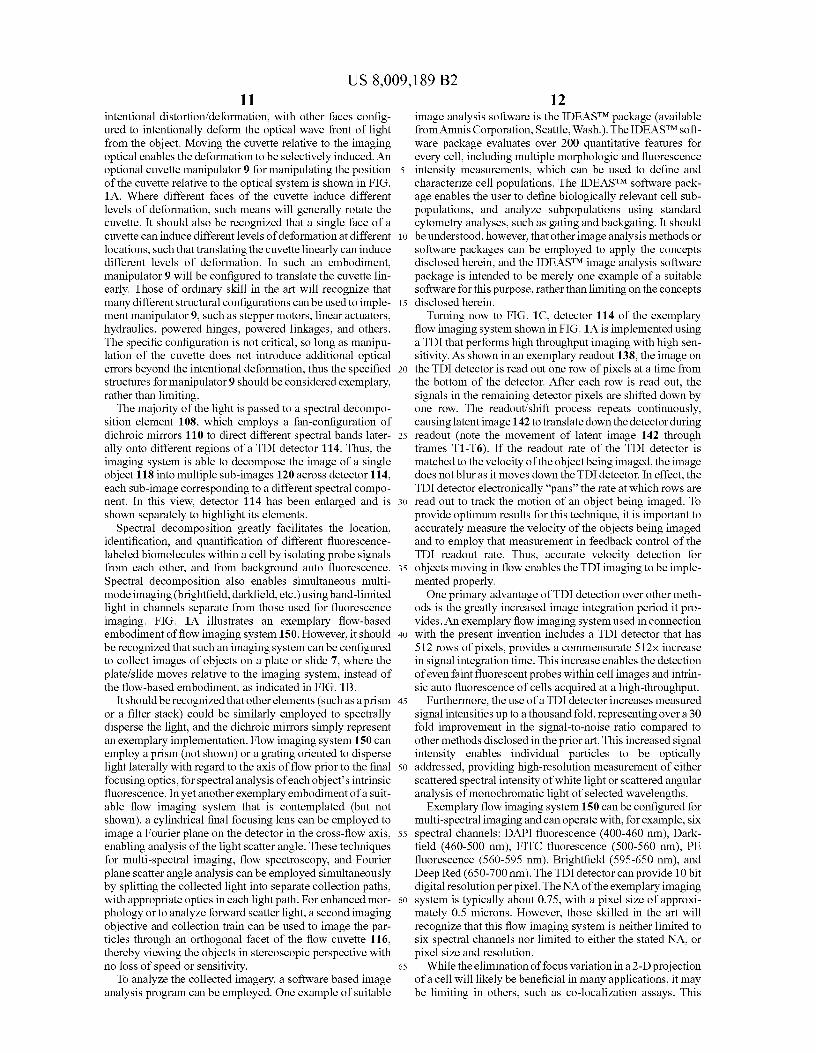
FIG. 4 is a block diagram schematically illustrating amethod of providing extended depth of field imagery for anobject;
FIG. 5 schematically illustrates a filter wheel for selec-tively positioning an wave front distortion element in a lightpath of a flow imaging system, such that the imaging systemcan be used for both EDF imaging and normal imaging,depending on the position of the filter wheel relative to thelight path;
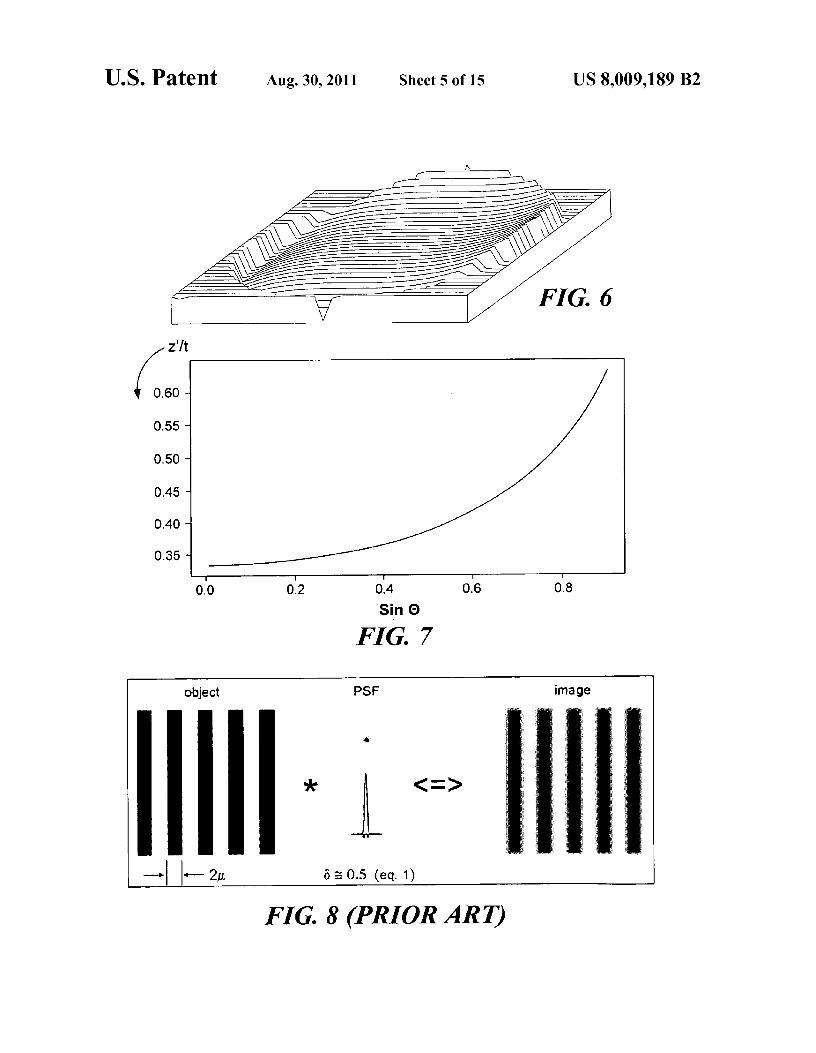
FIG. 6 illustrates a three-dimensional (3-D) contour of anexemplary optical element configured to deform the opticalwave front of light from an object;
FIG. 7 graphically illustrates the fractional focal offset as afunction of transmission angle due to a glass parallel plate,representing another type of optical element that can be usedto intentionally deform light from the object;
FIG. 8 schematically illustrates how the PSF of an imagingsystem affects the quality of an image generated by the imag-ing system;
FIG. 9 schematically illustrates the effect that varyingdegrees of defocus have on an image acquired using a stan-dard non-extended depth of field imaging method;
FIG. 10A graphically illustrates an absolute comparison ofthrough focus modulation transfer functions, at half theNyquist frequency, of a standard non-extended depth of fieldimaging method and a plurality of extended depth of field(EDF) imaging methods, as disclosed herein, the EDF meth-ods including an exemplary Wave Front Coded (WFC) EDFmethod, an exemplary Spherical Aberration EDF method,and an exemplary Tilted Object Plane Time Delay Integration(TOPTDI) EDF method;
FIG. 10B graphically illustrates a normalized comparisonof modulation transfer functions of a standard non-extendeddepth of field imaging method (diffraction limited) and theWFC EDF method, the Spherical Aberration EDF method,and the TOPTDI EDF method;
FIG. 11A illustrates the best focus imagery obtained usingthe exemplary imaging system of FIG. 1A, for both standardimaging and EDF imaging, before processing the image datato correct for errors introduced by the wave front deforma-tion;
FIG. 11B illustrates the best focus imagery obtained usingthe exemplary imaging system of FIG. 1A, for various EDFtechniques, after de-convolution;
FIG. 12A illustrates the imagery 5 microns away from thebest focus obtained using the exemplary imaging system ofFIG. 1A, for both standard imaging and EDF imaging, beforeprocessing the image data to correct for errors introduced bythe wave front deformation;
FIG. 12B illustrates the imagery 5 microns away from thebest focus obtained using the exemplary imaging system ofFIG. 1A, for various EDF techniques, after de-convolution;
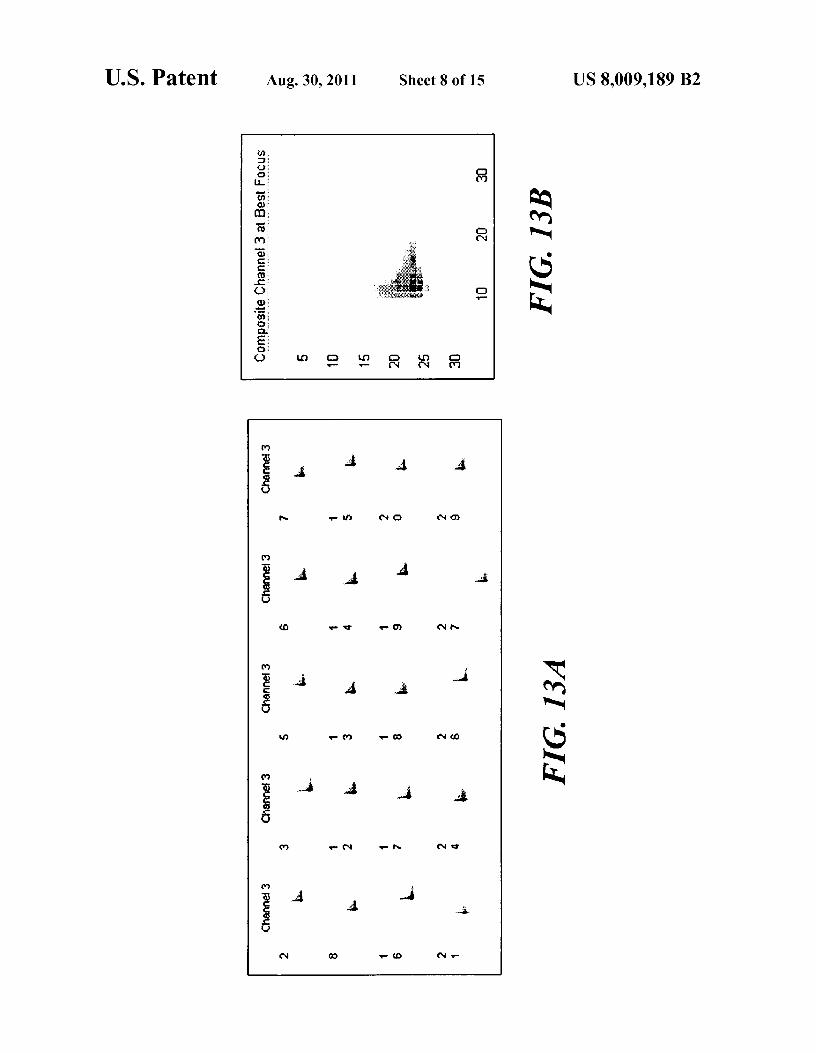
FIG. 13A illustrates a sampling of PSF imagery collectedusing the exemplary imaging system of FIG. 1A, modified toimplement WFC EDF imaging (modified by introducing aphase plate in infinite space);
FIG. 13B illustrates an exemplary de-convolution kernel;FIG. 14A illustrates the imagery collected using the exem-
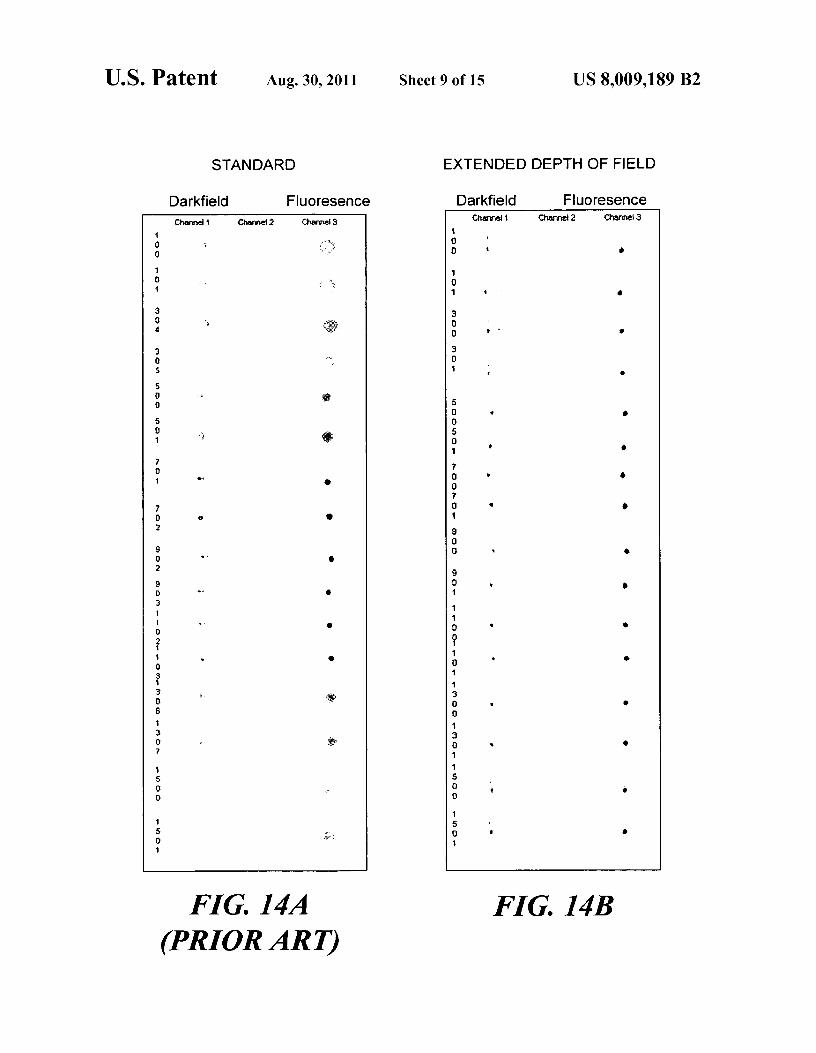
plary imaging system of FIG. 1A over a 16 micron focus panfor standard imaging (i.e., not EDF imaging);
FIG. 14B illustrates the imagery collected using the exem-plary imaging system of FIG. 1A modified for WFC EDFover a 16 micron focus pan;
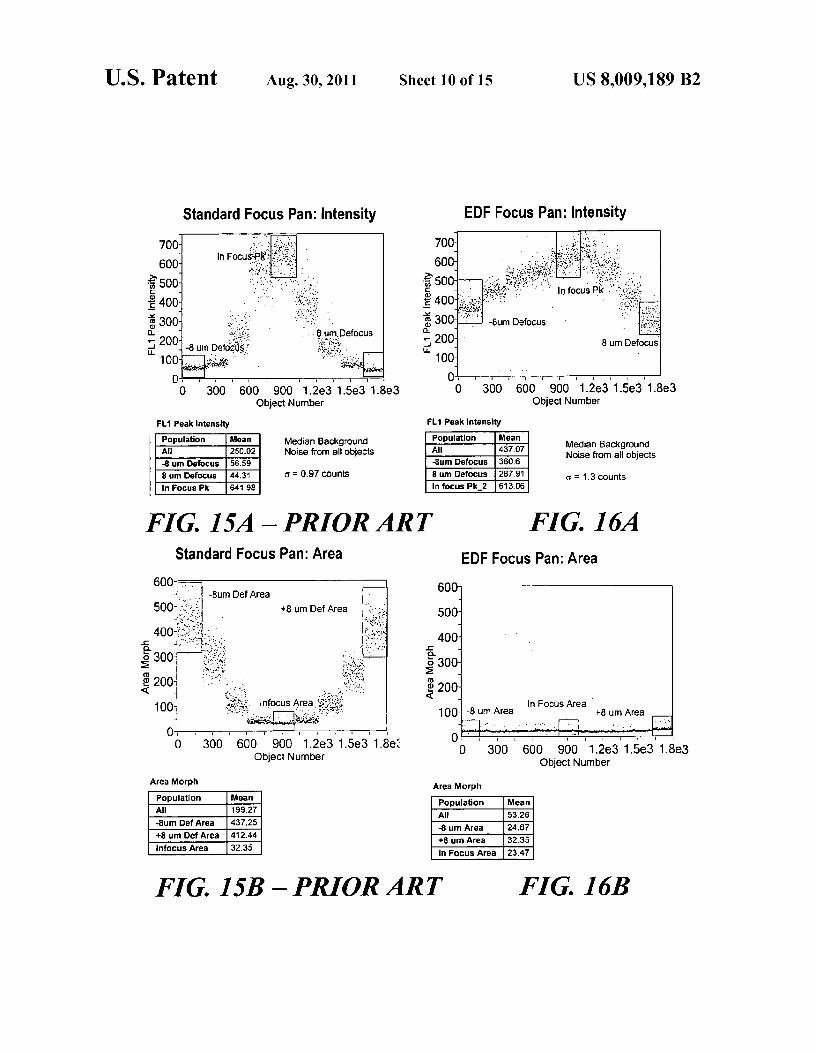
8FIG. 15A illustrates peak pixel intensity versus object
number for image data collected by the exemplary imagingsystem of FIG. 1A operating in a standard mode (i.e., not EDFimaging)) during a step-wise focus pan in which approxi-
5 mately 200 objects were imaged at each of nine focus posi-tions;
FIG. 15B illustrates area versus object number for imagedata collected by the exemplary imaging system of FIG. 1Aoperating in a standard mode (i.e., not EDF imaging) during
10 a step-wise focus pan in which approximately 200 objectswere imaged at each of nine focus positions;
FIG. 16A illustrates peak pixel intensity versus objectnumber for image data collected by the exemplary imagingsystem of FIG. 1A operating in an EDF mode) during a
15 step-wise focus pan in which approximately 200 objects wereimaged at each of nine focus positions;
FIG. 16B illustrates area versus object number for imagedata collected by the exemplary imaging system of FIG. 1Aoperating in an EDF mode) during a step-wise focus pan in
20 which approximately 200 objects were imaged at each of ninefocus positions;
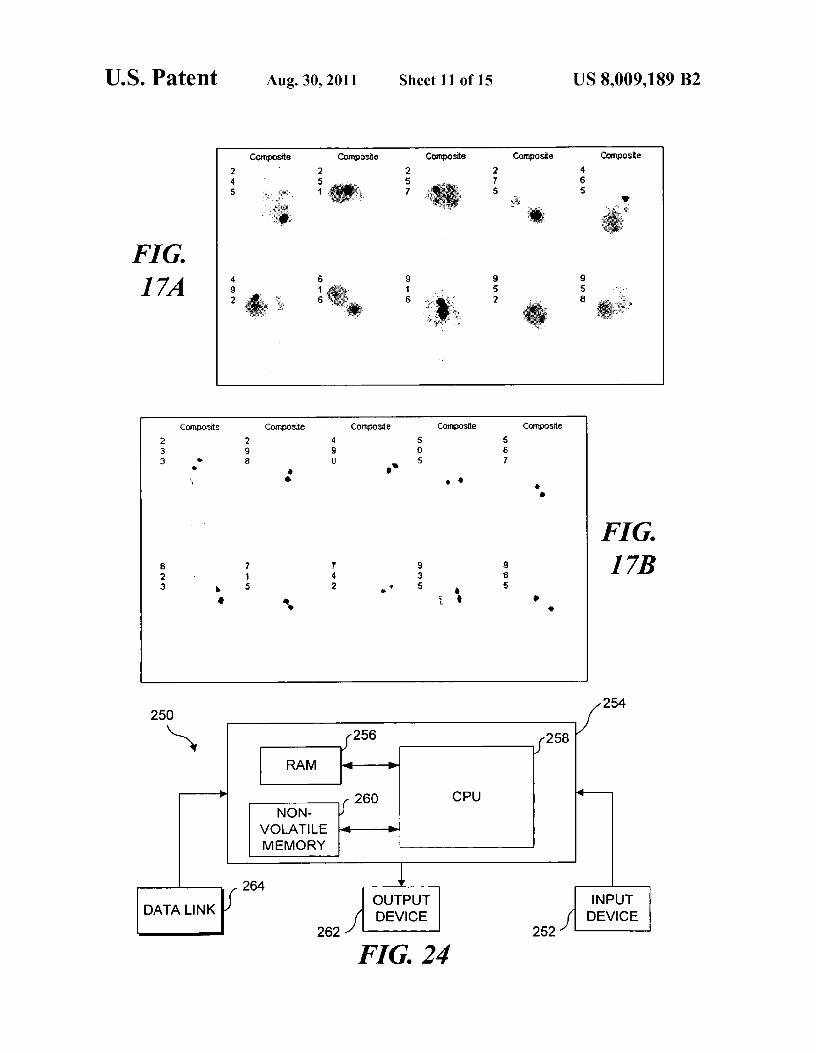
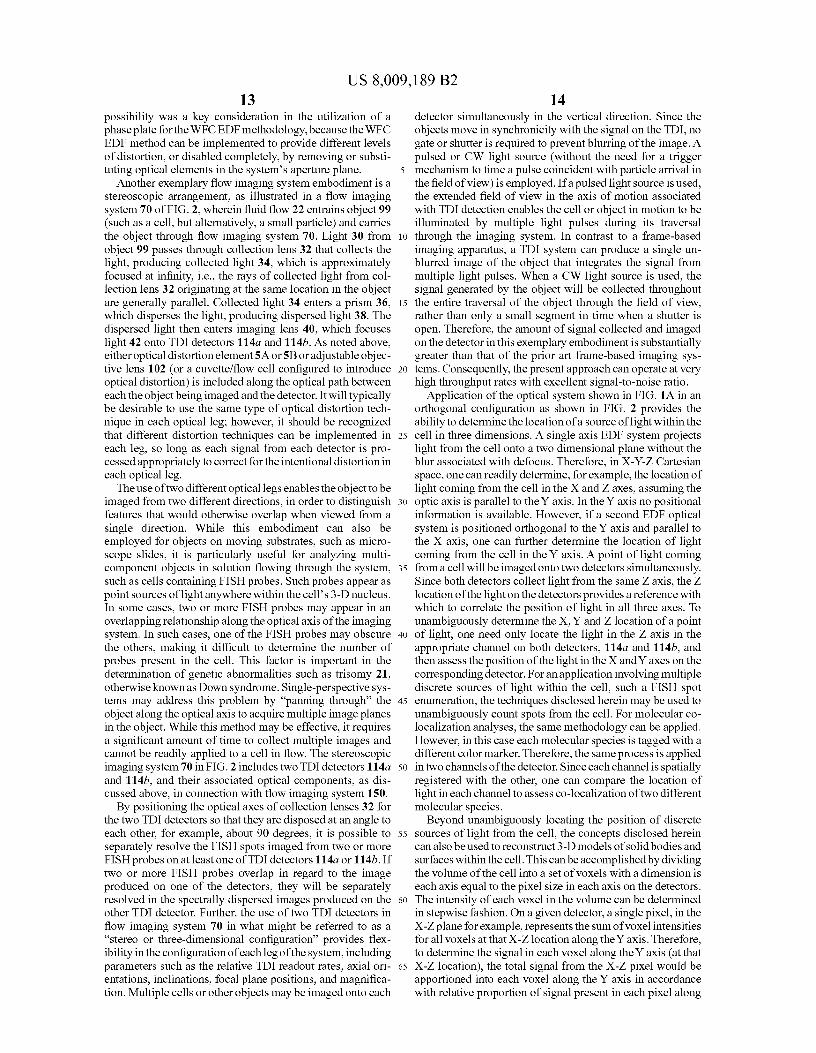
FIG. 17A illustrates FISH imagery of cells with disomy forchromosomeY collected by the exemplary imaging system ofFIG. 1A operating in a standard mode (i.e., not EDF imag-
25 ing);FIG. 17B illustrates FISH imagery of cells with disomy for
chromosomeY collected by the exemplary imaging system ofFIG. 1A operating in an EDF mode;
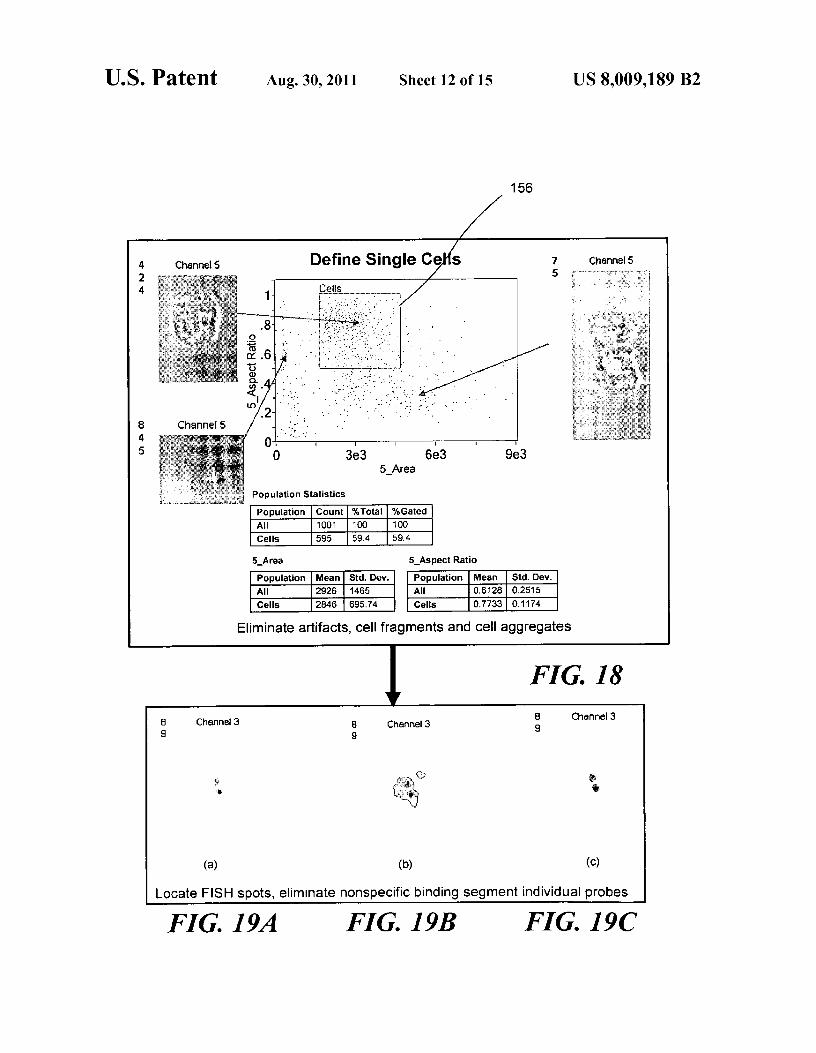
FIG. 18 graphically illustrates how EDF data collected30 using the exemplary imaging system of FIG. 1A operating in
EDF mode can be used to discriminate single cells fromdebris or cell clusters prior to classifying and enumeratingchromosomes;
FIG. 19A graphically illustrates a gray-scale fluorescence35 image prior to segmentation;
FIG. 19B graphically illustrates a segmentation mask toisolate areas of local maxima after initial segmentation;
FIG. 19C graphically illustrates a segmentation mask toisolate areas of local maxima after morphology segmenta-
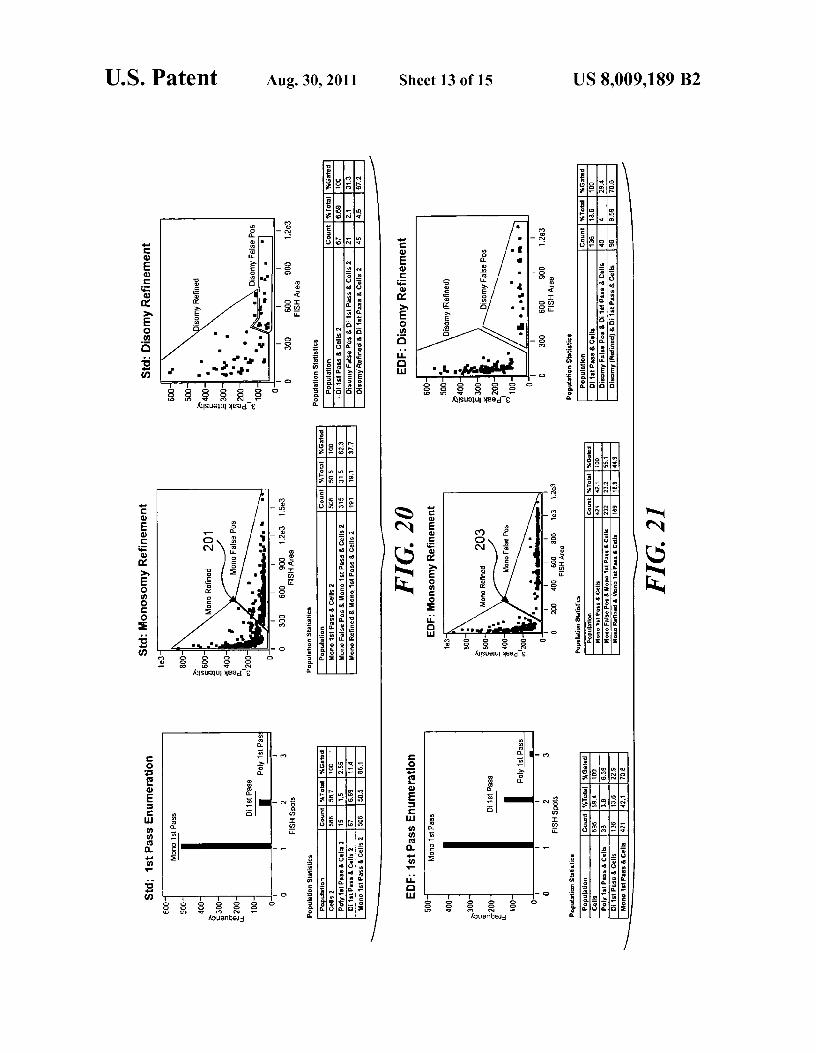
40 tion;FIG. 20 graphically illustrates an analysis of cellular
images obtained using the exemplary imaging system of FIG.1A operating in a standard mode (i.e., not EDF imaging);
FIG. 21 graphically illustrates an analysis of cellular45 images obtained using the exemplary imaging system of FIG.
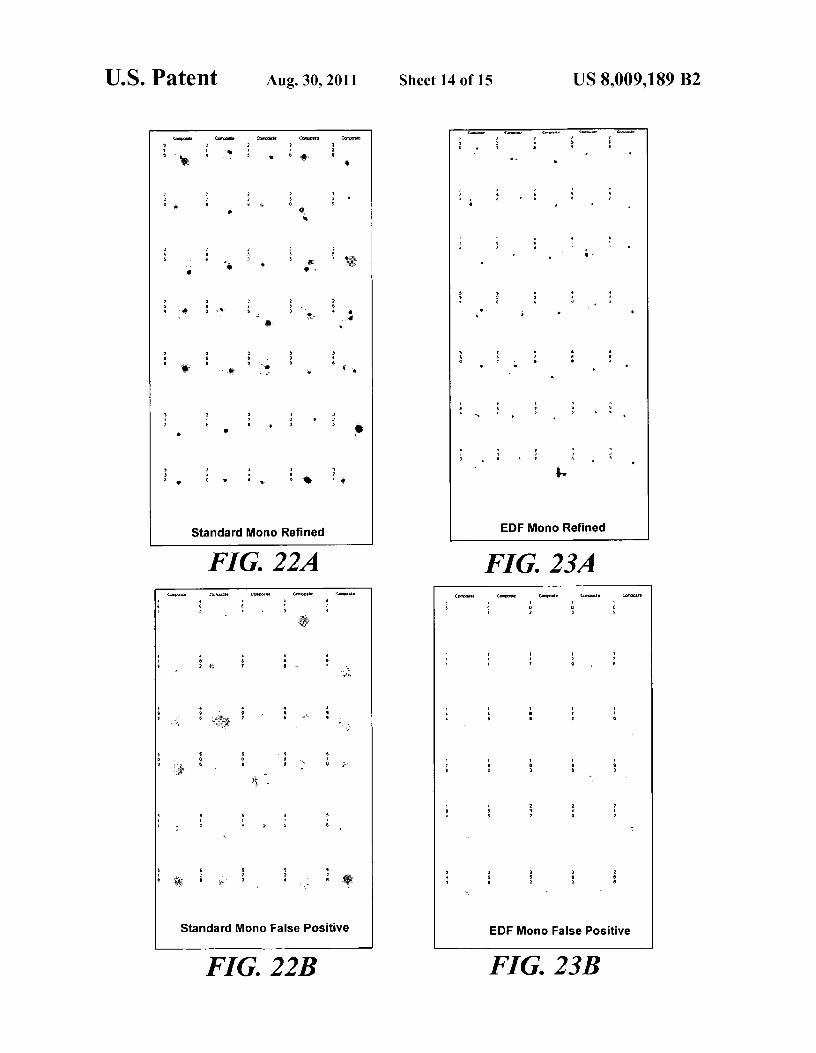
1A operating in an EDF mode;FIGS. 22A-22D illustrate randomly selected cell imagery
obtained using the exemplary imaging system of FIG. 1Aoperating in a standard mode (i.e., not EDF imaging) and
50 corresponding to "Monosomy Refinement' gates (FIG. 22A),Monosomy false positive events (FIG. 2213), "DisomyRefinement' gates (FIG. 22C), and "Disomy false positiveevents (FIG. 22D); and
FIGS. 23A-23D illustrate randomly selected cell imagery55 obtained using the exemplary imaging system of FIG. 1A
operating in an EDF mode and corresponding to "MonosomyRefinement' gates (FIG. 23A), "Monosomy false positiveevents" (FIG. 2313), "Disomy Refinement' gates (FIG. 23C),and "Disomy false positive events" (FIG. 23D).
60 FIG. 24 schematically illustrates an exemplary computingsystem used to implement the method steps of FIG. 4.
DESCRIPTION
65 Figures and Disclosed Embodiments Are Not LimitingExemplary embodiments are illustrated in referenced Fig-
ures of the drawings. It is intended that the embodiments and
US 8,009,189 B29
10Figures disclosed herein are to be considered illustrative
PSF of the imaging system is substantially invariant over a
rather than restrictive. No limitation on the scope of the tech- range of focal planes), collection, dispersing, and imagingnology and of the claims that follow is to be imputed to the optical elements 153 (to enable the multi-mode imaging suchexamples shown in the drawings and discussed herein. as shown in FIG. 1A to be achieved), a detector 154 for
The concepts disclosed herein encompass a method of 5 generating raw image data (preferably, a TDI detector,adding extended depth of field capability to a flow imaging although other imaging detectors can alternatively besystem configured for high-resolution imagery (exemplary, employed, i.e., non-TDI imaging detectors can also be used),but not limiting parameters include 0.75 NA and 0.5 micron and a processor 155 for processing the image data, to enhancepixel size). It thus should be recognized that the term "stan- the image data and at least partially correct for the distortionsdard image" or "standard imaging" refers to use of an exem- io introduced by the distortion element. Such processing canplary flow imaging system (described in detail below) that has comprise a de-convolution that reduces spatial broadeningnot been modified for EDF imaging. Such a flow imaging and enhances contrast. It should be recognized that suchsystem can combine the speed, sample handling, and cell
processing can be implemented using hardware (e.g., a cus-
sorting capabilities of flow cytometry with the imagery, sen- tom processing circuit or an application specific integratedsitivity, and resolution of multimode imagery with an 15 circuit (ASIC)), or a combination of hardware and softwareextended depth of field in order to provide a comprehensive
(e.g., a software-driven processor, such as is typically used in
feature set to more effectively eliminate artifacts and allow a computing device, a personal computer being one well-for the complex analysis of the location, distribution, and
known example thereof). It should further be recognized that
translocation of biomarkers. Standard, non-confocal methods the distortion element may be physically located outside ofof image collection are hindered by extended depth of field 20 the aperture of the imaging system (i.e. between the flow celllimitations. The EDF capability described herein is a result of
and the imaging objective in the case of the spherical aberra-
modifying an exemplary flow imaging system with an ele- tion technique), in aperture space after the imaging objectivement in aperture space to alter the wave front in a determin- (in the case of the WFC technique), or may be effected withinistic way. The combination of a modified wave front and
the imaging objective itself by adjustment of an aberration
post-processing of the imagery helps to mitigate the spatial 25 correction collar.resolution loss and blurring associated with defocus. The
Referring now to FIG. 1A, object(s) 99 are hydrodynami-
result is a 2-D projection of the 3-D cell for each of six cally focused in a flow of fluid directed into a flow cuvette 116multimode images (it being understood that the use of six and illuminated from one or more sides using light sources 98images are exemplary, and not limiting on the technique)
and 100. Light is collected from the objects with a high NA
acquired at rates 100 to 1000 times faster than confocal image 30 objective 102, and the light that is collected is directed alongstacking techniques. With the extended depth of field
a light path including lenses 103A and 103B, and a slit 105. A
enhancement disclosed herein, micron-level spatial resolu- fraction of this collected light is transmitted to an auto-focustion can be maintained over the entire cell so that cellular subsystem 104 and to a velocity detection system 106. Itstructures and probes lying outside the plane of best focus can should be noted that in connection with a velocity detectionbe analyzed with greater accuracy, as demonstrated with 35 system 106 that uses a TDI, it is important to ensure the dataempirical FISH probe image data discussed in detail below. signal produced by the detection system, which is integrated
More specifically, there are at least four applications in over time to increase the signal-to-noise ratio, is properlywhich such EDF imagery from flow imaging systems can be synchronized with the flow of objects through the imagingbeneficially employed, including: (1) Cell Activation, such as system. In the context of an exemplary implementation, thetranscription factor NF-eB nuclear translocation; (2) Mecha- 40 objects are fluorescently labeled beads or fluorescentlynisms of Monoclonal Antibody Drug Action, co-localization
labeled cells. The extended depth of field capability afforded
and compartmentalization; (3) Apoptosis Analysis: differen- by the present exemplary technique disclosed herein is par-tial rates of apoptosis in heterogeneous cell samples; and, (4)
ticularly useful in automated chromosome enumeration via
Morphologic cell classification, the identification of cells in
FISH probing of 7urkat cells, although such use is intended toblood and bone marrow. 45 be exemplary, rather than limiting on the application of this
Before discussing the steps employed in one exemplary technique.embodiment for implementing the present novel approach, it
Either an optical distortion element 5A is disposed
will be beneficial to review an exemplary flow imaging sys- between the objects being imaged and the collection lens, ortem 150 that can be used to execute this method. FIG. 1A
an optical distortion element 5B is disposed in infinite space
illustrates the key components of an optical system employed 50 (that is, at the objective aperture or at a conjugate image of theto project light from objects in flow onto a detector that aperture at a subsequent location in the optical system, butemploys an exemplary readout for any type of small object
before the detector). Alternatively, optical distortion may be
(although imaging cells represent an exemplary application). introduced via adjustment of a correction collar on an adjust-Objects are hydrodynamically focused into a single-file line able implementation of objective lens 102. Only one means ofin a fluidic system (not separately shown), forming a tall but 55 introducing optical distortion is required. The function of thenarrow field of view. This method enables the lateral dimen- optical distortion is to change the light from the object tosion of the detector to be used for signal decomposition. FIG. achieve a PSF that is substantially invariant across an EDF,3 is a block diagram showing the major components of exem- such that negative effects of the distortion produced by theplary flow imaging system 150. A key component is a distor- element can subsequently be removed by signal processing,tion element 152, which is used to distort the wave front of the 60 to yield an EDF image.light collected from an object, in a predictable and largely
Yet another technique that can be used to introduce optical
reversible fashion, while expanding the field of view. Refer- distortion into light from the object is to use a cuvette/flowring to FIG. 3, the major components of a multi-mode EDF
cell having different optical thicknesses at different locations,
flow imaging system include a flow cell or cuvette 151 into such that imaging through the different locations of thewhich object (such as cells) to be imaged are directed, an 65 cuvette induces different degrees of wave front deformation.optical distortion element 152 to introduce a well-character- For example, different faces of the cuvette can induce differ-ized distortion of light received from the object (such that the ent levels of distortion, with one or more faces introducing no
US 8,009,189 B211
12intentional distortion/deformation, with other faces config- image analysis software is the IDEAS TM package (availableured to intentionally deform the optical wave front of light
fromAmnis Corporation, Seattle, Wash.). The IDEAS TM soft-
from the object. Moving the cuvette relative to the imaging ware package evaluates over 200 quantitative features foroptical enables the deformation to be selectively induced. An every cell, including multiple morphologic and fluorescenceoptional cuvette manipulator 9 for manipulating the position 5 intensity measurements, which can be used to define andof the cuvette relative to the optical system is shown in FIG. characterize cell populations. The IDEAS TM software pack-1A. Where different faces of the cuvette induce different age enables the user to define biologically relevant cell sub-levels of deformation, such means will generally rotate the populations, and analyze subpopulations using standardcuvette. It should also be recognized that a single face of a cytometry analyses, such as gating and backgating. It shouldcuvette can induce different levels of deformation at different io be understood, however, that other image analysis methods orlocations, such that translating the cuvette linearly can induce software packages can be employed to apply the conceptsdifferent levels of deformation. In such an embodiment, disclosed herein, and the IDEASTM image analysis softwaremanipulator 9 will be configured to translate the cuvette lin- package is intended to be merely one example of a suitableearly. Those of ordinary skill in the art will recognize that software for this purpose, rather than limiting on the conceptsmany different structural configurations can be used to imple- 15 disclosed herein.ment manipulator 9, such as stepper motors, linear actuators, Turning now to FIG. 1C, detector 114 of the exemplaryhydraulics, powered hinges, powered linkages, and others. flow imaging system shown in FIG. lA is implemented usingThe specific configuration is not critical, so long as manipu- a TDI that performs high throughput imaging with high sen-lation of the cuvette does not introduce additional optical
sitivity. As shown in an exemplary readout 138, the image on
errors beyond the intentional deformation, thus the specified 20 the TDI detector is read out one row of pixels at a time fromstructures for manipulator 9 should be considered exemplary, the bottom of the detector. After each row is read out, therather than limiting. signals in the remaining detector pixels are shifted down by
The majority of the light is passed to a spectral decompo- one row. The readout/shift process repeats continuously,sition element 108, which employs a fan-configuration of
causing latent image 142 to translate down the detector during
dichroic mirrors 110 to direct different spectral bands later- 25 readout (note the movement of latent image 142 throughally onto different regions of a TDI detector 114. Thus, the
frames Tl-T6). If the readout rate of the TDI detector is
imaging system is able to decompose the image of a single matched to the velocity of the object being imaged, the imageobject 118 into multiple sub-images 120 across detector 114, does not blur as it moves down the TDI detector. In effect, theeach sub-image corresponding to a different spectral compo- TDI detector electronically "pans" the rate at which rows arenent. In this view, detector 114 has been enlarged and is 3o read out to track the motion of an object being imaged. Toshown separately to highlight its elements. provide optimum results for this technique, it is important to
Spectral decomposition greatly facilitates the location, accurately measure the velocity of the objects being imagedidentification, and quantification of different fluorescence- and to employ that measurement in feedback control of thelabeled biomolecules within a cell by isolating probe signals
TDI readout rate. Thus, accurate velocity detection for
from each other, and from background auto fluorescence. 35 objects moving in flow enables the TDI imaging to be imple-Spectral decomposition also enables simultaneous multi- mented properly.mode imaging (brightfield, darkfield, etc.) using band-limited
One primary advantage of TDI detection over other meth-
light in channels separate from those used for fluorescence ods is the greatly increased image integration period it pro-imaging. FIG. lA illustrates an exemplary flow-based
vides. An exemplary flow imaging system used in connection
embodiment of flow imaging system 150. However, it should 40 with the present invention includes a TDI detector that hasbe recognized that such an imaging system can be configured
512 rows of pixels, provides a commensurate 512x increase
to collect images of objects on a plate or slide 7, where the
in signal integration time. This increase enables the detectionplate/slide moves relative to the imaging system, instead of
of even faint fluorescent probes within cell images and intrin-
the flow-based embodiment, as indicated in FIG. 1B. sic auto fluorescence of cells acquired at a high-throughput.It should be recognized that other elements (such as a pri sm 45 Furthermore, the use of a TDI detector increases measured
or a filter stack) could be similarly employed to spectrally signal intensities up to a thousand fold, representing over a 30disperse the light, and the dichroic mirrors simply represent
fold improvement in the signal-to-noise ratio compared to
an exemplary implementation. Flow imaging system 150 can other methods disclosed in the prior art. This increased signalemploy a prism (not shown) or a grating oriented to disperse
intensity enables individual particles to be optically
light laterally with regard to the axis of flow prior to the final 5o addressed, providing high-resolution measurement of eitherfocusing optics, for spectral analysis of each object's intrinsic scattered spectral intensity of white light or scattered angularfluorescence. In yet another exemplary embodiment of a suit- analysis of monochromatic light of selected wavelengths.able flow imaging system that is contemplated (but not
Exemplary flow imaging system 150 can be configured for
shown), a cylindrical final focusing lens can be employed to multi-spectral imaging and can operate with, for example, siximage a Fourier plane on the detector in the cross-flow axis, 55 spectral channels: DAPI fluorescence (400-460 mu), Dark-enabling analysis of the light scatter angle. These techniques
field (460-500 mu), FITC fluorescence (500-560 mu), PE
for multi-spectral imaging, flow spectroscopy, and Fourier
fluorescence (560-595 mu), Brightfield (595-650 mu), andplane scatter angle analysis can be employed simultaneously
Deep Red (650-700 mu). The TDI detector can provide 10 bit
by splitting the collected light into separate collection paths, digital resolution per pixel. The NA of the exemplary imagingwith appropriate optics in each light path. For enhanced mor- 60 system is typically about 0.75, with a pixel size of approxi-phology or to analyze forward scatter light, a second imaging mately 0.5 microns. However, those skilled in the art willobjective and collection train can be used to image the par- recognize that this flow imaging system is neither limited toticles through an orthogonal facet of the flow cuvette 116, six spectral channels nor limited to either the stated NA, orthereby viewing the objects in stereoscopic perspective with
pixel size and resolution.
no loss of speed or sensitivity. 65 While the elimination of focus variation in a 2-D prof ectionTo analyze the collected imagery, a software based image of a cell will likely be beneficial in many applications, it may
analysis program can be employed. One example of suitable
be limiting in others, such as co-localization assays. This
US 8,009,189 B213
14possibility was a key consideration in the utilization of a
detector simultaneously in the vertical direction. Since the
phase plate for the WFC EDF methodology, because the WFC
objects move in synchronicity with the signal on the TDI, no
EDF method can be implemented to provide different levels gate or shutter is required to prevent blurring of the image. A
of distortion, or disabled completely, by removing or substi- pulsed or CW light source (without the need for a triggertuting optical elements in the system's aperture plane. 5 mechanism to time a pulse coincident with particle arrival in
Another exemplary flow imaging system embodiment is a the field of view) is employed. If a pulsed light source is used,
stereoscopic arrangement, as illustrated in a flow imaging the extended field of view in the axis of motion associated
system 70 of FIG. 2, wherein fluid flow 22 entrains object 99 with TDI detection enables the cell or object in motion to be
(such as a cell, but alternatively, a small particle) and carries
illuminated by multiple light pulses during its traversalthe object through flow imaging system 70. Light 30 from io through the imaging system. In contrast to a frame-based
object 99 passes through collection lens 32 that collects the
imaging apparatus, a TDI system can produce a single un-
light, producing collected light 34, which is approximately
blurred image of the object that integrates the signal from
focused at infinity, i.e., the rays of collected light from col- multiple light pulses. When a CW light source is used, the
lection lens 32 originating at the same location in the object signal generated by the object will be collected throughoutare generally parallel. Collected light 34 enters a prism 36, 15 the entire traversal of the object through the field of view,
which disperses the light, producing dispersed light 38. The rather than only a small segment in time when a shutter is
dispersed light then enters imaging lens 40, which focuses open. Therefore, the amount of signal collected and imaged
light 42 onto TDI detectors 114a and 114b. As noted above, on the detector in this exemplary embodiment is substantially
either optical distortion element 5A or 5B or adjustable objec- greater than that of the prior art frame-based imaging sys-tive lens 102 (or a cuvette/flow cell configured to introduce 20 tems. Consequently, the present approach can operate at very
optical distortion) is included along the optical path between
high throughput rates with excellent signal-to-noise ratio.
each the object being imaged and the detector. It will typically
Application of the optical system shown in FIG. lA in an
be desirable to use the same type of optical distortion tech- orthogonal configuration as shown in FIG. 2 provides the
nique in each optical leg; however, it should be recognized
ability to determine the location of a source of light within thethat different distortion techniques can be implemented in 25 cell in three dimensions. A single axis EDF system projects
each leg, so long as each signal from each detector is pro- light from the cell onto a two dimensional plane without the
cessed appropriately to correct for the intentional distortion in
blur associated with defocus. Therefore, in X-Y-Z Cartesianeach optical leg. space, one can readily determine, for example, the location of
The use of two different optical legs enables the object to be
light coming from the cell in the X and Z axes, assuming theimaged from two different directions, in order to distinguish 30 optic axis is parallel to theY axis. In theY axis no positional
features that would otherwise overlap when viewed from a
information is available. However, if a second EDF optical
single direction. While this embodiment can also be system is positioned orthogonal to theY axis and parallel to
employed for objects on moving substrates, such as micro- the X axis, one can further determine the location of light
scope slides, it is particularly useful for analyzing multi- coming from the cell in the Y axis. A point of light comingcomponent objects in solution flowing through the system, 35 from a cell will be imaged onto two detectors simultaneously.
such as cells containing FISH probes. Such probes appear as
Since both detectors collect light from the same Z axis, the Z
point sources of light anywhere within the cell's 3-D nucleus. location of the light on the detectors provides a reference with
In some cases, two or more FISH probes may appear in an which to correlate the position of light in all three axes. To
overlapping relationship along the optical axis of the imaging unambiguously determine the X, Y and Z location of a pointsystem. In such cases, one of the FISH probes may obscure 40 of light, one need only locate the light in the Z axis in the
the others, making it difficult to determine the number of
appropriate channel on both detectors, 114a and 114b, and
probes present in the cell. This factor is important in the then assess the position of the light in the X andY axes on the
determination of genetic abnormalities such as trisomy 21, corresponding detector. For an application involving multiple
otherwise known as Down syndrome. Single-perspective sys- discrete sources of light within the cell, such a FISH spottems may address this problem by "panning through" the 45 enumeration, the techniques disclosed herein may be used to
object along the optical axis to acquire multiple image planes unambiguously count spots from the cell. For molecular co-
in the object. While this method may be effective, it requires
localization analyses, the same methodology can be applied.
a significant amount of time to collect multiple images and
However, in this case each molecular species is tagged with a
cannot be readily applied to a cell in flow. The stereoscopic
different color marker. Therefore, the same process is appliedimaging system 70 in FIG. 2 includes two TDI detectors 114a 50 in two channels of the detector. Since each channel is spatially
and 114b, and their associated optical components, as dis- registered with the other, one can compare the location of
cussed above, in connection with flow imaging system 150. light in each channel to assess co-localization of two different
By positioning the optical axes of collection lenses 32 for molecular species.
the two TDI detectors so that they are disposed at an angle to
Beyond unambiguously locating the position of discreteeach other, for example, about 90 degrees, it is possible to 55 sources of light from the cell, the concepts disclosed herein
separately resolve the FISH spots imaged from two or more can also beused to reconstruct 3-D models of solidbodies and
FISH probes on at least one of TDI detectors 114a or 114b. If
surfaces withinthe cell. This can be accomplishedby dividing
two or more FISH probes overlap in regard to the image the volume of the cell into a set of voxels with a dimension is
produced on one of the detectors, they will be separately each axis equal to the pixel size in each axis on the detectors.resolved in the spectrally dispersed images produced on the 6o The intensity of each voxel in the volume can be determined
other TDI detector. Further, the use of two TDI detectors in
in stepwise fashion. On a given detector, a single pixel, in the
flow imaging system 70 in what might be referred to as a
X-Z plane for example, represents the sum of voxel intensities
"stereo or three-dimensional configuration" provides flex- for all voxels at that X-Z location along theY axis. Therefore,
ibility in the configuration of each leg of the system, including to determine the signal in each voxel along theY axis (at thatparameters such as the relative TDI readout rates, axial ori- 65 X-Z location), the total signal from the X-Z pixel would be
entations, inclinations, focal plane positions, and magnifica- apportioned into each voxel along the Y axis in accordance
tion. Multiple cells or other objects may be imaged onto each
with relative proportion of signal present in each pixel along
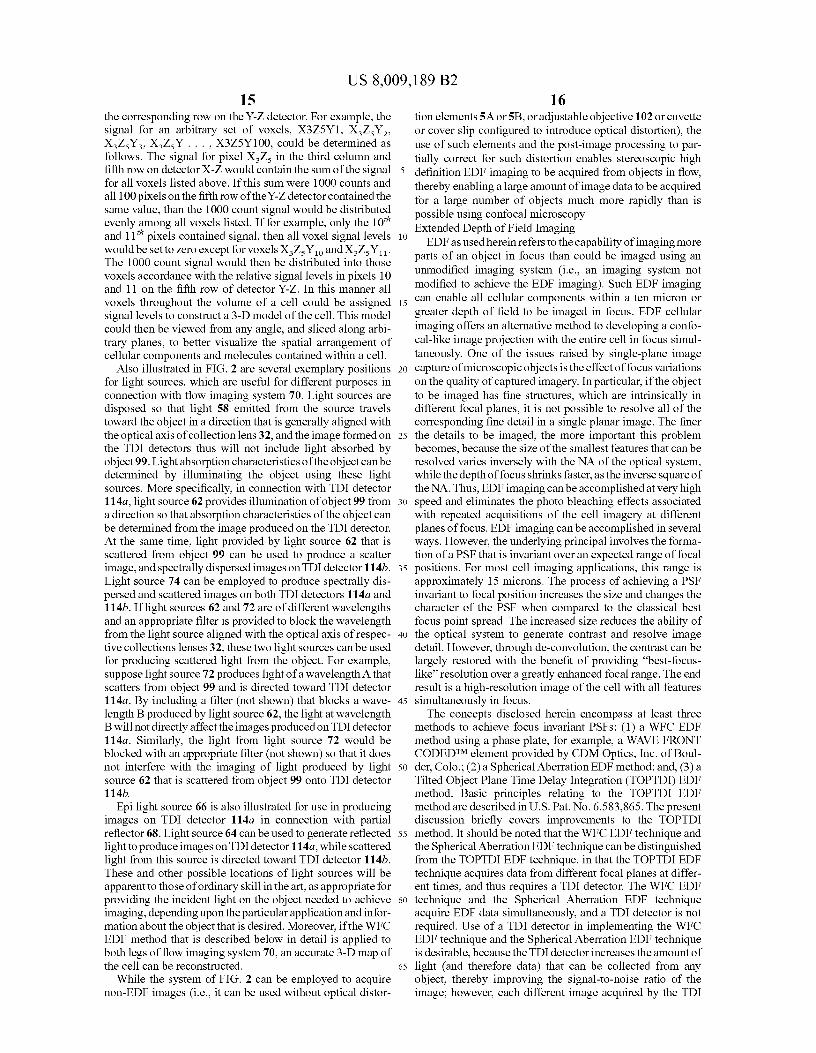
US 8,009,189 B215
the corresponding row on the Y-Z detector. For example, thesignal for an arbitrary set of voxels, X3Z5Y1, X3Z5Y21
X3 Z5Y31 X3Z5Y .... X3Z5Y100, could be determined asfollows. The signal for pixel X3Z5 in the third column andfifth row on detector X-Z would contain the sum of the signalfor all voxels listed above. If this sum were 1000 counts andall 100 pixels on the fifth row of theY-Z detector contained thesame value, than the 1000 count signal would be distributedevenly among all voxels listed. If for example, only the IOthand l Vh pixels contained signal, then all voxel signal levelswould be set to zero except for voxels X 3Z5Y1 o and X3Z5Y1 i .The 1000 count signal would then be distributed into thosevoxels accordance with the relative signal levels in pixels 10and 11 on the fifth row of detector Y-Z. In this manner allvoxels throughout the volume of a cell could be assignedsignal levels to construct a 3-D model of the cell. This modelcould then be viewed from any angle, and sliced along arbi-trary planes, to better visualize the spatial arrangement ofcellular components and molecules contained within a cell.
Also illustrated in FIG. 2 are several exemplary positionsfor light sources, which are useful for different purposes inconnection with flow imaging system 70. Light sources aredisposed so that light 58 emitted from the source travelstoward the object in a direction that is generally aligned withthe optical axis of collection lens 32, and the image formed onthe TDI detectors thus will not include light absorbed byobject 99. Light absorption characteristics of the object canbedetermined by illuminating the object using these lightsources. More specifically, in connection with TDI detector114a, light source 62 provides illumination of object 99 froma direction so that absorption characteristics of the object canbe determined from the image produced on the TDI detector.At the same time, light provided by light source 62 that isscattered from object 99 can be used to produce a scatterimage, and spectrally dispersed images on TDI detector 114b.Light source 74 can be employed to produce spectrally dis-persed and scattered images on both TDI detectors 114a and114b. If light sources 62 and 72 are of different wavelengthsand an appropriate filter is provided to block the wavelengthfrom the light source aligned with the optical axis of respec-tive collections lenses 32, these two light sources can be usedfor producing scattered light from the object. For example,suppose light source 72 produces light of a wavelengthA thatscatters from object 99 and is directed toward TDI detector114a. By including a filter (not shown) that blocks a wave-length B produced by light source 62, the light at wavelengthB will not directly affect the images produced on TDI detector114a. Similarly, the light from light source 72 would beblocked with an appropriate filter (not shown) so that it doesnot interfere with the imaging of light produced by lightsource 62 that is scattered from object 99 onto TDI detector114b.
Epi light source 66 is also illustrated for use in producingimages on TDI detector 114a in connection with partialreflector 68. Light source 64 can be used to generate reflectedlight to produce images on TDI detector 114a, while scatteredlight from this source is directed toward TDI detector 114b.These and other possible locations of light sources will beapparent to those of ordinary skill in the art, as appropriate forproviding the incident light on the object needed to achieveimaging, depending upon the particular application and infor-mation about the obj ect that is desired. Moreover, if the WFCEDF method that is described below in detail is applied toboth legs of flow imaging system 70, an accurate 3-D map ofthe cell can be reconstructed.
While the system of FIG. 2 can be employed to acquirenon-EDF images (i.e., it can be used without optical distor-
16tion elements 5A or 513, or adjustable objective 102 or cuvetteor cover slip configured to introduce optical distortion), theuse of such elements and the post-image processing to par-tially correct for such distortion enables stereoscopic high
5 definition EDF imaging to be acquired from objects in flow,thereby enabling a large amount of image data to be acquiredfor a large number of objects much more rapidly than ispossible using confocal microscopy.Extended Depth of Field Imaging
to EDF as usedherein refers to the capability of imaging moreparts of an object in focus than could be imaged using anunmodified imaging system (i.e., an imaging system notmodified to achieve the EDF imaging). Such EDF imaging
15 can enable all cellular components within a ten micron orgreater depth of field to be imaged in focus. EDF cellularimaging offers an alternative method to developing a confo-cal-like image projection with the entire cell in focus simul-taneously. One of the issues raised by single-plane image
20 capture ofmicroscopic objects isthe effectoffocus variationson the quality of captured imagery. In particular, if the objectto be imaged has fine structures, which are intrinsically indifferent focal planes, it is not possible to resolve all of thecorresponding fine detail in a single planar image. The finer
25 the details to be imaged, the more important this problembecomes, because the size of the smallest features that can beresolved varies inversely with the NA of the optical system,while the depth of focus shrinks faster, as the inverse square ofthe NA. Thus, EDF imaging can be accomplished at very high
30 speed and eliminates the photo bleaching effects associatedwith repeated acquisitions of the cell imagery at differentplanes of focus. EDF imaging can be accomplished in severalways. However, the underlying principal involves the forma-tion of a PSF that is invariant over an expected range of focal
35 positions. For most cell imaging applications, this range isapproximately 15 microns. The process of achieving a PSFinvariant to focal position increases the size and changes thecharacter of the PSF when compared to the classical bestfocus point spread. The increased size reduces the ability of
40 the optical system to generate contrast and resolve imagedetail. However, through de-convolution, the contrast can belargely restored with the benefit of providing "best-focus-like" resolution over a greatly enhanced focal range. The endresult is a high-resolution image of the cell with all features
45 simultaneously in focus.The concepts disclosed herein encompass at least three
methods to achieve focus invariant PSFs: (1) a WFC EDFmethod using a phase plate, for example, a WAVE FRONTCODEDTM element provided by CDM Optics, Inc. of Boul-
5o der, Colo.; (2) a Spherical Aberration EDF method; and, (3) aTilted Object Plane Time Delay Integration (TOPTDI) EDFmethod. Basic principles relating to the TOPTDI EDFmethod are described in U.S. Pat. No. 6,583, 865. The presentdiscussion briefly covers improvements to the TOPTDI
55 method. It should be noted that the WFC EDF technique andthe Spherical Aberration EDF technique can be distinguishedfrom the TOPTDI EDF technique, in that the TOPTDI EDFtechnique acquires data from different focal planes at differ-ent times, and thus requires a TDI detector. The WFC EDF
60 technique and the Spherical Aberration EDF techniqueacquire EDF data simultaneously, and a TDI detector is notrequired. Use of a TDI detector in implementing the WFCEDF technique and the Spherical Aberration EDF techniqueis desirable, because the TDI detector increases the amount of
65 light (and therefore data) that can be collected from anyobject, thereby improving the signal-to-noise ratio of theimage; however, each different image acquired by the TDI
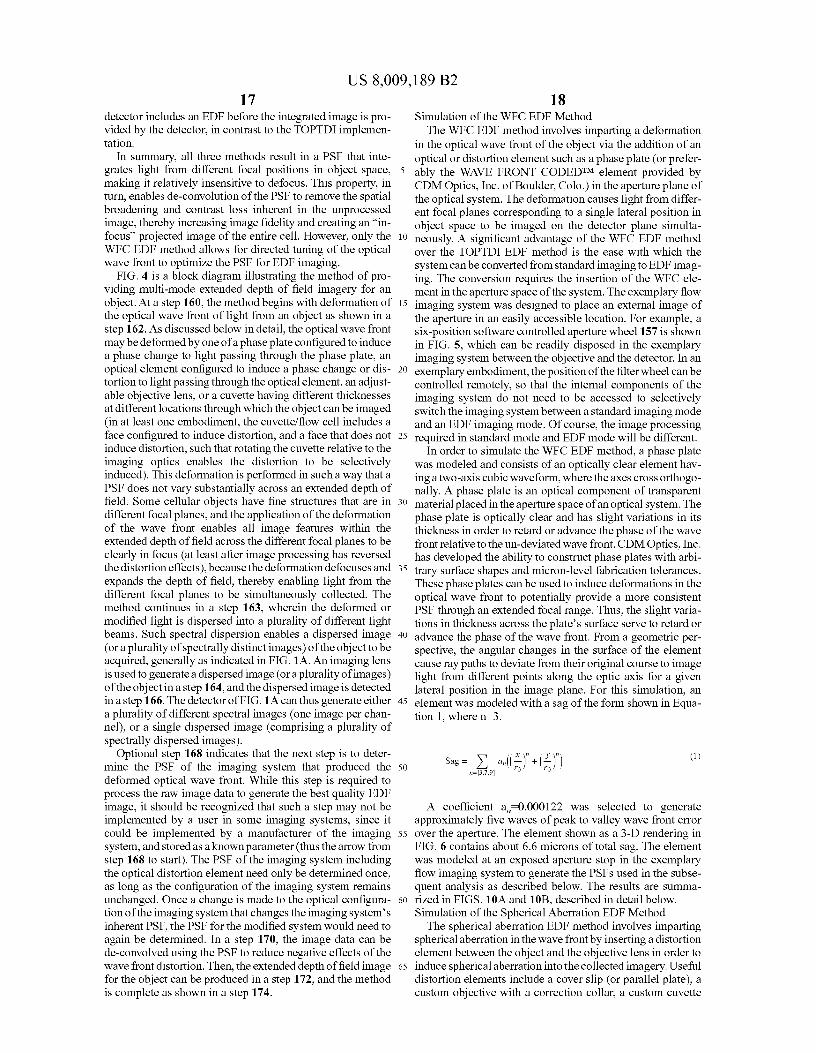
US 8,009,189 B217
detector includes an EDF before the integrated image is pro-vided by the detector, in contrast to the TOPTDI implemen-tation.
In summary, all three methods result in a PSF that inte-grates light from different focal positions in object space, 5making it relatively insensitive to defocus. This property, inturn, enables de-convolution of the PSF to remove the spatialbroadening and contrast loss inherent in the unprocessedimage, thereby increasing image fidelity and creating an "in-focus" projected image of the entire cell. However, only the ioWFC EDF method allows for directed tuning of the opticalwave front to optimize the PSF for EDF imaging.
FIG. 4 is a block diagram illustrating the method of pro-viding multi-mode extended depth of field imagery for anobject. At a step 160, the method begins with deformation of 15the optical wave front of light from an object as shown in astep 162. As discussed below in detail, the optical wave frontmay be deformed by one of a phase plate configured to inducea phase change to light passing through the phase plate, anoptical element configured to induce a phase change or dis- 20tortion to light passing through the optical element, an adjust-able objective lens, or a cuvette having different thicknessesat different locations through which the object can be imaged(in at least one embodiment, the cuvette/flow cell includes aface configured to induce distortion, and a face that does not 25induce distortion, such that rotating the cuvette relative to theimaging optics enables the distortion to be selectivelyinduced). This deformation is performed in such a way that aPSF does not vary substantially across an extended depth offield. Some cellular objects have fine structures that are in 30different focal planes, and the application of the deformationof the wave front enables all image features within theextended depth of field across the different focal planes to beclearly in focus (at least after image processing has reversedthe distortion effects), because the deformation defocuses and 35expands the depth of field, thereby enabling light from thedifferent focal planes to be simultaneously collected. Themethod continues in a step 163, wherein the deformed ormodified light is dispersed into a plurality of different lightbeams. Such spectral dispersion enables a dispersed image 40(or a plurality of spectrally distinct images) of the object to beacquired, generally as indicated in FIG. 1A. An imaging lensis used to generate a dispersed image (or a plurality of images)of the object in a step 164, and the dispersed image is detectedin a step 166. The detector of FIG. lA can thus generate either 45a plurality of different spectral images (one image per chan-nel), or a single dispersed image (comprising a plurality ofspectrally dispersed images).
Optional step 168 indicates that the next step is to deter-mine the PSF of the imaging system that produced the 50deformed optical wave front. While this step is required toprocess the raw image data to generate the best quality EDFimage, it should be recognized that such a step may not beimplemented by a user in some imaging systems, since itcould be implemented by a manufacturer of the imaging 55system, and stored as a known parameter (thus the arrow fromstep 168 to start). The PSF of the imaging system includingthe optical distortion element need only be determined once,as long as the configuration of the imaging system remainsunchanged. Once a change is made to the optical configura- 60tion of the imaging system that changes the imaging system'sinherent PSF, the PSF for the modified system would need toagain be determined. In a step 170, the image data can bede-convolved using the PSF to reduce negative effects of thewave front distortion. Then, the extended depth of field image 65for the object can be produced in a step 172, and the methodis complete as shown in a step 174.
18Simulation of the WFC EDF Method
The WFC EDF method involves imparting a deformationin the optical wave front of the object via the addition of anoptical or distortion element such as a phase plate (or prefer-ably the WAVE FRONT CODEDTM element provided byCDM Optics, Inc. of Boulder, Colo.) in the aperture plane ofthe optical system. The deformation causes light from differ-ent focal planes corresponding to a single lateral position inobject space to be imaged on the detector plane simulta-neously. A significant advantage of the WFC EDF methodover the TOPTDI EDF method is the ease with which thesystem can be converted from standard imaging to EDF imag-ing. The conversion requires the insertion of the WFC ele-ment in the aperture space of the system. The exemplary flowimaging system was designed to place an external image ofthe aperture in an easily accessible location. For example, asix-position software controlled aperture wheel 157 is shownin FIG. 5, which can be readily disposed in the exemplaryimaging system between the objective and the detector. In anexemplary embodiment, the position of the filter wheel can becontrolled remotely, so that the internal components of theimaging system do not need to be accessed to selectivelyswitch the imaging system between a standard imaging modeand an EDF imaging mode. Of course, the image processingrequired in standard mode and EDF mode will be different.
In order to simulate the WFC EDF method, a phase platewas modeled and consists of an optically clear element hav-ing a two-axis cubic waveform, where the axes cross orthogo-nally. A phase plate is an optical component of transparentmaterial placed in the aperture space of an optical system. Thephase plate is optically clear and has slight variations in itsthickness in order to retard or advance the phase of the wavefront relative to the un-deviated wave front. CDM Optics, Inc.has developed the ability to construct phase plates with arbi-trary surface shapes and micron-level fabrication tolerances.These phase plates can be used to induce deformations in theoptical wave front to potentially provide a more consistentPSF through an extended focal range. Thus, the slight varia-tions in thickness across the plate's surface serve to retard oradvance the phase of the wave front. From a geometric per-spective, the angular changes in the surface of the elementcause ray paths to deviate from their original course to imagelight from different points along the optic axis for a givenlateral position in the image plane. For this simulation, anelement was modeled with a sag of the form shown in Equa-tion 1, where n=3.
Sag=a°((r ^
r n—[379] 0 o
A coefficient a,-0.000122 was selected to generateapproximately five waves of peak to valley wave front errorover the aperture. The element shown as a 3-D rendering inFIG. 6 contains about 6.6 microns of total sag. The elementwas modeled at an exposed aperture stop in the exemplaryflow imaging system to generate the PSFs used in the subse-quent analysis as described below. The results are summa-rized in FIGS. 10A and 10B, described in detail below.Simulation of the Spherical Aberration EDF Method
The spherical aberration EDF method involves impartingspherical aberration in the wave front by inserting a distortionelement between the object and the objective lens in order toinduce spherical aberration into the collected imagery. Usefuldistortion elements include a cover slip (or parallel plate), acustom objective with a correction collar, a custom cuvette
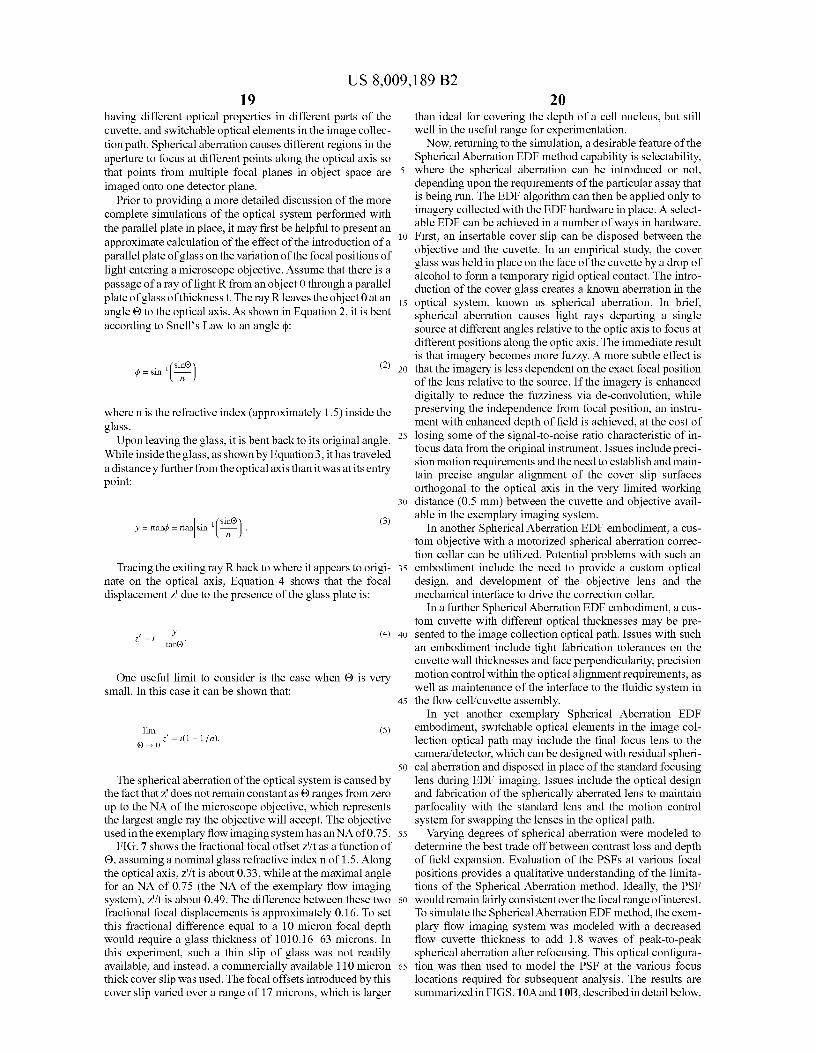
US 8,009,189 B2
The spherical aberration of the optical system is caused bythe fact that z' does not remain constant as O ranges from zeroup to the NA of the microscope objective, which representsthe largest angle ray the objective will accept. The objectiveused in the exemplary flow imaging system has an NA of 0.75.
FIG. 7 shows the fractional focal offset z'/t as a function ofO, assuming a nominal glass refractive index n of 1.5. Alongthe optical axis, z'/t is about 0.33, while at the maximal anglefor an NA of 0.75 (the NA of the exemplary flow imagingsystem), z'/t is about 0.49. The difference between these twofractional focal displacements is approximately 0.16. To setthis fractional difference equal to a 10 micron focal depthwould require a glass thickness of 1010.16=63 microns. Inthis experiment, such a thin slip of glass was not readilyavailable, and instead, a commercially available 110 micronthick cover slip was used. The focal offsets introduced by thiscover slip varied over a range of 17 microns, which is larger
20than ideal for covering the depth of a cell nucleus, but stillwell in the useful range for experimentation.
Now, returning to the simulation, a desirable feature of theSpherical Aberration EDF method capability is selectability,
5 where the spherical aberration can be introduced or not,depending upon the requirements of the particular assay thatis being run. The EDF algorithm can then be applied only toimagery collected with the EDF hardware in place. A select-able EDF can be achieved in a number of ways in hardware.
io First, an insertable cover slip can be disposed between theobjective and the cuvette. In an empirical study, the coverglass was held in place on the face of the cuvette by a drop ofalcohol to form a temporary rigid optical contact. The intro-duction of the cover glass creates a known aberration in the
15 optical system, known as spherical aberration. In brief,spherical aberration causes light rays departing a singlesource at different angles relative to the optic axis to focus atdifferent positions along the optic axis. The immediate resultis that imagery becomes more fuzzy. A more subtle effect is
20 that the imagery is less dependent on the exact focal positionof the lens relative to the source. If the imagery is enhanceddigitally to reduce the fuzziness via de-convolution, whilepreserving the independence from focal position, an instru-ment with enhanced depth of field is achieved, at the cost of
25 losing some of the signal-to-noise ratio characteristic of in-focus data from the original instrument. Issues include preci-sion motion requirements and the need to establish and main-tain precise angular alignment of the cover slip surfacesorthogonal to the optical axis in the very limited working
3o distance (0.5 mm) between the cuvette and objective avail-able in the exemplary imaging system.
In another Spherical Aberration EDF embodiment, a cus-tom objective with a motorized spherical aberration correc-tion collar can be utilized. Potential problems with such an
35 embodiment include the need to provide a custom opticaldesign, and development of the objective lens and themechanical interface to drive the correction collar.
In a further Spherical Aberration EDF embodiment, a cus-tom cuvette with different optical thicknesses may be pre-
40 sented to the image collection optical path. Issues with suchan embodiment include tight fabrication tolerances on thecuvette wall thicknesses and face perpendicularity, precisionmotion control within the optical alignment requirements, aswell as maintenance of the interface to the fluidic system in
45 the flow cell/cuvette assembly.In yet another exemplary Spherical Aberration EDF
embodiment, switchable optical elements in the image col-lection optical path may include the final focus lens to thecamera/detector, which can be designed with residual spheri-
50 cal aberration and disposed in place of the standard focusinglens during EDF imaging. Issues include the optical designand fabrication of the spherically aberrated lens to maintainparfocality with the standard lens and the motion controlsystem for swapping the lenses in the optical path.
55 Varying degrees of spherical aberration were modeled todetermine the best trade off between contrast loss and depthof field expansion. Evaluation of the PSFs at various focalpositions provides a qualitative understanding of the limita-tions of the Spherical Aberration method. Ideally, the PSF
60 would remain fairly consistent overthe focal range of interest.To simulate the Spherical Aberration EDF method, the exem-plary flow imaging system was modeled with a decreasedflow cuvette thickness to add 1.8 waves of peak-to-peakspherical aberration after refocusing. This optical configura-
65 tion was then used to model the PSF at the various focuslocations required for subsequent analysis. The results aresummarized in FIGS. 10A and lOB, described in detail below.
19having different optical properties in different parts of thecuvette, and switchable optical elements in the image collec-tion path. Spherical aberration causes different regions in theaperture to focus at different points along the optical axis sothat points from multiple focal planes in object space areimaged onto one detector plane.
Prior to providing a more detailed discussion of the morecomplete simulations of the optical system performed withthe parallel plate in place, it may first be helpful to present anapproximate calculation of the effect of the introduction of aparallel plate of glass on the variation of the focal positions oflight entering a microscope objective. Assume that there is apassage of a ray of light R from an object 0 through a parallelplate of glass of thickness t. The ray R leaves the object 0 at anangle O to the optical axis. As shown in Equation 2, it is bentaccording to Snell's Law to an angle ^:
0 =siri sin(I
)(2)
where n is the refractive index (approximately 1.5) inside theglass.
Upon leaving the glass, it is bent back to its original angle.While inside the glass, as shown by Equation 3, it has traveleda distance y further from the optical axis than it was at its entrypoint:
y = nanO = nan[siri i (sin0 ^^ 3)
Tracing the exiting ray R back to where it appears to origi-nate on the optical axis, Equation 4 shows that the focaldisplacement z' due to the presence of the glass plate is:
= t — y (4)Z,
tanO .
One useful limit to consider is the case when O is verysmall. In this case it can be shown that:
lim (5)0-0z —t(1-1/n).
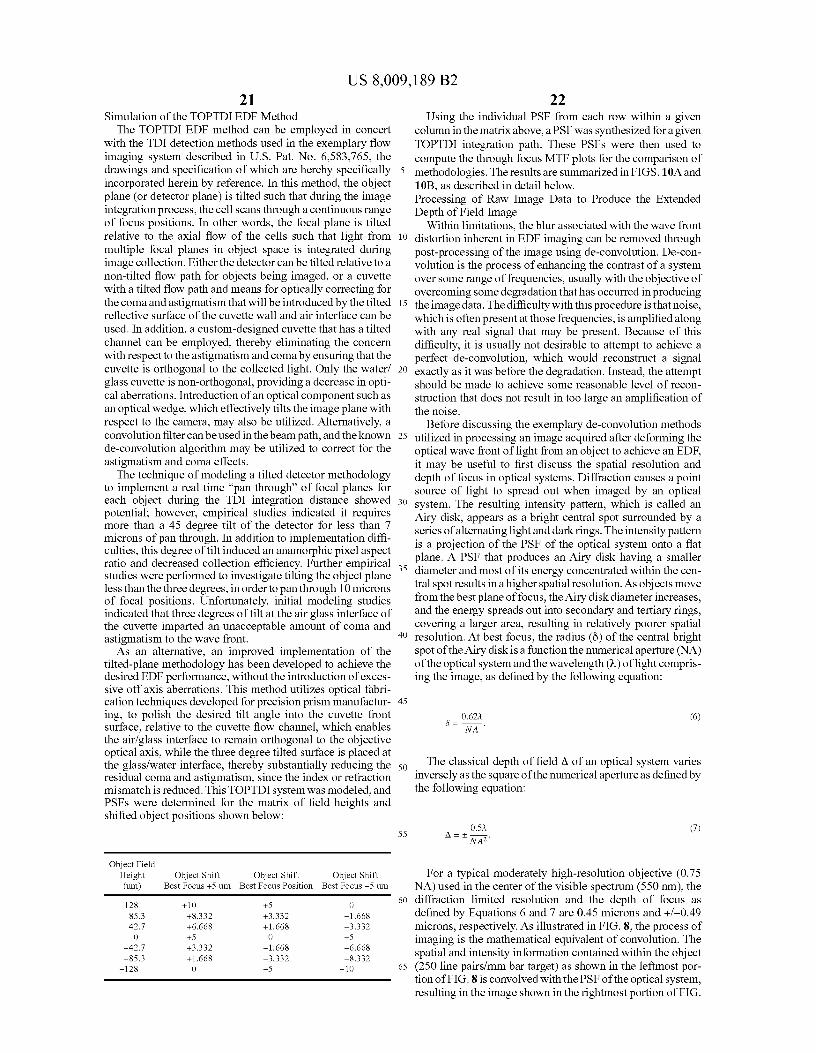
US 8,009,189 B221
Simulation of the TOPTDI EDF MethodThe TOPTDI EDF method can be employed in concert
with the TDI detection methods used in the exemplary flowimaging system described in U.S. Pat. No. 6,583,765, thedrawings and specification of which are hereby specificallyincorporated herein by reference. In this method, the objectplane (or detector plane) is tilted such that during the imageintegration process, the cell scans through a continuous rangeof focus positions. In other words, the focal plane is tiltedrelative to the axial flow of the cells such that light frommultiple focal planes in object space is integrated duringimage collection. Either the detector can be tilted relative to anon-tilted flow path for objects being imaged, or a cuvettewith a tilted flow path and means for optically correcting forthe coma and astigmatism that will be introduced by the tiltedreflective surface of the cuvette wall and air interface can beused. In addition, a custom-designed cuvette that has a tiltedchannel can be employed, thereby eliminating the concernwith respect to the astigmatism and coma by ensuring that thecuvette is orthogonal to the collected light. Only the water/glass cuvette is non-orthogonal, providing a decrease in opti-cal aberrations. Introduction of an optical component such asan optical wedge, which effectively tilts the image plane withrespect to the camera, may also be utilized. Alternatively, aconvolution filter can be used in the beam path, and the knownde-convolution algorithm may be utilized to correct for theastigmatism and coma effects.
The technique of modeling a tilted detector methodologyto implement a real time "pan through" of focal planes foreach object during the TDI integration distance showedpotential; however, empirical studies indicated it requiresmore than a 45 degree tilt of the detector for less than 7microns of pan through. In addition to implementation diffi-culties, this degree of tilt induced an anamorphic pixel aspectratio and decreased collection efficiency. Further empiricalstudies were performed to investigate tilting the object planeless than the three degrees, in order to pan through 10 micronsof focal positions. Unfortunately, initial modeling studiesindicated that three degrees of tilt at the air glass interface ofthe cuvette imparted an unacceptable amount of coma andastigmatism to the wave front.
As an alternative, an improved implementation of thetilted-plane methodology has been developed to achieve thedesired EDF performance, without the introduction of exces-sive off axis aberrations. This method utilizes optical fabri-cation techniques developed for precision prism manufactur-ing, to polish the desired tilt angle into the cuvette frontsurface, relative to the cuvette flow channel, which enablesthe air/glass interface to remain orthogonal to the objectiveoptical axis, while the three degree tilted surface is placed atthe glass/water interface, thereby substantially reducing theresidual coma and astigmatism, since the index or refractionmismatch is reduced. This TOPTDI system was modeled, andPSFs were determined for the matrix of field heights andshifted object positions shown below:
Object FieldHeight Object Shift Object Shift Object Shift(um) Best Focus +5 um Best Focus Position Best Focus —5 um
128 +10 +5 085.3 +8.332 +3.332 —1.66842.7 +6.668 +1.668 —3.332
0 +5 0 —5—42.7 +3.332 —1.668 —6.668—85.3 +1.668 —3.332 —8.332
—128 0 —5 —10
22Using the individual PSF from each row within a given
column in the matrix above, a PSF was synthesized for a givenTOPTDI integration path. These PSFs were then used tocompute the through focus MTF plots for the comparison of
5 methodologies. The results are summarized in FIGS. 1 O and10B, as described in detail below.Processing of Raw Image Data to Produce the ExtendedDepth of Field Image
Within limitations, the blur associated with the wave front10 distortion inherent in EDF imaging can be removed through
post-processing of the image using de-convolution. De-con-volution is the process of enhancing the contrast of a systemover some range of frequencies, usually with the objective ofovercoming some degradation that has occurred in producing
15 the image data. The difficulty with this procedure is that noise,which is often present at those frequencies, is amplified alongwith any real signal that may be present. Because of thisdifficulty, it is usually not desirable to attempt to achieve aperfect de-convolution, which would reconstruct a signal
20 exactly as it was before the degradation. Instead, the attemptshould be made to achieve some reasonable level of recon-struction that does not result in too large an amplification ofthe noise.
Before discussing the exemplary de-convolution methods25 utilized in processing an image acquired after deforming the
optical wave front of light from an object to achieve an EDF,it may be useful to first discuss the spatial resolution anddepth of focus in optical systems. Diffraction causes a pointsource of light to spread out when imaged by an optical
30 system. The resulting intensity pattern, which is called anAiry disk, appears as a bright central spot surrounded by aseries of alternating light and dark rings. The intensity patternis a projection of the PSF of the optical system onto a flatplane. A PSF that produces an Airy disk having a smaller
35 diameter and most of its energy concentrated within the cen-tral spot results in a higher spatial resolution. As objects movefrom the best plane of focus, the Airy disk diameter increases,and the energy spreads out into secondary and tertiary rings,covering a larger area, resulting in relatively poorer spatial
40 resolution. At best focus, the radius (6) of the central brightspot of theAiry disk is a function the numerical aperture (NA)of the optical system and the wavelength (X) of light compris-ing the image, as defined by the following equation:
45
— 0.62L (6)
NA
50 The classical depth of field A of an optical system varies
inversely as the square of the numerical aperture as defined bythe following equation:
550-+0.5L (7)
NAz
For a typical moderately high-resolution objective (0.75NA) used in the center of the visible spectrum (550 mu), the
6o diffraction limited resolution and the depth of focus asdefined by Equations 6 and 7 are 0.45 microns and +/-0.49microns, respectively. As illustrated in FIG. 8, the process ofimaging is the mathematical equivalent of convolution. Thespatial and intensity information contained within the object
65 (250 line pairs/mm bar target) as shown in the leftmost por-tion of FIG. 8 is convolved with the PSF of the optical system,resulting in the image shown in the rightmost portion of FIG.
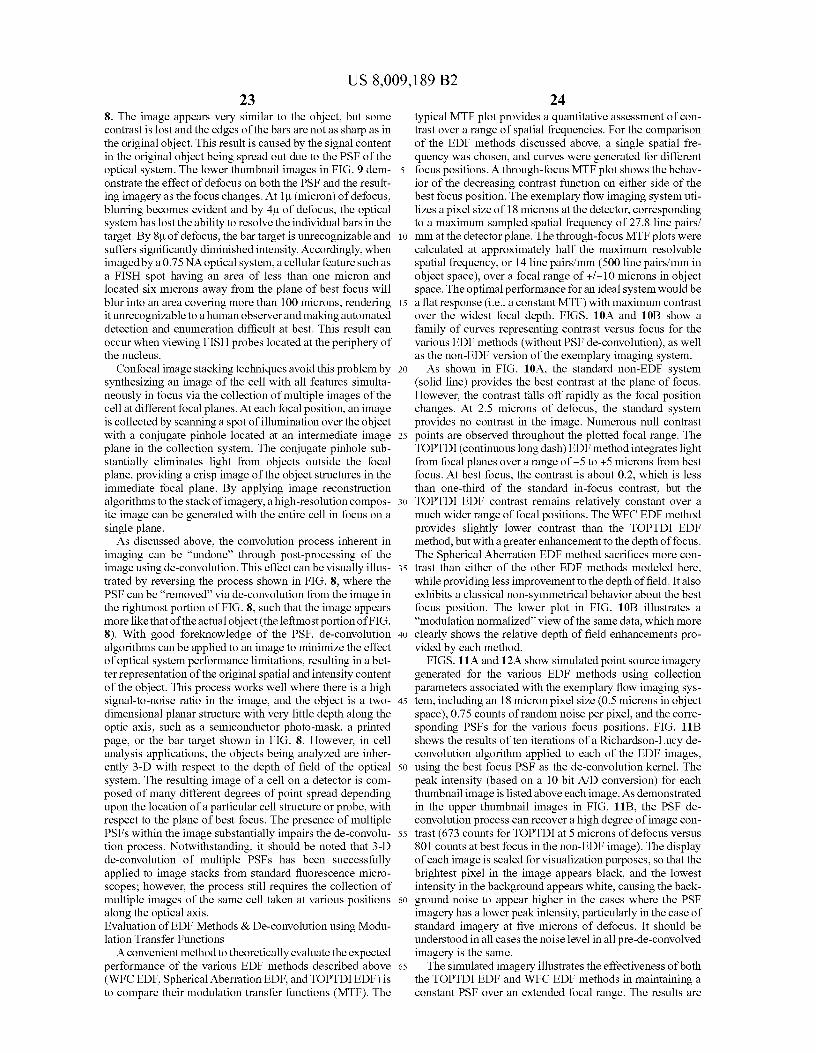
US 8,009,189 B223
248. The image appears very similar to the object, but some typical MTF plot provides a quantitative assessment of con-contrast is lost and the edges of the bars are not as sharp as in trast over a range of spatial frequencies. For the comparisonthe original object. This result is caused by the signal content of the EDF methods discussed above, a single spatial fre-in the original object being spread out due to the PSF of the quency was chosen, and curves were generated for differentoptical system. The lower thumbnail images in FIG. 9 dem- 5 focus positions. A through-focus MTF plot shows the behav-onstrate the effect of defocus on both the PSF and the result- ior of the decreasing contrast function on either side of theing imagery as the focus changes. At 1 µ (micron) of defocus, best focus position. The exemplary flow imaging system uti-blurring becomes evident and by 4µ of defocus, the optical
lizes a pixel size of 18 microns at the detector, corresponding
system has lost the ability to resolve the individual bars in the to a maximum sampled spatial frequency of 27.8 line pairs/target. By 8µ of defocus, the bar target is unrecognizable and io mm at the detector plane. The through-focus MTF plots weresuffers significantly diminished intensity. Accordingly, when calculated at approximately half the maximum resolvableimaged by a 0.75 NA optical system, a cellular feature such as spatial frequency, or 14 line pairs/mm (500 line pairs/mm ina FISH spot having an area of less than one micron and
object space), over a focal range of +/-10 microns in object
located six microns away from the plane of best focus will
space. The optimal performance for an ideal system would beblur into an area covering more than 100 microns, rendering 15 a flat response (i.e., a constant MTF) with maximum contrastit unrecognizable to a human observer and making automated
over the widest focal depth. FIGS. 10A and 10B show a
detection and enumeration difficult at best. This result can
family of curves representing contrast versus focus for theoccur when viewing FISH probes located at the periphery of
various EDF methods (without PSF de-convolution), as well
the nucleus. as the non-EDF version of the exemplary imaging system.Confocal image stacking techniques avoid this problem by 20 As shown in FIG. 10A, the standard non-EDF system
synthesizing an image of the cell with all features simulta- (solid line) provides the best contrast at the plane of focus.neously in focus via the collection of multiple images of the
However, the contrast falls off rapidly as the focal position
cell at different focal planes. At each focal position, an image changes. At 2.5 microns of defocus, the standard systemis collected by scanning a spot of illumination over the obj ect provides no contrast in the image. Numerous null contrastwith a conjugate pinhole located at an intermediate image 25 points are observed throughout the plotted focal range. Theplane in the collection system. The conjugate pinhole sub- TOPTDI (continuous long dash) EDF method integrates lightstantially eliminates light from objects outside the focal
from focal planes over a range of —5 to +5 microns from best
plane, providing a crisp image of the object structures in the
focus. At best focus, the contrast is about 0.2, which is lessimmediate focal plane. By applying image reconstruction than one-third of the standard in-focus contrast, but thealgorithms to the stack of imagery, a high-resolution compos- 3o TOPTDI EDF contrast remains relatively constant over aite image can be generated with the entire cell in focus on a much wider range of focal positions. The WFC EDF methodsingle plane. provides slightly lower contrast than the TOPTDI EDF
As discussed above, the convolution process inherent in method, but with a greater enhancement to the depth of focus.imaging can be "undone" through post-processing of the
The Spherical Aberration EDF method sacrifices more con-
image using de-convolution. This effect can be visually illus- 35 trast than either of the other EDF methods modeled here,trated by reversing the process shown in FIG. 8, where the while providing less improvement to the depth of field. It alsoPSF can be "removed" via de-convolution from the image in exhibits a classical non-symmetrical behavior about the bestthe rightmost portion of FIG. 8, such that the image appears
focus position. The lower plot in FIG. 10B illustrates a
more like that of the actual object (the leftmost portion of FIG. "modulation normalized" view of the same data, which more8). With good foreknowledge of the PSF, de-convolution 40 clearly shows the relative depth of field enhancements pro-algorithms can be applied to an image to minimize the effect vided by each method.of optical system performance limitations, resulting in a bet- FIGS. 11A and 12A show simulated point source imageryter representation of the original spatial and intensity content generated for the various EDF methods using collectionof the object. This process works well where there is a high
parameters associated with the exemplary flow imaging sys-
signal-to-noise ratio in the image, and the object is a two- 45 tem, including an 18 micron pixel size (0.5 microns in objectdimensional planar structure with very little depth along the space), 0.75 counts of random noise per pixel, and the corre-optic axis, such as a semiconductor photo-mask, a printed
sponding PSFs for the various focus positions. FIG. 11B
page, or the bar target shown in FIG. 8. However, in cell
shows the results of ten iterations of a Richardson-Lucy de-analysis applications, the objects being analyzed are inher- convolution algorithm applied to each of the EDF images,ently 3-D with respect to the depth of field of the optical 50 using the best focus PSF as the de-convolution kernel. Thesystem. The resulting image of a cell on a detector is com- peak intensity (based on a 10 bit A/D conversion) for eachposed of many different degrees of point spread depending thumbnail image is listed above each image. As demonstratedupon the location of a particular cell structure or probe, with
in the upper thumbnail images in FIG. 11B, the PSF de-
respect to the plane of best focus. The presence of multiple convolution process can recover a high degree of image con-PSFs within the image substantially impairs the de-convolu- 55 trast (673 counts for TOPTDI at 5 microns of defocus versustion process. Notwithstanding, it should be noted that 3-D
801 counts at best focus in the non-EDF image). The display
de-convolution of multiple PSFs has been successfully of each image is scaled for visualization purposes, so that theapplied to image stacks from standard fluorescence micro- brightest pixel in the image appears black, and the lowestscopes; however, the process still requires the collection of
intensity in the background appears white, causing the back-
multiple images of the same cell taken at various positions 60 ground noise to appear higher in the cases where the PSFalong the optical axis. imagery has a lower peak intensity, particularly in the case ofEvaluation of EDF Methods & De-convolution using Modu- standard imagery at five microns of defocus. It should belation Transfer Functions understood in all cases the noise level in all pre-de-convolved
A convenient method to theoretically evaluate the expected
imagery is the same.performance of the various EDF methods described above 65 The simulated imagery illustrates the effectiveness of both(WFC EDF, Spherical Aberration EDF, and TOPTDI EDF) is the TOPTDI EDF and WFC EDF methods in maintaining ato compare their modulation transfer functions (MTF). The constant PSF over an extended focal range. The results are
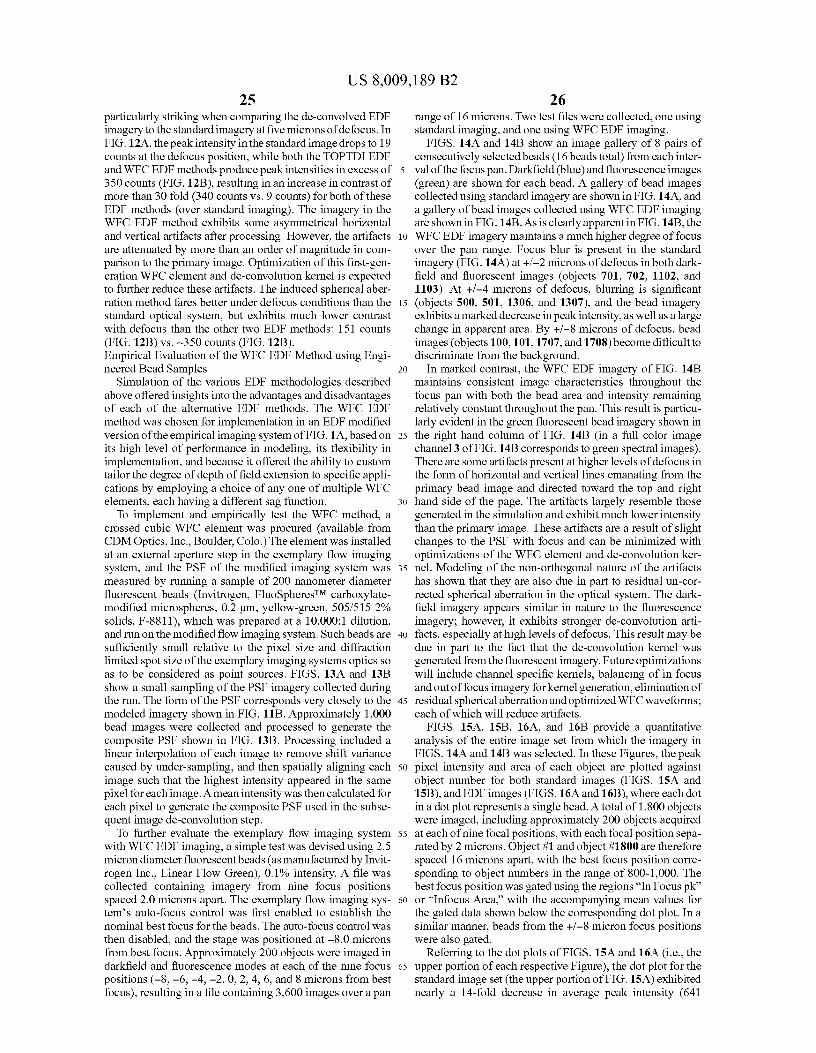
US 8,009,189 B225
26particularly striking when comparing the de-convolved EDF
range of 16 microns. Two test files were collected, one using
imagery to the standard imagery at five microns of defocus. In standard imaging, and one using WFC EDF imaging.FIG. 12A, the peak intensity in the standard image drops to 19
FIGS. 14A and 14B show an image gallery of 8 pairs of
counts at the defocus position, while both the TOPTDI EDF
consecutively selected beads (16 beads total) from each inter-and WFC EDF methods produce peak intensities in excess of 5 val of the focus pan. Darkfield (blue) and fluorescence images350 counts (FIG. 12B), resulting in an increase in contrast of
(green) are shown for each bead. A gallery of bead images
more than 30 fold (340 counts vs. 9 counts) for both of these collected using standard imagery are shown in FIG. 14A, andEDF methods (over standard imaging). The imagery in the a gallery of bead images collected using WFC EDF imagingWFC EDF method exhibits some asymmetrical horizontal
are shown in FIG. 14B. As is clearly apparent in FIG. 14B, the
and vertical artifacts after processing. However, the artifacts io WFC EDF imagery maintains a much higher degree of focusare attenuated by more than an order of magnitude in com- over the pan range. Focus blur is present in the standardparison to the primary image. Optimization of this first-gen- imagery (FIG. 14A) at +/-2 microns of defocus in both dark-eration WFC element and de-convolution kernel is expected
field and fluorescent images (objects 701, 702, 1102, and
to further reduce these artifacts. The induced spherical aber- 1103). At +/-4 microns of defocus, blurring is significantration method fares better under defocus conditions than the 15 (objects 500, 501, 1306, and 1307), and the bead imagerystandard optical system, but exhibits much lower contrast exhibits a marked decrease in peak intensity, as well as a largewith defocus than the other two EDF methods: 151 counts change in apparent area. By +/-8 microns of defocus, bead(FIG. 12B) vs. —350 counts (FIG. 12B). images (objects 100, 101, 1707, and 1708) become difficult toEmpirical Evaluation of the WFC EDF Method using Engi- discriminate from the background.neered Bead Samples 20 In marked contrast, the WFC EDF imagery of FIG. 14B
Simulation of the various EDF methodologies described
maintains consistent image characteristics throughout theabove offered insights into the advantages and disadvantages
focus pan with both the bead area and intensity remaining
of each of the alternative EDF methods. The WFC EDF
relatively constant throughout the pan. This result is particu-method was chosen for implementation in an EDF modified
larly evident in the green fluorescent bead imagery shown in
version of the empirical imaging system of FIG. 1A, based on 25 the right hand column of FIG. 14B (in a full color imageits high level of performance in modeling, its flexibility in channel 3 of FIG. 14B corresponds to green spectral images).implementation, and because it offered the ability to custom
There are some artifacts present at higher levels of defocus in
tailor the degree of depth of field extension to specific appli- the form of horizontal and vertical lines emanating from thecations by employing a choice of any one of multiple WFC
primary bead image and directed toward the top and right
elements, each having a different sag function. 3o hand side of the page. The artifacts largely resemble thoseTo implement and empirically test the WFC method, a generated in the simulation and exhibit much lower intensity
crossed cubic WFC element was procured (available from than the primary image. These artifacts are a result of slightCDM Optics, Inc., Boulder, Colo.) The element was installed
changes to the PSF with focus and can be minimized with
at an external aperture stop in the exemplary flow imaging optimizations of the WFC element and de-convolution ker-system, and the PSF of the modified imaging system was 35 nel. Modeling of the non-orthogonal nature of the artifactsmeasured by running a sample of 200 nanometer diameter
has shown that they are also due in part to residual un-cor-
fluorescent beads (Invitrogen, F1uoSpheresTM carboxylate- rected spherical aberration in the optical system. The dark-modified microspheres, 0.2 µm, yellow-green, 5051515 2%
field imagery appears similar in nature to the fluorescence
solids, F-8811), which was prepared at a 10,000:1 dilution, imagery; however, it exhibits stronger de-convolution arti-and run on the modified flow imaging system. Such beads are 40 facts, especially at high levels of defocus. This result may besufficiently small relative to the pixel size and diffraction
due in part to the fact that the de-convolution kernel was
limited spot size of the exemplary imaging systems optics so generated from the fluorescent imagery. Future optimizationsas to be considered as point sources. FIGS. 13A and 13B
will include channel specific kernels, balancing of in focus
show a small sampling of the PSF imagery collected during and out of focus imagery for kernel generation, elimination ofthe run. The form of the PSF corresponds very closely to the 45 residual spherical aberration and optimized WFC waveforms;modeled imagery shown in FIG. 11B. Approximately 1,000
each of which will reduce artifacts.
bead images were collected and processed to generate the
FIGS. 15A, 15B, 16A, and 16B provide a quantitativecomposite PSF shown in FIG. 13B. Processing included a analysis of the entire image set from which the imagery inlinear interpolation of each image to remove shift variance
FIGS. 14A and 14B was selected. In these Figures, the peak
caused by under-sampling, and then spatially aligning each 50 pixel intensity and area of each object are plotted againstimage such that the highest intensity appeared in the same object number for both standard images (FIGS. 15A andpixel for each image. A mean intensity was then calculated for
15B), and EDF images (FIGS. 16A and 16B), where each dot
each pixel to generate the composite PSF used in the subse- in a dot plot represents a single bead. A total of 1,800 objectsquent image de-convolution step. were imaged, including approximately 200 objects acquired
To further evaluate the exemplary flow imaging system 55 at each of nine focal positions, with each focal position sepa-with WFC EDF imaging, a simple test was devised using 2.5
rated by 2 microns. Object #1 and object #1800 are therefore
micron diameter fluorescent beads (as manufactured by Invit- spaced 16 microns apart, with the best focus position corre-rogen Inc., Linear Flow Green), 0.1% intensity. A file was sponding to object numbers in the range of 800-1,000. Thecollected containing imagery from nine focus positions
best focus position was gated using the regions "In Focus pk"
spaced 2.0 microns apart. The exemplary flow imaging sys- 60 or "Infocus Area," with the accompanying mean values fortem's auto-focus control was first enabled to establish the the gated data shown below the corresponding dot plot. In anominal best focus for the beads. The auto-focus control was similar manner, beads from the +/-8 micron focus positionsthen disabled, and the stage was positioned at —8.0 microns were also gated.from best focus. Approximately 200 objects were imaged in
Referring to the dot plots of FIGS. 15A and 16A (i.e., the
darkfield and fluorescence modes at each of the nine focus 65 upper portion of each respective Figure), the dot plot for thepositions (-8, —6, —4, —2, 0, 2, 4, 6, and 8 microns from best standard image set (the upper portion of FIG. 15A) exhibitedfocus), resulting in a file containing 3,600 images over a pan nearly a 14-fold decrease in average peak intensity (641
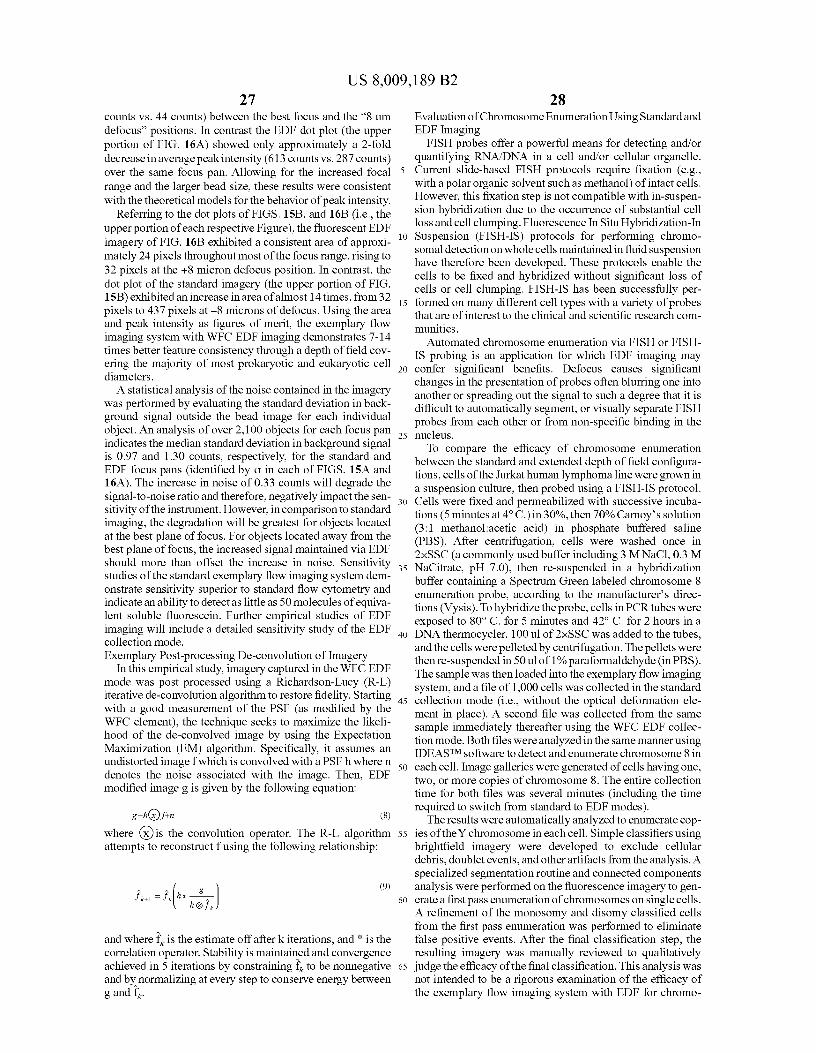
US 8,009,189 B227
counts vs. 44 counts) between the best focus and the "8 umdefocus" positions. In contrast the EDF dot plot (the upperportion of FIG. 16A) showed only approximately a 2-folddecrease in average peak intensity (613 counts vs. 287 counts)over the same focus pan. Allowing for the increased focalrange and the larger bead size, these results were consistentwith the theoretical models for the behavior of peak intensity.
Referring to the dot plots of FIGS. 15B, and 16B (i.e., theupper portion of each respective Figure), the fluorescent EDFimagery of FIG. 16B exhibited a consistent area of approxi-mately 24 pixels throughout most of the focus range, rising to32 pixels at the +8 micron defocus position. In contrast, thedot plot of the standard imagery (the upper portion of FIG.15B) exhibited an increase in area of almost 14 times, from 32pixels to 437 pixels at —8 microns of defocus. Using the areaand peak intensity as figures of merit, the exemplary flowimaging system with WFC EDF imaging demonstrates 7-14times better feature consistency through a depth of field cov-ering the majority of most prokaryotic and eukaryotic celldiameters.
A statistical analysis of the noise contained in the imagerywas performed by evaluating the standard deviation in back-ground signal outside the bead image for each individualobject. An analysis of over 2,100 objects for each focus panindicates the median standard deviation in background signalis 0.97 and 1.30 counts, respectively, for the standard andEDF focus pans (identified by a in each of FIGS. 15A and16A). The increase in noise of 0.33 counts will degrade thesignal-to-noise ratio and therefore, negatively impact the sen-sitivity of the instrument. However, in comparison to standardimaging, the degradation will be greatest for objects locatedat the best plane of focus. For objects located away from thebest plane of focus, the increased signal maintained via EDFshould more than offset the increase in noise. Sensitivitystudies of the standard exemplary flow imaging system dem-onstrate sensitivity superior to standard flow cytometry andindicate an ability to detect as little as 50 molecules of equiva-lent soluble fluorescein. Further empirical studies of EDFimaging will include a detailed sensitivity study of the EDFcollection mode.Exemplary Post-processing De-convolution of Imagery
In this empirical study, imagery captured in the WFC EDFmode was post processed using a Richardson-Lucy (R-L)iterative de-convolution algorithm to restore fidelity. Startingwith a good measurement of the PSF (as modified by theWFC element), the technique seeks to maximize the likeli-hood of the de-convolved image by using the ExpectationMaximization (EM) algorithm. Specifically, it assumes anundistorted image f which is convolved with a PSF h where ndenotes the noise associated with the image. Then, EDFmodified image g is given by the following equation:
g=h(Df+n (8)
where x@is the convolution operator. The R-L algorithmattempts to reconstruct f using the following relationship:
t tg (9)
.1 k+1 - f k hh® fk
and where fk is the estimate off after k iterations, and * is thecorrelation operator. Stability is maintained and convergenceachieved in 5 iterations by constraining fk to be nonnegativeand by normalizing at every step to conserve energy betweeng and f,
28Evaluation of Chromosome Enumeration Using Standard andEDF Imaging
FISH probes offer a powerful means for detecting and/orquantifying RNA/DNA in a cell and/or cellular organelle.
5 Current slide-based FISH protocols require fixation (e.g.,with a polar organic solvent such as methanol) of intact cells.However, this fixation step is not compatible with in-suspen-sion hybridization due to the occurrence of substantial cellloss and cell clumping. Fluorescence In Situ Hybridization-In
io Suspension (FISH-IS) protocols for performing chromo-somal detection on whole cells maintained in fluid suspensionhave therefore been developed. These protocols enable thecells to be fixed and hybridized without significant loss ofcells or cell clumping. FISH-IS has been successfully per-
15 formed on many different cell types with a variety of probesthat are of interest to the clinical and scientific research com-munities.
Automated chromosome enumeration via FISH or FISH-IS probing is an application for which EDF imaging may
20 confer significant benefits. Defocus causes significantchanges in the presentation of probes often blurring one intoanother or spreading out the signal to such a degree that it isdifficult to automatically segment, or visually separate FISHprobes from each other or from non-specific binding in the
25 nucleus.To compare the efficacy of chromosome enumeration
between the standard and extended depth of field configura-tions, cells of the 7urkat human lymphoma line were grown ina suspension culture, then probed using a FISH-IS protocol.
30 Cells were fixed and permeabilized with successive incuba-tions (5 minutes at 4° C.) in 30%, then 70% Camoy's solution(3:1 methanol:acetic acid) in phosphate buffered saline(PBS). After centrifugation, cells were washed once in2xSSC (a commonly used buffer including 3 M NaCl, 0.3 M
35 NaCitrate, pH 7.0), then re-suspended in a hybridizationbuffer containing a Spectrum Green labeled chromosome 8enumeration probe, according to the manufacturer's direc-tions (Vysis). To hybridize the probe, cells in PCR tubes wereexposed to 80° C. for 5 minutes and 42° C. for 2 hours in a
4o DNA thermocycler. 100 ul of 2xSSC was added to the tubes,and the cells were pelleted by centrifugation. The pellets werethen re-suspended in 50 ul of I %paraformaldehyde (in PBS).The sample was then loaded into the exemplary flow imagingsystem, and a file of 1,000 cells was collected in the standard
45 collection mode (i.e., without the optical deformation ele-ment in place). A second file was collected from the samesample immediately thereafter using the WFC EDF collec-tion mode. Both files were analyzed in the same manner usingIDEASTM software to detect and enumerate chromosome 8 in
50 each cell. Image galleries were generated of cells having one,two, or more copies of chromosome 8. The entire collectiontime for both files was several minutes (including the timerequired to switch from standard to EDF modes).
The results were automatically analyzed to enumerate cop-55 ies of theY chromosome in each cell. Simple classifiers using
brightfield imagery were developed to exclude cellulardebris, doublet events, and other artifacts from the analysis. Aspecialized segmentation routine and connected componentsanalysis were performed on the fluorescence imagery to gen-
60 erate a first pass enumeration of chromosomes on single cells.A refinement of the monosomy and disomy classified cellsfrom the first pass enumeration was performed to eliminatefalse positive events. After the final classification step, theresulting imagery was manually reviewed to qualitatively
65 judge the efficacy of the final classification. This analysis wasnot intended to be a rigorous examination of the efficacy ofthe exemplary flow imaging system with EDF for chromo-
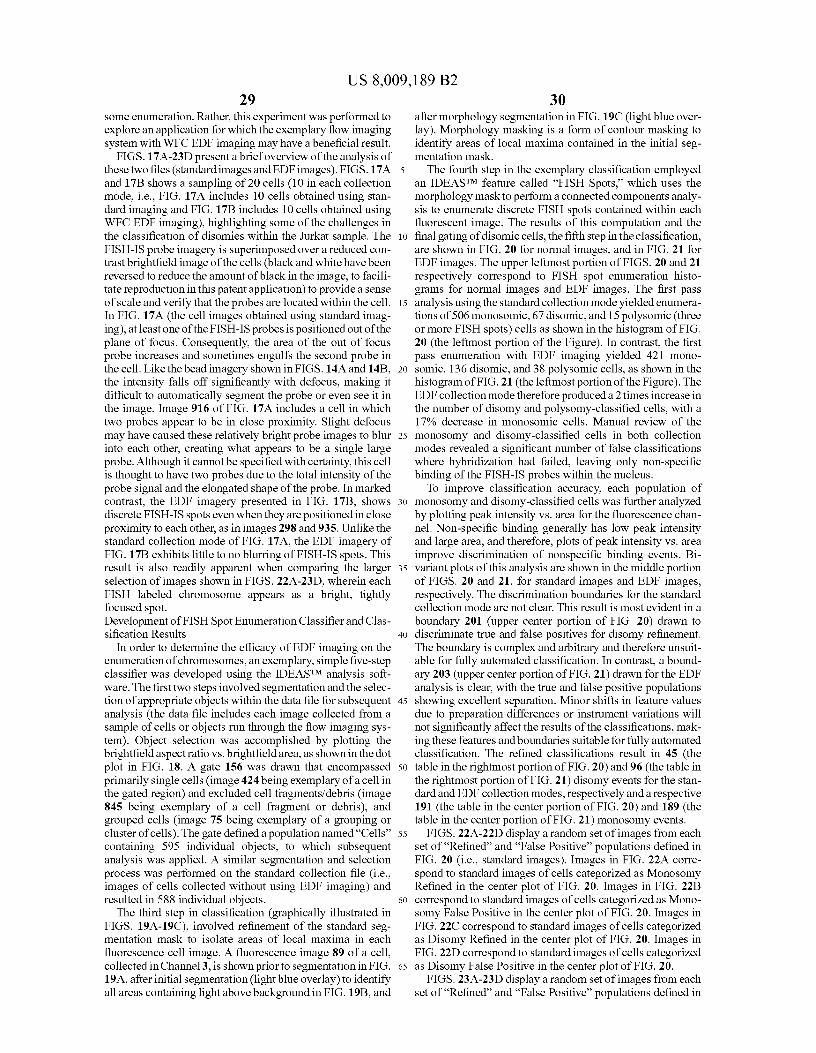
US 8,009,189 B229
30some enumeration. Rather, this experiment was performed to after morphology segmentation in FIG. 19C (light blue over-explore an application for which the exemplary flow imaging
lay). Morphology masking is a form of contour masking to
system with WFC EDF imaging may have a beneficial result. identify areas of local maxima contained in the initial seg-FIGS. 17A-23D present a brief overview of the analysis of
mentation mask.
these two files (standard images and EDF images). FIGS. 17A 5 The fourth step in the exemplary classification employedand 17B shows a sampling of 20 cells (10 in each collection an IDEASTM feature called "FISH Spots," which uses themode, i.e., FIG. 17A includes 10 cells obtained using stan- morphology mask to perform a connected components analy-dard imaging and FIG. 17B includes 10 cells obtained using sis to enumerate discrete FISH spots contained within eachWFC EDF imaging), highlighting some of the challenges in
fluorescent image. The results of this computation and the
the classification of disomies within the 7urkat sample. The io final gating of disomic cells, the fifth step in the classification,FISH-IS probe imagery is superimposed over a reduced con- are shown in FIG. 20 for normal images, and in FIG. 21 fortrast brightfield image of the cells (black and white have been
EDF images. The upper leftmost portion of FIGS. 20 and 21
reversed to reduce the amount of black in the image, to facili- respectively correspond to FISH spot enumeration histo-tate reproduction in this patent application) to provide a sense grams for normal images and EDF images. The first passof scale and verify that the probes are located within the cell. 15 analysis using the standard collection mode yielded enumera-In FIG. 17A (the cell images obtained using standard imag- tions of 506 monosomic, 67 disomic, and 15 polysomic (threeing), at least one of the FISH-IS probes is positioned out of the or more FISH spots) cells as shown in the histogram of FIG.plane of focus. Consequently, the area of the out of focus
20 (the leftmost portion of the Figure). In contrast, the firstprobe increases and sometimes engulfs the second probe in pass enumeration with EDF imaging yielded 421 mono-the cell. Like the bead imagery shown in FIGS. 14A and 1413, 20 somic, 136 disomic, and 38 polysomic cells, as shown in thethe intensity falls off significantly with defocus, making it
histogram of FIG. 21 (the leftmost portion of the Figure). The
difficult to automatically segment the probe or even see it in
EDF collection mode therefore produced a 2 times increase inthe image. Image 916 of FIG. 17A includes a cell in which
the number of disomy and polysomy-classified cells, with a
two probes appear to be in close proximity. Slight defocus
17% decrease in monosomic cells. Manual review of themay have caused these relatively bright probe images to blur 25 monosomy and disomy-classified cells in both collectioninto each other, creating what appears to be a single large modes revealed a significant number of false classificationsprobe. Although it cannot be specified with certainty, this cell
where hybridization had failed, leaving only non-specific
is thought to have two probes due to the total intensity of the
binding of the FISH-IS probes within the nucleus.probe signal and the elongated shape of the probe. In marked
To improve classification accuracy, each population of
contrast, the EDF imagery presented in FIG. 1713, shows 30 monosomy and disomy-classified cells was further analyzeddiscrete FISH-IS spots even when they are positioned in close
by plotting peak intensity vs. area for the fluorescence chan-
proximity to each other, as in images 298 and 935. Unlike the nel. Non-specific binding generally has low peak intensitystandard collection mode of FIG. 17A, the EDF imagery of
and large area, and therefore, plots of peak intensity vs. area
FIG. 17B exhibits little to no blurring of FISH-IS spots. This
improve discrimination of nonspecific binding events. Bi-result is also readily apparent when comparing the larger 35 variant plots of this analysis are shown in the middle portionselection of images shown in FIGS. 22A-23D, wherein each
of FIGS. 20 and 21, for standard images and EDF images,
FISH labeled chromosome appears as a bright, tightly respectively. The discrimination boundaries for the standardfocused spot. collection mode are not clear. This result is most evident in aDevelopment of FISH Spot Enumeration Classifier and Clas- boundary 201 (upper center portion of FIG. 20) drawn tosification Results 4o discriminate true and false positives for disomy refinement.
In order to determine the efficacy of EDF imaging on the
The boundary is complex and arbitrary and therefore unsuit-enumeration of chromosomes, an exemplary, simple five-step able for fully automated classification. In contrast, a bound-classifier was developed using the IDEAS TM analysis soft- ary 203 (upper center portion of FIG. 21) drawn for the EDFware. The first two steps involved segmentation and the selec- analysis is clear, with the true and false positive populationstion of appropriate objects within the data file for subsequent 45 showing excellent separation. Minor shifts in feature valuesanalysis (the data file includes each image collected from a
due to preparation differences or instrument variations will
sample of cells or objects run through the flow imaging sys- not significantly affect the results of the classifications, mak-tem). Object selection was accomplished by plotting the
ing these features and boundaries suitable for fully automated
brightfield aspectratio vs. brightfield area, as shown in the dot classification. The refined classifications result in 45 (theplot in FIG. 18. A gate 156 was drawn that encompassed 50 table in the rightmost portion of FIG. 20) and 96 (the table inprimarily single cells (image 424 being exemplary of a cell in the rightmost portion of FIG. 21) disomy events for the stan-the gated region) and excluded cell fragments/debris (image
dard and EDF collection modes, respectively and a respective
845 being exemplary of a cell fragment or debris), and
191 (the table in the center portion of FIG. 20) and 189 (thegrouped cells (image 75 being exemplary of a grouping or table in the center portion of FIG. 21) monosomy events.cluster of cells). The gate defined a population named "Cells" 55 FIGS. 22A-22D display a random set of images from eachcontaining 595 individual objects, to which subsequent set of "Refined" and "False Positive" populations defined inanalysis was applied. A similar segmentation and selection
FIG. 20 (i.e., standard images). Images in FIG. 22A corre-
process was performed on the standard collection file (i.e., spond to standard images of cells categorized as Monosomyimages of cells collected without using EDF imaging) and
Refined in the center plot of FIG. 20. Images in FIG. 22B
resulted in 588 individual objects. 60 correspond to standard images of cells categorized as Mono-The third step in classification (graphically illustrated in somy False Positive in the center plot of FIG. 20. Images in
FIGS. 19A-19C), involved refinement of the standard seg- FIG. 22C correspond to standard images of cells categorizedmentation mask to isolate areas of local maxima in each
as Disomy Refined in the center plot of FIG. 20. Images in
fluorescence cell image. A fluorescence image 89 of a cell, FIG. 22D correspond to standard images of cells categorizedcollected in Channel 3, is shown prior to segmentation in FIG. 65 as Disomy False Positive in the center plot of FIG. 20.19A, after initial segmentation (light blue overlay) to identify
FIGS. 23A-23D display a random set of images from each
all areas containing light above background in FIG. 1913, and
set of "Refined" and "False Positive" populations defined in
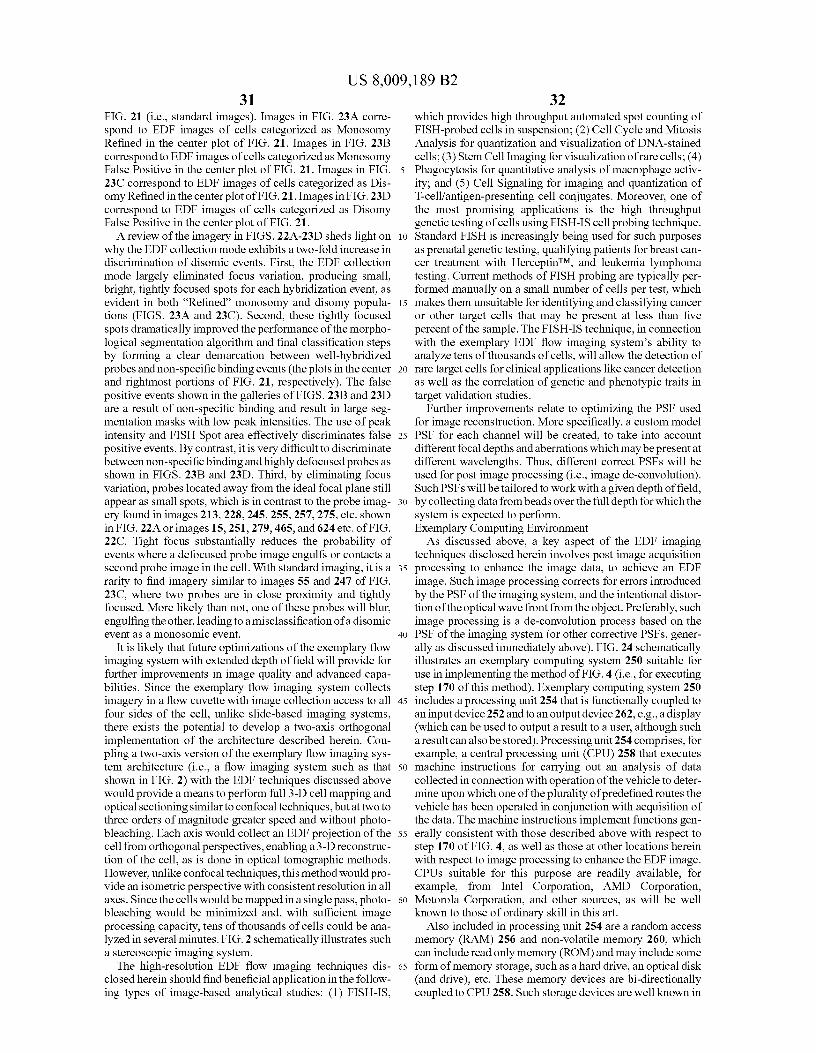
US 8,009,189 B231
32FIG. 21 (i.e., standard images). Images in FIG. 23A corre- which provides high throughput automated spot counting ofspond to EDF images of cells categorized as Monosomy
FISH-probed cells in suspension; (2) Cell Cycle and Mitosis
Refined in the center plot of FIG. 21. Images in FIG. 23B
Analysis for quantization and visualization of DNA-stainedcorrespond to EDF images of cells categorized as Monosomy cells; (3) Stem Cell Imaging for visualization of rare cells; (4)False Positive in the center plot of FIG. 21. Images in FIG. 5 Phagocytosis for quantitative analysis of macrophage activ-23C correspond to EDF images of cells categorized as Dis- ity; and (5) Cell Signaling for imaging and quantization ofomy Refined in the centerplot of FIG. 21. Images in FIG. 23D
T-cell/antigen-presenting cell conjugates. Moreover, one of
correspond to EDF images of cells categorized as Disomy the most promising applications is the high throughputFalse Positive in the center plot of FIG. 21. genetic testing of cells using FISH-IS cell probing technique.
A review of the imagery in FIGS. 22A-23D sheds light on io Standard FISH is increasingly being used for such purposeswhy the EDF collection mode exhibits a two-fold increase in as prenatal genetic testing, qualifying patients for breast can-discrimination of disomic events. First, the EDF collection cer treatment with Herceptin rm, and leukemia lymphomamode largely eliminated focus variation, producing small, testing. Current methods of FISH probing are typically per-bright, tightly focused spots for each hybridization event, as
formed manually on a small number of cells per test, which
evident in both "Refined" monosomy and disomy popula- 15 makes them unsuitable for identifying and classifying cancertions (FIGS. 23A and 23C). Second, these tightly focused
or other target cells that may be present at less than five
spots dramatically improved the performance of the morpho- percent of the sample. The FISH-IS technique, in connectionlogical segmentation algorithm and final classification steps with the exemplary EDF flow imaging system's ability toby forming a clear demarcation between well-hybridized
analyze tens of thousands of cells, will allow the detection of
probes and non-specific binding events (the plots in the center 20 rare target cells for clinical applications like cancer detectionand rightmost portions of FIG. 21, respectively). The false as well as the correlation of genetic and phenotypic traits inpositive events shown in the galleries of FIGS. 23B and 23D
target validation studies.
are a result of non-specific binding and result in large seg- Further improvements relate to optimizing the PSF usedmentation masks with low peak intensities. The use of peak
for image reconstruction. More specifically, a custom model
intensity and FISH Spot area effectively discriminates false 25 PSF for each channel will be created, to take into accountpositive events. By contrast, it is very difficult to discriminate
different focal depths and aberrations whichmay be present at
between non-specific binding and highly defocused probes as
different wavelengths. Thus, different correct PSFs will beshown in FIGS. 23B and 23D. Third, by eliminating focus used for post image processing (i.e., image de-convolution).variation, probes located away from the ideal focal plane still
Such PSFs will be tailored to work with a given depth of field,
appear as small spots, which is in contrast to the probe imag- 3o by collecting data frombeads overthe full depth for which theery found in images 213, 228, 245, 255, 257, 275, etc. shown system is expected to perform.in FIG. 22A or images 15, 251, 279, 465, and 624 etc. of FIG. Exemplary Computing Environment22C. Tight focus substantially reduces the probability of
As discussed above, a key aspect of the EDF imaging
events where a defocused probe image engulfs or contacts a techniques disclosed herein involves post image acquisitionsecond probe image in the cell. With standard imaging, it is a 35 processing to enhance the image data, to achieve an EDFrarity to find imagery similar to images 55 and 247 of FIG. image. Such image processing corrects for errors introduced23C, where two probes are in close proximity and tightly
by the PSF of the imaging system, and the intentional distor-
focused. More likely than not, one of these probes will blur, tion of the optical wave front from the object. Preferably, suchengulfing the other, leading to a misclassification of a disomic
image processing is a de-convolution process based on the
event as a monosomic event. 40 PSF of the imaging system (or other corrective PSFs, gener-It is likely that future optimizations of the exemplary flow ally as discussed immediately above). FIG. 24 schematically
imaging system with extended depth of field will provide for
illustrates an exemplary computing system 250 suitable forfurther improvements in image quality and advanced capa- use in implementing the method of FIG. 4 (i.e., for executingbilities. Since the exemplary flow imaging system collects step 170 of this method). Exemplary computing system 250imagery in a flow cuvette with image collection access to all 45 includes a processing unit 254 that is functionally coupled tofour sides of the cell, unlike slide-based imaging systems, an input device 252 and to an output device 262, e.g., a displaythere exists the potential to develop a two-axis orthogonal
(which can be used to output a result to a user, although such
implementation of the architecture described herein. Cou- a result can also be stored). Processing unit 254 comprises, forpling a two-axis version of the exemplary flow imaging sys- example, a central processing unit (CPU) 258 that executestem architecture (i.e., a flow imaging system such as that 50 machine instructions for carrying out an analysis of datashown in FIG. 2) with the EDF techniques discussed above collected in connection with operation of the vehicle to deter-would provide a means to perform full 3-D cell mapping and
mine upon which one of the plurality of predefined routes the
optical sectioning similar to confocal techniques, but at two to vehicle has been operated in conjunction with acquisition ofthree orders of magnitude greater speed and without photo- the data. The machine instructions implement functions gen-bleaching. Each axis would collect an EDF projection of the 55 erally consistent with those described above with respect tocell from orthogonal perspectives, enabling a 3-D reconstruc- step 170 of FIG. 4, as well as those at other locations hereintion of the cell, as is done in optical tomographic methods. with respect to image processing to enhance the EDF image.However, unlike confocal techniques, this method wouldpro- CPUs suitable for this purpose are readily available, forvide an isometric perspective with consistent resolution in all
example, from Intel Corporation, AMD Corporation,
axes. Since the cells would be mapped in a single pass, photo- 60 Motorola Corporation, and other sources, as will be wellbleaching would be minimized and, with sufficient image
known to those of ordinary skill in this art.
processing capacity, tens of thousands of cells could be ana- Also included in processing unit 254 are a random accesslyzed in several minutes. FIG. 2 schematically illustrates such
memory (RAM) 256 and non-volatile memory 260, which
a stereoscopic imaging system. can include read only memory (ROM) and may include someThe high-resolution EDF flow imaging techniques dis- 65 form of memory storage, such as a hard drive, an optical disk
closed herein should find beneficial application in the follow- (and drive), etc. These memory devices are bi-directionallying types of image-based analytical studies: (1) FISH-IS, coupled to CPU 258. Such storage devices are well known in
US 8,009,189 B233
the art. Machine instructions and data are temporarily loadedinto RAM 256 from non-volatile memory 260. Also stored inthe memory are an operating system software and ancillarysoftware. While not separately shown, it will be understoodthat a generally conventional power supply will be included to 5
provide electrical power at a voltage and current level appro-priate to energize the components of computing system 250.
Input device 252 can be any device or mechanism thatfacilitates user input into the operating environment, includ-ing, but not limited to, one or more of a mouse or other iopointing device, a keyboard, a microphone, a modem, or otherinput device. In general, the input device will be used toinitially configure computing system 250, to achieve thedesired processing (e.g., to process image data to produceimages as discussed above). Configuration of computing sys- 15
tem 250 to achieve the desired processing includes the stepsof loading appropriate processing software into non-volatilememory 260, and launching the processing application (e.g.,loading the processing software into RAM 256 for executionby the CPU) so that the processing application is ready for 20
use. Output device 262 generally includes any device thatproduces output information, but will most typically com-prise a monitor or computer display designed for humanvisual perception of output. Use of a conventional computerkeyboard for input device 252 and a computer display for 25
output device 262 should be considered as exemplary, ratherthan as limiting on the scope of this system. Data link 264 isconfigured to enable image data collected from a flow imag-ing system to be introduced into computing system 250 forsubsequent image processing as discussed above. Those of 30
ordinary skill in the art will readily recognize that many typesof data links can be implemented, including, but not limitedto, universal serial bus (USB) ports, parallel ports, serialports, inputs configured to couple with portable memory stor-age devices, FireWire (conforming to I.E.E.E. 1394 specifi- 35
cation) ports, infrared data ports, wireless data ports such asBluetoothTM, network connections such as Ethernet ports,and Internet connections.
Although the concepts disclosed herein have beendescribed in connection with the exemplary form of practic- 40
ing them and modifications thereto, those of ordinary skill inthe art will understand that many other modifications can bemade thereto within the scope of the claims that follow.Accordingly, it is not intended that the scope of these con-cepts in any way be limited by the above description, but 45
instead be determined entirely by reference to the claims thatfollow.
The invention in which an exclusive right is claimed isdefined by the following:
1. A method for generating a three-dimensional map of an 50
object, wherein the three-dimensional map exhibits a firstextended depth of field along a first axis and a secondextended depth of field along a second axis, comprising thesteps of:
(a) collecting light from the object along both a first col- 55
lection path comprising the first axis and a second col-lection path comprising the second axis, where the firstaxis and the second axis are not parallel;
(b) deforming an optical wave front of light from the objectto produce modified light, such that light in both the first 60
collection path and the second collection path comprisesmodified light, and a point spread function (PSF) of animaging system used to collect the modified light issubstantially invariant across the first extended depth offield and the second extended depth of field; 65
(c) focusing modified light from the first collection path toproduce a first image of the object, the first image being
34formed by light simultaneously collected from a firstplurality of different focal planes along the first axis, thefirst plurality of different focal planes comprising thefirst extended depth of field;
(d) detecting the first image of the object using a firstdetector to generate first image data;
(e) focusing modified light from the second collection pathto produce a second image of the object, the secondimage being formed by light simultaneously collectedfrom a second plurality of different focal planes alongthe second axis, the second plurality of different focalplanes comprising the second extended depth of field;
(f) detecting the second image of the object using a seconddetector to generate second image data;
(g) processing the first and second image data to reduceartifacts introduced by deforming the optical wave front,to produce a first corrected extended depth of field imagecorresponding to the first collection path, and a secondcorrected extended depth of field image correspondingto the second collection path; and
(h) using the first corrected extended depth of field imageand the second corrected extended depth of field imageto produce the three-dimensional model of the object.
2. The method of claim 1, further comprising the step ofanalyzing the three-dimensional model of the object to deter-mine at least one characteristic of the object.
3. The method of claim 1, wherein there is relative motionbetween the object and the imaging system used to producethe first image of the object and the second image of theobj ect.
4. The method of claim 3, wherein the object is entrained ina flow of fluid.
5. The method of claim 1, wherein at least one of the firstextended depth of field and the second extended depth of fieldcomprises about fifteen microns.
6. The method of claim 1, wherein the step of processingthe image data comprises the steps of:
(a) determining the PSF of the imaging system configuredto deform the optical wave front for the first collectionpath and the second collection path;
(b) using the PSF function for the first collection path toproduce the first corrected extended depth of field imageof the object; and
(c) using the PSF function for the second collection path toproduce the second corrected extended depth of fieldimage of the object.
7. The method of claim 1, wherein processing the imagedata comprises the step of de-convolving the first and secondimage data.
8. The method of claim 7, wherein the step of de-convolv-ing the image data reduces spatial broadening and contrastloss induced by the step of deforming the optical wave front.
9. The method of claim 1, wherein the step of deformingthe optical wave front comprises the step of using an opticalelement to deform the optical wave front.
10. The method of claim 9, wherein the optical elementcomprises at least one element selected from the group con-sisting essentially of:
(a) a phase plate configured to induce a phase deviation inthe optical wave front;
(b) an optical element configured to induce a sphericalaberration in light received from the object; and
(c) a cuvette having different optical thicknesses at differ-ent locations, such that imaging through the differentlocations of the cuvette induces different degrees ofwave front deformation.
US 8,009,189 B235
11. The method of claim 9, wherein the step of using anoptical element to deform the optical wave front comprisesthe steps of:
(a) using a first optical element to modify light for the firstcollection path; and
(b) using a second optical element to modify light for thesecond collection path.
12. The method of claim 1, further comprising the step ofspectrally dispersing the light in the first collection pathbefore focusing the modified light to produce the first image,such that the first image comprises a spectrally dispersedimage.
13. The method of claim 12, further comprising the step ofspectrally dispersing the light in the second collection pathbefore focusing the modified light to produce the secondimage, such that the second image comprises a spectrallydispersed image.
14. The method of claim 1, wherein the step of deformingthe optical wave front comprises the step of modifying theaberration correction of an objective lens.
15. A method for generating a stereoscopic view of anobject, while there is relative motion between the object andan imaging system used to produce the stereoscopic view,wherein the stereoscopic view exhibits a first extended depthof field along a first axis and a second extended depth of fieldalong a second axis, where the first axis and the second axisare not parallel, comprising the steps of:
(a)using a first optical element to induce an aberration in anoptical wave front of light from the object to produce afirst modified light along a first collection path, such thata point spread function (PSF) of the imaging system asmodified by the first optical element is substantiallyinvariant across the first extended depth of field;
(b) using a second optical element to induce an aberrationin an optical wave front of light from the object toproduce a second modified light along a second collec-tion path, such that a PSF of the imaging system asmodified by the second optical element is substantiallyinvariant across the second extended depth of field;
(c)focusing the first modified light to produce a first imageof the object that includes light simultaneously collectedfrom a plurality of different focal planes along the firstaxis, and focusing the second modified light to producea second image of the object that includes light simulta-neously collected from a plurality of different focalplanes along the second axis;
(d) detecting the first image of the object and the secondimage of the object to generate image data;
(e)processing the image data to reduce artifacts introducedby deforming the optical wave front with the first andsecond optical elements, to produce a first correctedextended depth of field image of the object and a secondcorrected extended depth of field image of the object;and
(f)using the first corrected extended depth of field image ofthe object and the second corrected extended depth offield image of the object to generate the stereoscopicview of the object.
16. The method of claim 15, wherein the step of detectingthe first image of the object and the second image of the objectcomprises the step of using a time delay integration detectorto collect each image over a period of time, while the objectmoves relative to the imaging system.
17. The method of claim 15, further comprising the step ofdispersing the first modified light into a plurality of lightbeams, such that:
36(a) the step of focusing the first modified light comprises
the step of focusing each of the light beams to produce arespective first image corresponding to that light beam,each respective first image being formed from the first
5 modified light simultaneously collected from the plural-ity of different focal planes along the first axis;
(b) the step of detecting the first image comprises the stepof detecting each respective first image of the object togenerate image data; and
10 (c) the step of processing the image data comprises the stepof processing the image data for each respective firstimage to reduce artifacts introduced by deforming theoptical wave front, to produce the first correctedextended depth of field image of the object for each
15 respective first image.18. The method of claim 17, further comprising the step of
analyzing each respective first image to determine at least onecharacteristic of the object.
19. The method of claim 17, wherein the step of processing20 the image data comprises the steps of:
(a) determining the PSF of the imaging system as modifiedby the first optical element configured to deform theoptical wave fronts along the first collection path; and
(b) using the PSF function to de-convolve each respective25 first image, thereby reducing spatial broadening and
contrast loss induced by the PSF of the imaging systemas modified by the first optical element.
20. The method of claim 15, wherein at least one of the firstoptical element and the second optical element comprises at
30 least one element selected from the group consisting essen-tially of:
(a) a phase plate configured to induce a phase deviation inan optical wave front;
(b) an optical element configured to induce a spherical35 aberration in light from the object; and
(c) a cuvette having different optical thicknesses at differ-ent locations, such that imaging through the differentlocations of the cuvette induces different degrees ofwave front deformation.
40 21. The method of claim 15, wherein the step of deformingthe optical wave front comprises the step of modifying theaberration correction of an objective lens.
22. An imaging system adapted to perform extended depthof field imaging of an object, to acquire a first extended depth
45 of field image of the object using light moving away from theobject in a first direction, and a second extended depth of fieldimage of the object using light moving away from the objectin a second direction, where the first and second directions aredifferent, such that a three-dimensional model of the object
50 can be generated using the first and second extended depth offield images, the system comprising:
(a) a first optical element configured to deform an opticalwave front of light moving away from the object in thefirst direction, and a second optical element configured
55 to deform an optical wave front of light moving awayfrom the object in the second direction, such that a pointspread function (PSF) of the imaging system as modifiedby the first and second optical elements is substantiallyinvariant across a first extended depth of field associated
60 with light moving away from the object in the first direc-tion and a second extended depth of field associated withlight moving away from the object in the second direc-tion;
(b) a first collection lens disposed so that light moving65 away from the object in the first direction passes through
the first collection lens andtravels along a first collectionpath, and a second collection lens disposed so that light
US 8,009,189 B237
moving away from the object in the second directionpasses through the second collection lens and travelsalong a second collection path;
(c) a first imaging lens disposed to receive light travellingalong the first collection path that has been deformed bythe first optical element, thus producing a first deformedextended depth of field image;
(d) a second imaging lens disposed to receive light travel-ling along the second collection path that has beendeformed by the second optical element, thus producinga second deformed extended depth of field image;
(e) a first detector disposed to receive the first deformedextended depth of field image produced by the firstimaging lens, producing an output signal that is indica-tive of the first deformed extended depth of field image,and a second detector disposed to receive the seconddeformed extended depth of field image produced by thesecond imaging lens, producing an output signal that isindicative of the second deformed extended depth offield image; and
(f) a processor configured to:(i)manipulate the output signal from the first detector to
reduce artifacts introduced by the first optical elementto deform the optical wave front of light from theobject in the first collection path, to produce the firstextended depth of field image of the object; and
(ii) manipulate the output signal from the second detec-tor to reduce artifacts introduced by the second opticalelement to deform the optical wave front of light fromthe object in the second collection path, to produce thesecond extended depth of field image of the object.
23. The system of claim 22, wherein at least one of the firstoptical element and the second optical element comprises oneelement selected from the group consisting essentially of:
(a) a phase plate configured to induce a phase deviation inthe optical wave front;
(b) an optical element configured to induce a sphericalaberration in light from the object; and
(c) a cuvette having different optical thicknesses at differ-ent locations, such that imaging through the differentlocations of the cuvette induces different degrees ofwave front deformation.
24. The system of claim 22, wherein at least one of the firstoptical element and the second optical element configured todeform the optical wave front of light moving away from theobject comprises an adjustable objective lens, such that theaberration of the objective lens can be modified to deform theoptical wave front of light from the object.
25. The system of claim 22, wherein at least one of the firstoptical element and the second optical element is selectivelypositionable, such that in a first position, that optical elementdeforms the optical wave front, thereby enabling extendeddepth of field imaging, while in a second position, that opticalelement does not deform the optical wave front, therebyenabling non-extended depth of field imaging.
26. The system of claim 22, wherein the processor is con-figured to use the PSF as modified by the first optical elementand the second optical element to de-convolve the first andsecond output signals, thereby reducing spatial broadeningand contrast loss induced by the PSF as modified by eachoptical element.
27. The system of claim 22, wherein the processor is con-figured to use the first extended depth of field image and thesecond extended depth of field image to generate the three-dimensional map of the object.
3828. The system of claim 22, further comprising a first
dispersion element configured to disperse light travelingalong the first collection path before the first imaging lensproduces the first deformed extended depth of field image,
5 such that the first deformed extended depth of field imagecomprises one of:
(a) a single dispersed image; and(b) a plurality of individual dispersed images.29. The system of claim 28, further comprising a second
10 dispersion element configured to disperse light travelingalong the second collection path before the second imaginglens produces the second deformed extended depth of fieldimage, such that the second deformed extended depth of field
15 image comprises one of:(a) a single dispersed image; and(b) a plurality of individual dispersed images.30. An imaging system adapted to perform extended depth
of field imaging of an object in order to produce a stereo-20 scopic image of the object, while there is relative movement
between the object and the imaging system, comprising:(a) a first optical element configured to deform an optical
wave front of light moving away from the object in a firstdirection, thereby producing first modified light, and a
25 second optical element configured to deform an opticalwave front of light moving away from the object in asecond direction, such that a point spread function (PSF)of the imaging system as modified by each optical ele-ment is substantially invariant across a first extended
30 depth of field associated with light moving away fromthe object in the first direction and a second extendeddepth of field associated with light moving away fromthe object in the second direction;
35 (b) a first collection lens disposed so that light movingaway from the object in the first direction passes throughthe first collection lens and travels along a first collectionpath, and a second collection lens disposed so that lightmoving away from the object in the second direction
40 passes through the second collection lens and travelsalong a second collection path;
(c) a first dispersing component disposed in the first col-lection path so as to receive the light that has passedthrough the first collection lens, dispersing the light into
45 a plurality of separate light beams, each light beam beingdirected away from the first dispersing component in adifferent predetermined direction, and a second dispers-ing component disposed in the second collection path soas to receive the light that has passed through the second
50 collection lens, dispersing the light into a plurality ofseparate light beams, each light beam being directedaway from the second dispersing component in a differ-ent predetermined direction;
(d) a first imaging lens disposed to receive the light beams55 from the first dispersing component, producing a plural-
ity of images, each image corresponding to one of thelight beams and being projected by the first imaging lenstoward a different predetermined location, and a secondimaging lens disposed to receive the light beams from
60 the second dispersing component, producing a pluralityof images, each image corresponding to one of the lightbeams and being projected by the second imaging lenstoward a different predetermined location;
(e) a first detector disposed to receive the plurality of65 images produced by the first imaging lens, producing a
first output signal that is indicative of imaging lightmoving away from the object in the first direction at a
US 8,009,189 B239
40plurality of different focal planes, and a second detectordisposed to receive the plurality of images produced bythe second imaging lens, producing a second outputsignal that is indicative of imaging light moving awayfrom the object in the second direction at a plurality ofdifferent focal planes; and
(f) a processor configured to manipulate the first outputsignal and the second output signal to reduce artifactsintroduced by the first optical element and the secondoptical element configured to deform the optical wavefronts of light from the object, to produce a plurality offirst corrected extended depth of field images of theobject for light moving away from the object in the firstdirection, and a plurality of second corrected extendeddepth of field images of the object for light moving awayfrom the object in the second direction, and to use theplurality of first corrected extended depth of field imagesand the plurality of second corrected extended depth offield images to produce the stereoscopic image of theobj ect.
31. The system of claim 30, wherein at least one of the firstoptical element and the second optical element is a phase
plate configured to induce a phase deviation in the opticalwave front.
32. The system of claim 31, wherein the phase plate isdisposed proximate a numerical objective of the imaging
5 system.33. The system of claim 30, wherein at least one of the first
optical element and the second optical element is configuredto induce a spherical aberration in light from the object.
34. The system of claim 30, wherein at least one of the firstio optical element and the second optical element is a cuvette
having different optical thicknesses at different locations,such that imaging through the different locations of thecuvette induces different degrees of wave front deformation.
35. The system of claim 30, wherein at least one of the first15 optical element and the second optical element is selectively
positionable, such that in a first position, that optical elementdeforms the optical wave front, thereby enabling extendeddepth of field imaging, while in a second position, that opticalelement does not deform the optical wave front, thereby
20 enabling non-extended depth of field imaging.

![United States Patent - OSS.Net · United States Patent [19] Farwell 11111 111111111111 111111lllillllllll11 111111111111111 11111111111iI11111iii US005363858A [11] Patent Number:](https://img.pdfslide.us/doc/110x75/603905c969795821012ab708/united-states-patent-oss-united-states-patent-19-farwell-11111-111111111111.jpg)


![United States Patent [19] [11] Patent Number: 6,157,815](https://img.pdfslide.us/doc/110x75/62416bdfa2fd610df03a51a4/united-states-patent-19-11-patent-number-6157815.jpg)