Embed Size (px)
Citation preview

POSITIVE TRENDS | PROFITS | HISTORY | STRENGTH | NETWORKS | STABILITY | FIFTH CONSECUTIVE RECORD REVENUE YEAR | LEADERSHIP | HISTORY | NETWORKS | STABILITY | FIFTH CONSECUTIVE RECORD REVENUE YEAR | POSITIVE TRENDS | LEADERSHIP | STRENGTH | $2.17 BILLION | INNOVATION | 53 MARKETS | SOLUTIONS | BUSINESS | RECORDS | INCREASES | CONFIDENCE | CREDIBILITY | INNOVATION | $2.17 BILLION | 53 MARKETS | REVENUE | SOLUTIONS | | RECORDS | INCREASES | CONFIDENCE | CREDIBILITY | EXPECTATIONS
TATIONS | BELIEF | PERCENTAGES | 28 YEARS | LEADERS | INVESTMENTS | VALUE | SALES | NETWORKS | EXPECTATIONS | LAUNCHES | TARGETS | BELIEF | PERCENTAGES | LEADERS | INVESTMENTS | ES | NETWORKS | LAUNCHES | TARGETS | NETWORKS | SUCC
| SUCCESS | CHANNELS | DIVIDEND PAYOUT INCREASE | BALANCE | PAYOUTS | INTEGRITY | DYNAMICS | ACHIEVEMENTS | PARTNERSHIPS | SUCCESS | CHANNELS | DIVIDEND PAYOUT INCREASE | INTEGRITY | DYNAMICS | ACHIEVEMENTS | PARTNERSHIPS | EXPANSION
PANSION | MILESTONES | GROWTH | COMMITMENT | RESOURCES | POTENTIAL | 24% REVENUE INCREASE | CAPITAL | DEVELOPMENTS | ALIGNMENT | RESULTS | AWARENESS | OPPORTUNITY | BREAKTHROUGHS | PASSION | STRENGTH | TRUST | PROGRESS | ADVA
ADVANCEMENT | EXPANSION | LEADERSHIP | EXPECTATIONS | SUCCCESS | EXPANSION | INNOVATION | STRENGTH | ADVANCEMENT | RECORDS | INCREASE | FIFTH CONSECUTIVE REVENUE YEAR | SALES | STRENGTH | STRENGTH | BREAKTHROUGHS | STRENGTH |
NU
SK
IN A
NN
UA
L R
EP
OR
T 2
012
CR
EATE
HIS
TOR
Y
12

WE CREATE


2NU SKIN ANNUAL REPORT 2012
DEAR SHAREHOLDER,
THE GLOBAL NU SKIN FAMILY, REPRESENTING NEARLY ONE MILLION people in 53 markets, continues to create history with record growth, a pipeline of innovative anti-aging solutions, and a dynamic business model proven by the test of time.
In 2012, we reached historic milestones in our business, including:
• Record annual revenue of $2.17 billion—a 24 percent increase over the prior year and our fifth consecutive record revenue year.
• Record earnings per share of $3.52, a 48 percent increase over 2011, or 31 percent when excluding charges of $32.8 million related to a 2011 Japan customs ruling.
• Record profitability, posting a 15.7 percent operating margin and generating $311 million in cash from operations, a 39 percent increase.
• A 24 percent increase in sales leaders, and 11 percent growth in actives.
• A 50 percent increase in our dividend payout, with a record $48 million in dividends paid during 2012.
This year, we are joining hands to create history again, helping propel Nu Skin to a new level of success as we work towards our vision of becoming the world’s leading direct selling company. To that end, our 2013 targets are focused on our global business strategies that include:
• Capitalizing on the strength of our ageLOC® anti-aging brand with the launch of a new and innovative weight management system;
• Expanding our sales network and consumer group through our global product launch process;
• Investing in channel innovation;
• Leveraging our experienced management and sales leaders to help drive growth in every geographic region;
• Increasing shareholder value by maintaining and utilizing our strong balance sheet and cash flow.
EARNINGS PER SHARE
$3.52
EARNINGS PER SHARE
+48%
OPERATING MARGIN
15.7%
CASH FROM OPERATIONS
$311MCASH FROM OPERATIONS
+39%
DIVIDEND PAYOUT
+50%

3CREATE HISTORY
ANNUAL REVENUE REPORTS
2008
2009
2010
2011
$1.25 B
$1.33 B
$1.54 B
$1.74 B
THIS YEAR, WE ARE
JOINING HANDS
TO CREATE HISTORY
AGAIN, HELPING
PROPEL NU SKIN
TO A NEW LEVEL
OF SUCCESS...
$2.17 B2012

4NU SKIN ANNUAL REPORT 2012
THE AGELOC BRAND CONTINUES TO BE A KEY GROWTH DRIVER for Nu Skin. We introduced this super-class of anti-aging products in 2008, and in 2012 generated more than $840 million in ageLOC® product sales. Our scientifi c research is focused on advancing our understanding of the sources that infl uence the aging process, including the science of gene expression. Our product development team then uses these scientifi c insights in the formulation process and in their eff orts to continually produce a compelling pipeline of anti-aging solutions.
In 2012, we focused on the international roll-out of our latest anti-aging products, the ageLOC® Body Spa and our fi rst global ageLOC nutrition product, ageLOC R2. These products were very well-received, generating more than $255 million in sales and helping expand both our consumer group and sales leadership.
CAPITALIZING ON THE STRENGTH OF THE AGELOC BRAND
®
This year, we plan to introduce our fi rst ageLOC weight management system under the trademark TR90.™ Formulated with our exclusive anti-aging science, TR90 is a proprietary system that includes four products and a comprehensive diet and lifestyle plan. Unlike rapid weight loss regimens, the objective of TR90 is to promote healthy weight loss. We have high hopes for TR90.
We also continue to invest in our product pipeline beyond 2013. In fact, we have made steady progress on two new anti-aging products scheduled for launch in 2015, following the regional and local launches of TR90 in 2014. As we consistently extend our product development cycle, we are able to stay in front of our goal to continually refresh the vibrancy of the opportunity and products we off er.
AGELOC TR90 INCLUDES FOUR PRODUCTS FORMULATED WITH OUR EXCLUSIVE ANTI-AGING SCIENCE

5CREATE HISTORY
WE’VE NOT ONLY TAKEN AN INNOVATIVE APPROACH TO developing our products, but we have also developed a systematic process of introducing new products to our sales leaders, distributors, and consumers. In 2012, our product launch process generated growth in each of our regions and helped drive growth in our sales network and consumer group.
Our launch process consists of a two-year marketing cycle where we off er purchase windows, or limited-time off ers (LTOs) before making products available on a full-time basis. In the early stages of the launch process, we provide our sales leaders with the training and communications messaging they can use to create product awareness and demand. Then, we execute a one-to-two week LTO focused around a key event (typically a global or regional convention). This phase of the launch process allows us to build even greater excitement within the sales network and generate signifi cant levels of awareness and product trial among our consumer group. In 2012, the combined regional LTOs for ageLOC® Body Spa and R2 generated more than $280 million of revenue. Following the global and regional LTOs, we typically make new products available on a full-time basis within three to six months.
EXPANDING OUR CONSUMER GROUP AND SALES NETWORK THROUGH OUR GLOBAL PRODUCT LAUNCH PROCESS
THIS PRODUCT LAUNCH PROCESS
HAS ADDED AN IMPRESSIVE
DYNAMIC TO OUR BUSINESS. OUR
SALES LEADERS HAVE ALIGNED
AROUND THIS PROCESS TO
MAXIMIZE THEIR EFFECTIVENESS
AND PRODUCTIVITY.
AGELOC® PRODUCT SALES
$840M
AGELOC® BODY SPA & AGELOC R2 SALES
$255M
This product launch process has added an impressive dynamic to our business. Our sales leaders have aligned around this process to maximize their eff ectiveness and productivity. For example, the successful limited-time off er of Galvanic Body Spa™ in Japan helped generate 26 percent local-currency revenue growth in the fourth quarter of 2012, resulting in 6 percent growth for the year. Country by country, as our sales leaders continue to better align behind this LTO launch process, we continue to drive improving results.
We anticipate the magnitude of the 2013 global LTO of TR90™ will surpass the $100 million global LTO launch of our ageLOC R2 and Body Galvanic system in 2011.

6NU SKIN ANNUAL REPORT 2012
FOR MORE THAN 28 YEARS,
NU SKIN HAS SUCCESSFULLY
SOLD ITS PRODUCTS THROUGH
THE DIRECT SELLING CHANNEL.
92 PERCENT OF WORLDWIDE
CONSUMERS CITE THAT THEY
TRUST RECOMMENDATIONS FROM
FRIENDS AND FAMILY MORE
THAN ANY OTHER FORM OF
ADVERTISING.
FUTURE

7CREATE HISTORY
FOR MORE THAN 28 YEARS, NU SKIN HAS SUCCESSFULLY sold its products through the direct selling channel, a channel that utilizes person-to-person marketing to promote and sell products to consumers. Direct selling continues to be a vibrant and growing channel. From 2010 to 2011 the global direct selling industry grew 8 percent, consistent with its historical growth rate.
The direct selling channel fosters a ‘high-touch’ purchasing experience that leverages the power of word-of-mouth advertising, one of the most eff ective methods of marketing products. In fact, 92 percent of worldwide consumers cite that they trust recommendations from friends and family more than any other form of advertising. In addition, our person-to-person marketing eff orts are supported by various mediums, including catalogs, the Internet, and walk-in centers.
While direct selling is fl ourishing globally, growth rates are particularly robust in emerging markets. In some of these markets, to compete eff ectively we must adapt our product off ering and business model to fi t the local economic, regulatory, and social dynamics of the market. For example, we continue to see tremendous potential in mainland China. As China’s regulatory framework is unique, our business model in China is diff erent than our global business model.
Our business, along with other multinational direct selling companies, is fl ourishing in China. Since the direct selling regulations were put in place in 2006, China has already become the third largest direct selling market in the world. We believe there is an enormous appetite for opportunity in mainland China and we intend to compete in this large and rapidly growing market by off ering a compelling business opportunity that aligns with China’s unique socioeconomic and regulatory environment.
•Source: World Federation of Direct Selling Associations (WFDSA)
INVESTING IN CHANNEL INNOVATION
We have been developing our business in China for 15 years and operating there for nearly 10 years—as a result, we have developed a deep understanding of the local culture and business environment. As we have outlined, our fi ve-year business development plan for the market includes tripling the number of stores and sales support centers by 2017 and expanding our direct selling coverage and distribution model to generate higher levels of market penetration. We are also making signifi cant local investments that include a new $55 million Innovation Park and regional headquarters in Shanghai, as well as manufacturing facilities, and other initiatives unique to China.
Additionally, we are in the early phases of investing in Latin America, where we are pursuing a business model that we believe will allow us to become a more signifi cant player in what is a very large and growing direct selling area. We currently plan to introduce this model in Brazil in 2014, including region-specifi c products, along with a business opportunity tailored specifi cally for Brazil and other Latin American countries. We believe Latin America presents a large and mostly untapped opportunity for us. We look forward to creating a greater foothold in this region.
8NU SKIN ANNUAL REPORT 2012
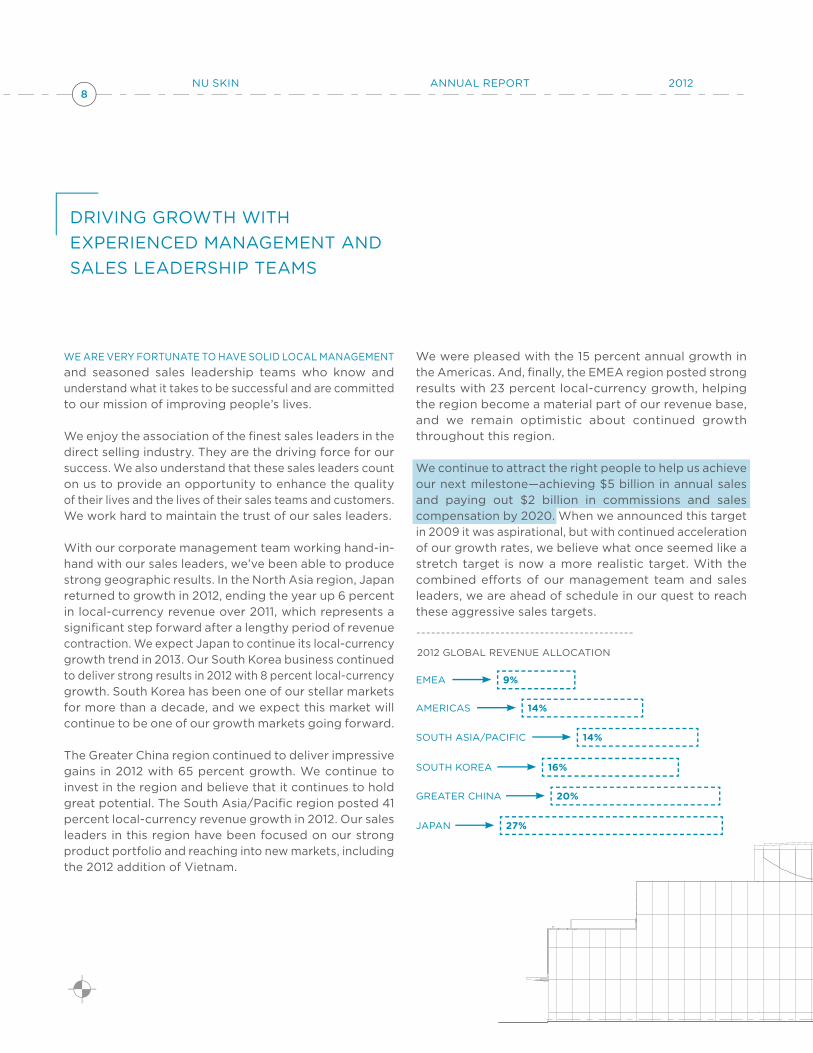
WE ARE VERY FORTUNATE TO HAVE SOLID LOCAL MANAGEMENT and seasoned sales leadership teams who know and understand what it takes to be successful and are committed to our mission of improving people’s lives.
We enjoy the association of the fi nest sales leaders in the direct selling industry. They are the driving force for our success. We also understand that these sales leaders count on us to provide an opportunity to enhance the quality of their lives and the lives of their sales teams and customers. We work hard to maintain the trust of our sales leaders.
With our corporate management team working hand-in-hand with our sales leaders, we’ve been able to produce strong geographic results. In the North Asia region, Japan returned to growth in 2012, ending the year up 6 percent in local-currency revenue over 2011, which represents a signifi cant step forward after a lengthy period of revenue contraction. We expect Japan to continue its local-currency growth trend in 2013. Our South Korea business continued to deliver strong results in 2012 with 8 percent local-currency growth. South Korea has been one of our stellar markets for more than a decade, and we expect this market will continue to be one of our growth markets going forward.
The Greater China region continued to deliver impressive gains in 2012 with 65 percent growth. We continue to invest in the region and believe that it continues to hold great potential. The South Asia/Pacifi c region posted 41 percent local-currency revenue growth in 2012. Our sales leaders in this region have been focused on our strong product portfolio and reaching into new markets, including the 2012 addition of Vietnam.
We were pleased with the 15 percent annual growth in the Americas. And, fi nally, the EMEA region posted strong results with 23 percent local-currency growth, helping the region become a material part of our revenue base, and we remain optimistic about continued growth throughout this region.
We continue to attract the right people to help us achieve our next milestone—achieving $5 billion in annual sales and paying out $2 billion in commissions and sales compensation by 2020. When we announced this target in 2009 it was aspirational, but with continued acceleration of our growth rates, we believe what once seemed like a stretch target is now a more realistic target. With the combined eff orts of our management team and sales leaders, we are ahead of schedule in our quest to reach these aggressive sales targets.
DRIVING GROWTH WITH EXPERIENCED MANAGEMENT AND SALES LEADERSHIP TEAMS
2012 GLOBAL REVENUE ALLOCATION
JAPAN 27%
SOUTH KOREA 16%
GREATER CHINA 20%
SOUTH ASIA/PACIFIC 14%
AMERICAS 14%
EMEA 9%

9CREATE HISTORY
OUR BALANCE SHEET REMAINS STRONG—WE GENERATED a record level of free cash fl ow in 2012. We are net cash positive and have continued to reward shareholders by increasing our dividend for the 12th straight year and by purchasing more than $200 million of our stock during the year.
We plan to continue to invest in the future. We enjoy cash fl ow dynamics that enable us to continue to repurchase shares, pay a healthy dividend, and still invest in growth initiatives. In 2013, we plan to complete the construction of our Innovation Center in Provo and our Greater China regional headquarters in Shanghai. Both facilities refl ect our confi dence in our future and our commitment to investing our resources to support our long-term growth potential.
INCREASING SHAREHOLDER VALUE BY MAINTAINING AND UTILIZING OUR STRONG BALANCE SHEET AND CASH FLOW
STOCK REPURCHASED
+$200M
BEGAN OPERATING IN VIETNAM
IN 2013, WE PLAN TO CONTINUE
TO INVEST IN THE FUTURE...
WE PLAN TO COMPLETE THE
CONSTRUCTION OF OUR
INNOVATION CENTER IN PROVO
AND OUR GREATER CHINA
REGIONAL HEADQUARTERS IN
SHANGHAI. BOTH FACILITIES
REFLECT OUR INVESTMENT IN
OUR FUTURE AND OUR
COMMITMENT TO INVESTING OUR
RESOURCES TO SUPPORT OUR
LONG-TERM GROWTH POTENTIAL.
WEST VIEW OF THE 164,000 SQUARE-FOOT INNOVATION CENTER IN PROVO

10NU SKIN ANNUAL REPORT 2012
STEVEN J. LUND TRUMAN HUNTCHAIRMANNU SKIN ENTERPRISES
PRESIDENT, CEONU SKIN ENTERPRISES
OVERALL, WE ARE EXTREMELY PLEASED WITH THE DIRECTION OF THE BUSINESS AND WE EXPECT 2013 TO BE YET ANOTHER RECORD YEAR.
We are focused on reaching our aggressive business targets by capitalizing on our compelling product pipeline and launch process, vibrant business model, and financial strength and discipline.
For all those associated with Nu Skin, we are creating history with a new era of success that is drawing us closer to our vision of becoming the world’s leading direct selling company.
Sincerely,

ANNUAL REPORT ON FORM 10-K


UNITED STATESSECURITIES AND EXCHANGE COMMISSION
Washington, D.C. 20549
FORM 10-K(Mark One)þ ANNUAL REPORT PURSUANT TO SECTION 13 OR 15(D) OF THE SECURITIES EXCHANGE
ACT OF 1934
For the fi scal year ended December 31, 2012
OR
¨ TRANSITION REPORT PURSUANT TO SECTION 13 OR 15(D) OF THE SECURITIES EX-CHANGE ACT OF 1934.
For the transition period from ________ to ________
Commission fi le number: 001-12421
NU SKIN ENTERPRISES, INC.(Exact name of registrant as specifi ed in its charter)
Delaware(State or other jurisdiction
of incorporation or organization)
75 WEST CENTER STREETPROVO UT 84601
(Address of principal executive offi ces, including zip code)
87-0565309(IRS Employer
Identifi cation No.)
Registrant’s telephone number, including area code: (801) 345-1000
Securities registered pursuant to Section 12(b) of the Act:
Title of each classClass A common stock, $.001 par value
Name of exchange on which registered New York Stock Exchange
Securities registered pursuant to Section 12(g) of the Act: None
Indicate by check mark if the registrant is a well-known seasoned issuer, as defi ned in Rule 405 of the Securities Act. Yes þ No ¨
Indicate by check mark if the registrant is not required to fi le reports pursuant to Section 13 or Section 15(d) of the Act. Yes ¨ No þ
Indicate by check mark whether the Registrant: (1) has fi led all reports required to be fi led by Section 13 or 15(d) of the Securities Exchange Act of 1934 during the preceding 12 months (or for such shorter period that the Registrant was required to fi le such reports), and (2) has been subject to such fi ling requirements for the past 90 days. Yes þ No ¨

Indicate by check mark whether the Registrant has submitted electronically and posted on its corporate Website, if any, every Interactive Data File required to be submitted and posted pursuant to Rule 405 of Regulation S-T (§232.405 of this chapter) during the preceding 12 months (or for such shorter period that the Registrant was required to submit and post such fi les). Yes þ No ¨
Indicate by check mark if disclosure of delinquent fi lers pursuant to Item 405 of Regulation S-K(§229.405 of this chapter) is not contained herein, and will not be contained, to the best of the Registrant’s knowledge, in defi nitive proxy or information statements incorporated by reference in Part III of this Form 10-K or any amendment to this Form 10-K. ¨
Indicate by check mark whether the Registrant is a large accelerated fi ler, an accelerated fi ler, a non-accel-erated fi ler, or a smaller reporting company. See the defi nitions of “large accelerated fi ler,” “accelerated fi ler,” and “smaller reporting company” in Rule 12b-2 of the Exchange Act.
Large accelerated fi ler þ Accelerated fi ler ¨
Non-accelerated fi ler ¨ (Do not check if a smaller reporting company) Smaller Reporting Company ¨
Indicate by check mark whether the Registrant is a shell company (as defined in Rule 12b-2 of the Act). Yes ¨ No þ
Based on the closing sales price of the Class A common stock on the New York Stock Exchange on June 29, 2012, the last business day of the Registrant’s second fi scal quarter, the aggregate market value of the voting stock held by non-affi liates of the Registrant was approximately $2.7 billion. All executive offi cers and directors of the Registrant, and all stockholders holding more than 10% of the Registrant’s outstanding voting stock, other than institutional investors, such as registered investment companies, eligible to fi le benefi cial ownership reports on Schedule 13G, have been deemed, solely for the purpose of the foregoing calculation, to be “affi liates” of the Registrant.
As of January 31, 2013, 58,315,710 shares of the Registrant’s Class A common stock, $.001 par value per share, and no shares of the Registrant’s Class B common stock, $.001 par value per share, were outstanding.
Documents incorporated by reference. Portions of the Registrant’s Defi nitive Proxy Statement for the Registrant’s 2013 Annual Meeting of Stockholders to be fi led with the Securities and Exchange Commission within 120 days after the Registrant’s fi scal year end are incorporated by reference in Part III of this report.
PART I
1 ITEM 1 BUSINESS Overview Our Di� erence Demonstrated Our Product Categories Sourcing and Production Research and Development Intellectual Property Geographic Sales Regions Channel Distribution Our Culture Competition Government Regulation Employees Available Information Executive O� cers
13 ITEM 1A RISK FACTORS
26 ITEM 1B UNRESOLVED STAFF COMMENTSITEM 2 PROPERTIES
26 ITEM 3 LEGAL PROCEEDINGS
27 ITEM 4 MINE SAFETY DISCLOSURES
PART II
28 ITEM 5 MARKET FOR REGISTRANT’S COMMON EQUITY, RELATED STOCKHOLDER MATTERS AND ISSUER PURCHASES OF EQUITY SECURITIES
31 ITEM 6 SELECTED FINANCIAL DATA
32 ITEM 7 MANAGEMENT’S DISCUSSION AND ANALYSIS OF FINANCIAL CONDITION AND RESULTS OF OPERATIONS
48 ITEM 7A QUANTITATIVE AND QUALITATIVE DISCLOSURES ABOUT MARKET RISK
ITEM 8 FINANCIAL STATEMENTS AND SUPPLEMENTARY DATA
80 ITEM 9 CHANGES IN AND DISAGREEMENTS WITH ACCOUNTANTS ON ACCOUNTING AND FINANCIAL DISCLOSURE
ITEM 9A CONTROLS AND PROCEDURESITEM 9B OTHER INFORMATION
PART III
81 ITEM 10 DIRECTORS, EXECUTIVE OFFICERS AND CORPORATE GOVERNANCE
ITEM 11 EXECUTIVE COMPENSATION ITEM 12 SECURITY OWNERSHIP OF
CERTAIN BENEFICIAL OWNERS AND MANAGEMENT AND RELATED STOCKHOLDER MATTERS
ITEM 13 CERTAIN RELATIONSHIPS AND RELATED TRANSACTIONS AND DIRECTOR INDEPENDENCE
ITEM 14 PRINCIPAL ACCOUNTANT FEES AND SERVICES
PART IV
81 ITEM 15 EXHIBITS AND FINANCIAL STATEMENT SCHEDULES
85 SIGNATURES
86 BOARD OF DIRECTORS
TABLE OF CONTENTS

FORWARD-LOOKING STATEMENTS
THIS ANNUAL REPORT ON FORM 10-K, IN PARTICULAR “ITEM 7. MANAGEMENT’S DISCUSSION AND ANALYSIS OF FINANCIAL CONDITION AND RESULTS OF OPERATION,” AND “ITEM 1. BUSINESS,” CONTAINS FORWARD-LOOKING STATEMENTS WITHIN THE MEANING OF SECTION 27A OF THE SECURITIES ACT OF 1933, AS AMENDED, AND SECTION 21E OF THE SECURITIES EXCHANGE ACT OF 1934, AS AMENDED THAT REPRESENT THE COMPANY’S CURRENT EXPEC-TATIONS AND BELIEFS. ALL STATEMENTS OTHER THAN STATEMENTS OF HISTORICAL FACT ARE “FORWARD-LOOKING STATEMENTS” FOR PURPOSES OF FEDERAL AND STATE SECURITIES LAWS AND INCLUDE, BUT ARE NOT LIMITED TO, STATEMENTS OF MANAGEMENT’S EXPECTATIONS REGARDING THE COMPANY’S PERFORMANCE, INITIATIVES, STRATEGIES, NEW PRODUCTS, OPPORTUNITIES AND RISKS; STATEMENTS OF PROJECTIONS REGARDING FUTURE OPERATING RESULTS AND OTHER FINANCIAL ITEMS; STATEMENTS OF BELIEF; AND STATEMENTS OF ASSUMPTIONS UNDERLYING ANY OF THE FOREGOING. IN SOME CASES, YOU CAN IDENTIFY THESE STATEMENTS BY FORWARD-LOOKING WORDS SUCH AS “BELIEVE,” “EXPECT,” “PROJECT,” “ANTICIPATE,” “ESTIMATE,” “INTEND,” “PLAN,” “TARGETS,” “LIKELY,” “WILL,” “WOULD,” “COULD,” “MAY,” “MIGHT,” THE NEGATIVE OF THESE WORDS AND OTHER SIMILAR WORDS. WE UNDERTAKE NO OBLIGATION TO PUBLICLY UPDATE OR REVISE ANY FORWARD-LOOKING STATEMENT, WHETHER AS A RESULT OF NEW INFORMATION, FUTURE EVENTS OR OTHERWISE, EXCEPT AS REQUIRED BY LAW. WE CAUTION AND ADVISE READERS THAT THESE STATEMENTS ARE BASED ON CERTAIN ASSUMPTIONS THAT MAY NOT BE REALIZED AND INVOLVE RISKS AND UNCERTAINTIES THAT COULD CAUSE ACTUAL RESULTS TO DIFFER MATERIALLY FROM THE EXPECTATIONS AND BELIEFS CONTAINED HEREIN. FOR A SUMMARY OF CERTAIN RISKS RELATED TO OUR BUSINESS, SEE “ITEM 1A—RISK FACTORS.”
In this Annual Report on Form 10-K, references to “dollars” and “$” are to United States dollars.
Nu Skin, Pharmanex and ageLOC are our trademarks. The italicized product names used in this Annual Report on Form 10-K are product names and also, in certain cases, our trademarks.
All references to our “distributors” in this Annual Report on Form 10-K include our independent distributors, and our sales employees, contractual sales promoters and direct sellers in China. “Actives” are persons who have purchased products directly from the company during the previous three months. “Sales Leaders” are persons who have completed and who maintain specifi ed sales requirements at the end of a period. Sales Leaders include our independent distributors who have completed and who maintain specifi ed sales requirements, and our sales employees and contractual sales promoters in China, who have completed certain qualifi cation requirements.

1
ITEM 1. BUSINESS
OVERVIEWWe are a leading, global direct selling company founded in 1984,
with operations in 53 markets worldwide. We develop and distribute innovative, premium-quality anti-aging personal care products and nutritional supplements under our Nu Skin and Pharmanex category brands, respectively. Over the last several years, we have introduced new Pharmanex nutritional supplements and Nu Skin personal care products under our ageLOC anti-aging brand. We strive to secure competitive advantages in four key areas: our people, our products, the culture we promote, and the business opportunities we o� er. In 2012, we posted record revenue of $2.2 billion, representing growth of 24% percent year-over-year.
We operate in the direct selling channel, primarily utilizing person-to-person marketing to market and sell our products. These personal marketing e� orts are supported by various mediums, including catalogs, the Internet and walk-in centers. As of December 31, 2012, we had nearly 950,000 active distributors and consumers who purchased products directly from the company during the previous three months (“Actives”). More than 51,000 of our Actives were qualifi ed sales leaders (“Sales Leaders”), who are the core of our sales network and play a key role in the growth and development of our business.
Approximately 89% of our 2012 revenue came from outside of the United States. While we have become more geographically diverse over the past decade, Japan, our largest revenue market, accounted for approximately 23% of our 2012 total revenue. Due to the size of our foreign operations, our results are often impacted by fl uctuations of foreign currencies. In addition, our results are impacted by global economic, political, demographic and business trends and conditions.
Our business is subject to various laws and regulations globally, particularly with respect to our product categories and our primary sales compensation model, which is sometimes referred to as multi-level marketing. Accordingly, we face certain risks, including risks as-sociated with potential improper activities of our distributors or any inability to obtain necessary product registrations.
OUR DIFFERENCE DEMONSTRATEDWe strive to maintain a competitive advantage in four key areas: our people, our products, our culture, and our opportunity.
Our people—A global network of nearly 950,000 Actives in 53 countries. We distribute our products primarily through direct selling,
without traditional mass media advertising or direct marketing cam-paigns. Consequently, our most signifi cant asset is our global net-work of distributors and consumers who enable us to introduce prod-ucts and penetrate new markets with modest upfront promotional expense. We believe our competitive sales compensation plan has helped us to attract and develop a strong group of Sales Leaders who play a critical role in building, motivating and training our global sales network.
Our products—Science-based, proprietary anti-aging skin care and nutritional products. We believe our innovative approach to product development provides us with a competitive advantage in the anti-aging and direct selling markets. Over the last four years, we have successfully introduced a suite of innovative anti-aging skin care and nutritional products under our ageLOC brand. We are developing additional ageLOC anti-aging products for the future, including a new ageLOC weight management system. We currently plan to introduce our new ageLOC weight management system in the second half of 2013. One of our primary research and development focuses is seeking to understand the sources of aging, including the infl uence of gene expression and utilizing that knowledge in the development of our anti-aging products. We believe that our acquired and licensed technologies, research collaborations and in-house research expertise enable us to continue to introduce innovative proprietary anti-aging products in skin care and nutrition.
Our culture—Improving lives. Our mission statement promotes an uplifting culture and encourages our people to be a “force for good” by improving lives through our products and business opportunities. We encourage our distributors, consumers and employees to become involved in humanitarian e� orts, including our Nourish the Children initiative, which provides an opportunity to donate nutritious meals to malnourished children, and the Nu Skin Force for Good Foundation, which supports charitable causes that improve children’s lives.
Our opportunity—Global business opportunity. Our business model o� ers individuals the opportunity to build a business marketing anti-aging and other products directly to consumers or through a sales network of individuals whom they train and develop. Our global sales compensation plan, which we have implemented in all our markets except China, is designed to incentivize our Sales Leaders to establish sales organizations and consumer bases in each country where we conduct business. Our global sales compensation plan allows our Sales Leaders, in each of our markets except China, to develop an international business and receive commissions on global sales
PART I

2
volume in their home market. We believe our global sales compensation plan, which has historically paid between 41% and 45% of our product sales in sales compensation and incentives, is among the most fi nan-cially rewarding sales compensation plans o� ered by leading direct selling companies. We operate under a di� erent business and sales compensation model in China.
OUR PRODUCT CATEGORIESWe have two primary product categories, each operating under its own brand. We market our premium-quality personal care products under the Nu Skin category brand and our science-based nutritional supplements under the Pharmanex category brand. Over the last
several years, we have introduced new Pharmanex nutritional supple-ments and Nu Skin personal care products under our ageLOC anti-aging brand.
Presented below are the U.S. dollar amounts and associated revenue percentages from the sale of Nu Skin and Pharmanex prod-ucts for the years ended December 31, 2010, 2011, and 2012. This ta-ble should be read in conjunction with the information presented in the section entitled “Management’s Discussion and Analysis of Fi-nancial Condition and Results of Operations,” which discusses the factors impacting revenue trends and the costs associated with gen-erating the aggregate revenue presented.
REVENUE BY PRODUCT CATEGORY(U.S. dollars in millions)(1)
Year Ended December 31,
Product Category 2010 2011 2012Nu Skin . . . . . . . . . . . . . . . . . . . . . . . . . . . . . . . . . . . . . . . . . . . . . . . . . $ 913.8 59.4% $ 964.1 55.3% $ 1,178.4 54.3%
Pharmanex . . . . . . . . . . . . . . . . . . . . . . . . . . . . . . . . . . . . . . . . . . . . . 612.2 39.8 770.2 44.2 983.8 45.3
Other(2) . . . . . . . . . . . . . . . . . . . . . . . . . . . . . . . . . . . . . . . . . . . . . . . . 11.3 0.8 9.7 0.5 7.5 0.4
$ 1,537.3 100.0% $ 1,744.0 100.0% $ 2,169.7 100.0%
(1) In 2012, 89% of our sales were transacted in foreign currencies that were then con-
verted to U.S. dollars for fi nancial reporting purposes at weighted-average
exchange rates. Foreign currency fl uctuations negatively impacted reported revenue
by approximately 1% in 2012 compared to 2011. Foreign currency fl uctuations posi-
tively impacted reported revenue by approximately 6% in 2011 compared to 2010.(2) We currently o� er a limited number of other products and services, including
household products and technology services.
Nu Skin. Nu Skin is the brand of our original product line and o� ers premium-quality anti-aging personal care products. Our strategy is to leverage our distribution channel to establish Nu Skin as an innovative leader in the anti-aging personal care market. We are committed to continuously improving and evolving our product formulations to develop and incorporate innovative and proven ingredients. Our primary categories in this product line are core skin-care systems and targeted treatment products that target specifi c skin needs. We formulate these products with ingredients that are scientifi cally proven to provide visible results. Products in this category include our ageLOC Galvanic Spa System, our ageLOC Galvanic Body Spa, ageLOC Galvanic Spa Body Shaping Gel and ageLOC Dermatic E� ects Body Contouring Lotion and our ageLOC Transformation anti-aging skin care system. Our ageLOC skin care products accounted for 23% of our total revenue and 43% of Nu Skin sales in 2012. We also o� er a number of other cosmetic, personal care and hair care products.
Pharmanex. We market a variety of products under our Pharmanex brand. Our strategy is to continue to introduce innovative, substanti-ated anti-aging products based on research and development and quality manufacturing. Direct selling has proven to be an e� ective method of marketing our high-quality supplements because our distributors can personally educate consumers on the quality and benefi ts of our products, di� erentiating them from our competitors’ o� erings. This product line includes LifePak, our line of micronutrient supplements designed to provide optimal levels of essential vitamins, minerals and anti-oxidants. LifePak is our largest nutritional line in terms of revenue, representing 13% of our total revenue and 26% of Pharmanex revenue in 2012. Other anti-aging nutritional supplements include our recently launched ageLOC R,2 which is designed to renew and recharge the body. We also o� er a number of other anti-aging nutritional solutions and weight management products.
We are developing additional ageLOC anti-aging supplements, including a new ageLOC weight management system that we currently plan to introduce in most of our markets through a global limited-time o� er in the second half of 2013.
SOURCING AND PRODUCTION Nu Skin. In order to maintain high product quality, we acquire our in-gredients and contract production of nearly all our proprietary prod-ucts from suppliers and manufacturers that we believe are reliable, reputable and deliver high quality materials and service. We also

3
manufacture a limited number of our products. We procure our ageLOC Galvanic Spa systems, including the ageLOC Edition Galvanic Spa System II and ageLOC Galvanic Body Spa, from a single vendor who owns certain patent rights that we license and use in these products. We maintain a good relationship with this supplier and do not anticipate that either party will terminate this relationship in the near term. However, to continue o� ering this product category following any termination of our relationship with this vendor, we would need to develop and manufacture new galvanic units and source them from another supplier. We also acquire ingredients and products from one other supplier that currently manufactures prod-ucts representing approximately 22% of our Nu Skin personal care purchases in 2012. We maintain a good relationship with this supplier and do not anticipate that either party will terminate this relationship in the near term. We also have ongoing relationships with secondary and tertiary suppliers. Please refer to “Risk Factors—The loss of sup-pliers or shortages in ingredients could harm our business” for a dis-cussion of risks and uncertainties associated with our supplier rela-tionships and with the sourcing of raw materials and ingredients.
Since 2001, we have operated a production facility in Shanghai, China, where we currently manufacture our personal care products sold in China, as well as a limited number of products exported to some of our other markets. We are in the process of expanding our manufacturing capacity in China to meet increasing demand in that market.
Pharmanex. Substantially all of our Pharmanex nutritional sup-plements and ingredients, including LifePak, are produced or pro-vided by third-party suppliers and manufacturers. The majority of our Pharmanex products are supplied by three vendors, representing approximately 36%, 10% and 9% of our 2012 nutritional supplement purchases, respectively. In the event we become unable to source any products or ingredients from these suppliers or from our other cur-rent vendors, we believe that we would be able to produce or replace those products or substitute ingredients without great di� culty or signifi cant increases to our cost of goods sold. Please refer to “Risk Factors—The loss of suppliers or shortages in ingredients could harm our business” for a discussion of certain risks and uncertainties associ-ated with our supplier relationships, as well as with the sourcing of raw materials and ingredients.
Since 2004, we have operated a facility in Zhejiang Province, China, where we produce some of our Pharmanex nutritional supplements for sale in China and herbal extracts used to produce Tēgreen 97, ReishiMax GLp and other products sold globally. We are in the process of expanding our manufacturing capacity in China to meet increasing demand in that market.
RESEARCH AND DEVELOPMENT We are committed to developing and marketing innovative and technologically-advanced products. Our research and product development activities include:
• Internal research and development activities;• Joint research projects and collaborations;• Identifi cation and assessment of technologies for potential
licensing arrangements; and• Acquisition of technologies
We maintain research and development facilities at our headquarters in Provo, Utah as well as in Mainland China where we conduct various research and development activities. We also contract with third parties for clinical studies and collaborate on basic research projects with researchers from prominent universities and other research institutions in the United States and Asia, whose sta� s include scientists with basic research expertise in natural product chemistry, biochemistry, derma-tology, pharmacology and clinical studies. Our expenditures for internal research and development activities and joint research projects and collaborations were $12.4 million, $13.6 million and $14.9 million in 2010, 2011 and 2012, respectively.
We also work to identify and assess innovative technologies developed by third parties for potential licensing or supply arrange-ments. Because of the nature of our distribution channel, which allows us to provide a high level of product information on a person-to-person basis, we often have third parties who are interested in licensing inno-vative technologies for us to incorporate into our products and com-mercialize through our distribution channel. Licensing arrangements allow us to leverage the research activities of third parties that have resulted in demonstrated technologies, without the upfront costs and uncertainty associated with internal development, in exchange for the payment of a royalty on product sales. We have also invested in acqui-sitions to supplement our research capabilities and to acquire cutting edge technologies, including our acquisition of Pharmanex and the technology underlying our BioPhotonic Scanner. In the last two years, we acquired substantially all of the assets of LifeGen Technologies, LLC for $11.6 million and acquired Nox Technologies, Inc., for $12.6 million, including in each case, the acquisition of patents and previ-ously licensed technology utilized in connection with Nu Skin’s re-search e� orts and incorporated into some of our products. Our ex-pense for royalties and amortization for previous technology related acquisitions were approximately $9.4 million, $8.8 million and $8.9 million in 2010, 2011 and 2012, respectively. These amounts do not include our expenses for acquiring licensed ingredients and other technologies for our Tru Face Essence products, Galvanic Spa systems and other products.

4
INTELLECTUAL PROPERTY Our major trademarks are registered in the United States and in each country where we operate or have plans to operate, and we consider trademark protection to be very important to our business. Our ma-jor trademarks include Nu Skin,® our fountain logos, Pharmanex,® ageLOC,® LifePak® and Galvanic Spa.® In addition, a number of our products, including the ageLOC Edition Galvanic Spa System II,
ageLOC Galvanic Body Spa, ageLOC True Face Essence Ultra and Pharmanex BioPhotonic Scanner, are based on proprietary technolo-gies, some of which are patented or licensed from third parties. We also rely on patents and trade secret protection to protect our propri-etary formulas and other proprietary information for our ageLOC and other products.
GEOGRAPHIC SALES REGIONS We currently sell and distribute our products in 53 markets. We have divided our markets into fi ve geographic regions: North Asia, Greater China, South Asia/Pacifi c, Americas and EMEA. The following table sets forth the revenue for each of the geographic regions for the years ended December 31, 2010, 2011 and 2012:
Year Ended December 31,
(U.S. dollars in millions) 2010 2011 2012North Asia . . . . . . . . . . . . . . . . . . . . . . . . . . . . . . . . . . . . . . . . . . . . . . $ 686.1 45% $ 751.2 43% $ 794.8 37%
Greater China . . . . . . . . . . . . . . . . . . . . . . . . . . . . . . . . . . . . . . . . . 268.2 17 341.9 20 570.7 26
South Asia/Pacifi c . . . . . . . . . . . . . . . . . . . . . . . . . . . . . . . . . . . . . . 182.8 12 236.2 14 330.3 15
Americas . . . . . . . . . . . . . . . . . . . . . . . . . . . . . . . . . . . . . . . . . . . . . . . 250.0 16 252.0 14 288.7 13
EMEA . . . . . . . . . . . . . . . . . . . . . . . . . . . . . . . . . . . . . . . . . . . . . . . . . 150.2 10 162.7 9 185.2 9
$ 1,537.3 100% $ 1,744.0 100% $ 2,169.7 100%
Additional comparative revenue and related fi nancial informa-tion is presented in the tables captioned “Segment Information” in Note 19 to our Consolidated Financial Statements
Set forth below is information regarding the key markets in our geographic regions including information about the launch of key new products.
Although our product launch process may vary by market, we generally introduce new products to our distributors and consumers in all markets where the products are registered, through limited-time o� ers in connection with global and regional distributor events. The limited-time o� ers typically generate signifi cant distributor activity and a high level of purchasing, which may result in a higher than normal increase in revenue during the quarter of the limited-time o� er and skew year-over-year and sequential comparisons. We believe our product launch process attracts new people to our business, driving growth in our Sales Leaders and Actives. For example, limited-time o� ers of ageLOC R2 and ageLOC Body Spa and related products in connection with a series of regional events generated approximately $122 million in our Greater China region and $68 million in our South Asia/Pacifi c region during the second and third quarters of 2012. We typically make a new product generally available within a year following the regional limited-time o� ers. We currently plan to introduce a new ageLOC weight management system in most of our markets through a global limited-time o� er in the second half of 2013, followed by regional limited-time o� ers in most of our markets during the following year. We currently
anticipate that the size of these limited-time o� ers may increase as our Actives grow and the percentage of Actives participating in these limited-time o� ers increases. However, we cannot be sure whether these limited-time o� ers will continue to generate distributor and consumer interest and participation, or what the short- and long-term impact will be on our business. Please refer to “Risk Factors” for more information on risks related to our product launch process
North Asia. The following table provides information on each of the markets in the North Asia region, including the year we commenced operations in the market, 2012 revenue, and the percentage of our total 2012 revenue for each market:
(U.S. dollars in millions) Year Opened 2012 RevenuePercentage of 2012 Revenue
Japan . . . . . . . . . . . . . . . . . . . . . . 1993 $ 497.3 23%
South Korea . . . . . . . . . . . . . . . 1996 $ 297.5 14%
Japan is our largest market and accounted for approximately 23% of total revenue in 2012. We o� er most of our Nu Skin and Pharmanex products in Japan. In addition, both product categories include a limited number of locally developed products sold exclusively in our Japanese market. In the fi rst quarter of 2012, we introduced our ageLOC R2 anti-aging nutritional supplements in Japan through a regional limited-time o� er. In the second half of 2012, a regional limited-time o� er of our ageLOC Galvanic Body Spa together with our ageLOC Galvanic Spa Body Shaping Gel and ageLOC Dermatic E� ects Body Contouring Lotion generated strong growth in this market.

5
The direct selling environment in Japan continues to be di� cult due to a general decline of the direct selling industry and regulatory and media scrutiny over the last several years. Please refer to “Business—Government Regulation” and “Risk Factors” for a discussion of risks and uncertainties associated with challenges in the Japan market.
In South Korea, we o� er most of our Nu Skin and Pharmanex products. We introduced our ageLOC R2 anti-aging nutritional supplements and ageLOC Galvanic Body Spa and related products in South Korea through regional limited-time o� ers in the fi rst and fourth quarters of 2012, respectively.
Greater China. The following table provides information on each of the markets in the Greater China region, including the year we commenced operations in the market, 2012 revenue, and the percentage of our total 2012 revenue for each market:
(U.S. dollars in millions) Year Opened 2012 RevenuePercentage of 2012 Revenue
China . . . . . . . . . . . . . . . . . . . . . . 2003 $ 264.8 12%
Hong Kong . . . . . . . . . . . . . . . . 1991 $ 169.8 8%
Taiwan . . . . . . . . . . . . . . . . . . . . . 1992 $ 136.1 6%
In China, we o� er many of our Nu Skin products and a locally produced value line of personal care products under the Scion brand name. We also sell a select number of Pharmanex products, including our number one nutritional product, LifePak. In Hong Kong and Taiwan, we o� er a majority of our Nu Skin and Pharmanex products and lim-ited other products and services, although our ageLOC Galvanic Spa Systems are not approved for sale in Taiwan. The introduction of our ageLOC R2 and ageLOC Galvanic Body Spa and related products through a limited-time o� er in connection with the Greater China regional convention in the second quarter of 2012 generated signifi cant growth in this region.
Our Hong Kong and Taiwan markets operate under our global direct selling business model and global sales compensation plan. However, we currently are unable to operate under our global direct selling business model in China, as a result of regulatory restrictions on direct selling activities in this market. Consequently, we have imple-mented a business model that utilizes an employed sales force and contractual sales promoters to sell products through our stores. We continue to operate this model because we believe it provides us with more fl exibility in the manner in which we can operate throughout China and compensate our contractual sales promoters and employed sales representatives. We rely on our employed sales force and con-tractual sales promoters to market and sell products through our various store locations throughout China supported by minimal traditional mass media advertising or direct marketing campaigns. Our sales force may also refer individuals to join our sales force as sales employees, contrac-
tual sales promoters or direct sellers. Our business model in China is largely based upon our ability to attract consumers to our stores through our employed sales force and contractual sales promoters, to educate consumers about our products through frequent training meetings, and to promote repeat purchases. We also continue to implement a direct sales opportunity that allows us to engage an entry-level, non-employee sales force that can sell products away from our stores where we have obtained a direct sales license. We have obtained direct selling licenses in over 50 cities and districts covering 15 provinces in China. We con-tinue to work to obtain the necessary approvals in other locations in China. Our current direct sales model is structured in a manner that we believe complements our store model. We currently operate through approximately 40 stores in China. We recently announced plans to signifi cantly expand our store count over the next fi ve years.
South Asia/Pacifi c. The following table provides information on our South Asia/Pacifi c region, including the year we commenced operations in the region, 2012 revenue, and the percentage of our total 2012 revenue:
(U.S. dollars in millions) Year Opened 2012 RevenuePercentage of 2012 Revenue
South Asia/Pacifi c Region . . 1993 $ 330.3 15%
(1) South Asia/Pacifi c region includes Australia, Brunei, French Polynesia, Indonesia,
Malaysia, New Caledonia, New Zealand, Philippines, Singapore, Thailand and
Vietnam.
We o� er a majority of our Pharmanex and Nu Skin products in the South Asia/Pacifi c region. We introduced our ageLOC R2 and our ageLOC Galvanic Body Spa and related products through a limited-time o� er in connection with the South Asia/Pacifi c regional convention in the fi rst half of 2012. Our TRA weight management products also continue to contribute to our strong growth in this region. In 2012, we began operations in Vietnam.
Americas. The following table provides information on our Americas region, including the year we commenced operations in the region, 2012 revenue, and the percentage of our total 2012 revenue:
(U.S. dollars in millions) Year Opened 2012 RevenuePercentage of 2012 Revenue
Americas Region(1) . . . . . . . . 1984 $ 288.7 13%
(1) Americas region includes Argentina, Canada, Colombia, Costa Rica, El Salvador,
Guatemala, Honduras, Mexico, United States and Venezuela.
Substantially all of our Nu Skin and Pharmanex products are available for sale in the Americas region. We introduced our new

6
ageLOC True Face Essence Ultra through a limited-time o� er in connection with the Americas regional convention in the second half of 2012.
EMEA. The following table provides information on our Europe, Middle East & Africa (“EMEA”) region, including the year we com-menced operations in the region, 2012 revenue, and the percentage of our total 2012 revenue:
(U.S. dollars in millions) Year Opened 2012 RevenuePercentage of 2012 Revenue
EMEA Region(1) . . . . . . . . . . 1995 $ 185.2 9%
(1) EMEA region includes Austria, Belgium, Czech Republic, Denmark, Finland,
France, Germany, Hungary, Ireland, Iceland, Israel, Italy, Luxembourg, the Neth-
erlands, Norway, Poland, Portugal, Romania, Russia, Slovakia, South Africa, Spain,
Sweden, Switzerland, Turkey, Ukraine and the United Kingdom.
We o� er a majority of our Pharmanex and Nu Skin products in the EMEA region. We introduced our ageLOC Galvanic Body Spa and related products and ageLOC R2 in the majority of our markets in the EMEA region through limited-time-o� ers in fi rst and second halves of 2012, respectively.
DISTRIBUTION CHANNELOverview. We operate in the direct selling channel, primarily utilizing person-to-person marketing to market and sell our products. These personal marketing e� orts are supported by various mediums, includ-ing catalogs, the Internet, and walk-in centers. We believe our distribu-tion channel is an e� ective vehicle to distribute our products because:
• our distributors can educate consumers about our products face-to-face, which we believe is more e� ective for di� erenti-ating our products than using traditional mass-media advertis-ing because it provides a better opportunity to educate the consumer about the attributes of our products;
• our distribution channel allows for actual product demonstra-tions and testing by potential consumers;
• our distribution channel allows distributors to provide testimo-nials; and
• as compared to other distribution methods, our distributors can provide consumers higher levels of service and encourage repeat purchases
The manner in which we operate our distribution channel can vary from market to market based on regulatory and socio-economic conditions. While our person-to-person marketing philosophy re-mains consistent globally, various aspects of our business may di� er from market-to-market, including product mix and pricing, compen-sation structure, access to distribution outlets or product stores, the manner of getting products to consumers, product claims, branding and product formulations.
Our policies generally require that our products may not be sold, and our business opportunities may not be promoted, in tradi-tional retail environments. This policy promotes a level playing fi eld for all Sales Leaders. However, owners or employees of a service-re-lated business, such as a doctor’s o� ce, hair salon or health club, may make products available to regular customers as long as products are not displayed visibly to the general public
Consumers and Sales Network. Our distribution channel is composed of two primary groups: our consumer group—individuals who buy our products primarily for personal or family consumption; and our sales network—individuals who personally buy, use and resell products, and who also fi nd new consumers, and recruit, train and develop new Sales Leaders. We strive to develop both our consumer group and our sales network. Our strategy for growing our consumer group is to o� er high-quality, innovative products that provide de-monstrable benefi ts. Our strategy for growing our sales network is to provide a meaningful business opportunity for those persons who demonstrate the ability to develop both a consumer group and a team of Sales Leaders.
To monitor the growth trends in our consumer group, we track the number persons who purchased products directly from the com-pany during the previous three months (“Actives”). To monitor the growth in our sales network, we also track the number of persons who have completed and who maintain specifi ed sales requirements at the end of a period (“Sales Leaders”). The following chart sets forth information concerning our Actives and Sales Leaders for the last three years:

7
TOTAL NUMBER OF ACTIVES AND SALES LEADERS BY REGIONAs of December 31, 2010 As of December 31, 2011 As of December 31, 2012
Actives Sales Leaders Actives Sales Leaders Actives Sales Leaders
North Asia . . . . . . . . . . . . . . . . . . . . . . . . . . . . . . . 329,000 14,687 338,000 15,293 349,000 17,395
Greater China . . . . . . . . . . . . . . . . . . . . . . . . . . . 118,000 8,015 143,000 11,808 216,000 18,527
South Asia/Pacifi c . . . . . . . . . . . . . . . . . . . . . . . 84,000 3,930 99,000 5,619 98,000 4,988
Americas . . . . . . . . . . . . . . . . . . . . . . . . . . . . . . . . 161,000 5,305 166,000 5,356 164,000 6,352
EMEA . . . . . . . . . . . . . . . . . . . . . . . . . . . . . . . . . . . 107,000 3,739 109,000 3,740 119,000 4,528
Total . . . . . . . . . . . . . . . . . . . . . . . . . . 799,000 35,676 855,000 41,816 946,000 51,790
Participating in our Channel. Individuals can elect to participate in our business as follows:
“Distributor-Direct Consumer”—Individuals who purchase prod-ucts directly from a distributor at a price established by the dis-tributor.
“Company-Direct Consumers”—Individuals who purchase prod-ucts directly from the company. These consumers generally have the opportunity to purchase at a discount if they participate in our subscription and/or loyalty programs. These individuals do not have the right to build a Nu Skin business by reselling product or recruiting others.
“Basic Distributors”—Distributors who purchase products at a discount for personal or family use or for resale to other consum-ers. These individuals are not eligible to receive compensation on a multi-level basis unless they elect to qualify as a Sales Leader under our global compensation plan. We consider these indi-viduals to be part of our consumer group, as most of these dis-tributors are purchasing products for personal use and not ac-tively recruiting others.
“Sales Leaders and Qualifi ers”—Distributors who have qualifi ed or are trying to qualify as a Sales Leader. These are the distributors who have elected to qualify as a Sales Leader and are actively recruiting consumers and distributors and building a sales network under our global compensation plan, and constitute our sales network. In China, where we operate under a di� erent business and sales compensation model, Sales Leaders are the individuals who have applied to become contractual sales promoters or sales employees.
To become a distributor in most of our markets, an individual must sign a distributor agreement and purchase a not-for-profi t starter-kit for a small fee, which varies from market to market. The starter kit generally consists of documentation concerning the business, includ-ing copies of the sales compensation plan, distributor policies and procedures and other documentation, but does not include products.
There are no requirements to purchase products, and no commissions are paid on the purchase of the starter-kit.
We o� er a generous product return policy, which allows distributors to return product for a full refund, less a 10% restocking fee. In most markets, the return policy applies to any products purchased in the last 12 months. Distributors are not required to terminate their distributorship to return product. Actual product returns have historically been less than 5% of annual revenue. We believe our generous return policy minimizes the fi nancial risks associated with operating a Nu Skin business.
Compensation. There are two fundamental ways in which our distributors can earn money:
• by reselling products purchased from the company to consumers; and
• through commissions earned on the sale of products under our global sales compensation plan.
We believe that our global sales compensation plan, which has been implemented in each of our markets except for China, is one of our competitive advantages. Our Sales Leaders can receive “multi-level” compensation under our global sales compensation plan for product sales to their consumer groups as well as the sales made through the network of Sales Leaders they have developed and trained. Our distributors are not required to recruit or sponsor other distributors, and we do not pay any commissions for recruiting or sponsoring other distributors. While all of our distributors can sponsor other distributors at any time, our Sales Leaders and those in qualifi cation to become Sales Leaders are the distributors who generally are actively sponsoring other distributors. Pursuant to our global sales compensation plan, we pay consolidated monthly commissions in a Sales Leader’s home country, in local currency, for product sales in the Sales Leader’s own consumer group and for product sales in the Sales Leader’s organization of Sales Leaders across all geographic markets.
Because of restrictions on direct selling and multi-level commis-sions in China, our sales employees, contractual sales promoters and

8
direct sellers do not participate in our global sales compensation plan, but are instead compensated according to a separate compensation model established for that market.
Sales Incentives, Meetings, Recognition and Training. An important part of our distribution channel is motivating our Sales Leaders and recognizing their achievements. We hold regular distributor meetings and events globally in order to recognize Sales Leaders who have achieved various levels of success in our business. These meetings also allow the company and key Sales Leaders to provide training to our distributors. We utilize a variety of sales incentives such as incentive trips to motivate Sales Leaders. In addition to rewarding performance, incentive trips provide Sales Leaders and the company opportunities to share best practices, generate alignment of Sales Leaders around key initiatives, and provide a high level of motivation and team building among Sales Leaders.
OUR CULTURE From our inception more than 28 years ago, Nu Skin Enterprises’ mission has been to improve people’s lives through our innovative products and rewarding business opportunities and by promoting an uplifting and enriching culture. Our mission statement encourages people to be a “force for good” in the world around them. Our culture unites our distributors and employees in innovative humanitarian e� orts, the most signifi cant of which are the Nourish the Children initiative that provides an opportunity to purchase and donate nutritious meals to malnourished children and the Nu Skin Force for Good Foundation that supports charitable causes that improve children’s lives. We encourage our distributors and employees to live each day with an understanding that together we have the opportunity to make the world a better place.
Nourish the Children. In 2002, we introduced an innovative hu-manitarian initiative, Nourish the Children, which applies the power of our distribution network to help address the problem of hunger and malnutrition. We sell a highly nutritious meal replacement product under the brand, VitaMeal, and encourage our distributors and em-ployees to purchase VitaMeal and donate their purchase to charitable organizations that specialize in distributing food to alleviate famine and poverty. Our distributors also earn commissions from VitaMealsales. For every eight packages of VitaMeal purchased and donated, we donate an additional package, or approximately 30 meals. Since 2002, our distributors and employees have donated more than 291 million nutritious meals to malnourished children in various locations throughout the world.
The Nu Skin Force for Good Foundation. Since its inception in 1996, the Nu Skin Force for Good Foundation and our distributors and employees have supported charitable projects that improve children’s lives in more than 50 countries. Generally, the purpose of
these charitable projects is to improve the lives of children by o� ering hope for a life free from disease, illiteracy and poverty. Projects supported by the Nu Skin Force for Good Foundation and our distributors and employees include helping to provide crucial heart surgeries for children in Southeast Asia and China, supporting schools and libraries for children in need and providing training for farmers and their families in Malawi to increase crop production and become more self-reliant.
COMPETITION Direct Selling Companies. We compete with other direct selling organizations, some of which have a longer operating history and higher visibility, name recognition and fi nancial resources than we do. The leading direct selling companies in our existing markets are Herbalife, Mary Kay, Orifl ame, Avon and Amway. We compete with these companies to attract and retain our distributors and consumers based on the strength of our multiple business opportunities, product o� erings, global sales compensation plan, management and interna-tional operations.
Nu Skin and Pharmanex Products. The markets for our Nu Skin and Pharmanex products are highly competitive. Our competitors include manufacturers and marketers of personal care and nutritional products, pharmaceutical companies and other direct selling organiza-tions, many of which have longer operating histories and greater name recognition and fi nancial resources than we do. We compete in these markets by emphasizing the innovation, value and premium quality of our products and the convenience of our distribution system.
GOVERNMENT REGULATION Direct Selling Activities. Direct selling activities are regulated by various federal, state and local governmental agencies in the United States and foreign countries. These laws and regulations are generally intended to prevent fraudulent or deceptive schemes, often referred to as “pyramid” schemes, that compensate participants primarily for recruiting additional participants without signifi cant emphasis on product sales. The laws and regulations in our current markets often:
• impose order cancellations, product returns, inventory buy-backs and cooling-o� rights for our distributors and consumers;
• require us, or our distributors, to register with governmental agencies;
• impose caps on the amount of commission we can pay;
• impose reporting requirements; and

9
• require that we ensure, among other things, that our distribu-tors maintain levels of product sales to qualify to receive com-missions and that our distributors are being compensated for sales of products and not for recruiting others.
The laws and regulations governing direct selling are modifi ed from time to time, and, like other direct selling companies, we are subject from time to time to government investigations in our various markets related to our direct selling activities. This can require us to make changes to our business model and aspects of our sales com-pensation plan in the markets impacted by such changes and investigations.
In Japan, the direct selling industry continues to experience regulatory and media scrutiny. Several direct sellers in Japan have been penalized for actions of distributors that violated applicable regulations. We have received warnings from consumer centers in certain prefec-tures raising concerns about the number of general inquiries and com-plaints regarding the activities of certain distributors. We have imple-mented additional steps to reinforce our distributor education and training in Japan to help address these concerns. In South Korea, our results were negatively impacted by minor adjustments we made to the commissionable value of our products to comply with local regu-latory requirements that limit the amount of commissions we pay to our distributors. In the United States, there has been signifi cant media and short seller attention over the past year regarding the direct selling industry and multi-level compensation. Please refer to “Risk Factors” for more information on regulatory and other risks associated with our business in Japan, Korea and the United States.
As a result of restrictions in China on direct selling activities, we have implemented a business model that utilizes an employed sales force and contractual sales promoters to sell products through our stores, and independent direct sellers that can sell products away from our stores where we have obtained a direct sales license. The regula-tory environment in China is complex. China’s direct selling and anti-pyramiding regulations are restrictive and contain various limitations, including a restriction on the ability to pay multi-level compensation. Our operations in China have attracted signifi cant regulatory and media scrutiny since we expanded our operations there in January 2003. Regulations are subject to discretionary interpretation by mu-nicipal and provincial level regulators as well as local customs and practices. Interpretations of what constitutes permissible activities by regulators can vary from province to province and can change from time to time because of the lack of clarity in the rules regarding direct selling activities and di� erences in customs and practices in each loca-tion. Please refer to “Risk Factors” for more information on the regula-tory risks associated with our business in China.
The regulatory environment with respect to direct selling in China remains fl uid, and the process for obtaining the necessary gov-ernmental approvals to conduct direct selling continues to evolve. The regulations and processes in some circumstances have been inter-preted di� erently by di� erent governmental authorities. In order to expand our direct selling model into additional provinces we cur-rently must obtain a series of approvals from the local Department of Commerce in such provinces, the Shanghai Municipal Commission of Commerce (our supervisory authority), as well as the State Ministry of Commerce (“MOFCOM”), which is the national governmental authority overseeing direct selling. In the course of obtaining these approvals, the respective authorities under MOFCOM must also consult and seek opinions on our business operations from the Min-istry of Public Security and the Administration for Industry and Com-merce at both provincial and State levels. In addition, regulators are acting cautiously as they monitor the expansion of direct selling. Please refer to “Risk Factors” for more information on the risks associated with our planned expansion of direct selling in China.
Regulation of Our Products. Our Nu Skin and Pharmanex products and related promotional and marketing activities are subject to extensive governmental regulation by numerous governmental agencies and authorities, including the Food and Drug Administration (the “FDA”), the Federal Trade Commission (the “FTC”), the Consumer Product Safety Commission, the Department of Agriculture, State Attorneys General and other state regulatory agencies in the United States, and the Ministry of Health, Labor and Welfare in Japan and similar government agencies in each market in which we operate.
Our personal care products are subject to various laws and regula-tions that regulate cosmetic and personal care products and set forth regulations for determining whether a product can be marketed as a “cosmetic” or requires further approval as an over-the-counter drug. In the United States, regulation of cosmetics are under the jurisdiction of the FDA. The Food, Drug and Cosmetic Act defi nes cosmetics by their intended use, as “articles intended to be rubbed, poured, sprinkled, or sprayed on, introduced into, or otherwise applied to the human body . . . for cleansing, beautifying, promoting attractiveness, or altering the appearance.” Among the products included in this defi nition are skin moisturizers, perfumes, lipsticks, fi ngernail polishes, eye and facial makeup preparations, shampoos, permanent waves, hair colors, tooth-pastes and deodorants, as well as any material intended for use as a component of a cosmetic product. Conversely, a product will not be considered a cosmetic, but may be considered a drug if it is intended for use in the diagnosis, cure, mitigation, treatment, or prevention of disease, or is intended to a� ect the structure or any function of the body. A product’s intended use can be inferred from marketing or product claims and regulators may consider the marketing claims of our distributors.

10
The FDA recently issued warning letters to several cosmetic com-panies alleging improper structure/function claims regarding their cos-metic products, including, for example, product claims regarding gene activity, cellular rejuvenation, and rebuilding collagen. There is a degree of subjectivity in determining whether a claim is an improper structure/function claim. Given this subjectivity and our research and development focus on the sources of aging and gene expression, there is a risk that we could receive a warning letter, be required to modify our product claims or take other actions to satisfy the FDA if the FDA determines any of our marketing materials include improper structure/function claims for our cosmetic products. In addition, plainti� s’ lawyers have fi led class action lawsuits against some of our competitors after our competitors received these FDA warning letters. There can be no assurance that we will not be subject to governmental actions or class action lawsuits, which could harm our business.
The other markets in which we operate have similar regulations. In Japan, the Ministry of Health, Labor and Welfare regulates the sale and distribution of cosmetics and requires us to have an import business license and to register each personal care product imported into Japan. In Taiwan, all “medicated” cosmetic products require registration. In China, personal care products are placed into one of two categories, “general” and “drug.” Products in both categories require submission of formulas and other information with the health authorities, and drug products require human clinical studies. The product registration process in China is unpredictable and can take from nine to 18 months or sub-stantially longer. In some cases, registration has taken several years to complete. Such regulations in any given market can limit our ability to import products and can delay product launches as we go through the registration and approval process for those products. The sale of cos-metic products is regulated in the European Union (the “EU”) under the EU Cosmetics Directive, which requires a uniform application for foreign companies making personal care product sales.
Our Pharmanex dietary supplement products are subject to ap-plicable regulations of government agencies in the markets in which we operate. In the United States, we generally market our nutritional prod-ucts as conventional foods or dietary supplements. The FDA has juris-diction over this regulatory area. Because these products are regulated under the Dietary Supplement and Health Education Act, we are gen-erally not required to obtain regulatory approval prior to introducing a product into the United States market. None of this infringes, however, upon the FDA’s power to remove from the market any product it determines to be unsafe or an unapproved drug. The FDA may also deem a dietary supplement an unapproved drug where the marketing claims made in connection with the sale or promotion of the product places it in the drug category. In our foreign markets, the products are generally regulated by similar government agencies, such as the Japan Ministry of Health, Labor and Welfare, the South Korea Food and Drug Administration, and the Taiwan Department of Health. We typically
market our Pharmanex products in international markets as foods or health foods under applicable regulatory regimes. In the event a prod-uct, or an ingredient in a product, is classifi ed as a drug or pharmaceuti-cal product in any market, we will generally not be able to distribute that product in that market through our distribution channel because of pre-market approvals and strict regulations applicable to drug and phar-maceutical products. China has some of the most restrictive nutrition-al supplement product regulations. Products marketed as “health foods” are subject to extensive laboratory and clinical analysis by governmen-tal authorities, and the product registration process in China generally takes one to two years, but may be substantially longer. We market both “health foods” and “general foods” in China. There is some risk associ-ated with the common practice in China of marketing a product as a “general food” while seeking “health food” classifi cation. If government o� cials feel our categorization of our products is inconsistent with prod-uct claims, ingredients or function, this could end or limit our ability to market such products in China in their current form.
The markets in which we operate all have varied regulations that distinguish foods and nutritional health supplements from “drugs” or “pharmaceutical products.” Because of the varied regulations, some products or ingredients that are recognized as a “food” in certain markets may be treated as a “pharmaceutical” in other markets. In Japan, for example, if a specifi ed ingredient is not listed as a “food” by the Ministry of Health and Welfare, we must either modify the product to eliminate or substitute that ingredient, or petition the government to treat such ingredient as a food. We experience similar issues in our other markets. This is particularly a challenge in Europe, where regulations often still di� er from state to state, despite EU regulations designed to harmonize the laws of EU member states. As a result, we must often modify the ingredients and/or the levels of ingredients in our products for certain markets, or create unique formulations for multiple markets. In some circumstances, the regulations in foreign markets may require us to ob-tain regulatory approval prior to introduction of a new product or limit our use of certain ingredients altogether. Because of negative publicity associated with some adulterated or misbranded supplements, includ-ing pharmaceutical drugs marketed as dietary supplements, there has been an increased movement in the United States and other markets to expand the regulation of dietary supplements, which could impose additional restrictions or requirements in the future. In general, the regulatory environment is becoming more complex with increasingly stricter regulations each year.
E� ective June 2008, the FDA established regulations to require current good manufacturing practices for dietary supplements. The regulations ensure that dietary supplements are produced in a quality manner, do not contain contaminants or impurities, and are accurately labeled. The regulations include requirements for establishing quality control procedures for us and our vendors and suppliers, designing and constructing manufacturing plants, and testing ingredients and fi nished

11
products. The regulations also include requirements for record keeping and handling consumer product complaints. If dietary supplements contain contaminants or do not contain the type or quantity of dietary ingredient they are represented to contain, the FDA would consider those products to be adulterated or misbranded. Our business is subject to additional FDA regulations, such as those implementing an adverse event reporting system e� ective December 2007, which requires us to document and track adverse events and report serious adverse events, which are events involving hospitalization or death, associated with con-sumers’ use of our products. Compliance with these regulations has increased, and may further increase, the cost of manufacturing and sell-ing certain of our products as we oversee and inspect more aspects of third party manufacturing and work with our vendors to assure they are in compliance.
Most of our major markets also regulate advertising and product claims regarding the e� cacy of products and require adequate and reliable scientifi c substantiation of all claims. Accordingly, these regula-tions can limit our ability to inform consumers of the full benefi ts of our products. For example, in the United States, we are unable to claim that any of our nutritional supplements will diagnose, cure, mitigate, treat or prevent disease. In most of our foreign markets, we are not able to make any “medicinal” claims with respect to our Pharmanex products. In the United States, the Dietary Supplement Health and Education Act, however, permits substantiated, truthful and non-misleading statements of nutritional support to be made in labeling, such as statements describing general well-being resulting from consumption of a dietary ingredient or the role of a nutrient or dietary ingredient in a� ecting or maintaining a structure or a function of the body. Most of the other markets in which we operate have not adopted similar legislation and we may be subject to more restrictive limitations on the claims we can make about our products in these markets. For example, in Japan, our nutritional supplements are marketed as food products, which signifi cantly limits our ability to make any claims regarding these products. If marketing materials produced or used by us or our distributors make claims that exceed the scope of allowed claims for dietary supplements the FDA or other regulatory authorities could deem our products to be unap-proved drugs. E� ective December 1, 2009, the FTC approved revisions to its Guides Concerning the Use of Endorsements and Testimonials in Advertising that restrict marketing to those results obtained by a “typical” consumer and require disclosure of any material connections between an endorser and the company or products they are endorsing.
In the United States, we are also subject to a consent decree with the FTC and various state regulatory agencies arising out of investiga-tions that occurred in the early 1990s of certain alleged unsubstantiated product and earnings claims made by our distributors. The consent decree requires us to, among other things, supplement our procedures to enforce our policies, not allow our distributors to make earnings rep-
resentations without making certain average earnings disclosures, and not allow our distributors to make unsubstantiated product claims.
Our Pharmanex BioPhotonic Scanner and our ageLOC Galvanic Spa System are subject to the regulations of various health, consumer protection and other governmental authorities around the world. These regulations vary from market to market and a� ect whether our products are required to be registered as medical devices, the claims that can be made with respect to these products, who can use them, and where they can be used. We have been required to register our ageLOC Galvanic Spa as a medical device in a few markets. We have been subject to regulatory inquiries in the United States, Japan, and other countries with respect to the status of the Pharmanex BioPhotonic Scanner as a non-medical device. Any determination that medical device clearance is required for one of our products, in a market where we currently market and sell such product as a cosmetic or non-medical device, could require us to expend signifi cant time and resources in order to meet the addi-tional stringent standards imposed on medical device companies or prevent us from marketing the product. Please refer to “Risk Factors” for more information on the regulatory risks associated with our Pharmanex BioPhotonic Scanner and our ageLOC Galvanic Spa System.
Other Regulatory Issues. As a United States entity operating through subsidiaries in foreign jurisdictions, we are subject to foreign exchange control, transfer pricing and customs laws that regulate the fl ow of funds between us and our subsidiaries and for product purchases, management services and contractual obligations, such as the payment of sales commissions.
As is the case with most companies that operate in our product categories, we receive from time to time inquiries from government regulatory authorities regarding the nature of our business and other issues, such as compliance with local direct selling, transfer pricing, customs, taxation, foreign exchange control, securities and other laws. Negative publicity resulting from inquiries into our operations by the United States and state government agencies in the early 1990s, stemming in part from alleged inappropriate product and earnings claims by distributors, and in the late 1990s resulting from adverse media attention in South Korea, harmed our business.
EMPLOYEES As of December 31, 2012, we had approximately 3,733 full- and part-time employees worldwide. This does not include approximately 12,707 individuals who were employed as sales representatives in our China operations. Our employees are not represented by a union or other collective bargaining group, except in China and a limited number of our employees in Japan. We believe that our relationship with our employees is good, and we do not foresee a shortage in qualifi ed personnel necessary to operate our business.

12
AVAILABLE INFORMATIONOur website address is www.nuskinenterprises.com. We make available free of charge on or through our website our annual reports on Form 10-K, quarterly reports on Form 10-Q, current reports on Form 8-K, and amendments to those reports fi led or furnished pursuant to Section 13(a) or 15(d) of the Securities Exchange Act of 1934 as soon as reasonably practicable after we electronically fi le such material with, or furnish it to, the Securities and Exchange Commission (the “SEC”). The public may read and copy any materials we fi le with the SEC at the SEC’s Public Reference Room at 100 F Street, NE, Washington, DC 20549. The public may obtain information on the operation of the Public Reference Room by calling the SEC at 1-800-SEC-0330. The SEC maintains a website at http://www.sec.gov that contains reports, proxy and information statements, and other information regarding issuers that fi le electronically with the SEC.
EXECUTIVE OFFICERSOur executive o� cers as of January 31, 2013, are as follows:
NAME AGE POSITIONSteven J. Lund 59 Executive Chairman of the BoardM. Truman Hunt 53 President and Chief Executive O� cerRitch N. Wood 47 Chief Financial O� cerJoseph Y. Chang 60 Chief Scientifi c O� cer and Executive
Vice President, Product DevelopmentDaniel R. Chard 48 President, Global Sales and OperationsD. Matthew Dorny 48 General Counsel and SecretaryScott E. Schwerdt 55 President, Americas Region
Set forth below is the business background of each of our executive o� cers.
Steven J. Lund has served as Executive Chairman of our board of directors since May 2012. Mr. Lund previously served as Vice Chairman of our board of directors from September 2006 to May 2012, and as President and Chief Executive O� cer, and as a member of our board of directors from 1996, when the we went public, until 2003. Mr. Lund was a founding stockholder of our company. Mr. Lund is a trustee of the Nu Skin Force for Good Foundation, a chari-table organization established in 1996 by our company to help encourage and drive the philanthropic e� orts of our company and its distributors and employees to enrich the lives of others. Mr. Lund worked as an attorney in private practice prior to joining our company as Vice President and General Counsel. He received a B.A. degree from Brigham Young University and a J.D. degree from Brigham Young University’s J. Reuben Clark Law School.
M. Truman Hunt has served as our President and Chief Execu-tive O� cer since 2003. He also joined our board of directors when he
was named Chief Executive O� cer. Mr. Hunt has served in various positions with our company since 1994, including Executive Vice President from 2001 to 2003 and General Counsel from 1996 to 2003. From 2005 until 2008, Mr. Hunt served as Chairman of the World Federation of Direct Selling Associations, a global trade association for the direct selling industry. He received a B.S. degree from Brigham Young University and a J.D. degree from the University of Utah.
Ritch N. Wood has served as our Chief Financial O� cer since November 2002. Prior to this appointment, Mr. Wood served as Vice President, Finance from July 2002 to November 2002 and Vice President, New Market Development from June 2001 to July 2002. Mr. Wood joined our company in 1993 and has served in various capacities. Prior to joining us, he worked for the accounting fi rm of Grant Thornton LLP. Mr. Wood earned a B.S. and a Master of Accountancy degrees from Brigham Young University.
Joseph Y. Chang has served as our Chief Scientifi c O� cer and Executive Vice President of Product Development since February 2006. Dr. Chang served as President of our Pharmanex division from April 2000 to February 2006. Dr. Chang served as Vice President of Clinical Studies and Pharmacology of Pharmanex from 1997 until April 2000. Dr. Chang has nearly 20 years of pharmaceutical experi-ence. He received a B.S. degree from Portsmouth University and a Ph.D. degree from the University of London.
Daniel R. Chard has served as President of Global Sales and Operations since May 2009. Prior to serving in this position, Mr. Chard served as Executive Vice President of Distributor Success from February 2006 to May 2009 and President of Nu Skin Europe from April 2004 to February 2006. Mr. Chard also served as Vice President of Marketing and Product Management of Big Planet, our technology products and services division, from May 2003 to April 2004 and as Senior Director of Marketing and Product Development at Pharmanex. Prior to joining us in 1998, Mr. Chard worked in a variety of strategic marketing positions in the consumer products industry. Mr. Chard holds a B.A. degree in Economics from Brigham Young University and an M.B.A. from the University of Minnesota.
D. Matthew Dorny has served as our General Counsel and Sec-retary since January 2003. Mr. Dorny previously served as Assistant General Counsel from May 1998 to January 2003. Prior to joining us, Mr. Dorny was a securities and business attorney in private practice in Salt Lake City, Utah. Mr. Dorny received B.A., M.B.A. and J.D. degrees from the University of Utah.
Scott E. Schwerdt has served as President, Americas Region, since June 2011. Mr. Schwerdt served as the President of the Americas,

13
Europe and Pacifi c from February 2006 to June 2011 and as Region-al Vice President of North America and President of Nu Skin Enter-prises United States, Inc. from May 2004 to February 2006. Mr. Schw-erdt previously served as the General Manager of our U.S. operations from May 2001 to May 2004. Mr. Schwerdt joined our company in 1988 and has held various positions, including Vice President of North America/South Pacifi c Operations and Vice President of Europe. Mr. Schwerdt received a B.A. degree in International Relations from Brigham Young University.
ITEM 1A. RISK FACTORS We face a number of substantial risks. Our business, fi nancial condition or results of operations could be harmed by any of these risks. The trading price of our common stock could decline due to any of these risks, and they should be considered in connection with the other information con-tained in this Annual Report on Form 10-K. These risk factors should be read together with the other items in this Annual Report on Form 10-K, including Item 1. “Business” and Item 7. “Management’s Discussion and Analysis of Financial Condition and Results of Operation.”
Di� cult economic conditions could harm our business.Global economic conditions continue to be challenging. Even
with continued growth in many of our markets, di� cult economic conditions could adversely a� ect our business in the future by causing a decline in demand for our products, particularly if the economic conditions are prolonged or worsen. In addition, such economic conditions may adversely impact access to capital for us and our suppliers, may decrease the ability of our distributors and consumers to obtain or maintain credit cards, and may otherwise adversely impact our operations and overall fi nancial condition.
Currency exchange rate fl uctuations could impact our fi nancial results. In 2012, approximately 89% of our sales occurred in markets
outside of the United States in each market’s respective local currency. We purchase inventory primarily in the United States in U.S. dollars. In preparing our fi nancial statements, we translate revenue and expenses in our markets outside the United States from their local currencies into U.S. dollars using weighted average exchange rates. If the U.S. dollar strengthens relative to local currencies, our reported revenue, gross profi t and net income will likely be reduced. Foreign currency fl uctuations, particularly with respect to the Japanese yen given the amount of yen denominated debt on our balance sheet, can also result in losses and gains resulting from translation of foreign currency denominated balances on our balance sheet. Although we may engage in transactions intended to reduce our exposure to foreign currency fl uctuations, there can be no assurance that these transactions will be e� ective. Given the complex global political and economic dynamics that a� ect exchange rate fl uctuations, it is di� cult to predict future fl uctuations and the e� ect these fl uctuations may have upon future reported results or our overall fi nancial condition.
Improper distributor actions that violate laws or regulations could harm our business.
Distributor activities that violate applicable laws or regulations could result in government or third party actions against us, which could harm our business. Except in China, our distributors are not employees and act independently of us. The most signifi cant area of risk for such ac-tivities relates to improper product claims and claims regarding the busi-ness opportunity of being a distributor. We implement strict policies

14
and procedures to ensure our distributors comply with legal requirements. However, given the size of our distributor force, we experience problems with distributors from time to time. For example, product claims made by some of our distributors in 1990 and 1991 led to a United States Federal Trade Commission (“FTC”) investigation that resulted in our entering into a consent decree with the FTC. In addition, rulings by the South Korean Federal Trade Commission and by judicial authorities against us and other companies in South Korea indicate that vicarious liability may be imposed on us for the criminal activity of our distributors. We have also seen an increase in sales aids and promotional material produced by distributors and distributor groups in some markets, increasing the burden on us to monitor compliance of such materials and increasing the risk that such materials could contain problematic product or market-ing claims in violation of our policies and applicable regulations. As we expand internationally, our distributors often attempt to anticipate which markets we will open in the future and begin marketing and sponsoring activities in markets where we are not qualifi ed to conduct business. We could face fi nes or other legal action if our distributors violate applicable laws and regulations.
If we are unable to retain our existing distributors and recruit additional distributors, our revenue will not increase and may even decline.
Our products are primarily marketed by our distributors and we depend on them to generate virtually all of our revenue. Our distributors may terminate their services at any time, and, like most direct selling companies, we experience high turnover among distributors from year to year. Distributors who join to purchase our products for personal consumption or for short-term income goals frequently only stay with us for a short time. Sales Leaders who have committed time and e� ort to build a sales organization will generally stay for longer periods. Distributors have highly variable levels of training, skills and capabilities. To increase our revenue, we must increase the number of and/or the productivity of our distributors.
We have experienced periodic declines in both Sales Leaders and Actives in the past and could experience such declines again in the future. If our initiatives do not drive growth in both our Sales Leaders and Actives, our operating results could be harmed. While we take many steps to help train, motivate, and retain distributors, we cannot accurately predict how the number and productivity of distributors may fl uctuate because we rely primarily upon our Sales Leaders to fi nd new consumers, and train and develop new Sales Leaders. Our operating results could be harmed if we, and our Sales Leaders, do not generate su� cient interest in our business to retain and motivate existing distributors and attract new distributors.
The number and productivity of our distributors could be harmed by several additional factors, including:
• any adverse publicity regarding us, our products, our distribution channel, or our competitors;
• lack of interest in, or the technical failure of, existing or new products;
• lack of a compelling product or income opportunity that generates interest for potential new distributors;
• any negative public perception of our products and their ingredients;
• any negative public perception of our distributors and direct selling businesses in general;
• our actions to enforce our policies and procedures;
• any regulatory actions or charges against us or others in our industry;
• general economic and business conditions; and
• potential saturation or maturity levels in a given country or market which could negatively impact our ability to attract and retain distributors in such market.
Because our Japanese operations account for a signifi cant part of our business, continued weakness in our business operations in Japan could harm our business.
Approximately 23% of our 2012 revenue was generated in Japan. Although our revenue in Japan increased in 2012 compared to the prior year, we have experienced local currency revenue declines in the previous several years and continue to face challenges in this market. These declines could continue or increase. Factors that could impact our results in the market include:
• continued or increased levels of regulatory and media scrutiny and any regulatory actions taken by regulators, or any adoption of more restrictive regulations, in response to such scrutiny;
• signifi cant weakening of the Japanese yen;
• increased regulatory constraints with respect to the claims we can make regarding the e� cacy of our products, which could limit our ability to e� ectively market them;

15
• inappropriate activities by our distributors and any resulting regulatory actions;
• improper practices of other direct selling companies or their distributors that increase regulatory and media scrutiny of our industry;
• increased weakness in the economy or consumer confi dence; and
• increased competitive pressures from other direct selling companies and their distributors who actively seek to solicit our distributors to join their businesses.
Regulatory scrutiny of the direct selling industry in Japan could harm our business if we are not able to successfully limit the number of general inquiries and complaints regarding our business received by consumer centers.
The direct selling industry in Japan continues to experience regulatory and media scrutiny. Several direct sellers in Japan have been penalized for actions of distributors that violated applicable regulations, including a prominent international direct selling company and a large Japanese direct selling company that were suspended from sponsoring activities for three months in 2008 and six months in 2009, respectively.
Over the last few years, we have received warnings from consumer centers in certain prefectures raising concerns about the number of general inquiries and complaints regarding us. Although we are imple-menting additional steps to reinforce our distributor compliance, education and training e� orts in Japan, we cannot be sure that such e� orts will be successful. If the current level of inquiries or complaints does not improve, there is an increased likelihood that the government could take action against us, including sanctions and or suspensions, or that we could receive negative media attention, all of which could harm our business.
If direct selling regulations in China are modified, interpreted or enforced in a manner that results in negative changes to our business model or the imposition of a range of potential penalties, our business would be significantly negatively impacted.
The government of China has adopted direct selling and anti-pyramiding regulations that impose signifi cant restrictions and limita-tions on the way we do business. Most notably, the regulations include a restriction on the use of multi-level compensation, which is the basis of how we compensate distributors outside of China. We have struc-tured our business model in China based on several factors: our inter-pretation of applicable regulations, the guidance we have received from government o� cials, our understanding of the practices of other international direct selling companies operating in China, and our understanding as to how regulators are interpreting and enforcing the regulations. In China, we operate with both independent direct
sellers who can sell away from our stores as well as contractual sales promoters who can progress through various leadership positions in our sales organization and become employed sales representatives once they have achieved designated performance levels. We generally compensate our Sales Leaders at a level that is competitive with other direct selling companies in the market and refl ective of the compensation of our Sales Leaders globally. The nature of the political, regulatory and legal systems in China gives regulatory agencies at both the local and central levels of government broad discretion to interpret and enforce regulations as they deem appropriate to promote social order. We face a risk that regulators may change the way in which they currently interpret and enforce the direct selling regulations. If our business practices are found to be in violation of applicable regulations as they may be interpreted or enforced in the future, in particular our use of the sales productivity of a Sales Leader and the sales promoters and employees that such Sales Leader leads and supervises in setting his/her quarterly compensation level, then we could be sanctioned and/or required to change our business model, either of which could signifi cantly harm our business.
Our operations in China are subject to signifi cant government scrutiny, and we could be subject to fi nes or other penalties if our sales force engage in activities that violate applicable laws and regulations.
We work diligently to train our sales force in China on how our China business model di� ers from our global business model. However, because there are often foreign Sales Leaders performing training in China and because our global model varies signifi cantly from our China business model, confusion can result as to how those working in China should promote the business in China. This confusion may lead to governmental reviews and investigations of our operations in China. The legal system in China provides governmental authorities with broad latitude to conduct investigations. We anticipate that our business will continue to attract signifi cant governmental scrutiny, particularly as our business grows and the number of sales employees and contractual sales promoters continues to increase. We face a risk that future inves-tigations may result in fi nes or other more signifi cant sanctions.
Our ability to expand our business in China could be negatively impacted if we are unable to obtain additional necessary national and local government approvals in China.
We have obtained direct selling licenses in over 50 cities and districts covering 15 provinces in China. In order to expand our direct selling model into additional provinces, we currently must obtain a series of approvals from district, city, provincial and national government agencies with respect to each province in which we wish to expand. The process for obtaining the necessary government approvals to conduct direct selling continues to evolve and is lengthy, as we are required to work with a large number of provincial, city, district and national government authorities. The complexity of the approval process

16
as well as the government’s continued cautious approach as direct selling develops in China makes it di� cult to predict the timeline for obtaining these approvals. If the government’s evaluation of our direct selling activities results in further delays in obtaining licenses elsewhere, or if the current processes for obtaining approvals are delayed further for any reason or are changed or are interpreted di� erently than currently understood, our ability to receive direct selling licenses in China and our growth prospects in this market, could be negatively impacted.
We also face lengthy timelines with respect to product registra-tions in China. The registration process may be particularly di� cult for nutrition products classifi ed as health foods. The process for obtaining product permits and licenses may require extended periods of time that may prevent us from being able to launch new product initiatives in China on the same timelines as other markets around the world.
If we are unable to e� ectively manage our rapid growth in China, our operations could be harmed.
We have experienced rapid growth in China, which could strain our ability to e� ectively manage our operations. We continue to focus re-sources to successfully manage the necessary expansion of our man-agement team, labor force, manufacturing operations, government relations e� orts, and stores and service centers. Insu� cient management of such growth could result in, among other things, product delays or shortages, operating mistakes and errors, inadequate customer service, inappropriate claims or promotions by our sales force, and governmental inquires and investigations, all of which could harm our revenue and ability to generate sustained growth and result in unanticipated expenses. In addition, we will need to continue to attract and develop qualifi ed management personnel to sustain growth in this market. If we are not able to successfully retain existing personnel and identify, hire and integrate new personnel, our business and growth prospects could be harmed.
Our business could be negatively impacted if we fail to execute our product launch process due to increased pressure on our supply chain, information systems and management.
Although our product launch process may vary by market, we generally introduce new products to our distributors and consumers in all markets where the products are registered, through limited-time o� ers in connection with global and regional distributor events. The limited-time o� ers typically generate signifi cant distributor activity and a high level of purchasing, which may result in a higher than nor-mal increase in revenue during the quarter of the limited-time o� er and skew year-over-year and sequential comparisons. We typically make a new product generally available within a year following the regional limited-time o� ers. We currently anticipate that the size of these limited-time o� ers may increase as our Actives grow and the percentage of Actives participating in these limited-time o� ers in-creases. However, we cannot be sure whether these limited-time of-fers will continue to generate distributor interest and participation, or
what the short- and long-term impact will be on our business. We may experience di� culty e� ectively managing growth associated with these limited-time o� ers. In addition, the size and condensed schedule of these global product launches increases pressure on our supply chain. If we are unable to accurately forecast sales levels in each market, obtain su� cient ingredients or produce a su� cient sup-ply to meet global demand, we may incur higher expedited shipping costs and we may experience stockouts, which could negatively im-pact the enthusiasm of our distributors and consumers. Conversely, if we over forecast demand for a global product launch, we could incur increased inventory write-o� s. Our order processing systems could have di� culties handling the high volume of orders generated by limited-time o� ers. Although our previous limited-time o� ers have not materially a� ected our product return rate, these events may in-crease our product return rate in the future.
If our Pharmanex BioPhotonic Scanner or Galvanic Spa Systems, including our recently launched Body Spa, are determined to be medical devices in a particular geographic market or if our distributors use these products for medical purposes or make improper medical claims, our ability to continue to market and distribute such tools could be harmed.
One of our strategies is to market unique and innovative products and tools that allow our distributors to distinguish our products, including the Galvanic Spa System and the Pharmanex BioPhotonic Scanner. Any determination by regulatory authorities in our markets that these prod-ucts must be registered as medical devices could restrict our ability to import or sell the product in such market until registration is obtained. While we have not been required to register these products as med-ical devices in most of our markets, we were required to register our Galvanic Spa System as a medical device in Indonesia, Thailand and Colombia. There have been legislative proposals in Singapore and Malaysia relating to the regulation of medical devices that could a� ect the way we market the Galvanic Spa System and the Pharmanex BioPhotonic Scanner in these countries.
The United States Food and Drug Administration (the “FDA”) has refused admission of shipments of our Galvanic Spa facial units because the FDA believes it may require clearance as a medical device. While we disagree with the FDA’s position, we have elected to suspend further imports of Galvanic Spa facial units. In September 2012, we fi led an application for clearance of an alternative facial spa unit as a low-level medical device. We currently anticipate that this process could take nine months to a year or longer. If we face delays or chal-lenges in getting clearance or resolving the matter with the FDA, or if we cease selling existing inventory or do not have su� cient inven-tory to sell while we work through these issues with the FDA, our results in the United States could be negatively impacted. In addition, if our distributors are making medical claims regarding our products or are using our products to perform medical diagnoses or other activities

17
limited to licensed professionals or approved medical devices, it could negatively impact our ability to market or sell such products.
Where necessary, obtaining medical device registrations and clearances could require us to provide documentation concerning product manufacturing and clinical utility, to make design, specifi cation and manufacturing process modifi cations to meet standards imposed on medical device companies, and to modify our marketing claims regarding the registered product. While we have successfully registered the Galvanic Spa facial unit as a medical device in Indonesia, Thailand and Colombia, because medical device regulations vary widely from country to country, there can be no assurance we will not face chal-lenges or delays in obtaining clearance in other markets, including the United States, or that we will be able to make any required modifi cations or provide documentation necessary to obtain clearance. If we obtain such medical device clearance in order to sell a product in one market, such clearance may be used as precedent for requiring similar approval in another market. Such additional requirements could negatively impact the cost associated with manufacturing and selling the Galvanic Spa System as a non-medical device in those markets.
Laws and regulations may prohibit or severely restrict direct selling and cause our revenue and profi tability to decline, and regulators could adopt new regulations that harm our business.
Various government agencies throughout the world regulate direct sales practices. Laws and regulations in Japan, South Korea and China are particularly burdensome. These laws and regulations are generally intended to prevent fraudulent or deceptive schemes, often referred to as “pyramid” schemes, that compensate participants primarily for recruiting additional participants without signifi cant emphasis on product sales. The laws and regulations in our current markets often:
• impose order cancellations, product returns, inventory buy-backs and cooling-o� rights for distributors and consumers;
• require us, or our distributors, to register with government agencies;
• impose caps on the amount of commissions we can pay;
• impose reporting requirements; and
• require that we ensure, among other things, that our distribu-tors maintain levels of product sales to qualify to receive com-missions and that our distributors are being compensated for sales of products and not for recruiting others.
Complying with these widely varying and sometimes inconsistent rules and regulations can be di� cult and may require signifi cant resources. The laws and regulations governing direct selling are modifi ed
from time to time, and, like other direct selling companies, we are subject from time to time to government investigations in our various markets related to our direct selling activities. This can require us to make changes to our business model and aspects of our sales compen-sation plan in the markets impacted by such changes and investigations. In addition, countries where we currently do business could change their laws or regulations to prohibit direct selling. If we are unable to continue business in existing markets or commence operations in new markets because of these laws, our revenue and profi tability may decline.
Challenges to the form of our network marketing system could harm our business.
We may be subject to challenges by government regulators regarding the form of our network marketing system. Legal and regu-latory requirements concerning the direct-selling industry generally do not include “bright line” rules and are inherently fact-based and subject to interpretation. As a result, regulators and courts have discretion in their application of these laws and regulations, and the enforcement or interpretation of these laws and regulations by governmental agencies or courts can change. We could also be subject to challenges by private parties in civil actions. We are aware of recent civil actions against some of our competitors in the United States, including one involving a signifi cant settlement. Recent allegations by short-sellers regarding the legality of multi-level marketing have also created intense public scrutiny of our industry.
From time to time, we receive formal and informal inquiries from various government regulatory authorities about our business and our compliance with local laws and regulations. If we are not able to resolve regulatory reviews to the satisfaction of the applicable governmental agencies, or there are any new regulatory challenges or civil actions regarding our business or others in our industry, our business could be harmed if our network marketing program is found not to be in compliance with applicable law or regulations, such actions result in the imposition of any fi nes or damages on our business, create adverse publicity, increase scrutiny of our industry, detrimen-tally a� ect our e� orts to recruit or motivate distributors and attract consumers, or interpret laws in a manner inconsistent with our current business practices.
Government regulations relating to the marketing and advertising of our products and services may restrict, inhibit or delay our ability to sell our products and harm our business.
Government authorities regulate advertising and product claims regarding the e� cacy and benefi ts of our products. These regulatory authorities typically require adequate and reliable scien-tifi c substantiation to support any marketing claims. What constitutes such reliable scientifi c substantiation can vary widely from market to market and there is no assurance that the research and development e� orts that we undertake to support our claims will be deemed ade-
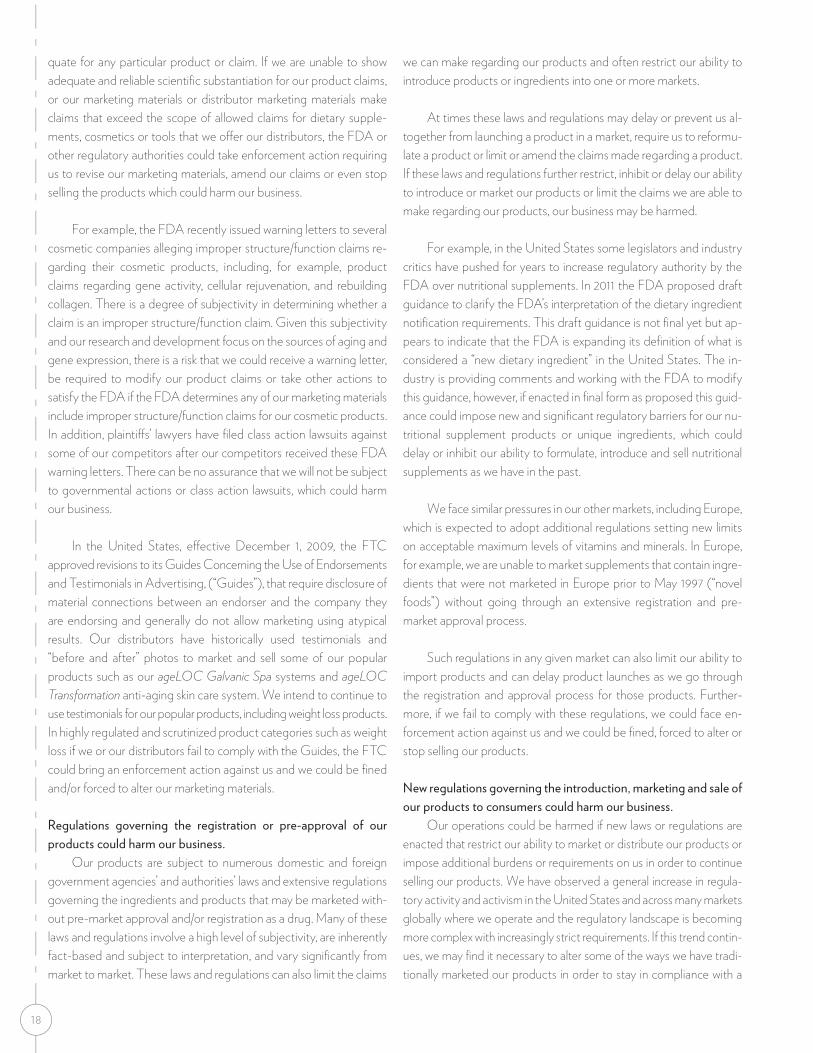
18
quate for any particular product or claim. If we are unable to show adequate and reliable scientifi c substantiation for our product claims, or our marketing materials or distributor marketing materials make claims that exceed the scope of allowed claims for dietary supple-ments, cosmetics or tools that we o� er our distributors, the FDA or other regulatory authorities could take enforcement action requiring us to revise our marketing materials, amend our claims or even stop selling the products which could harm our business.
For example, the FDA recently issued warning letters to several cosmetic companies alleging improper structure/function claims re-garding their cosmetic products, including, for example, product claims regarding gene activity, cellular rejuvenation, and rebuilding collagen. There is a degree of subjectivity in determining whether a claim is an improper structure/function claim. Given this subjectivity and our research and development focus on the sources of aging and gene expression, there is a risk that we could receive a warning letter, be required to modify our product claims or take other actions to satisfy the FDA if the FDA determines any of our marketing materials include improper structure/function claims for our cosmetic products. In addition, plainti� s’ lawyers have fi led class action lawsuits against some of our competitors after our competitors received these FDA warning letters. There can be no assurance that we will not be subject to governmental actions or class action lawsuits, which could harm our business.
In the United States, e� ective December 1, 2009, the FTC approved revisions to its Guides Concerning the Use of Endorsements and Testimonials in Advertising, (“Guides”), that require disclosure of material connections between an endorser and the company they are endorsing and generally do not allow marketing using atypical results. Our distributors have historically used testimonials and “before and after” photos to market and sell some of our popular products such as our ageLOC Galvanic Spa systems and ageLOC Transformation anti-aging skin care system. We intend to continue to use testimonials for our popular products, including weight loss products. In highly regulated and scrutinized product categories such as weight loss if we or our distributors fail to comply with the Guides, the FTC could bring an enforcement action against us and we could be fi ned and/or forced to alter our marketing materials.
Regulations governing the registration or pre-approval of our products could harm our business.
Our products are subject to numerous domestic and foreign government agencies’ and authorities’ laws and extensive regulations governing the ingredients and products that may be marketed with-out pre-market approval and/or registration as a drug. Many of these laws and regulations involve a high level of subjectivity, are inherently fact-based and subject to interpretation, and vary signifi cantly from market to market. These laws and regulations can also limit the claims
we can make regarding our products and often restrict our ability to introduce products or ingredients into one or more markets.
At times these laws and regulations may delay or prevent us al-together from launching a product in a market, require us to reformu-late a product or limit or amend the claims made regarding a product. If these laws and regulations further restrict, inhibit or delay our ability to introduce or market our products or limit the claims we are able to make regarding our products, our business may be harmed.
For example, in the United States some legislators and industry critics have pushed for years to increase regulatory authority by the FDA over nutritional supplements. In 2011 the FDA proposed draft guidance to clarify the FDA’s interpretation of the dietary ingredient notifi cation requirements. This draft guidance is not fi nal yet but ap-pears to indicate that the FDA is expanding its defi nition of what is considered a “new dietary ingredient” in the United States. The in-dustry is providing comments and working with the FDA to modify this guidance, however, if enacted in fi nal form as proposed this guid-ance could impose new and signifi cant regulatory barriers for our nu-tritional supplement products or unique ingredients, which could delay or inhibit our ability to formulate, introduce and sell nutritional supplements as we have in the past.
We face similar pressures in our other markets, including Europe, which is expected to adopt additional regulations setting new limits on acceptable maximum levels of vitamins and minerals. In Europe, for example, we are unable to market supplements that contain ingre-dients that were not marketed in Europe prior to May 1997 (“novel foods”) without going through an extensive registration and pre-market approval process.
Such regulations in any given market can also limit our ability to import products and can delay product launches as we go through the registration and approval process for those products. Further-more, if we fail to comply with these regulations, we could face en-forcement action against us and we could be fi ned, forced to alter or stop selling our products.
New regulations governing the introduction, marketing and sale of our products to consumers could harm our business.
Our operations could be harmed if new laws or regulations are enacted that restrict our ability to market or distribute our products or impose additional burdens or requirements on us in order to continue selling our products. We have observed a general increase in regula-tory activity and activism in the United States and across many markets globally where we operate and the regulatory landscape is becoming more complex with increasingly strict requirements. If this trend contin-ues, we may fi nd it necessary to alter some of the ways we have tradi-tionally marketed our products in order to stay in compliance with a

19
changing regulatory landscape and this could add to the costs of our operations and/or have an adverse impact on our business.
Our operations could be harmed if we are found not to be in com-pliance with Good Manufacturing Practices.
In the United States, FDA regulations on Good Manufacturing Practices and Adverse Event Reporting requirements for the nutri-tional supplement industry require us and our vendors to maintain good manufacturing processes, including stringent vendor qualifi ca-tions, ingredient identifi cation, manufacturing controls and record keeping. The ingredient identifi cation requirement, which requires us to confi rm the levels, identity and potency of ingredients listed on our product labels within a narrow range, is particularly burdensome and di� cult for us with respect to a product like LifePak Nano, which con-tains as many as 36 di� erent ingredients. We are also required to re-port serious adverse events associated with consumer use of our products. Our operations could be harmed if regulatory authorities make determinations that we, or our vendors, are not in compliance with these regulations or public reporting of adverse events harms our reputation for quality and safety. A fi nding of noncompliance may result in administrative warnings, penalties or actions impacting our ability to continue selling certain products. In addition, compli-ance with these regulations has increased and may further increase the cost of manufacturing certain of our products as we work with our vendors to assure they are qualifi ed and in compliance.
The loss of suppliers or shortages in ingredients could harm our business.
We acquire ingredients and products from two suppliers that each currently manufactures a signifi cant portion of our Nu Skin per-sonal care products. In addition, we currently rely on two suppliers for a majority of our Pharmanex nutritional supplement products. A loss of any of these suppliers and any di� culties in fi nding or transitioning to alternative suppliers could harm our business. In addition, we obtain some of our products, including our ageLOC Galvanic Spa systems, from sole suppliers that own or control the product formulations, in-gredients, or other intellectual property rights associated with such products. We also license the right to distribute some of our products from third parties. In the event we are unable to renew these contracts, we may need to discontinue some products or develop substitute products, which could harm our revenue. In addition, if we experience supply shortages or regulatory impediments with respect to the raw materials and ingredients we use in our products, we may need to seek alternative supplies or suppliers and may experience di� culties in fi nd-ing ingredients that are comparable in quality and price. Some of our nutritional products, including g3 juice, incorporate natural products that are only harvested once a year and may have limited supplies. If demand exceeds forecasts, we may have di� culties in obtaining ad-ditional supplies to meet the excess demand until the next growing
season. If we are unable to successfully respond to such issues, our business could be harmed.
Product diversion to certain markets, including China, may have a negative impact on our business.
From time to time, we see our products being sold through online or other distribution channels in certain markets. Although we have taken steps to try to control this activity, particularly for products sold in China, product diversion continues to be a challenge. Product diver-sion causes confusion regarding our distribution channels and nega-tively impacts our distributors’ ability to sell our products. It also creates a negative impression regarding the viability of the business opportu-nity for our distributors and sales representatives, which can harm our ability to recruit new distributors and sales representatives. Product diversion schemes may also involve illegal importation, investment or other activities. If we are unable to e� ectively address this issue or if diversion increases, our business could be harmed.
Changes to our sales compensation plan could be viewed nega-tively by some distributors, could fail to achieve desired long-term results and have a negative impact on revenue.
Our sales compensation plan includes some components that di� er from market to market. We modify components of our sales compensation plan from time to time to keep our sales compensation plan competitive and attractive to existing and potential distributors, to address changing market dynamics, to provide incentives to dis-tributors that we believe will help grow our business, to conform to local regulations and to address other business needs. Because of the size of our distributor force and the complexity of our sales compensa-tion plan, it is di� cult to predict how such changes will be viewed by distributors and whether such changes will achieve their desired results. For example, certain changes we made to our sales compensation plan in the past, which were successful in several markets, did not achieve anticipated results in certain other markets and negatively impacted our business.
Production di� culties, quality control problems and inaccurate forecasting could harm our business.
Production di� culties and quality control problems and our reliance on third party suppliers to deliver quality products in a timely manner could harm our business. Occasionally, we have experienced production di� culties with respect to our products, including the import or export of ingredients and delivery of products that do not meet our specifi cations and quality control standards. These quality problems have in the past, and could in the future, result in stock outages or shortages in our markets with respect to such products, harming our sales and creating inventory write-o� s for unusable products.

20
Adverse publicity concerning our business, marketing plan, products or people could harm our business and reputation.
Growth in our distributors and consumers and our results of operations can be particularly impacted by adverse publicity regarding us, the nature of our sales network, our products or the actions of our distributors and employees. Specifi cally, we are susceptible to adverse publicity concerning:
• suspicions about the legality and ethics of network marketing;
• the safety or e� ectiveness of ingredients in our or our com-petitors’ products;
• recent allegations that four of our products contained lead amounts in excess of amounts that would require consumer warnings in California under Proposition 65;
• regulatory investigations of us, our competitors and our respective products;
• the actions of our current or former distributors and employees; and
• public perceptions of the direct selling industry or the nutritional or personal care industry generally.
In addition, in the past we have experienced negative publicity that has harmed our business in connection with regulatory investiga-tions and inquiries. Critics of our industry, short sellers and other indi-viduals who want to pursue an agenda, have in the past and may in the future utilize the Internet, the press and other means to publish criticisms of the industry, our company and our competitors, or make allegations regarding our business and operations, or the business and operations of our competitors. We or others in our industry may receive similar negative publicity or allegations in the future, and it may harm our business and reputation.
Non-compliance with anti-corruption laws could harm our business. Our international operations are subject to anti-corruption laws,
including the Foreign Corrupt Practices Act (the “FCPA”). Any allegations that we are not in compliance with anti-corruption laws may require us to dedicate time and resources to an internal investi-gation of the allegations or may result in a government investigation. Any determination that our operations or activities are not in compli-ance with existing anti-corruption laws or regulations could result in the imposition of substantial fi nes, and other penalties. Although we have implemented anti-corruption policies, controls and training globally to protect against violation of these laws, we cannot be certain that these e� orts will be e� ective. We are aware that one of
our competitors is under investigation in the United States for allega-tions that its employees violated the FCPA in China and other markets. If this investigation causes adverse publicity or increased scrutiny of our industry, our business could be harmed.
Our ability to conduct business in international markets may be a� ected by political, legal, tax and regulatory risks.
Our ability to capitalize on growth in new international markets and to maintain the current level of operations in our existing interna-tional markets is exposed to risks associated with our international operations, including:
• the possibility that a foreign government might ban or severely restrict our business method of direct selling, or that local civil unrest, political instability or changes in diplomatic or trade relationships might disrupt our operations in an international market;
• the lack of well-established or reliable legal systems in certain areas where we operate;
• the presence of high infl ation in the economies of international markets in which we operate;
• the possibility that a government authority might impose legal, tax or other fi nancial burdens on us or our distributors, due, for example, to the structure of our operations in various markets;
• the possibility that a government authority might challenge the status of our distributors as independent contractors or impose employment or social taxes on our distributors; and
• the possibility that governments may impose currency remit-tance restrictions limiting our ability to repatriate cash.
We depend on our key personnel, and the loss of the services pro-vided by any of our executive o� cers or other key employees could harm our business and results of operations.
Our success depends to a signifi cant degree upon the continued contributions of our senior and regional management, many of whom would be di� cult to replace. We currently have expatriates serving in key management positions in certain markets, including Japan. Our senior and regional management employees may voluntarily termi-nate their employment with us at any time. In addition, we will need to continue to attract and develop qualifi ed management personnel to sustain growth in our markets. If we are not able to successfully retain existing personnel and identify, hire and integrate new personnel, our business and growth prospects could be harmed.

21
Inability of products and other initiatives to gain or maintain distributor and market acceptance could harm our business.
Our operating results could be adversely a� ected if our business opportunities and incentives, products and other initiatives do not generate su� cient enthusiasm and economic incentive to retain our existing distributors or to sponsor new distributors on a sustained basis. Factors that could a� ect our ability to continue to introduce new products include, among others, government regulations, the inability to attract and retain qualifi ed research and development sta� , the termination of third-party research and collaborative arrangements, proprietary protections of competitors that may limit our ability to o� er comparable products and the di� culties in antici-pating changes in consumer tastes and buying preferences. In addition, in our more mature markets, one of the challenges we face is keeping Sales Leaders with established businesses and high income levels motivated and actively engaged in business building activities and in developing new Sales Leaders. There can be no assurance that our initiatives will continue to generate excitement among our distributors in the long-term or that planned initiatives will be successful in maintaining distributor activity and productivity or in motivating Sales Leaders to remain engaged in business building and develop-ing new Sales Leaders. Some initiatives may have unanticipated negative impacts on our distributors, particularly changes to our sales compensation plan. The introduction of a new product or key initia-tive can also negatively impact other product lines to the extent our Sales Leaders focus their e� orts on the new product or initiative. In addition, if any of our products fail to gain distributor acceptance, we could see an increase in returns.
The loss of key distributors could negatively impact our growth and our revenue.
As of December 31, 2012, we had a global network of nearly 950,000 Actives. More than 51,000 of our Actives were Sales Leaders. Less than 1,000 Sales Leaders occupied the highest distributor level under our global sales compensation plan as of that date. These Sales Leaders, together with their extensive sales networks, generate substantially all of our revenue. As a result, the loss of a high-level Sales Leader or a group of leading Sales Leaders, whether by their own choice or through disciplinary actions by us for violations of our policies and procedures, could negatively impact our growth and our revenue.
Government authorities may question our tax positions or transfer pricing policies or change their laws in a manner that could increase our e� ective tax rate or otherwise harm our business.
As a U.S. company doing business in international markets through subsidiaries, we are subject to various tax and intercompany pricing laws, including those relating to the fl ow of funds between our company and our subsidiaries. From time to time, we are audited by tax regulators in the United States and in our foreign markets. If regu-lators challenge our tax positions, corporate structure, transfer pricing
mechanisms or intercompany transfers, we may be subject to fi nes and payment of back taxes, our e� ective tax rate may increase and our operations may be harmed. Tax rates vary from country to coun-try, and, if tax authorities determine that our profi ts in one jurisdiction may need to be increased, we may not be able to fully utilize all for-eign tax credits that are generated, which will increase our e� ective tax rate. For example, our federal corporate income tax rate in the United States is 35%. If our profi tability in a higher tax jurisdiction, such as Japan where our tax rate in 2012 was approximately 46%, in-creases disproportionately to the rest of our business, our e� ective tax rate may increase. The various customs, exchange control and transfer pricing laws are continually changing and are subject to the interpretation of government agencies. We have experienced in-creased e� orts by customs authorities in some countries to reclassify our products or otherwise increase the level of duties we pay on our products. Despite our e� orts to be aware of and comply with such laws, and changes to and interpretations thereof, there is a risk that we may not continue to operate in compliance with such laws. We may need to adjust our operating procedures in response to such chang-es, and as a result, our business may su� er. In addition, due to the in-ternational nature of our business, we are subject from time to time to reviews and audits by foreign taxing authorities of other jurisdictions in which we conduct business throughout the world.
We may be held responsible for certain taxes or assessments relating to the activities of our distributors, which could harm our fi nancial condition and operating results.
Our distributors are subject to taxation, and in some instances, legislation or governmental agencies impose an obligation on us to collect taxes, such as value added taxes, and to maintain appropriate records. In addition, we are subject to the risk in some jurisdictions of being responsible for social security and similar taxes with respect to our distributors. In the event that local laws and regulations or the interpretation of local laws and regulations change to require us to treat our independent distributors as employees, or that our distributors are deemed by local regulatory authorities in one or more of the jurisdictions in which we operate to be our employees rather than independent contractors under existing laws and interpretations, we may be held responsible for social security and related taxes in those jurisdictions, plus any related assessments and penalties, which could harm our fi nancial condition and operating results. If our distributors were deemed to be employees rather than independent contractors, we would also face the threat of increased vicarious liability for their actions.
The loss of or a disruption in our manufacturing and distribution operations could adversely a� ect our business.
As of December 31, 2012, our principal properties consist of distri-bution centers where o� ces are located and where fi nished merchandise is packed and shipped to distributors in fulfi llment of their orders, our
22
worldwide headquarters, three research and development facilities and manufacturing facilities and approximately 40 stores in China. Addition-ally, we also use third party manufacturers to manufacture certain of our products. As a company engaged in manufacturing, distribution and research and development on a global scale, we are subject to the risks inherent in such activities, including industrial accidents, environmental events, fi res, strikes and other labor or industrial disputes, disruptions in logistics or information systems, loss or impairment of key manufactur-ing or distribution sites, product quality control, safety, licensing require-ments and other regulatory or government issues, as well as natural disasters, pandemics, border disputes, acts of terrorism and other ex-ternal factors over which we have no control. For example, the earthquake and tsunami in 2011 disrupted our operations in Japan and negatively impacted our operating results. These risks may be exacerbated by our e� orts to increase facility consolidation covering our manufacturing, distribution and supply footprints or if we are unable to successfully enhance our disaster recovery planning. The loss of, or damage to, any of our facilities or centers, or that of our third party manufacturers could have a material adverse e� ect on our business, results of operations and fi nancial condition.
Disruptions to transportation channels that we use to distribute our products to international warehouses may adversely a� ect our margins and profi tability in those markets.
We may experience disruptions to the transportation channels used to distribute our products, including increased airport and ship-ping port congestion, a lack of transportation capacity, increased fuel expenses, and a shortage of manpower. Disruptions in our container shipments may result in increased costs, including the additional use of airfreight to meet demand. Although we have not recently experi-enced signifi cant shipping disruptions, we continue to watch for signs of upcoming congestion. Congestion to ports can a� ect previously negotiated contracts with shipping companies, resulting in unexpect-ed increases in shipping costs and reduction in our net sales.
Our markets are intensely competitive, and market conditions and the strengths of competitors may harm our business.
The markets for our products are intensely competitive. Our results of operations may be harmed by market conditions and com-petition in the future. Many competitors have much greater name recognition and fi nancial resources than we have, which may give them a competitive advantage. For example, our Nu Skin products compete directly with branded, premium retail products. We also compete with other direct selling organizations. Because of regula-tory restrictions concerning claims about the e� cacy of personal care products and dietary supplements, we may have di� culty dif-ferentiating our products from our competitors’ products, and com-peting products entering the personal care and nutritional market could harm our revenue.
We also compete with other direct selling companies to attract and retain our distributors and consumers. Some of these competi-tors have a longer operating history and greater visibility, name rec-ognition and fi nancial resources than we do. Some of our competi-tors have also adopted and could continue to adopt some of our successful business strategies, including our global sales compensa-tion plan. Consequently, to successfully compete in this industry, and attract and retain our distributors and consumers, we must en-sure that our business opportunities and sales compensation plan is fi nancially rewarding. We believe we have signifi cant competitive advantages, but we cannot assure that we will be able to continue to successfully compete in this industry.
We may incur product liability claims that could harm our business.
We sell products for human consumption and use. Our dietary supplement products consist of vitamins, minerals and botanicals and other ingredients that are classifi ed as foods or dietary supple-ments. Our personal care products are cosmetic and other beautify-ing products intended to be used on the body and skin. These prod-ucts are not generally subject to pre-market approval or registration processes so we cannot rely upon a government safety panel to qualify or approve our products for use, and some ingredients may not have long histories of human consumption or use. We rely upon published and unpublished safety information including clinical studies on ingredients used in our products and conduct our own clinical studies on some key ingredients and products, but not all products. A product may be safe for the general population when consumed or used as directed but could cause an adverse reaction for a person who has a health condition or allergies, or who is taking a prescription medication. While we include what we believe are ad-equate instructions and warnings and we have historically had low numbers of reported reactions, previously unknown adverse reac-tions could occur.
As a result of the type of products that we sell we may be sub-ject to various product liability claims, including that the products failed to meet quality or manufacturing specifi cations, contain con-taminants, include inadequate instructions as to their proper use, or the products include inadequate warnings concerning side e� ects and interactions with other substances or for persons with health conditions or allergies. Product liability claims could increase our costs, and adversely a� ect our business and fi nancial results. As we continue to o� er an increasing number of new products through larger scale limited-time o� ers our product liability risk may increase.
If our distributors or employees provide improper or inappro-priate advice regarding our products, their appropriate use or safety, we may be subject to additional product liability.

23
We have elected to self-insure our product liability risks. We continue to periodically evaluate whether we can and should obtain product liability insurance. Based upon our current approach to product liability risk management if any of our products are found to cause any injury or damage or we become subject to product liabil-ity claims, we will be subject to the full amount of liability associated with any injuries or damages. This liability could be substantial and may exceed our existing reserves and harm our business.
We are involved, and may become involved in the future, in legal proceedings that, if adversely adjudicated or settled, could adversely a� ect our fi nancial results.
We are and may in the future become party to litigation. In gen-eral, litigation claims can be expensive and time consuming to bring or defend against and could result in settlements or damages that could signifi cantly a� ect fi nancial results. We are currently vigorously contesting certain of these litigation claims. However, it is not possible to predict the fi nal resolution of the litigation to which we currently are or may in the future become party to, and the impact of certain of these matters on our business, results of operations and fi nancial con-dition could be material.
We are currently involved in two separate disputes with customs authorities in Japan with respect to duty assessments on several of our Pharmanex nutritional products. The fi rst dispute relates to ad-ditional customs assessments made by Yokohama Customs for the period of October 2002 through June 2005. In March 2011, the Tokyo District Court upheld the additional assessments. As a result of this decision, we recorded an expense for the full amount of the disputed assessments, or $32.8 million, in the fi rst quarter of 2011. We appealed the matter to the Tokyo High Court, which upheld the decision of the Tokyo District Court in November 2012. We continue to disagree with this decision and have appealed the matter to the Supreme Court of Japan. The second dispute in Japan relates to additional customs as-sessments made by Yokohama Customs for the period of October 2006 through September 2009 in connection with post-importation audits, as well as the disputed portion of our import duties from Oc-tober 2009 to the present, which we have or will hold in bond or pay under protest. The aggregate amount of these assessments and dis-puted duties was 4.0 billion Japanese yen as of December 31, 2012 (approximately $46.7 million), net of any recovery of consumption taxes. In addition, we are currently being required to post a bond or make a deposit equal to the di� erence between our declared duties and the amount the customs authorities have determined we should be paying on all current imports. We are now pursuing this matter in Tokyo District Court. Any adverse rulings in these matters could ma-terially impact our results. Please refer to Item 3. “Legal Proceedings” for more information regarding these litigation matters.
In addition, our intellectual property may infringe on the rights of others, resulting in costly litigation. In recent years, there has been sig-nifi cant litigation in the United States involving patents and other intel-lectual property rights. In particular, there has been an increase in the fi ling of suits alleging infringement of intellectual property rights, which pressure defendants into entering settlement arrangements quickly to dispose of such suits, regardless of their merit. Other companies or individuals may allege that we, or our distributors, consumers, licensees or other parties indemnifi ed by us infringe on their intellectual prop-erty rights. Even if we believe that such claims are without merit, de-fending such intellectual property litigation can be costly, distract management’s attention and resources, and the outcome is inher-ently uncertain. Claims of intellectual property infringement also might require us to redesign a� ected products, enter into costly settlement or license agreements, pay costly damage awards, or face a temporary or permanent injunction prohibiting us from marketing or selling certain of our products. Any of these results may adversely a� ect our fi nancial condition.
If we are unable to protect our intellectual property rights, our ability to compete could be negatively impacted.
The market for our products depends to a signifi cant extent upon the value associated with our product innovations and our brand equity. We rely upon patent, copyright, trademark and trade secret laws in the United States and similar laws in other countries, and non-disclosure, confi dentiality and other types of agreements with our employees, distributors, consumers, suppliers and other par-ties, to establish, maintain and enforce our intellectual property rights. Despite these measures, any of our intellectual property rights could be challenged, invalidated, circumvented or misappropriated, or such intellectual property rights may not be su� cient to permit us to pro-vide competitive advantages, which could result in costly product redesign e� orts, discontinuance of certain product o� erings or other competitive harm. In addition, the laws of certain foreign countries, including emerging markets such as China, may not protect our intel-lectual property rights to the same extent as the laws of the United States. The costs required to protect our patents and trademarks may be substantial. We have fi led patent applications to protect our intellectual property rights in our new technologies, however, there can be no assurance that our patent applications will be approved, that any patents issued will adequately protect our intellectual prop-erty, or that such patents will not be challenged by third parties or found by a judicial authority to be invalid or unenforceable. Moreover, many of our products rely on technologies developed or licensed by third parties, and we may not be able to obtain or continue to obtain licenses and technologies from these third parties on reasonable terms or at all.
To enforce and protect our intellectual property rights, we may initiate litigation against third parties, such as patent infringement

24
suits or interference proceedings. Any lawsuits that we initiate could be expensive, take signifi cant time and divert management’s atten-tion from other business concerns. Litigation also puts our patents at risk of being invalidated or interpreted narrowly and our patent ap-plications at risk of not issuing. Additionally, we may provoke third parties to assert claims against us. We may not prevail in any lawsuits that we initiate and the damages or other remedies awarded, if any, may not be commercially valuable. The occurrence of any of these events may adversely a� ect our fi nancial condition.
If we are unable to protect the confi dentiality of our proprietary information and know-how, the value of our products could be adversely a� ected.
In addition to patented technology, we rely on our unpatented proprietary technology, trade secrets, processes and know-how. De-spite these measures, any of our intellectual property rights could be challenged, invalidated, circumvented or misappropriated. We gen-erally seek to protect this information by confi dentiality, non-disclo-sure and assignment of invention agreements with our employees, consultants, scientifi c advisors and third parties. Our employees may leave to work for competitors. These agreements may be breached, and we may not have adequate remedies for any such breach. In ad-dition, our trade secrets may be disclosed to or otherwise become known or be independently developed by competitors. To the extent that our current or former employees, consultants or contractors use intellectual property owned by others in their work for us, disputes may arise as to the rights in related or resulting know-how and inven-tions. If, for any of the above reasons, our intellectual property is dis-closed or misappropriated, it would harm our ability to protect our rights and adversely a� ect our fi nancial condition.
We may be subject to claims that we, or our employees, have inadvertently or otherwise used or disclosed alleged trade secrets or other proprietary information of our employees’ former employers.
We employ individuals who were previously employed at other personal care product or nutritional supplement companies, including our competitors or potential competitors. To the extent that our em-ployees are involved in research areas that are similar to those in which they were involved with their former employers, we may be subject to claims that such employees have inadvertently or otherwise used or disclosed the alleged trade secrets or other proprietary information of the former employers. Litigation may be necessary to defend against such claims.
Any future acquisitions may expose us to additional risks. From time to time we review acquisition prospects that would
complement our current product o� erings, increase the size and geographic scope of our operations or otherwise o� er growth and operating e� ciency opportunities. The fi nancing for any of these ac-
quisitions could dilute the interests of our stockholders, result in an increase in our indebtedness or both. Acquisitions may entail numer-ous risks, including:
• di� culties in assimilating acquired operations or products, including the loss of key employees from acquired businesses and disruption to our direct selling channel;
• diversion of management’s attention from our core business;
• adverse e� ects on existing business relationships with our sup-pliers, distributors and consumers; and
• risks of entering markets in which we have limited or no prior experience.
Our failure to successfully complete the integration of any acquired business could have a material adverse e� ect on our business, fi nancial condition and operating results. In addition, there can be no assurance that we will be able to identify suitable acquisition candidates or consummate acquisitions on favorable terms
Any failure of our internal controls over fi nancial reporting or our compliance e� orts could harm our stock price and our fi nancial and operating results or could result in fi nes or penalties.
We have implemented internal controls to help ensure the accu-racy of our fi nancial reporting and have implemented compliance poli-cies and programs to help ensure that our employees and distributors comply with applicable laws and regulations. Our internal audit team regularly audits our internal controls and various aspects of our business and we regularly assess the e� ectiveness of our internal controls. There can be no assurance, however, that these internal or external assessments and audits will identify all signifi cant or material weaknesses in our inter-nal controls. Any failure to correct a weakness in internal controls could result in the disclosure of a material weakness. If a material weakness results in a material misstatement in our fi nancial results, we may also have to restate our fi nancial statements.
From time to time, we initiate further investigations into our business operations based on the results of these audits or complaints, questions, or allegations made by employees or other parties regarding our business practices and operations. In addition, our business and operations may be investigated by applicable government authorities. In the event any of these investigations identify material violations of applicable laws by our employees or our distributors, we could be subject to adverse pub-licity, fi nes, penalties or loss of licenses or permits.
System failures could harm our business. With global operations and a complex sales compensation plan,
our business is highly dependent on e� ciently functioning informa-

25
tion technology systems. Our systems may be damaged or disrupted by fi res, fl oods, earthquakes or other natural disasters, telecommuni-cations failures, break-ins, sabotage, intentional acts of vandalism and similar misconduct. We have adopted and implemented a Business Continuity/Disaster Recovery Plan. Our data is archived and stored at third-party secure sites and we have recovery sites for certain criti-cal data and operations. Growth in our business could also strain our systems. There can be no assurance that our systems will not be sig-nifi cantly damaged or disrupted or that our systems will be adequate to meet our future business needs.
Epidemics and other crises could negatively impact our business. Due to the person-to-person nature of direct selling, our results
of operations could be harmed if the fear of a communicable and rap-idly spreading disease or other crises such as natural disasters result in travel restrictions or cause people to avoid group meetings or gather-ings or interaction with other people. For example, a SARS epidemic in Asia negatively impacted our revenue in 2003. It is di� cult to pre-dict the impact on our business, if any, of a recurrence of SARS, the emergence of new epidemics, or other crises. In addition, most of our Pharmanex nutritional supplement revenue is generated from prod-ucts that are encapsulated in bovine- and/or porcine-sourced gel cap-sules. If we experience production di� culties, quality control prob-lems, or shortages in supply in connection with bovine or porcine related health concerns, this could result in additional risk of product shortages or write-o� s of inventory. We may be unable to introduce our products in some markets if we are unable to obtain the necessary regulatory approvals or if any product ingredients are prohibited, which could harm our business.
The market price of our Class A common stock is subject to signifi cant fl uctuations due to a number of factors that are beyond our control.
Our Class A common stock closed at $30.08 per share on January 31, 2011 and closed at $42.36 per share on January 31, 2013. During this two-year period, our Class A common stock traded as low as $27.50 per share and as high as $62.02 per share. Many factors, including some we may be unable to control, could cause the market price of our Class A common stock to fall. Some of these factors include:
• fl uctuations in our quarterly operating results;
• the sale of shares of Class A common stock by signifi cant stockholders;
• general trends in the market for our products;
• acquisitions by us or our competitors;
• economic or currency exchange issues in markets in which we operate;
• changes in estimates of our operating performance or changes in recommendations by securities analysts;
• speculative trading, including short selling and options trading;
• rumors or publicity related to our business, products or indus-try; and
• general business and political conditions.
Broad market fl uctuations could also lower the market price of our Class A common stock regardless of our actual operating performance.

26
ITEM 1B. UNRESOLVED STAFF COMMENTS
None.
ITEM 2. PROPERTIES
Our principal properties consist of the following:
Operational Facilities. These facilities include administrative o� ces, walk-in centers, and warehouse/distribution centers. Our operational facilities measuring 30,000 square feet or more include the following:
• our worldwide headquarters in Provo, Utah;
• our worldwide distribution center/warehouse in Provo, Utah; and
• our distribution center in Tokyo, Japan.
Manufacturing Facilities. Each of our manufacturing facilities measure 30,000 square feet or more, and include the following:
• our nutritional supplement manufacturing facility in Zhejiang Province, China;
• our personal care manufacturing facility in Shanghai, China;
• our VitaMeal manufacturing facility in Jixi, Heilongjiang Province, China;
• our herbal extraction facility in Zhejiang Province, China;
• our scanner assembly and maintenance facility in Shanghai, China.
Stores. As of December 31, 2012, we operated approximately 40 stores throughout China.
Research and Development Centers. We operate three research and development centers, one in Provo, Utah, one in Shanghai, China, and one in Beijing, China. In 2011, we began construction on state-of-the-art innovation centers at our corporate headquarters in Provo, Utah and our Greater China regional headquarters in Shanghai, China. We believe the Provo and Shanghai facilities will be substan-tially completed in 2013.
We own our corporate headquarters buildings, distribution center and research and development center located in Provo, Utah. We also own personal care and nutritional supplement plants in China, and a
few other minor facilities. We currently lease the other properties described above. We believe that our existing and planned facilities are adequate for our current operations in each of our existing markets.
ITEM 3. LEGAL PROCEEDINGS
JAPAN CUSTOMSWe are currently involved in two separate disputes with customs
authorities in Japan with respect to duty assessments on several of our Pharmanex nutritional products. The fi rst dispute relates to additional customs assessments made by Yokohama Customs for the period of October 2002 through June 2005. The dispute relates to whether we used the proper valuation method for these products in determining the applicable customs duties. The primary legal issue in the case is whether the relevant import transaction is a sale between our third party manufacturers and our Japan subsidiary, or a sale between our United States subsidiary and our Japan subsidiary. In 1999, we worked with the Yokohama Customs authorities to restructure the form of the relevant transactions in order to have the import transaction be a sale between our third party manufacturers and our Japan subsidiary, and thus have the duties assessed on the price paid to our third party man-ufacturers. With the input and guidance of the Yokohama Customs authorities, we restructured the form of the transaction and the agree-ments between the relevant parties based on these discussions so that our United States subsidiary would be acting on behalf of our Japan subsidiary with respect to the purchase of these products rather than as a buyer/seller. Our Japan subsidiary entered into a Memorandum of Understanding with each of our third party manufacturers of the relevant products, which provided that our Japan subsidiary was the purchaser of the products and that our United States subsidiary was acting for and on behalf of our Japan subsidiary with respect to these products. Our Japan subsidiary also entered into a Memorandum of Understanding with our United States subsidiary documenting the same agency rela-tionship. We believe that these legal documents establish that our United States subsidiary was acting as an agent and not buyer and seller of the relevant products. The additional assessment of duties by Yokohama Customs was based on its re-characterization of the transac-tion as a sale between our United States subsidiary and our Japan subsidiary for custom law purposes despite the legal form of the trans-action. We do not believe the legal documentation supports the re-characterization of these transactions. We fi led a complaint in the Tokyo District Court Civil Action Section in December 2006 to reverse the additional assessments. In March 2011, the Tokyo District Court denied our complaint and upheld the additional assessments. As a result of this decision, we recorded an expense for the full amount of the disputed assessments, or $32.8 million, in the fi rst quarter of 2011. The charge was a non-cash item, as we were previously required to pay the assessments. We appealed the matter to the Tokyo High Court, which upheld the decision of the Tokyo District Court in November 2012. We continue

27
to disagree with this decision and have appealed the matter to the Su-preme Court of Japan.
The second dispute relates to additional customs assessments made by Yokohama Customs for the period of October 2006 through Sep-tember 2009 in connection with post-importation audits, as well as the disputed portion of our import duties from October 2009 to the pres-ent, which we have or will hold in bond or pay under protest. The ag-gregate amount of these assessments and disputed duties was 4.0 billion Japanese yen as of December 31, 2012 (approximately $46.7 million), net of any recovery of consumption taxes. Additional assess-ments related to any prior period would be barred by applicable statutes of limitations. The issue in this case is whether a United States entity utilizing a commissionaire agent in Japan to import its products can use the manufacturer’s invoice or must use another valuation method, and, if an alternative method must be used, what the allowable deductions would be in determining the proper valuation. Following our review of the assessments and after consulting with our legal and customs advi-sors, we believe that the additional assessments are improper and are not supported by applicable customs laws. We fi led letters of protest with Yokohama Customs, which were rejected. We then appealed the matter to the Ministry of Finance in Japan. In May 2011, we received notice that the Ministry of Finance in Japan denied our administrative appeal. We disagree with the Ministry of Finance’s administrative deci-sion. We are now pursuing the matter in Tokyo District Court, which we believe will provide a more independent determination of the mat-ter. In addition, we are currently being required to post a bond or make a deposit equal to the di� erence between our declared duties and the amount the customs authorities have determined we should be paying on all current imports. Because we believe that the higher rate determined by the customs authorities is an improper application of the regulations, we are currently expensing the portion of the duties we believe is sup-ported under applicable customs law, and recording the additional
deposit or payment as a receivable within long-term assets on our con-solidated fi nancial statements. If we are unsuccessful in recovering the amounts assessed and paid, we will likely record a non-cash expense for the full amount of the disputed assessments.
LAZERSON, CRAIG & HARPERIn September 2011, Elizabeth Craig (“Craig”) and Brady Harper
(“Harper”) fi led suit against us and our subsidiaries in the Utah Fourth District Court for malicious prosecution, abuse of criminal process, defamation and intentional infl iction of emotional distress. In aggregate, the proposed complaint would seek damages in excess of approxi-mately $42 million and punitive damages in the amount of $200 million. We believe the complaint is without merit and intend to vigorously defend ourselves. In August 2011, we fi led suit in the Utah Fourth District Court against Scott Lazerson (“Lazerson”) and Nu Lite Sales, LLC (“Nu Lite”), an entity owned by Craig and Harper, alleging fraud, negligent misrepresentation, conversion and unjust enrichment and seeking declaratory and equitable relief. A counterclaim was fi led by Nu Lite that includes factual allegations similar to those set forth in the complaint fi led on behalf of Craig and Harper. The counterclaim alleges conversion and tortious interference with prospective business relations, and seeks aggregate damages in excess of $2 million and punitive damages in the amount of $20 million. We believe the counterclaim is without merit.
From time to time, we are involved in legal proceedings arising in the ordinary course of business. We believe that the resolution of these matters will not have a negative material e� ect on our consolidated fi nancial position, results of operations or liquidity.
ITEM 4. MINE SAFETY DISCLOSURES
Not applicable.

28
ITEM 5. MARKET FOR REGISTRANT’S COMMON EQUITY, RELATED STOCKHOLDER MATTERS AND ISSUER PURCHASES OF EQUITY SECURITIES
Our Class A common stock is listed on the New York Stock Exchange (“NYSE”) and trades under the symbol “NUS.” The following table is based upon the information available to us and sets forth the range of the high and low sales prices for our Class A common stock for the quarterly periods during 2011 and 2012 based upon quotations on the NYSE.
Quarter Ended High LowMarch 31, 2011 . . . . . . . . . . . . . . $ 33.08 $ 27.50
June 30, 2011 . . . . . . . . . . . . . . . 39.35 28.53
September 30, 2011 . . . . . . . . 46.93 35.44
December 31, 2011 . . . . . . . . . . 51.67 37.67
Quarter Ended High LowMarch 31, 2012 . . . . . . . . . . . . . . . $ 62.02 $ 45.50
June 30, 2012 . . . . . . . . . . . . . . . . 60.14 40.00
September 30, 2012 . . . . . . . . . 56.52 36.20
December 31, 2012 . . . . . . . . . . 49.01 32.36
The market price of our Class A common stock is subject to signifi cant fl uctuations in response to variations in our quarterly oper-ating results, general trends in the market for our products and product
candidates, economic and currency exchange issues in the foreign markets in which we operate and other factors, many of which are not within our control. In addition, broad market fl uctuations, as well as general economic, business, regulatory and political conditions may adversely a� ect the market for our Class A common stock, regardless of our actual or projected performance.
The closing price of our Class A common stock on January 31, 2013, was $42.36. The approximate number of holders of record of our Class A common stock as of January 31, 2013 was 542. This number of holders of record does not represent the actual number of benefi cial owners of shares of our Class A common stock because shares are frequently held in “street name” by securities dealers and others for the benefi t of individual owners who have the right to vote their shares.
DIVIDENDSWe declared and paid a $0.135 per share quarterly dividend
for Class A common stock in March and June 2011, a $0.16 per share quarterly dividend in September and December of 2011, and a $0.20 per share dividend for Class A common stock in March, June, September and December of 2012. The board of directors has approved an increased quarterly cash dividend of $0.30 per share of Class A common stock to be paid on March 13, 2013, to stockholders of record on February 22, 2013. Annually, this would increase the dividend to $1.20 from $0.80 in the prior year. Management believes that cash fl ows from operations will be su� cient to fund this and future dividend payments, if any.
PART II

29
We currently expect to continue to pay dividends on our common stock. However, the declaration of dividends is subject to the discretion of our board of directors and will depend upon various factors, including our net earnings, fi nancial condition, cash requirements, future prospects and other factors deemed relevant by our board of directors.
Purchases of Equity Securities by the Issuer (a) (b) (c) (d)
Period
Total Number of Shares
PurchasedAverage Price Paid per Share
Total Number of Shares Purchased as Part of Publicly Announced Plans or Programs
Approximate Dollar Value of Shares that may yet be
Purchased Under the Plans or Programs
(in millions)(1)
October 1 – 31, 2012 . . . . . . . . . . . . . . . 42,500 $ 39.94 42,500 $ 155.5
November 1 – 30, 2012 . . . . . . . . . . . . 175,000 44.27 175,000 144.4
December 1 – 31, 2012 . . . . . . . . . . . . . 280,000 44.31 280,000 135.3
Total . . . . . . . . . . . . . . . . . . . . . . . . . . . . . 497,500 43.92 497,500
(1) In August 1998, our board of directors approved a plan to repurchase $10.0 million of our Class A common stock on the open market or in private transactions. Our board
has from time to time increased the amount authorized under the plan and a total amount of approximately $735.0 million was authorized as of December 31, 2012. As of
December 31, 2012, we had repurchased approximately $599.7 million of shares under the plan. On May 1, 2012, our board of directors authorized a $250.0 million extension of
our ongoing share repurchase authorization, which is included in the total authorized. There has been no termination or expiration of the plan since the initial date of approval.

30
STOCK PERFORMANCE GRAPHSet forth below is a line graph comparing the cumulative total stockholder return (stock price appreciation plus dividends) on our Class A Common Stock with the cumulative total return of the S&P 500 Index, a market-weighted index of publicly traded peers (the “ Peer Group”) for the period from December 31, 2007 through December 31, 2012. The graph assumes that $100 was invested in each of the Class A Common Stock, the S&P 500 Index, and each of the indexes of publicly traded peers on December 31, 2007 and that all dividends were reinvested. The Peer Group consists of the following companies, which compete in our industry and product categories: Avon Products, Inc., Estee Lauder, Tupperware Corporation, Herbalife LTD., USANA Health Sciences, Inc., Nature’s Sunshine Products, Inc., Weight Watchers International, Inc., Mannatech, Inc. and Elizabeth Arden, Inc..
COMPARISON OF 5 YEAR CUMULATIVE TOTAL RETURNAmong Nu Skin Enterprises, Inc., the S&P 500 Index, and a PeerGroup
12/07 12/08 12/09 12/10 12/11 12/12
$ 350$ 300$ 250$ 200$150
$ 100$ 50
$ 0
DO
LLA
RS
NU SKIN ENTERPRISES, INC. S&P 500 PEERGROUP
Copyright© 2013 S&P, a division of The McGraw-Hill Companies Inc. All rights reserved.
Measured Period Company S&P 500 Index New Peer Group Index
December 31, 2007 $ 100.00 $ 100.00 $ 100.00
December 31, 2008 65.45 63.00 63.34
December 31, 2009 173.84 79.67 88.57
December 31, 2010 199.28 91.67 109.48
December 31, 2011 324.82 93.61 115.87
December 31, 2012 252.16 108.59 109.54

31
ITEM 6. SELECTED FINANCIAL DATA
The following selected consolidated fi nancial data as of and for the years ended December 31, 2008, 2009, 2010, 2011 and 2012 have been derived from the audited consolidated fi nancial statements.
Year Ended December 31,2008 2009 2010 2011 2012
(U.S. dollars in thousands, except per share data and cash dividends)
Income Statement Data:Revenue . . . . . . . . . . . . . . . . . . . . . . . . . . . . . . . . . . . . . . . . . . . . . . . . . . . . $ 1,247,646 $ 1,331,058 $ 1,537,259 $ 1,743,991 $ 2,169,664
Cost of sales . . . . . . . . . . . . . . . . . . . . . . . . . . . . . . . . . . . . . . . . . . . . . . . 228,597 243,648 272,431 322,624(1) 353,152
Gross profi t . . . . . . . . . . . . . . . . . . . . . . . . . . . . . . . . . . . . . . . . . . . . . . . . . 1,019,049 1,087,410 1,264,828 1,421,367 1,816,512
Operating expenses:Selling expenses . . . . . . . . . . . . . . . . . . . . . . . . . . . . . . . . . . . . . . . . . . 533,151 559,605 646,348 751,448 970,219
General and administrative expenses . . . . . . . . . . . . . . . . . . . . 360,470 369,368 401,418 436,177 505,449
Restructuring charges . . . . . . . . . . . . . . . . . . . . . . . . . . . . . . . . . . . . — 10,724 — — —
Total operating expenses . . . . . . . . . . . . . . . . . . . . . . . . . . . . . . . 893,621 939,697 1,047,766 1,187,625 1,475,668
Operating income . . . . . . . . . . . . . . . . . . . . . . . . . . . . . . . . . . . . . . . . . 125,428 147,713 217,062 233,742 340,844
Other income (expense), net . . . . . . . . . . . . . . . . . . . . . . . . . . . . . . (24,775) (6,589) (9,449) (6,973) 4,398
Income before provision for income taxes . . . . . . . . . . . . . . . . . 100,653 141,124 207,613 226,769 345,242
Provision for income taxes . . . . . . . . . . . . . . . . . . . . . . . . . . . . . . . . . 35,306 51,279 71,562 73,439 123,597
Net income . . . . . . . . . . . . . . . . . . . . . . . . . . . . . . . . . . . . . . . . . . . . . . . . . $ 65,347 $ 89,845 $ 136,051 $ 153,330 $ 221,645
Net income per share:Basic . . . . . . . . . . . . . . . . . . . . . . . . . . . . . . . . . . . . . . . . . . . . . . . . . . . . . . $ 1.03 $ 1.42 $ 2.18 $ 2.47 $ 3.66
Diluted . . . . . . . . . . . . . . . . . . . . . . . . . . . . . . . . . . . . . . . . . . . . . . . . . . . . $ 1.02 $ 1.40 $ 2.11 $ 2.38 $ 3.52
Weighted-average common shares outstanding (000s):Basic . . . . . . . . . . . . . . . . . . . . . . . . . . . . . . . . . . . . . . . . . . . . . . . . . . . . . . 63,510 63,333 62,370 62,066 60,600
Diluted . . . . . . . . . . . . . . . . . . . . . . . . . . . . . . . . . . . . . . . . . . . . . . . . . . . . 64,132 64,296 64,547 64,546 63,025
Balance Sheet Data (at end of period):Cash and cash equivalents and current investments . . . . . . $ 114,586 $ 158,045 $ 230,337 $ 290,701 $ 333,403
Working capital . . . . . . . . . . . . . . . . . . . . . . . . . . . . . . . . . . . . . . . . . . . . 124,036 152,731 206,078 288,916 279,300
Total assets . . . . . . . . . . . . . . . . . . . . . . . . . . . . . . . . . . . . . . . . . . . . . . . . . 709,772 748,449 892,224 990,956 1,152,907
Current portion of long-term debt . . . . . . . . . . . . . . . . . . . . . . . . 30,196 35,400 27,865 28,608 39,019
Long-term debt . . . . . . . . . . . . . . . . . . . . . . . . . . . . . . . . . . . . . . . . . . . . 158,760 121,119 133,013 107,944 154,963
Stockholders’ equity . . . . . . . . . . . . . . . . . . . . . . . . . . . . . . . . . . . . . . . . 316,180 375,687 471,249 574,236 590,612
Cash dividends declared . . . . . . . . . . . . . . . . . . . . . . . . . . . . . . . . . . . 0.44 0.46 0.50 0.59 0.80
Supplemental Operating Data (at end of period):Approximate number of Actives(2) . . . . . . . . . . . . . . . . . . . . . . . . 761,000 761,000 799,000 855,000 946,000
Number of Sales Leaders(3) . . . . . . . . . . . . . . . . . . . . . . . . . . . . . . . . 30,588 32,939 35,676 41,816 51,790
(1) Includes $32.8 million related to an adverse decision in the Japan customs litigation.(2) “Actives” are persons who purchased products directly from the company during the previous three months.(3) “Sales Leaders” are persons who have completed and who maintain specifi ed sales requirements. Sales Leaders include our independent distributors who have completed
and who maintain specifi ed sales requirements, and our sales employees and contractual sales promoters in China, who have completed certain qualifi cation requirements.

32
ITEM 7. MANAGEMENT’S DISCUSSION AND ANALYSIS OF FINANCIAL CONDITION AND RESULTS OF OPERATIONS
The following discussion of our fi nancial condition and results of operation should be read in conjunction with the Consolidated Financial Statements and related Notes thereto, which are included in this Annual Report on Form 10-K.
OVERVIEWWe are a leading, global direct selling company with operations
in 53 markets worldwide. We develop and distribute innovative, pre-mium-quality anti-aging personal care products and nutritional sup-plements under our Nu Skin and Pharmanex category brands, re-spectively. Over the last several years, we have introduced new Pharmanex nutritional supplements and Nu Skin personal care prod-ucts under our ageLOC anti-aging brand. We strive to secure com-petitive advantage in four key areas: our people, our products, the culture we promote, and the business opportunities we o� er. As of December 31, 2012, we had nearly 950,000 active distributors and consumers who purchased products directly from the company dur-ing the previous three months (“Actives”). More than 51,000 of our Actives were qualifi ed sales leaders (“Sales Leaders”), who are the core of our sales network and play a key role in the growth and devel-opment of our business. In 2012, we posted record revenue of $2.2 billion. Revenue in 2012 grew 24%, driven by sustained interest in our product portfolio, including our ageLOC anti-aging products, growth in Sales Leaders and Actives, and alignment around our product launch process. Approximately 89% of our 2012 revenue came from markets outside the United States. While we have be-come more geographically diverse over the past decade, Japan, our largest revenue market, accounted for approximately 23% of our 2012 total revenue. Due to the size of our foreign operations, our results are often impacted by foreign currency fl uctuations. In addition, our re-sults are generally impacted by global economic, political, demo-graphic and business trends and conditions.
Our revenue depends on the number and productivity of our Sales Leaders and Actives. We have been successful in attracting and motivating our distributors by:
• developing and marketing innovative, technologically and scientifi cally advanced products;
• providing compelling initiatives and strong support; and
• o� ering attractive incentives that motivate our distributors to build sales organizations.
Our distributors market and sell our products and recruit others based on the distinguishing benefi ts and innovative characteristics of our products. As a result, it is vital to our business that we continu-ously leverage our research and development resources to develop and introduce innovative products and provide our distributors with an attractive portfolio of products. Since 2008, we have successfully introduced a suite of innovative ageLOC anti-aging skin care and nu-tritional products, including our ageLOC Transformation daily skin care system, Galvanic Spa Gels with ageLOC, ageLOC Galvanic Spa Body Shaping Gel and ageLOC Dermatic E� ects Body Contouring Lotion, ageLOC Vitality and ageLOC R2 anti-aging nutritional supplements. We are developing additional ageLOC anti-aging products for the future, including a new ageLOC weight management system. We currently plan to introduce our new ageLOC weight management system in the second half of 2013. We also o� er unique initiatives, products, and business tools, such as our ageLOC Galvanic Spa Systems and Pharmanex BioPhotonic Scanner, to help distributors ef-fectively di� erentiate our earnings opportunity and product o� erings. Any delays or di� culties in introducing compelling products or attrac-tive initiatives or tools into our markets may have a negative impact on our revenue and our number of Actives and Sales Leaders.
Although our product launch process may vary by market, we generally introduce new products to our distributors and consumers in all markets where the products are registered, through limited-time o� ers in connection with global and regional distributor events. The limited-time o� ers typically generate signifi cant distributor activity and a high level of purchasing, which may result in a higher than normal increase in revenue during the quarter of the limited-time o� er and skew year-over-year and sequential comparisons. We believe our product launch process attracts new people to our business, driving growth in our Sales Leaders and Actives. For example, limited-time o� ers of ageLOC R2 and ageLOC Body Spa and related products in connection with a series of regional events generated approximately $122 million in our Greater China region and $68 million in our South Asia/Pacifi c region during the second and third quarters of 2012. We typically make a new product generally available within a year follow-ing the regional limited-time o� ers. We currently plan to introduce a new ageLOC weight management system in most of our markets through a global limited-time o� er in the second half of 2013, followed by regional limited-time o� ers in most of our markets during the fol-lowing year. We currently anticipate that the size of these limited-time o� ers may increase as our Actives grow and the percentage of Ac-tives participating in these limited-time o� ers increases. However, we cannot be sure whether these limited-time o� ers will continue to gen-erate distributor interest and participation, or what the short- and long-term impact will be on our business. We may experience di� -culty e� ectively managing growth associated with these limited-time o� ers. In addition, the size and condensed schedule of these global product launches increases pressure on our supply chain. If we are un-

33
able to accurately forecast sales levels in each market, obtain su� cient ingredients or produce a su� cient supply to meet global demand, we may incur higher expedited shipping costs and we may experience stockouts, which could negatively impact the enthusiasm of our distributors and consumers. Conversely, if we over forecast demand for a global product launch, we could incur increased inventory write-o� s. Our order processing systems could also have di� culties handling the high volume of orders generated by limited-time o� ers. Although our previous limited-time o� ers have not materially a� ected our product return rate, these events may increase our product return rate in the future.
Our global sales network helps us to rapidly introduce products and penetrate our markets with modest up-front promotional expense. Similar to other companies in our industry, we experience a high level of turnover among our distributors. As a result, it is impor-tant that we regularly introduce innovative and compelling products and initiatives in order to maintain a compelling business opportunity that will attract new people to our business. We have also developed, and continue to promote in many of our markets, product subscription and loyalty programs that provide incentives for consumers to commit to purchase a specifi c amount of products on a monthly basis. All
purchases under these programs are subject to our standard product payment and return policies. We believe these subscription and loy-alty programs have improved consumer retention, have had a stabiliz-ing impact on revenue, and have helped generate recurring sales. Subscription and loyalty programs represented 58% of our non-limit-ed-time o� er revenue in 2012.
Our business is subject to various laws and regulations globally, particularly with respect to network marketing activities, cosmetics, and nutritional supplements. Accordingly, we face certain risks, includ-ing any improper claims or activities of our distributors or any inability to obtain or maintain necessary product registrations.
INCOME STATEMENT PRESENTATIONWe report revenue in fi ve geographic regions and we translate reve-nue from each market’s local currency into U.S. dollars using weight-ed-average exchange rates. The following table sets forth revenue information by region for the periods indicated. This table should be reviewed in connection with the tables presented under “Results of Operations,” which disclose selling expenses and other costs associ-ated with generating the aggregate revenue presented.
REVENUE BY REGIONYear Ended December 31,
(U.S. dollars in millions) 2010 2011 2012North Asia . . . . . . . . . . . . . . . . . . . . . . . . . . . . . . . . . . . . . . . . . . . . . . $ 686.1 45% $ 751.2 43% $ 794.8 37%
Greater China . . . . . . . . . . . . . . . . . . . . . . . . . . . . . . . . . . . . . . . . . 268.2 17 341.9 20 570.7 26
South Asia/Pacifi c . . . . . . . . . . . . . . . . . . . . . . . . . . . . . . . . . . . . . 182.8 12 236.2 14 330.3 15
Americas . . . . . . . . . . . . . . . . . . . . . . . . . . . . . . . . . . . . . . . . . . . . . . . 250.0 16 252.0 14 288.7 13
EMEA . . . . . . . . . . . . . . . . . . . . . . . . . . . . . . . . . . . . . . . . . . . . . . . . . . 150.2 10 162.7 9 185.2 9
$ 1,537.3 100% $ 1,744.0 100% $ 2,169.7 100%
Cost of sales primarily consists of:
• cost of products purchased from third-party vendors, generally in U.S. dollars;
• costs of self-manufactured products;
• cost of sales materials which we sell to distributors at or near cost;
• amortization expenses associated with certain products and services such as the Pharmanex BioPhotonic Scanners that are leased to distributors;
• f reight cost of shipping products to distributors and import du-ties for the products; and
• royalties and related expenses for licensed technologies.
We source the majority of our products from third-party manu-facturers located in the United States. Due to Chinese government restrictions on the importation of fi nished goods applicable to the current scope of our business in China, we are required to manufac-ture the bulk of our own products for distribution in China. Cost of sales and gross profi t, on a consolidated basis, may fl uctuate as a re-sult of changes in the ratio between self-manufactured products and products sourced from third-party suppliers. In addition, because we purchase a signifi cant majority of our goods in U.S. dollars and recog-nize revenue in local currencies, our gross margin is subject to ex-

34
change rate risks. Because our gross margins vary from product to product and due to higher pricing in some markets such as Japan, changes in product mix and geographic revenue mix can impact our gross margin, on a consolidated basis.
Selling expenses are our most signifi cant expense and are classi-fi ed as operating expenses. Selling expenses include sales commis-sions paid to our distributors, costs for incentive trips and other re-wards, as well as wages, benefi ts, bonuses and other labor and unemployment expenses we pay to our sales force in China. Our global sales compensation plan, which we employ in all our markets, except China, is an important factor in our ability to attract and retain distributors. Under our global sales compensation plan, Sales Lead-ers can earn “multi-level” compensation, where they earn commis-sions for product sales to their consumer groups as well as the prod-uct sales made through the sales network they have developed and trained. We do not pay commissions on sales materials, which are sold to distributors at or near cost. Small fl uctuations occur in the amount of commissions paid as the network of distributors actively purchasing products changes from month to month. However, with nearly 950,000 Actives and 51,000 Sales Leaders, the fl uctuation in the overall payout is relatively small. The overall compensation has typically averaged between 41% and 45% of global product sales. From time to time, we make modifi cations and enhancements to our global sales compensation plan in an e� ort to help motivate distribu-tors and develop leadership characteristics, which can have an impact on selling expenses.
Distributors also have the opportunity to make profi ts by pur-chasing products from us at a discount and selling them to consum-ers with a mark-up. We do not account for nor pay additional com-missions on these mark-ups received by distributors. In many markets, we also allow individuals who are not distributors, whom we refer to as “preferred customers,” to buy products directly from us at a discount. We pay commissions on preferred customer purchases to the refer-ring distributors.
General and administrative expenses include:
• wages and benefi ts;
• rents and utilities;
• depreciation and amortization;
• promotion and advertising;
• professional fees;
• travel;
• research and development; and
• other operating expenses.
Labor expenses are the most signifi cant portion of our general and administrative expenses. Promotion and advertising expenses include costs of distributor conventions held in various markets worldwide, which we expense in the period in which they are incurred. Because our various distributor conventions are not held during each fi scal year, or in the same period each year, their impact on our gen-eral and administrative expenses may vary from year to year and from quarter to quarter. For example, we held our global convention in October 2011 and will have another global convention in the fall of 2013 as we currently plan to hold a global convention every other year. In addition, we hold regional conventions and conventions in our major markets at di� erent times during the year. These conventions have signifi cant expenses associated with them. Because we have not incurred expenses for these conventions during every fi scal year or in comparable interim periods, year-over-year comparisons have been impacted accordingly.
Provision for income taxes depends on the statutory tax rates in each of the jurisdictions in which we operate. For example, statutory tax rates in 2012 were approximately 16.5% in Hong Kong, 17% in Tai-wan, 24.2% in South Korea, 46.1% in Japan and 25% in China. We are subject to taxation in the United States at the statutory corporate federal tax rate of 35% and we pay taxes in multiple states within the United States at various tax rates. Our overall e� ective tax rate was 35.8% for the year ended December 31, 2012.
CRITICAL ACCOUNTING POLICIESThe following critical accounting policies and estimates should be read in conjunction with our audited Consolidated Financial State-ments and related Notes thereto. Management considers our critical accounting policies to be the recognition of revenue, accounting for income taxes, accounting for intangible assets and accounting for stock-based compensation. In each of these areas, management makes estimates based on historical results, current trends and future projections.
Revenue. We recognize revenue when products are shipped, which is when title and risk of loss pass to our independent distribu-tors and preferred customers who are our consumers. With some exceptions in various countries, we o� er a return policy whereby dis-tributors can return unopened and unused product for up to 12 months subject to a 10% restocking fee. Reported revenue is net of returns, which have historically been less than 5% of annual revenue. A reserve for product returns is accrued based on historical experi-ence. We classify selling discounts as a reduction of revenue. Our selling expenses include commissions paid under our global sales

35
compensation plan, which is focused on remunerating distributors based primarily upon the selling e� orts of the distributors and/or the volume of products purchased by their sales organization, and not their personal purchases.
Through our product subscription and loyalty programs, which can vary from market to market, participants who commit to purchase on a monthly basis receive a discount from suggested retail or whole-sale prices, as applicable. We apply this discount at the time of each purchase and not through a larger discount on the initial purchase. Participants may cancel their commitment at any time, however some markets charge a one-time early cancellation fee. All purchases under these programs are subject to our standard product payment and return policies. In accordance with ASC 605-50, we classify sell-ing discounts and rebates, as a reduction of revenue at the time the sale is recorded.
Income Taxes. We account for income taxes in accordance with the Income Taxes Topic of the Financial Accounting Standards Cod-ifi cation. These standards establish fi nancial accounting and report-ing standards for the e� ects of income taxes that result from an en-terprise’s activities during the current and preceding years. We take an asset and liability approach for fi nancial accounting and reporting of income taxes. We pay income taxes in many foreign jurisdictions based on the profi ts realized in those jurisdictions, which can be sig-nifi cantly impacted by terms of intercompany transactions among our a� liates around the world. Deferred tax assets and liabilities are created in this process. As of December 31, 2012, we had net deferred tax assets of $35.6 million. These net deferred tax assets assume suf-fi cient future earnings will exist for their realization, as well as the con-tinued application of current tax rates. In certain foreign jurisdictions valuation allowances have been recorded against the deferred tax assets specifi cally related to use of net operating losses. When we determine that there is su� cient taxable income to utilize the net op-erating losses, the valuation allowances will be released. In the event we were to determine that we would not be able to realize all or part of our net deferred tax assets in the future, an adjustment to the de-ferred tax assets would be charged to earnings in the period such determination was made.
We fi le income tax returns in the U.S. federal jurisdiction, and in various state and foreign jurisdictions. During 2011, we entered into a closing agreement with the United States Internal Revenue Service (the “IRS”) for all adjustments for the 2005 through 2008 tax years. As a result of entering into the closing agreement, we are no longer subject to tax examinations from the IRS for years before 2009. With a few exceptions, we are no longer subject to state and local income tax examination by tax authorities for the years before 2005. In 2009, we entered into a voluntary program with the IRS called Compliance Assurance Process (“CAP”). The objective of CAP is to contempo-
raneously work with the IRS to achieve federal tax compliance and resolve all or most of the issues prior to fi ling of the tax return. We have elected to participate in the CAP program for 2013 and may elect to continue participating in CAP for future tax years; we may withdraw from the program at any time. In major foreign jurisdictions, we are no longer subject to income tax examinations for years before 2006. Along with the IRS examination, we are currently under ex-amination in certain foreign jurisdictions; however, the outcomes of those reviews are not yet determinable.
At December 31, 2012, we had $9.0 million in unrecognized tax benefi ts of which $3.8 million, if recognized, would a� ect the e� ective tax rate. In comparison, at December 31, 2011, we had $7.4 million in unrecognized tax benefi ts of which $3.1 million, if recognized, would a� ect the e� ective tax rate. During each of the years ended Decem-ber 31, 2011 and 2012 we recognized approximately $(0.8) million and $0.3 million in interest and penalties expenses/(benefi ts), respective-ly. We had approximately $1.6 million, $0.8 million and $1.1 million of accrued interest and penalties related to uncertain tax positions at December 31, 2010, 2011 and 2012, respectively. Interest and penal-ties related to uncertain tax positions are recognized as a component of income tax expense.
We are subject to regular audits by federal, state and foreign tax authorities. These audits may result in additional tax liabilities. We ac-count for such contingent liabilities in accordance with relevant ac-counting standards and believe we have appropriately provided for income taxes for all years. Several factors drive the calculation of our tax reserves. Some of these factors include: (i) the expiration of vari-ous statutes of limitations; (ii) changes in tax law and regulations; (iii) issuance of tax rulings; and (iv) settlements with tax authorities. Changes in any of these factors may result in adjustments to our re-serves, which would impact our reported fi nancial results.
Intangible Assets. Acquired intangible assets may represent in-defi nite-lived assets, determinable-lived intangibles, or goodwill. Of these, only the costs of determinable-lived intangibles are amortized to expense over their estimated life. The value of indefi nite-lived in-tangible assets and residual goodwill is not amortized, but is tested at least annually for impairment. Our impairment testing for goodwill is performed separately from our impairment testing of indefi nite-lived intangibles. We test goodwill for impairment, at least annually, by re-viewing the book value compared to the fair value at the reportable unit level. We test individual indefi nite-lived intangibles at least annu-ally by reviewing the individual book values compared to the fair val-ue. Considerable management judgment is necessary to measure fair value. We did not recognize any impairment charges for goodwill or intangible assets during the periods presented.

36
2012 COMPARED TO 2011
OVERVIEWRevenue in 2012 increased 24% to $2.2 billion from $1.7 billion in
2011. Our revenue growth in 2012 was driven by sustained interest in our product portfolio, including our ageLOC anti-aging products, as well as growth in our Sales Leaders and Actives. Since 2008, we have successfully introduced a suite of innovative ageLOC anti-aging skin care and nutritional products, including our ageLOC Transformationanti-aging skin care system, ageLOC Edition Galvanic Spa System II, Galvanic Spa Gels with ageLOC, and ageLOC Vitality nutritional supplement. Limited-time o� ers of ageLOC R2 and ageLOC Body Spa and related products in connection with a series of regional events generated approximately $122 million in our Greater China region and $68 million in our South Asia/Pacifi c region during the second and third quarters of 2012. We currently plan to introduce an ageLOC weight management system in most of our markets through a global limited-time o� er in the second half of 2013, followed by regional limited-time o� ers in most of our markets during the following year. Foreign currency exchange fl uctuations had a 1% negative impact on revenue in 2012 compared to 2011. Globally, our Sales Leaders and Actives grew 24% and 11%, respectively, compared to the prior-year period.
Earnings per share in 2012 increased to $3.52, compared to $2.38 in 2011, or $2.69 excluding charges of $32.8 million associated with the 2011 Japan customs ruling, discussed below under Gross Profi t, on a diluted basis. Earnings per share excluding Japan customs expense is a non-GAAP fi nancial measure. See “Non-GAAP Financial Measures” below. The increase in earnings is largely the result of increased revenue, as discussed above, coupled with improved margins and controlled expenses.
REVENUENorth Asia. The following table sets forth revenue for the North Asia region and its principal markets (U.S. dollars in millions):
2011 2012 ChangeJapan . . . . . . . . . . . . . . $ 472.5 $ 497.3 5%
South Korea . . . . . . . 278.7 297.5 7%
North Asia total . . . $ 751.2 $ 794.8 6%
Foreign currency fl uctuations negatively impacted revenue by less than 1% in this region compared to the prior-year period.
Excluding the impact of foreign currency fl uctuations, revenue in Japan increased 6% in 2012, compared to 2011. This growth was
RESULTS OF OPERATIONSThe following table sets forth our operating results as a percentage of revenue for the periods indicated::
Year Ended December 31,2010 2011 2012
Revenue . . . . . . . . . . . . . . . . . . . . . . . . . . . . . . . . . . . . . . . . . . . . . . . . . . . . . . . . . 100.0% 100.0% 100.0%
Cost of sales . . . . . . . . . . . . . . . . . . . . . . . . . . . . . . . . . . . . . . . . . . . . . . . . . . . . 17.7 18.5* 16.3
Gross profi t . . . . . . . . . . . . . . . . . . . . . . . . . . . . . . . . . . . . . . . . . . . . . . . . . . . . . . 82.3 81.5 83.7
Operating expenses:Selling expenses . . . . . . . . . . . . . . . . . . . . . . . . . . . . . . . . . . . . . . . . . . . . . . . 42.1 43.1 44.7
General and administrative expenses . . . . . . . . . . . . . . . . . . . . . . . . . 26.1 25.0 23.3
Total operating expenses . . . . . . . . . . . . . . . . . . . . . . . . . . . . . . . . . . . . . . . 68.2 68.1 68.0
Operating income . . . . . . . . . . . . . . . . . . . . . . . . . . . . . . . . . . . . . . . . . . . . . . 14.1 13.4 15.7
Other income (expense), net . . . . . . . . . . . . . . . . . . . . . . . . . . . . . . . . . . . (0.6) (0.4) 0.2
Income before provision for income taxes . . . . . . . . . . . . . . . . . . . . . 13.5 13.0 15.9
Provision for income taxes . . . . . . . . . . . . . . . . . . . . . . . . . . . . . . . . . . . . . . 4.6 4.2 5.7
Net income . . . . . . . . . . . . . . . . . . . . . . . . . . . . . . . . . . . . . . . . . . . . . . . . . . . . . . 8.9% 8.8% 10.2%
* Includes $32.8 million related to an adverse decision in the Japan customs litigation.
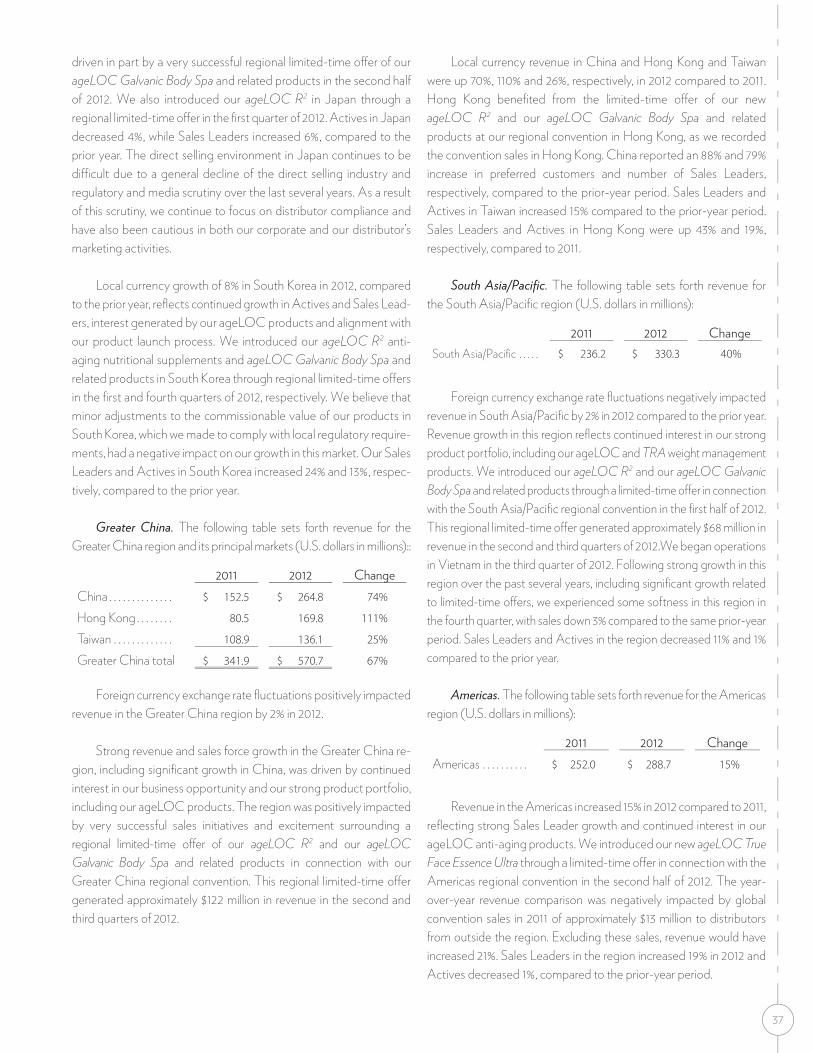
37
driven in part by a very successful regional limited-time o� er of our ageLOC Galvanic Body Spa and related products in the second half of 2012. We also introduced our ageLOC R2 in Japan through a regional limited-time o� er in the fi rst quarter of 2012. Actives in Japan decreased 4%, while Sales Leaders increased 6%, compared to the prior year. The direct selling environment in Japan continues to be di� cult due to a general decline of the direct selling industry and regulatory and media scrutiny over the last several years. As a result of this scrutiny, we continue to focus on distributor compliance and have also been cautious in both our corporate and our distributor’s marketing activities.
Local currency growth of 8% in South Korea in 2012, compared to the prior year, refl ects continued growth in Actives and Sales Lead-ers, interest generated by our ageLOC products and alignment with our product launch process. We introduced our ageLOC R2 anti-aging nutritional supplements and ageLOC Galvanic Body Spa and related products in South Korea through regional limited-time o� ers in the fi rst and fourth quarters of 2012, respectively. We believe that minor adjustments to the commissionable value of our products in South Korea, which we made to comply with local regulatory require-ments, had a negative impact on our growth in this market. Our Sales Leaders and Actives in South Korea increased 24% and 13%, respec-tively, compared to the prior year.
Greater China. The following table sets forth revenue for the Greater China region and its principal markets (U.S. dollars in millions)::
2011 2012 ChangeChina . . . . . . . . . . . . . . $ 152.5 $ 264.8 74%
Hong Kong . . . . . . . . 80.5 169.8 111%
Taiwan . . . . . . . . . . . . . 108.9 136.1 25%
Greater China total $ 341.9 $ 570.7 67%
Foreign currency exchange rate fl uctuations positively impacted revenue in the Greater China region by 2% in 2012.
Strong revenue and sales force growth in the Greater China re-gion, including signifi cant growth in China, was driven by continued interest in our business opportunity and our strong product portfolio, including our ageLOC products. The region was positively impacted by very successful sales initiatives and excitement surrounding a regional limited-time o� er of our ageLOC R2 and our ageLOC Galvanic Body Spa and related products in connection with our Greater China regional convention. This regional limited-time o� er generated approximately $122 million in revenue in the second and third quarters of 2012.
Local currency revenue in China and Hong Kong and Taiwan were up 70%, 110% and 26%, respectively, in 2012 compared to 2011. Hong Kong benefi ted from the limited-time o� er of our new ageLOC R2 and our ageLOC Galvanic Body Spa and related products at our regional convention in Hong Kong, as we recorded the convention sales in Hong Kong. China reported an 88% and 79% increase in preferred customers and number of Sales Leaders, respectively, compared to the prior-year period. Sales Leaders and Actives in Taiwan increased 15% compared to the prior-year period. Sales Leaders and Actives in Hong Kong were up 43% and 19%, respectively, compared to 2011.
South Asia/Pacifi c. The following table sets forth revenue for the South Asia/Pacifi c region (U.S. dollars in millions):
2011 2012 ChangeSouth Asia/Pacifi c . . . . . $ 236.2 $ 330.3 40%
Foreign currency exchange rate fl uctuations negatively impacted revenue in South Asia/Pacifi c by 2% in 2012 compared to the prior year. Revenue growth in this region refl ects continued interest in our strong product portfolio, including our ageLOC and TRA weight management products. We introduced our ageLOC R2 and our ageLOC Galvanic Body Spa and related products through a limited-time o� er in connection with the South Asia/Pacifi c regional convention in the fi rst half of 2012. This regional limited-time o� er generated approximately $68 million in revenue in the second and third quarters of 2012.We began operations in Vietnam in the third quarter of 2012. Following strong growth in this region over the past several years, including signifi cant growth related to limited-time o� ers, we experienced some softness in this region in the fourth quarter, with sales down 3% compared to the same prior-year period. Sales Leaders and Actives in the region decreased 11% and 1% compared to the prior year.
Americas. The following table sets forth revenue for the Americas region (U.S. dollars in millions):
2011 2012 ChangeAmericas . . . . . . . . . . $ 252.0 $ 288.7 15%
Revenue in the Americas increased 15% in 2012 compared to 2011, refl ecting strong Sales Leader growth and continued interest in our ageLOC anti-aging products. We introduced our new ageLOC True Face Essence Ultra through a limited-time o� er in connection with the Americas regional convention in the second half of 2012. The year-over-year revenue comparison was negatively impacted by global convention sales in 2011 of approximately $13 million to distributors from outside the region. Excluding these sales, revenue would have increased 21%. Sales Leaders in the region increased 19% in 2012 and Actives decreased 1%, compared to the prior-year period.

38
EMEA. The following table sets forth revenue for the Europe, Middle East and Africa (“EMEA”) region (U.S. dollars in millions):
2011 2012 ChangeEMEA . . . . . . . . . . . . . $ 162.7 $ 185.2 14%
Foreign currency exchange rate fl uctuations negatively impacted revenue in EMEA by 9% in 2012 compared to the prior year. Local currency revenue growth of 23% in EMEA during 2012 refl ects robust growth in Sales Leaders and Actives and continued interest in our strong product portfolio, including our ageLOC products. We introduced our ageLOC Galvanic Body Spa and related products and ageLOC R2
in the majority of our markets in the EMEA region through limited-time-o� ers in fi rst and second halves of 2012, respectively. Our Sales Leaders and Actives in EMEA increased by 21% and 9% when compared to 2011.
GROSS PROFITGross profi t as a percentage of revenue in 2012 increased to 83.7%
compared to 81.5% in 2011. In March 2011, the Tokyo District Court upheld a disputed $32.8 million customs assessment on certain of our products imported into Japan. As a result of this decision, we record-ed an expense within cost of sales for the full amount of the disputed assessments in the fi rst quarter of 2011. Excluding this $32.8 million non-cash charge, gross profi t as a percentage of revenue for 2011 was 83.4%. Gross profi t excluding Japan customs expense is a non-GAAP fi nancial measure. See “Non-GAAP Financial Measures” below. We anticipate that our gross profi t as a percentage of revenue will be ap-proximately 83.6% in 2013.
SELLING EXPENSESSelling expenses increased as a percentage of revenue at 44.7%
in 2012 compared to 43.1% in 2011. This increase refl ects a higher commission percentage associated with Sales Leaders achieving larger monthly volumes during our limited-time-o� ers, sales network growth resulting in a higher number of Sales Leaders achieving sales incentive trips, and expenses associated with achievement of special incentive targets in Greater China and South Asia. We currently anticipate that our selling expenses as a percentage of revenue may increase in connection with limited-time o� ers in the second half of 2013.
GENERAL AND ADMINISTRATIVE EXPENSESAlthough our general and administrative expenses increased by
$69.2 million, compared to the prior-year, as we grew our operations to support the growth of our business, general and administrative ex-penses decreased as a percentage of revenue to 23.3% in 2012 from 25.0% in 2011. This decrease is due primarily to our revenue growing at a faster rate than our general and administrative expenses.
OTHER INCOME (EXPENSE), NETOther income (expense), net was $4.4 million of income in 2012
compared to $7.0 million of expense in 2011. The decrease in expense was due primarily to the impact of changes in foreign currency ex-change rates. Because it is impossible to predict foreign currency fl uctuations, we cannot estimate the degree to which our other in-come expense will be impacted in the future. Other income (ex-pense), net also included approximately $5.2 million and $4.8 million in interest expense during 2012 and 2011, respectively.
PROVISION FOR INCOME TAXESProvision for income taxes increased to $123.6 million in 2012 from $73.4 million in 2011. The e� ective tax rate increased to 35.8% in 2012 from 32.4% of pre-tax income in 2011. The lower income tax rate in 2011 was primarily attributable to a one-time discrete tax benefi t of $7.7 million associated with the e� ective settlement of an IRS audit for tax years 2005 – 2008. We anticipate our tax rate will be approximately 35.2% to 35.7% in 2013.
NET INCOMEAs a result of the foregoing factors, net income increased to $221.6 million compared to $153.3 million in 2011, or $173.8 million excluding $32.8 million (approximately $20.5 million, net of tax) in expense in 2011 associated with an adverse ruling in our Japan customs matter. Net income excluding Japan customs expense is a non-GAAP fi nancial measure. See “Non-GAAP Financial Measures” below.
2011 COMPARED TO 2010
OVERVIEWRevenue in 2011 increased 13% to $1.74 billion from $1.54 billion in
2010. Our revenue growth in 2011 was driven by sustained interest in our product portfolio, including our ageLOC anti-aging products, as well as growth in our Sales Leaders and Actives and continued growth in our emerging markets, including China, South Asia and South Korea. We introduced our ageLOC R2 anti-aging nutritional supplements and our ageLOC Galvanic Body Spa together with our ageLOC Galvanic Spa Body Shaping Gel and ageLOC Dermatic E� ects Body Contouring Lotion through limited-time o� ers in connection with our global convention in the fourth quarter of 2011. These limited-time o� ers of ageLOC R2
and ageLOC Galvanic Body Spa with its associated products generated over $78 million and $18 million, respectively, in the fourth quarter of 2011. Foreign currency exchange fl uctuations had a 6% positive impact on revenue in 2011 compared to 2010. Our Sales Leaders and Actives globally grew 17% and 7%, respectively, compared to the prior-year period.
Earnings per share in 2011 increased to $2.38, or $2.69 excluding non-cash charges of $32.8 million associated with the fi rst quarter Japan customs ruling, discussed below under Gross Profi t, compared to $2.11

39
in 2010 on a diluted basis. Earnings per share excluding Japan customs expense is a non-GAAP fi nancial measure. See “Non-GAAP Finan-cial Measures” below. The increase in earnings was largely the result of increased revenue, as discussed above, coupled with improved margins and controlled expenses.
REVENUENorth Asia. The following table sets forth revenue for the North Asia region and its principal markets (U.S. dollars in millions):
2010 2011 ChangeJapan . . . . . . . . . . . . . . $ 471.4 $ 472.5 *
South Korea . . . . . . . 214.7 278.7 30%
North Asia total . . . $ 686.1 $ 751.2 9%
* Change less than 1%
Foreign currency fl uctuations positively impacted revenue by 8% in this region compared to the prior-year period.
Excluding the impact of foreign currency fl uctuations, revenue in Japan decreased 9% in 2011 compared to 2010. The March 2011 natural disasters that occurred in Japan negatively impacted our sales in this market during 2011. Sales Leaders and Actives decreased 6% and 8%, respectively, in Japan compared to the prior year. Substantial regulatory and media scrutiny of the direct selling industry continued to negatively impact the industry and our business in 2011.
South Korea posted strong year-over-year revenue growth. This growth refl ected continued strong growth in Sales Leaders and Actives and interest generated by our ageLOC products including our ageLOC Edition Galvanic Spa System II, our restaged TRA weight management products and our ageLOC R.2 In 2011, our Sales Leaders and Actives in South Korea increased 24% and 20%, respectively, compared to the prior year.
Greater China. The following table sets forth revenue for the Greater China region and its principal markets (U.S. dollars in millions):
2010 2011 ChangeChina . . . . . . . . . . . . . . $ 91.4 $ 152.5 67%
Taiwan . . . . . . . . . . . . . 107.1 108.9 2%
Hong Kong . . . . . . . . 69.7 80.5 15%
Greater China total $ 268.2 $ 341.9 27%
Foreign currency exchange rate fl uctuations positively impacted revenue in the Greater China region by 5% in 2011.
Strong revenue and sales force growth in the Greater China region, including signifi cant growth in China, was driven by continued interest in our business opportunity and our strong product portfolio, including our ageLOC products. The region was also positively impacted by successful sales initiatives and excitement surrounding limited-time o� ers of our ageLOC R2 and ageLOC Galvanic Body Spa and related products in the fourth quarter of 2011.
Local currency revenue in China and Hong Kong were up 59% and 16%, respectively, while Taiwan was down 5% in 2011 compared to 2010. Hong Kong benefi ted from sales of our new ageLOC R2 and our ageLOC Galvanic Body Spa and related products, as most of the sales in the region during the limited-time o� er were recorded in Hong Kong, including sales to our distributors and consumers from outside Hong Kong. In 2011, China reported a 50% and 77% increase in preferred customers and number of sales representatives, respec-tively, compared to the prior-year period. Sales Leaders increased 15% in Taiwan and Actives remained level in 2011, compared to the prior-year period. In 2011, Sales Leaders and Actives in Hong Kong were up 24% and 5%, respectively, compared to the prior-year period.
South Asia/Pacifi c. The following table sets forth revenue for the South Asia/Pacifi c region (U.S. dollars in millions):
2010 2011 ChangeSouth Asia/Pacifi c . . . . . $ 182.8 $ 236.2 29%
Foreign currency exchange rate fl uctuations positively impacted revenue in South Asia/Pacifi c by 7% in 2011 compared to the same prior-year period. Excluding the impact of foreign currency fl uctuations, revenue growth of 22% in this region was driven primarily by robust growth in Sales Leaders and Actives, along with continued interest in our strong product portfolio, including our ageLOC and TRA weight management products. The region was positively impacted by limited-time o� ers of our ageLOC R2 and our ageLOC Galvanic Body Spa and related products in connection with our global convention in the fourth quarter of 2011. In 2011, Sales Leaders in the region increased 43% while Actives increased 18% compared to the prior year.
Americas. The following table sets forth revenue for the Americas region (U.S. dollars in millions):
2010 2011 ChangeAmericas . . . . . . . . . . $ 250.0 $ 252.0 1%
Revenue in the Americas increased slightly in 2011 compared to 2010. Successful product launches in the region in 2010 presented a di� cult year-over-year comparison for 2011. The region was posi-tively impacted by limited-time o� ers of our ageLOC R2 and our ageLOC Galvanic Body Spa and related products in the fourth quarter
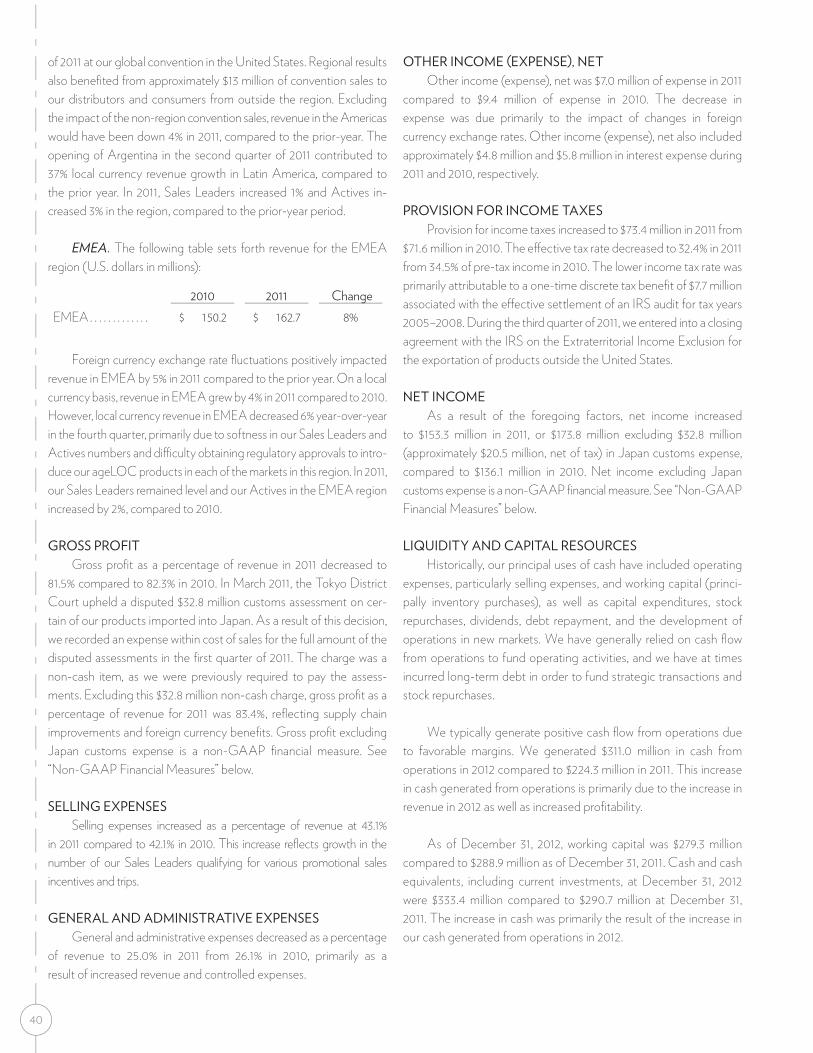
40
of 2011 at our global convention in the United States. Regional results also benefi ted from approximately $13 million of convention sales to our distributors and consumers from outside the region. Excluding the impact of the non-region convention sales, revenue in the Americas would have been down 4% in 2011, compared to the prior-year. The opening of Argentina in the second quarter of 2011 contributed to 37% local currency revenue growth in Latin America, compared to the prior year. In 2011, Sales Leaders increased 1% and Actives in-creased 3% in the region, compared to the prior-year period.
EMEA. The following table sets forth revenue for the EMEA region (U.S. dollars in millions):
2010 2011 ChangeEMEA . . . . . . . . . . . . . $ 150.2 $ 162.7 8%
Foreign currency exchange rate fl uctuations positively impacted revenue in EMEA by 5% in 2011 compared to the prior year. On a local currency basis, revenue in EMEA grew by 4% in 2011 compared to 2010. However, local currency revenue in EMEA decreased 6% year-over-year in the fourth quarter, primarily due to softness in our Sales Leaders and Actives numbers and di� culty obtaining regulatory approvals to intro-duce our ageLOC products in each of the markets in this region. In 2011, our Sales Leaders remained level and our Actives in the EMEA region increased by 2%, compared to 2010.
GROSS PROFITGross profi t as a percentage of revenue in 2011 decreased to
81.5% compared to 82.3% in 2010. In March 2011, the Tokyo District Court upheld a disputed $32.8 million customs assessment on cer-tain of our products imported into Japan. As a result of this decision, we recorded an expense within cost of sales for the full amount of the disputed assessments in the fi rst quarter of 2011. The charge was a non-cash item, as we were previously required to pay the assess-ments. Excluding this $32.8 million non-cash charge, gross profi t as a percentage of revenue for 2011 was 83.4%, refl ecting supply chain improvements and foreign currency benefi ts. Gross profi t excluding Japan customs expense is a non-GAAP fi nancial measure. See “Non-GAAP Financial Measures” below.
SELLING EXPENSESSelling expenses increased as a percentage of revenue at 43.1%
in 2011 compared to 42.1% in 2010. This increase refl ects growth in the number of our Sales Leaders qualifying for various promotional sales incentives and trips.
GENERAL AND ADMINISTRATIVE EXPENSESGeneral and administrative expenses decreased as a percentage
of revenue to 25.0% in 2011 from 26.1% in 2010, primarily as a result of increased revenue and controlled expenses.
OTHER INCOME (EXPENSE), NETOther income (expense), net was $7.0 million of expense in 2011
compared to $9.4 million of expense in 2010. The decrease in expense was due primarily to the impact of changes in foreign currency exchange rates. Other income (expense), net also included approximately $4.8 million and $5.8 million in interest expense during 2011 and 2010, respectively.
PROVISION FOR INCOME TAXESProvision for income taxes increased to $73.4 million in 2011 from
$71.6 million in 2010. The e� ective tax rate decreased to 32.4% in 2011 from 34.5% of pre-tax income in 2010. The lower income tax rate was primarily attributable to a one-time discrete tax benefi t of $7.7 million associated with the e� ective settlement of an IRS audit for tax years 2005–2008. During the third quarter of 2011, we entered into a closing agreement with the IRS on the Extraterritorial Income Exclusion for the exportation of products outside the United States.
NET INCOMEAs a result of the foregoing factors, net income increased
to $153.3 million in 2011, or $173.8 million excluding $32.8 million (approximately $20.5 million, net of tax) in Japan customs expense, compared to $136.1 million in 2010. Net income excluding Japan customs expense is a non-GAAP fi nancial measure. See “Non-GAAP Financial Measures” below.
LIQUIDITY AND CAPITAL RESOURCESHistorically, our principal uses of cash have included operating
expenses, particularly selling expenses, and working capital (princi-pally inventory purchases), as well as capital expenditures, stock repurchases, dividends, debt repayment, and the development of operations in new markets. We have generally relied on cash fl ow from operations to fund operating activities, and we have at times incurred long-term debt in order to fund strategic transactions and stock repurchases.
We typically generate positive cash fl ow from operations due to favorable margins. We generated $311.0 million in cash from operations in 2012 compared to $224.3 million in 2011. This increase in cash generated from operations is primarily due to the increase in revenue in 2012 as well as increased profi tability.
As of December 31, 2012, working capital was $279.3 million compared to $288.9 million as of December 31, 2011. Cash and cash equivalents, including current investments, at December 31, 2012 were $333.4 million compared to $290.7 million at December 31, 2011. The increase in cash was primarily the result of the increase in our cash generated from operations in 2012.

41
Capital expenditures in 2012 totaled $96.6 million, and we anticipate capital expenditures of approximately $150.0 million for 2013. This year-over-year increase refl ects signifi cant construction projects as noted below, which we currently anticipate will be completed in 2013. The capital expenditures in 2013 are primarily related to:
• planning and construction of a new innovation center on our Provo campus and a new Greater China regional headquar-
ters in Shanghai, China, and related real estate acquisitions and development projects;
• the build-out and upgrade of leasehold improvements in our various markets, including stores in China; and
• purchases of computer systems and software, including equipment and development costs

42
We currently have debt pursuant to various credit facilities and other borrowings. Our book value for both the individual and consoli-dated debt included in the table below approximates fair value. The estimated fair value of our debt is based on interest rates available for debt with similar terms and remaining maturities. We have classifi ed these instruments as Level 2 in the fair value hierarchy. The following table summarizes these debt arrangements as of December 31, 2012:
Facility or Arrangement(1)
Original Principal Amount
Balance as of December 31,
2012(2)Interest
Rate Repayment termsMulti-currency uncommittedshelf facility:
U.S. dollar denominated: $40.0 million $22.9 million 6.2% Notes due July 2016 with annual principal payments that began in July 2010.
$20.0 million $14.3 million 6.2% Notes due January 2017 with annual principal payments that began in January 2011.
Japanese yen denominated: 3.1 billion yen 0.9 billion yen ($10.2 million as of December 31, 2012)
1.7% Notes due April 2014 with annual principal payments that began in April 2008.
2.3 billion yen 1.6 billion yen ($18.7 million as of December 31, 2012)
2.6% Notes due September 2017 with annual principal payments that began in September 2011.
2.2 billion yen 1.6 billion yen ($17.9 million as of December 31, 2012)
3.3% Notes due January 2017 with annual principal payments that began in January 2011.
8.0 billion yen(3) 8.0 billion yen($92.0 million as of December 31, 2012)
1.7% Notes due May 2022 with annual principal payments that begin in May 2016
Committed loan:U.S. dollar denominated: $30.0 million $18.0 million Variable
30 day: 1.21%
Amortizes at $0.5 million every 30 days.
Revolving credit facility(4) N/A None N/A
(1) On May 25, 2012, we (a) entered into an amendment and restatement of our multi-currency uncommitted shelf facility to extend the termination date to May 25, 2015 and provide for the issuance of up to $150 million in additional senior promissory notes; (b) entered into an amendment and restatement of our revolving credit facility to extend the termination date to May 9, 2014; and (c) terminated pledges and guarantees of our subsidiaries as security for the multi-currency uncommitted shelf facility, committed loan and revolving credit facility. The committed loan continues to be secured by deeds of trust with respect to our corporate headquarters and distribution center in Provo, Utah.
(2) The The current portion of our long-term debt (i.e. becoming due in the next 12 months) includes $12.4 million of the balance of our Japanese yen-denominated debt under the multi-currency uncommitted shelf facility, $8.6 million of the balance on our U.S. dollar denominated debt under the 2003 multi-currency uncommitted shelf facility and $18.0 million of our committed loan.
(3) On May 31, 2012, we issued a series of yen denominated senior promissory notes under the multi-currency uncommitted shelf facility with an aggregate principal amount of 8.0 billion yen.
(4) On February 5, 2013, we entered into a second amendment of the amended and restated credit agreement. The amendment increased the commitment amount from $25.0 million to $100.0 million from February 2013 to February 2014, after which the commitment amount returns to the current level over a three-month period

43
Our board of directors has approved a stock repurchase program authorizing us to repurchase our outstanding shares of Class A com-mon stock on the open market or in private transactions. The repur-chases are used primarily to o� set dilution from our equity incentive plans and for strategic initiatives. During the year ended December 31, 2012, we repurchased approximately 4.6 million shares of Class A common stock under this program for $201.5 million. At December 31, 2012, $135.3 million was available for repurchases under the stock repurchase program.
Our board of directors declared cash dividends on our Class A common stock of $0.20 per share during each quarter of 2012. These quarterly cash dividends totaled approximately $48.4 million and were paid during 2012 to stockholders of record in 2012. The board of direc-tors has approved an increased quarterly cash dividend of $0.30 per share of Class A common stock to be paid on March 13, 2013, to stock-holders of record on February 22, 2013. Annually, this would increase the dividend to $1.20 from $0.80 in the prior year. Currently, we an-ticipate that our board of directors will continue to declare quarterly cash dividends and that the cash fl ows from operations will be su� cient to fund our future dividend payments. However, the continued dec-laration of dividends is subject to the discretion of our board of direc-tors and will depend upon various factors, including our net earnings, fi nancial condition, cash requirements, future prospects and other factors deemed relevant by our board of directors.
As of December 31, 2011 and 2012, we held $272.9 million and $320.0 million, respectively, in cash and cash equivalents, including $216.2 million and $248.7 million, respectively, held in our operations
outside of the U.S. Substantially all of our non-U.S. cash and cash equivalents are readily convertible into U.S. dollars or other currencies. We typically fund the cash requirements of our operations in the U.S. through intercompany charges for products, license fees and corporate services. We currently plan to repatriate undistributed earnings from our foreign operations as necessary, considering the cash needs of our foreign operations and the cash needs of our U.S. operations for dividends, stock repurchases, capital investments, debt repayment and strategic transactions. In all but one jurisdiction, we have not desig-nated our investments as permanently reinvested, but rather have these funds available for the our operations in the U.S. as needed. Any re-patriation of non-U.S. earnings requires payment of U.S. taxes in ac-cordance with applicable U.S. tax rules and regulations. Accordingly, we have accrued the necessary U.S. taxes related to the funds that are not permanently reinvested.
We believe we have su� cient liquidity to be able to meet our obligations on both a short-term and long-term basis. We currently believe that existing cash balances, future cash fl ows from operations and existing lines of credit will be adequate to fund our cash needs on both a short- and long-term basis. The majority of our historical ex-penses have been variable in nature and as such, a potential reduction in the level of revenue would reduce our cash fl ow needs. In the event that our current cash balances, future cash fl ow from operations and current lines of credit are not su� cient to meet our obligations or stra-tegic needs, we would consider raising additional funds in the debt or equity markets or restructuring our current debt obligations. Addition-ally, we would consider realigning our strategic plans, including a reduc-tion in capital spending, stock repurchases or dividend payments.
CONTRACTUAL OBLIGATIONS AND CONTINGENCIESThe following table sets forth payments due by period for fi xed contractual obligations as of December 31, 2012 (U.S. dollars in thousands):
Total 2013 2014–2015 2016–2017 ThereafterLong-term debt obligations. . . . . . . . . . . . $ 193,982 $ 39,019 $ 36,900 $ 52,338 $ 65,725
Interest payable . . . . . . . . . . . . . . . . . . . . . . . . 20,120 5,274 7,619 4,056 3,171
Operating lease obligations . . . . . . . . . . . . 37,611 17,309 14,827 3,780 1,695
Purchase obligations(1) . . . . . . . . . . . . . . . . . 171,041 32,123 35,187 91,944 11,787
Other long-term liabilities refl ected on the balance sheet . . . . . . . . . . . . . . . . . . . . . 87,229 —(2) —(2) —(2) —(2)
Total . . . . . . . . . . . . . . . . . . . . . . . . . . . . . . . $ 509,983 $ 93,725 $ 94,533 $ 152,118 $ 82,378
(1) The amounts reported under purchase obligations do not include anticipated expenditures related to ongoing construction projects at our corporate headquarters in Provo, Utah and our Greater China regional headquarters in Shanghai, China. We currently anticipate the Provo and Shanghai facilities will require future expenditures of approximately $95 million and $30 million, respectively, and anticipate that both facilities will be substantially completed in 2013
(2) Other long term liabilities refl ected on the balance sheet primarily consist of long-term tax related balances, in which the timing of the commitments is uncertain.

44
We are currently involved in a dispute with customs authorities in Japan with respect to duty assessments on several of our Pharmanex nutritional products, which is separate and distinct from the dispute discussed above under Gross Profi t. The dispute relates to additional customs assessments made by Yokohama Customs for the period of October 2006 through September 2009 in connection with post-importation audits, as well as the disputed portion of our import duties from October 2009 to the present, which we have or will hold in bond or pay under protest. The aggregate amount of these assessments and disputed duties was 4.0 billion Japanese yen as of December 31, 2012 (approximately $46.7 million), net of any recovery of consumption taxes. Additional assessments related to any prior period would be barred by applicable statutes of limitations. The issue in this case is whether a United States entity utilizing a commissionaire agent in Japan to import its products can use the manufacturer’s invoice or must use another valuation method, and, if an alternative method must be used, what the allowable deductions would be in determining the proper valuation. Following our review of the assessments and after consulting with our legal and customs advisors, we believe that the additional assessments are improper and are not supported by applicable customs laws. We fi led letters of protest with Yokohama Customs, which were rejected. We then appealed the matter to the Ministry of Finance in Japan. In May 2011, we received notice that the Ministry of Finance in Japan denied our administrative appeal. We disagree with the Ministry of Finance’s administrative decision. We are now pursuing the matter in Tokyo District Court, which we believe will provide a more independent determination of the matter. In addition, we are currently being required to post a bond or make a deposit equal to the di� erence between our declared duties and the amount the customs authorities have determined we should be paying on all current imports. Because we believe that the higher rate determined by the customs authorities is an improper application of the regulations, we are currently expensing the portion of the duties we believe is supported under applicable customs law, and recording the additional deposit or payment as a receivable within
long-term assets on our consolidated fi nancial statements. If we are unsuccessful in recovering the amounts assessed and paid, we will likely record a non-cash expense for the full amount of the disputed assessments. We anticipate that additional disputed duties will be reduced going forward as we recently began purchasing a majority of the a� ected products in Japan from a Japanese company that purchases and imports the products from the manufacturer.
SEASONALITY AND CYCLICALITYIn addition to general economic factors, we are impacted by sea-
sonal factors and trends such as major cultural events and vacation patterns. For example, most Asian markets celebrate their respective local New Year in the fi rst quarter, which generally has a negative impact on that quarter. We believe that direct selling in Japan, the United States and Europe is also generally negatively impacted during the third quarter, when many individuals, including our distributors, traditionally take vacations.
We have experienced rapid revenue growth in certain new markets following commencement of operations. This initial rapid growth has often been followed by a short period of stable or declining revenue, then followed by renewed growth fueled by product introductions, an increase in the number of Actives and increased distributor productivity. The contraction following initial rapid growth has been more pronounced in certain new markets, due to other factors such as business or economic conditions or distributor distractions outside the market.
Although our product launch process may vary by market, we generally introduce new products to our distributors and consumers in all markets where the products are registered, through limited-time o� ers in connection with global and regional distributor events. The limited-time o� ers typically generate signifi cant distributor activity and a high level of purchasing, which may result in a higher than normal increase in revenue during the quarter of the limited-time o� er and skew year-over-year and sequential comparisons.
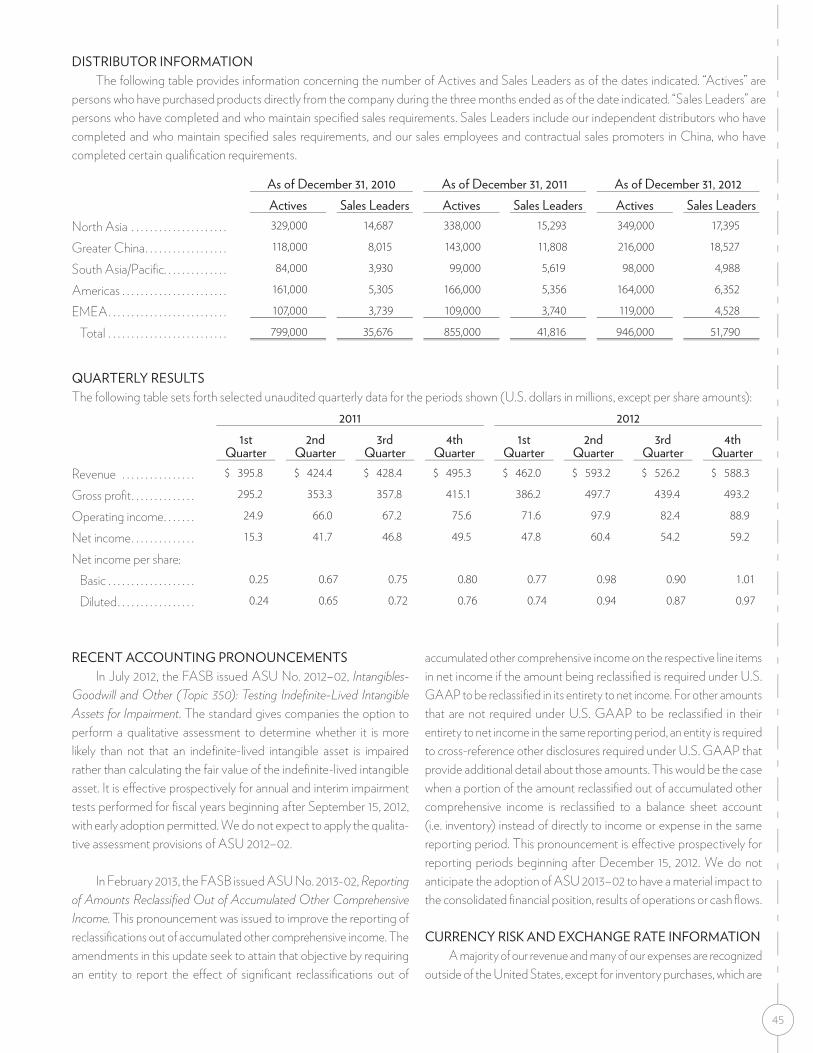
45
DISTRIBUTOR INFORMATIONThe following table provides information concerning the number of Actives and Sales Leaders as of the dates indicated. “Actives” are
persons who have purchased products directly from the company during the three months ended as of the date indicated. “Sales Leaders” are persons who have completed and who maintain specifi ed sales requirements. Sales Leaders include our independent distributors who have completed and who maintain specifi ed sales requirements, and our sales employees and contractual sales promoters in China, who have completed certain qualifi cation requirements.
As of December 31, 2010 As of December 31, 2011 As of December 31, 2012Actives Sales Leaders Actives Sales Leaders Actives Sales Leaders
North Asia . . . . . . . . . . . . . . . . . . . . . 329,000 14,687 338,000 15,293 349,000 17,395
Greater China . . . . . . . . . . . . . . . . . . 118,000 8,015 143,000 11,808 216,000 18,527
South Asia/Pacifi c . . . . . . . . . . . . . . 84,000 3,930 99,000 5,619 98,000 4,988
Americas . . . . . . . . . . . . . . . . . . . . . . . 161,000 5,305 166,000 5,356 164,000 6,352
EMEA . . . . . . . . . . . . . . . . . . . . . . . . . . 107,000 3,739 109,000 3,740 119,000 4,528
Total . . . . . . . . . . . . . . . . . . . . . . . . . . 799,000 35,676 855,000 41,816 946,000 51,790
QUARTERLY RESULTSThe following table sets forth selected unaudited quarterly data for the periods shown (U.S. dollars in millions, except per share amounts):
2011 20121st
Quarter2nd
Quarter3rd
Quarter4th
Quarter1st
Quarter2nd
Quarter3rd
Quarter4th
QuarterRevenue . . . . . . . . . . . . . . . . $ 395.8 $ 424.4 $ 428.4 $ 495.3 $ 462.0 $ 593.2 $ 526.2 $ 588.3
Gross profi t . . . . . . . . . . . . . . 295.2 353.3 357.8 415.1 386.2 497.7 439.4 493.2
Operating income . . . . . . . 24.9 66.0 67.2 75.6 71.6 97.9 82.4 88.9
Net income . . . . . . . . . . . . . . 15.3 41.7 46.8 49.5 47.8 60.4 54.2 59.2
Net income per share:Basic . . . . . . . . . . . . . . . . . . . 0.25 0.67 0.75 0.80 0.77 0.98 0.90 1.01
Diluted . . . . . . . . . . . . . . . . . 0.24 0.65 0.72 0.76 0.74 0.94 0.87 0.97
RECENT ACCOUNTING PRONOUNCEMENTSIn July 2012, the FASB issued ASU No. 2012–02, Intangibles-
Goodwill and Other (Topic 350): Testing Indefi nite-Lived Intangible Assets for Impairment. The standard gives companies the option to perform a qualitative assessment to determine whether it is more likely than not that an indefi nite-lived intangible asset is impaired rather than calculating the fair value of the indefi nite-lived intangible asset. It is e� ective prospectively for annual and interim impairment tests performed for fi scal years beginning after September 15, 2012, with early adoption permitted. We do not expect to apply the qualita-tive assessment provisions of ASU 2012–02.
In February 2013, the FASB issued ASU No. 2013-02, Reporting of Amounts Reclassifi ed Out of Accumulated Other Comprehensive Income. This pronouncement was issued to improve the reporting of reclassifi cations out of accumulated other comprehensive income. The amendments in this update seek to attain that objective by requiring an entity to report the e� ect of signifi cant reclassifi cations out of
accumulated other comprehensive income on the respective line items in net income if the amount being reclassifi ed is required under U.S. GAAP to be reclassifi ed in its entirety to net income. For other amounts that are not required under U.S. GAAP to be reclassifi ed in their entirety to net income in the same reporting period, an entity is required to cross-reference other disclosures required under U.S. GAAP that provide additional detail about those amounts. This would be the case when a portion of the amount reclassifi ed out of accumulated other comprehensive income is reclassifi ed to a balance sheet account (i.e. inventory) instead of directly to income or expense in the same reporting period. This pronouncement is e� ective prospectively for reporting periods beginning after December 15, 2012. We do not anticipate the adoption of ASU 2013–02 to have a material impact to the consolidated fi nancial position, results of operations or cash fl ows.
CURRENCY RISK AND EXCHANGE RATE INFORMATIONA majority of our revenue and many of our expenses are recognized
outside of the United States, except for inventory purchases, which are

46
primarily transacted in U.S. dollars from vendors in the United States. The local currency of each of our subsidiaries’ primary markets is con-sidered the functional currency. All revenue and expenses are trans-lated at weighted-average exchange rates for the periods reported. Therefore, our reported revenue and earnings will be positively im-pacted by a weakening of the U.S. dollar and will be negatively im-pacted by a strengthening of the U.S. dollar. Given the large portion of our business derived from Japan, South Korea and China, any weak-ening of these currencies negatively impacts reported revenue and profi ts, whereas a strengthening of these currencies positively impacts our reported revenue and profi ts. Given the uncertainty of exchange rate fl uctuations, it is di� cult to predict the e� ect of these fl uctuations on our future business, product pricing and results of operations or fi -nancial condition.
Foreign exchange risk is managed in certain jurisdictions through the use of foreign currency debt. Portions of our Japanese yen borrow-ings have been designated, and are e� ective as, economic hedges of the net investment in a foreign operation. Accordingly, foreign cur-rency transaction gains or losses due to spot rate fl uctuations on these debt instruments are included in foreign currency translation adjustment within other comprehensive income. Included in the cumulative trans-
lation adjustment are $4.2 million and $0.9 million of pretax net losses and $7.3 million of pretax net gains for the years ended December 31, 2010, 2011 and 2012, respectively from Japanese yen borrowings.
Additionally, we may seek to reduce our exposure to fl uctuations in foreign currency exchange rates through the use of foreign currency exchange contracts and through intercompany loans of foreign cur-rency. We do not use derivative fi nancial instruments for trading or speculative purposes. We regularly monitor our foreign currency risks and periodically take measures to reduce the impact of foreign exchange fl uctuations on our operating results. At December 31, 2011 and 2012, we held forward contracts designated as foreign currency cash fl ow hedges with notional amounts totaling approximately $83.6 million and $21.9 million, respectively, to hedge forecasted foreign-currency-de-nominated intercompany transactions. Because of our foreign exchange contracts at December 31, 2012, the impact of a 10% appreciation or 10% depreciation of the U.S. dollar against the Japanese yen would not represent a material potential loss in fair value, earnings or cash fl ows against these contracts. This potential loss does not consider the un-derlying foreign currency transaction or translation exposures to which we are subject.
Following are the weighted-average currency exchange rates of U.S. $1 into local currency for each of our international or foreign markets in which revenue exceeded U.S. $5.0 million for at least one of the quarters listed:
2011 20121st
Quarter2nd
Quarter3rd
Quarter4th
Quarter1st
Quarter2nd
Quarter3rd
Quarter4th
QuarterJapan(1) . . . . . . . . . . . . 82.3 81.5 77.7 77.3 79.3 80.1 78.6 81.1
Taiwan. . . . . . . . . . . . . . 29.3 28.9 29.1 30.3 29.7 29.6 29.9 29.1
Hong Kong . . . . . . . . 7.8 7.8 7.8 7.8 7.8 7.8 7.8 7.8
South Korea . . . . . . . 1,119.4 1,083.0 1,083.4 1,146.3 1,131.1 1,152.3 1,132.8 1,093.2
Malaysia . . . . . . . . . . . 3.0 3.0 3.0 3.2 3.0 3.1 3.1 3.1
Thailand . . . . . . . . . . . 30.5 30.3 30.1 31.0 30.9 31.3 31.4 30.7
China . . . . . . . . . . . . . . 6.6 6.5 6.4 6.4 6.3 6.3 6.4 6.3
Singapore. . . . . . . . . . 1.3 1.2 1.2 1.3 1.3 1.3 1.2 1.2
Canada . . . . . . . . . . . . 1.0 1.0 1.0 1.0 1.0 1.0 1.0 1.0
(1) As of January 31, 2013, the exchange rate of U.S. $1 into the Japanese yen was approximately 91.72.
NON-GAAP FINANCIAL MEASURESRegulation G, Conditions for Use of Non-GAAP Financial
Measures, and other SEC regulations defi ne and prescribe the conditions for use of certain non-GAAP fi nancial information. Our measures of earnings per share, gross profi t and net income, each excluding the Japan customs expense, meet the defi nition of non-GAAP fi nancial measures. Earnings per share, gross profi t and net income, each excluding the Japan customs expense, are used in addition to and in conjunction
with results presented in accordance with GAAP and should not be relied upon to the exclusion of GAAP fi nancial measures.
Management believes these non-GAAP fi nancial measures assist management and investors in evaluating, and comparing from period to period, results from ongoing operations in a more meaningful and consistent manner while also highlighting more meaningful trends in the results of operations.

47
The following is a reconciliation of gross profi t, as reported, to gross profi t excluding Japan customs expense for the years ended December 31, 2011 and 2012 (in thousands):
Year Ended December 31,2011 2012
Revenue as reported . . . . . . . . . . . . . . . . . . . . . . . . . . . . . . . . . . . . . . . . . . . . . . . . . . . . . . . . . . . . . . . . . . . . . . . $ 1,743,991 $ 2,169,664
Gross profi t as reported . . . . . . . . . . . . . . . . . . . . . . . . . . . . . . . . . . . . . . . . . . . . . . . . . . . . . . . . . . . . . . . . . . . . $ 1,421,367 $ 1,816,512
Japan customs expense . . . . . . . . . . . . . . . . . . . . . . . . . . . . . . . . . . . . . . . . . . . . . . . . . . . . . . . . . . . . . . . . . . . . 32,754 —
Gross profi t excluding Japan customs expense . . . . . . . . . . . . . . . . . . . . . . . . . . . . . . . . . . . . . . . . . . . $ 1,454,121 $ 1,816,512
Gross profi t as a percent of revenue as reported . . . . . . . . . . . . . . . . . . . . . . . . . . . . . . . . . . . . . . . . . . 81.5% 83.7%
Gross profi t as a percent of revenue excluding Japan customs expense . . . . . . . . . . . . . . . . . . 83.4%
The following is a reconciliation of net income and diluted earnings per share, as reported, to net income and diluted earnings per share excluding Japan customs expense for the years ended December 31, 2011 and 2012 (in thousands, except per share amounts):
Year Ended December 31,2011 2012
Net income as reported . . . . . . . . . . . . . . . . . . . . . . . . . . . . . . . . . . . . . . . . . . . . . . . . . . . . . . . . . . . . . . . . . . . . $ 153,330 $ 221,645
Japan customs expense . . . . . . . . . . . . . . . . . . . . . . . . . . . . . . . . . . . . . . . . . . . . . . . . . . . . . . . . . . . . . . . . . . . . 32,754 —
Tax e� ect of Japan customs expense . . . . . . . . . . . . . . . . . . . . . . . . . . . . . . . . . . . . . . . . . . . . . . . . . . . . . (12,275) —
Net income excluding Japan customs expense . . . . . . . . . . . . . . . . . . . . . . . . . . . . . . . . . . . . . . . . . . . $ 173,809 $ 221,645
Diluted earnings per share as reported . . . . . . . . . . . . . . . . . . . . . . . . . . . . . . . . . . . . . . . . . . . . . . . . . . . . $ 2.38 $ 3.52
Diluted earnings per share, excluding Japan customs expense . . . . . . . . . . . . . . . . . . . . . . . . . . . $ 2.69

48
ITEM 7A. QUANTITATIVE AND QUALITATIVE DISCLOSURES ABOUT MARKET RISKThe information required by Item 7A of Form 10-K is incorporated herein by reference from the information contained in Item 7. “Management’s Discussion and Analysis of Financial Condition and Results of Operation—Currency Risk and Exchange Rate Information” and Note 17 to the Consolidated Financial Statements.
ITEM 8. FINANCIAL STATEMENTS AND SUPPLEMENTARY DATA
1. Financial Statements. Set forth below is the index to the Financial Statements included in this Item 8:
Page
Consolidated Balance Sheets at December 31, 2011 and 2012 49
Consolidated Statements of Income for the years ended December 31, 2010, 50 2011 and 2012
Consolidated Statements of Comprehensive Income for the years ended 51 December 31, 2010, 2011, 2012
Consolidated Statements of Stockholders’ Equity for the years ended 52 December 31, 2010, 2011 and 2012
Consolidated Statements of Cash Flows for the years ended December 31, 53 2010, 2011 and 2012
Notes to Consolidated Financial Statements 54
Report of Independent Registered Public Accounting Firm 80
2. Financial Statement Schedules: Financial statement schedules have been omitted because they are not required or are not applicable, or because the required information is shown in the financial statements or notes thereto.
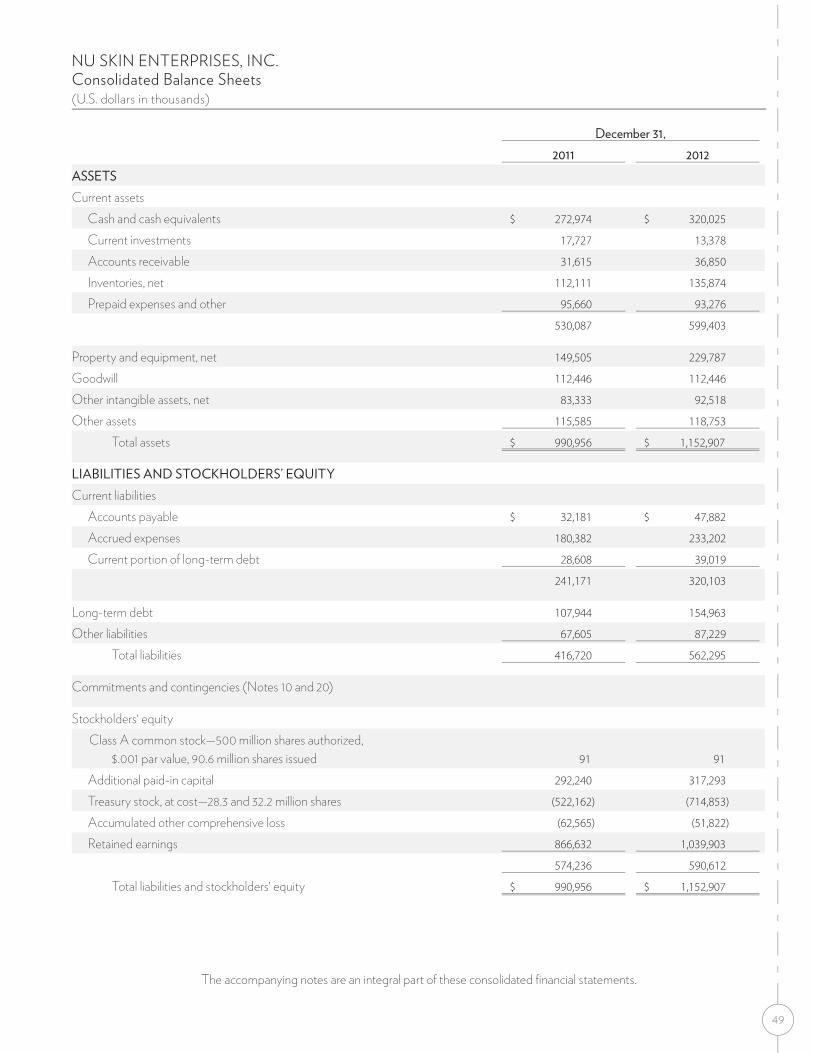
49
NU SKIN ENTERPRISES, INC.Consolidated Balance Sheets(U.S. dollars in thousands)
December 31,2011 2012
ASSETSCurrent assets
Cash and cash equivalents $ 272,974 $ 320,025
Current investments 17,727 13,378
Accounts receivable 31,615 36,850
Inventories, net 112,111 135,874
Prepaid expenses and other 95,660 93,276
530,087 599,403
Property and equipment, net 149,505 229,787
Goodwill 112,446 112,446
Other intangible assets, net 83,333 92,518
Other assets 115,585 118,753
Total assets $ 990,956 $ 1,152,907
LIABILITIES AND STOCKHOLDERS’ EQUITYCurrent liabilities
Accounts payable $ 32,181 $ 47,882
Accrued expenses 180,382 233,202
Current portion of long-term debt 28,608 39,019
241,171 320,103
Long-term debt 107,944 154,963
Other liabilities 67,605 87,229
Total liabilities 416,720 562,295
Commitments and contingencies (Notes 10 and 20)
Stockholders’ equityClass A common stock—500 million shares authorized,
$.001 par value, 90.6 million shares issued 91 91
Additional paid-in capital 292,240 317,293
Treasury stock, at cost—28.3 and 32.2 million shares (522,162) (714,853)
Accumulated other comprehensive loss (62,565) (51,822)
Retained earnings 866,632 1,039,903
574,236 590,612
Total liabilities and stockholders’ equity $ 990,956 $ 1,152,907
The accompanying notes are an integral part of these consolidated fi nancial statements.

50
Year Ended December 31,2010 2011 2012
Revenue $ 1,537,259 $ 1,743,991 $ 2,169,664
Cost of sales 272,431 322,624 353,152
Gross profi t 1,264,828 1,421,367 1,816,512
Operating expenses:Selling expenses 646,348 751,448 970,219
General and administrative expenses 401,418 436,177 505,449
Total operating expenses 1,047,766 1,187,625 1,475,668
Operating income 217,062 233,742 340,844
Other income (expense), net (Note 23) (9,449) (6,973) 4,398
Income before provision for income taxes 207,613 226,769 345,242
Provision for income taxes 71,562 73,439 123,597
Net income $ 136,051 $ 153,330 $ 221,645
Net income per share:Basic $ 2.18 $ 2.47 $ 3.66
Diluted $ 2.11 $ 2.38 $ 3.52
Weighted-average common shares outstanding (000s):Basic 62,370 62,066 60,600
Diluted 64,547 64,546 63,025
The accompanying notes are an integral part of these consolidated fi nancial statements.
NU SKIN ENTERPRISES, INC.Consolidated Statements of Income(U.S. dollars in thousands, except per share amounts)

51
NU SKIN ENTERPRISES, INC.Consolidated Statements of Comprehensive Income(U.S. dollars in thousands)
Year Ended December 31,2010 2011 2012
Net income $ 136,051 $ 153,330 $ 221,645
Other comprehensive income, net of tax:Foreign currency translation adjustment 9,661 (2,985) 7,843
Net unrealized gains/(losses) on foreign currency cash fl ow hedges 60 (1,954) 3,299
Less: Reclassifi cation adjustment for realized losses/(gains) in current earnings (126) 913 (399)
9,595 (4,026) 10,743
Comprehensive income $ 145,646 $ 149,304 $ 232,388
The accompanying notes are an integral part of these consolidated fi nancial statements.

52
Class A Common
StockAdditional
Paid-in Capital Treasury Stock
Accumulated Other Com-
prehensive LossRetained Earnings Total
Balance at January 1, 2010 $ 91 $ 232,219 $ (433,567) $ (68,134) $ 645,078 $ 375,687
Net income — — — — 136,051 136,051Other comprehensive income, net of tax — — — 9,595 — 9,595Repurchase of Class A common stock (Note 11) — — (58,516) — — (58,516)Reclassification of treasury shares held by subsidiary — 3,122 (3,122) — — — Exercise of employee stock options (1.5 million
shares)/vesting of stock awards —
2,724
18,457 — —
21,181 Excess tax benefit from equity awards — 7,605 — — — 7,605Stock-based compensation — 10,835 — — — 10,835Cash dividends — — — — (31,189) (31,189)Balance at December 31, 2010 91 256,505 (476,748) (58,539) 749,940 471,249
Net income — — — — 153,330 153,330Other comprehensive income, net of tax — — — (4,026) — (4,026)Repurchase of Class A common stock (Note 11) — — (67,149) — — (67,149)Exercise of employee stock options (2.1 million
shares)/vesting of stock awards —
7,978
21,735 — —
29,713 Excess tax benefit from equity awards — 12,657 — — — 12,657Stock-based compensation — 15,100 — — — 15,100Cash dividends — — — — (36,638) (36,638)Balance at December 31, 2011 91 292,240 (522,162) (62,565) 866,632 574,236
Net income — — — — 221,645 221,645Other comprehensive income, net of tax — — — 10,743 — 10,743Repurchase of Class A common stock (Note 11) — — (201,471) — — (201,471)Exercise of employee stock options (0.8 million
shares)/vesting of stock awards —
(4,214)
8,780 — —
4,566Excess tax benefit from equity awards — 7,909 — — — 7,909Stock-based compensation — 21,358 — — — 21,358Cash dividends — — — — (48,374) (48,374)Balance at December 31, 2012 $ 91 $ 317,293 $ (714,853) $ (51,822) $ 1,039,903 $ 590,612
NU SKIN ENTERPRISES, INC.Consolidated Statements of Stockholders’ Equity (U.S. dollars in thousands)
The accompanying notes are an integral part of these consolidated fi nancial statements.

53
NU SKIN ENTERPRISES, INC.Consolidated Statements of Cash Flows (U.S. dollars in thousands)
Year Ended December 31,2010 2011 2012
Cash flows from operating activities:Net income $ 136,051 $ 153,330 $ 221,645Adjustments to reconcile net income to net cash provided
by operating activities: Depreciation and amortization 29,616 32,850 33,412Japan customs expense — 32,754 —Foreign currency (gains)/losses 3,681 4,162 (3,874)Stock-based compensation 10,835 15,450 21,358Deferred taxes (13,735) 108 4,692
Changes in operating assets and liabilities:Accounts receivable (6,649) (5,890) (7,884)Inventories, net (4,293) 2,415 (22,605)Prepaid expenses and other 3,854 (4,690) (2,358)Other assets (1,631) (16,809) (11,579)Accounts payable (568) 6,077 15,831Accrued expenses 13,777 1,624 62,056Other liabilities 16,945 2,934 282
Net cash provided by operating activities 187,883 224,315 310,976
Cash flows from investing activities:Purchase of property and equipment (53,783) (41,809) (96,645)Proceeds on investment sales — 6,634 20,086Purchases of investments — (24,361) (15,737)Acquisitions (Note 24) — (11,663) (12,562)
Net cash used in investing activities (53,783) (71,199) (104,858)
Cash flows from financing activities:Payment of cash dividends (31,189) (36,638) (48,374)Repurchase of shares of common stock (58,516) (67,149) (201,471)Exercise of distributor and employee stock options 21,181 29,713 4,565Income tax benefit of options exercised 6,908 12,059 7,750Payments on long-term debt (37,401) (28,001) (28,279)Related party payment — (16,995) —Proceeds from long-term debt 30,000 — 101,922
Net cash used in financing activities (69,017) (107,011) (163,887)
Effect of exchange rate changes on cash 7,209 (3,468) 4,820
Net increase in cash and cash equivalents 72,292 42,637 47,051
Cash and cash equivalents, beginning of period 158,045 230,337 272,974
Cash and cash equivalents, end of period $ 230,337 $ 272,974 $ 320,025
The accompanying notes are an integral part of these consolidated fi nancial statements.
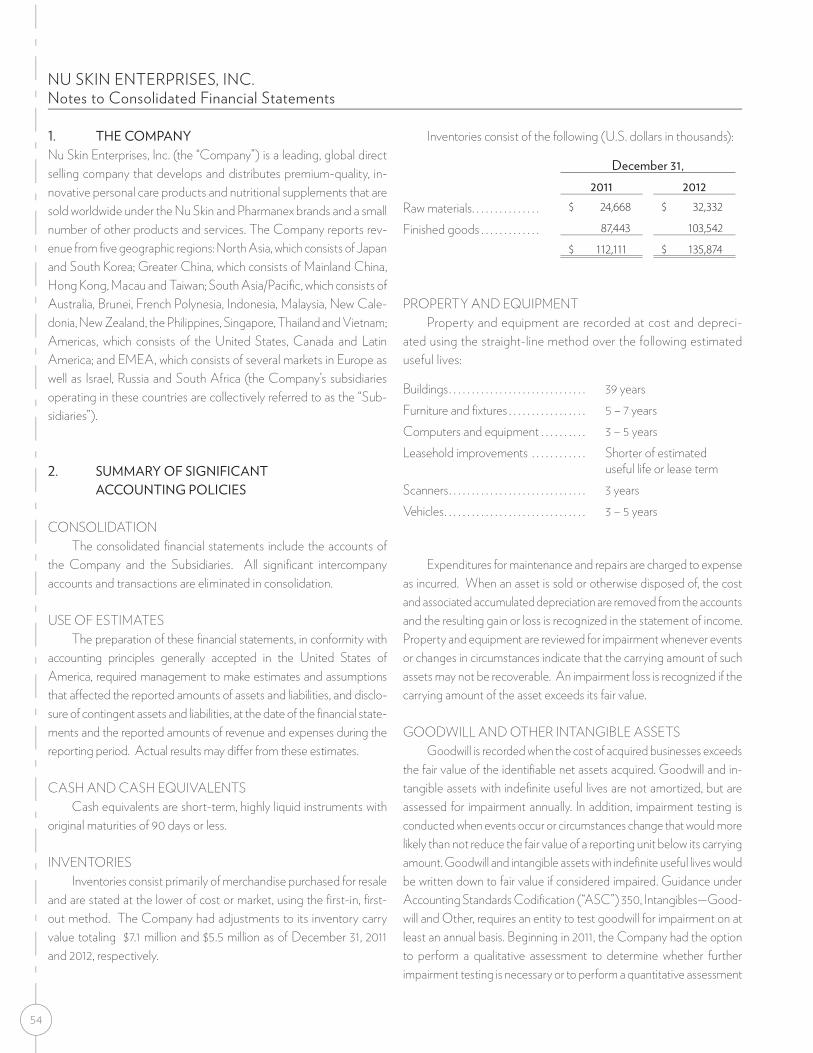
54
1. THE COMPANYNu Skin Enterprises, Inc. (the “Company”) is a leading, global direct selling company that develops and distributes premium-quality, in-novative personal care products and nutritional supplements that are sold worldwide under the Nu Skin and Pharmanex brands and a small number of other products and services. The Company reports rev-enue from fi ve geographic regions: North Asia, which consists of Japan and South Korea; Greater China, which consists of Mainland China, Hong Kong, Macau and Taiwan; South Asia/Pacifi c, which consists of Australia, Brunei, French Polynesia, Indonesia, Malaysia, New Cale-donia, New Zealand, the Philippines, Singapore, Thailand and Vietnam; Americas, which consists of the United States, Canada and Latin America; and EMEA, which consists of several markets in Europe as well as Israel, Russia and South Africa (the Company’s subsidiaries operating in these countries are collectively referred to as the “Sub-sidiaries”).
2. SUMMARY OF SIGNIFICANT ACCOUNTING POLICIES
CONSOLIDATIONThe consolidated fi nancial statements include the accounts of
the Company and the Subsidiaries. All signifi cant intercompany accounts and transactions are eliminated in consolidation.
USE OF ESTIMATESThe preparation of these fi nancial statements, in conformity with
accounting principles generally accepted in the United States of America, required management to make estimates and assumptions that a� ected the reported amounts of assets and liabilities, and disclo-sure of contingent assets and liabilities, at the date of the fi nancial state-ments and the reported amounts of revenue and expenses during the reporting period. Actual results may di� er from these estimates.
CASH AND CASH EQUIVALENTSCash equivalents are short-term, highly liquid instruments with
original maturities of 90 days or less.
INVENTORIESInventories consist primarily of merchandise purchased for resale
and are stated at the lower of cost or market, using the fi rst-in, fi rst-out method. The Company had adjustments to its inventory carry value totaling $7.1 million and $5.5 million as of December 31, 2011 and 2012, respectively.
Inventories consist of the following (U.S. dollars in thousands):
December 31,2011 2012
Raw materials . . . . . . . . . . . . . . . $ 24,668 $ 32,332
Finished goods . . . . . . . . . . . . . 87,443 103,542
$ 112,111 $ 135,874
PROPERTY AND EQUIPMENTProperty and equipment are recorded at cost and depreci-
ated using the straight-line method over the following estimated useful lives:
Buildings . . . . . . . . . . . . . . . . . . . . . . . . . . . . . . 39 yearsFurniture and fi xtures . . . . . . . . . . . . . . . . . 5 – 7 yearsComputers and equipment . . . . . . . . . . 3 – 5 yearsLeasehold improvements . . . . . . . . . . . . Shorter of estimated
useful life or lease termScanners . . . . . . . . . . . . . . . . . . . . . . . . . . . . . . 3 yearsVehicles . . . . . . . . . . . . . . . . . . . . . . . . . . . . . . . 3 – 5 years
Expenditures for maintenance and repairs are charged to expense as incurred. When an asset is sold or otherwise disposed of, the cost and associated accumulated depreciation are removed from the accounts and the resulting gain or loss is recognized in the statement of income. Property and equipment are reviewed for impairment whenever events or changes in circumstances indicate that the carrying amount of such assets may not be recoverable. An impairment loss is recognized if the carrying amount of the asset exceeds its fair value.
GOODWILL AND OTHER INTANGIBLE ASSETS Goodwill is recorded when the cost of acquired businesses exceeds
the fair value of the identifi able net assets acquired. Goodwill and in-tangible assets with indefi nite useful lives are not amortized, but are assessed for impairment annually. In addition, impairment testing is conducted when events occur or circumstances change that would more likely than not reduce the fair value of a reporting unit below its carrying amount. Goodwill and intangible assets with indefi nite useful lives would be written down to fair value if considered impaired. Guidance under Accounting Standards Codifi cation (“ASC”) 350, Intangibles—Good-will and Other, requires an entity to test goodwill for impairment on at least an annual basis. Beginning in 2011, the Company had the option to perform a qualitative assessment to determine whether further impairment testing is necessary or to perform a quantitative assessment
NU SKIN ENTERPRISES, INC.Notes to Consolidated Financial Statements

55
NU SKIN ENTERPRISES, INC.Notes to Consolidated Financial Statements
by comparing the fair value of a reporting unit to its carrying amount, including goodwill. Under the qualitative assessment, an entity is not required to calculate the fair value of a reporting unit unless the entity determines that it is more likely than not that its fair value is less than its carrying amount. If under the quantitative assessment the fair value of a reporting unit is less than its carrying amount, then the amount of the impairment loss, if any, must be measured. The Company used the quantitative assessment for all periods presented. Intangible assets with fi nite useful lives are amortized to their estimated residual values over such fi nite lives, and reviewed for impairment whenever events or cir-cumstances warrant such a review.
No impairment charges were recorded for goodwill or intangibles during the periods presented.
REVENUE RECOGNITIONRevenue is recognized when products are shipped, which is when
title and risk of loss pass to independent distributors and preferred customers who are the Company’s consumers. A reserve for product returns is accrued based on historical experience totaling $5.2 million and $6.2 million as of December 31, 2011 and 2012, respectively. During the years ended December 31, 2010, 2011 and 2012, the Company recorded sales returns of $55.4 million, $56.5 million and $56.1 million, respectively. The Company generally requires cash or credit card pay-ment at the point of sale. Accounts receivable generally represents amounts due from credit card companies and are generally collected within a few days of the purchase. As such, the Company has deter-mined that no allowance for doubtful accounts is necessary. Amounts received prior to shipment and title passage to distributors are record-ed as deferred revenue. The global sales compensation plan for the Company’s distributors generally does not provide rebates or selling discounts to distributors who purchase its products and services. The Company classifi es selling discounts and rebates, if any, as a reduction of revenue at the time the sale is recorded.
Through the Company’s product subscription and loyalty pro-grams, which can vary from market to market, participants who com-mit to purchases on a monthly basis receive a discount from suggested retail or wholesale prices, as applicable. The Company applies this discount at the time of each purchase and not through a larger dis-count on the initial purchase. Participants may cancel their commit-ment at any time, however some markets charge a one-time early cancellation fee. All purchases under these programs are subject to the Company’s standard product payment and return policies. In ac-cordance with ASC 605-50, the Company classifi es selling discounts and rebates, as a reduction of revenue at the time the sale is recorded.
ADVERTISING EXPENSESAdvertising costs are expensed as incurred. Advertising expense
incurred for the years ended December 31, 2010, 2011 and 2012 totaled approximately $2.1 million, $2.3 million and $5.1 million, respectively.
SELLING EXPENSESSelling expenses are the Company’s most signifi cant expense a
nd are classifi ed as operating expenses. Selling expenses include distributor commissions as well as wages, benefi ts, bonuses and other labor and unemployment expenses the Company pays to its sales force in China. In each of the Company’s markets, except China, sales leaders can earn “multi-level” compensation under the Company’s global sales compensation plan, including commissions for product sales to their consumer groups as well as the product sales made through the sales network they have developed and trained. The Company does not pay commissions on sales materials, which are sold to distributors at or near cost.
The Company’s distributors may make profi ts by purchasing the products from the Company at a discount and selling them to consumers with a mark-up. The Company does not account for nor pay additional commissions on these mark-ups received by distributors. In many markets, the Company also allows individuals who are not distributors, referred to as “preferred customers,” to buy products directly from the Company at a discount. The Company pays commis-sions on preferred customer purchases to the referring distributors.
RESEARCH AND DEVELOPMENTResearch and development costs are included in general and
administrative expenses in the accompanying consolidated statements of income and are expensed as incurred and totaled $12.4 million, $13.6 million and $14.9 million in 2010, 2011 and 2012, respectively.
DEFERRED TAX ASSETS AND LIABILITIESThe Company accounts for income taxes in accordance with the
Income Taxes Topic of the Financial Accounting Standards Codifi cation. These standards establish fi nancial accounting and reporting standards for the e� ects of income taxes that result from an enterprise’s activities during the current and preceding years. The Company takes an asset and liability approach for fi nancial accounting and reporting of income taxes. The Company pays income taxes in many foreign jurisdictions based on the profi ts realized in those jurisdictions, which can be signifi -cantly impacted by terms of intercompany transactions between the Company and its foreign a� liates. Deferred tax assets and liabilities are created in this process. The Company has netted these deferred tax assets and deferred tax liabilities by jurisdiction. Valuation allowances

56
are established when necessary to reduce deferred tax assets to the amounts expected to be ultimately realized.
UNCERTAIN TAX POSITIONSThe Company fi les income tax returns in the U.S. federal jurisdiction,
and in various state and foreign jurisdictions. In 2011, the Company entered into a closing agreement with the United States Internal Revenue Service (the “IRS”) for all adjustments for the 2005 through 2008 tax years. As a result of entering into the closing agreement, the Company is no longer subject to tax examinations from the IRS for years before 2009. With a few exceptions, the Company is no longer subject to state and local income tax examination by tax authorities for the years before 2005. In 2009, the Company entered into a voluntary program with the IRS called Compliance Assurance Process (“CAP”). The objective of CAP is to contemporaneously work with the IRS to achieve federal tax compliance and resolve all or most of the issues prior to fi ling of the tax return. The Company has elected to participate in the CAP program for 2013 and may elect to continue participating in CAP for future tax years; the Company may withdraw from the program at any time. In major foreign jurisdictions, the Company is no longer subject to income tax examinations for years before 2006. Along with the IRS examination, the Company is currently under examination in certain foreign jurisdictions; however, the outcomes of those reviews are not yet determinable.
A reconciliation of the beginning and ending amount of unrecognized tax benefi ts included in other liabilities is as follows (U.S. dollars in thousands):
Gross Balance at January 1, 2010 . . . . . . . . . . . . . . . . . . . $ 28,275
Decreases related to prior year tax positions. . . . . . . . (1,206)
Increases related to current year tax positions . . . . . . 2,236
Settlements . . . . . . . . . . . . . . . . . . . . . . . . . . . . . . . . . . . . . . . . . —
Decreases due to lapse of statutes of limitations . . . (15,395)
Currency adjustments . . . . . . . . . . . . . . . . . . . . . . . . . . . . . . 911
Gross Balance at December 31, 2010 $ 14,821
Gross Balance at January 1, 2011 . . . . . . . . . . . . . . . . . . . . $ 14,821
Decreases related to prior year tax positions. . . . . . . . (7,138)
Increases related to current year tax positions . . . . . . 1,415
Settlements . . . . . . . . . . . . . . . . . . . . . . . . . . . . . . . . . . . . . . . . . (499)
Decreases due to lapse of statutes of limitations . . . (1,255)
Currency adjustments . . . . . . . . . . . . . . . . . . . . . . . . . . . . . . 43
Gross Balance at December 31, 2011 $ 7,387
Gross Balance at January 1, 2012 . . . . . . . . . . . . . . . . . . . $ 7,387
Decreases related to prior year tax positions. . . . . . . . —
Increases related to current year tax positions . . . . . . 2,430
Settlements . . . . . . . . . . . . . . . . . . . . . . . . . . . . . . . . . . . . . . . . . —
Decreases due to lapse of statutes of limitations . . . (854)
Currency adjustments . . . . . . . . . . . . . . . . . . . . . . . . . . . . . . 82
Gross Balance at December 31, 2012 $ 9,045
At December 31, 2012, the Company had $9.0 million in unrecog-nized tax benefi ts of which $3.8 million, if recognized, would a� ect the e� ective tax rate. In comparison, at December 31, 2011, the Company had $7.4 million in unrecognized tax benefi ts of which $3.1 million, if recognized, would a� ect the e� ective tax rate. The Company’s unrecognized tax benefi ts relate to multiple foreign and domestic juris-dictions. Due to potential increases in unrecognized tax benefi ts from the multiple jurisdictions in which the Company operates, as well as the expiration of various statutes of limitation, it is reasonably possible that the Company’s gross unrecognized tax benefi ts, net of foreign currency adjustments, may decrease within the next 12 months by a range of approximately $2 to $4 million.
During each of the years ended December 31, 2010, 2011 and 2012, the Company recognized approximately ($1.7) million, ($0.8) million and $0.3 million, respectively in interest and penalties expenses/ (benefi ts). The Company had approximately $1.6 million, $0.8 million and $1.1 million of accrued interest and penalties related to uncertain tax positions at December 31, 2010, 2011 and 2012, respectively. Interest and penalties related to uncertain tax positions are recognized as a component of income tax expense.
NET INCOME PER SHARENet income per share is computed based on the weighted-average
number of common shares outstanding during the periods presented. Additionally, diluted earnings per share data gives e� ect to all poten-tially dilutive common shares that were outstanding during the periods presented (Note 11).
FOREIGN CURRENCY TRANSLATIONA signifi cant portion of the Company’s business operations
occurs outside the United States. The local currency of each of the Company’s Subsidiaries is considered its functional currency. All assets and liabilities are translated into U.S. dollars at exchange rates existing at the balance sheet dates, revenue and expenses are trans-lated at weighted-average exchange rates and stockholders’ equity is recorded at historical exchange rates. The resulting foreign currency
NU SKIN ENTERPRISES, INC.Notes to Consolidated Financial Statements

57
NU SKIN ENTERPRISES, INC.Notes to Consolidated Financial Statements
translation adjustments are recorded as a separate component of stockholders’ equity in the consolidated balance sheets and transac-tion gains and losses are included in other income and expense in the consolidated fi nancial statements. Net of tax the accumulated other comprehensive income related to the foreign currency translation adjustments are $58.5 million, $61.5 million and $54.7 million at December 31, 2010, 2011 and 2012, respectively.
FAIR VALUE OF FINANCIAL INSTRUMENTSThe carrying value of fi nancial instruments including cash and
cash equivalents, accounts receivable and accounts payable approximate fair values due to the short-term nature of these instruments. The Company’s current investments as of December 31, 2012 include cer-tifi cates of deposits and pre-refunded municipal bonds that are clas-sifi ed by management as held-to-maturity as the Company had the positive intent and ability to hold to maturity. The carrying value of these current investments approximate fair values due to the short-term nature of these instruments. As of December 31, 2011 and 2012, the long-term debt fair value is $145.0 million and $199.5 million, respec-tively. The estimated fair value of the Company’s debt is based on interest rates available for debt with similar terms and remaining ma-turities. The Company has classifi ed these instruments as Level 2 in the fair value hierarchy. Fair value estimates are made at a specifi c point in time, based on relevant market information.
The FASB Codifi cation defi nes fair value as the price that would be received to sell an asset or paid to transfer a liability in the principal or most advantageous market for the asset or liability in an orderly transaction between market participants at the measurement date. On a quarterly basis, the Company measures at fair value certain fi nancial assets, including cash equivalents. Accounting standards specify a hierarchy of valuation techniques based on whether the inputs to those valuation techniques are observable or unobservable. Observable inputs refl ect data obtained from independent sources, while unobserv-able inputs refl ect the Company’s market assumptions. These two types of inputs have created the following fair-value hierarchy:
• Level 1—quoted prices in active markets for identical assets or liabilities;
• Level 2—inputs, other than the quoted prices in active markets, that are observable either directly or indirectly;
• Level 3—unobservable inputs based on the Company’s own assumptions.
Accounting standards permit companies, at their option, to choose to measure many fi nancial instruments and certain other items at fair value. The Company has elected to not fair value existing eligible items.
STOCK-BASED COMPENSATIONAll share-based payments, including grants of stock options and
restricted stock units, are required to be recognized in our fi nancial state-ments based upon their respective grant date fair values. The Black-Scholes option pricing model is used to estimate the fair value of stock options. The determination of the fair value of stock options is a� ected by our stock price and a number of assumptions, including expected volatility, expected life, risk-free interest rate and expected dividends. We use historical volatility as the expected volatility assumption required in the Black-Scholes model. The expected life of the stock options is based on historical data trended into the future. The risk-free interest rate assumption is based on observed interest rates appropriate for the expected terms of our stock options. The fair value of our restricted stock units is based on the closing market price of our stock on the date of grant less our expected dividend yield. We recognize stock-based compensation net of any estimated forfeitures on a straight-line basis over the requisite service period of the award.
The total compensation expense related to equity compensation plans was approximately $10.8 million, $15.5 million and $21.4 million for the years ended December 31, 2010, 2011 and 2012. For the years end-ed December 31, 2010, 2011 and 2012, all stock-based compensation expense was recorded within general and administrative expenses.
REPORTING COMPREHENSIVE INCOMEComprehensive income is defi ned as the change in equity of a
business enterprise during a period from transactions and other events and circumstances from non-owner sources, and it includes all changes in equity during a period except those resulting from invest-ments by owners and distributions to owners.
ACCOUNTING FOR DERIVATIVE INSTRUMENTS AND HEDGING ACTIVITIES
The Company recognizes all derivatives as either assets or liabil-ities, with the instruments measured at fair value.
The Company manages foreign exchange risk in certain jurisdic-tions through the use of foreign currency debt. Portions of the Com-pany’s Japanese yen borrowings have been designated, and are e� ec-tive as, economic hedges of the net investment in its foreign operations. Accordingly, foreign currency transaction gains or losses

58
due to spot rate fl uctuations on these debt instruments are included in foreign currency translation adjustment within other comprehensive income. Included in the cumulative translation adjustment are $4.2 million and $0.9 million of pretax net losses and $7.3 million of pretax net gains for the years ended December 31, 2010, 2011 and 2012, re-spectively from Japanese yen borrowings.
Additionally, the Company’s Subsidiaries enter into signifi cant transactions with each other and third parties that may not be denom-inated in the respective Subsidiaries’ functional currencies. The Com-pany regularly monitors its foreign currency risks and seeks to reduce its exposure to fl uctuations in foreign exchange rates using foreign currency exchange contracts and through certain intercompany loans of foreign currency.
Hedge e� ectiveness is assessed at inception and throughout the life of the hedge to ensure the hedge qualifi es for hedge accounting treatment. Changes in fair value associated with hedge ine� ective-ness, if any, are recorded in the results of operations currently. In the event that an anticipated transaction is no longer likely to occur, the Company recognizes the change in fair value of the derivative in its results of operations currently.
Changes in the fair value of derivatives are recorded in current earnings or accumulated other comprehensive loss, depending on the intended use of the derivative and its resulting designation. The gains and losses in accumulated other comprehensive loss stemming from these derivatives will be reclassifi ed into earnings in the period during which the hedged forecasted transaction a� ects earnings. The fair value of the receivable and payable amounts related to these unreal-ized gains and losses is classifi ed as other current assets and liabilities. The Company does not use such derivative fi nancial instruments for trading or speculative purposes. Gains and losses on certain intercom-pany loans of foreign currency are recorded as other income and expense in the consolidated statements of income.
RECENT ACCOUNTING PRONOUNCEMENTSIn July 2012, the FASB issued ASU No. 2012-02, Intangibles-
Goodwill and Other (Topic 350): Testing Indefi nite-Lived Intangible Assets for Impairment. The standard gives companies the option to perform a qualitative assessment to determine whether it is more likely
than not that an indefi nite-lived intangible asset is impaired rather than calculating the fair value of the indefi nite-lived intangible asset. It is e� ective prospectively for annual and interim impairment tests performed for fi scal years beginning after September 15, 2012, with early adoption permitted. The Company does not expect to apply the qualitative assessment provisions of ASU 2012-02.
In February 2013, the FASB issued ASU No. 2013-02, Reporting of Amounts Reclassifi ed out of Accumulated Other Comprehensive Income. This pronouncement was issued to improve the reporting of reclassifi cations out of accumulated other comprehensive income. The amendments in this update seek to attain that objective by requiring an entity to report the e� ect of signifi cant reclassifi cations out of accumu-lated other comprehensive income on the respective line items in net income if the amount being reclassifi ed is required under U.S. GAAP to be reclassifi ed in its entirety to net income. For other amounts that are not required under U.S. GAAP to be reclassifi ed in their entirety to net income in the same reporting period, an entity is required to cross-reference other disclosures required under U.S. GAAP that provide additional detail about those amounts. This would be the case when a portion of the amount reclassifi ed out of accumulated other compre-hensive income is reclassifi ed to a balance sheet account (i.e. inventory) instead of directly to income or expense in the same reporting period. This pronouncement is e� ective prospectively for reporting periods beginning after December 15, 2012. The Company does not anticipate the adoption of ASU 2013-02 to have a material impact to its consoli-dated fi nancial position, results of operations or cash fl ows.
3. RELATED PARTY TRANSACTIONS
The Company previously leased corporate o� ce and warehouse space from two entities that were owned by certain o� cers and direc-tors of the Company. Total lease payments to these two a� liated entities were $3.6 million for the year ended December 31, 2010. On December 30, 2010, the Company purchased the corporate o� ce and warehouse space from these two a� liated entities for approxi-mately $33.0 million. Approximately $16.0 million was paid in cash and the remaining $17.0 million was paid in January 2011.
NU SKIN ENTERPRISES, INC.Notes to Consolidated Financial Statements
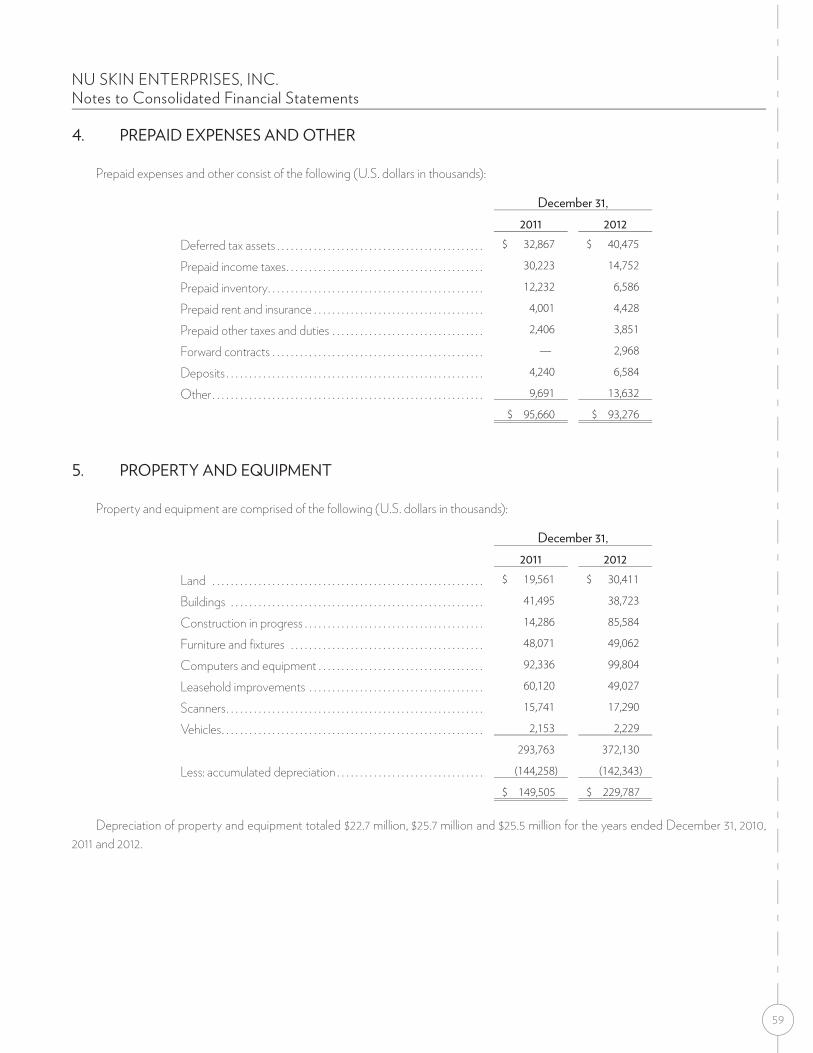
59
NU SKIN ENTERPRISES, INC.Notes to Consolidated Financial Statements
4. PREPAID EXPENSES AND OTHER
Prepaid expenses and other consist of the following (U.S. dollars in thousands):
December 31,2011 2012
Deferred tax assets . . . . . . . . . . . . . . . . . . . . . . . . . . . . . . . . . . . . . . . . . . . . . $ 32,867 $ 40,475
Prepaid income taxes . . . . . . . . . . . . . . . . . . . . . . . . . . . . . . . . . . . . . . . . . . . 30,223 14,752
Prepaid inventory . . . . . . . . . . . . . . . . . . . . . . . . . . . . . . . . . . . . . . . . . . . . . . . 12,232 6,586
Prepaid rent and insurance . . . . . . . . . . . . . . . . . . . . . . . . . . . . . . . . . . . . . 4,001 4,428
Prepaid other taxes and duties . . . . . . . . . . . . . . . . . . . . . . . . . . . . . . . . . 2,406 3,851
Forward contracts . . . . . . . . . . . . . . . . . . . . . . . . . . . . . . . . . . . . . . . . . . . . . . — 2,968
Deposits . . . . . . . . . . . . . . . . . . . . . . . . . . . . . . . . . . . . . . . . . . . . . . . . . . . . . . . . 4,240 6,584
Other . . . . . . . . . . . . . . . . . . . . . . . . . . . . . . . . . . . . . . . . . . . . . . . . . . . . . . . . . . . 9,691 13,632
$ 95,660 $ 93,276
5. PROPERTY AND EQUIPMENT
Property and equipment are comprised of the following (U.S. dollars in thousands):
December 31,2011 2012
Land . . . . . . . . . . . . . . . . . . . . . . . . . . . . . . . . . . . . . . . . . . . . . . . . . . . . . . . . . . . $ 19,561 $ 30,411
Buildings . . . . . . . . . . . . . . . . . . . . . . . . . . . . . . . . . . . . . . . . . . . . . . . . . . . . . . . 41,495 38,723
Construction in progress . . . . . . . . . . . . . . . . . . . . . . . . . . . . . . . . . . . . . . . 14,286 85,584
Furniture and fi xtures . . . . . . . . . . . . . . . . . . . . . . . . . . . . . . . . . . . . . . . . . . 48,071 49,062
Computers and equipment . . . . . . . . . . . . . . . . . . . . . . . . . . . . . . . . . . . . 92,336 99,804
Leasehold improvements . . . . . . . . . . . . . . . . . . . . . . . . . . . . . . . . . . . . . . 60,120 49,027
Scanners . . . . . . . . . . . . . . . . . . . . . . . . . . . . . . . . . . . . . . . . . . . . . . . . . . . . . . . . 15,741 17,290
Vehicles . . . . . . . . . . . . . . . . . . . . . . . . . . . . . . . . . . . . . . . . . . . . . . . . . . . . . . . . . 2,153 2,229
293,763 372,130
Less: accumulated depreciation . . . . . . . . . . . . . . . . . . . . . . . . . . . . . . . . (144,258) (142,343)
$ 149,505 $ 229,787
Depreciation of property and equipment totaled $22.7 million, $25.7 million and $25.5 million for the years ended December 31, 2010, 2011 and 2012.

60
6. GOODWILL AND OTHER INTANGIBLE ASSETS
Goodwill and other intangible assets consist of the following (U.S. dollars in thousands):
Carrying Amount atDecember 31,
Goodwill and indefi nite life intangible assets: 2011 2012Goodwill . . . . . . . . . . . . . . . . . . . . . . . . . . . . . . . . . . . . . . . . . . . . . . . . . . . . . . . . . . . . . . . . . . . $ 112,446 $ 112,446
Trademarks and trade names . . . . . . . . . . . . . . . . . . . . . . . . . . . . . . . . . . . . . . . . . . . . . . 24,599 24,599
$ 137,045 $ 137,045
December 31, 2011 December 31, 2012
Finite life intangible assets:Gross Carrying
AmountAccumulated Amortization
Gross Carrying Amount
Accumulated Amortization
Weighted-average Amortization Period
Scanner technology . . . . . . . . $ 46,482 $ 21,457 $ 46,482 $ 24,490 18 years
Developed technology . . . . . 22,500 14,261 22,500 15,085 20 years
Distributor network . . . . . . . . . 11,598 9,089 11,598 9,591 15 years
Trademarks . . . . . . . . . . . . . . . . . 13,401 10,214 13,784 10,925 15 years
Other . . . . . . . . . . . . . . . . . . . . . . . 46,652 26,878 55,416 21,770 8 years
$ 140,633 $ 81,899 $ 149,780 $ 81,861 15 years
Amortization of fi nite-life intangible assets totaled $6.9 million, $7.1 million and $7.9 million for the years ended December 31, 2010, 2011 and 2012, respectively. Annual estimated amortization expense is expected to approximate $7.0 million for each of the fi ve succeeding fi scal years.
All of the Company’s goodwill is based in the U.S. Goodwill and indefi nite life intangible assets are not amortized, rather they are subject to annual impairment tests. Annual impairment tests were completed resulting in no impairment charges for any of the periods shown. Finite life intangibles are amortized over their useful lives unless circumstances occur that cause the Company to revise such lives or review such assets for impairment.
7. OTHER ASSETS
Other assets consist of the following (U.S. dollars in thousands):
December 31,2011 2012
Deferred taxes . . . . . . . . . . . . . . . . . . . . . . . . . . . . . . . . . . . . . . . . . . . . . . . . . . . . . . . . . . . . . . . . . . . $ 29,661 $ 26,302
Deposits for noncancelable operating leases . . . . . . . . . . . . . . . . . . . . . . . . . . . . . . . . . . . 15,559 15,189
Deposit for customs assessment (Note 20) . . . . . . . . . . . . . . . . . . . . . . . . . . . . . . . . . . . . 50,719 46,653
Cash surrender value for life insurance policies . . . . . . . . . . . . . . . . . . . . . . . . . . . . . . . . . 14,925 18,605
Other . . . . . . . . . . . . . . . . . . . . . . . . . . . . . . . . . . . . . . . . . . . . . . . . . . . . . . . . . . . . . . . . . . . . . . . . . . . . 4,721 12,004
$ 115,585 $ 118,753
NU SKIN ENTERPRISES, INC.Notes to Consolidated Financial Statements

61
NU SKIN ENTERPRISES, INC.Notes to Consolidated Financial Statements
8. ACCRUED EXPENSES
Accrued expenses consist of the following (U.S. dollars in thousands):
December 31,2011 2012
Accrued commissions and other payments to distributors . . . . . . . . . . . . . . . . . . . . . $ 68,925 $ 110,950
Other taxes payable . . . . . . . . . . . . . . . . . . . . . . . . . . . . . . . . . . . . . . . . . . . . . . . . . . . . . . . . . . . . . 12,628 23,558
Accrued payroll and payroll taxes . . . . . . . . . . . . . . . . . . . . . . . . . . . . . . . . . . . . . . . . . . . . . . . 18,039 21,381
Accrued payable to vendors . . . . . . . . . . . . . . . . . . . . . . . . . . . . . . . . . . . . . . . . . . . . . . . . . . . . 12,752 6,717
Deferred revenue. . . . . . . . . . . . . . . . . . . . . . . . . . . . . . . . . . . . . . . . . . . . . . . . . . . . . . . . . . . . . . . . 22,007 4,608
Other accrued employee expenses . . . . . . . . . . . . . . . . . . . . . . . . . . . . . . . . . . . . . . . . . . . . . 18,588 30,285
Other . . . . . . . . . . . . . . . . . . . . . . . . . . . . . . . . . . . . . . . . . . . . . . . . . . . . . . . . . . . . . . . . . . . . . . . . . . . . 27,443 35,703
$ 180,382 $ 233,202

62
9. LONG-TERM DEBT
The Company currently has debt pursuant to various credit facilities and other borrowings. The following tables summarize the Company’s long-term debt arrangements as of December 31, 2012:
Facility orArrangement(1)
Original Principal Amount
Balance as of December 31,
2011
Balance as of December 31,
2012(2)Interest
Rate Repayment termsMulti-currency uncommittedshelf facility:
U.S. dollar denominated: $40.0 million $28.6 million $22.9 million 6.2% Notes due July 2016 with annual principal payments that began in July 2010.
$20.0 million $17.1 million $14.3 million 6.2% Notes due January 2017 with annual principal payments that began in January 2011.
Japanese yen denominated:
3.1 billion yen 1.3 billion yen ($17.4 million as of December 31, 2011)
0.9 billion yen ($10.2 million as of December 31, 2012)
1.7% Notes due April 2014 with annual principal payments that began in April 2008.
2.3 billion yen 1.9 billion yen ($25.3 million as of December 31, 2011)
1.6 billion yen ($18.7 million as of December 31, 2012)
2.6% Notes due September 2017 with annual principal payments that began in September 2011.
2.2 billion yen 1.9 billion yen ($24.2 million as of December 31, 2011)
1.6 billion yen ($17.9 million as of December 31, 2012)
3.3% Notes due January 2017 with annual principal payments that began in January 2011.
8.0 billion yen(3)
N/A 8.0 billion yen ($92.0 million as of December 31, 2012)
1.7% Notes due May 2022 with annual principal payments that begin in May 2016.
Committed loan:
U.S. dollar denominated: $30.0 million $24.0 million $18.0 million Variable 30 day: 1.21%
Amortizes $0.5 million every30 days.
Revolving credit facility(4) N/A None None N/A
(1) On May 25, 2012, the Company (a) entered into an amendment and restatement of its multi-currency uncommitted shelf facility to extend the termination date to May 25, 2015 and provide for the issuance of up to $150 million in additional senior promissory notes; (b) entered into an amendment and restatement of the Company’s revolving credit facility to extend the termination date to May 9, 2014; and (c) terminated pledges and guarantees of its subsidiaries as security for the multi-currency uncommitted shelf facility, committed loan and revolving credit facility. The committed loan continues to be secured by deeds of trust with respect to the Company’s corporate head-quarters and distribution center in Provo, Utah.
(2) The current portion of the Company’s long-term debt (i.e. becoming due in the next 12 months) includes $12.4 million of the balance of its Japanese yen-denominated debt under the multi-currency uncommitted shelf facility, $8.6 million of the balance on its U.S. dollar denominated debt under the multi-currency uncommitted shelf facility and $18.0 million of the Company’s committed loan.
(3) On May 31, 2012, the Company issued a series of yen denominated senior promissory notes under the multi-currency uncommitted shelf facility with an aggregate principal amount of 8.0 billion yen.
(4) On February 5, 2013, the Company entered into a second amendment of the amended and restated credit agreement. The amendment increased the commitment amount from $25.0 million to $100.0 million from February 2013 to February 2014, after which the commitment amount returns to the current level over a three-month period.
NU SKIN ENTERPRISES, INC.Notes to Consolidated Financial Statements

63
NU SKIN ENTERPRISES, INC.Notes to Consolidated Financial Statements
Interest expense relating to debt totaled $5.8 million, $4.8 million and $5.2 million for the years ended December 31, 2010, 2011 and 2012, respectively.
The notes and shelf facility contain other terms and conditions and a� rmative and negative fi nancial covenants customary for credit facilities of this type, including a requirement to maintain a minimum cash balance of $65.0 million. As of December 31, 2012, the Company is in compliance with all fi nancial covenants.
Maturities of all long-term debt at December 31, 2012, based on the year-end exchange rate, are as follows (U.S. dollars in thousands):
Year Ending December 31,2013 . . . . . . . . . . . . . . . . . . . . . . . . . . . . . . . . . . . . . . . . . . . $ 39,019
2014 . . . . . . . . . . . . . . . . . . . . . . . . . . . . . . . . . . . . . . . . . . . 21,019
2015 . . . . . . . . . . . . . . . . . . . . . . . . . . . . . . . . . . . . . . . . . . . 15,881
2016 . . . . . . . . . . . . . . . . . . . . . . . . . . . . . . . . . . . . . . . . . . . 29,026
2017 . . . . . . . . . . . . . . . . . . . . . . . . . . . . . . . . . . . . . . . . . . . 23,312
Thereafter . . . . . . . . . . . . . . . . . . . . . . . . . . . . . . . . . . . . . 65,725
Total . . . . . . . . . . . . . . . . . . . . . . . . . . . . . . . . . . . . . . . $ 193,982
10. LEASE OBLIGATIONS
The Company leases o� ce space and computer hardware under noncancelable long-term operating leases. Most leases include renewal options of at least three years. Minimum future operating lease obligations at December 31, 2012 are as follows (U.S. dollars in thousands):
Year Ending December 31,2013 . . . . . . . . . . . . . . . . . . . . . . . . . . . . . . . . . . . . . . . . . . . $ 17,309
2014 . . . . . . . . . . . . . . . . . . . . . . . . . . . . . . . . . . . . . . . . . . . 9,474
2015 . . . . . . . . . . . . . . . . . . . . . . . . . . . . . . . . . . . . . . . . . . . 5,353
2016 . . . . . . . . . . . . . . . . . . . . . . . . . . . . . . . . . . . . . . . . . . . 2,261
2017 . . . . . . . . . . . . . . . . . . . . . . . . . . . . . . . . . . . . . . . . . . . 1,519
Thereafter . . . . . . . . . . . . . . . . . . . . . . . . . . . . . . . . . . . . . 1,695
Total . . . . . . . . . . . . . . . . . . . . . . . . . . . . . . . . . . . . . . . $ 37,611
Rental expense for operating leases totaled $28.8 million, $25.8 million and $27.7 million for the years ended December 31, 2010, 2011 and 2012, respectively.

64
11. CAPITAL STOCK
The Company’s authorized capital stock consists of 25 million shares of preferred stock, par value $.001 per share, 500 million shares of Class A common stock, par value $.001 per share, and 100 million shares of Class B common stock, par value $.001 per share. The shares of Class A common stock and Class B common stock are identical in all respects, except for voting rights and certain conversion rights and transfer restrictions, as follows: (1) each share of Class A common stock entitles the holder to one vote on matters submitted to a vote of the Company’s stockholders and each share of Class B common stock entitles the holder to ten votes on each such matter; (2) stock dividends of Class A common stock may be paid only to holders of Class A common stock and stock dividends of Class B common stock may be paid only to holders of Class B common stock; (3) if a holder of Class B common stock transfers such shares to a person other than a permitted transferee, as defi ned in the Company’s Certifi cate of Incorporation, such shares will be converted automatically into shares of Class A common stock; and (4) Class A common stock has no conversion rights; however, each share of Class B common stock is convertible into one share of Class A common stock, in whole or in part, at any time at the option of the holder. All outstanding Class B shares have been converted to Class A shares. As of December 31, 2011 and 2012, there were no preferred or Class B common shares outstanding.
WEIGHTED-AVERAGE COMMON SHARES OUTSTANDINGThe following is a reconciliation of the weighted-average common shares outstanding for purposes of computing basic and diluted net
income per share (in thousands):
Year Ended December 31,2010 2011 2012
Basic weighted-average common shares outstanding . . . . . . . . . . . . 62,370 62,066 60,600
E� ect of dilutive securities:Stock awards and options . . . . . . . . . . . . . . . . . . . . . . . . . . . . . . . . . . . . . . . 2,177 2,480 2,425
Diluted weighted-average common shares outstanding . . . . . . . . . 64,547 64,546 63,025
For the years ended December 31, 2010, 2011 and 2012, other stock options totaling 0.4 million, none and 0.1 million, respectively, were excluded from the calculation of diluted earnings per share because they were anti-dilutive.
NU SKIN ENTERPRISES, INC.Notes to Consolidated Financial Statements
REPURCHASES OF COMMON STOCKThe board of directors has approved a stock repurchase program
authorizing the Company to repurchase the Company’s outstanding shares of Class A common stock on the open market or in private trans-actions. The repurchases are used primarily to o� set dilution from the Company’s equity incentive plans and for strategic initiatives. During the years ended December 31, 2010, 2011 and 2012, the Company repurchased approximately 2.2 million, 1.9 million and 4.6 million shares of Class A common stock for an aggregate price of approximately $58.5 million, $67.1 million and $201.5 million, respectively. In May 2012, the Company’s board of directors authorized an increase of $250.0 million in the amount available under the Company’s ongoing stock repurchase program. At December 31, 2012, $135.3 million was available for repurchases under the stock repurchase program.
12. STOCK–BASED COMPENSATION
At December 31, 2012, the Company had the following stock-based employee compensation plans::
EQUITY INCENTIVE PLANSIn 1996, the Company’s board of directors adopted the Nu Skin
Enterprises, Inc. 1996 Stock Incentive Plan (the “1996 Stock Incentive Plan”). The 1996 Stock Incentive Plan was approved by the Compa-ny’s stockholders at the Company’s 1997 Annual Meeting of Stock-holders and approved, as amended, at the Company’s May 1999 An-nual Meeting of Stockholders. In 2006, the Company’s Board of Directors approved the Nu Skin Enterprises, Inc. 2006 Stock Incen-tive Plan (the “2006 Stock Incentive Plan”). The 2006 Stock Incentive

65
NU SKIN ENTERPRISES, INC.Notes to Consolidated Financial Statements
Plan was approved by the Company’s stockholders at the Compa-ny’s 2006 Annual Meeting of Stockholders held in May of 2006. The 1996 Stock Incentive Plan and the 2006 Stock Incentive Plan provide for granting of stock awards and options to purchase common stock to executives, other employees, independent consultants and direc-tors of the Company and its Subsidiaries. Stock options granted un-der these plans are generally non-qualifi ed stock options, but the plans permit some stock options granted to qualify as “incentive stock options” under the U.S. Internal Revenue Code. The exercise price of a stock option generally is equal to the fair market value of the Company’s common stock on the stock option grant date. The con-tractual term of stock options granted since 1996 is generally ten years. However, for stock options granted beginning in the second quarter of 2006, the contractual term has been shortened to seven years. Currently, all shares issued upon the exercise of stock options are from the Company’s treasury shares. With the adoption of the 2010 Omnibus Incentive Plan discussed below, no further grants will be made under the 1996 Stock Incentive Plan or the 2006 Stock Incentive Plan.
In April 2010, the Company’s Board of Directors approved the Nu Skin Enterprises, Inc. 2010 Omnibus Incentive Plan (the “2010 Omnibus Incentive Plan”). This plan was approved by the Company’s stockholders at the Company’s 2010 Annual Meeting of Stockhold-ers held in May of 2010. The 2010 Omnibus Incentive Plan provides for granting of a variety of equity based awards including stock options, stock appreciation rights, restricted stock, restricted stock units, other share based awards, performance cash, performance shares and performance units to executives, other employees, inde-pendent consultants and directors of the Company and its subsidiaries. Options granted under the 2010 Omnibus Incentive Plan are generally non-qualifi ed stock options, but the 2010 Omnibus Incentive Plan permits some stock options granted to qualify as “incentive stock options” under the U.S. Internal Revenue Code. The exercise price of a stock option generally is equal to the fair market value of the Company’s common stock on the stock option grant date. The contractual term of a stock option granted under the 2010 Omnibus Incentive Plan is seven years. Currently, all shares issued upon the exercise of stock options are from the Company’s treasury shares. Seven million shares, subject to certain adjustments, were authorized for issuance under the 2010 Omnibus Incentive Plan.
The Company has traditionally granted time-vested options. However, the Company has made performance based grants over the last four years. The following is a summary of the terms of the two most signifi cant grants of performance awards. The compensation committee of the board of directors approved the grant of perfor-mance stock options to certain senior level executives in the fourth and fi rst quarter of 2007 and 2008, respectively, under the 2006 Stock Incentive Plan. Vesting for the options is performance based, with the options vesting in two installments if the Company’s earn-ings per share equal or exceed the two established performance lev-els, measured in terms of diluted earnings per share. Fifty percent of the options vest upon earnings per share meeting or exceeding the fi rst performance level and fi fty percent of the options vest upon earnings per share meeting or exceeding the second performance level. Both of the performance levels were met prior to December 31, 2010 for these performance stock options.
In November 2010, the compensation committee of the board of directors approved the grant of performance stock options to certain key employees under the 2010 Omnibus Incentive Plan. Vesting for the options is performance based, with the options vesting in three installments if the Company’s earnings per share equal or exceed the three established performance levels, measured in terms of diluted earnings per share. One third of the options will vest upon earnings per share meeting or exceeding the fi rst performance level, one third of the options will vest upon earnings per share meeting or exceeding the second performance level and one third of the options will vest upon earnings per share meeting or exceeding the third performance level. During the second quarter of 2012, the fi rst performance level was achieved. Remaining unvested options will terminate upon the Company’s failure to meet certain performance thresholds for each of years 2013 through 2015. In addition, all unvested options will terminate on March 30, 2016. The Company records an expense each period for the estimated amount of expense associated with the Company’s projected achievement of the perfor-mance based targets.
The Company has also issued other performance based awards to a limited number of participants that similarly vest, or become eligible for vesting, upon achievement of various performance targets.

66
The fair value of stock option awards was estimated using the Black-Scholes option-pricing model with the following assumptions and weighted-average fair values as follows:
December 31,Stock Options: 2010 2011 2012Weighted average grant date fair value of grants . . . . . . . . . . . . . . . . . $ 8.61 $ 9.98 $ 13.31
Risk-free interest rate(1) . . . . . . . . . . . . . . . . . . . . . . . . . . . . . . . . . . . . . . . . . . . . . 1.8% 1.8% 0.8%
Dividend yield(2) . . . . . . . . . . . . . . . . . . . . . . . . . . . . . . . . . . . . . . . . . . . . . . . . . . . . 2.6% 2.6% 2.7%
Expected volatility(3) . . . . . . . . . . . . . . . . . . . . . . . . . . . . . . . . . . . . . . . . . . . . . . . 37.8% 38.4% 46.8%
Expected life in months(4) . . . . . . . . . . . . . . . . . . . . . . . . . . . . . . . . . . . . . . . . . . 69 months 63 months 58 months
(1) The risk-free interest rate is based upon the rate on a zero coupon U.S. Treasury bill, for periods within the contractual life of the option, in e� ect at the time of the grant. (2) The dividend yield is based on the average of historical stock prices and actual dividends paid. (3) Expected volatility is based on the historical volatility of the Company’s stock price, over a period similar to the expected life of the option.(4) The expected term of the option is based on the historical employee exercise behavior, the vesting terms of the respective option, and a contractual life of either seven or ten years.
NU SKIN ENTERPRISES, INC.Notes to Consolidated Financial Statements

67
NU SKIN ENTERPRISES, INC.Notes to Consolidated Financial Statements
Options under the plans as of December 31, 2012 and changes during the year ended December 31, 2012 were as follows:
Shares(in thousands)
Weighted-average
Exercise Price
Weighted- average
Remaining Contractual
Term (in years)
Aggregate Intrinsic Value (in thousands)
Options activity — service based Outstanding at December 31, 2011. . . . . . . . . . . . . . . . . . . . . . 3,505.5 $ 16.68
Granted . . . . . . . . . . . . . . . . . . . . . . . . . . . . . . . . . . . . . . . . . . . . . . . . . 172.5 47.47
Exercised . . . . . . . . . . . . . . . . . . . . . . . . . . . . . . . . . . . . . . . . . . . . . . . . (425.8) 15.09
Forfeited/cancelled/expired . . . . . . . . . . . . . . . . . . . . . . . . . . . . . (17.0) 12.23
Outstanding at December 31, 2012 . . . . . . . . . . . . . . . . . . . . . 3,235.2 18.55 2.95 $ 61,819
Exercisable at December 31, 2012 . . . . . . . . . . . . . . . . . . . . . . . 2,477.3 16.95 2.49 49,850
Options activity — performance basedOutstanding at December 31, 2011. . . . . . . . . . . . . . . . . . . . . . 2,754.0 $ 27.32
Granted . . . . . . . . . . . . . . . . . . . . . . . . . . . . . . . . . . . . . . . . . . . . . . . . . 57.5 54.08
Exercised . . . . . . . . . . . . . . . . . . . . . . . . . . . . . . . . . . . . . . . . . . . . . . . . (76.5) 20.46
Forfeited/cancelled/expired . . . . . . . . . . . . . . . . . . . . . . . . . . . . . (8.0) 30.43
Outstanding at December 31, 2012 . . . . . . . . . . . . . . . . . . . . . 2,727.0 28.06 4.28 $ 25,483
Exercisable at December 31, 2012 . . . . . . . . . . . . . . . . . . . . . . . 1,261.3 24.32 3.54 16,062
Options activity — all optionsOutstanding at December 31, 2011. . . . . . . . . . . . . . . . . . . . . . 6,259.5 $ 21.36
Granted . . . . . . . . . . . . . . . . . . . . . . . . . . . . . . . . . . . . . . . . . . . . . . . . . 230.0 49.12
Exercised . . . . . . . . . . . . . . . . . . . . . . . . . . . . . . . . . . . . . . . . . . . . . . . . (502.3) 15.90
Forfeited/cancelled/expired . . . . . . . . . . . . . . . . . . . . . . . . . . . . . (25.0) 18.03
Outstanding at December 31, 2012 . . . . . . . . . . . . . . . . . . . . . 5,962.2 22.90 3.56 $ 87,302
Exercisable at December 31, 2012 . . . . . . . . . . . . . . . . . . . . . . . 3,738.6 19.44 2.84 65,912
The aggregate intrinsic value in the table above represents the total pretax intrinsic value (the di� erence between the Company’s closing stock price on the last trading day of the respective years and the exercise price, multiplied by the number of in-the-money options) that would have been received by the option holders had all option holders exercised their options on December 31, 2012. This amount varies based on the fair market value of the Company’s stock. The total fair value of options vested and expensed was $6.5 million, net of tax, for the year ended December 31, 2012.

68
Cash proceeds, tax benefi ts, and intrinsic value related to total stock options exercised during 2010, 2011 and 2012, were as follows (in millions):
December 31,2010 2011 2012
Cash proceeds from stock options exercised . . . . . . . . . . . . . . . . . . . . . $ 21.2 $ 29.7 $ 8.0
Tax benefi t realized for stock options exercised . . . . . . . . . . . . . . . . . . . 10.3 17.4 6.3
Intrinsic value of stock options exercised . . . . . . . . . . . . . . . . . . . . . . . . . . 25.4 61.6 10.6
Nonvested restricted stock awards as of December 31, 2012 and changes during the year ended December 31, 2012 were as follows:
Number of Shares (in thousands)
Weighted-average Grant Date Fair Value
Nonvested at December 31, 2011 . . . . . . . . . . . . . . . . . . . . . . . . . . . . . . . . . . . . . . . . . . . . . . . . . . . . . . . . . . . . 663.7 $ 27.84
Granted . . . . . . . . . . . . . . . . . . . . . . . . . . . . . . . . . . . . . . . . . . . . . . . . . . . . . . . . . . . . . . . . . . . . . . . . . . . . . . . . . . . . . . 328.6 53.35
Vested . . . . . . . . . . . . . . . . . . . . . . . . . . . . . . . . . . . . . . . . . . . . . . . . . . . . . . . . . . . . . . . . . . . . . . . . . . . . . . . . . . . . . . . . (259.5) 26.71
Forfeited . . . . . . . . . . . . . . . . . . . . . . . . . . . . . . . . . . . . . . . . . . . . . . . . . . . . . . . . . . . . . . . . . . . . . . . . . . . . . . . . . . . . . (3.9) 38.65
Nonvested at December 31, 2012 . . . . . . . . . . . . . . . . . . . . . . . . . . . . . . . . . . . . . . . . . . . . . . . . . . . . . . . . . . . . 729.0 39.68
As of December 31, 2012, there was $17.0 million of unrecognized stock-based compensation expense related to nonvested restricted stock awards. That cost is expected to be recognized over a weighted-average period of 2.3 years. As of December 31, 2012, there was $8.4 million of unrecognized stock-based compensation expense related to nonvested stock option awards. That cost is expected to be recognized over a weighted-average period of 2.3 years.
NU SKIN ENTERPRISES, INC.Notes to Consolidated Financial Statements

69
NU SKIN ENTERPRISES, INC.Notes to Consolidated Financial Statements
12. FAIR VALUE
Assets and liabilities recorded at fair value in the consolidated balance sheets are categorized based upon the level of judgment associ-ated with the inputs used to measure their fair value.
The following tables present the fair value hierarchy for those assets and liabilities measured at fair value on a recurring basis as of De-cember 31, 2011 and December 31, 2012 (U.S. dollars in thousands):
Fair Value at December 31, 2011Level 1 Level 2 Level 3 Total
Financial assets (liabilities):Cash equivalents. . . . . . . . . . . . . . . . . . . . . . . . . . . . . . . . . . . . . . . . . . . . . . . . . . $ 15,733 $ — $ — $ 15,733
Forward contracts . . . . . . . . . . . . . . . . . . . . . . . . . . . . . . . . . . . . . . . . . . . . . . . . — (1,580) — (1,580)
Insurance company contracts . . . . . . . . . . . . . . . . . . . . . . . . . . . . . . . . . . . . — — 14,925 14,925
Total . . . . . . . . . . . . . . . . . . . . . . . . . . . . . . . . . . . . . . . . . . . . . . . . . . . . . . . . . . . $ 15,733 $ (1,580) $ 14,925 $ 29,078
Fair Value at December 31, 2012Level 1 Level 2 Level 3 Total
Financial assets (liabilities):Cash equivalents. . . . . . . . . . . . . . . . . . . . . . . . . . . . . . . . . . . . . . . . . . . . . . . . . . $ 76,006 $ — $ — $ 76,006
Forward contracts . . . . . . . . . . . . . . . . . . . . . . . . . . . . . . . . . . . . . . . . . . . . . . . . — 2,969 — 2,969
Insurance company contracts . . . . . . . . . . . . . . . . . . . . . . . . . . . . . . . . . . . . — — 18,605 18,605
Total . . . . . . . . . . . . . . . . . . . . . . . . . . . . . . . . . . . . . . . . . . . . . . . . . . . . . . . . . . . $ 76,006 $ 2,969 $ 18,605 $ 97,580
The following methods and assumptions were used to determine the fair value of each class of assets and liabilities recorded at fair value in the consolidated balance sheets:
Cash equivalents: Cash equivalents primarily consist of highly rated money market funds with maturities of three months or less, and are purchased daily at par value with specifi ed yield rates. Due to the high ratings and short-term nature of the funds, the Company considers all cash equivalents as Level I.
Forward contracts: To hedge foreign currency risks, the Company uses foreign currency exchange forward contracts, where possible and
practical. These forward contracts are valued using standard valuation formulas with assumptions about foreign currency exchange rates derived from existing exchange rates.
Insurance Company Contracts: ASC 820 preserves practicability exceptions to fair value measurements provided by other applicable GAAP. The guidance in ASC 715-30-35-60 allows a reporting entity, as a practical expedient, to use cash surrender value or conversion value as an expedient for fair value when it is present. Accordingly, the Company determines the fair value of its insurance company contracts as the cash-surrender value of life insurance policies held in its Rabbi Trust as disclosed in Note 16 “Executive Deferred Compensation Plan.”

70
The following table provides a summary of changes in fair value of the Company’s Level 3 marketable securities (U.S. dollars in thousands):
Insurance Company Contracts
Beginning balance at January 1, 2011 . . . . . . . . . . . . . . . . . . . . . . . . . . . . . . . . . . . . . . . . . . . . . . . . . . . . . $ 12,967
Actual return on plan assets:Relating to assets still held at the reporting date . . . . . . . . . . . . . . . . . . . . . . . . . . . . . . . . . . . . (365)
Purchases and issuances . . . . . . . . . . . . . . . . . . . . . . . . . . . . . . . . . . . . . . . . . . . . . . . . . . . . . . . . . . . . 2,883
Sales and settlements . . . . . . . . . . . . . . . . . . . . . . . . . . . . . . . . . . . . . . . . . . . . . . . . . . . . . . . . . . . . . . . (560)
Transfers into Level 3 . . . . . . . . . . . . . . . . . . . . . . . . . . . . . . . . . . . . . . . . . . . . . . . . . . . . . . . . . . . . . . . . —
Ending balance at December 31, 2011 . . . . . . . . . . . . . . . . . . . . . . . . . . . . . . . . . . . . . . . . . . . . . . . . . . . . $ 14,925
Actual return on plan assets:Relating to assets still held at the reporting date . . . . . . . . . . . . . . . . . . . . . . . . . . . . . . . . . . . . 1,560
Purchases and issuances . . . . . . . . . . . . . . . . . . . . . . . . . . . . . . . . . . . . . . . . . . . . . . . . . . . . . . . . . . . . 2,970
Sales and settlements . . . . . . . . . . . . . . . . . . . . . . . . . . . . . . . . . . . . . . . . . . . . . . . . . . . . . . . . . . . . . . . (850)
Transfers into Level 3 . . . . . . . . . . . . . . . . . . . . . . . . . . . . . . . . . . . . . . . . . . . . . . . . . . . . . . . . . . . . . . . . —
Ending balance at December 31, 2012 . . . . . . . . . . . . . . . . . . . . . . . . . . . . . . . . . . . . . . . . . . . . . . . . . . . . $ 18,605
14. INCOME TAXES
Consolidated income before provision for income taxes consists of the following for the years ended December 31, 2010, 2011 and 2012 (U.S. dollars in thousands):
2010 2011 2012U.S. . . . . . . . . . . . . . . . . . . . . . . . . . . . . . . . . . . . . . . . . . . . . . . . . . . . . . . . . . . . . . . . . $ 141,069 $ 142,929 $ 259,309
Foreign . . . . . . . . . . . . . . . . . . . . . . . . . . . . . . . . . . . . . . . . . . . . . . . . . . . . . . . . . . . . 66,544 83,840 85,933
Total . . . . . . . . . . . . . . . . . . . . . . . . . . . . . . . . . . . . . . . . . . . . . . . . . . . . . . . . . . . . $ 207,613 $ 226,769 $ 345,242
The provision for current and deferred taxes for the years ended December 31, 2010, 2011 and 2012 consists of the following (U.S. dollars in thousands):
2010 2011 2012Current . . . . . . . . . . . . . . . . . . . . . . . . . . . . . . . . . . . . . . . . . . . . . . . . . . . . . . . . . . . .
Federal . . . . . . . . . . . . . . . . . . . . . . . . . . . . . . . . . . . . . . . . . . . . . . . . . . . . . . . . . $ 45,761 $ 14,723 $ 70,727
State . . . . . . . . . . . . . . . . . . . . . . . . . . . . . . . . . . . . . . . . . . . . . . . . . . . . . . . . . . . 3,825 2,245 2,425
Foreign . . . . . . . . . . . . . . . . . . . . . . . . . . . . . . . . . . . . . . . . . . . . . . . . . . . . . . . . . 27,450 56,973 45,851
77,036 73,941 119,003
Deferred . . . . . . . . . . . . . . . . . . . . . . . . . . . . . . . . . . . . . . . . . . . . . . . . . . . . . . . . . . .Federal . . . . . . . . . . . . . . . . . . . . . . . . . . . . . . . . . . . . . . . . . . . . . . . . . . . . . . . . . (2,558) 17,756 12,918
State . . . . . . . . . . . . . . . . . . . . . . . . . . . . . . . . . . . . . . . . . . . . . . . . . . . . . . . . . . . 212 582 656
Foreign . . . . . . . . . . . . . . . . . . . . . . . . . . . . . . . . . . . . . . . . . . . . . . . . . . . . . . . . . (3,128) (18,840) (8,980)
(5,474) (502) 4,594
Provision for income taxes . . . . . . . . . . . . . . . . . . . . . . . . . . . . . . . . . . . . . . . . $ 71,562 $ 73,439 $ 123,597
NU SKIN ENTERPRISES, INC.Notes to Consolidated Financial Statements

71
NU SKIN ENTERPRISES, INC.Notes to Consolidated Financial Statements
The Company’s foreign taxes paid are high relative to foreign operating income and the Company’s U.S. taxes paid are low relative to U.S. operating income due largely to the fl ow of funds among the Company’s Subsidiaries around the world. As payments for services, management fees, license arrangements and royalties are made from the Company’s foreign a� liates to its U.S. corporate headquarters, these payments often incur withholding and other forms of tax that are generally creditable for U.S. tax purposes. Therefore, these payments lead to increased foreign e� ective tax rates and lower U.S. e� ective tax rates. Variations (or shifts) occur in the Company’s foreign and U.S. e� ective tax rates from year to year depending on several factors. These factors include the impact of global transfer prices, the timing and level of remittances from foreign a� liates, profi ts and losses in various markets, in the valuation of deferred tax assets or liabilities, or changes in tax laws, regulations, accounting principles, or interpretations thereof.

72
The principal components of deferred taxes are as follows (U.S. dollars in thousands):
Year Ended December 31,2011 2012
Deferred tax assets:Inventory di� erences . . . . . . . . . . . . . . . . . . . . . . . . . . . . . . . . . . . . . . . . . . . . . . . . . . . . . . . . . $ 3,796 $ 3,490
Foreign tax credit and other foreign benefi ts . . . . . . . . . . . . . . . . . . . . . . . . . . . . . . . . 25,149 42,128
Stock-based compensation . . . . . . . . . . . . . . . . . . . . . . . . . . . . . . . . . . . . . . . . . . . . . . . . . . 9,674 13,772
Accrued expenses not deductible until paid . . . . . . . . . . . . . . . . . . . . . . . . . . . . . . . . . 37,992 49,258
Foreign currency exchange . . . . . . . . . . . . . . . . . . . . . . . . . . . . . . . . . . . . . . . . . . . . . . . . . . 16,927 10,947
Net operating losses . . . . . . . . . . . . . . . . . . . . . . . . . . . . . . . . . . . . . . . . . . . . . . . . . . . . . . . . . 11,656 10,561
Capitalized research and development . . . . . . . . . . . . . . . . . . . . . . . . . . . . . . . . . . . . . . 14,746 10,535
Other . . . . . . . . . . . . . . . . . . . . . . . . . . . . . . . . . . . . . . . . . . . . . . . . . . . . . . . . . . . . . . . . . . . . . . . . 568 648
Gross deferred tax assets . . . . . . . . . . . . . . . . . . . . . . . . . . . . . . . . . . . . . . . . . . . . . . . . . 120,508 141,339
Deferred tax liabilities:Exchange gains and losses . . . . . . . . . . . . . . . . . . . . . . . . . . . . . . . . . . . . . . . . . . . . . . . . . . . 3,300 7,504
Intangibles step-up . . . . . . . . . . . . . . . . . . . . . . . . . . . . . . . . . . . . . . . . . . . . . . . . . . . . . . . . . . 12,179 18,379
Amortization of intangibles . . . . . . . . . . . . . . . . . . . . . . . . . . . . . . . . . . . . . . . . . . . . . . . . . . 14,457 15,840
Foreign outside basis in controlled foreign corporation . . . . . . . . . . . . . . . . . . . . . . 16,081 32,592
Other . . . . . . . . . . . . . . . . . . . . . . . . . . . . . . . . . . . . . . . . . . . . . . . . . . . . . . . . . . . . . . . . . . . . . . . . 11,431 20,867
Gross deferred tax liabilities . . . . . . . . . . . . . . . . . . . . . . . . . . . . . . . . . . . . . . . . . . . . . . 57,448 95,182
Valuation allowance . . . . . . . . . . . . . . . . . . . . . . . . . . . . . . . . . . . . . . . . . . . . . . . . . . . . . . . . . . . . . (11,611) (10,522)
Deferred taxes, net . . . . . . . . . . . . . . . . . . . . . . . . . . . . . . . . . . . . . . . . . . . . . . . . . . . . . . . . . . . . . . $ 51,449 $ 35,635
At December 31, 2012, the Company had foreign operating loss carryforwards of approximately $46.2 million for tax purposes, which will be available to o� set future taxable income. If not used, $11.6 million of carryforwards will expire between 2013 and 2022, while $34.7 million do not expire. A valuation allowance has been placed on foreign operating loss carryforwards of approximately $41.0 million.
The valuation allowance primarily represents amounts for foreign operating loss carryforwards for which it is more likely than not some portion or all of the deferred tax asset will not be realized. In making such determination, the Company considers all available positive and negative evidence, including future reversals of existing taxable temporary di� erence, projected future taxable income, tax planning strategies and recent fi nancial operations. When the Company determines that there is su� cient taxable income to utilize the net operating losses, the valuation will be released which would reduce the provision for income taxes.
NU SKIN ENTERPRISES, INC.Notes to Consolidated Financial Statements

73
NU SKIN ENTERPRISES, INC.Notes to Consolidated Financial Statements
The components of deferred taxes, net on a jurisdiction basis are as follows (U.S. dollars in thousands):
Year Ended December 31,2011 2012
Net current deferred tax assets . . . . . . . . . . . . . . . . . . . . . . . . . . . . . . . . . . . . . . . . . . . . . . . . . $ 32,867 $ 40,475
Net noncurrent deferred tax assets . . . . . . . . . . . . . . . . . . . . . . . . . . . . . . . . . . . . . . . . . . . . 29,661 26,302
Total net deferred tax assets . . . . . . . . . . . . . . . . . . . . . . . . . . . . . . . . . . . . . . . . . . . . . . . . 62,528 66,777
Net current deferred tax liabilities . . . . . . . . . . . . . . . . . . . . . . . . . . . . . . . . . . . . . . . . . . . . . . 7 2
Net noncurrent deferred tax liabilities . . . . . . . . . . . . . . . . . . . . . . . . . . . . . . . . . . . . . . . . . . 11,072 31,140
Total net deferred tax liabilities . . . . . . . . . . . . . . . . . . . . . . . . . . . . . . . . . . . . . . . . . . . . . . 11,079 31,142
Deferred taxes, net . . . . . . . . . . . . . . . . . . . . . . . . . . . . . . . . . . . . . . . . . . . . . . . . . . . . . . . . . . . . . $ 51,449 $ 35,635
The Company is subject to regular audits by federal, state and foreign tax authorities. These audits may result in proposed assessments that may result in additional tax liabilities.
The actual tax rate for the years ended December 31, 2010, 2011 and 2012 compared to the statutory U.S. Federal tax rate is as follows:
Year Ended December 31,2010 2011 2012
Income taxes at statutory rate . . . . . . . . . . . . . . . . . . . . . . . . . . . . 35.00% 35.00% 35.00%
Non-deductible expenses . . . . . . . . . . . . . . . . . . . . . . . . . . . . . . . . .10 .16 .12
Extraterritorial income tax credit . . . . . . . . . . . . . . . . . . . . . . . . . . . .00 (3.39) .00
Other . . . . . . . . . . . . . . . . . . . . . . . . . . . . . . . . . . . . . . . . . . . . . . . . . . . . . (.63) .62 .68
34.47% 32.39% 35.80%
The lower e� ective tax rate in 2011 compared to 2010 and 2012 was primarily attributable to a one-time discrete tax benefi t of $7.7 million associated with the e� ective settlement of an IRS audit for tax years 2005–2008. In 2011, the Company entered into a closing agreement with the IRS on the Extraterritorial Income Exclusion for the exportation of products outside the United States.
15. EMPLOYEE BENEFIT PLAN
The Company has a 401(k) defi ned contribution plan which permits participating employees to defer up to a maximum of 100% of their compensation, subject to limitations established by the Internal Revenue Service. Employees age 18 and older are eligible to contribute to the plan starting the fi rst day of employment. After completing at least one day of service, employees are eligible to receive matching contribu-tions from the Company. In 2010, 2011, and 2012 the Company matched employees’ base pay up to 4% each year. The Company’s matching contributions cli� vest after two years of service. The Company recorded compensation expense of $2.1 million, $2.3 million and $2.4 million for the years ended December 31, 2010, 2011 and 2012, respectively, related to its contributions to the plan. The Company may make an ad-ditional discretionary contributions to the plan of up to 10% of employees’ base pay. The Company’s discretionary contributions vest 20% per year for an employee’s fi rst fi ve years of service. For the year ended December 31, 2011, the fi rst year of this “retire ready” contribution, the Company made additional discretionary contributions of approximately $2.1 million and for the year ended December 31, 2012, the Company plans to make an additional discretionary contribution of approximately $3.5 million.

74
The Company has a defi ned benefi t pension plan for its employees in Japan. All employees of Nu Skin Japan, after certain years of service, are entitled to pension plan benefi ts when they terminate employment with Nu Skin Japan. The accrued pension liability was $7.4 million, $8.4 million and $7.6 million as of December 31, 2010, 2011 and 2012, respectively. Although Nu Skin Japan has not specifi cally funded this obligation, as it is not required to do so, Nu Skin Japan believes it maintains adequate cash balances for this defi ned benefi t pension plan. The Company recorded pension expense of $1.1 million, $0.9 million and $1.1 million for the years ended December 31, 2010, 2011 and 2012, respectively.
16. EXECUTIVE DEFERRED COMPENSATION PLAN
The Company has an executive deferred compensation plan for select management personnel. Under this plan, the Company may make a contribution of up to 10% of a participant’s salary. In addition, each participant has the option to defer a portion of their compensation up to a maximum of 80% of their base salary and 100% of their bonuses. Participant contributions are immediately vested. Company contribu-tions vest 50% after ten years of service and 5% each year of service thereafter. In addition, any unvested company contributions will fully vest on the earlier of: (a) the participant attaining 60 years of age; and (b) death or disability.
The Company recorded compensation expense of $3.4 million, $1.7 million and $1.2 million for the years ended December 31, 2010, 2011 and 2012, respectively, related to its contributions to the plan. The total long-term deferred compensation liability under the deferred compen-sation plan was $17.3 million and $22.1 million for the years ended December 31, 2011 and 2012, respectively, related to its contributions to the plan and is included in other long-term liabilities.
All benefi ts under the deferred compensation plan are unsecured obligations of the Company. The Company has contributed assets to a “rabbi trust” for the payment of benefi ts under the deferred compensation plan. As the assets of the trust are available to satisfy the claims of general creditors if the Company becomes insolvent, the amounts held in the trust are accounted for as an investment on the Company’s consolidated balance sheet of $14.9 million and $18.6 million for the years ended December 31, 2011 and 2012, respectively.
17. DERIVATIVE FINANCIAL INSTRUMENTS
The Company held mark-to-market forward contracts designated as foreign currency cash fl ow hedges with notional amounts totaling 1.9 billion Japanese yen ($21.9 million as of December 31, 2012) and 6.5 billion Japanese yen ($83.6 million as of December 31, 2011) to hedge forecasted foreign-currency-denominated intercompany transactions.
The contracts held at December 31, 2012 have maturities through October 2013, and accordingly, all unrealized gains and losses on foreign currency cash fl ow hedges included in accumulated other comprehensive loss will be recognized in current earnings over the next 10 months. There were $0.1 million of pre-tax net gains, $1.4 million of pre-tax net losses, and $0.5 million of pre-tax net gains on foreign currency cash fl ow hedges recorded in current earnings for years ended December 31, 2010, 2011 and 2012, respectively.
18. SUPPLEMENTAL CASH FLOW INFORMATION
Cash paid for interest totaled $6.2 million, $5.2 million and $5.1 million for the years ended December 31, 2010, 2011 and 2012, respectively. Cash paid for income taxes totaled $61.2 million, $75.6 million and $95.2 million for the years ended December 31, 2010, 2011 and 2012, respectively. There was a non-cash item for the year ended December 31, 2012 of $7.0 million in deferred tax liabilities and intangibles in conjunction with the NOX Technologies, Inc. acquisition. There was a non-cash item for the year ended December 31, 2010, of $17.0 million for the purchase of the corporate o� ce and warehouse space as described in Note 3.
NU SKIN ENTERPRISES, INC.Notes to Consolidated Financial Statements

75
NU SKIN ENTERPRISES, INC.Notes to Consolidated Financial Statements
19. SEGMENT INFORMATION
The Company operates in a single operating segment by selling products to a global network of independent distributors that operates in a seamless manner from market to market, except for its operations in Mainland China. In Mainland China, the Company utilizes an employed sales force and contractual sales promoters to sell products through its stores, and independent direct sellers who can sell away from the Company’s stores where the Company has obtained a direct sales license. Selling expenses are the Company’s largest expense comprised of the commissions paid to its worldwide independent distributors as well as remuneration to its sales force in Mainland China. The Company manages its business primarily by managing its global distributors. The Company does not use profi tability reports on a regional or divisional basis for making business decisions. However, the Company does report revenue in fi ve geographic regions: North Asia, Greater China, South Asia/Pacifi c, Americas and EMEA.
Revenue generated in each of these regions is set forth below (U.S. dollars in thousands):
Year Ended December 31,Revenue: 2010 2011 2012North Asia . . . . . . . . . . . . . . . . . . . . . . . . . . . . . . . . . . . . . . . . . . . . . . . . $ 686,073 $ 751,165 $ 794,833
Greater China . . . . . . . . . . . . . . . . . . . . . . . . . . . . . . . . . . . . . . . . . . . . . 268,171 341,919 570,640
South Asia/Pacifi c . . . . . . . . . . . . . . . . . . . . . . . . . . . . . . . . . . . . . . . . . 182,796 236,212 330,240
Americas . . . . . . . . . . . . . . . . . . . . . . . . . . . . . . . . . . . . . . . . . . . . . . . . . . 250,008 251,984 288,732
EMEA . . . . . . . . . . . . . . . . . . . . . . . . . . . . . . . . . . . . . . . . . . . . . . . . . . . . 150,211 162,711 185,219
Total . . . . . . . . . . . . . . . . . . . . . . . . . . . . . . . . . . . . . . . . . . . . . . . . . $ 1,537,259 $ 1,743,991 $ 2,169,664
Revenue generated by each of the Company’s product lines is set forth below (U.S. dollars in thousands):
Year Ended December 31,Revenue: 2010 2011 2012Nu Skin . . . . . . . . . . . . . . . . . . . . . . . . . . . . . . . . . . . . . . . . . . . . . . . . . . . . $ 913,819 $ 964,130 $ 1,178,414
Pharmanex . . . . . . . . . . . . . . . . . . . . . . . . . . . . . . . . . . . . . . . . . . . . . . . . 612,209 770,192 983,778
Other . . . . . . . . . . . . . . . . . . . . . . . . . . . . . . . . . . . . . . . . . . . . . . . . . . . . . . 11,231 9,669 7,472
Total . . . . . . . . . . . . . . . . . . . . . . . . . . . . . . . . . . . . . . . . . . . . . . . . . . . . $ 1,537,259 $ 1,743,991 $ 2,169,664

76
Additional information as to the Company’s operations in the most signifi cant geographical areas is set forth below (U.S. dollars in thousands):
Year Ended December 31,Revenue: 2010 2011 2012Japan . . . . . . . . . . . . . . . . . . . . . . . . . . . . . . . . . . . . . . . . . . . . . . . . . . . . . . $ 471,425 $ 472,519 $ 497,298
South Korea . . . . . . . . . . . . . . . . . . . . . . . . . . . . . . . . . . . . . . . . . . . . . . 214,648 278,646 297,535
Mainland China . . . . . . . . . . . . . . . . . . . . . . . . . . . . . . . . . . . . . . . . . . . 91,352 152,538 264,791
United States . . . . . . . . . . . . . . . . . . . . . . . . . . . . . . . . . . . . . . . . . . . . . . 212,070 211,788 230,924
Hong Kong . . . . . . . . . . . . . . . . . . . . . . . . . . . . . . . . . . . . . . . . . . . . . . . . 69,686 80,524 169,728
Europe . . . . . . . . . . . . . . . . . . . . . . . . . . . . . . . . . . . . . . . . . . . . . . . . . . . . 124,497 140,497 162,055
Taiwan . . . . . . . . . . . . . . . . . . . . . . . . . . . . . . . . . . . . . . . . . . . . . . . . . . . . 107,133 108,857 136,121
Year Ended December 31,Long-lived assests: 2011 2012Japan . . . . . . . . . . . . . . . . . . . . . . . . . . . . . . . . . . . . . . . . . . . . . . . . . . . . . . . . . . . . . . . . . . . . . . . . . . . . . . $ 14,113 $ 8,441
South Korea . . . . . . . . . . . . . . . . . . . . . . . . . . . . . . . . . . . . . . . . . . . . . . . . . . . . . . . . . . . . . . . . . . . . . . 11,451 14,030
Mainland China . . . . . . . . . . . . . . . . . . . . . . . . . . . . . . . . . . . . . . . . . . . . . . . . . . . . . . . . . . . . . . . . . . . 15,135 30,199
United States . . . . . . . . . . . . . . . . . . . . . . . . . . . . . . . . . . . . . . . . . . . . . . . . . . . . . . . . . . . . . . . . . . . . . . 98,205 163,137
Hong Kong . . . . . . . . . . . . . . . . . . . . . . . . . . . . . . . . . . . . . . . . . . . . . . . . . . . . . . . . . . . . . . . . . . . . . . . . 1,030 559
Europe . . . . . . . . . . . . . . . . . . . . . . . . . . . . . . . . . . . . . . . . . . . . . . . . . . . . . . . . . . . . . . . . . . . . . . . . . . . . . 1,966 2,622
Taiwan . . . . . . . . . . . . . . . . . . . . . . . . . . . . . . . . . . . . . . . . . . . . . . . . . . . . . . . . . . . . . . . . . . . . . . . . . . . . 1,556 1,945
20. COMMITMENTS AND CONTINGENCIES
The Company is subject to governmental regulations pertaining to product formulation, labeling and packaging, product claims and advertising and to the Company’s direct selling system. The Company is also subject to the jurisdiction of numerous foreign tax and customs authorities. Any assertions or determination that either the Company or the Company’s distributors is not in compliance with existing statutes, laws, rules or regulations could potentially have a material adverse e� ect on the Company’s operations. In addition, in any country or jurisdiction, the adoption of new statutes, laws, rules or regulations or changes in the interpretation of existing statutes, laws, rules or regulations could have a material adverse e� ect on the Company and its operations. Although management believes that the Company is in compliance in all material respects with the statutes, laws, rules and regulations of every jurisdiction in which it operates, no assurance can be given that the Company’s compliance with applicable statutes, laws, rules and regulations will not be challenged by foreign authorities or that such challenges will not have a material adverse e� ect on the Company’s fi nancial position or results of operations or cash fl ows. The Company and its Subsidiaries are defendants in litigation and proceedings involving various matters. Except as noted below, in the opinion of the Company’s management, based upon advice of its counsel handling such litigation and proceedings, adverse outcomes, if any, will not likely result in a material e� ect on the Company’s consolidated fi nancial condition, results of operations or cash fl ows.
The Company is subject to regular audits by federal, state and foreign tax authorities. These audits may result in additional tax liabilities. The Company believes it has appropriately provided for income taxes for all years. Several factors drive the calculation of its tax reserves. Some of these factors include: (i) the expiration of various statutes of limitations; (ii) changes in tax law and regulations; (iii) issuance of tax rulings; and (iv) settlements with tax authorities. Changes in any of these factors may result in adjustments to the Company’s reserves, which would impact its reported fi nancial results.
NU SKIN ENTERPRISES, INC.Notes to Consolidated Financial Statements

77
NU SKIN ENTERPRISES, INC.Notes to Consolidated Financial Statements
The Company is currently involved in a dispute with customs authorities in Japan related to additional customs assessments on several of the Company’s Pharmanex nutritional products made by Yokohama Customs for the period of October 2006 through September 2009 in connection with post-importation audits, as well as the disputed portion of the Company’s import duties from October 2009 to the present, which the Company has or will hold in bond or pay under protest. This dispute is separate and distinct from the dispute related to customs assessments on certain of the Company’s products imported into Japan during the period of October 2002 through July 2005. The aggregate amount of these assessments and disputed duties was approximately 4.0 billion Japanese yen as of December 31, 2012 (approximately $46.7 million), net of any recovery of consumption taxes. Additional assessments related to any prior period would be barred by applicable statutes of limitations. The issue in this case is whether a United States entity utilizing a commissionaire agent in Japan to import its products can use the manufacturer’s invoice or must use another valuation method, and, if an alternative method must be used, what the allowable deductions would be in determining the proper valuation. Following the Company’s review of the assessments and after consulting with the Company’s legal and customs advisors, the Company believes that the additional assessments are improper and are not supported by applicable customs laws. The Company fi led letters of protest with Yokohama Customs, which were rejected. The Company then appealed the matter to the Ministry of Finance in Japan. In May 2011, the Company received notice that the Ministry of Finance in Japan denied the Company’s admin-istrative appeal. The Company disagrees with the Ministry of Finance’s administrative decision. The Company is now pursuing the matter in Tokyo District Court, which the Company believes will provide a more independent determination of the matter. In addition, the Company is currently being required to post a bond or make a deposit equal to the di� erence between the Company’s declared duties and the amount the customs authorities have determined the Company should be paying on all current imports. Because the Company believes that the assessment of higher duties by the customs authorities is an improper application of the regulations, the Company is currently expensing the portion of the duties the Company believes is supported under applicable customs law, and recording the additional deposit or payment as a receivable within long-term assets on its consolidated fi nancial statements. If the Company is unsuccessful in recovering the amounts assessed and paid, the Company will likely be required to record a non-cash expense for the full amount of the disputed assessments. The Company anticipates that additional disputed duties will be reduced going forward as the Company now purchases a majority of the a� ected products in Japan from a Japanese company that purchases and imports the products from the manufacturer.
21. DIVIDENDS PER SHARE
Quarterly cash dividends for the years ended December 31, 2011 and 2012 totaled $36.6 million and $48.4 million or $0.135 per share in the fi rst two quarters of 2011 and 0.16 per share in the last two quarters of 2011 and $0.20 per share in all quarters of 2012. The board of directors has declared a quarterly cash dividend of $0.30 per share for all classes of common stock to be paid on March 13, 2013 to stockholders of record on February 22, 2013.

78
22. QUARTERLY RESULTS
The following table sets forth selected unaudited quarterly data for the periods shown (U.S. dollars in millions, except per share amounts):
2011 20121st
Quarter2nd
Quarter3rd
Quarter4th
Quarter1st
Quarter2nd
Quarter3rd
Quarter4th
QuarterRevenue . . . . . . . . . . . . $ 395.8 $ 424.4 $ 428.4 $ 495.3 $ 462.0 $ 593.2 $ 526.2 $ 588.3
Gross profi t. . . . . . . . . 295.2 353.3 357.8 415.1 386.2 497.7 439.4 493.2
Operating income . . 24.9 66.0 67.2 75.6 71.6 97.9 82.4 88.9
Net income . . . . . . . . 15.3 41.7 46.8 49.5 47.8 60.4 54.2 59.2
Net income per share: Basic . . . . . . . . . . . . 0.25 0.67 0.75 0.80 0.77 0.98 0.90 1.01
Diluted . . . . . . . . . . 0.24 0.65 0.72 0.76 0.74 0.94 0.87 0.97
23. OTHER INCOME (EXPENSE), NET
Other income (expense), net was $9.4 million, $7.0 million of expense in 2010 and 2011 and was $4.4 million of income in 2012. The Com-pany recorded foreign currency transaction losses with respect to its intercompany receivables and payables with certain of its international af-fi liates, including markets that are newly opened or have remained in a loss position since inception. Generally, foreign currency transaction losses with these a� liates would be o� set by gains related to the foreign currency transactions of the Company’s yen-based bank debt. Other income (expense), net also includes approximately $5.8 million, $4.8 million and $5.2 million in interest expense during 2010, 2011 and 2012, re-spectively. The Company cannot estimate the degree to which its operations will be impacted in the future, but it remains subject to these cur-rency risks. However, the majority of these transaction losses are non-cash, non-operating losses.
24. ACQUISITIONS
In the fourth quarter of 2012, a subsidiary of the Company acquired NOX Technologies, Inc. (“NOX”), a biotechnology and biodiagnostic company based in Malvern, Pennsylvania, for approximately $12.6 million in cash. The NOX acquisition included patents and previously licensed technology utilized in connection with the Company’s research e� orts and incorporated into some of the Company’s products. As the acquisition was deemed to be an asset acquisition, the Company has allocated the purchase price to the patents and will amortize the patents over their remaining lives, which were approximately 8 years.
In the fourth quarter of 2011, a subsidiary of the Company acquired substantially all of the assets of LifeGen Technologies, LLC (“LifeGen”), a genomics company based in Madison, Wisconsin for approximately $11.7 million in cash. The LifeGen acquisition included LifeGen’s proprietary tissue bank and gene expression database, patents and other intellectual property related to anti-aging gene research. The Company has allocated the purchase price primarily to the patents and will amortize the patents over their remaining lives, which were approximately 17 years.
NU SKIN ENTERPRISES, INC.Notes to Consolidated Financial Statements

79
Report of Independent Registered Public Accounting Firm
To the Board of Directors and Shareholders of Nu Skin Enterprises, Inc.:
In our opinion, the accompanying consolidated balance sheets and the related consolidated statements of income, comprehensive income, shareholders’ equity, and cash fl ows present fairly, in all material respects, the fi nancial position of Nu Skin Enterprises, Inc. and its subsidiaries at December 31, 2012 and December 31, 2011, and the results of their operations and their cash fl ows for each of the three years in the period ended December 31, 2012 in conformity with accounting principles generally accepted in the United States of America. Also in our opinion, the Company maintained, in all material respects, e� ective internal control over fi nancial reporting as of December31, 2012, based on criteria established in Internal Control—Integrated Framework issued by the Committee of Sponsoring Or-ganizations of the Treadway Commission (COSO). The Company’s management is responsible for these fi nancial statements, for main-taining e� ective internal control over fi nancial reporting and for its assessment of the e� ectiveness of internal control over fi nancial reporting, included in Management’s Report on Internal Control over Financial Reporting appearing in Item 9A. Our responsibility is to express opinions on these fi nancial statements and on the Company’s internal control over fi nancial reporting based on our integrated audits. We conducted our audits in accordance with the standards of the Public Company Accounting Oversight Board (United States). Those standards require that we plan and perform the audits to obtain reasonable assurance about whether the fi nancial statements are free of material misstatement and whether e� ective internal control over fi nancial reporting was maintained in all material respects. Our audits of the fi nancial statements included examining, on a test basis, evidence supporting the amounts and disclosures in the fi nancial statements, assessing the accounting principles used and signifi cant estimates made by management, and evaluating the overall fi nancial statement presentation. Our audit of internal control over fi nancial reporting included obtaining an understanding of internal control over fi nancial reporting, assessing the risk that a material weakness exists, and testing and evaluating the design and operating
e� ectiveness of internal control based on the assessed risk. Our audits also included performing such other procedures as we consid-ered necessary in the circumstances. We believe that our audits provide a reasonable basis for our opinions.
A company’s internal control over fi nancial reporting is a process designed to provide reasonable assurance regarding the reliability of fi nancial reporting and the preparation of fi nancial statements for external purposes in accordance with generally accepted accounting principles. A company’s internal control over fi nancial reporting includes those policies and procedures that (i) pertain to the mainte-nance of records that, in reasonable detail, accurately and fairly refl ect the transactions and dispositions of the assets of the company; (ii) provide reasonable assurance that transactions are recorded as necessary to permit preparation of fi nancial statements in accor-dance with generally accepted accounting principles, and that receipts and expenditures of the company are being made only in accordance with authorizations of management and directors of the company; and (iii) provide reasonable assurance regarding prevention or timely detection of unauthorized acquisition, use, or disposition of the company’s assets that could have a material e� ect on the fi nancial statements.
Because of its inherent limitations, internal control over fi nancial reporting may not prevent or detect misstatements. Also, projections of any evaluation of e� ectiveness to future periods are subject to the risk that controls may become inadequate because of changes in conditions, or that the degree of compliance with the policies or procedures may deteriorate.
/s/ PricewaterhouseCoopers LLP
Salt Lake City, UtahFebruary 26, 2013

80
ITEM 9. CHANGES IN AND DISAGREEMENTS WITH ACCOUNTANTS ON ACCOUNTING AND FINANCIAL DISCLOSURE
None.
ITEM 9A. CONTROLS AND PROCEDURES
Evaluation of Disclosure Controls and Procedures. Under the super-vision and with the participation of our management, including our Chief Executive O� cer and Chief Financial O� cer, we evaluated the e� ectiveness of the design and operation of our disclosure con-trols and procedures (as such term is defi ned in Rule 13a-15(e) under the Securities Exchange Act of 1934 (the “Exchange Act”)). Disclo-sure controls and procedures are the controls and other procedures that we designed to ensure that we record, process, summarize and report in a timely manner the information we must disclose in reports that we fi le with or submit to the Securities and Exchange Commis-sion under the Exchange Act. Based on this evaluation, our Chief Executive O� cer and our Chief Financial O� cer concluded that our disclosure controls and procedures were e� ective as of the end of the period covered by this report.
Changes in Internal Control over Financial Reporting. During the fourth quarter of 2012, there was no change in our internal control over fi nancial reporting (as such term is defi ned in Rule 13a-15(f) under the Exchange Act) that has materially a� ected, or is reasonably likely to materially a� ect, our internal control over fi nancial reporting.
Management’s Report on Internal Control over Financial Reporting.Our management is responsible for establishing and maintaining ad-equate internal control over fi nancial reporting. Internal control over fi nancial reporting is defi ned in Rule 13a-15(f) under the Exchange Act as a process designed by, or under the supervision of, our principal executive and principal fi nancial o� cers and e� ected by our board of directors, management and other personnel, to provide reasonable assurance regarding the reliability of fi nancial reporting and the prep-aration of fi nancial statements for external purposes in accordance with accounting principles generally accepted in the United States of America and includes those policies and procedures that:
• pertain to the maintenance of records that, in reasonable detail, accurately and fairly refl ect the transactions and dispositions of our assets;
• provide reasonable assurance that transactions are recorded as necessary to permit preparation of fi nancial statements in ac-cordance with accounting principles generally accepted in the United States of America, and that our receipts and expendi-tures are being made only in accordance with authorization of management and directors; and
• provide reasonable assurance regarding prevention or timely detection of unauthorized acquisition, use or disposition of our assets that could have a material e� ect on the fi nancial state-ments.
Because of its inherent limitations, internal control over fi nancial reporting may not prevent or detect misstatements. Also, projections of any evaluation of e� ectiveness to future periods are subject to the risk that controls may become inadequate because of changes in conditions, or that the degree of compliance with the policies or pro-cedures may deteriorate.
Under the supervision and with the participation of our man-agement, including our principal executive and principal fi nancial o� cers, we assessed, as of December 31, 2012, the e� ectiveness of our internal control over fi nancial reporting. This assessment was based on criteria established in the framework in Internal Control-Integrated Framework issued by the Committee of Sponsoring Organizations of the Treadway Commission. Based on our assess-ment, our management concluded that our internal control over fi nancial reporting was e� ective at a reasonable assurance level as of December 31, 2012.
The e� ectiveness of our internal control over fi nancial reporting as of December 31, 2012, has been audited by PricewaterhouseCoopers LLP, an independent registered public accounting fi rm, as stated in their report which appears herein.
ITEM 9B. OTHER INFORMATION
None.

81
PART IIIThe information required by Items 10, 11, 12, 13 and 14 of Part III is hereby incorporated by reference to our Defi nitive Proxy Statement fi led or to be fi led with the Securities and Exchange Commission for our 2013 Annual Meeting of Stockholders except for certain information required by Item 10 with respect to our executive o� cers which is set forth under Item 1. “Business”, of this Annual Report on Form 10-K, and is incor-porated herein by reference.
PART IVITEM 15. EXHIBITS AND FINANCIAL
STATEMENT SCHEDULES
Documents fi led as part of this Form 10-K:
1. Financial Statements. See Index to Consolidated Financial Statements under Item 8 of Part II.
2. Financial Statement Schedules. N/A
3. Exhibits. References to the “Company” shall mean Nu Skin Enterprises, Inc. Unless otherwise noted, the SEC fi le num-ber for exhibits incorporated by reference is 001-12421.
2.1 LifeGen Asset Purchase Agreement, dated as of December 13, 2011 between LifeGen Technologies, LLC and Nu Skin International, Inc. (incorporated by reference to Exhibit 2.1 to the Company’s Annual Report on Form 10-K for the year ended December 31, 2011; the Company undertakes to fur-nish a copy of any omitted schedule or similar attachments to the Securities and Exchange Commission upon request).
3.1 Amended and Restated Certifi cate of Incorporation of the Company (incorporated by reference to Exhibit 3.1 to the Company’s Registration Statement on Form S-1 (File No. 333-12073) (the “Form S-1”)).
3.2 Certifi cate of Amendment to the Amended and Restated Certifi cate of Incorporation (incorporated by reference to Exhibit 3.2 to the Company’s Annual Report on Form 10-K for the year ended December 31, 2009).
3.3 Certifi cate of Designation, Preferences and Relative Partici-pating, Optional and Other Special Rights of Preferred Stock and Qualifi cations, Limitations and Restrictions Thereof (incorporated by reference to Exhibit 3.3 to the Company’s Annual Report on Form 10-K for the year ended December 31, 2004).
3.4 Second Amended and Restated Bylaws of Nu Skin Enter-prises, Inc. (incorporated by reference to Exhibit 3.1 to the Company’s Quarterly Report on Form 10-Q for the quarter ended June 30, 2011)
4.1 Specimen Form of Stock Certifi cate for Class A Common Stock (incorporated by reference to Exhibit 4.1 to the Com-pany’s Registration Statement on Form S-3 (File No. 333-90716)).
4.2 Specimen Form of Stock Certifi cate for Class B Common Stock (incorporated by reference to Exhibit 4.2 to the Com-pany’s Form S-1).
10. 1 Credit Agreement, dated as of December 29, 2010, among the Company and JPMorgan Chase Bank, N.A. (incorpo-rated by reference to Exhibit 10.12 to the Company’s Annual Report on Form 10-K for the year ended December 31, 2010.)
10.2 Amended and Restated Credit Agreement, dated as of May 25, 2012, among the Company, various fi nancial institu-tions, and JPMorgan Chase Bank, N.A. as administrative agent (incorporated by reference to Exhibit 10.1 to the Com-pany’s Quarterly Report on Form 10-Q fi led August 7, 2012).
10.3 Amended and Restated Note Purchase and Private Shelf Agreement (Multi-Currency), dated as of May 25, 2012, among the Company, Prudential Investment Management, Inc. and certain other purchasers (incorporated by reference to Exhibit 10.2 to the Company’s Quarterly Report on Form 10-Q fi led August 7, 2012).
10.4 Series C Senior Notes Nos. C-1 and C-2 issued February 7, 2005 by the Company to Prudential Investment Management, Inc. and/or its a� liates pursuant to the Private Shelf Agreement (incorporated by reference to Exhibit 99.2 to the Company’s Current Report on Form 8-K fi led February 8, 2005).

82
10.5 Series D Senior Notes Nos. D-1, D-2, D-3 and D-4 issued October 3, 2006 by the Company to Prudential Investment Management, Inc. and/or its a� liates pursuant to the Private Shelf Agreement (incorporated by reference to Exhibit 99.4 to the Company’s Current Report on Form 8-K fi led Octo-ber 10, 2006).
10.6 Series E Senior Notes Nos. E-1, E-2, E-3, E-4 and E-5 issued January 19, 2007 by the Company to Prudential Investment Management, Inc. and/or its a� liates pursuant to the Private Shelf Agreement (incorporated by reference to Exhibit 99.1 to the Company’s Current Report on Form 8-K fi led Janu-ary 25, 2007).
10.7 Series E Senior Note E-6, issued July 20, 2007, by the Com-pany to Prudential Insurance Company of America pursuant to the Private Shelf Agreement (incorporated by reference to Exhibit 99.1 to the Company’s Current Report on 8-K fi led January 14, 2008).
10.8 Series EE Senior Note EE-1, issued January 8, 2008, by the Company to Prudential Insurance Company of America pursuant to the Private Shelf Agreement (incorporated by reference to Exhibit 99.2 to the Company’s Current Report on 8-K fi led January 14, 2008).
10.9 Series F Senior Notes Nos. F-1 and F-2 issued September 28, 2007 by the Company to Prudential Investment Man-agement, Inc. and/or its a� liates pursuant to the Private Shelf Agreement (incorporated by reference to Exhibit 10.1 to the Company’s Quarterly Report on Form 10-Q for the quarter ended September 30, 2007).
10.10 Series G Senior Notes Nos. G-1, G-2 and G-3, issued May 31, 2012, by the Company to The Prudential Insurance Com-pany of America, Pruco Life Insurance Company and Pru-dential Retirement Insurance and Annuity Company (incor-porated by reference to Exhibit 10.3 to the Company’s Quarterly Report on Form 10-Q fi led August 7, 2012).
10.11 Design and Construction Agreements e� ective March 10, 2011, between Nu Skin International, Inc. and each of Bolin Cywinski Jackson and Okland Construction Company, Inc. (incorporated by reference to Exhibit 10.1 to the Company’s Quarterly Report on Form 10-Q for the quarter ended March 31, 2011).
10.12 Form of Termination of Lock-up Agreement dated as of Sep-tember 1, 2010 between the Company and Steven Lund (incorporated by reference to Exhibit 10.37 to the Company’s
Annual Report on Form 10-K for the year ended December 31, 2010).
#10.13 Form of Indemnifi cation Agreement to be entered into be-tween the Company and certain of its o� cers and directors (incorporated by reference to Exhibit 10.48 to the Compa-ny’s Annual Report on Form 10-K for the year ended De-cember 31, 2008).
#10.14 Amended and Restated Deferred Compensation Plan, ef-fective as of January 1, 2008 (incorporated by reference to Exhibit 10.5 to the Company’s Quarterly Report on Form 10-Q for the quarter ended September 30, 2007).
#10.15 Amendment to the Deferred Compensation Plan, e� ective as of January 1, 2009 (incorporated by reference to Exhibit 10.50 to the Company’s Annual Report on Form 10-K for the year ended December 31, 2008).
#10.16 Nu Skin Enterprises, Inc. Nonqualifi ed Deferred Compensa-tion Trust dated December 14, 2005 (incorporated by refer-ence to Exhibit 99.2 to the Company’s Current Report on Form 8-K fi led December 19, 2005).
#10.17 Second Amended and Restated Nu Skin Enterprises, Inc. 1996 Stock Incentive Plan (incorporated by reference to Ex-hibit 10.28 to the Company’s Annual Report on Form 10-K for the year ended December 31, 2005).
#10.18 Form of Master Stock Option Agreement (1996 Plan) (in-corporated by reference to Exhibit 10.49 to the Company’s Annual Report on Form 10-K for the year ended December 31, 2007).
#10.19 Form of Stock Option Agreement for Directors (1996 Plan) (incorporated by reference to Exhibit 10.48 to the Compa-ny’s Annual Report on Form 10-K for the year ended De-cember 31, 2006).
#10.20 Nu Skin Enterprises, Inc. 2006 Stock Incentive Plan (incor-porated by reference to Exhibit 10.1 to the Company’s Cur-rent Report on Form 8-K fi led on June 1, 2006).
#10.21 Form of Master Stock Option Agreement (2006 Plan) (in-corporated by reference to Exhibit 10.10 to the Company’s Quarterly Report on Form 10-Q for the quarterly period ended September 30, 2006).
#10.22 Form of Master Stock Option Agreement (2006 Plan Perfor-mance Option (U.S.)) (incorporated by reference to Exhibit

83
10.54 to the Company’s Annual Report on Form 10-K for the year ended December 31, 2007).
#10.23 Form of Master Stock Option Agreement for Directors (2006 Plan) (incorporated by reference to Exhibit 10.59 to the Company’s Annual Report on Form 10-K for the year ended December 31, 2008).
#10.24 Form of Director Restricted Stock Unit Agreement (2006 Plan) (incorporated by reference to Exhibit 10.4 to the Com-pany’s Quarterly Report on Form 10-Q for the quarter end-ed June 30, 2007).
#10.25 Form of Master Restricted Stock Unit Agreement (2006 Plan) (incorporated by reference to Exhibit 10.11 to the Com-pany’s Quarterly Report on Form 10-Q for the quarterly period ended September 30, 2006).
#10.26 Nu Skin Enterprises, Inc. 2010 Omnibus Incentive Plan (in-corporated by reference to Exhibit 10.1 to the Company’s Current Report on Form 8-K fi led on June 2, 2010).
#10.27 Form of 2010 Plan U.S. Stock Option Master Agreement and Grant Notice (incorporated by reference to Exhibit 10.1 to the Company’s Current Report on Form 8-K fi led on July 2, 2010).
#10.28 Form of 2010 Plan U.S. Restricted Stock Unit Master Agree-ment and Grant Notice (incorporated by reference to Exhibit 10.3 to the Company’s Current Report on Form 8-K fi led on July 2, 2010).
#10.29 Form of 2010 Plan U.S. Performance Stock Option Master Agreement and Grant Notice (incorporated by reference to Exhibit 10.54 to the Company’s Annual Report on Form 10-K for the year ended December 31, 2010).
#10.30 Form of 2010 Plan U.S. Performance Restricted Stock Unit Master Agreement and Grant Notice (incorporated by reference to Exhibit 10.2 to the Company’s Current Report on Form 8-K fi led on July 2, 2010).
#10.31 Form of 2010 Plan Director Stock Option Master Agreement and Grant Notice (incorporated by reference to Exhibit 10.7 to the Company’s Quarterly Report on Form 10-Q for the quarterly period ended June 30, 2010).
#10.32 Form of 2010 Plan Director Restricted Stock Unit Master Agreement and Grant Notice (incorporated by reference to
Exhibit 10.8 to the Company’s Quarterly Report on Form 10-Q for the quarterly period ended June 30, 2010).
#10.33 Nu Skin Enterprises, Inc. 2009 Key Employee Death Benefi t Plan (incorporated by reference to Exhibit 10.58 to the Com-pany’s Annual Report on Form 10-K for the year ended December 31, 2010).
#10.34 Joseph Y. Chang Employment Agreement dated Novem-ber 9, 2009, between Mr. Chang and the Company (incor-porated by reference to Exhibit 10.2 to the Company’s Quarterly Report on Form 10-Q for the quarter ended September 30, 2009).
#10.35 Employment Agreement, e� ective as of August 1, 2012, be-tween the Company and M. Truman Hunt (incorporated by reference to Exhibit 10.4 to the Company’s Quarterly Report on Form 10-Q fi led August 7, 2012).
#10.36 Form of Employment Agreement, with schedule of material di� erences, e� ective as of August 1, 2012, between the Company and Ritch N. Wood, Daniel R. Chard, D. Matthew Dorny and Scott E. Schwerdt (incorporated by reference to Exhibit 10.5 to the Company’s Quarterly Report on Form 10-Q fi led August 7, 2012).
#10.37 Form of Key Employee Covenants (incorporated by refer-ence to Exhibit 10.2 to the Company’s Quarterly Report on Form 10-Q for the quarter ended June 30, 2007).
*21.1 Subsidiaries of the Company.
*23.1 Consent of PricewaterhouseCoopers LLP.
*31.1 Certifi cation by M. Truman Hunt, President and Chief Execu-tive O� cer, pursuant to Rule 13a-14(a) of the Securities Exchange Act of 1934, as adopted pursuant to Section 302 of the Sarbanes-Oxley Act of 2002.
*31.2 Certifi cation by Ritch N. Wood, Chief Financial O� cer, pur-suant to Rule 13a-14(a) of the Securities Exchange Act of 1934, as adopted pursuant to Section 302 of the Sarbanes-Oxley Act of 2002.
*32.1 Certifi cation by M. Truman Hunt, President and Chief Execu-tive O� cer, pursuant to Section 1350, Chapter 63 of Title 18, United States Code, as adopted pursuant to Section 906 of the Sarbanes-Oxley Act of 2002.

84
*32.2 Certifi cation by Ritch N. Wood, Chief Financial O� cer, pursuant to Section 1350, Chapter 63 of Title 18, United States Code, as adopted pursuant to Section 906 of the Sarbanes-Oxley Act of 2002.
*101.INS XBRL Instance Document
*101.SCH XBRL Taxonomy Extension Schema Document
*101.CAL XBRL Taxonomy Extension Calculation Link-base Document
*101.DEF XBRL Taxonomy Extension Defi nition Linkbase Document
*101.LAB XBRL Taxonomy Extension Label Linkbase Document
*101.PRE XBRL Taxonomy Extension Presentation Linkbase Document
* Filed herewith. # Management contract or compensatory plan or arrangement.

85
SIGNATURES
Pursuant to the requirements of Section 13 or 15(d) of the Securities Exchange Act of 1934, the Registrant has duly caused this report to be signed on its behalf by the undersigned, thereunto duly authorized on February 27, 2012.
NU SKIN ENTERPRISES, INC.
By: /s/ M. Truman Hunt M. Truman HuntPresident and Chief Executive O� cer
Pursuant to the requirements of the Securities Exchange Act of 1934, this report has been signed below by the following persons on behalf of the Registrant and in the capacities indicated on February 26, 2013.
Signatures Capacity in Which Signed
/s/ Steven J. LundSteven J. Lund
Executive Chairman of the Board
/s/ M. Truman HuntM. Truman Hunt
President and Chief Executive O� cer and Director (Principal Executive O� cer)
/s/ Ritch N. WoodRitch N. Wood
Chief Financial O� cer(Principal Financial O� cer and Accounting O� cer)
/s/ Daniel W. CampbellDaniel W. Campbell
Director
/s/ Andrew D. LipmanAndrew D. Lipman
Director
/s/ Patricia A. NegrónPatricia A. Negrón
Director
/s/ Thomas R. PisanoThomas R. Pisano
Director
/s/ Nevin N. AndersenNevin N. Andersen
Director
/s/ Neil O� enNeil O� en
Director

86
BOARD OF DIRECTORS
Steven J. LundExecutive Chairman of the Board
M. Truman HuntPresident, Chief Executive O� cer
Nevin N. AndersenRetiredAudit Committee ChairNominating and Corporate Governance Committee Member
Daniel W. CampbellManaging General Partner, EsNet, Ltd.Executive Compensation Committee ChairAudit Committee Member
Andrew D. LipmanPartner, Bingham McCutchen, LLPNominating and Corporate Governance Committee ChairExecutive Compensation Committee Member
Patricia A. NegrónIndependent Consultant, AuthorAudit Committee MemberExecutive Compensation Committee Member
Neil O� enRetiredNominating and Corporate Governance Committee MemberExecutive Compensation Committee Member
Thomas R. PisanoRetiredNominating and Corporate Governance Committee MemberAudit Committee Member

87
CORPORATE INFORMATION
TRANSFER AGENTInquiries regarding lost stock certifi cates, consolidation of accounts, and changes in address, name, or ownership should be addressed to: American Stock Transfer & Trust Co. LLC, 6201 15th Avenue, Brooklyn, NY 11219. Toll Free: 800-937-5449. International Shareholders: 718-921-8124, Email: [email protected]
CORPORATE HEADQUARTERSNu Skin Enterprises 75 West Center Street Provo, Utah 84601 Telephone: 801-345-1000
COMPANY WEBSITEnuskinenterprises.com
ADDITIONAL STOCKHOLDER INFORMATION Additional information and news is available at www.nuskinenterprises.com. For investor information, inquiries, annual reports and SEC fi lings, call 801-345-1000, email [email protected], or write Investor Relations at the corporate headquarters.
FORWARD-LOOKING STATEMENTSThis annual report contains forward-looking statements within the meaning of Section 27A of the Securities Act of 1933, as amended, and Section 21E of the Securities Exchange Act of 1934, as amended, that represent the company’s current expectations and beliefs. All statements other than statements of historical fact are “forward-looking statements” for purposes of federal and state securities laws and include, but are not limited to, statements of management’s expectations regarding the company’s performance, initiatives, strategies, new products, oppor-tunities and risks; statements of projections regarding future operating results and other fi nancial items; statements of belief; and statements of assumptions underlying any of the foregoing. In some cases, you can identify these statements by forward-looking words such as “believe,” “expect,” “project,” “anticipate,” “estimate,” “intend
,
” “plan,” “targets,” “likely,” “will,” “would,” “could,” “may,” “might,” the negative of these words and other similar words. We undertake no obligation to publicly update or revise any forward-looking statement, whether as a result of new information, future events or otherwise, except as required by law. We caution and advise readers that these statements are based on certain assumptions that may not be realized and involve risks and uncertainties that could cause actual results to di� er materially from the expectations and beliefs contained herein. For a summary of certain risks related to our business, see the company’s Annual Report on Form 10-K fi led on February 27, 2013, and other documents fi led by the company with the Securities and Exchange Commission.

88

Cert no. XXX-XXX-XXXX

POSITIVE TRENDS | PROFITS | HISTORY | STRENGTH | NETWORKS | STABILITY | FIFTH CONSECUTIVE RECORD REVENUE YEAR | LEADERSHIP | HISTORY | NETWORKS | STABILITY | FIFTH CONSECUTIVE RECORD REVENUE YEAR | POSITIVE TRENDS | LEADERSHIP | STRENGTH | $2.17 BILLION | INNOVATION | 53 MARKETS | SOLUTIONS | BUSINESS | RECORDS | INCREASES | CONFIDENCE | CREDIBILITY | INNOVATION | $2.17 BILLION | 53 MARKETS | REVENUE | SOLUTIONS | | RECORDS | INCREASES | CONFIDENCE | CREDIBILITY | EXPECTATIONS
TATIONS | BELIEF | PERCENTAGES | 28 YEARS | LEADERS | INVESTMENTS | VALUE | SALES | NETWORKS | EXPECTATIONS | LAUNCHES | TARGETS | BELIEF | PERCENTAGES | LEADERS | INVESTMENTS | ES | NETWORKS | LAUNCHES | TARGETS | NETWORKS | SUCC
| SUCCESS | CHANNELS | DIVIDEND PAYOUT INCREASE | BALANCE | PAYOUTS | INTEGRITY | DYNAMICS | ACHIEVEMENTS | PARTNERSHIPS | SUCCESS | CHANNELS | DIVIDEND PAYOUT INCREASE | INTEGRITY | DYNAMICS | ACHIEVEMENTS | PARTNERSHIPS | EXPANSION
PANSION | MILESTONES | GROWTH | COMMITMENT | RESOURCES | POTENTIAL | 24% REVENUE INCREASE | CAPITAL | DEVELOPMENTS | ALIGNMENT | RESULTS | AWARENESS | OPPORTUNITY | BREAKTHROUGHS | PASSION | STRENGTH | TRUST | PROGRESS | ADVA
ADVANCEMENT | EXPANSION | LEADERSHIP | EXPECTATIONS | SUCCCESS | EXPANSION | INNOVATION | STRENGTH | ADVANCEMENT | RECORDS | INCREASE | FIFTH CONSECUTIVE REVENUE YEAR | SALES | STRENGTH | STRENGTH | BREAKTHROUGHS | STRENGTH |