Embed Size (px)
Citation preview

Bridging the Material and Pressure Gaps
in Catalysis Studies
By
Au/TiO2/Ru Model Catalysts and UHV attached High Pressure Cell
Universität Ulm Abteilung Oberflächenchemie und Katalyse
Dissertation
zur Erlangung des Doktorgrades Dr. rer. nat der Fakultät für Naturwissenschaften
Zhong Zhao
(Ulm)
2006


1. Gutachter: Prof. Dr. Rolf Jürgen Behm 2. Gutachter: apl. Prof. Dr. Hans Gerd Boyen 3. Gutachter: PD. Dr. Hubert Rauscher


道冲,而用之或不盈。
渊兮,似万物之宗;
湛兮,似或存。吾不知谁之子,
象帝之先。
------------老子
the way is a limitless vessel;
used by the self, it is not filled by the world;
it cannot be cut, knotted, dimmed or stilled;
its depths are hidden, ubiquitous and eternal;
I don't know where it comes from;
it comes before nature.
------------Lao tzi

Contents i
Contents
List of publications
1 Introduction and motivation…………………………………….………...1 1.1 Planar model catalysts…………………………………………….………....…2
1.2 Bridging the material and pressure gaps in catalysis studies…….……....….3
1.2.1 Bridge the material gap……………………………………………….….……..3
1.2.2 Bridge the pressure gap..………………………….…………………..…...……..5
2 Experimental.………………………………………………………….……8 2.1 STM chamber.…………………………………………………………….….…9
2.2 TPD chamber.……………………………………………………….…………13
2.3 High pressure cell………………………………………………………..…….15
2.3.1 The set up of the high pressure cell.……………………………………………….15
2.3.2 Gas handling system………………………………….…………………………..21
2.3.3 Test of the high pressure cell system…………………………………….………..........24
2.3.4 Conclusions.………………………………………………………………………..…..27
2.4 Surface science approaches in UHV………………………………………….28
2.4.1 Scanning tunneling microscopy……………………………………………...…28
2.4.2 X-ray photoelectron spectroscopy and Auger electron spectroscopy ………….32
2.4.3 Temperature-programmed Desorption ……………………………………........36
3 Preparation and characterization of titania thin film on Ru(0001) …..40 3.1 Introduction……………………………………………………………….…...41
3.1.1 Bulk of TiO2.………………………………………………………………...….42
Contents ii
3.1.2 Surface of the rutile TiO2……………………………………………….……...43
3.1.3 Growth of oxide thin films……………………………………………………...46
3.2 Experimental results and discussion…………………………………………50
3.2.1 TiOx ultrathin film (<2 ML)……………………………………………………52
3.2.1.1 Morphology and structure of ultrathin TiOx films……………………………………...52
3.2.1.2 Chemical composition of the TiOx films……………………………………………….57
3.2.1.3 Thermal stability of the ultrathin TiOx films………………………………………...…60
3.2.2 Growth mode of the thin TiOx films and thermal stability of the TiOx
films up to 10 ML………………………………………………………………69
3.3 Conclusions…………………………………………………………………….82
4 Au supported on TiO2 thin film studied by STM, XPS and CO-TPD...83 4.1 Introduction…………………………………………………………………….84
4.2 Au supported on TiO2 studied by STM and XPS……………………………85
4.2.1 Previous studies…………………………………………………………………85
4.2.2 Experimental results and discussion…………………………………………….87
4.3 CO-TPD studies of Au/TiO2…………………………………………………..96
4.3.1 Previous studies of CO adsorption on TiO2 surfaces……………………………96
4.3.2 Experimental results and discussion…………………………………………….97
4.4 Conclusions……………………………………………………………………108
5 Kinetic measurement of CO oxidation in high pressure cell………….109 5.1 Introduction…………………………………………………………………...110
5.2 Previous studies of CO oxidation on Au/TiO2 ……………………………...112
5.3 Experimental results and discussion………………………………………...115
5.4 Conclusions……………………………………………………………………120
6 Summary and outlook…………………………………………………...121
Bibliography………………………………………………………………….124
Acknowledgements…………………………………………………………..139

Contents iii
Curriculum Vitae…………………………………………………………….141
List of publications i
List of publications
1 A. Männig, Z. Zhao, D. Rosenthal, K. Christmann, H. Hoster, H. Rauscher and R.J.
Behm, “Structure and growth of ultrathin titanium oxide films on Ru(0001)”, Surf. Sci. 576 (2005) 29.
2 Z. Zhao, T. Diemant, T. Häring, H. Rauscher and R.J. Behm, “Small-volume, UHV
compatible high-pressure reaction cell for combined kinetic and in-situ IR spectroscopic measurements on planar model catalysts”, Rev. Sci. Instrum.76, 123903 (2005)
3 Z. Zhao, T. Diemant, D. Rosenthal, K. Christmann, J. Bansmann, H. Rauscher and R. J.
Behm, “Au/TiO2/Ru(0001) model catalysts and their interaction with CO”, Surf. Sci., 600 (2006) 4992.
4 Z. Zhao, J. Bansmann, H. Rauscher and R.J. Behm, “Titania thin films on Ru(0001)
studied by STM and XPS”, to be published. 5 T. Diemant, Z. Zhao, J. Bansmann, H. Rauscher, R.J. Behm, “Kinetic and IR study on the
CO oxidation by planar Au/TiO2 model catalysts under realistic conditions”, to be published. 6 T. Diemant, Z. Zhao, J. Bansmann, H. Rauscher, R.J. Behm, “Interaction of CO with
Au/TiO2 model catalysts at elevated pressure”, to be published. 7 T. Diemant B. Schumacher, D. Hansgen, Z. Zhao, H. Rauscher, R.J. Behm, “Bridging the
material gap and pressure in catalysis studies”, to be published Conference contributions: 1 Z. Zhao, A. Männig, D. Rosenthal, J. Oswald, S.L.M. Schröder , K. Christmann , H.
Rauscher, and R.J. Behm, “Structure and thermal stability of thick TiOx films and Au/TiOx on Ru(0001)”, Spring-Meeting of the German Physical Society, March, 2003 in Dresden, Germany.

List of publications ii
2 Z. Zhao, H. Rauscher, and R.J. Behm, “Thin TiO2 films and Au/TiO2 on Ru (0001) studied by XPS and CO-TPD”, Spring-Meeting of the German Physical Society, March, 2004 in Regensburg, Germany
3 Z. Zhao, T. Diemant, H. Rauscher, and R.J. Behm, “Preparation and characterization of
fully oxidized TiO2 films on Ru(0001) and of Au/TiO2/Ru(0001) model catalysts”, Spring-Meeting of the German Physical Society, March 2005 in Berlin, Germany.
4 Z. Zhao, T. Diemant, H. Rauscher, and R.J. Behm, “Titanium oxide film preparation on Ru(0001) and Au/TiO2 /Ru(0001) model catalytic properties”, Kompetenznetz Funktionale Nanostrukturen, September, 2004, Bad Herrenalb, Germany.

List of publications iii

CHAPTER 1 Introduction and motivation 1
CHAPTER 1
Introduction and motivation
This chapter introduces firstly the background of planar model catalysts. Then the concepts of
“material gap” and “pressure gap” are presented and the approaches for bridging these two
gaps are discussed, which are the main points of this thesis.

CHAPTER 1 Introduction and motivation 2
1.1 Planar model catalysts As a natural phenomenon, catalysis started to be known in the first decades of the nineteenth
century. In 1835 Berzelius defined catalysis as a phenomenon that changes the composition of
a reaction mixture but leaves the catalyst unaltered [1]. Generally, a catalyst is an entity which
accelerates a chemical reaction without being consumed itself in the process. Without
catalysts, some chemical reactions would not take place or proceed so slowly at a certain
temperature that they could not be detected because of high activation barriers. With
application of catalysts, the reactions can be separated into several steps, each with a lower
activation barrier than that of the overall reaction. Just for these significant roles in chemistry,
catalysts play unimaginable roles in our daily life. For example, the catalytical synthesis of
ammonia, developed by the German chemist Fritz Haber can even “change air into cereals”.
Catalysis science, especially heterogeneous catalysis began to associate with surface
science at the beginning of last century, when Langmuir advanced a simple theory of
chemisorption and showed how it could be used to formulate rate laws for reactions occurring
on surfaces. In heterogeneous catalysis, the reactants are present in one phase and the
catalysts in a different one, with the catalytic reaction occurring at the interface or surface
between them. The surface of the catalyst then provides the place for the adsorbed or gaseous
species to meet and react. Many catalytic surface reactions occur on catalysts containing
small, typically nanometer-sized, supported metal particles where most atoms are in a surface
position. An understanding of these nanostructured materials on the atomic level and, in
particular, of surface-mediated processes such as chemisorption, surface restructuring, and the
underlying mechanisms are the main tasks of surface science studies related to heterogeneous
catalysis. The application of heterogeneous catalysis in industry began in the late nineteenth
century together with the development of physical chemistry of surfaces. During that time and
also later, catalysts were mainly optimized based on the empirical method of trial and error in
order to give the highest reaction rate and also to have the best selectivity. From the middle of
the last century, the application of various spectroscopic and structural probes made it
possible to investigate catalyst surfaces at a more microscopic level. However, it is still
impossible to describe details of the reaction mechanisms taking place during a practical
catalytic reaction. This is partly due to the complexity of catalysts and also due to the lack of
characterization of real catalysts. Indeed, real catalysts are composed of small (in the

CHAPTER 1 Introduction and motivation 3
nanometer range) metal particles dispersed on a porous material (high-surface-area materials),
and electron microscopy can hardly be achieved on these samples. In order to overcome these
difficulties, Ertl and Somorjai pioneered studies on idealized surfaces such as the surface of
single crystals in ultra-high vacuum apparatus with surface analysis techniques [2,3].
Investigations on particle morphology, surface and interface structures became possible,
which is the beginning of the planar model catalysis studies. From then on, much progress has
been made. The mechanisms of some catalytic reactions have been elucidated, e.g., the
catalytic CO oxidation [4,5], which was extensively studied over a variety of single crystal
catalysts and compared to the corresponding real catalysts.
However, it seems that the step from real catalysts to single crystal model catalysis is too
large. Because of the complexity of real catalysts and the higher pressure (elevated pressure to
atmosphere or even higher) of the true catalytical reactions, it is sometimes very difficult or
even impossible to correlate the mechanisms working under UHV (ultrahigh vacuum)
conditions to practical catalysis. These disparities between the two areas have been referred to
as the “material gap” and “pressure gap” [6-8,10]. Bridging these gaps had been a major
challenge during the recent years.
1.2 Bridging the material and pressure gaps in catalysis studies 1.2.1 Bridge the material gap As mentioned above, metal single crystals are too ideal compared to real catalysts. They
cannot account for two important characteristics of practical catalysts, which are (1) the finite
size of the metal particles, because catalytical activity can depend on the particle size, and (2)
the interaction between support and particles. The support of catalysts is usually not a simple
mechanical support for the metal particles, since it can modify the electronic properties (and
thus the reactivity) of the particles, and in some cases, even migrate over the particles when
the strong metal-support interaction (SMSI) [9] exists.
In order to bridge the “material gap” between high-area-surface real catalysts and single
crystal metal surfaces, one should design a kind of material that is not porous or a powder
which have too complicated surface structures to be analyzed easily by spectroscopy. The
material should not be as ideal as a single crystal surface, it should be a solid bulk material.
Considering the materials applied in real catalysts, naturally, people thought of metals
supported on oxides. Furthermore, because the metal nanoparticles supported on oxides have

CHAPTER 1 Introduction and motivation 4
large exposed surface and interface area, this led to the synthesis of supported metal
nanoparticles on oxide supports. These supported model catalysts can be prepared by many
ways [6,7]. Among them, the UHV synthesized catalysts have the advantages of offering a
much cleaner catalysts and better uniformity of the collection of metal particles, and thus can
be characterized and tested by surface science techniques.
Additionally, bulk metal oxides are wide band gap materials and therefore are
semiconductor or insulator. Poor conductivity and charging problems make them unsuitable
candidates for STM and electron spectroscopy. In addition, single crystals of bulk oxides that
exist in nature are usually contaminated, the impurities segregate to the surface in UHV, and
often, the oxides are non-stoichiometric and their defect concentrations are uncontrolled [11].
Furthermore, some of the oxides (for example, TiO2) fracture and do not cleave well [12].
These difficulties, however, can be circumvented by synthesizing well ordered, thin oxide
films on refractory metal substrates such as Pt, Mo, Ta, or materials given in Refs. [13-27].
The orientation of the substrate is specifically chosen to match the particular oxide film to be
grown since crystal orientation and the nature of the interface are critical parameters in
obtaining a high quality film. These films can be made thin enough (<5 nm) to be conductive
and prevent charging. On the other hand, they exhibit electronic and chemical properties
comparable to the corresponding bulk oxide. Furthermore, specific orientation of surfaces can
be prepared. It is well known that the growth of metal particles strongly depend on the crystal
surface orientation, implying a striking variation of particle morphology with different
interface atomic structure. In real catalyst studies, however, metal nanoparticles are always
supported on oxides powder with many crystal faces being exposed. The chemical reaction
observed on such powder catalysts is an average of reactions taking place on all crystal
surfaces.
On thin oxide films, metal particles are usually prepared by thermal evaporation of the
metal of choice. By the judicious control of the deposition parameters, metal particles of
varying size can be routinely achieved. The nucleation and growth of metals on oxides have
been studied extensively and reviewed by several groups [6,7,28]. It is now possible to
prepare metal particles on single-crystal oxide surfaces, where both the particles’ thickness
and lateral dimension (parallel to the surface) are known and controllable. Thus, it is
necessary to refer to more than just their “diameter”. One now has the potential to correlate
CHAPTER 1 Introduction and motivation 5
the particles’ chemisorption, catalytic and electronic properties not only with their lateral
diameter, but also with their thickness and also even their shape [7,29].
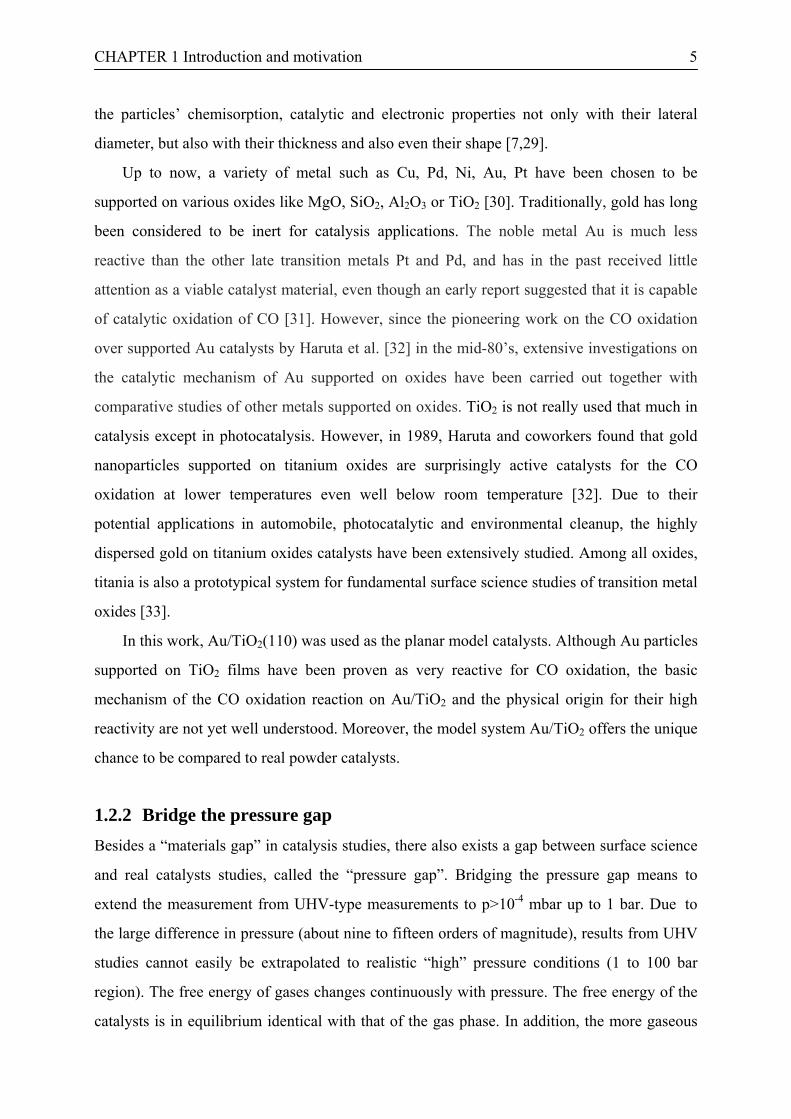
Up to now, a variety of metal such as Cu, Pd, Ni, Au, Pt have been chosen to be
supported on various oxides like MgO, SiO2, Al2O3 or TiO2 [30]. Traditionally, gold has long
been considered to be inert for catalysis applications. The noble metal Au is much less
reactive than the other late transition metals Pt and Pd, and has in the past received little
attention as a viable catalyst material, even though an early report suggested that it is capable
of catalytic oxidation of CO [31]. However, since the pioneering work on the CO oxidation
over supported Au catalysts by Haruta et al. [32] in the mid-80’s, extensive investigations on
the catalytic mechanism of Au supported on oxides have been carried out together with
comparative studies of other metals supported on oxides. TiO2 is not really used that much in
catalysis except in photocatalysis. However, in 1989, Haruta and coworkers found that gold
nanoparticles supported on titanium oxides are surprisingly active catalysts for the CO
oxidation at lower temperatures even well below room temperature [32]. Due to their
potential applications in automobile, photocatalytic and environmental cleanup, the highly
dispersed gold on titanium oxides catalysts have been extensively studied. Among all oxides,
titania is also a prototypical system for fundamental surface science studies of transition metal
oxides [33].
In this work, Au/TiO2(110) was used as the planar model catalysts. Although Au particles
supported on TiO2 films have been proven as very reactive for CO oxidation, the basic
mechanism of the CO oxidation reaction on Au/TiO2 and the physical origin for their high
reactivity are not yet well understood. Moreover, the model system Au/TiO2 offers the unique
chance to be compared to real powder catalysts.
1.2.2 Bridge the pressure gap Besides a “materials gap” in catalysis studies, there also exists a gap between surface science
and real catalysts studies, called the “pressure gap”. Bridging the pressure gap means to
extend the measurement from UHV-type measurements to p>10-4 mbar up to 1 bar. Due to
the large difference in pressure (about nine to fifteen orders of magnitude), results from UHV
studies cannot easily be extrapolated to realistic “high” pressure conditions (1 to 100 bar
region). The free energy of gases changes continuously with pressure. The free energy of the
catalysts is in equilibrium identical with that of the gas phase. In addition, the more gaseous
CHAPTER 1 Introduction and motivation 6
species are adsorbed or reacted, the more energy (adsorption energy) is gained by the system,
this leads to formation of new phases and structures [34].
In order to bridge the “pressure gap” in catalysis studies, two approaches are possible.
The first one is to prepare the catalysts in UHV and characterize them with surface analysis
methods, then check the catalytical reactions under conditions close to real reactions and
finally, characterize the catalysts again with surface analysis methods without breaking the
vacuum. This led to the idea of designing an attached high pressure cell to the UHV chamber.
Practice has proven that the “pressure gap” can be bridged partly by combining UHV surface
analytical techniques with an elevated pressure reactor system designed for measuring
reaction kinetics [35-37]. Measurements combining surface science analytical techniques with
reaction kinetics have successfully been used to correlate the reaction rates measured on
single-crystal surfaces with those measured on more realistic catalysts.
The second idea is quite simple but also difficult in technique. It requires to explore new
methods that are applicable in situ at elevated pressure to provided detailed studies on the
structure sensitivity, the effects of promoters/inhibitors on catalytic activity, and, in certain
cases, the identification of reaction intermediates. Actually, many new techniques have been
developed adapted to high pressure measurement, e.g. infrared-visible sum frequency
generation vibrational spectroscopy (SFG) [38-40], polarization modulation infrared
absorption reflection spectroscopy (PM-IRAS) [41,42], in situ X-ray photoelectron
spectroscopy (XPS) [43], and in situ scanning tunneling microscopy (STM) [44,45]. These
techniques have been utilized successfully to characterize the adsorption, chemical
components and morphology changes in situ.
In this work, the investigations of bridging the “material gap” and “pressure gap” were
carried out on the catalytic CO oxidation at low temperatures with respect to the model
catalyst Au/TiO2(110)/Ru(0001). For the CO oxidation on Pt, the reaction normally proceeds
by a Langmuir-Hinshelwood mechanism involving adsorbed CO molecules and adsorbed
oxygen atoms (dissociated oxygen molecules) [5]. The surface of the catalyst is almost
entirely covered by CO, and the reaction rate is determined by the rate of CO desorption.
However, the mechanism of the catalytic CO oxidation on Au/TiO2 is still under debate,
especially with regard to the question of whether oxygen is dissociated or not. From previous
studies, it is apparent that the CO oxidation activity is a complex process depending on many
factors such as particle size, particle shape and interface between the gold particles and the

CHAPTER 1 Introduction and motivation 7
support [46]. The synthesis procedure of the catalyst and subsequent pre-treatment play a
crucial role on the particles size and metal-support interaction [47]. Many pathways for the
CO oxidation were suggested [48], e.g. (1) CO reacting with dissociated oxygen, (2) CO
reacting with activated molecular oxygen being adsorbed on highly under-coordinated sites on
gold, and (3) CO being oxidized through a complex scheme involving surface hydroxyls.
This thesis consists of four main parts. In the first part, the instruments and methods
which were used in this work are introduced. The focus is put on the high pressure cell (HP
cell), which was designed and manufactured as the way to span the “pressure gap” in the
model catalysis studies. It was designed for kinetic measurements in batch-mode and flow-
mode, and for in situ PM-IRAS measurement. In the second part, the growth and thermal
stability of ultrathin and thin titania films on single crystal Ru(0001) were investigated by
STM, XPS, Auger electron spectroscopy (AES) and low energy electron diffraction (LEED).
The growth of thin oxide films on single crystal metals is a main topic not at least due to the
variety of oxidation states of titania (eight oxidation states) and their extreme sensitivity to the
preparation conditions. In the third part, the interaction of CO with the surface of well
oxidized and reduced TiO2 films was studied by temperature programmed desorption of CO
(CO-TPD). Afterwards, gold was evaporated on the TiO2(110)-(1×1) films at room
temperature, the physical and chemical properties of Au nanoparticles supported on TiO2
were then studied by STM, XPS, and CO-TPD. Both, the second and third parts are steps for
bridging the “material gap” in catalysis studies. In the last part of this thesis, measurements of
the CO oxidation kinetics on Au/TiO2(110)-(1×1) in the attached HP cell are presented,
demonstrating that the “material gap” as well as the “pressure gap” can successfully be
bridged by planar model catalysts and the HP cell designed in our group. In addition, an
overview of correlations between geometric structure, electronic properties and catalytic
activity of CO oxidation on Au/TiO2 compared with data from realistic catalysts and catalytic
reaction conditions is presented. Further investigations on the mechanism of CO oxidation on
Au/TiO2 model catalysts will not be included in this thesis, they will be presented in detail in
the dissertation of Diemant and in our joint forthcoming papers.

CHAPTER 2 Experimental 8
CHAPTER 2
Experimental
This chapter describes the experimental setup used to obtain the results in subsequent
chapters. It includes the two UHV systems: the STM chamber and the TPD chamber. Because
the design and manufacture of the high pressure cell (HP cell) is a main part of the work, it
will go to some length in describing the details and test results of the HP cell. After that,
several surface analysis techniques such as STM, XPS, AES, and TPD that had been used in
this work are briefly introduced.
CHAPTER 2 Experimental 9
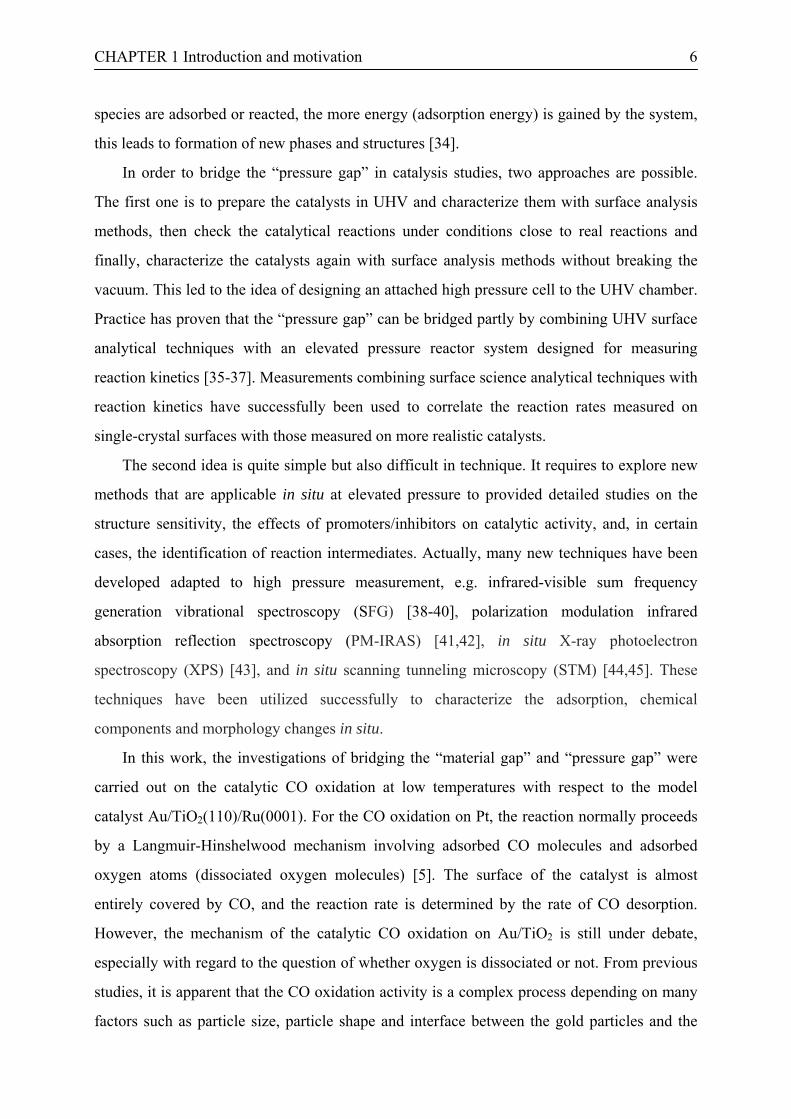
2.1 STM chamber The STM chamber is schematically illustrated in Fig. 2.1 [49]. It is equipped with a home-
built STM and other standard facilities for surface preparation and characterization such as Ar
ion sputtering, UHV gas dosing systems, quadrupole mass spectrometer (QMS 421, Pfeiffer
Vacuum), Auger electron spectroscopy (AES, Phi, 10-155) with a cylindrical mirror analyzer,
and low energy electron diffraction (LEED, VSI, Er-Leed). The chamber is pumped by a
combination of a turbomolecular pump (240 l⋅s-1, Pfeiffer Vacuum), a 400 l⋅s-1 ion getter
pump (Varian), and a titanium sublimation pump, the base pressure is better than 2×10⁻¹⁰
mbar.
Sample store
Roughapproach
Tunnelmicroscop on intervibration damping
Extern vibration damping
Ion getter pump
AES
LEED
Precise manipulator
Plate valve
Vibration damping
Turbo molecular pump
Wobble stickhori. Transfer
Wobble stickvert. Transfer
Figure 2.1: Schematic drawing of the STM chamber.
For convenient sample processing and sample transfer from the sample holder to the
STM, two viewports are mounted on the front side of the chamber as indicated in Fig. 2.2.
The construction of the STM is shown in Fig. 2.3. The electrochemical etched tungsten tip
( 0.7 mm in diameter) is fixed in the piezo tube. Above the tip on the stainless steel block,
there is a crystal holder, it is notched in round shape, the sample can be put into it with the

CHAPTER 2 Experimental 10
AES QMS Wobble stick
STM
Sample Holder
Figure 2.2: Front side photo of the STM UHV chamber.
Stainlesssteel
Cu
crystal Micrometer
Stainless steel block
Cu plate
Crystal holder Micrometer screw
Tip
Figure 2.3: Photo of the STM.
surface downwards. The position of the tip is not in the center of the sample but on the edge,
with the help of the wobble stick, the position of the scanning area of the tip can be changed.
A micrometer screw is used to fast approach the tip to the sample manually from the
outside of the chamber by a rotator. The final tip approach is controlled by the integrator of
CHAPTER 2 Experimental 11
STM electronics when the tip is very closed to the sample surface. When applying a few volts
between the tip and sample, a small current can be measured, if the tip is very close (< 1 nm)
to the sample.
The STM is normally operated in the constant current feedback mode in which the actual
current IT is compared with a preset constant value (I0), typically, 0.5-5 nA, in a feedback loop.
The feedback signal, proportional to the difference between IT and I0, provides a correction
voltage to the z transducer. This causes a change in the distance z between the tip and the
surface when an atom or, in more general terms, a protrusion is traversed. Recording the
feedback signal or z voltage as a function of the lateral tip position during scanning yields a
map of the surface topography. Actually, the topographic image that one sees in the STM
software is a recording of the change in z voltage required to keep the tunnel current constant
as a function of x and y.
For high resolution measurement, a high tip to sample stability is required. For this
reason, the stainless steel block is mounted on a staple which consists of five triangle Cu
plates, with viton rings in between to dampen high frequency vibrations. The entire UHV
table was further dampened by mounting the system on top of a table supported by four
pneumatic dampeners, which were positioned on individual blocks separately.
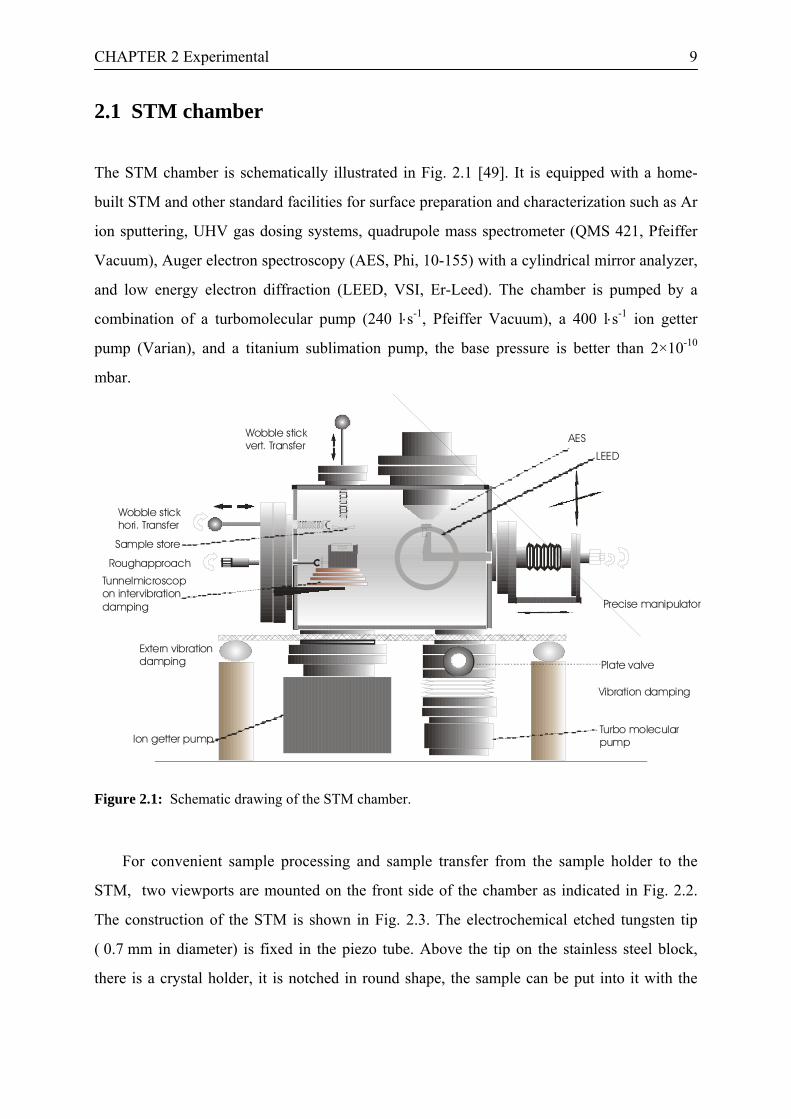
The sample, sample holder and processing system can be seen from the right viewport of
the UHV chamber, it is shown in Fig. 2.4. A Ru(0001) single crystal (5 mm in diameter,
2 mm thick) used as a substrate in this work is fixed in a Mo ring by spot welding with Ta
foils. A trough is made on the outer edge of the coin shaped ring, this is used to be hold by the
stub grip at one end of the wobble stick. The sample can be transferred between the sample
holder and STM. The whole part of the ring and crystal is pressed by two Ta plural on the
sample holder. The latter is a cup-shaped holder, which is held on a L shaped manipulator, the
sample can be rotated or moved back and forth, up and down together with the manipulator
from the outside. A filament is mounted under the sample to heat the sample up to 1700 K
from the backside by electron bombardment. The heating temperature is measured with two
pyrometers, one working from room temperature (RT) to 850 K, the temperature can be read
directly from the instrument. The other instrument operates from 800 K to 1700 K, it is
controlled by software, by which the heating gradient or mode (flash or anneal) and time
length can be set up easily and exactly. Before the measurements, both of the pyrometers were
carefully cross calibrated with the TPD system described later in this chapter.
CHAPTER 2 Experimental 12
Ru single crystal
Mo ring
Ta foils
Ta wafer
Figure 2.4: Photo of sample holder and processing system.
Two different evaporator sources (one for Ti and the other one for Au) are mounted on a
big flange. A small viewport is used for optimizing the position when depositing material on
the sample. Both evaporators work in a physical vapor deposition (PVD) mode. Titanium is
deposited from a commercial Omicron EFM3 evaporator, the material used is a titanium rod
(2 mm in diameter, 30 mm long, from Goodfellow) with 99.99% purity. The other source for
Au deposition is home-built. The gold wire with a purity of 99.99% is filled into a ceramic
Al2O3 tube (3 mm in diameter, 7 mm long, 2 mm thick, with machined threads outside).
Before filling it with Au, it has been cooked in hot HCl for a few hours, followed by cleaning
in demineralized water with supersonic treatment. After that, a tungsten wire with a diameter
of 0.2 mm is wrapped around outside with 15 rings. There is no wire wrapped near the right
end of the tube, and the temperature of this part is lower. When melted Au reaches this part, it
is cooled down to a temperature below its melting point, and thus, the material itself acts as a
bottom for the tube, just like a crucible. With this setup, the gold in ceramic tube can be
heated to temperatures necessary for evaporation. A K-type (NiCr/Ni) thermocouple is fixed
on the tungsten wire contacting with the crucible. The temperature of the source is measured
from the voltage output. Before deposition, the crucible is heated to temperature around the
melting point of Au for degassing. A cylindrical-shaped tantalum evaporator cage is fixed
around the crucible with a small hole on the front side in line with the crucible tube. Most of
CHAPTER 2 Experimental 13
the evaporated Au atoms come out from the outlet to the sample, and other scattered atoms
condensed on the wall of the colder cage. A tungsten filament is fixed in between the crucible
and wall of the cage, which is used to degas the cage. Electrons ejected from the filament
(anode, 2.5 A) are accelerated by a potential difference (800 V) between the filament and the
cage and bombarded on the wall of the cage. The whole cage and the crucible are fixed on a
copper frame with ceramic tubes, the latter is connected to a feedthrough by electrical and
thermal isolated ceramics on a CF35-UHV flange.
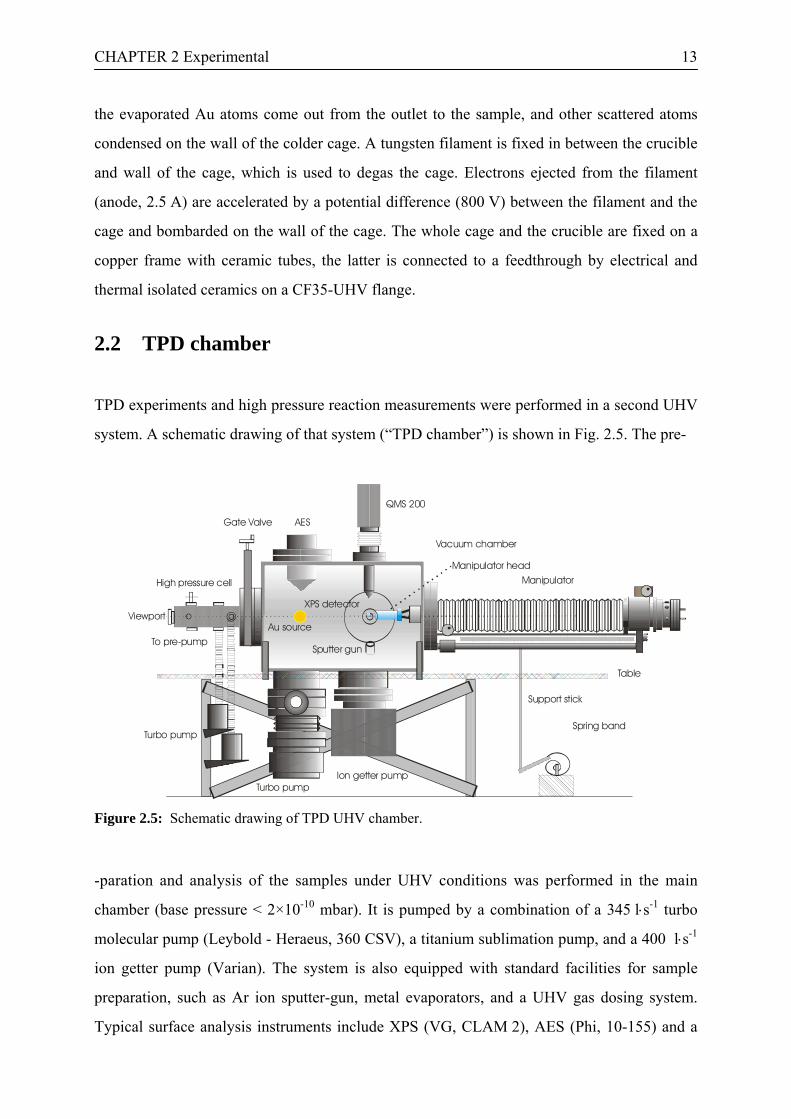
2.2 TPD chamber TPD experiments and high pressure reaction measurements were performed in a second UHV
system. A schematic drawing of that system (“TPD chamber”) is shown in Fig. 2.5. The pre-
Figure 2.5: Schematic drawing of TPD UHV chamber.
-paration and analysis of the samples under UHV conditions was performed in the main
chamber (base pressure < 2×10⁻¹⁰ mbar). It is pumped by a combination of a 345 l⋅s-1 turbo
molecular pump (Leybold - Heraeus, 360 CSV), a titanium sublimation pump, and a 400 l⋅s-1
ion getter pump (Varian). The system is also equipped with standard facilities for sample
preparation, such as Ar ion sputter-gun, metal evaporators, and a UHV gas dosing system.
Typical surface analysis instruments include XPS (VG, CLAM 2), AES (Phi, 10-155) and a
Manipulator
QMS 200
AESGate Valve
Spring band
Ion getter pumpTurbo pump
Turbo pump
High pressure cell
Sputter gun
Au source
XPS detector
Support stick
Table
Vacuum chamber
Manipulator head
To pre-pump
Viewport

CHAPTER 2 Experimental 14
QMS (200, Pfeiffer Vacuum) for TPD measurements and residual gas analysis. A newly
designed and manufactured HP cell and gas handling system are attached on the left side of
the main chamber, separated by a gate valve as shown in Fig. 2.6. Details about sample
mounting, moving, heating and cooling will be given in next section together with the set up
of HP cell. Sample manipulation was achieved by a commercial translator system (VG,
QMS
XPS AES
FTIR HP Cell
manipulator
Figure 2.6: Outside photo of the TPD UHV chamber.
Omniax), which allows movement in x/y-direction by ±12.5 mm and in z-direction (600 mm).
It is equipped with a differentially pumped module for sample rotation and was rebuilt in this
work. The schematic structure is shown in Fig. 2.7. In order to make the translator stiff
Figure 2.7: Schematic diagram of Omniax manipulator: (A) outlet of coolant line, (B) bellows, (C) fixing block, (D) feedthrough of thermocouple, (E) feedthrough of filament, (F) hand bar, (G) bellows for differential pump, (H) bellows, (I) cooling lines, (J) fixing tube, (K) fixing block, (L) Teflon spacers, (M) flange, (N) polished stainless tube, (O) VCR connector, (P) manipulator head.
C
A
BH E
D
IF
G
J
KLM
NOP
CHAPTER 2 Experimental 15
enough when inserting into the HP-cell (because the interaction sealing force in between the
wall of manipulator head with the three sealing O-rings can be strong enough to deform the
translator), an additional stainless steel tube was welded in between the two stainless steel
tubes used for LN2 recycling. Two VCR connectors are used to mount the manipulator head
to the cooling tubes.
2.3 High pressure cell For bridging the “pressure gap” between the real catalysis and surface science studies, various
kinds of high pressure cells (HP cell) combined with an UHV chamber systems have been
devised and manufactured [6-8,10,30,36,37,50]. The model catalyst can be prepared in a
chamber, and then characterized pre- and post-reaction by various surface analysis techniques
such as AES, TPD, XPS, UPS, and LEED.
Previous designs of HP cells mostly followed one of two different routes: Either they
involved a transfer of the sample from the UHV system to the HP cell and subsequent
isolation of the cell by a valve, which requires that the sample is completely detached from
the UHV manipulator [51-55], or the sample remains attached to the manipulator and just the
sample or the manipulator head is exposed to high pressure [56,57]. In the latter case, the
sample itself, the sample holder or the end of the manipulator head act as part of the seal
between the HP cell and the UHV system. This is performed, for instance, by pressing the
sample or manipulator head against a sealing surface (knife edge) [58-62], or by transferring
the sample holder through a sliding seal, mostly consisting of a set of O-rings, with the
volume between the O-rings being differentially pumped [57,63-65]. Each of these designs
offers specific advantages, but has, on the other hand, also distinct disadvantages, which have
to be considered for a particular application.
2.3.1 The setup of the high-pressure cell
In this work a HP cell was designed for simultaneous reaction kinetics and in situ IR
spectroscopy measurements under controlled conditions, in the pressure range between 10-3
and 103 mbar. While partially based on components or individual design ideas that have been

CHAPTER 2 Experimental 16
used in previous constructions, this new design in total represents a considerable
improvement compared to previous ones. In particular, it allows
- normal UHV operation, continuous control of the sample temperature and both sample
cooling and rapid sample heating, and complete separation of the HP cell when the
sample is moved back into the UHV system;
- rapid sample transfer between UHV system and HP cell as well as rapid pump-down
of the HP cell after high-pressure measurements;
- operation as batch reactor at controlled pressure or as flow reactor at independently
controlled gas flow and reaction pressure;
- simultaneous in-situ IR characterization and mass spectrometry analysis of the
reaction gas during high pressure operation;
- highly sensitive measurements of the reaction kinetics, due to a very small cell volume.
The design represents a combination of the two separate principles as described above: a
gate valve allows for complete separation of the HP cell from the main chamber under normal
UHV operation, when the sample is retracted from the HP cell, a differentially pumped stage
which consists of the manipulator head and three sealing O-rings separates the HP cell from
the main chamber when the manipulator is introduced into the high-pressure cell during high-
pressure operation. This allows continuous temperature control during both UHV and high-
pressure operation and maintains the full flexibility of operation during UHV measurements.
For operation as a batch reactor, the cell was filled with the respective reaction gases up
to the desired pressure, the pressure could be measured via two pressure gauges (MKS
Instruments, Baratron type 628B). For operation as flow reactor, both gas flow and reactor
pressure could be adjusted independently and in a controlled way, by using calibrated
capillaries with known conductance for the incoming gas flow (see section 2.3.1) and an
adjustable pumping speed for setting the reactor pressure. The gas composition was analyzed
by a mass spectrometer in a separately pumped chamber, with an adjustable leak rate from the
reactor to the mass spectrometer. This way the absolute gas load of detection system can be
kept constant. In situ IR measurements could be performed during reaction. In order to reduce
contributions from the gas phase, which become dominating at higher pressures (> 1 mbar for
CO), polarization modulation (PM) techniques were used (PM-IRAS).
After high pressure operation the HP cell could be quickly pumped down to about 10-7-
10-8 mbar by using direct pumping lines and the differential pumping stages. Subsequently,

CHAPTER 2 Experimental 17
the manipulator is fully retracted and the HP cell, including the differential pumping stages, is
sealed off by a gate valve.
The volume of the reaction cell could be reduced to about 50 ml, not accounting for
volumes in the periphery connections such as connections to gas lines, pressure gauges etc.
The total volume, including gas lines etc., is about 100 ml.
A schematic cross section of the high pressure reaction cell is illustrated in Fig. 2.8. It is a
rather simple construction and, in particular, a rather small reaction cell volume was achieved
by machining the complete HP cell from one piece of stainless steel. The reaction cell is
mounted via a CF 63 gate valve (VAT), to the UHV system. The gate valve is opened only
when the sample is in the high pressure cell, and closed during normal UHV operation. This
Gate valve
Metal spacer
Window
Figure. 2.8: Cross section of the high-pressure reaction cell with the manipulator head inserted, including the connecting flange of the gate valve between the high-pressure cell and UHV system(top view).
prevents gas flow from the HP cell and the differential pumping lines into the UHV chamber
and thus helps to maintain standard UHV conditions in the main system.
At the upper side of the reaction cell, a CF16 flange carries a stainless steel prism which
contains the gas inlet to the high pressure cell via a ¼ in. OD tube (see section 2.3.1) and two
HP cell
O-rings
Cooling lines
Thermocouple

CHAPTER 2 Experimental 18
capacitive pressure transducers P1 and P2 (MKS Instruments, Baratron type 628B) covering
different, overlapping pressure ranges (10-4 mbar to 1 mbar and 0.1 mbar to 1000 mbar).
A CF16 flange on the bottom-side of the cell carries connections to a right angle valve
CV1, leading to the turbomolecular pump of the first differential pumping stage, which can be
used for efficient pump-down of the cell (time for evacuating from 10 to <10-7 mbar around 5
min, the pressure decreases to less than 10-9 mbar during sample transfer). The second
connection leads to a fine metering valve FMV1 (Parker, HR-0) and then to the same pump,
for controlled pumping during operation as flow reactor. The third connection leads, via
another fine metering valve FMV2 (Parker, HR-0), to the detector chamber. The detector
chamber consists of a CF100 TEE piece, which houses the mass spectrometer (Pfeiffer
Vacuum, QMS 421). It is pumped by a 240 l⋅s-1 turbomolecular pump (TP2, Pfeiffer Vacuum
TPU240). During kinetic measurements the valve is opened such that the steady state pressure
in the QMS chamber increases to about 10-7 mbar. Typically, mass scans are performed every
6 minutes, comparing the intensity of the main signals (amu 28, amu 32, and amu 44 for CO-
oxidation). To reduce the production of CO2 at the filament of the mass spectrometer, the
filament is only switched on shortly (10 s) before each mass scan.
The first part of the reaction cell contains the sliding seal, consisting of three Teflon
covered Viton O-rings (Schötz Industrietechnik GmbH, 40-5VI-PFA) and two pumping
stages for differential pumping in between. The pumping stages are pumped by a 70 l⋅s-1
turbomolecular pump TP3 (Varian V70) each, which are connected via a CF16 flange to the
HP cell body and backed by a rotary pump. The O-rings are fixed by three stainless steel
circular rings, which act as spacers. The last spacer is fixed to the body of the high pressure
cell by 4 set screws. Varying the tightening of the set screws allows to adjust the force exerted
on the O-rings, and to compress the O-rings. This way it is possible to adjust the O-rings in a
way that sufficient sealing of the reaction cell is accomplished. After repeated bake out of the
cell to 180°C, no obvious deformation of the O-rings was found, and also no decrease of the
sealing function.
When the sample is transferred into the reaction cell, the manipulator and the polished
cylindrical manipulator head have to be centered carefully to prevent a damage of the O-rings
or the head itself. This can be ascertained by visual inspection, while inserting the sample into
the reaction cell, through a CF35 viewport at the end of the HP cell.
CHAPTER 2 Experimental 19
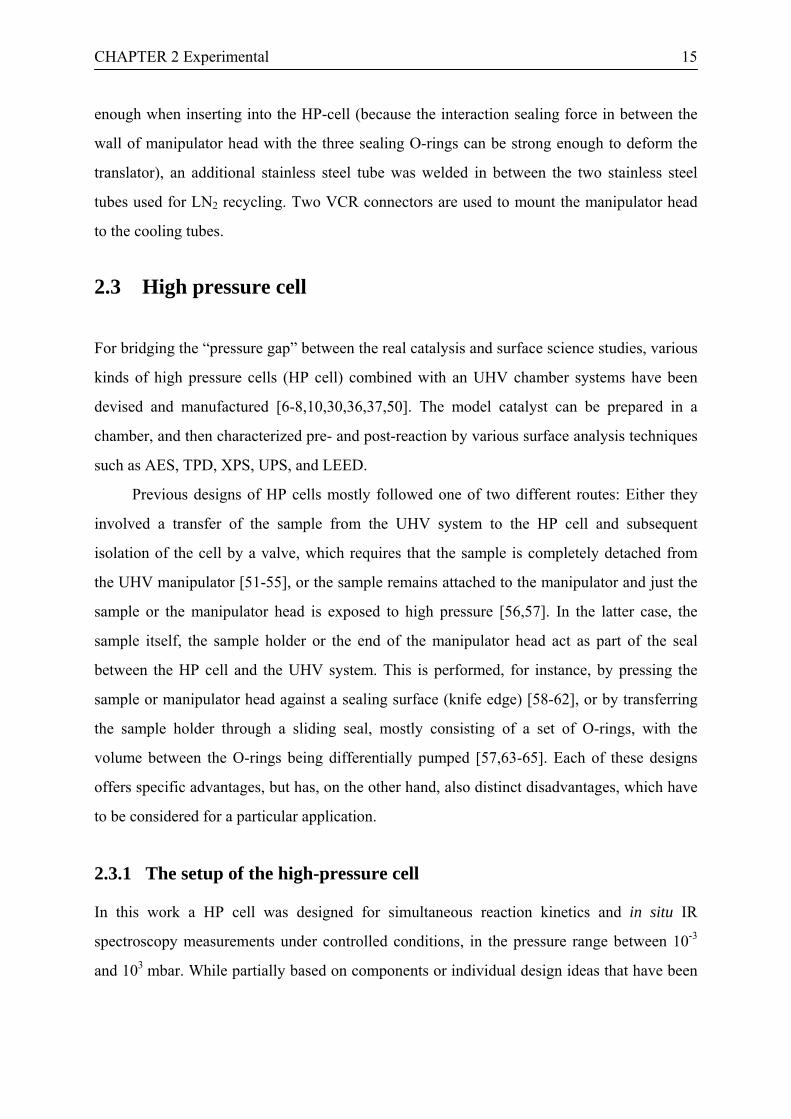
The second part of the HP-cell contains the reaction cell itself. It consists of a cylindrical
bore hole in a tetrahedral steel body. Four CF16 flanges, which are machined into the steel
body, serve as connections for gas analysis and pumping (bottom), gas inlet and pressure
measurements (top), and KBr windows for incoming and outgoing IR beam. The two flanges
at the sides form an angle of 173° to allow grazing incidence PM-IRAS measurements. The
home designed IR windows and the mounting is shown in Fig. 2.9. The construction consists
of an inner stainless steel flange with 12 bores, which has a CF16 knife edge on one side and
a groove to hold an O-ring on the other side. It is fixed to the CF16 flange connection of the
HP reaction cell by 6 countersunk screws. A KBr disk (Korth Kristalle GmbH, 19 mm
diameter, 4 mm thickness) is used as optical window and fixed between the inner flange and a
similar outer flange, with Viton O-rings (16 mm in diameter / width 1 mm - Schötz Industrie
Technik GmbH) between the stainless steel rings and the KBr piece on both sides. The outer
stainless steel ring is fixed to the inner ring by 6 set screws, screwed into the 6 tapped bores
left on the inner ring. To fix the optical windows, the set screws are tightened very carefully
in a cross mode to reduce stress on the optical windows. For similar reasons, care has to be
taken that the O-rings are sitting exactly in the grooves. After proper assembling, the
construction is fully He leak tight.
HP cell
Connection tube
CF16 flange
KBr windowViton O-rings
Cu gasket
HP cell
Connection tube
CF16 flange
KBr windowViton O-rings
Cu gasket
Figure 2.9: Cross section of the CF16 optical window for IR measurements.
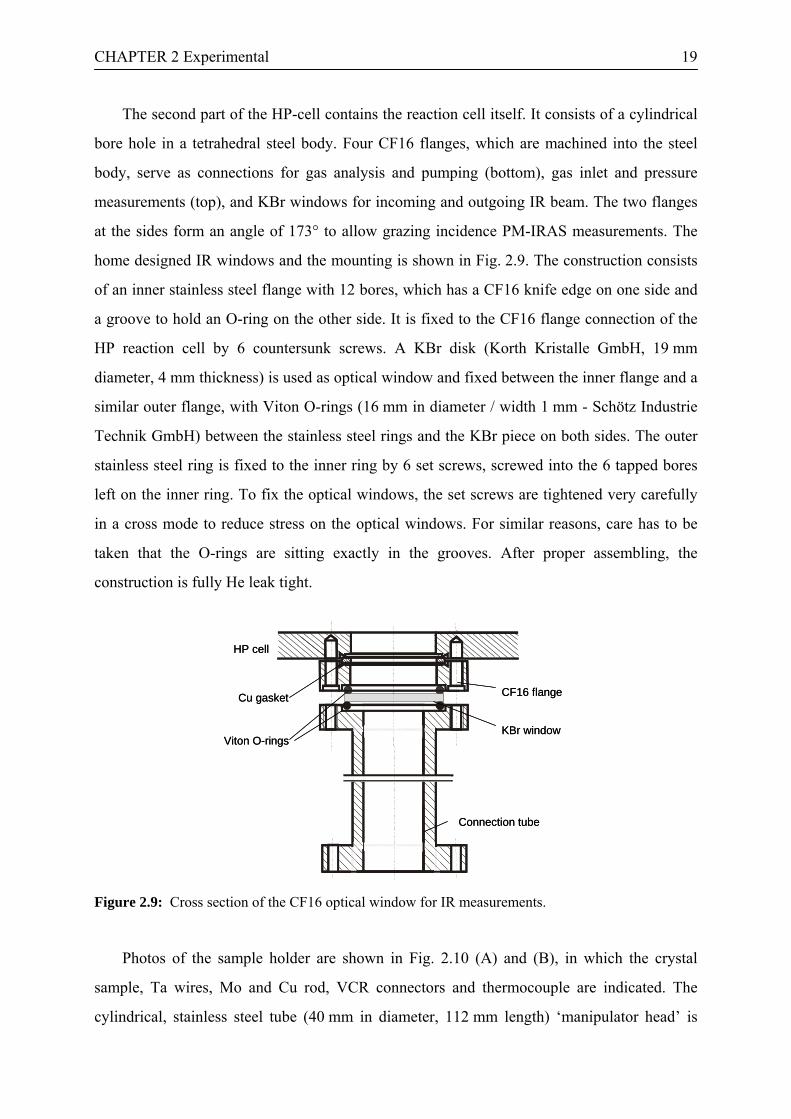
Photos of the sample holder are shown in Fig. 2.10 (A) and (B), in which the crystal
sample, Ta wires, Mo and Cu rod, VCR connectors and thermocouple are indicated. The
cylindrical, stainless steel tube (40 mm in diameter, 112 mm length) ‘manipulator head’ is
CHAPTER 2 Experimental 20
mounted via two ¼ in. stainless steel tubes at the front end of the translator and can be moved
into the sliding seals of the differential pumping stages of the high pressure cell. During high
pressure operation, it seals the differential pumping stages between the UHV system and the
HP cell.
A
Manipulator head
Ta wire
Mo rod
A
Manipulator head
Ta wire
Mo rod Cu rod
A
Manipulator head
Ta wire
Mo rod
A
Manipulator head
Ta wire
Mo rod Cu rod
VCR connector
B
Thermocouple VCR connector
B
Thermocouple
Figure 2.10: Photos of the sample mounting on sample holder (A) and VCR connector (B) in UHV chamber.
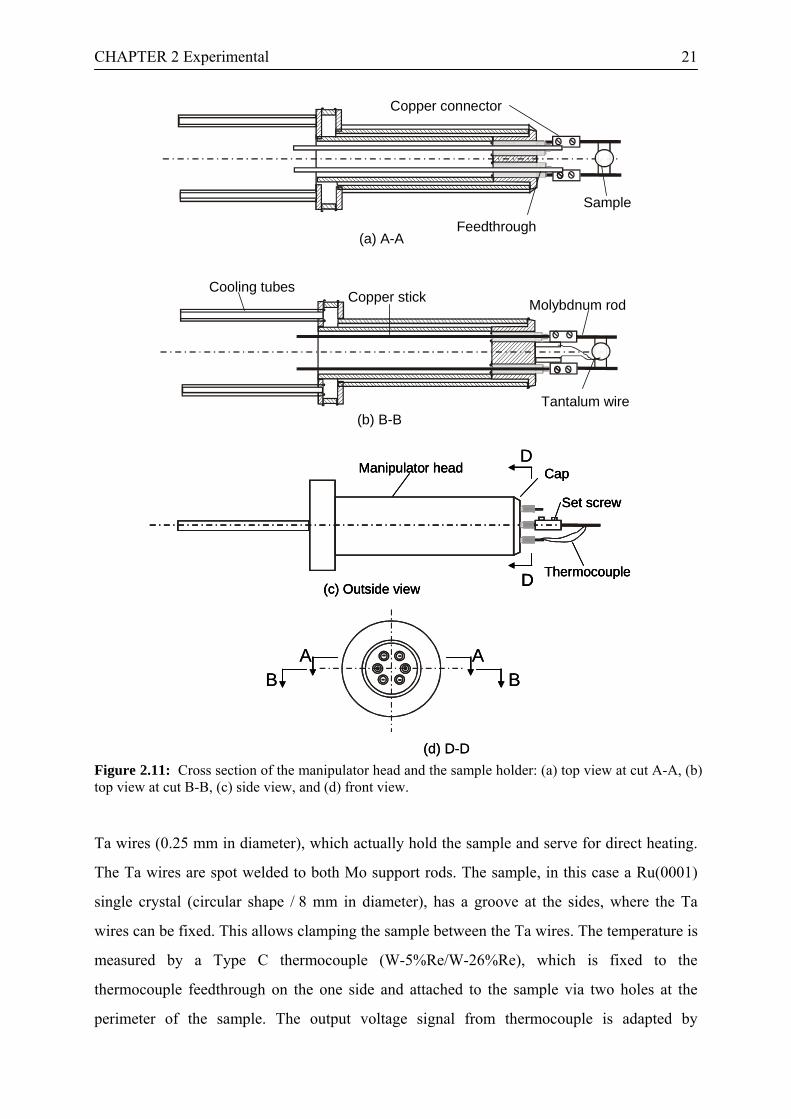
To improve the sealing abilities, its outer surface is mirror polished. The cross section
details of the manipulator head are shown in Fig. 2.11. It consists of a double walled cylinder,
made of two concentric stainless steel tubes, a base part, which is mounted on the two ¼ in.
tubes coming from the translator end and which carries the two concentric steel tubes on the
side oriented towards the HP cell, and a massive front plate on the HP cell side of the double
walled cylinder. Together with the base and front plates (see below) the two tubes form a
reservoir, which can be filled with liquid N2 for sample cooling. The LN2 is supplied to the
reservoir via the two steel tubes, which mainly act as mechanical support for the entire
construction, but are also part of the cooling system. At the front end, the concentric steel
tubes are welded to a massive stainless steel front plate, which is machined accordingly. This
plate (20 mm thickness) carries 6 feedthroughs, which are arranged concentrically. They
include two high current feedthroughs (30 A, MDC Caburn) and four thermocouple
feedthroughs (type C, MDC Caburn), which can be used for temperature control and for
additional indirect heating. These feedthroughs are welded into the front plate from the UHV
side, with their metal shaft pointing towards the HP side. The high power feedthrough support
the sample holder, which consists of two molybdenum rods clamped to the Cu shafts, and two
CHAPTER 2 Experimental 21
(a) A-AFeedthrough
Sample
Copper connector
Copper stick Molybdnum rod
Tantalum wire
Cooling tubes
(b) B-B
D
Thermocouple
Set screw
CapManipulator head
(c) Outside view D
D
Thermocouple
Set screw
CapManipulator head
(c) Outside view D Thermocouple
Set screw
CapManipulator head
(c) Outside view D
A AB B
(d) D-D
A AB B
(d) D-D Figure 2.11: Cross section of the manipulator head and the sample holder: (a) top view at cut A-A, (b) top view at cut B-B, (c) side view, and (d) front view.
Ta wires (0.25 mm in diameter), which actually hold the sample and serve for direct heating.
The Ta wires are spot welded to both Mo support rods. The sample, in this case a Ru(0001)
single crystal (circular shape / 8 mm in diameter), has a groove at the sides, where the Ta
wires can be fixed. This allows clamping the sample between the Ta wires. The temperature is
measured by a Type C thermocouple (W-5%Re/W-26%Re), which is fixed to the
thermocouple feedthrough on the one side and attached to the sample via two holes at the
perimeter of the sample. The output voltage signal from thermocouple is adapted by

CHAPTER 2 Experimental 22
computer, thus, the measurement and control of the sample temperature is controlled by
software with computer. Calibration of temperature was carried out by comparison with the
mixture of ice and water. This sample mounting configuration allows controlled variation of
the sample temperature from 100 K to 1700 K under UHV conditions, using liquid N2 cooling
and resistive heating, respectively.
2.3.2 Gas handling system The gas handling system was designed such that it could deliver controlled gas flows to the
HP cell for operation as flow reactor, which extend to flow ranges of about 10-3 sccm
(standard cubic centimeter per minute), far below the operating range of conventional mass
flow controllers. This is achieved by using two calibrated capillaries, which lead from the gas
mixing stage with an adjustable, controlled pressure to the HP cell and which permit to
control exactly the gas flow into the high pressure cell [66,67]. Rapid filling of the HP cell for
operation as batch reactor can be achieved via a third line. A schematic description of the gas
handling system is displayed in Fig. 2.12.
Figure 2.12: Flow scheme of the gas supply/analysis system with the HP cell, the gas-mixing stage, and the gas analysis unit (V: all metal membrane valve, P: pressure gauge, Cp: capillary, CV: right angle valves, FMV: fine meter valves, TP: turbomolecular pump, and RP: rotary pump).

CHAPTER 2 Experimental 23
The three connecting lines are separated from the HP cell by a membrane valve V1
(Parker, Netherlands), which is directly mounted at the top of the HP cell to reduce the reactor
volume during batch operation. Furthermore, these can be closed off towards V1 by the
membrane valves V2-V4 and towards the gas mixing stage by similar valves V2’ and V4’.
For gas dosing, the two valves of the respective line are opened, while those of the other two
lines remain closed. For evacuation of the lines, which is necessary whenever changing the
reaction gas or gas line, this can be pumped via V5 and one of the valves V2-V4. The gas
mixing chamber (volume 0.7 l), could be filled by the desired gases or gas mixtures via
bellow valves VG1-VG3 (Swagelock, USA) and be evacuated via right angle valve CV2. The
pressure in the gas mixing stage was controlled via pressure gauge P1.
Glass capillaries (Macherey/Nagel, untreated capillaries) with nominal inner diameters of
50 µm and 100 µm respectively, and a length of 100 cm were used for flow control. A fine
metering valve (Parker HR-0), which connects the reaction cell to the pumping stages, is used
to set a constant pressure in the reaction cell. In the case of laminar flow through the
capillaries, which is maintained for pressures of 200 mbar or higher in the gas mixing stage
[66], the volume flow can be calculated by applying the Hagen-Poiseuille equation,
(2.1) TkL
RppdN π ( −=
dt Bη16) 42
22
1
where:
N -number of molecules
t -time
p1-gas pressure before capillary (gas mixing chamber)
p2-gas pressure after capillary (high pressure cell)
R -radius of the capillary
L -length of the capillary
η -viscosity
kB -Boltzmann constant
T -temperature
In this case, the number of molecules passing the capillary is determined by the gas viscosity,
the inner diameter, the length of the capillary, and the gas pressures before and after it. For
CHAPTER 2 Experimental 24
pressures below 200 mbar, when the laminar flow breaks down, the gas flow has to be
calibrated. This can be done by monitoring the pressure increase in the sealed high pressure
cell with time when passing gas through the respective capillary.
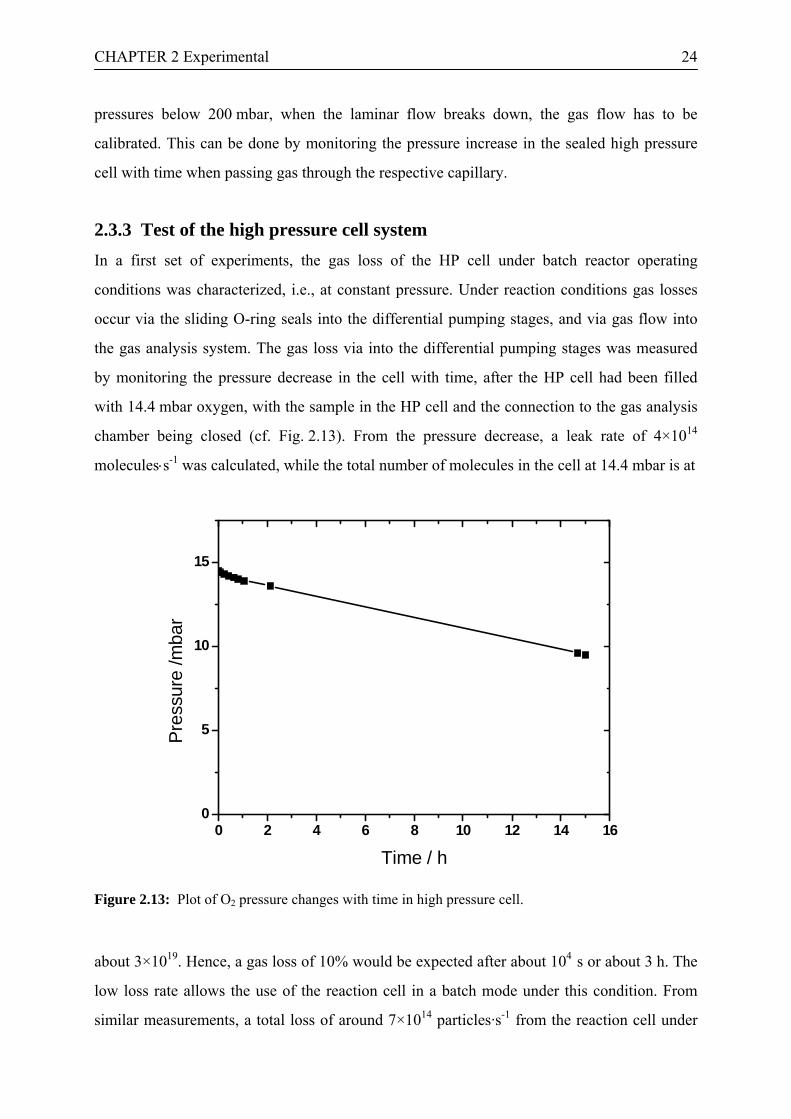
2.3.3 Test of the high pressure cell system In a first set of experiments, the gas loss of the HP cell under batch reactor operating
conditions was characterized, i.e., at constant pressure. Under reaction conditions gas losses
occur via the sliding O-ring seals into the differential pumping stages, and via gas flow into
the gas analysis system. The gas loss via into the differential pumping stages was measured
by monitoring the pressure decrease in the cell with time, after the HP cell had been filled
with 14.4 mbar oxygen, with the sample in the HP cell and the connection to the gas analysis
chamber being closed (cf. Fig. 2.13). From the pressure decrease, a leak rate of 4×10¹⁴
molecules⋅s-1 was calculated, while the total number of molecules in the cell at 14.4 mbar is at
0 2 4 6 8 10 12 14 160
5
10
15
Pres
sure
/mba
r
Time / h
Figure 2.13: Plot of O2 pressure changes with time in high pressure cell.
about 3×10¹⁹. Hence, a gas loss of 10% would be expected after about 104 s or about 3 h. The
low loss rate allows the use of the reaction cell in a batch mode under this condition. From
similar measurements, a total loss of around 7×10¹⁴ particles·s-1 from the reaction cell under
CHAPTER 2 Experimental 25
batch conditions at 14.4 mbar to the differentially pumped gas analysis chamber and the gas
analysis system was determined, when the latter is operated at a typical pressure of 10-7 mbar.
Hence, the loss into the gas analysis system is of similar order of magnitude as that via the
sliding seals under these conditions under batch conditions at 14.4 mbar. According to eq. 2.1,
the gas flow scales with 21p
dtdN
∝ , so if the pressure is ten times higher (lower), the gas flow
is 100 higher (lower). This allows measurements at 10-1 mbar at continuous gas flow into the
analysis system. Further reductions in operating pressure are possible, if the gas flow into the
analysis system is opened only for limited times.
The performance of the high pressure cell in kinetic and IR experiments was tested using
the CO oxidation reaction on Au/TiO2 model catalysts as an example. The Au/TiO2 samples
were prepared in the UHV chamber by first depositing Ti in an O2 atmosphere on a Ru(0001)
single crystal at elevated temperatures, followed by annealing steps to higher temperatures in
O2 to achieve a relatively flat and fully oxidized titania film. Subsequently, Au particles with
particle sizes in the few nanometer-range were formed by Au evaporation on the titania films,
while the latter were kept at room temperature. More details of the preparation of the model
catalysts will be described in chapter 3. Before transferring the sample to the high pressure
cell, the surface cleanness and composition was routinely checked by XPS.
After completion of sample preparation and the UHV analysis of the prepared model
catalysts, the sample was transferred to the high pressure cell to carry out CO adsorption or
CO oxidation measurements. Because of the low absolute activity of the model catalysts due
to their low active area, the background activity of the HP cell was carefully evaluated by
various experiments. First the activity of the complete set-up was tested by CO oxidation
measurements on a Ru(0001) sample covered by a TiO2 film on both sides without depositing
any Au on the surface under typical reaction conditions (20 mbar total pressure, pCO : pO2 =
1 : 2, 100°C) and, for comparison, by similar measurements on a Au foil at 180°C. Both
surfaces can be considered as inert for CO oxidation under present reaction conditions [68].
The resulting reaction rate therefore describes the background activity of the set-up (cf.
Fig.2.14). The difference between both samples lies in the possible activity of the edges of the
Ru substrate, which are not covered by a TiO2 film. While Ru is known as good catalyst for
CO oxidation [69], these edges are expected to be poisoned by a thick contaminant layer,
since they are not exposed to ion bombardment. Nevertheless, the increase in CO2 partial
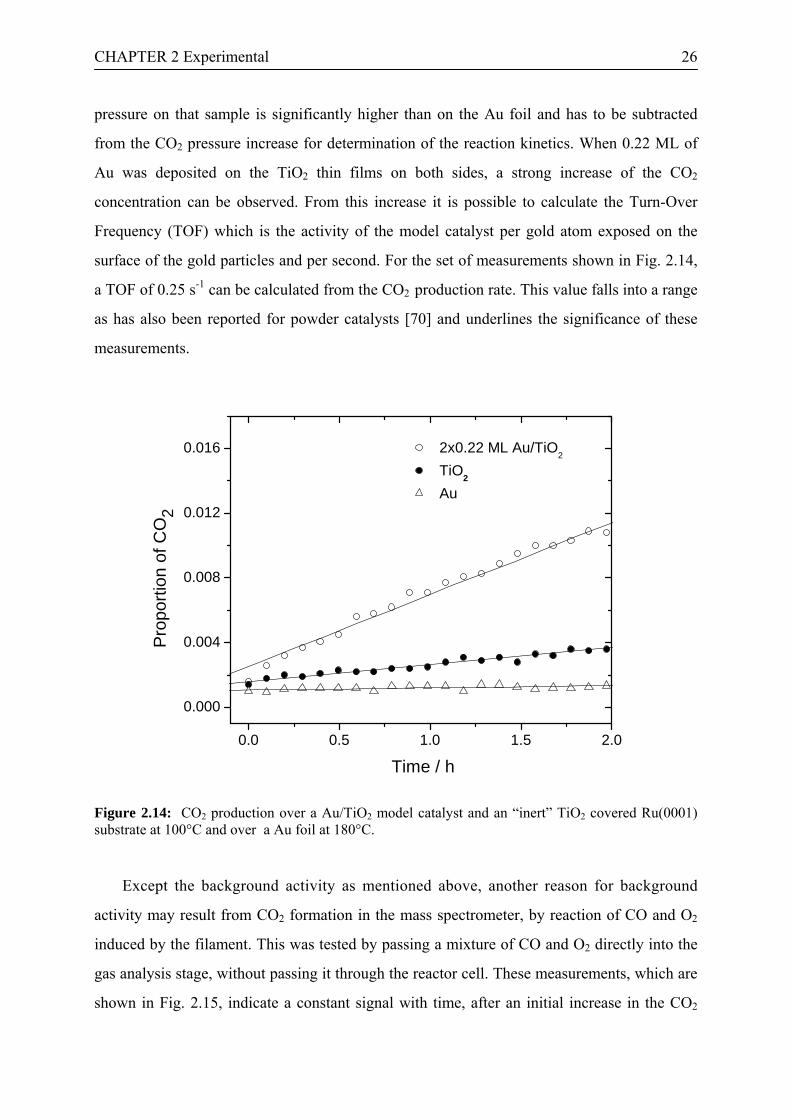
CHAPTER 2 Experimental 26
pressure on that sample is significantly higher than on the Au foil and has to be subtracted
from the CO2 pressure increase for determination of the reaction kinetics. When 0.22 ML of
Au was deposited on the TiO2 thin films on both sides, a strong increase of the CO2
concentration can be observed. From this increase it is possible to calculate the Turn-Over
Frequency (TOF) which is the activity of the model catalyst per gold atom exposed on the
surface of the gold particles and per second. For the set of measurements shown in Fig. 2.14,
a TOF of 0.25 s-1 can be calculated from the CO2 production rate. This value falls into a range
as has also been reported for powder catalysts [70] and underlines the significance of these
measurements.
0.0 0.5 1.0 1.5 2.0
0.000
0.004
0.008
0.012
0.016 2x0.22 ML Au/TiO2 TiO2
Au
Pro
porti
on o
f CO
2
Time / h
Figure 2.14: CO2 production over a Au/TiO2 model catalyst and an “inert” TiO2 covered Ru(0001) substrate at 100°C and over a Au foil at 180°C.
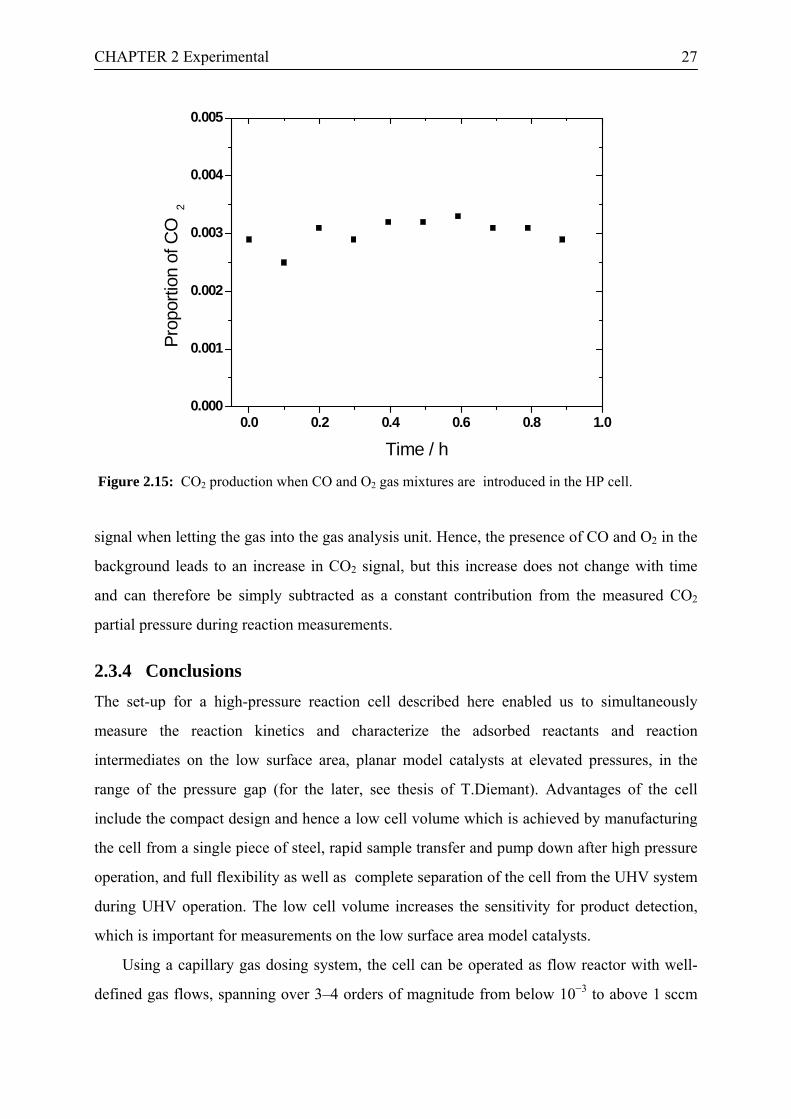
Except the background activity as mentioned above, another reason for background
activity may result from CO2 formation in the mass spectrometer, by reaction of CO and O2
induced by the filament. This was tested by passing a mixture of CO and O2 directly into the
gas analysis stage, without passing it through the reactor cell. These measurements, which are
shown in Fig. 2.15, indicate a constant signal with time, after an initial increase in the CO2
CHAPTER 2 Experimental 27
0.0 0.2 0.4 0.6 0.8 1.00.000
0.001
0.002
0.003
0.004
0.005
Prop
ortio
n of
CO
2
Time / h Figure 2.15: CO2 production when CO and O2 gas mixtures are introduced in the HP cell.
signal when letting the gas into the gas analysis unit. Hence, the presence of CO and O2 in the
background leads to an increase in CO2 signal, but this increase does not change with time
and can therefore be simply subtracted as a constant contribution from the measured CO2
partial pressure during reaction measurements.
2.3.4 Conclusions The set-up for a high-pressure reaction cell described here enabled us to simultaneously
measure the reaction kinetics and characterize the adsorbed reactants and reaction
intermediates on the low surface area, planar model catalysts at elevated pressures, in the
range of the pressure gap (for the later, see thesis of T.Diemant). Advantages of the cell
include the compact design and hence a low cell volume which is achieved by manufacturing
the cell from a single piece of steel, rapid sample transfer and pump down after high pressure
operation, and full flexibility as well as complete separation of the cell from the UHV system
during UHV operation. The low cell volume increases the sensitivity for product detection,
which is important for measurements on the low surface area model catalysts.
Using a capillary gas dosing system, the cell can be operated as flow reactor with well-
defined gas flows, spanning over 3–4 orders of magnitude from below 10−3 to above 1 sccm
CHAPTER 2 Experimental 28
(standard cubic centimeter per minute), and at adjustable pressures between 10−1 and
102 mbar. The low gas losses over the sliding seals and for gas analysis allow the operation
as batch reactor in the pressure range between 10−2 and 103 mbar over extended times, losing
no more than 10% of the reaction gas over 3 hours of operation. The use of polarization
modulation in IRAS measurements permits in-situ IR measurements at higher gas pressure up
to 100 mbar or possibly even higher pressures (for the IRAS measurements, see thesis of
T.Diemant).
2.4 Surface science methods in UHV In this section, the surface science techniques, which have been used, will briefly be
described. Since the topic of surface analysis approaches are described in detail in the
literatures as [76-79], it is not attempted to duplicate the bulk of that subject matter in this
thesis.
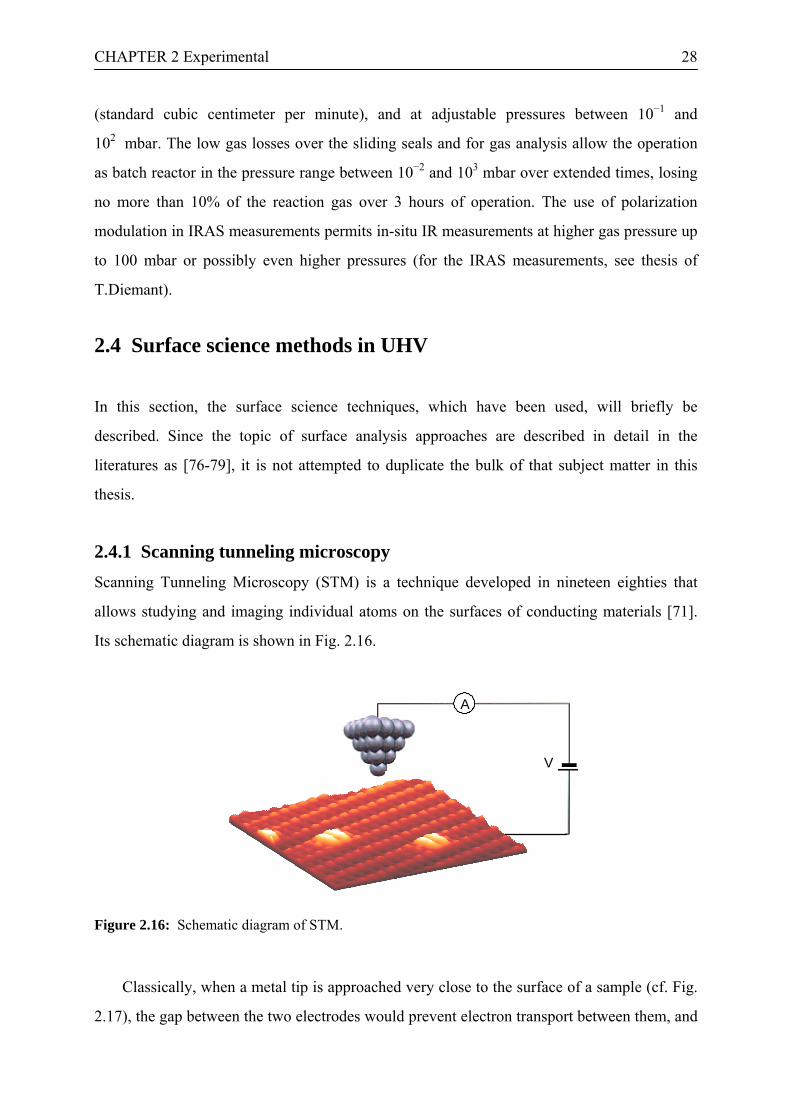
2.4.1 Scanning tunneling microscopy Scanning Tunneling Microscopy (STM) is a technique developed in nineteen eighties that
allows studying and imaging individual atoms on the surfaces of conducting materials [71].
Its schematic diagram is shown in Fig. 2.16.
A
V
Figure 2.16: Schematic diagram of STM.
Classically, when a metal tip is approached very close to the surface of a sample (cf. Fig.
2.17), the gap between the two electrodes would prevent electron transport between them, and
CHAPTER 2 Experimental 29
there should be no current between tip and sample even when a bias voltage is applied
between them. However, because of the wavelike properties of particles (electrons, in this
case) in quantum mechanics, when an electron is incident upon a vacuum barrier with
potential energy larger than the kinetic energy of the electron, there is still a non-zero
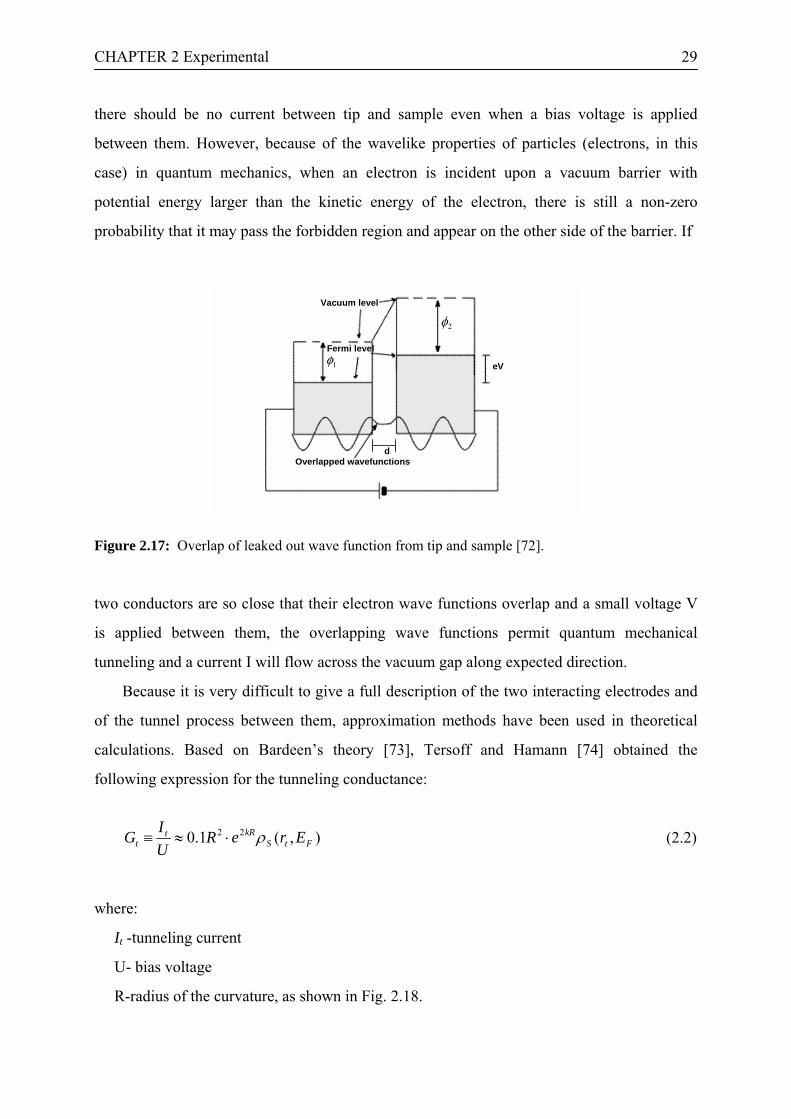
probability that it may pass the forbidden region and appear on the other side of the barrier. If
Vacuum level
1φ
2φ
eV
Fermi level
Overlapped wavefunctionsd
Vacuum level
1φ
2φ
eV
Fermi level
Overlapped wavefunctionsd
Figure 2.17: Overlap of leaked out wave function from tip and sample [72].
two conductors are so close that their electron wave functions overlap and a small voltage V
is applied between them, the overlapping wave functions permit quantum mechanical
tunneling and a current I will flow across the vacuum gap along expected direction.
Because it is very difficult to give a full description of the two interacting electrodes and
of the tunnel process between them, approximation methods have been used in theoretical
calculations. Based on Bardeen’s theory [73], Tersoff and Hamann [74] obtained the
following expression for the tunneling conductance:
),(1.0 22FtS
kRtt EreR
UIG ρ⋅≈≡ (2.2)
where:
It -tunneling current
U- bias voltage
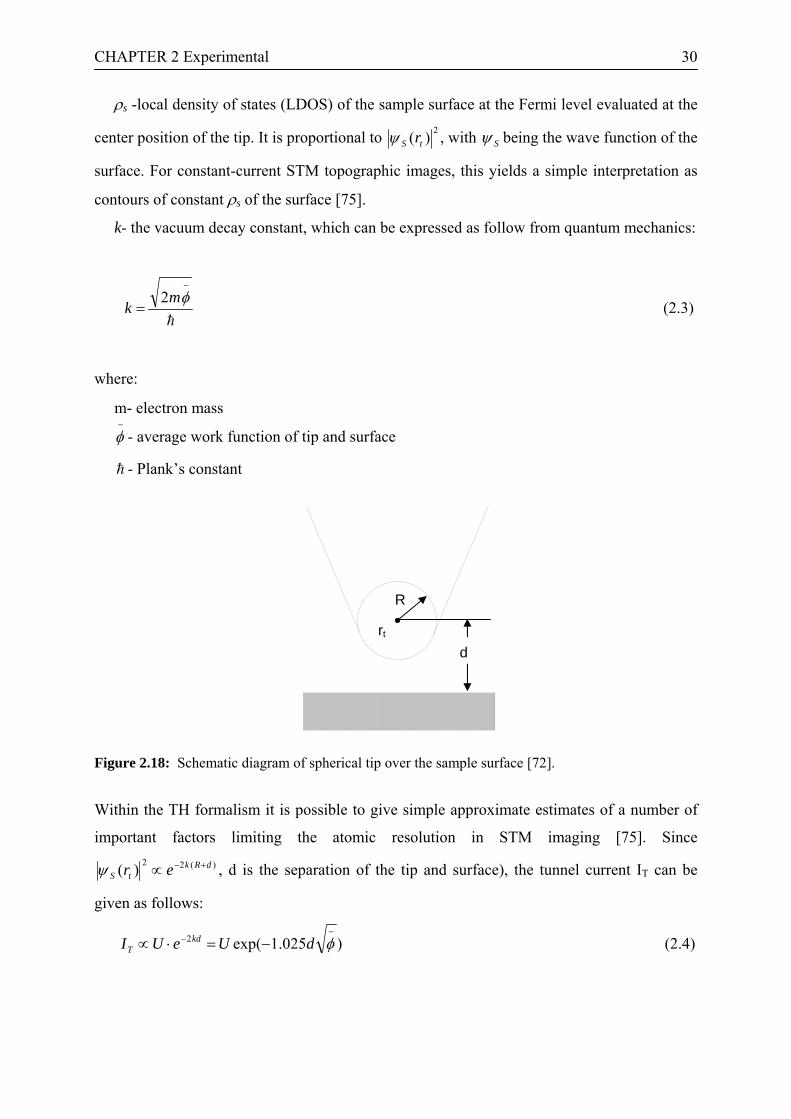
R-radius of the curvature, as shown in Fig. 2.18.
CHAPTER 2 Experimental 30
ρs -local density of states (LDOS) of the sample surface at the Fermi level evaluated at the
center position of the tip. It is proportional to 2)( tS rψ , with Sψ being the wave function of the
surface. For constant-current STM topographic images, this yields a simple interpretation as
contours of constant ρs of the surface [75].
k- the vacuum decay constant, which can be expressed as follow from quantum mechanics:
h
−
=φm
k2
(2.3)
where:
m- electron mass
- average work function of tip and surface −
φ
- Plank’s constant h
R
rt
d
Figure 2.18: Schematic diagram of spherical tip over the sample surface [72].
Within the TH formalism it is possible to give simple approximate estimates of a number of
important factors limiting the atomic resolution in STM imaging [75]. Since )(22)( dRk
tS er +−∝ψ , d is the separation of the tip and surface), the tunnel current IT can be
given as follows:
)025.1exp(2−
− −=⋅∝ φdUeUI kdT (2.4)
CHAPTER 2 Experimental 31
Equation (2.4) indicates that the tunneling current decays exponentially with increasing
distance d between the tip and sample surface. If the distance is increased by 1 Å, the current
flow decreased by one order of magnitude for typical values of , so the sensitivity to the
variations in the vertical distance is very high. In addition, the equation also implies that
changes of I
−
φ
T might be due to a local variation of the work function. The two effects using the
relation:
(2.5) 2)/ln( dIT ∂∂≈−
φ
can be separated by recording both the signal IT and the derivative (by a special electronic
circuit design). This way it is possible to distinguish between topography and work function
changes.
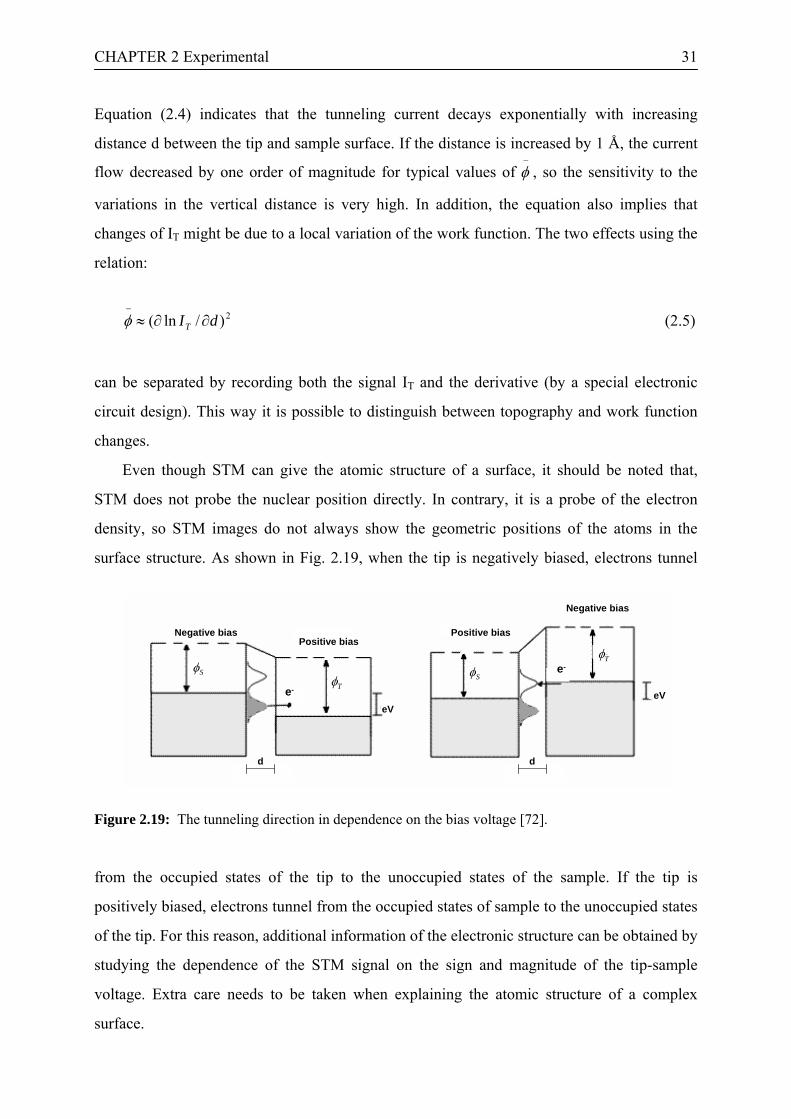
Even though STM can give the atomic structure of a surface, it should be noted that,
STM does not probe the nuclear position directly. In contrary, it is a probe of the electron
density, so STM images do not always show the geometric positions of the atoms in the
surface structure. As shown in Fig. 2.19, when the tip is negatively biased, electrons tunnel
Negative bias
Sφ
Positive bias
e- Tφ
eV
d d
Sφ
Positive bias
e-Tφ
Negative bias
eV
Negative bias
Sφ
Positive bias
e- Tφ
eV
d d
Sφ
Positive bias
e-Tφ
Negative bias
eV
Figure 2.19: The tunneling direction in dependence on the bias voltage [72].
from the occupied states of the tip to the unoccupied states of the sample. If the tip is
positively biased, electrons tunnel from the occupied states of sample to the unoccupied states
of the tip. For this reason, additional information of the electronic structure can be obtained by
studying the dependence of the STM signal on the sign and magnitude of the tip-sample
voltage. Extra care needs to be taken when explaining the atomic structure of a complex
surface.
CHAPTER 2 Experimental 32
In general, STM is an indispensable technique for characterizing planar surfaces with
sufficient conductivity. Bulk metal oxides typically used for catalytic supports, however, are
wide band gap materials and therefore conductivity problems making them unsuitable
candidates for electron spectroscopy and STM measurements. In this thesis, the problem is
overcome by preparing thin oxide films on a single crystal Ru surface. In the present case,
TiO2 films have been prepared on Ru(0001).
2.4.2 X-ray photoelectron spectroscopy and Auger electron spectroscopy X-ray photoelectron spectroscopy (XPS) is a powerful technique for determining the chemical
composition of a solid surface. It is often referred to as electron spectroscopy for chemical
analysis (ESCA), Siegbahn coined the acroynm ESCA to underline the fact that both
photoelectrons and Auger electron peaks appear in the ‘XPS’ spectrum. In XPS, x-rays (λ<30
Å) are focused onto a sample and as a consequence, electrons emitted from the sample. The
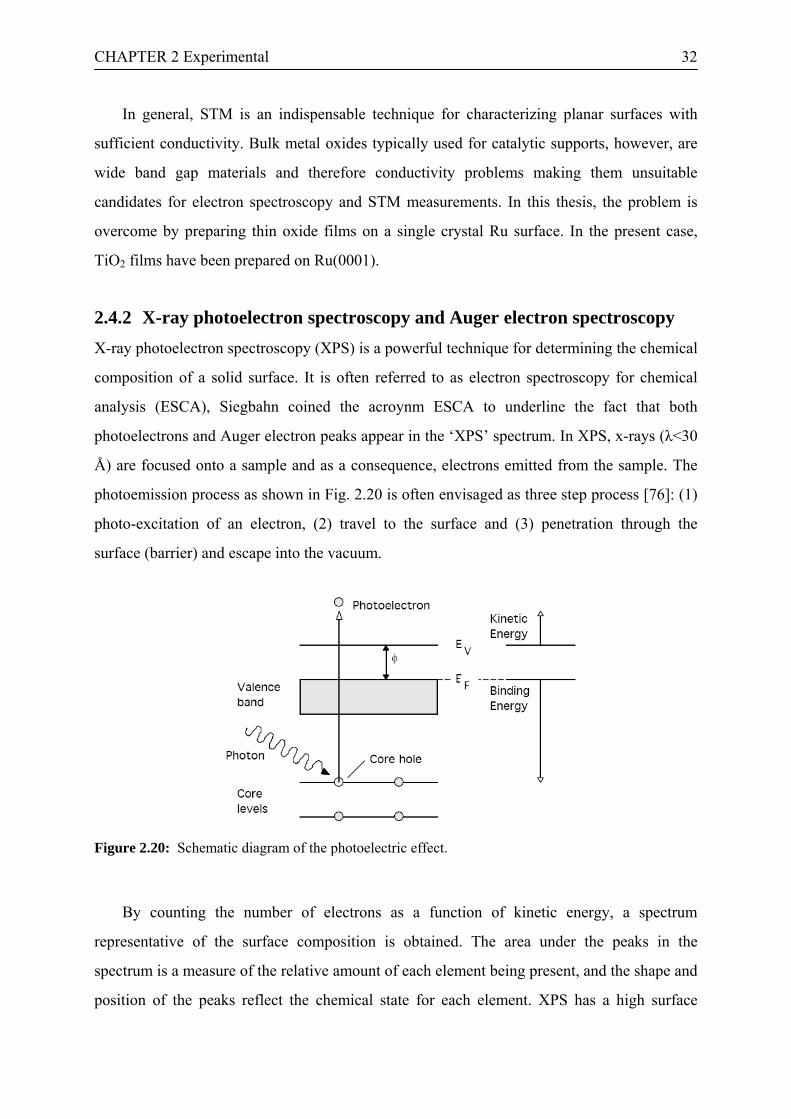
photoemission process as shown in Fig. 2.20 is often envisaged as three step process [76]: (1)
photo-excitation of an electron, (2) travel to the surface and (3) penetration through the
surface (barrier) and escape into the vacuum.
Figure 2.20: Schematic diagram of the photoelectric effect.
By counting the number of electrons as a function of kinetic energy, a spectrum
representative of the surface composition is obtained. The area under the peaks in the
spectrum is a measure of the relative amount of each element being present, and the shape and
position of the peaks reflect the chemical state for each element. XPS has a high surface
CHAPTER 2 Experimental 33
sensitivity because only electrons from the surface near region can make it to the surface and
are emitted [77]. In a solid, electrons have a short mean free path and, as a consequence, only
electrons originating from the top few atomic layers are detected. XPS can detect chemical
states because each chemical bond causes a change in the electrostatic potential as the valence
electron charge density changes in an atom [78]. Based on the photoelectric effect. For solids,
Ek= hν − Eb − φ (2.6)
where:
Ek -kinetic energy (KE) of the photoelectrons
hν-energy of X-ray
Eb -binding energy (BE) of the electron (Eb=0 at EF)
φ - work function of the solid
From the equation above, one can expect that, if the energy of the incident photon beam is
larger than the BE, electrons are emitted. Since the energy of the incident photons is known
and the KE is experimentally detected, the BE can be determined. Each element has a unique
set of core levels, Eb, that can be used for a chemical analysis.
Photoelectron spectra are mostly interpreted in terms of an approximation called
Koopman's theorem, which assumes that the binding energy equals the negative energy of the
orbital from which the electron is emitted (relaxation effects are neglected). The binding
energy Eb of an electron is simply the difference between the initial state (atom with n
electrons) and the final state (atom with n-1 electrons (ion) and free photoelectron) of the
excited atom [76]:
Eb = Efinal(n -1)- Einitial (n) (2.7)
This means that both initial state effects and final state effects have an influence on the
measured binding energy Eb. However, the theorem is only an approximation, which neglects
the fact of electron rearrangements to shield the core hole.
The main structures in XPS are the binding energy of the element, spin-orbit-splitting,
area ratio of the peaks, Auger peaks, core level chemical shift and inelastic background. The
CHAPTER 2 Experimental 34
secondary structure in XPS includes X-ray satellites, surface charging, final state effects
(Intrinsic Satellites), multiplet splitting, extrinsic satellites.
The core-level binding energies shifts provide evidence for the character of the chemical
bonding and chemical interactions of the ionized atom and, thus, XPS data may help to
explain properties of surfaces relevant for processes in heterogeneous catalysis.
Besides XPS, Auger electron spectroscopy (AES) is also a widespread method for
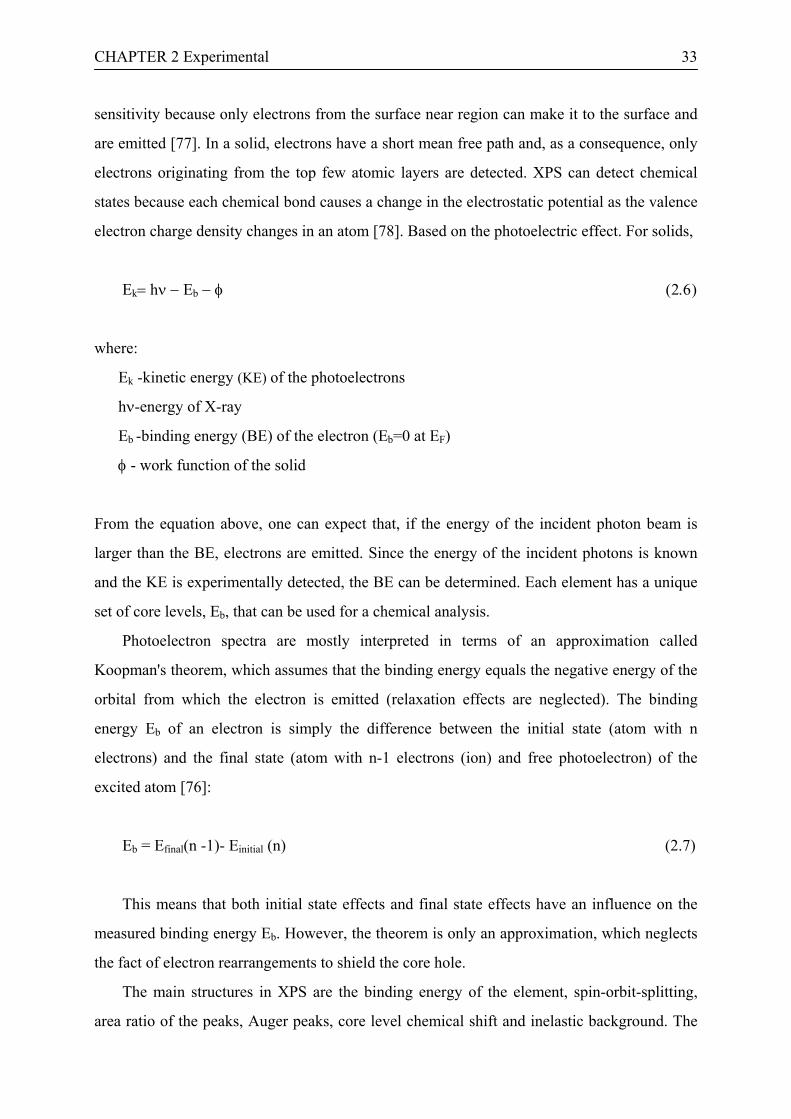
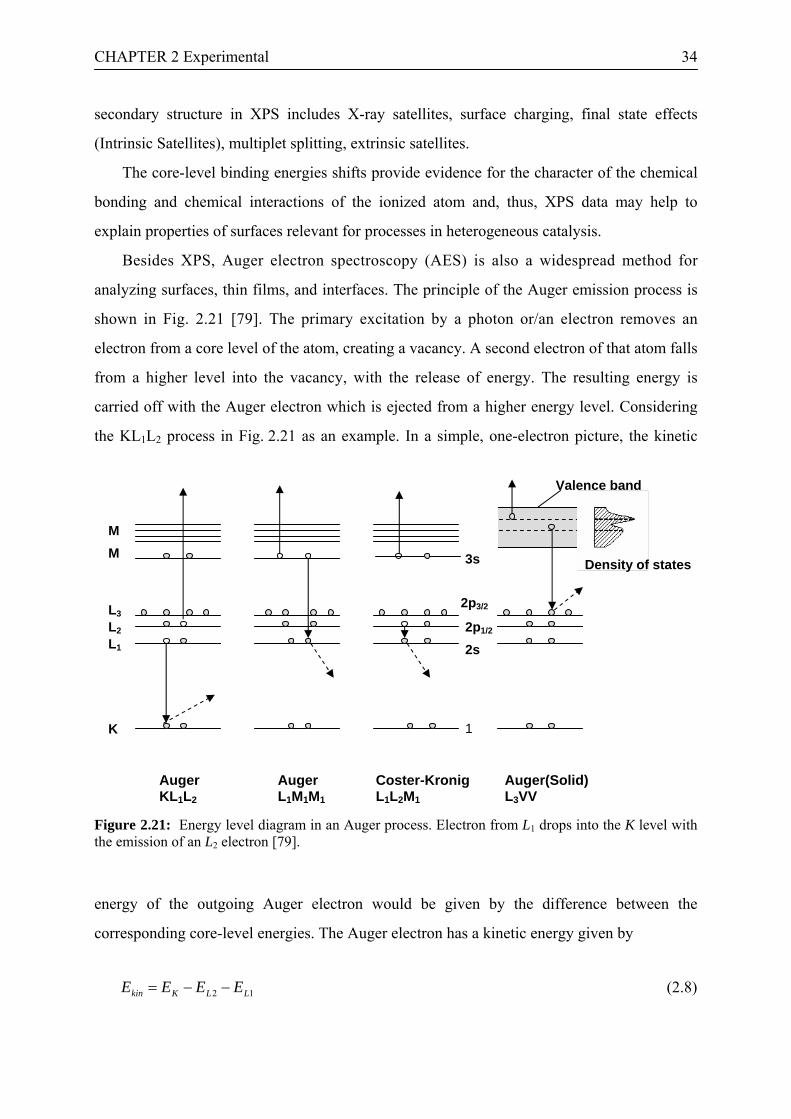
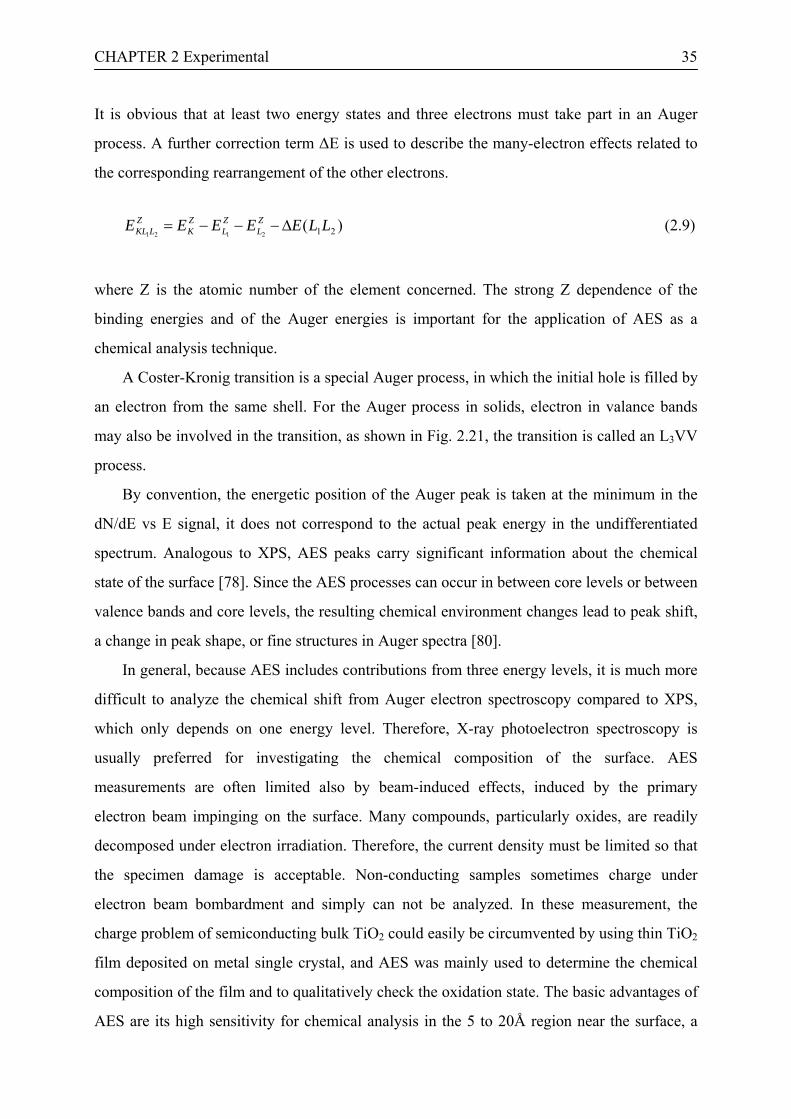
analyzing surfaces, thin films, and interfaces. The principle of the Auger emission process is
shown in Fig. 2.21 [79]. The primary excitation by a photon or/an electron removes an
electron from a core level of the atom, creating a vacancy. A second electron of that atom falls
from a higher level into the vacancy, with the release of energy. The resulting energy is
carried off with the Auger electron which is ejected from a higher energy level. Considering
the KL1L2 process in Fig. 2.21 as an example. In a simple, one-electron picture, the kinetic
Valence band
Figure 2.21: Energy level diagram in an Auger process. Electron from L1 drops into the K level with the emission of an L2 electron [79].
energy of the outgoing Auger electron would be given by the difference between the
corresponding core-level energies. The Auger electron has a kinetic energy given by
(2.8) 12 LLKkin EEEE −−=
MM
L3
L2
L1
K
Auger KL1L2
Auger L1M1M1
Coster-Kronig L1L2M1
Auger(Solid) L3VV
2p3/2
3s
2s 2p1/2
Density of states
1
CHAPTER 2 Experimental 35
It is obvious that at least two energy states and three electrons must take part in an Auger
process. A further correction term ∆E is used to describe the many-electron effects related to
the corresponding rearrangement of the other electrons.
(2.9) )( 212121
LLEEEEE ZL
ZL
ZK
ZLKL ∆−−−=
where Z is the atomic number of the element concerned. The strong Z dependence of the
binding energies and of the Auger energies is important for the application of AES as a
chemical analysis technique.
A Coster-Kronig transition is a special Auger process, in which the initial hole is filled by
an electron from the same shell. For the Auger process in solids, electron in valance bands
may also be involved in the transition, as shown in Fig. 2.21, the transition is called an L3VV
process.
By convention, the energetic position of the Auger peak is taken at the minimum in the
dN/dE vs E signal, it does not correspond to the actual peak energy in the undifferentiated
spectrum. Analogous to XPS, AES peaks carry significant information about the chemical
state of the surface [78]. Since the AES processes can occur in between core levels or between
valence bands and core levels, the resulting chemical environment changes lead to peak shift,
a change in peak shape, or fine structures in Auger spectra [80].
In general, because AES includes contributions from three energy levels, it is much more
difficult to analyze the chemical shift from Auger electron spectroscopy compared to XPS,
which only depends on one energy level. Therefore, X-ray photoelectron spectroscopy is
usually preferred for investigating the chemical composition of the surface. AES
measurements are often limited also by beam-induced effects, induced by the primary
electron beam impinging on the surface. Many compounds, particularly oxides, are readily
decomposed under electron irradiation. Therefore, the current density must be limited so that
the specimen damage is acceptable. Non-conducting samples sometimes charge under
electron beam bombardment and simply can not be analyzed. In these measurement, the
charge problem of semiconducting bulk TiO2 could easily be circumvented by using thin TiO2
film deposited on metal single crystal, and AES was mainly used to determine the chemical
composition of the film and to qualitatively check the oxidation state. The basic advantages of
AES are its high sensitivity for chemical analysis in the 5 to 20Å region near the surface, a

CHAPTER 2 Experimental 36
rapid data acquisition speed, its ability to detect all elements except helium, and its capability
of high-spatial resolution [81].
2.4.3 Temperature Programmed Desorption Temperature programmed desorption (TPD), also known as thermal desorption
spectroscopy (TDS), is a useful technique to study adsorption-substrate bonding. For thermal
desorption, increasingly higher temperatures are needed to desorb adsorbates with stronger
adsorbate-substrate bond. Integrated TPD intensities provide information about the relative
surface coverage of a given adsorbate. Absolute coverages can be obtained by comparison
with the integrated intensity from a known structure with a well-defined coverage. The graph
in Fig. 2.22 shows an example of a CO-TPD spectrum, following adsorption of CO on
Ru(0001) at 100 K.
100 200 300 400 500 600
Temperature / K
CO
QM
S C
urre
nt /
28 a
mu
Figure 2.22: CO-TPD from single crystal clean Ru(0001).
During a TPD measurement, the conditions are such that the pumping rate is much larger
than the desorption rate. Under these conditions, the additional QMS intensity rise of a given
molecular species is proportional to the desorption rate. A TPD peak at a given temperature
Tp hence indicates a maximum desorption rate at that temperature. When the activation
CHAPTER 2 Experimental 37
energy for desorption is independent of the adsorbate coverage, Tp is not influenced by the
initial coverage for first-order desorption, while for second-order desorption, Tp will shift with
coverage. These characteristics often provide useful information on the desorption
mechanism. It is important to realize that shifts of TPD peaks often originate from other
mechanisms than simple associated desorption, such as adsorbate-adsorbate interaction,
substrate transformations, etc.
More detailed information on the nature and number of adsorbed species as well as their
desorption kinetics can be extracted from a quantitative TPD spectrum analysis. If the
activation energy of desorption Ed and the frequency factor νx are independent of the
coverage, the rate of change in coverage can be represented by an Arrhenius equation:
)/exp( RTEdtd
dxx −=− υθθ
(2.10)
where:
θ - the surface coverage of adsorbates
νx - the rate constant
x - the desorption order
For a molecular adsorbate, such as CO, the rate of desorption will depend linearly on the CO
coverage, i.e. first-order desorption is expected (x=1). For associative desorption of, e.g., O,
second-order desorption (x=2) is expected, since two oxygen atoms have to meet prior to
desorption.
In a temperature programmed desorption experiment, two heating schedules are used: a
linear variation of sample temperature with time or a reciprocal temperature variation [82],
the former of which is used in the work. The temperature is increased linearly with time from
an initial temperature To , which means:
T=To+ βt and dT = β dt (2.11)

CHAPTER 2 Experimental 38
With the heating rate dtdT /=β , the intensity of the desorption signal, I(T) , is proportional
to the rate at which the surface concentration of adsorbed species decreases. For first-order
desorption, we obtain
⎟⎟⎠
⎞⎜⎜⎝
⎛ −=−∝
RTE
dTdTI dexp)(
βνθθ (2.12)
The maximum desorption signal in the I(T) trace will occur when (dI / dT)=0, i.e. when
0exp =⎥⎦
⎤⎢⎣
⎡⎟⎟⎠
⎞⎜⎜⎝
⎛−
RTE
dTd d
βνθ (2.13)
Hence , remembering that the surface coverage changes with temperature i.e. θ = θ (T),
0expexp2 =⋅⎟⎠⎞
⎜⎝⎛−+⎟
⎠⎞
⎜⎝⎛−⋅
dTd
RTE
RTE
RTE add θ
βν
βνθ (2.14)
Substituting for dθ/dT from (2.7) then gives
0expexp2 =⎟⎠⎞
⎜⎝⎛−⎥
⎦
⎤⎢⎣
⎡⎟⎠⎞
⎜⎝⎛−−
RTE
RTE
RTE ddd
βν
βνθ (2.15)
The solution is given by setting the expression in square brackets to be equal to zero , i.e.
⎟⎟⎠
⎞⎜⎜⎝
⎛−=
p
d
p
d
RTE
RTE exp2 β
ν (2.16)
where the temperature of the desorption maximum is defined as T = Tp ( peak temperature ).
Equation (2.13) shows that Tp is independent of coverage for a first-order reaction with
constant Ed and thus Ed can be found directly from a measurement of Tp provided a value of ν
is known or assumed. The relation between Ed and Tp is nearly linear and, for 1013>
ν1β>108(K-1), is given to ±1.5 percent by [82]:
64.3)/ln(/ 1 −= βυ ppd TRTE (2.17)

CHAPTER 2 Experimental 39
The logarithmic nature of the relationship helps to reduce the impact of the different
underlying assumptions and may thus provide a useful estimate of the desorption energy.
In addition to the maximum desorption rate, the shape of the experimental curve of the
desorption rate as a function of sample temperature can be used to determine (a) the order of
the desorption, and (b) whether the activation energy is constant [82]. For the case of a linear
temperature sweep, the desorption rate curve is asymmetric about the peak temperature for
first order case, while it is symmetric about the peak temperature for second order desorption.
The basic experiment is very simple. First step: Adsorption of one or more molecular
species onto the sample surface at low temperature; second step: Heating of the sample in a
controlled manner (preferably so as to give a linear temperature ramp) whilst monitoring the
evolution of species from the surface back into the gas phase.
In modern implementations of the technique the detector of choice is a small quadrupole
mass spectrometer (QMS) and the whole process is carried out under computer control with
quasi-simultaneous monitoring of a number of possible products. The data obtained from such
an experiment consists of the intensity variation of each recorded mass fragment as a function
of time / temperature. In the case of a simple reversible adsorption process it may only be
necessary to record one signal - that attributable to the molecular ion of the adsorbate
concerned. Since mass spectrometric detection is used, the sensitivity of the technique is good
with attainable detection limits below 1% of a monolayer of adsorbate.
CHAPTER 3 Preparation and characterization of titania thin film on Ru(0001) 40
CHAPTER 3
Preparation and characterization of titania thin film on
Ru(0001)
This chapter describes the preparation and characterization of TiO2 thin films on a Ru(0001)
single crystal. The purpose is to bridge the material gap in catalysts study by building a thin
single crystal TiO2 film as a support for Au nanoparticles. Compared with single crystal bulk
TiO2 or polycrystalline TiO2 powder, a single crystal TiO2 thin film deposited on a metal
support is much easier to characterize by surface science approaches because of its improved
conductivity.
CHAPTER 3 Preparation and characterization of titania thin film on Ru(0001) 41
3.1 Introduction
Oxides play an important role in practical technology and science, especially in catalysis
application. Many commercial catalysts consist of nanometer size metal particles supported
on a high-surface-area oxide and some of the oxides are catalyst by themselves [33].
However, more detailed studies of metal oxide surfaces just started a few decades ago because
of some formidable challenges compared with metal and semiconductors, e.g., the sheer
complexity of the chemical and physical properties along with the complexity of their
crystallography.
The starting point in understanding the structures of metal oxide is the “ionic model”. The
most important bonding forces are those that operate between the positively charged metal
cations and the negatively charged oxide/oxygen anions. Therefore, the structures of the
transition metal oxides will be dominated by arrangements where metal ions are surrounded
by oxygen and vice versa [33]. Compared with ideal crystal structures, defects and non-
stoichiometries are always present in practical crystalline samples. Many transition-metal
oxides have an unusually high concentration of defects in the bulk, which are associated with
the possibility of the variable valance or oxidation states. This is a main feature of transition-
metal chemistry, which exerts an important influence on the physical and chemical properties
of the solid compounds.
This work will focus on titanium oxide, in particular, the growth of the titanium oxide
thin films on single crystal Ru(0001) and the surface characterization of the films. After
describing the electronic and geometrical properties of bulk and surface of TiO2 briefly, the
growth of TiO2 thin film will be discussed. In the section of “Experimental results and
discussion”, the investigation results on ultrathin TiOx films (at coverages from submonolayer
to 2 ML) will be presented first. This was driven by two main reasons. Firstly, the structure
and the resulting properties of thin films depend on the initial morphology of the interface
region. Only with the knowledge about the initial growth mode of ultrathin film, it is possible
to grow thicker films in a controlled way. Secondly, there could be new surface structures and
chemical reactivities different from the surfaces of the bulk oxide due to the direct contact of
the ultrathin oxide films to the metallic or oxide substrate [27,83].
In order to elucidate the effect of the substrate, a comparison of the results with data
obtained for TiO2 monolayer films on other metal substrates such as Pt(111) [22], Cu(100)

CHAPTER 3 Preparation and characterization of titania thin film on Ru(0001) 42
and Fe/Cu(100) [26], and Ni(110) [84] will be presented. Following that, the growth mode
and thermal stability of thicker TiO2 films up to 10 ML are investigated. A fully oxidized and
well ordered rutile TiO2 film with (110)-(1×1) surface structure was obtained, which will be
used later as a support in the model catalyst Au/TiO2.
3.1.1 Bulk of TiO2 Titanium oxides belong to transition-metal oxides. Their physical and chemical properties are
determined by their electronic structure, e.g., the energy band is an overlap of the 2s, 2p
electrons of oxygen and mainly the 3d electron of the transition metal. There exist several
stable crystal structures for a given cation valency, so-called polymorphs. As for TiO2, the
electronic structure of Ti cation is Ti4+(3d0), the highest filled orbital is 3p, about 35 eV below
the Fermi level. The material is a wide-band gap (3.1 eV) semiconductor, the highest
occupied states are mostly O(2p) derived. The conduction band is mostly Ti(3d) derived [33].
Analogously to many transition-metal oxides, titanium oxide is quite easily reduced. This
makes it even more sensitive to the preparation conditions.
Titanium dioxide crystallizes in three major different structures, rutile, anatase, brookite.
Recently, a new cotunnite TiO2 was synthesized as the hardest oxide known [85]. Brookite
has a rhombohedrical unit cell, with lattice constants of a=5.436 Å, b=9.166 Å, c=5.135 Å.
Both rutile and anatase have the same tetragonal unit cell, but different lattice constants of
a=b=4.584 Å, c=2.953 Å and a=b=3.782 Å, c=9.502 Å, respectively [12]. Among all
structures, only rutile and anatase play an important role in applications.
The rutile structure is the most often studied phase of titania. Its unit cell is shown in
Fig. 3.1. Each Ti atom is surrounded by six O atoms to form a slightly distorted octahedron
with four equatorial bonds (lengths: 1.946 Å) and two apical bonds with about 1.983 Å
distance.
The bulk structure of reduced TiOx crystal is quite complex. Below 1830°C, there exist at
least eight intermediate titanium oxides (TinO2n-1, n=1 to 7) and TiO2 [12], various types of
defects are expected to exist in the bulk, such as O vacancies (F-centers) and Ti interstitial
ions, which manifest themselves as pronounced color changes of the sample, from an initial
pale yellow via light blue to opaque black for an increasing degree of bulk reduction. For
higher degrees of reduction, planar defects called Crystallographic Shear Planes (CSPs) are
formed. Up to date, it is still under debate which type of defect is dominant in which regime
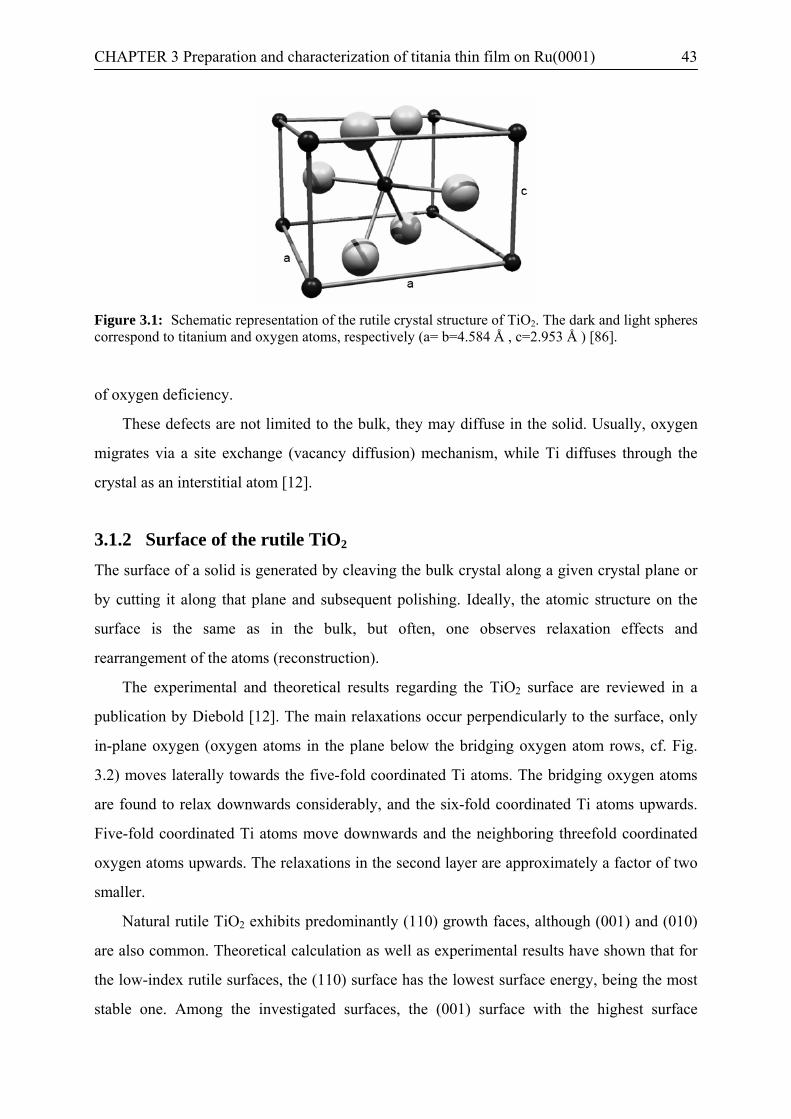
CHAPTER 3 Preparation and characterization of titania thin film on Ru(0001) 43
Figure 3.1: Schematic representation of the rutile crystal structure of TiO2. The dark and light spheres correspond to titanium and oxygen atoms, respectively (a= b=4.584 Å , c=2.953 Å ) [86].
of oxygen deficiency.
These defects are not limited to the bulk, they may diffuse in the solid. Usually, oxygen
migrates via a site exchange (vacancy diffusion) mechanism, while Ti diffuses through the
crystal as an interstitial atom [12].
3.1.2 Surface of the rutile TiO2
The surface of a solid is generated by cleaving the bulk crystal along a given crystal plane or
by cutting it along that plane and subsequent polishing. Ideally, the atomic structure on the
surface is the same as in the bulk, but often, one observes relaxation effects and
rearrangement of the atoms (reconstruction).
The experimental and theoretical results regarding the TiO2 surface are reviewed in a
publication by Diebold [12]. The main relaxations occur perpendicularly to the surface, only
in-plane oxygen (oxygen atoms in the plane below the bridging oxygen atom rows, cf. Fig.
3.2) moves laterally towards the five-fold coordinated Ti atoms. The bridging oxygen atoms
are found to relax downwards considerably, and the six-fold coordinated Ti atoms upwards.
Five-fold coordinated Ti atoms move downwards and the neighboring threefold coordinated
oxygen atoms upwards. The relaxations in the second layer are approximately a factor of two
smaller.
Natural rutile TiO2 exhibits predominantly (110) growth faces, although (001) and (010)
are also common. Theoretical calculation as well as experimental results have shown that for
the low-index rutile surfaces, the (110) surface has the lowest surface energy, being the most
stable one. Among the investigated surfaces, the (001) surface with the highest surface
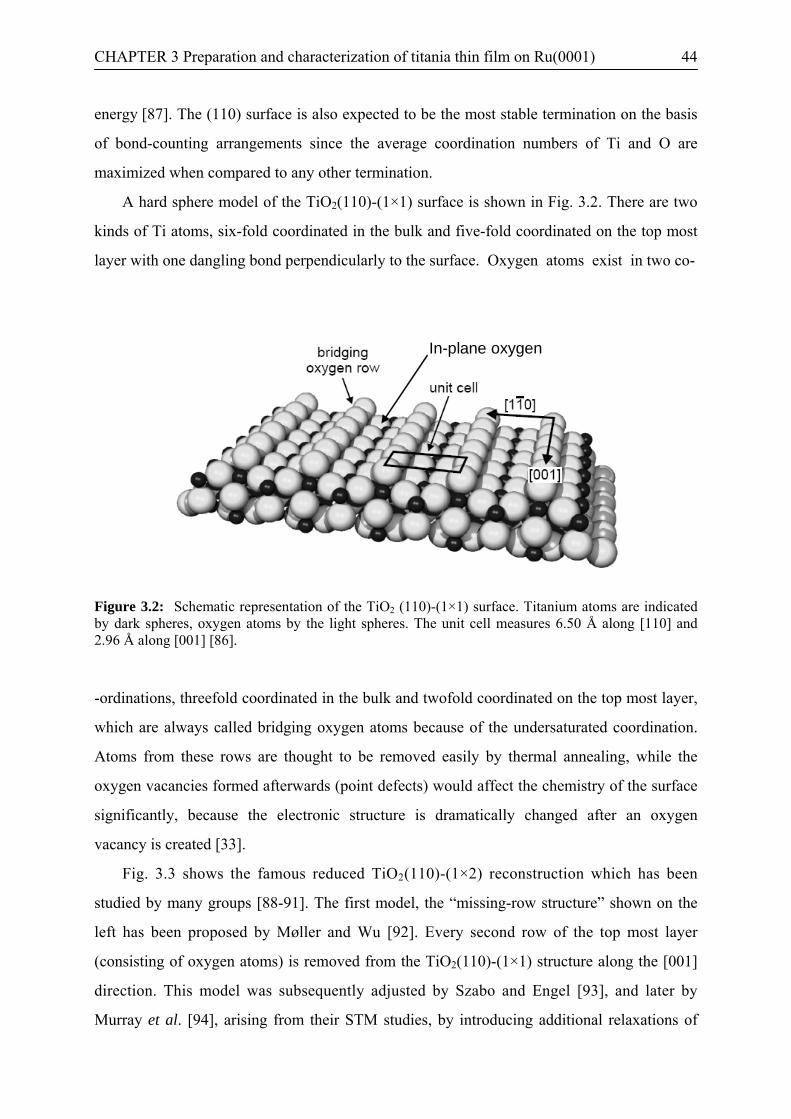
CHAPTER 3 Preparation and characterization of titania thin film on Ru(0001) 44
energy [87]. The (110) surface is also expected to be the most stable termination on the basis
of bond-counting arrangements since the average coordination numbers of Ti and O are
maximized when compared to any other termination.
A hard sphere model of the TiO2(110)-(1×1) surface is shown in Fig. 3.2. There are two
kinds of Ti atoms, six-fold coordinated in the bulk and five-fold coordinated on the top most
layer with one dangling bond perpendicularly to the surface. Oxygen atoms exist in two co-
In-plane oxygenIn-plane oxygen
Figure 3.2: Schematic representation of the TiO2 (110)-(1×1) surface. Titanium atoms are indicated by dark spheres, oxygen atoms by the light spheres. The unit cell measures 6.50 Å along [110] and 2.96 Å along [001] [86].
-ordinations, threefold coordinated in the bulk and twofold coordinated on the top most layer,
which are always called bridging oxygen atoms because of the undersaturated coordination.
Atoms from these rows are thought to be removed easily by thermal annealing, while the
oxygen vacancies formed afterwards (point defects) would affect the chemistry of the surface
significantly, because the electronic structure is dramatically changed after an oxygen
vacancy is created [33].
Fig. 3.3 shows the famous reduced TiO2(110)-(1×2) reconstruction which has been
studied by many groups [88-91]. The first model, the “missing-row structure” shown on the
left has been proposed by Møller and Wu [92]. Every second row of the top most layer
(consisting of oxygen atoms) is removed from the TiO2(110)-(1×1) structure along the [001]
direction. This model was subsequently adjusted by Szabo and Engel [93], and later by
Murray et al. [94], arising from their STM studies, by introducing additional relaxations of
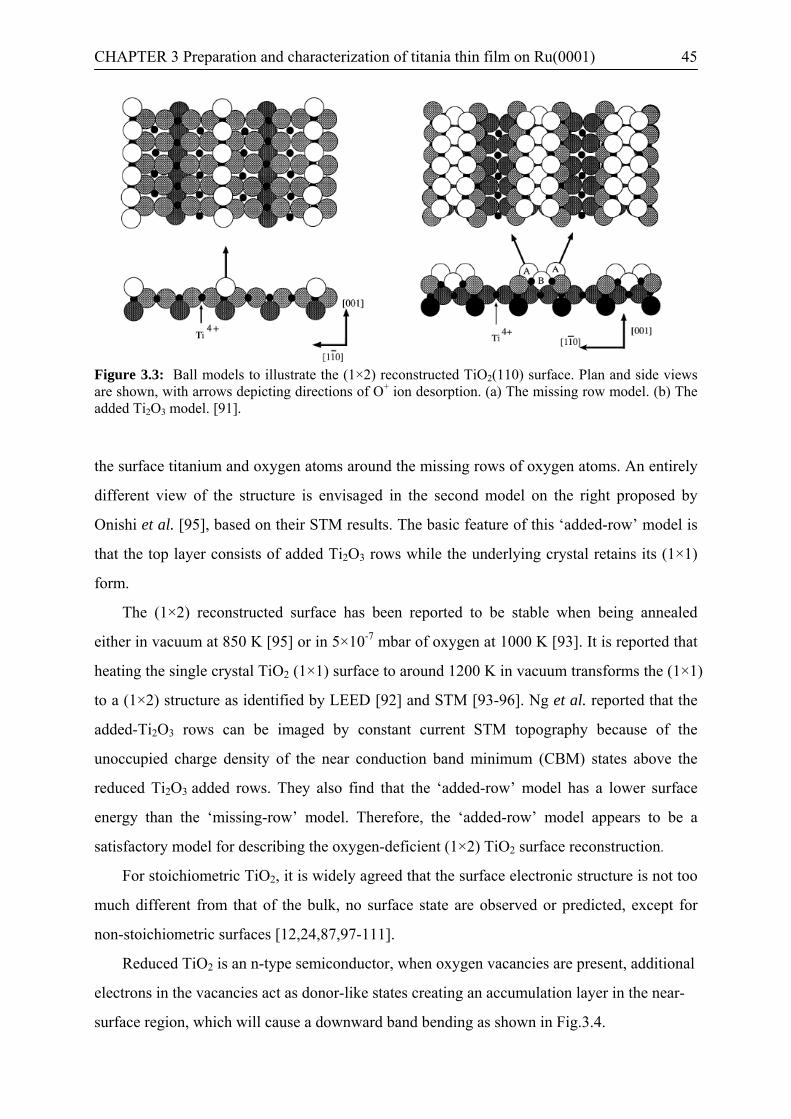
CHAPTER 3 Preparation and characterization of titania thin film on Ru(0001) 45
Figure 3.3: Ball models to illustrate the (1×2) reconstructed TiO2(110) surface. Plan and side views are shown, with arrows depicting directions of O+ ion desorption. (a) The missing row model. (b) The added Ti2O3 model. [91].
the surface titanium and oxygen atoms around the missing rows of oxygen atoms. An entirely
different view of the structure is envisaged in the second model on the right proposed by
Onishi et al. [95], based on their STM results. The basic feature of this ‘added-row’ model is
that the top layer consists of added Ti2O3 rows while the underlying crystal retains its (1×1)
form.
The (1×2) reconstructed surface has been reported to be stable when being annealed
either in vacuum at 850 K [95] or in 5×10⁻⁷ mbar of oxygen at 1000 K [93]. It is reported that
heating the single crystal TiO2 (1×1) surface to around 1200 K in vacuum transforms the (1×1)
to a (1×2) structure as identified by LEED [92] and STM [93-96]. Ng et al. reported that the
added-Ti2O3 rows can be imaged by constant current STM topography because of the
unoccupied charge density of the near conduction band minimum (CBM) states above the
reduced Ti2O3 added rows. They also find that the ‘added-row’ model has a lower surface
energy than the ‘missing-row’ model. Therefore, the ‘added-row’ model appears to be a
satisfactory model for describing the oxygen-deficient (1×2) TiO2 surface reconstruction.
For stoichiometric TiO2, it is widely agreed that the surface electronic structure is not too
much different from that of the bulk, no surface state are observed or predicted, except for
non-stoichiometric surfaces [12,24,87,97-111].
Reduced TiO2 is an n-type semiconductor, when oxygen vacancies are present, additional
electrons in the vacancies act as donor-like states creating an accumulation layer in the near-
surface region, which will cause a downward band bending as shown in Fig.3.4.

CHAPTER 3 Preparation and characterization of titania thin film on Ru(0001) 46
Figure 3.4: Schematic diagram of band-bending effect due to donor-like surface defect states [12].
3.1.3 Growth of oxide thin films Studies of ultra-thin metal oxide films growth on metal have recently received
considerable attention due to their important applications both in heterogeneous catalysis and
microelectronics [112]. Oxide films can be prepared mainly by two ways, i) oxidize a metal
single crystal. This often results in disordered layers due to large lattice mismatch between the
metal and its oxide. In addition, the stoichiometry can be difficult to control [113]. ii)
deposition of an oxide film on a substrate [112]. It consist of two ways further:
a) by depositing the metal of interest onto a substrate and oxidizing it layer-by-layer [114].
The disadvantage is it takes too long time if a thick film is needed.
b) oxide films on top of a substrate may be produced in a single deposition sequence.
This method is more straightforward and faster when depositing thick oxide films. The oxide
films can be deposited by thermal evaporation deposition, molecular-beam epitaxy (MBE),
pulsed laser deposition (PLD), chemical vapor deposition (CVD), chemical solution
deposition or spray pyrolysis. Here, it is not intended to describe every techniques in detail,
but only the introduction on thermal evaporation (the method used in this work) and MBE are
given. In thermal evaporation, oxide films are usually deposited on an refractory single crystal
metal substrate in an O2 atmosphere and followed by annealing steps. The disadvantage is the
film stoichiometry may be different than that found in the bulk oxide depending on the
content of O2 [23,25,27]. In order to obtain the desired stoichiometry precisely, MBE method
is best suited since it is generally thought to offer the best controlled film growth [112].
The main topics to be considered for oxide thin film growth are the following: (1) the
lattice mismatch between the deposited film and the substrate, (2) the kinetics of film growth
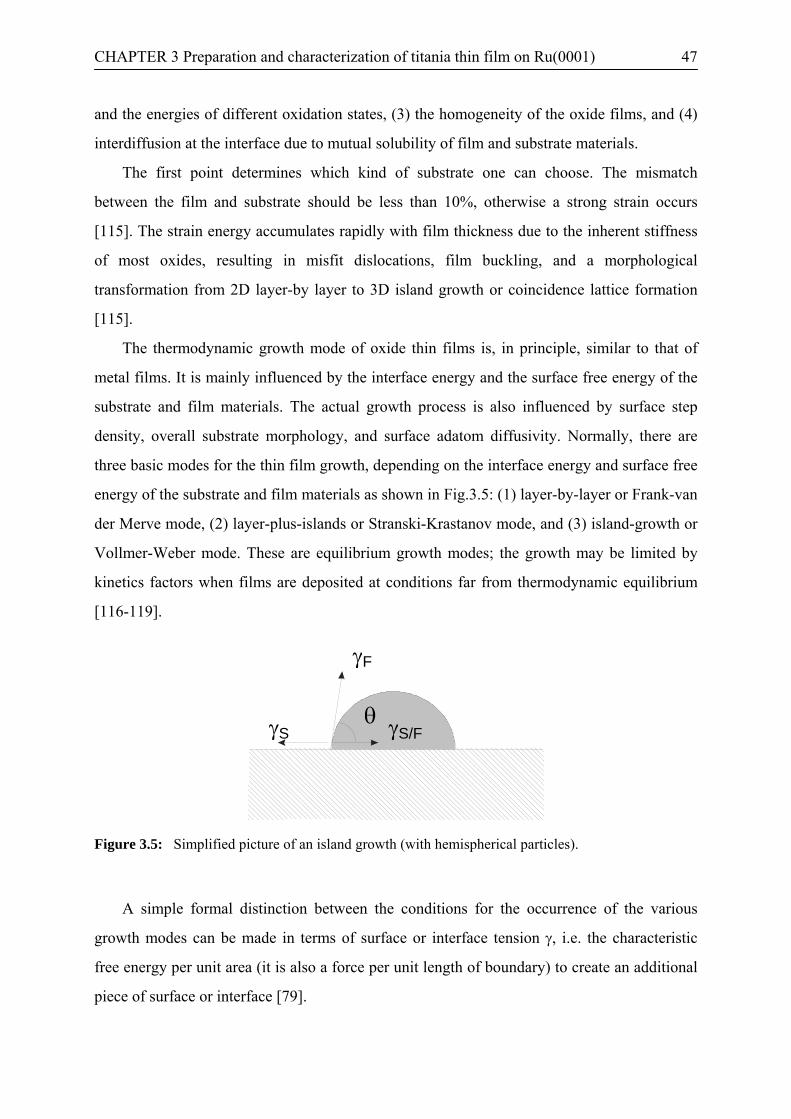
CHAPTER 3 Preparation and characterization of titania thin film on Ru(0001) 47
and the energies of different oxidation states, (3) the homogeneity of the oxide films, and (4)
interdiffusion at the interface due to mutual solubility of film and substrate materials.
The first point determines which kind of substrate one can choose. The mismatch
between the film and substrate should be less than 10%, otherwise a strong strain occurs
[115]. The strain energy accumulates rapidly with film thickness due to the inherent stiffness
of most oxides, resulting in misfit dislocations, film buckling, and a morphological
transformation from 2D layer-by layer to 3D island growth or coincidence lattice formation
[115].
The thermodynamic growth mode of oxide thin films is, in principle, similar to that of
metal films. It is mainly influenced by the interface energy and the surface free energy of the
substrate and film materials. The actual growth process is also influenced by surface step
density, overall substrate morphology, and surface adatom diffusivity. Normally, there are
three basic modes for the thin film growth, depending on the interface energy and surface free
energy of the substrate and film materials as shown in Fig.3.5: (1) layer-by-layer or Frank-van
der Merve mode, (2) layer-plus-islands or Stranski-Krastanov mode, and (3) island-growth or
Vollmer-Weber mode. These are equilibrium growth modes; the growth may be limited by
kinetics factors when films are deposited at conditions far from thermodynamic equilibrium
[116-119].
Figure 3.5: Simplified picture of an island growth (with hemispherical particles).
A simple formal distinction between the conditions for the occurrence of the various
growth modes can be made in terms of surface or interface tension γ, i.e. the characteristic
free energy per unit area (it is also a force per unit length of boundary) to create an additional
piece of surface or interface [79].
γF
θγS γS/F

CHAPTER 3 Preparation and characterization of titania thin film on Ru(0001) 48
FS /γ - substrate/film interface tension
Sγ - substrate surface tension
Fγ - film surface tension
θ - contact angle
when FSFS /cos γθγγ +≥ , layer growth is promoted; when FSFS /cos γθγγ +< , island
growth. The mixed Stranski-Krastanov growth mode is an intermediate case, the transition
from layer to island growth occurs when the spatial extent of the elastic strain field exceeds
the range of the adhesion forces within the deposited material [79].
The second point is the most important and also a difficult point compared with growing
of pure metal films. The crystallinity of oxide thin film is significantly affected by the kinetics
of atomic arrangements during deposition and reaction with O2, since thin films are often
deposited at temperatures Ts (substrate temperature) which are less than the melting point Tm
of deposit materials (20%–30% below). Thus, film synthesis generally takes place far from
thermodynamic equilibrium, crystal growth is a non-equilibrium kinetic process [116]. As a
consequence, for metals, which have a few oxidation states, the ultimate phase grown in
oxygen is controlled by kinetic and thermodynamic criteria. The state obtained is not
necessarily the most stable, but kinetically determined. Some parts of the overall process may
be kinetically limited, others may be ‘in local’ thermodynamic equilibrium. In this case,
equilibrium arguments may be applied locally even though the whole growth process is a non-
equilibrium process.
In general, bulk single crystals can be grown according to their phase diagrams given in
handbooks. Unfortunately, the structure of the resulting thin film does not necessarily fit to
the phase of the bulk, because growth occurs in a non-equilibrium state. The phase diagram of
TiO2 is also very complicated due to their particular electronic structure, transition metal
oxides such as TiOx and VOx have the highest amount of non-stoichiometric states. Generally,
the processing parameters such as the temperature, oxygen ambient pressure and deposition
conditions play an important role for the oxide thin film growth. The temperature is the most
important factor to be considered as it influences both the diffusion and oxidation of the metal
atoms or islands of the coating material.
The surface diffusion can be described by Fick first law:

CHAPTER 3 Preparation and characterization of titania thin film on Ru(0001) 49
dxdCDJ −= (3.1)
where:
J- diffusion flux
D- diffusion efficient
dC/dx- the concentration gradient
(3.2) kTEeDD /
0−=
where:
D0- temperature independent frequency factor
E- activation energy
Equation (3.2) implies that the diffusion efficient D changes exponentially with temperature,
and lower deposition temperature leads to lower immobility of adatoms. The oxidation of
metals is also widely accepted to be a thermal activated process, thus a higher deposition
temperature improves the film growth and oxidation state. However, the oxidation of metals
is a reversible reaction, and at higher temperature, the oxygen can dissociate from the metal
atoms. For the specific system investigated here, TiO2/Ru(0001), the deposited Ti atoms can
also diffuse into the Ru substrate and form surface alloys.
The oxygen ambient pressure also influences the oxidation state of the film. If it is too
low, the oxidation of metal is limited; if it is too high, the diffusion of metal atoms may be
slowed down [120] or the deposited material will be surrounded by an amorphous oxide layer
[121]. In the latter case, growth of an ordered film maybe inhibited, leading to disordered
films, or 3D islands.
The deposition rate should be suitable also; the surface does not maintain the bulk
stoichiometry upon termination of the growth, if the growth rate of a film is faster than the
kinetics of dissociative O2 and metal oxidation.
In practice, as deposited films are often not well-ordered or well-oxidized because
perfect matching of the parameters such as deposition rate, temperature, O2 pressure was not
achieved. In that case, post-deposition annealing steps are necessary to improve the quality of
the film significantly. Annealing at higher temperature can lead further recrystallization of the
poorly ordered films, and remove stress in the film. One can expect the increase of crystallite
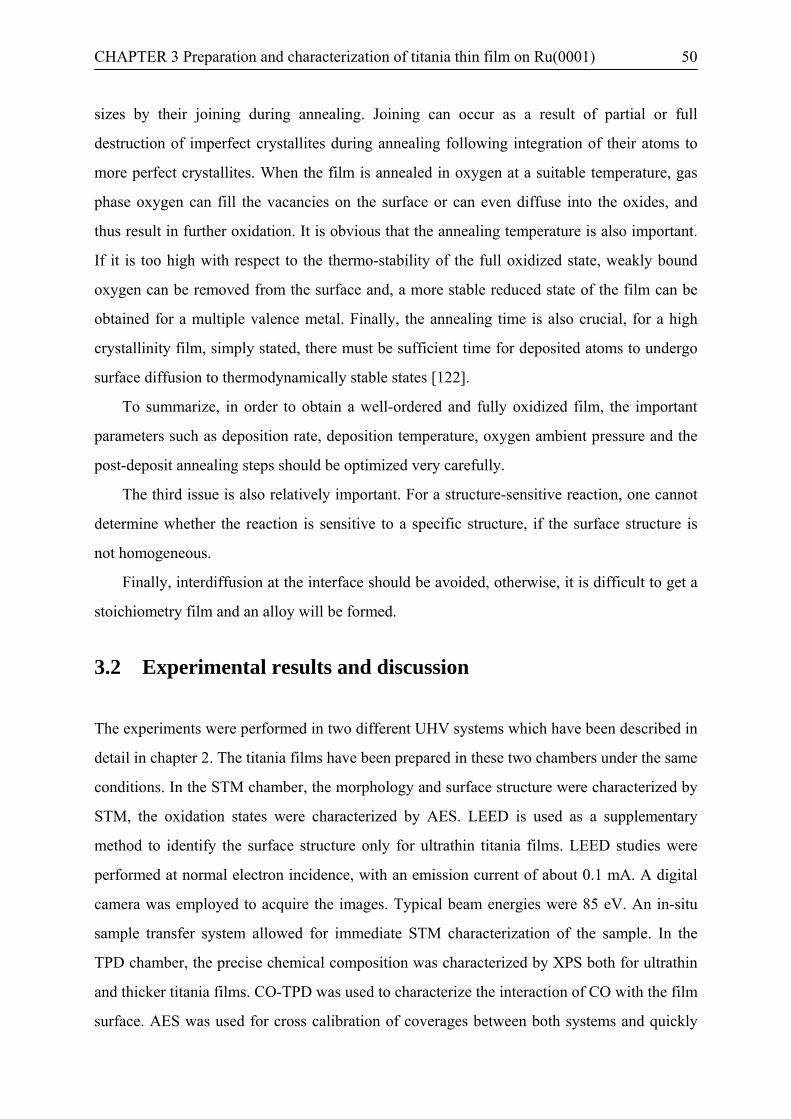
CHAPTER 3 Preparation and characterization of titania thin film on Ru(0001) 50
sizes by their joining during annealing. Joining can occur as a result of partial or full
destruction of imperfect crystallites during annealing following integration of their atoms to
more perfect crystallites. When the film is annealed in oxygen at a suitable temperature, gas
phase oxygen can fill the vacancies on the surface or can even diffuse into the oxides, and
thus result in further oxidation. It is obvious that the annealing temperature is also important.
If it is too high with respect to the thermo-stability of the full oxidized state, weakly bound
oxygen can be removed from the surface and, a more stable reduced state of the film can be
obtained for a multiple valence metal. Finally, the annealing time is also crucial, for a high
crystallinity film, simply stated, there must be sufficient time for deposited atoms to undergo
surface diffusion to thermodynamically stable states [122].
To summarize, in order to obtain a well-ordered and fully oxidized film, the important
parameters such as deposition rate, deposition temperature, oxygen ambient pressure and the
post-deposit annealing steps should be optimized very carefully.
The third issue is also relatively important. For a structure-sensitive reaction, one cannot
determine whether the reaction is sensitive to a specific structure, if the surface structure is
not homogeneous.
Finally, interdiffusion at the interface should be avoided, otherwise, it is difficult to get a
stoichiometry film and an alloy will be formed.
3.2 Experimental results and discussion
The experiments were performed in two different UHV systems which have been described in
detail in chapter 2. The titania films have been prepared in these two chambers under the same
conditions. In the STM chamber, the morphology and surface structure were characterized by
STM, the oxidation states were characterized by AES. LEED is used as a supplementary
method to identify the surface structure only for ultrathin titania films. LEED studies were
performed at normal electron incidence, with an emission current of about 0.1 mA. A digital
camera was employed to acquire the images. Typical beam energies were 85 eV. An in-situ
sample transfer system allowed for immediate STM characterization of the sample. In the
TPD chamber, the precise chemical composition was characterized by XPS both for ultrathin
and thicker titania films. CO-TPD was used to characterize the interaction of CO with the film
surface. AES was used for cross calibration of coverages between both systems and quickly

CHAPTER 3 Preparation and characterization of titania thin film on Ru(0001) 51
checking whether the Ru(0001) substrate is completely covered by the titania film.
Temperature cross calibration has been described in detail in chapter 2.
The Ru(0001) surface was prepared by 60 minutes Ar ion sputtering (1.2 keV, 10 µA),
and then repeatedly exposed to 0.1 L O2 at 300 K and annealed to 1560 K to remove traces of
surface carbon. Finally, the sample was flashed to 1560 K for several times, until the
contaminants were completely removed (the contamination level was below the AES
detection limit of about 0.01 ML). The resulting Ru(0001) surface is characterized by wide
terraces of typically >30 nm width, separated by monolayer steps, as shown in Fig. 3.6(a).
The lateral and vertical scale of STM measurement are calibrated on clean Ru with atomic
resolution.
a bb
Figure 3.6: (a) STM image of Ru(0001), 1000 Å×1000 Å, UT= 1.80 V, IT = 178 pA. The bright big spots are the implanted Ar atoms when sputtering the Ru surface with Ar+. Inset: 9 Å×9 Å, UT= 0.60 V, IT= 45 nA. Lattice constant: 2.7 Å, (b) STM image of (2×1) oxygen superstructure with 0.5 ML on Ru, 50 Å×50 Å, UT= 0.90 V, IT= 1.778 nA, unit cell: 5.4 Å×2.7 Å.
Following the discussion in section 3.1.3 and the recipes for TiOx films growth developed
by other groups [25,123], TiOx films were prepared by thermal evaporation of Ti from an
electron-beam evaporator (Omicron EFM3) with a flux of 0.5 ML/min in O2 atmosphere
( mbar O7101 −× 2), while the Ru substrate was kept at 640 K. Under these conditions, the
Ru(0001) surface is rapidly covered with a ( 12× ) oxygen superstructure with 0.5 ML Oad
instead of being oxidized, as shown in Fig. 3.6(b). The unit cell of the superstructure is
(5.6 Å×2.7 Å). After deposition, the ultrathin TiOx was cooled down in vacuum (20 minutes)
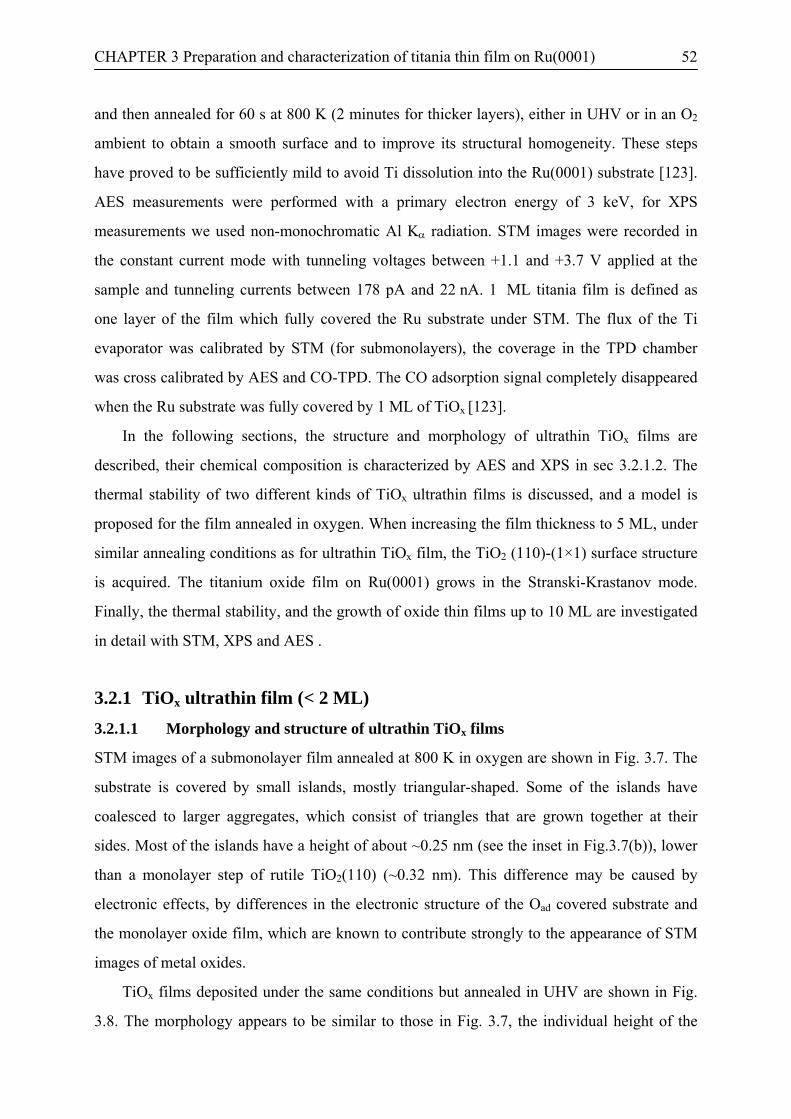
CHAPTER 3 Preparation and characterization of titania thin film on Ru(0001) 52
and then annealed for 60 s at 800 K (2 minutes for thicker layers), either in UHV or in an O2
ambient to obtain a smooth surface and to improve its structural homogeneity. These steps
have proved to be sufficiently mild to avoid Ti dissolution into the Ru(0001) substrate [123].
AES measurements were performed with a primary electron energy of 3 keV, for XPS
measurements we used non-monochromatic Al Kα radiation. STM images were recorded in
the constant current mode with tunneling voltages between +1.1 and +3.7 V applied at the
sample and tunneling currents between 178 pA and 22 nA. 1 ML titania film is defined as
one layer of the film which fully covered the Ru substrate under STM. The flux of the Ti
evaporator was calibrated by STM (for submonolayers), the coverage in the TPD chamber
was cross calibrated by AES and CO-TPD. The CO adsorption signal completely disappeared
when the Ru substrate was fully covered by 1 ML of TiOx [123].
In the following sections, the structure and morphology of ultrathin TiOx films are
described, their chemical composition is characterized by AES and XPS in sec 3.2.1.2. The
thermal stability of two different kinds of TiOx ultrathin films is discussed, and a model is
proposed for the film annealed in oxygen. When increasing the film thickness to 5 ML, under
similar annealing conditions as for ultrathin TiOx film, the TiO2 (110)-(1×1) surface structure
is acquired. The titanium oxide film on Ru(0001) grows in the Stranski-Krastanov mode.
Finally, the thermal stability, and the growth of oxide thin films up to 10 ML are investigated
in detail with STM, XPS and AES .
3.2.1 TiOx ultrathin film (< 2 ML)
3.2.1.1 Morphology and structure of ultrathin TiOx films
STM images of a submonolayer film annealed at 800 K in oxygen are shown in Fig. 3.7. The
substrate is covered by small islands, mostly triangular-shaped. Some of the islands have
coalesced to larger aggregates, which consist of triangles that are grown together at their
sides. Most of the islands have a height of about ~0.25 nm (see the inset in Fig.3.7(b)), lower
than a monolayer step of rutile TiO2(110) (~0.32 nm). This difference may be caused by
electronic effects, by differences in the electronic structure of the Oad covered substrate and
the monolayer oxide film, which are known to contribute strongly to the appearance of STM
images of metal oxides.
TiOx films deposited under the same conditions but annealed in UHV are shown in Fig.
3.8. The morphology appears to be similar to those in Fig. 3.7, the individual height of the
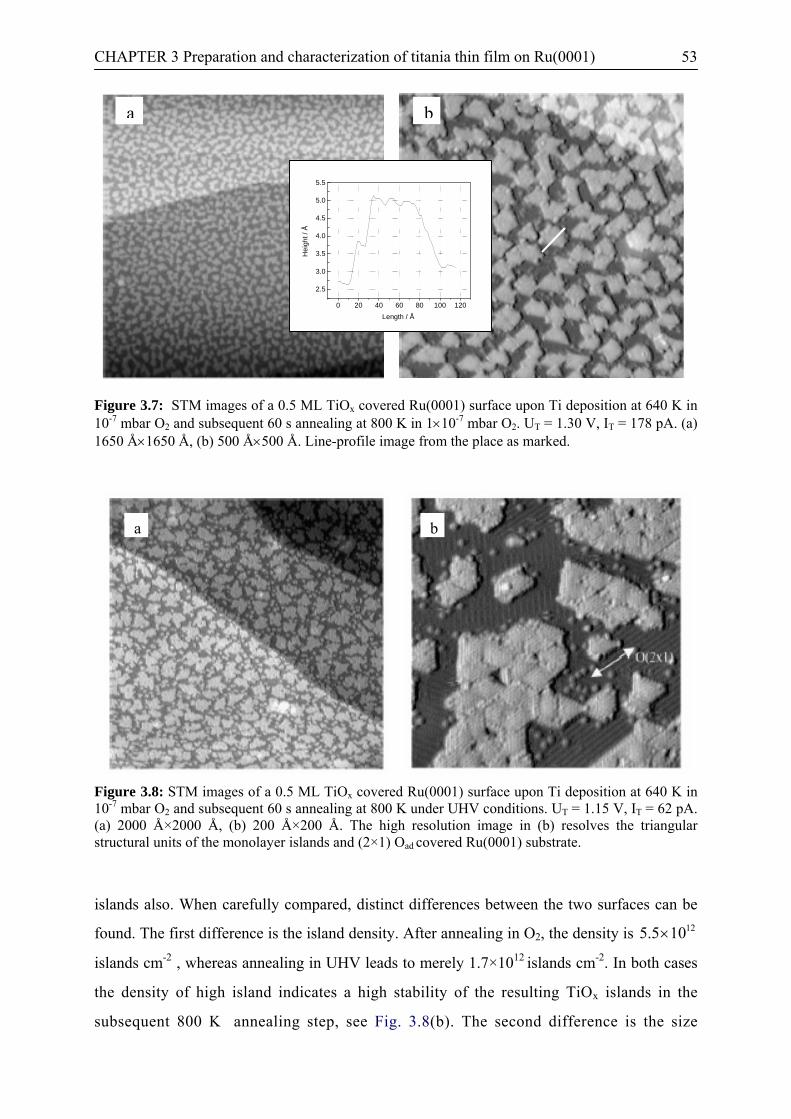
CHAPTER 3 Preparation and characterization of titania thin film on Ru(0001) 53
a b
0 20 40 60 80 100 120
2.5
3.0
3.5
4.0
4.5
5.0
5.5
Hei
ght /
Å
Length / Å
a b
0 20 40 60 80 100 120
2.5
3.0
3.5
4.0
4.5
5.0
5.5
Hei
ght /
Å
Length / Å
Figure 3.7: STM images of a 0.5 ML TiOx covered Ru(0001) surface upon Ti deposition at 640 K in 10-7 mbar O2 and subsequent 60 s annealing at 800 K in 1×10⁻⁷ mbar O2. UT = 1.30 V, IT = 178 pA. (a) 1650 Å×1650 Å, (b) 500 Å×500 Å. Line-profile image from the place as marked.
aa
aa bbbb
Figure 3.8: STM images of a 0.5 ML TiOx covered Ru(0001) surface upon Ti deposition at 640 K in 10-7 mbar O2 and subsequent 60 s annealing at 800 K under UHV conditions. UT = 1.15 V, IT = 62 pA. (a) 2000 Å×2000 Å, (b) 200 Å×200 Å. The high resolution image in (b) resolves the triangular structural units of the monolayer islands and (2×1) Oad covered Ru(0001) substrate.
islands also. When carefully compared, distinct differences between the two surfaces can be
found. The first difference is the island density. After annealing in O2, the density is
islands cm
12105.5 ×-2 , whereas annealing in UHV leads to merely 1.7×10¹² islands cm-2. In both cases
the density of high island indicates a high stability of the resulting TiOx islands in the
subsequent 800 K annealing step, see Fig. 3.8(b). The second difference is the size
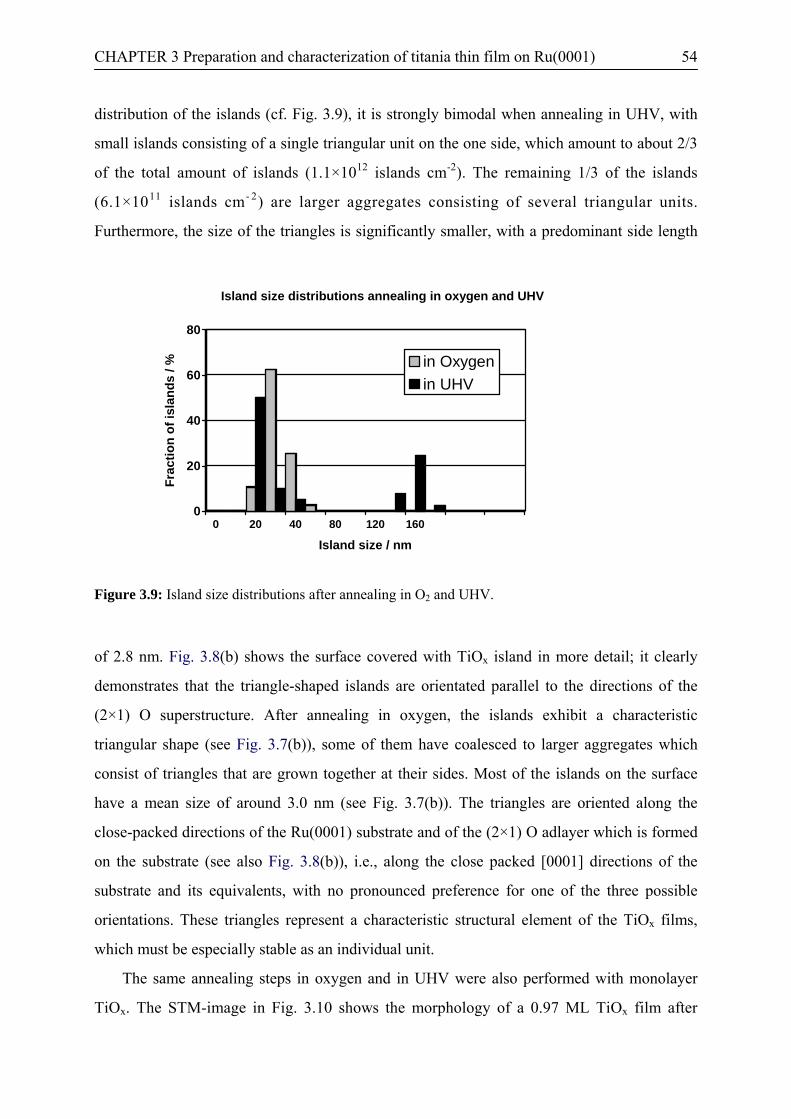
CHAPTER 3 Preparation and characterization of titania thin film on Ru(0001) 54
distribution of the islands (cf. Fig. 3.9), it is strongly bimodal when annealing in UHV, with
small islands consisting of a single triangular unit on the one side, which amount to about 2/3
of the total amount of islands (1.1×10¹² islands cm-2). The remaining 1/3 of the islands
(6.1×10¹¹ islands cm- 2) are larger aggregates consisting of several triangular units.
Furthermore, the size of the triangles is significantly smaller, with a predominant side length
0
20
40
60
80
Frac
tion
of is
land
s / %
0 20 40 80 120 160
Island size / nm
Island size distributions annealing in oxygen and UHV
in Oxygenin UHV
Figure 3.9: Island size distributions after annealing in O2 and UHV.
of 2.8 nm. Fig. 3.8(b) shows the surface covered with TiOx island in more detail; it clearly
demonstrates that the triangle-shaped islands are orientated parallel to the directions of the
(2×1) O superstructure. After annealing in oxygen, the islands exhibit a characteristic
triangular shape (see Fig. 3.7(b)), some of them have coalesced to larger aggregates which
consist of triangles that are grown together at their sides. Most of the islands on the surface
have a mean size of around 3.0 nm (see Fig. 3.7(b)). The triangles are oriented along the
close-packed directions of the Ru(0001) substrate and of the (2×1) O adlayer which is formed
on the substrate (see also Fig. 3.8(b)), i.e., along the close packed [0001] directions of the
substrate and its equivalents, with no pronounced preference for one of the three possible
orientations. These triangles represent a characteristic structural element of the TiOx films,
which must be especially stable as an individual unit.
The same annealing steps in oxygen and in UHV were also performed with monolayer
TiOx. The STM-image in Fig. 3.10 shows the morphology of a 0.97 ML TiOx film after
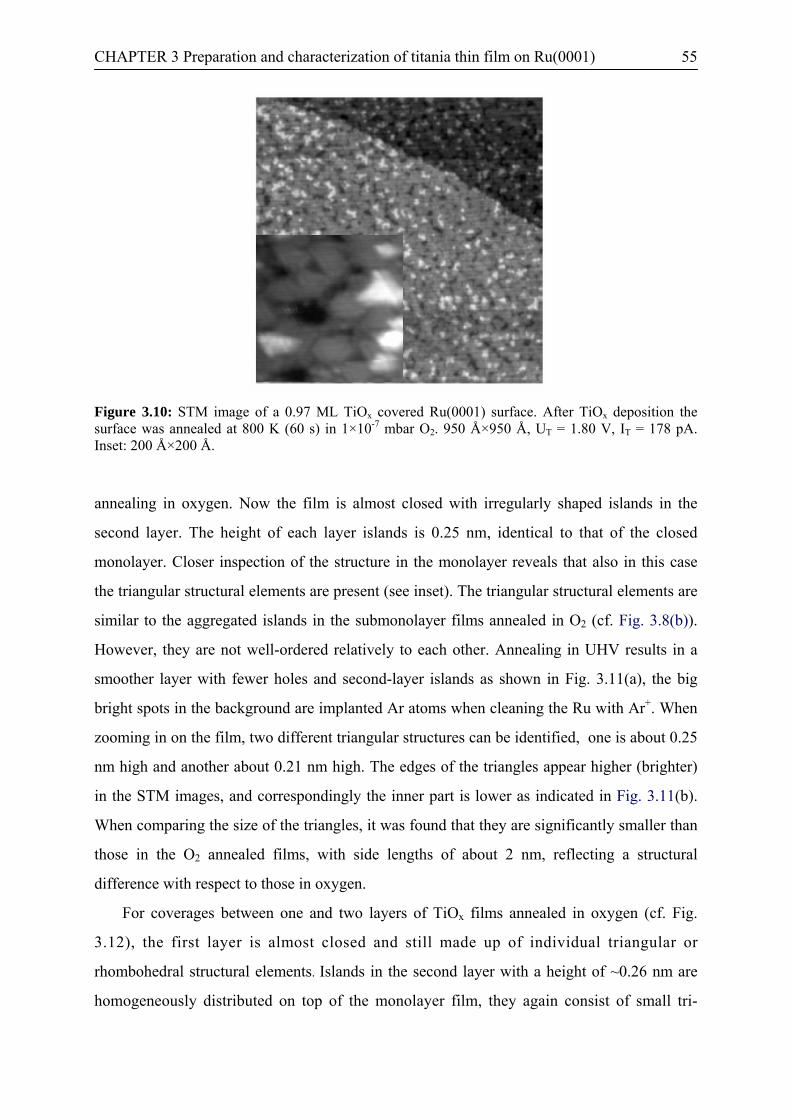
CHAPTER 3 Preparation and characterization of titania thin film on Ru(0001) 55
Figure 3.10: STM image of a 0.97 ML TiOx covered Ru(0001) surface. After TiOx deposition the surface was annealed at 800 K (60 s) in 1×10⁻⁷ mbar O2. 950 Å×950 Å, UT = 1.80 V, IT = 178 pA. Inset: 200 Å×200 Å.
annealing in oxygen. Now the film is almost closed with irregularly shaped islands in the
second layer. The height of each layer islands is 0.25 nm, identical to that of the closed
monolayer. Closer inspection of the structure in the monolayer reveals that also in this case
the triangular structural elements are present (see inset). The triangular structural elements are
similar to the aggregated islands in the submonolayer films annealed in O2 (cf. Fig. 3.8(b)).
However, they are not well-ordered relatively to each other. Annealing in UHV results in a
smoother layer with fewer holes and second-layer islands as shown in Fig. 3.11(a), the big
bright spots in the background are implanted Ar atoms when cleaning the Ru with Ar+. When
zooming in on the film, two different triangular structures can be identified, one is about 0.25
nm high and another about 0.21 nm high. The edges of the triangles appear higher (brighter)
in the STM images, and correspondingly the inner part is lower as indicated in Fig. 3.11(b).
When comparing the size of the triangles, it was found that they are significantly smaller than
those in the O2 annealed films, with side lengths of about 2 nm, reflecting a structural
difference with respect to those in oxygen.
For coverages between one and two layers of TiOx films annealed in oxygen (cf. Fig.
3.12), the first layer is almost closed and still made up of individual triangular or
rhombohedral structural elements. Islands in the second layer with a height of ~0.26 nm are
homogeneously distributed on top of the monolayer film, they again consist of small tri-
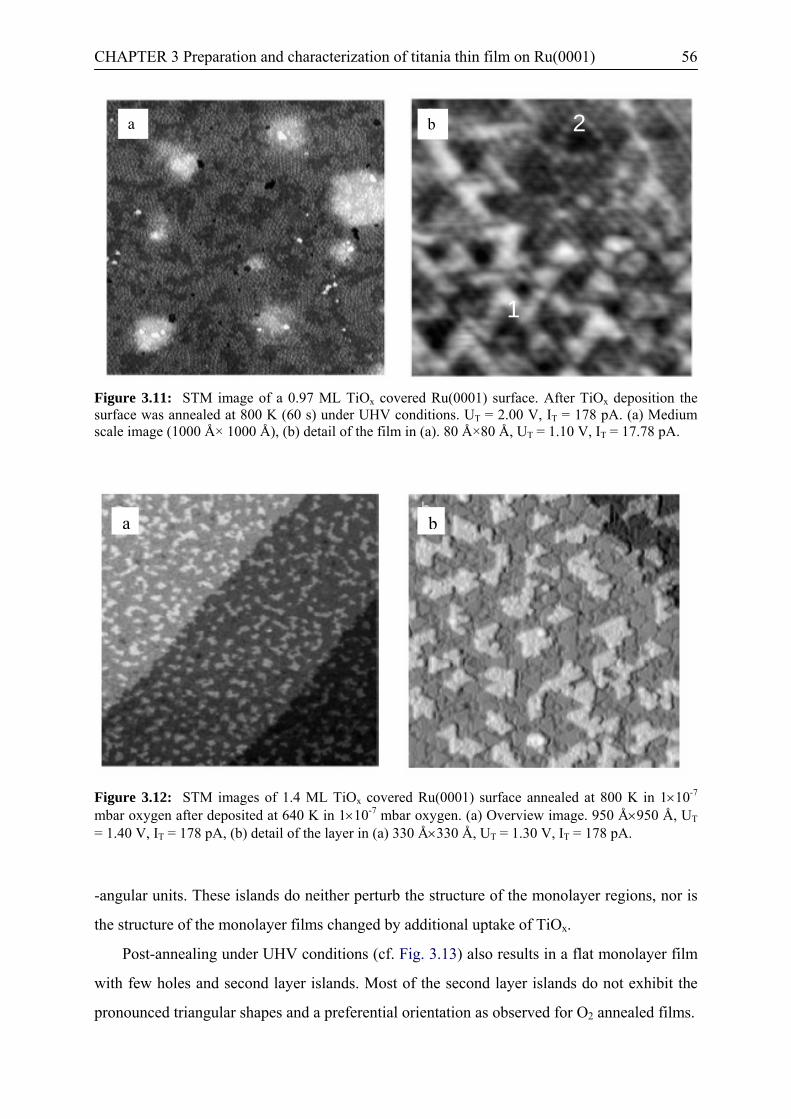
CHAPTER 3 Preparation and characterization of titania thin film on Ru(0001) 56
aa
bb
1
2
Figure 3.11: STM image of a 0.97 ML TiOx covered Ru(0001) surface. After TiOx deposition the surface was annealed at 800 K (60 s) under UHV conditions. UT = 2.00 V, IT = 178 pA. (a) Medium scale image (1000 Å× 1000 Å), (b) detail of the film in (a). 80 Å×80 Å, UT = 1.10 V, IT = 17.78 pA.
a
b
Figure 3.12: STM images of 1.4 ML TiOx covered Ru(0001) surface annealed at 800 K in 1×10⁻⁷ mbar oxygen after deposited at 640 K in 1×10⁻⁷ mbar oxygen. (a) Overview image. 950 Å×950 Å, UT = 1.40 V, IT = 178 pA, (b) detail of the layer in (a) 330 Å×330 Å, UT = 1.30 V, IT = 178 pA.
-angular units. These islands do neither perturb the structure of the monolayer regions, nor is
the structure of the monolayer films changed by additional uptake of TiOx.
Post-annealing under UHV conditions (cf. Fig. 3.13) also results in a flat monolayer film
with few holes and second layer islands. Most of the second layer islands do not exhibit the
pronounced triangular shapes and a preferential orientation as observed for O2 annealed films.

CHAPTER 3 Preparation and characterization of titania thin film on Ru(0001) 57
Figure 3.13: STM image of a 1.4 ML TiOx film covered Ru(0001) surface deposited at 640 K in 1×10⁻⁷ mbar oxygen and annealed for 60 s at 800 K under UHV. 720 Å×720 Å, UT = 2.90 V, IT = 178 pA.
Moreover, the distribution of islands on the surface is less homogeneous. In total, UHV
annealing results in less ordered films than O2 annealing.
3.2.1.2 Chemical composition of the TiOx films
In the studies above, the morphology and structure of the ultrathin TiOx films has been
discussed with respect to post-annealing conditions. In this section, the focus will be laid on
the chemical composition of these films, since the oxidation state of the ultrathin films may
play an important role in film growth and in catalysis studies as mentioned in section 3.1.
The chemical composition of the titanium oxide can be determined from the ratio of the
O(1s) peak intensities to the Ti (2p) peak intensities and from the relative intensities of the Ti
related peaks in AES and XP spectra. For ultrathin films with a thickness between 0.5 and
2 ML and annealing at 800 K in oxygen (open circles) or under UHV, AES measurements
show a ratio of OKLL/TiLMM between 1.1 and 1.2 and a ratio of TiLMV/TiLMM around 0.85 for
both preparation methods (cf. Fig. 3.14). In general, the OKLL/TiLMM ratios decrease as the
oxidation state of the oxides is reduced. For example, a value of 1.7 for TiO2 films in Ref.
[25] is identical to 10 ML TiO2(110)-(1×1) films on Ru(0001) prepared later (see Section
3.2.2). For reduced TiO2 (100)-(1×3) and the TiO2(100)-(1×5) single crystal surfaces, the
OKLL/TiLMM ratios are 1.7 and 1.5, respectively [124]. For a TiO2(110) single crystal surface
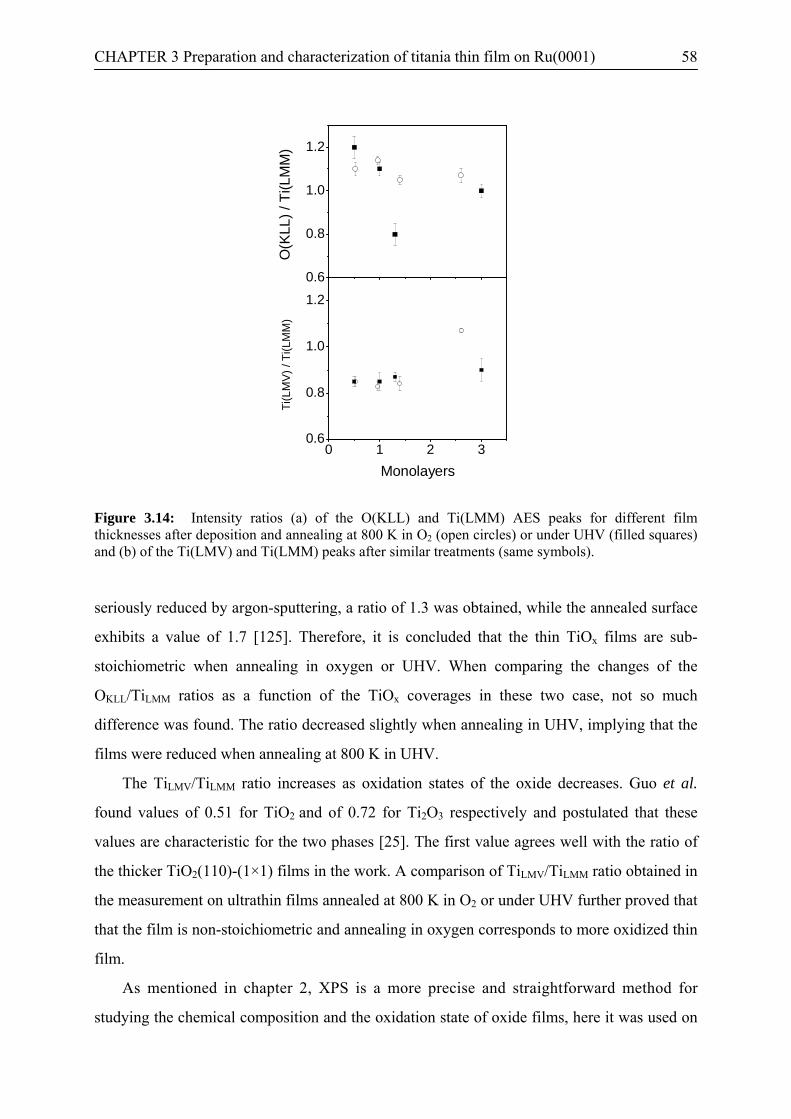
CHAPTER 3 Preparation and characterization of titania thin film on Ru(0001) 58
0.6
0.8
1.0
1.2
0 1 2 30.6
0.8
1.0
1.2
O(K
LL) /
Ti(L
MM
)
Ti(L
MV
) / T
i(LM
M)
Monolayers
Figure 3.14: Intensity ratios (a) of the O(KLL) and Ti(LMM) AES peaks for different film thicknesses after deposition and annealing at 800 K in O2 (open circles) or under UHV (filled squares) and (b) of the Ti(LMV) and Ti(LMM) peaks after similar treatments (same symbols).
seriously reduced by argon-sputtering, a ratio of 1.3 was obtained, while the annealed surface
exhibits a value of 1.7 [125]. Therefore, it is concluded that the thin TiOx films are sub-
stoichiometric when annealing in oxygen or UHV. When comparing the changes of the
OKLL/TiLMM ratios as a function of the TiOx coverages in these two case, not so much
difference was found. The ratio decreased slightly when annealing in UHV, implying that the
films were reduced when annealing at 800 K in UHV.
The TiLMV/TiLMM ratio increases as oxidation states of the oxide decreases. Guo et al.
found values of 0.51 for TiO2 and of 0.72 for Ti2O3 respectively and postulated that these
values are characteristic for the two phases [25]. The first value agrees well with the ratio of
the thicker TiO2(110)-(1×1) films in the work. A comparison of TiLMV/TiLMM ratio obtained in
the measurement on ultrathin films annealed at 800 K in O2 or under UHV further proved that
that the film is non-stoichiometric and annealing in oxygen corresponds to more oxidized thin
film.
As mentioned in chapter 2, XPS is a more precise and straightforward method for
studying the chemical composition and the oxidation state of oxide films, here it was used on

CHAPTER 3 Preparation and characterization of titania thin film on Ru(0001) 59
the monolayer film post-annealed at 800 K in O2. The resulting spectra of the Ti(2p) and the
O(1s) regions are displayed in Fig. 3.15. Since the Ti(2p) signals (Fig. 3.15(a)) overlap with
the Ru(3p3/2) peak at 462.0eV, the latter was subtracted using the signal of the clean Ru(0001)
surface for comparison. The remaining signal can be fitted with two Ti(2p) doublets. The
binding energies of the Ti(2p3/2) signals are 459.2 eV and 457.5 eV, with a spin-orbit-splitting
of 5.7 eV and 5.6 eV, respectively. These Ti peaks can be assigned to Ti4+ and Ti3+ species,
respectively [126]. From the ratio of the intensities, Ti4+(2p):Ti3+ (2p) = 2.46:1, it is
concluded that Ti3+ species are not restricted to individual defects in the film, but are
characteristic for this film, in agreement with the conclusion from XPS, that the TiOx films
are substoichiometric. When comparing the O(1s) signal of the monolayer film (Fig. 3.15(b))
455 460 465 470
Ru3p3/2
Ti4+2p1/2
Ti3+2p1/2
Ti4+2p3/2
Binding energy / eV
Inte
nsity
/ a.
u.
Ti3+2p3/2
a
455 460 465 470
Ru3p3/2
Ti4+2p1/2
Ti3+2p1/2
Ti4+2p3/2
Binding energy / eV
Inte
nsity
/ a.
u.
Ti3+2p3/2
a
525 530 535
Inte
nsity
/ a.
u.
Binding energy / eV
O1sb
Figure 3.15: XP spectra of a monolayer TiOx film covered Ru(0001) surface upon 60 s annealing at 800 K in 1x10⁻⁷ mbar O2. (a) Ti(2p) region and (b) O(1s).
to that of thick, well-oxidized TiO2 films (section 3.2.2), it was found that the full width at
half maximum (FWHM) of the latter is around 1.5 eV, while it is 1.8 eV for the monolayer
film. The O(1s) signal of the monolayer film is slightly asymmetric, with a slower decrease of
the intensity on the high energy side. Therefore, the O(1s) signal is fitted with two peaks at
530.6 eV and 531.8 eV, respectively, with a fixed FWHM of 1.5 eV [127]. In the present case
one may speculate that the larger peak relates to oxygen bound to Ti4+ ions, and the other one
to oxygen bound to Ti3+ species. Using a different model one could associate the larger peak
to oxygen located between Ru substrate and Tix+ ions, (see model in Fig. 3.19), and the other
one to oxygen in the topmost layer, preferably oxygen bound to Ti3+ species. The atomic
ratios are normally determined from the respective intensity ratios, corrected by their atomic
CHAPTER 3 Preparation and characterization of titania thin film on Ru(0001) 60
sensitivity factors (ASF). In the present case this is not possible because of the strong
dependence of the Ti(2p) ASF on the Ti oxidation state: Data for paramagnetic species such
as Ti3+ generally have lower ASF values than the diamagnetic analog (e.g., Ti4+) [78].
Therefore, we relate the Ti4+(2p) intensity to the O(1s) peak at 530.6 eV, which is close to the
commonly observed O(1s) binding energy for TiO2 [12,127,128]. Using ASF values of 1.8 for
the Ti(2p) signal (typical for Ti4+ [78]) and 0.66 for the O(1s) peak [78], an O:Ti atomic ratio
of 2.2 is obtained, because of the rather similar inelastic mean free paths of the respective
electrons 17.8 Å at Ekin = 794 eV for Ti(2p) and 16.6 Å at E kin = 723 eV for O(1s) [129]
absorption effects were not included. Note that for thick, well-oxidized TiO2 films an intensity
ratio of the O(1s):Ti(2p) of 0.9 is obtained, which equally corresponds to an atomic ratio of
2.2, and similar values were reported recently also for fully oxidized TiO2 surfaces [130,131].
The other O(1s) and Ti(2p) peaks (O(1s) at 531.8 eV, Ti3+ at 457.5 eV) yield an O(1s):Ti(2p)
intensity ratio of 1.15. As mentioned above, a lower Ti(2p) ASF value is expected in this case,
so that more detailed conclusions on the atomic composition of this phase are difficult. In
total, two different forms of Tix+ exist on layers such as the one depicted in Fig. 3.15, Ti4+ and
possibly Ti3+.
3.2.1.3 Thermal stability of the ultrathin TiOx films
In order to study the thermal stability of ultrathin TiOx films, it was tried to change the
annealing steps after evaporating Ti in an O2 atmosphere of 10-7 mbar with the surface
temperature kept at 640 K. After cooling down to room temperature, these layers were
successively annealed at higher temperatures (60 s at 700 K, 1 s at 900 K, 1 s at 1000 K),
either in an O2 atmosphere (10-7 mbar) or under UHV conditions. After each annealing step,
the structure/morphology of the surface was characterized by STM, and the chemical
composition was evaluated by AES and XPS.
Upon 60 s annealing at 700 K the structure of the surfaces is almost independent of the
annealing atmosphere (UHV annealing or O2 annealing), which is reflected by the
characteristic STM images in Figs. 3.16(a) and 3.20. The surface morphology closely
resembles that obtained upon 60 s annealing at 800 K in O2 (Fig. 3.7). The first layer is almost
closed, with additional islands nucleated in the second layer (3.5×1012 cm-2). Both layers
exhibit the triangular structures described above for the (sub)monolayer films. Their heights
also appear rather similar, with values of about 0.25 nm.
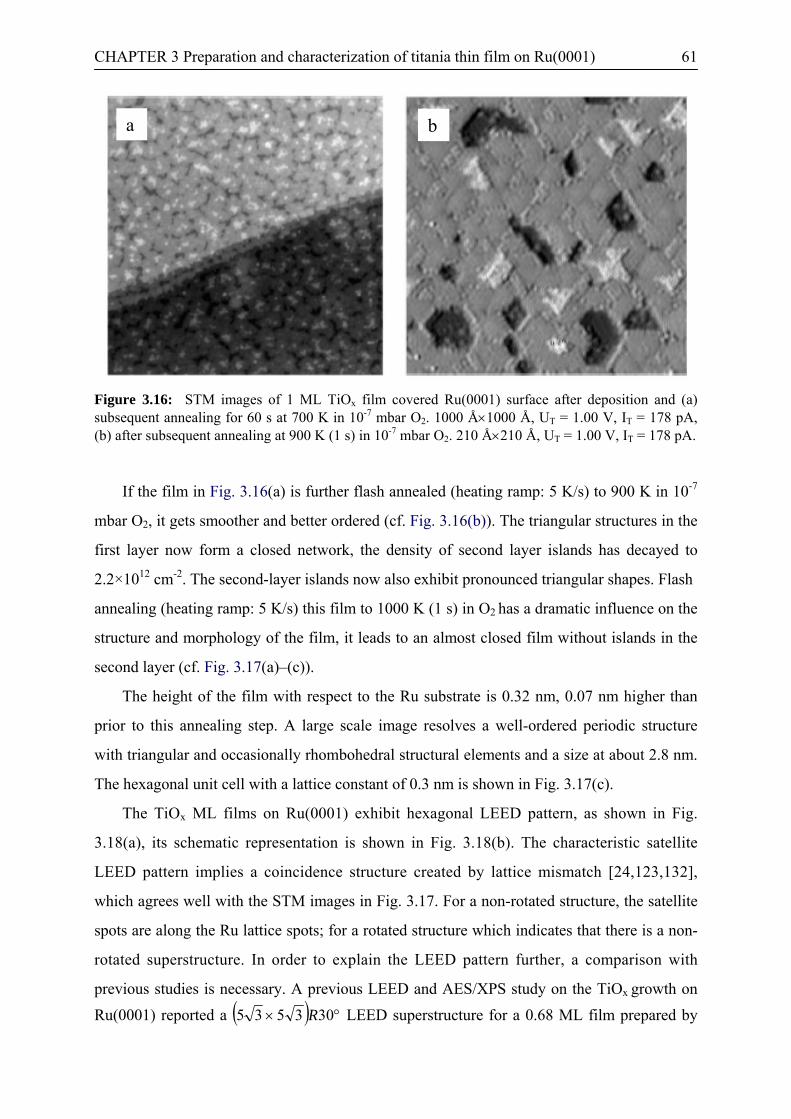
CHAPTER 3 Preparation and characterization of titania thin film on Ru(0001) 61
aa bb
Figure 3.16: STM images of 1 ML TiOx film covered Ru(0001) surface after deposition and (a) subsequent annealing for 60 s at 700 K in 10-7 mbar O2. 1000 Å×1000 Å, UT = 1.00 V, IT = 178 pA, (b) after subsequent annealing at 900 K (1 s) in 10-7 mbar O2. 210 Å×210 Å, UT = 1.00 V, IT = 178 pA.
If the film in Fig. 3.16(a) is further flash annealed (heating ramp: 5 K/s) to 900 K in 10-7
mbar O2, it gets smoother and better ordered (cf. Fig. 3.16(b)). The triangular structures in the
first layer now form a closed network, the density of second layer islands has decayed to
2.2×1012 cm-2. The second-layer islands now also exhibit pronounced triangular shapes. Flash
annealing (heating ramp: 5 K/s) this film to 1000 K (1 s) in O2 has a dramatic influence on the
structure and morphology of the film, it leads to an almost closed film without islands in the
second layer (cf. Fig. 3.17(a)–(c)).
The height of the film with respect to the Ru substrate is 0.32 nm, 0.07 nm higher than
prior to this annealing step. A large scale image resolves a well-ordered periodic structure
with triangular and occasionally rhombohedral structural elements and a size at about 2.8 nm.
The hexagonal unit cell with a lattice constant of 0.3 nm is shown in Fig. 3.17(c).
The TiOx ML films on Ru(0001) exhibit hexagonal LEED pattern, as shown in Fig.
3.18(a), its schematic representation is shown in Fig. 3.18(b). The characteristic satellite
LEED pattern implies a coincidence structure created by lattice mismatch [24,123,132],
which agrees well with the STM images in Fig. 3.17. For a non-rotated structure, the satellite
spots are along the Ru lattice spots; for a rotated structure which indicates that there is a non-
rotated superstructure. In order to explain the LEED pattern further, a comparison with
previous studies is necessary. A previous LEED and AES/XPS study on the TiOx growth on Ru(0001) reported a ( ) °× 303535 R LEED superstructure for a 0.68 ML film prepared by

CHAPTER 3 Preparation and characterization of titania thin film on Ru(0001) 62
aa bb
ccc
450 455 460 465 470
Ti4+2p1/2
Ru3p3/2
Ti3+2p1/2
Ti4+2p3/2
Binding energy / eV
Inte
nsity
/ a.
u.
Ti3+2p3/2
d
450 455 460 465 470
Ti4+2p1/2
Ru3p3/2
Ti3+2p1/2
Ti4+2p3/2
Binding energy / eV
Inte
nsity
/ a.
u.
Ti3+2p3/2
d
Figure 3.17: STM images of a 1 ML TiOx film covered Ru(0001) surface after additional annealing of the surface in (Fig. 16(b)) for 1 s at 1000 K in 10-7 mbar O2. (a) Overview image. 1000 Å×1000 Å, UT = 1.40 V, IT = 178 pA, (b) detail of the surface in (a), 250 Å×250 Å , UT = 1.00 V, IT = 178 pA, and (c) detail of the surface in (a), 50 Å×50 Å, UT = 0.90 V, IT = 178 pA. (d) Fitted detail XP spectrum of the ML TiOx film.
Ti deposition in an O2 atmosphere and subsequent annealing at 1500 K [123]. The main
difference of our structure compared to that phase is the non rotation of the oxide layer. A
similar type of satellite LEED pattern was reported for FeO film grown on Pt(111) (deposition
at room temperature and subsequent oxidation at 870–1000 K in 10-6 mbar O2). The satellite
spots result from multiple scattering involving the Ru and TiOx lattice. The structure was
supposed to be a Moiré-type structure [24], with a rotated coincidence lattice for coverages
from submonolayer to 2 ML iron oxide film. However, for a coverage higher than 2 ML, a
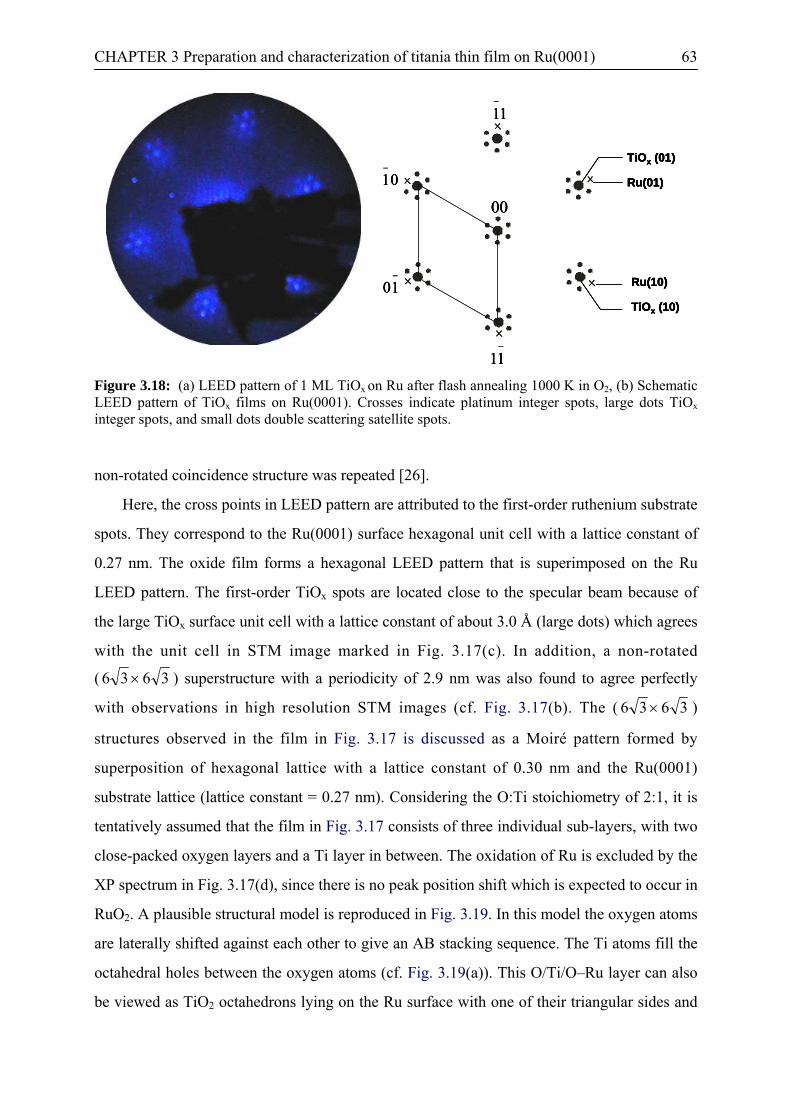
CHAPTER 3 Preparation and characterization of titania thin film on Ru(0001) 63
TiOx (01)
Ru(01)
TiOx (10)
Ru(10)
11−
01−
−
10
−
11
00
TiOx (01)
Ru(01)
TiOx (10)
Ru(10)
11−
01−
−
10
−
11
00
TiOx (01)
Ru(01)
TiOx (10)
Ru(10)
TiOx (01)
Ru(01)
TiOx (10)
Ru(10)
11−
01−
−
10
−
11
00
Figure 3.18: (a) LEED pattern of 1 ML TiOx on Ru after flash annealing 1000 K in O2, (b) Schematic LEED pattern of TiOx films on Ru(0001). Crosses indicate platinum integer spots, large dots TiOx integer spots, and small dots double scattering satellite spots.
non-rotated coincidence structure was repeated [26].
Here, the cross points in LEED pattern are attributed to the first-order ruthenium substrate
spots. They correspond to the Ru(0001) surface hexagonal unit cell with a lattice constant of
0.27 nm. The oxide film forms a hexagonal LEED pattern that is superimposed on the Ru
LEED pattern. The first-order TiOx spots are located close to the specular beam because of
the large TiOx surface unit cell with a lattice constant of about 3.0 Å (large dots) which agrees
with the unit cell in STM image marked in Fig. 3.17(c). In addition, a non-rotated
( 3636 × ) superstructure with a periodicity of 2.9 nm was also found to agree perfectly
with observations in high resolution STM images (cf. Fig. 3.17(b). The ( 3636 × )
structures observed in the film in Fig. 3.17 is discussed as a Moiré pattern formed by
superposition of hexagonal lattice with a lattice constant of 0.30 nm and the Ru(0001)
substrate lattice (lattice constant = 0.27 nm). Considering the O:Ti stoichiometry of 2:1, it is
tentatively assumed that the film in Fig. 3.17 consists of three individual sub-layers, with two
close-packed oxygen layers and a Ti layer in between. The oxidation of Ru is excluded by the
XP spectrum in Fig. 3.17(d), since there is no peak position shift which is expected to occur in
RuO2. A plausible structural model is reproduced in Fig. 3.19. In this model the oxygen atoms
are laterally shifted against each other to give an AB stacking sequence. The Ti atoms fill the
octahedral holes between the oxygen atoms (cf. Fig. 3.19(a)). This O/Ti/O–Ru layer can also
be viewed as TiO2 octahedrons lying on the Ru surface with one of their triangular sides and
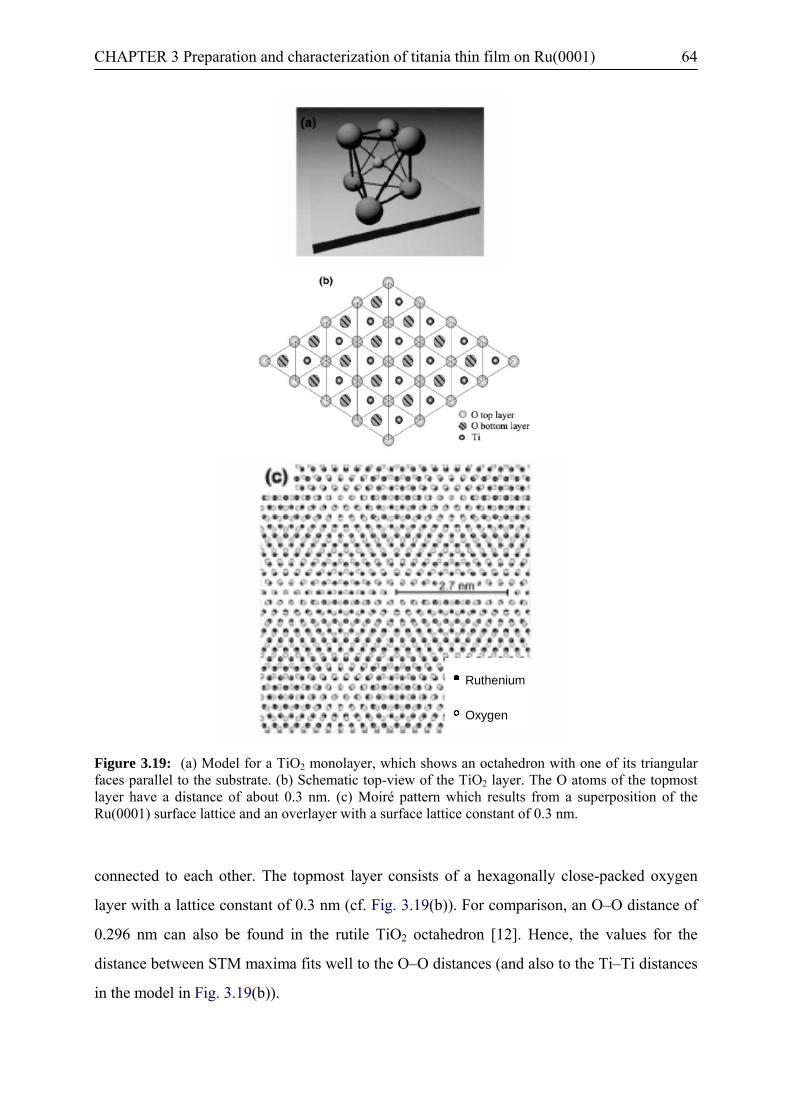
CHAPTER 3 Preparation and characterization of titania thin film on Ru(0001) 64
Ruthenium
Oxygen
Ruthenium
Oxygen
Ruthenium
Oxygen
Figure 3.19: (a) Model for a TiO2 monolayer, which shows an octahedron with one of its triangular faces parallel to the substrate. (b) Schematic top-view of the TiO2 layer. The O atoms of the topmost layer have a distance of about 0.3 nm. (c) Moiré pattern which results from a superposition of the Ru(0001) surface lattice and an overlayer with a surface lattice constant of 0.3 nm.
connected to each other. The topmost layer consists of a hexagonally close-packed oxygen
layer with a lattice constant of 0.3 nm (cf. Fig. 3.19(b)). For comparison, an O–O distance of
0.296 nm can also be found in the rutile TiO2 octahedron [12]. Hence, the values for the
distance between STM maxima fits well to the O–O distances (and also to the Ti–Ti distances
in the model in Fig. 3.19(b)).

CHAPTER 3 Preparation and characterization of titania thin film on Ru(0001) 65
As already mentioned above, the Moiré pattern results from a superposition of the Ru
lattice and the oxygen sub-layer of the Ti oxide with a lattice constant of 0.3 nm. Ideally this
should give a Moiré pattern with a periodicity of 2.7 nm (Fig. 3.19(c)). The value of 2.8 nm
determined from STM images slightly deviates from the expected value. This deviation is
explained by the structural defects and irregularities in the O/Ti/O layer, such as varying sizes
of the unit cell or domain boundaries, and even holes in the overlayer (see Fig. 3.10). Further
support for the assignment of the Moiré structure to a TiO2 layer comes from the XP spectrum
of such a layer (cf. Fig. 3.17(d), because the ratio of Ti4+/Ti3+ is very high (13.3:1, which
clearly indicates that TiO2 is dominant. Since the substrate is covered dominantly by the type
of film as shown in Fig. 3.17(C), may be the Ti3+ species only come from the boarder of the
black holes on the layer, which are supposed to be Ru substrate covered by O2. The structure
of the titanium oxide overlayer proposed here for TiO2/Ru(0001) is identical to that suggested
in an earlier study on TiO2 growth on Cu(100) [26]. In that work the formation of an
overlayer with TiO2 stoichiometry and O/Ti/O stacking sequence was concluded from LEED
and XPS measurements after oxidation (10-7 mbar O2, 10min) of deposited Ti at 623 K. In
contrast, structures resembling the (111) surface of rutile TiO2 were observed for
stoichiometric TiOx films deposited on Pt(111), with coverages between 1.0 and 5.0 ML, after
room temperature deposition of Ti in O2 (1.3×10⁻⁶ mbar) and subsequent annealing at 573°C
in 1.3×10⁻⁶ mbar O2 [22]. Well-ordered titanium oxide monolayer films were also reported in
an STM study on TiO2 film growth on Ni(110), after oxidation of room temperature deposited
Ti at 800 K in a flow of 1×10⁻⁷ mbar O2 [84]. These authors concluded that the first layer
consists of TiO(001), while (110) oriented rutile TiO2 islands are formed on top of that layer
at higher coverages in a Stranski–Krastanov growth mode.
Annealing under UHV conditions leads to rather different results. There is no difference
up to an annealing temperature of 700 K (cf. Fig. 3.20). For 900 K annealing, a flattening of
the film was not found which was observed after 900 K annealing in O2 (cf. Fig. 3.16(b)). In
fact, the surface is very similar to that obtained after annealing to 700 K. Flash-annealing to
1000 K under UHV conditions induces, however, pronounced structural changes (cf.
Fig. 3.21). A large part of the surface is covered by well-ordered arrays of triangular
structures. Similar to annealing in O2, the film height is 0.31 nm, with the periodicity of
around 2.8 nm×2.8 nm. The high resolution image in Fig. 3.21(e) also resolves individual
maxima in the triangular structures with distances of 0.30 nm. The general appearance of
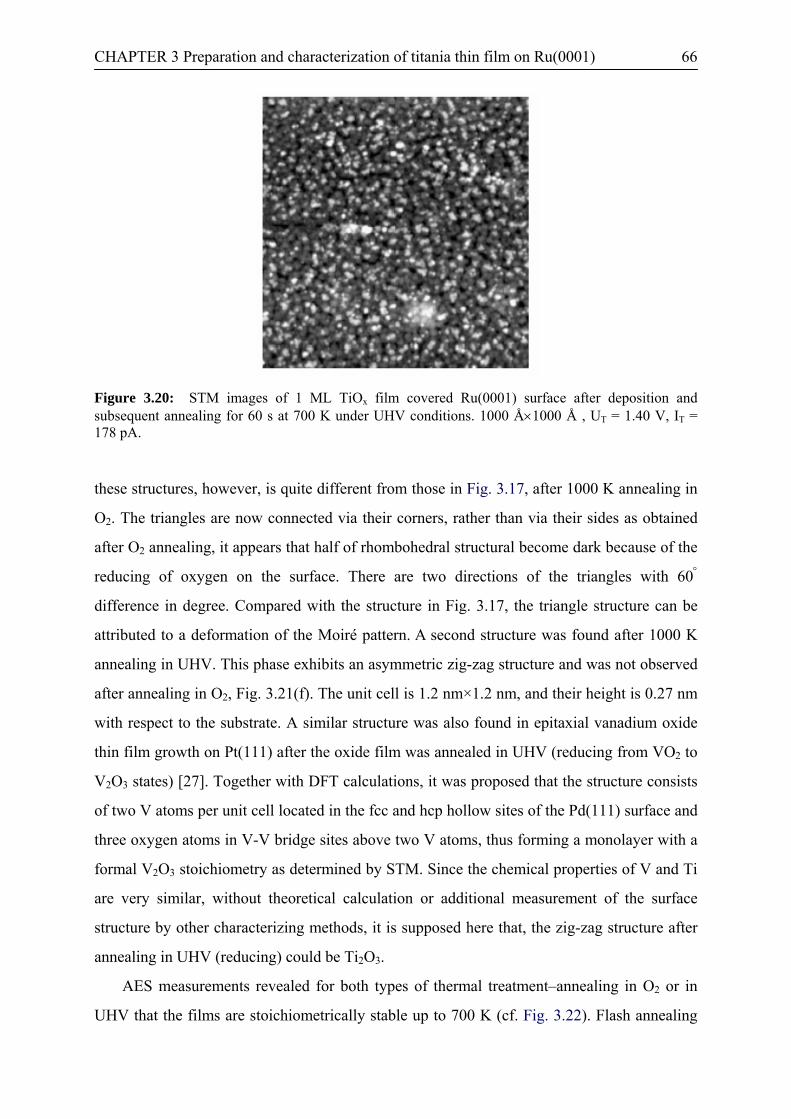
CHAPTER 3 Preparation and characterization of titania thin film on Ru(0001) 66
Figure 3.20: STM images of 1 ML TiOx film covered Ru(0001) surface after deposition and subsequent annealing for 60 s at 700 K under UHV conditions. 1000 Å×1000 Å , UT = 1.40 V, IT = 178 pA.
these structures, however, is quite different from those in Fig. 3.17, after 1000 K annealing in
O2. The triangles are now connected via their corners, rather than via their sides as obtained
after O2 annealing, it appears that half of rhombohedral structural become dark because of the
reducing of oxygen on the surface. There are two directions of the triangles with 60°
difference in degree. Compared with the structure in Fig. 3.17, the triangle structure can be
attributed to a deformation of the Moiré pattern. A second structure was found after 1000 K
annealing in UHV. This phase exhibits an asymmetric zig-zag structure and was not observed
after annealing in O2, Fig. 3.21(f). The unit cell is 1.2 nm×1.2 nm, and their height is 0.27 nm
with respect to the substrate. A similar structure was also found in epitaxial vanadium oxide
thin film growth on Pt(111) after the oxide film was annealed in UHV (reducing from VO2 to
V2O3 states) [27]. Together with DFT calculations, it was proposed that the structure consists
of two V atoms per unit cell located in the fcc and hcp hollow sites of the Pd(111) surface and
three oxygen atoms in V-V bridge sites above two V atoms, thus forming a monolayer with a
formal V2O3 stoichiometry as determined by STM. Since the chemical properties of V and Ti
are very similar, without theoretical calculation or additional measurement of the surface
structure by other characterizing methods, it is supposed here that, the zig-zag structure after
annealing in UHV (reducing) could be Ti2O3.
AES measurements revealed for both types of thermal treatment–annealing in O2 or in
UHV that the films are stoichiometrically stable up to 700 K (cf. Fig. 3.22). Flash annealing
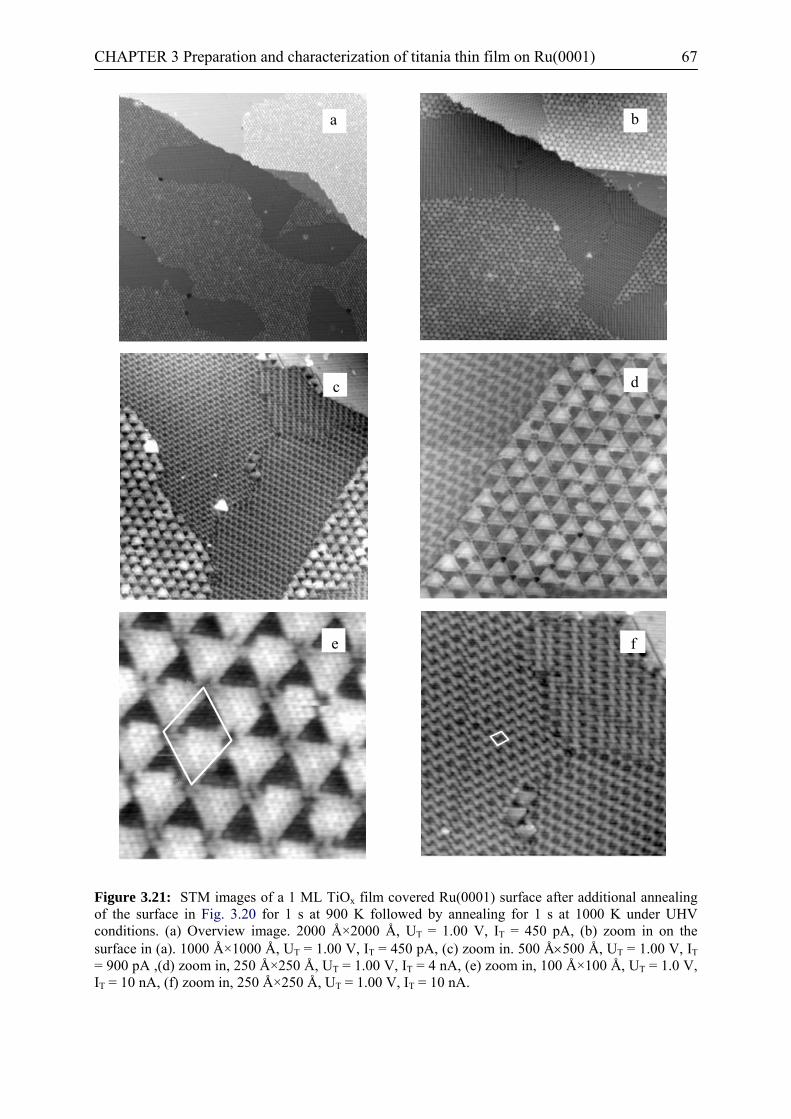
CHAPTER 3 Preparation and characterization of titania thin film on Ru(0001) 67
aa
b
c
d
eeee
f
Figure 3.21: STM images of a 1 ML TiOx film covered Ru(0001) surface after additional annealing of the surface in Fig. 3.20 for 1 s at 900 K followed by annealing for 1 s at 1000 K under UHV conditions. (a) Overview image. 2000 Å×2000 Å, UT = 1.00 V, IT = 450 pA, (b) zoom in on the surface in (a). 1000 Å×1000 Å, UT = 1.00 V, IT = 450 pA, (c) zoom in. 500 Å×500 Å, UT = 1.00 V, IT = 900 pA ,(d) zoom in, 250 Å×250 Å, UT = 1.00 V, IT = 4 nA, (e) zoom in, 100 Å×100 Å, UT = 1.0 V, IT = 10 nA, (f) zoom in, 250 Å×250 Å, UT = 1.00 V, IT = 10 nA.
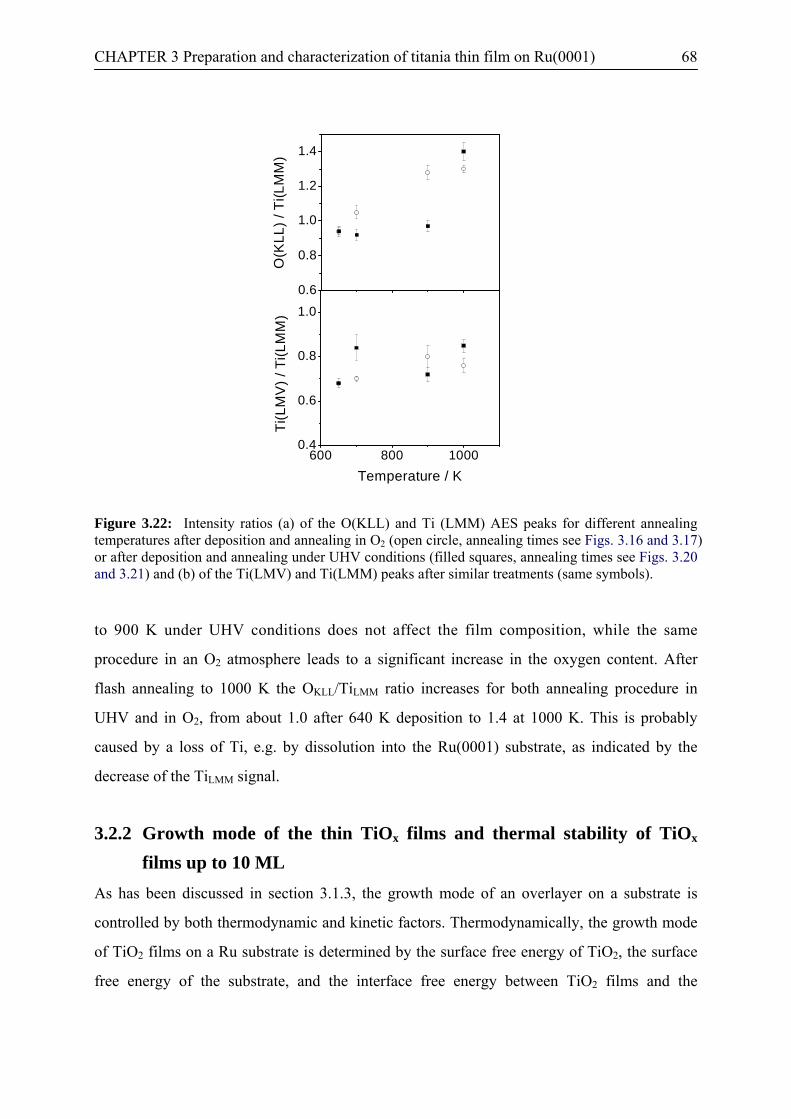
CHAPTER 3 Preparation and characterization of titania thin film on Ru(0001) 68
0.6
0.8
1.0
1.2
1.4
600 800 10000.4
0.6
0.8
1.0
O(K
LL) /
Ti(L
MM
)
Ti(L
MV
) / T
i(LM
M)
Temperature / K
Figure 3.22: Intensity ratios (a) of the O(KLL) and Ti (LMM) AES peaks for different annealing temperatures after deposition and annealing in O2 (open circle, annealing times see Figs. 3.16 and 3.17) or after deposition and annealing under UHV conditions (filled squares, annealing times see Figs. 3.20 and 3.21) and (b) of the Ti(LMV) and Ti(LMM) peaks after similar treatments (same symbols).
to 900 K under UHV conditions does not affect the film composition, while the same
procedure in an O2 atmosphere leads to a significant increase in the oxygen content. After
flash annealing to 1000 K the OKLL/TiLMM ratio increases for both annealing procedure in
UHV and in O2, from about 1.0 after 640 K deposition to 1.4 at 1000 K. This is probably
caused by a loss of Ti, e.g. by dissolution into the Ru(0001) substrate, as indicated by the
decrease of the TiLMM signal.
3.2.2 Growth mode of the thin TiOx films and thermal stability of TiOx films up to 10 ML
As has been discussed in section 3.1.3, the growth mode of an overlayer on a substrate is
controlled by both thermodynamic and kinetic factors. Thermodynamically, the growth mode
of TiO2 films on a Ru substrate is determined by the surface free energy of TiO2, the surface
free energy of the substrate, and the interface free energy between TiO2 films and the
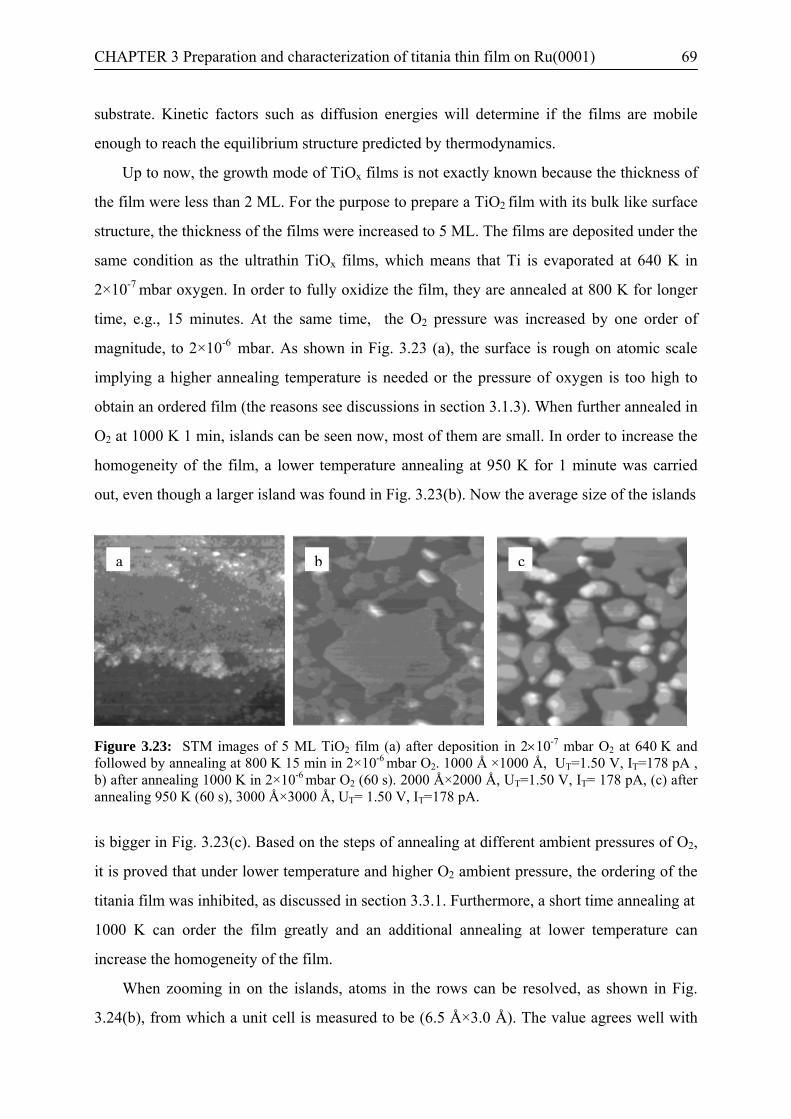
CHAPTER 3 Preparation and characterization of titania thin film on Ru(0001) 69
substrate. Kinetic factors such as diffusion energies will determine if the films are mobile
enough to reach the equilibrium structure predicted by thermodynamics.
Up to now, the growth mode of TiOx films is not exactly known because the thickness of
the film were less than 2 ML. For the purpose to prepare a TiO2 film with its bulk like surface
structure, the thickness of the films were increased to 5 ML. The films are deposited under the
same condition as the ultrathin TiOx films, which means that Ti is evaporated at 640 K in
2×10⁻⁷ mbar oxygen. In order to fully oxidize the film, they are annealed at 800 K for longer
time, e.g., 15 minutes. At the same time, the O2 pressure was increased by one order of
magnitude, to 2×10⁻⁶ mbar. As shown in Fig. 3.23 (a), the surface is rough on atomic scale
implying a higher annealing temperature is needed or the pressure of oxygen is too high to
obtain an ordered film (the reasons see discussions in section 3.1.3). When further annealed in
O2 at 1000 K 1 min, islands can be seen now, most of them are small. In order to increase the
homogeneity of the film, a lower temperature annealing at 950 K for 1 minute was carried
out, even though a larger island was found in Fig. 3.23(b). Now the average size of the islands
a
b c
Figure 3.23: STM images of 5 ML TiO2 film (a) after deposition in 2×10⁻⁷ mbar O2 at 640 K and followed by annealing at 800 K 15 min in 2×10⁻⁶ mbar O2. 1000 Å ×1000 Å, UT=1.50 V, IT=178 pA , b) after annealing 1000 K in 2×10⁻⁶ mbar O2 (60 s). 2000 Å×2000 Å, UT=1.50 V, IT= 178 pA, (c) after annealing 950 K (60 s), 3000 Å×3000 Å, UT= 1.50 V, IT=178 pA.
is bigger in Fig. 3.23(c). Based on the steps of annealing at different ambient pressures of O2,
it is proved that under lower temperature and higher O2 ambient pressure, the ordering of the
titania film was inhibited, as discussed in section 3.3.1. Furthermore, a short time annealing at
1000 K can order the film greatly and an additional annealing at lower temperature can
increase the homogeneity of the film.
When zooming in on the islands, atoms in the rows can be resolved, as shown in Fig.
3.24(b), from which a unit cell is measured to be (6.5 Å×3.0 Å). The value agrees well with
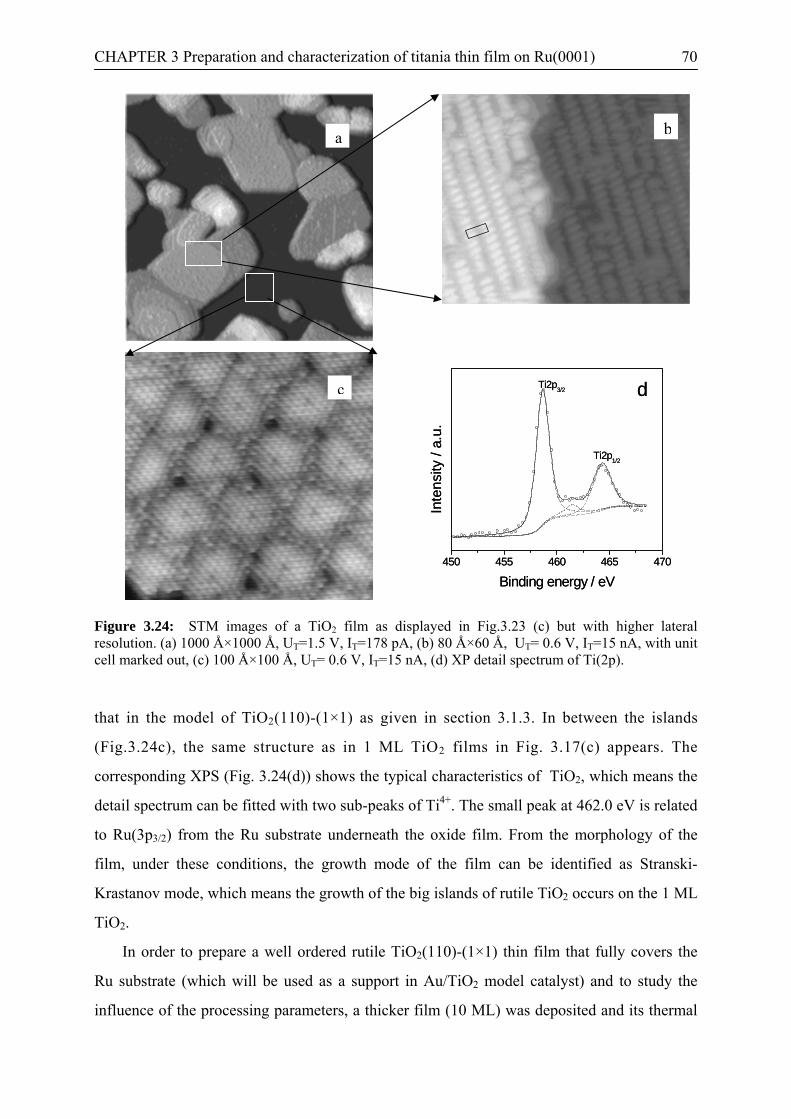
CHAPTER 3 Preparation and characterization of titania thin film on Ru(0001) 70
a
c
450 455 460 465 470
Ti2p1/2
Binding energy / eV
Inte
nsity
/ a.
u.
Ti2p3/2 d
450 455 460 465 470
Ti2p1/2
Binding energy / eV
Inte
nsity
/ a.
u.
Ti2p3/2 d
bb
Figure 3.24: STM images of a TiO2 film as displayed in Fig.3.23 (c) but with higher lateral resolution. (a) 1000 Å×1000 Å, UT=1.5 V, IT=178 pA, (b) 80 Å×60 Å, UT= 0.6 V, IT=15 nA, with unit cell marked out, (c) 100 Å×100 Å, UT= 0.6 V, IT=15 nA, (d) XP detail spectrum of Ti(2p).
that in the model of TiO2(110)-(1×1) as given in section 3.1.3. In between the islands
(Fig.3.24c), the same structure as in 1 ML TiO2 films in Fig. 3.17(c) appears. The
corresponding XPS (Fig. 3.24(d)) shows the typical characteristics of TiO2, which means the
detail spectrum can be fitted with two sub-peaks of Ti4+. The small peak at 462.0 eV is related
to Ru(3p3/2) from the Ru substrate underneath the oxide film. From the morphology of the
film, under these conditions, the growth mode of the film can be identified as Stranski-
Krastanov mode, which means the growth of the big islands of rutile TiO2 occurs on the 1 ML
TiO2.
In order to prepare a well ordered rutile TiO2(110)-(1×1) thin film that fully covers the
Ru substrate (which will be used as a support in Au/TiO2 model catalyst) and to study the
influence of the processing parameters, a thicker film (10 ML) was deposited and its thermal
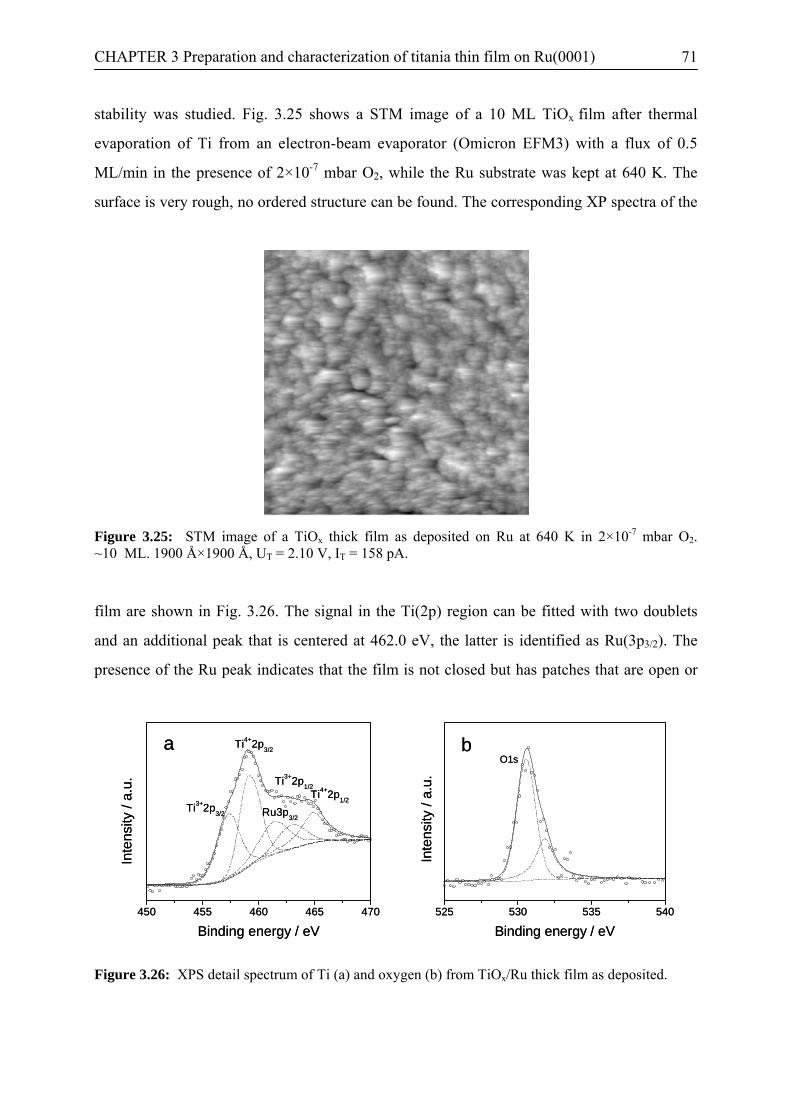
CHAPTER 3 Preparation and characterization of titania thin film on Ru(0001) 71
stability was studied. Fig. 3.25 shows a STM image of a 10 ML TiOx film after thermal
evaporation of Ti from an electron-beam evaporator (Omicron EFM3) with a flux of 0.5
ML/min in the presence of 2×10⁻⁷ mbar O2, while the Ru substrate was kept at 640 K. The
surface is very rough, no ordered structure can be found. The corresponding XP spectra of the
Figure 3.25: STM image of a TiOx thick film as deposited on Ru at 640 K in 2×10⁻⁷ mbar O2. ~10 ML. 1900 Å×1900 Å, UT = 2.10 V, IT = 158 pA.
film are shown in Fig. 3.26. The signal in the Ti(2p) region can be fitted with two doublets
and an additional peak that is centered at 462.0 eV, the latter is identified as Ru(3p3/2). The
presence of the Ru peak indicates that the film is not closed but has patches that are open or
450 455 460 465 470
Ti4+2p1/2
Ru3p3/2
Ti3+2p1/2
Ti4+2p3/2
Binding energy / eV
Inte
nsity
/ a.
u.
Ti3+2p3/2
a
450 455 460 465 470
Ti4+2p1/2
Ru3p3/2
Ti3+2p1/2
Ti4+2p3/2
Binding energy / eV
Inte
nsity
/ a.
u.
Ti3+2p3/2
a
525 530 535 540
Binding energy / eV
Inte
nsity
/ a.
u.
O1sb
525 530 535 540
Binding energy / eV
Inte
nsity
/ a.
u.
O1sb
Figure 3.26: XPS detail spectrum of Ti (a) and oxygen (b) from TiOx/Ru thick film as deposited.
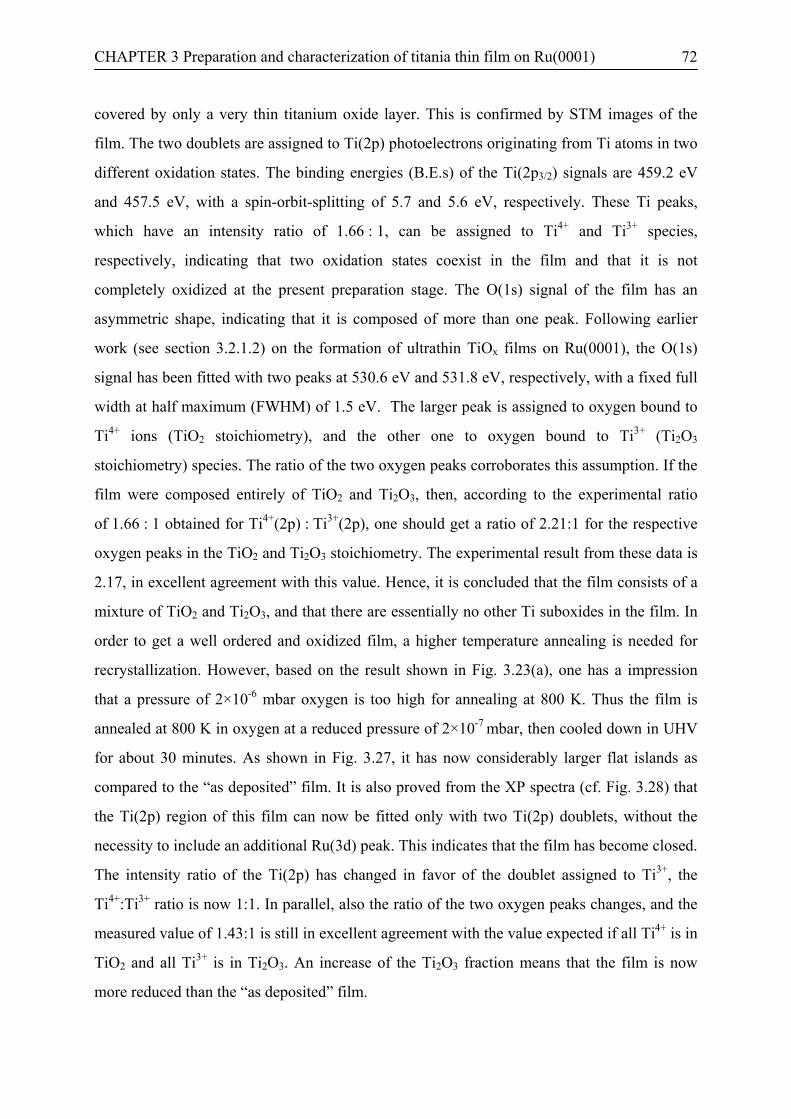
CHAPTER 3 Preparation and characterization of titania thin film on Ru(0001) 72
covered by only a very thin titanium oxide layer. This is confirmed by STM images of the
film. The two doublets are assigned to Ti(2p) photoelectrons originating from Ti atoms in two
different oxidation states. The binding energies (B.E.s) of the Ti(2p3/2) signals are 459.2 eV
and 457.5 eV, with a spin-orbit-splitting of 5.7 and 5.6 eV, respectively. These Ti peaks,
which have an intensity ratio of 1.66 : 1, can be assigned to Ti4+ and Ti3+ species,
respectively, indicating that two oxidation states coexist in the film and that it is not
completely oxidized at the present preparation stage. The O(1s) signal of the film has an
asymmetric shape, indicating that it is composed of more than one peak. Following earlier
work (see section 3.2.1.2) on the formation of ultrathin TiOx films on Ru(0001), the O(1s)
signal has been fitted with two peaks at 530.6 eV and 531.8 eV, respectively, with a fixed full
width at half maximum (FWHM) of 1.5 eV. The larger peak is assigned to oxygen bound to
Ti4+ ions (TiO2 stoichiometry), and the other one to oxygen bound to Ti3+ (Ti2O3
stoichiometry) species. The ratio of the two oxygen peaks corroborates this assumption. If the
film were composed entirely of TiO2 and Ti2O3, then, according to the experimental ratio
of 1.66 : 1 obtained for Ti4+(2p) : Ti3+(2p), one should get a ratio of 2.21:1 for the respective
oxygen peaks in the TiO2 and Ti2O3 stoichiometry. The experimental result from these data is
2.17, in excellent agreement with this value. Hence, it is concluded that the film consists of a
mixture of TiO2 and Ti2O3, and that there are essentially no other Ti suboxides in the film. In
order to get a well ordered and oxidized film, a higher temperature annealing is needed for
recrystallization. However, based on the result shown in Fig. 3.23(a), one has a impression
that a pressure of 2×10⁻⁶ mbar oxygen is too high for annealing at 800 K. Thus the film is
annealed at 800 K in oxygen at a reduced pressure of 2×10⁻⁷ mbar, then cooled down in UHV
for about 30 minutes. As shown in Fig. 3.27, it has now considerably larger flat islands as
compared to the “as deposited” film. It is also proved from the XP spectra (cf. Fig. 3.28) that
the Ti(2p) region of this film can now be fitted only with two Ti(2p) doublets, without the
necessity to include an additional Ru(3d) peak. This indicates that the film has become closed.
The intensity ratio of the Ti(2p) has changed in favor of the doublet assigned to Ti3+, the
Ti4+:Ti3+ ratio is now 1:1. In parallel, also the ratio of the two oxygen peaks changes, and the
measured value of 1.43:1 is still in excellent agreement with the value expected if all Ti4+ is in
TiO2 and all Ti3+ is in Ti2O3. An increase of the Ti2O3 fraction means that the film is now
more reduced than the “as deposited” film.
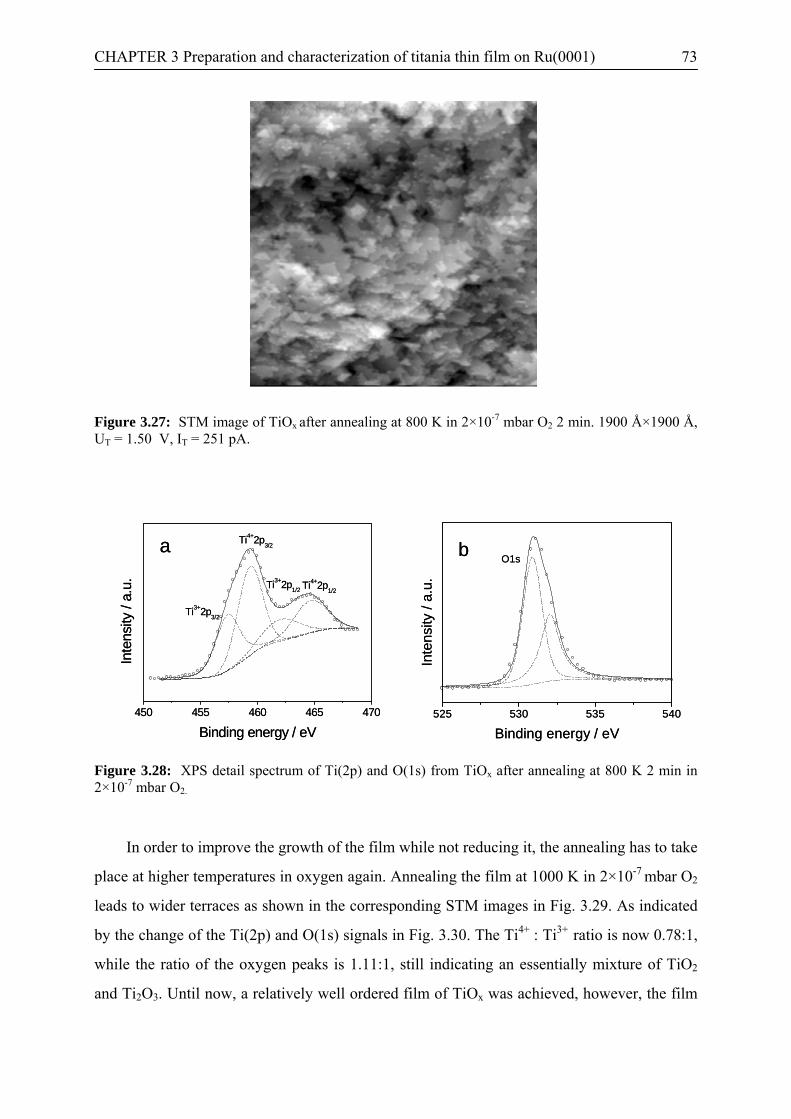
CHAPTER 3 Preparation and characterization of titania thin film on Ru(0001) 73
Figure 3.27: STM image of TiOx after annealing at 800 K in 2×10⁻⁷ mbar O2 2 min. 1900 Å×1900 Å, UT = 1.50 V, IT = 251 pA.
450 455 460 465 470
Ti4+2p1/2
Ti4+2p3/2
Ti3+2p1/2
Binding energy / eV
Inte
nsity
/ a.
u.
Ti3+2p3/2
a
450 455 460 465 470
Ti4+2p1/2
Ti4+2p3/2
Ti3+2p1/2
Binding energy / eV
Inte
nsity
/ a.
u.
Ti3+2p3/2
a
525 530 535 540
Binding energy / eV
Inte
nsity
/ a.
u.
O1sb
525 530 535 540
Binding energy / eV
Inte
nsity
/ a.
u.
O1sb
Figure 3.28: XPS detail spectrum of Ti(2p) and O(1s) from TiOx after annealing at 800 K 2 min in 2×10⁻⁷ mbar O2.
In order to improve the growth of the film while not reducing it, the annealing has to take
place at higher temperatures in oxygen again. Annealing the film at 1000 K in 2×10⁻⁷ mbar O2
leads to wider terraces as shown in the corresponding STM images in Fig. 3.29. As indicated
by the change of the Ti(2p) and O(1s) signals in Fig. 3.30. The Ti4+ : Ti3+ ratio is now 0.78:1,
while the ratio of the oxygen peaks is 1.11:1, still indicating an essentially mixture of TiO2
and Ti2O3. Until now, a relatively well ordered film of TiOx was achieved, however, the film
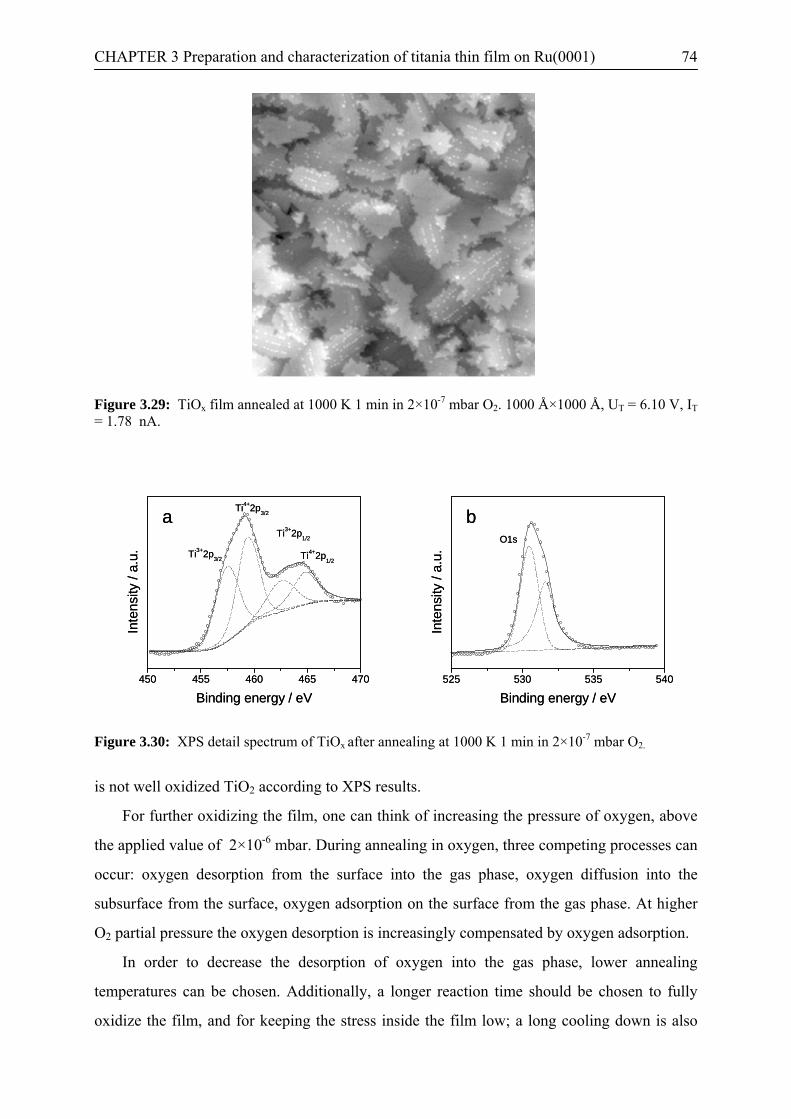
CHAPTER 3 Preparation and characterization of titania thin film on Ru(0001) 74
Figure 3.29: TiOx film annealed at 1000 K 1 min in 2×10⁻⁷ mbar O2. 1000 Å×1000 Å, UT = 6.10 V, IT = 1.78 nA.
450 455 460 465 470
Ti4+2p1/2
Ti3+2p1/2
Ti4+2p3/2
Binding energy / eV
Inte
nsity
/ a.
u. Ti3+2p3/2
a
450 455 460 465 470
Ti4+2p1/2
Ti3+2p1/2
Ti4+2p3/2
Binding energy / eV
Inte
nsity
/ a.
u. Ti3+2p3/2
a
525 530 535 540
Binding energy / eV
Inte
nsity
/ a.
u.
O1s
b
525 530 535 540
Binding energy / eV
Inte
nsity
/ a.
u.
O1s
b
Figure 3.30: XPS detail spectrum of TiOx after annealing at 1000 K 1 min in 2×10⁻⁷ mbar O2.
is not well oxidized TiO2 according to XPS results.
For further oxidizing the film, one can think of increasing the pressure of oxygen, above
the applied value of 2×10⁻⁶ mbar. During annealing in oxygen, three competing processes can
occur: oxygen desorption from the surface into the gas phase, oxygen diffusion into the
subsurface from the surface, oxygen adsorption on the surface from the gas phase. At higher
O2 partial pressure the oxygen desorption is increasingly compensated by oxygen adsorption.
In order to decrease the desorption of oxygen into the gas phase, lower annealing
temperatures can be chosen. Additionally, a longer reaction time should be chosen to fully
oxidize the film, and for keeping the stress inside the film low; a long cooling down is also
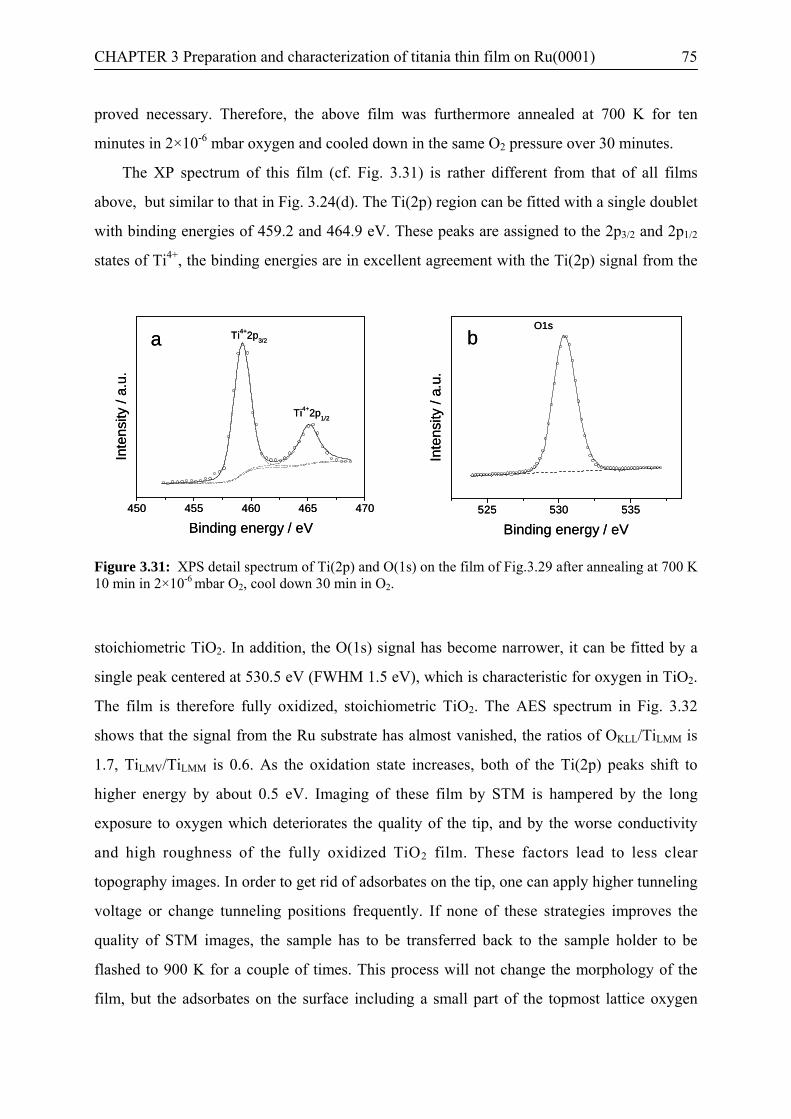
CHAPTER 3 Preparation and characterization of titania thin film on Ru(0001) 75
proved necessary. Therefore, the above film was furthermore annealed at 700 K for ten
minutes in 2×10⁻⁶ mbar oxygen and cooled down in the same O2 pressure over 30 minutes.
The XP spectrum of this film (cf. Fig. 3.31) is rather different from that of all films
above, but similar to that in Fig. 3.24(d). The Ti(2p) region can be fitted with a single doublet
with binding energies of 459.2 and 464.9 eV. These peaks are assigned to the 2p3/2 and 2p1/2
states of Ti4+, the binding energies are in excellent agreement with the Ti(2p) signal from the
450 455 460 465 470
Ti4+2p1/2
Binding energy / eV
Inte
nsity
/ a.
u.
Ti4+2p3/2 a
450 455 460 465 470
Ti4+2p1/2
Binding energy / eV
Inte
nsity
/ a.
u.
Ti4+2p3/2 a
525 530 535
Binding energy / eV
Inte
nsity
/ a.
u.
O1sb
525 530 535
Binding energy / eV
Inte
nsity
/ a.
u.
O1sb
Figure 3.31: XPS detail spectrum of Ti(2p) and O(1s) on the film of Fig.3.29 after annealing at 700 K 10 min in 2×10⁻⁶ mbar O2, cool down 30 min in O2.
stoichiometric TiO2. In addition, the O(1s) signal has become narrower, it can be fitted by a
single peak centered at 530.5 eV (FWHM 1.5 eV), which is characteristic for oxygen in TiO2.
The film is therefore fully oxidized, stoichiometric TiO2. The AES spectrum in Fig. 3.32
shows that the signal from the Ru substrate has almost vanished, the ratios of OKLL/TiLMM is
1.7, TiLMV/TiLMM is 0.6. As the oxidation state increases, both of the Ti(2p) peaks shift to
higher energy by about 0.5 eV. Imaging of these film by STM is hampered by the long
exposure to oxygen which deteriorates the quality of the tip, and by the worse conductivity
and high roughness of the fully oxidized TiO2 film. These factors lead to less clear
topography images. In order to get rid of adsorbates on the tip, one can apply higher tunneling
voltage or change tunneling positions frequently. If none of these strategies improves the
quality of STM images, the sample has to be transferred back to the sample holder to be
flashed to 900 K for a couple of times. This process will not change the morphology of the
film, but the adsorbates on the surface including a small part of the topmost lattice oxygen
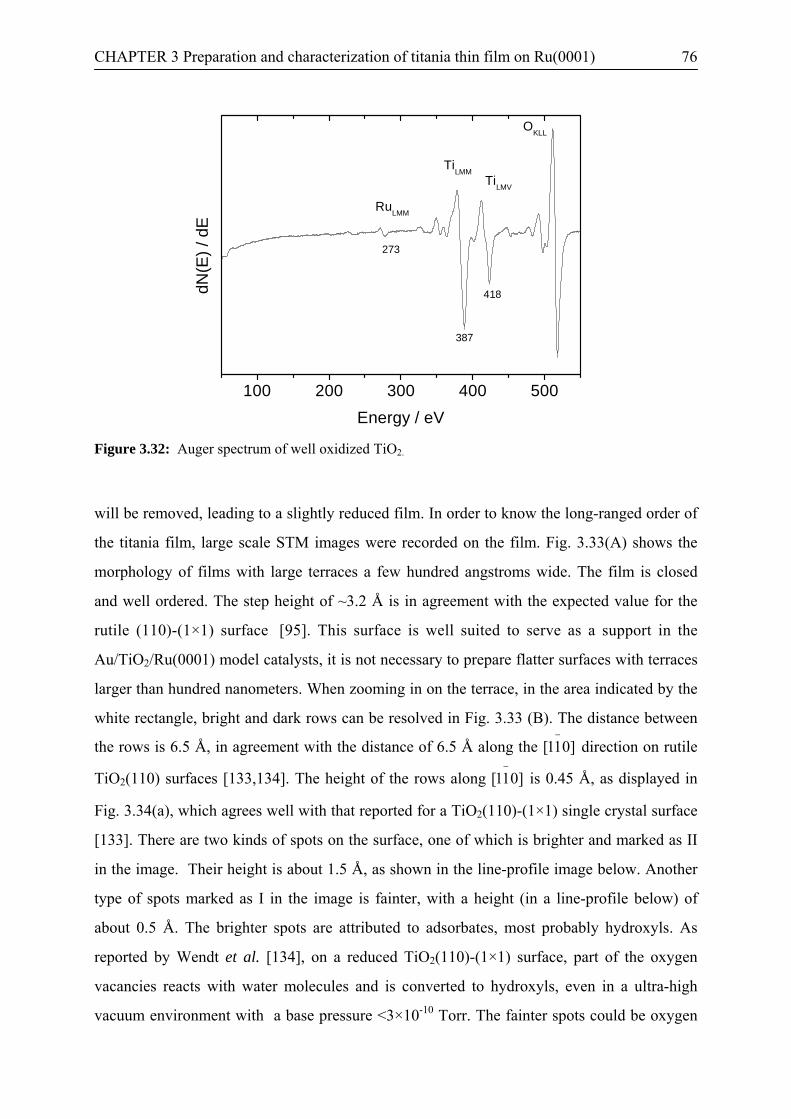
CHAPTER 3 Preparation and characterization of titania thin film on Ru(0001) 76
100 200 300 400 500
418
RuLMM
Energy / eV
dN(E
) / d
E
TiLMM
TiLMV
OKLL
387
273
Figure 3.32: Auger spectrum of well oxidized TiO2.
will be removed, leading to a slightly reduced film. In order to know the long-ranged order of
the titania film, large scale STM images were recorded on the film. Fig. 3.33(A) shows the
morphology of films with large terraces a few hundred angstroms wide. The film is closed
and well ordered. The step height of ~3.2 Å is in agreement with the expected value for the
rutile (110)-(1×1) surface [95]. This surface is well suited to serve as a support in the
Au/TiO2/Ru(0001) model catalysts, it is not necessary to prepare flatter surfaces with terraces
larger than hundred nanometers. When zooming in on the terrace, in the area indicated by the
white rectangle, bright and dark rows can be resolved in Fig. 3.33 (B). The distance between
the rows is 6.5 Å, in agreement with the distance of 6.5 Å along the direction on rutile
TiO
]011[−
2(110) surfaces [133,134]. The height of the rows along is 0.45 Å, as displayed in
Fig. 3.34(a), which agrees well with that reported for a TiO
]011[−
2(110)-(1×1) single crystal surface
[133]. There are two kinds of spots on the surface, one of which is brighter and marked as II
in the image. Their height is about 1.5 Å, as shown in the line-profile image below. Another
type of spots marked as I in the image is fainter, with a height (in a line-profile below) of
about 0.5 Å. The brighter spots are attributed to adsorbates, most probably hydroxyls. As
reported by Wendt et al. [134], on a reduced TiO2(110)-(1×1) surface, part of the oxygen
vacancies reacts with water molecules and is converted to hydroxyls, even in a ultra-high
vacuum environment with a base pressure <3×10⁻¹⁰ Torr. The fainter spots could be oxygen
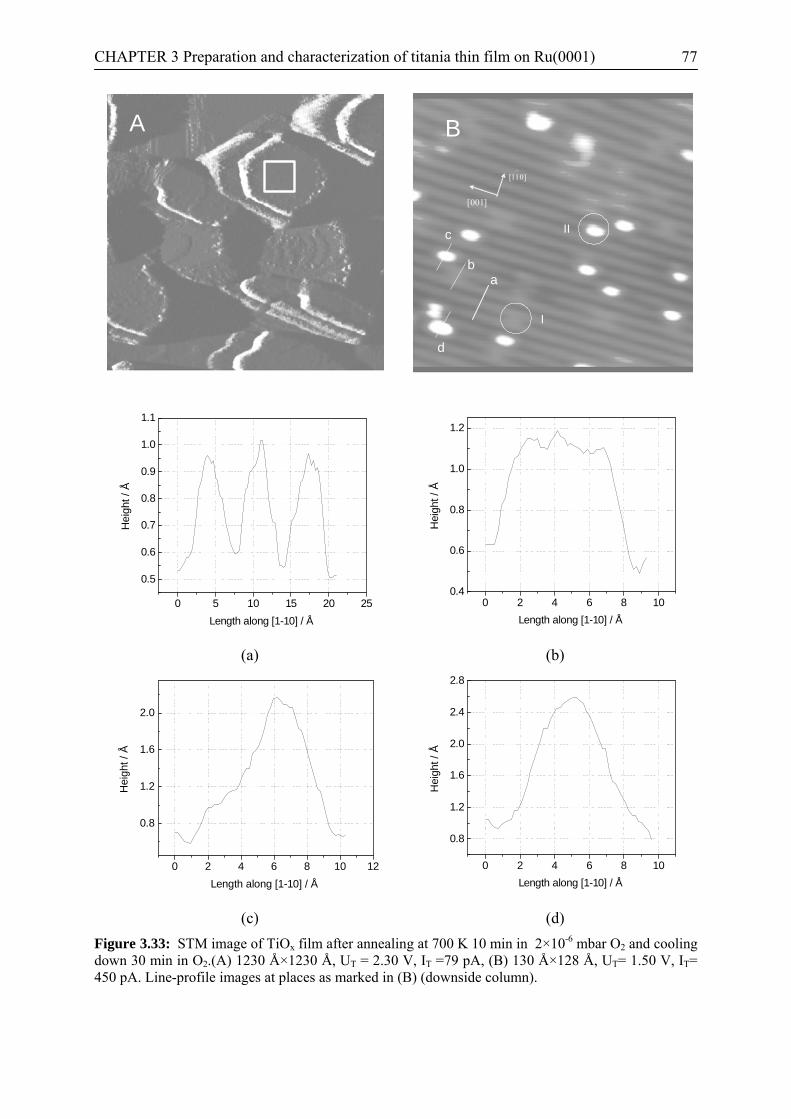
CHAPTER 3 Preparation and characterization of titania thin film on Ru(0001) 77
AAAAAAAA
]001[
]011[−
I
II
]001[
]011[−
I
II
B
]001[
]011[−
I
II
]001[
]011[−
I
II
ab
c
d
]001[
]011[−
I
II
]001[
]011[−
I
II
B
]001[
]011[−
I
II
]001[
]011[−
I
II
ab
c
d
B
]001[
]011[−
I
II
]001[
]011[−
I
II
B
]001[
]011[−
I
II
]001[
]011[−
I
II
ab
c
d
]001[
]011[−
I
II
]001[
]011[−
I
II
B
]001[
]011[−
I
II
]001[
]011[−
I
II
ab
c
d
B
0 5 10 15 20 25
0.5
0.6
0.7
0.8
0.9
1.0
1.1
Hei
ght /
Å
Length along [1-10] / Å
(a)
0 2 4 6 8 100.4
0.6
0.8
1.0
1.2
Hei
ght /
Å
Length along [1-10] / Å
(b)
0 2 4 6 8 10 12
0.8
1.2
1.6
2.0
Hei
ght /
Å
Length along [1-10] / Å
(c)
0 2 4 6 8 10
0.8
1.2
1.6
2.0
2.4
2.8
Hei
ght /
Å
Length along [1-10] / Å
(d) Figure 3.33: STM image of TiOx film after annealing at 700 K 10 min in 2×10⁻⁶ mbar O2 and cooling down 30 min in O2.(A) 1230 Å×1230 Å, UT = 2.30 V, IT =79 pA, (B) 130 Å×128 Å, UT= 1.50 V, IT= 450 pA. Line-profile images at places as marked in (B) (downside column).
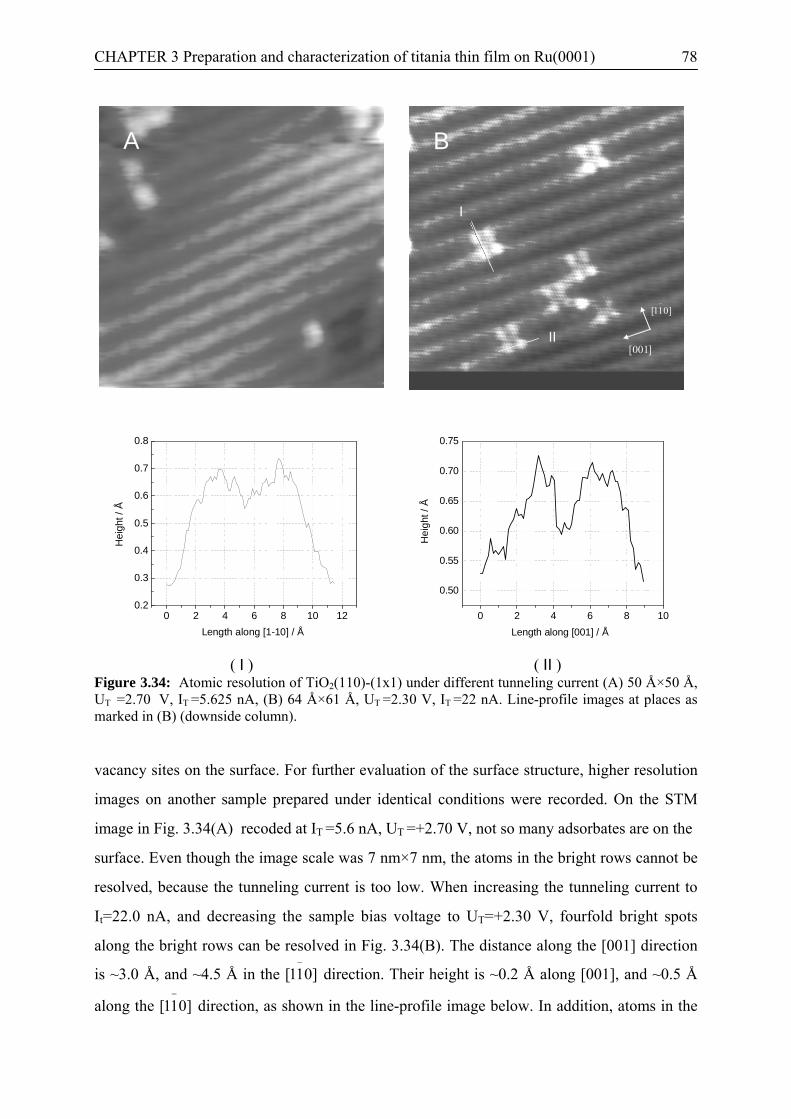
CHAPTER 3 Preparation and characterization of titania thin film on Ru(0001) 78
Figure 3.34: Atomic resolution of TiO2(110)-(1x1) under different tunneling current (A) 50 Å×50 Å, UT =2.70 V, IT =5.625 nA, (B) 64 Å×61 Å, UT =2.30 V, IT =22 nA. Line-profile images at places as marked in (B) (downside column).
AA
]011[−
]001[
I
II
]011[−
]001[
I
II
B
]011[−
]001[
I
II
]011[−
]001[
I
II
B
0 2 4 6 8 10 120.2
0.3
0.4
0.5
0.6
0.7
0.8
Hei
ght /
Å
Length along [1-10] / Å
( I )
0 2 4 6 8 10
0.50
0.55
0.60
0.65
0.70
0.75
H
eigh
t / Å
Length along [001] / Å
( II )
vacancy sites on the surface. For further evaluation of the surface structure, higher resolution
images on another sample prepared under identical conditions were recorded. On the STM
image in Fig. 3.34(A) recoded at IT =5.6 nA, UT =+2.70 V, not so many adsorbates are on the
surface. Even though the image scale was 7 nm×7 nm, the atoms in the bright rows cannot be
resolved, because the tunneling current is too low. When increasing the tunneling current to
It=22.0 nA, and decreasing the sample bias voltage to UT=+2.30 V, fourfold bright spots
along the bright rows can be resolved in Fig. 3.34(B). The distance along the [001] direction
is ~3.0 Å, and ~4.5 Å in the direction. Their height is ~0.2 Å along [001], and ~0.5 Å
along the direction, as shown in the line-profile image below. In addition, atoms in the
]011[−
]011[−

CHAPTER 3 Preparation and characterization of titania thin film on Ru(0001) 79
bright rows start to be resolved. These atoms in the bright rows can be resolved more clearly
in Fig.3.35(A) (IT=18 nA, UT=+2.2 V), in addition, the atoms in between the bright rows can
be resolved to some extent also. The distance between two atoms along the atom rows is 3.0
Å, and 6.5 Å vertical to the rows, as shown in Fig. 3.35(B). Thus, the unit cell of the surface
structure is 6.5 Å×3.0 Å. This is identical to the (1×1) unit cell of rutile TiO2(110), and thus
C
]001[
]011[−
I
II
C
]001[
]011[−I
II
C
]001[
]011[−
I
II
A
]001[
]011[−I
II
C
]001[
]011[−
I
II
C
]001[
]011[−I
II
C
]001[
]011[−
I
II
A
]001[
]011[−I
II
DBDB
0 2 4 6 8 10 120.1
0.2
0.3
0.4
0.5
0.6
0.7
Hei
ght /
Å
Length along [1-10] / Å
( I )
0 2 4 6 8 10 12
0.3
0.4
0.5
0.6
0.7
Hei
ght /
Å
Length along [001] / Å
( II ) Figure 3.35: Atomic resolution of TiO2(110)-(1x1). (A) 50 Å×50 Å, UT = 2.20 V, IT =18.00 nA, (B) interactive grid on (A). Line-profile images at places as marked in (A) (downside column).
the titanium dioxide films consist of a rutile TiO2(110)-(1×1) phase. For identifying the bright
rows as fivefold Ti or bridging oxygen, we need to further analyze the surface structure. The
fourfold maxima structure in Fig. 3.35(B) changed into two bright bars vertical to the [001]
direction in Fig. 3.35(A). The distance between the two bars is ~3.0 Å, and the height of the
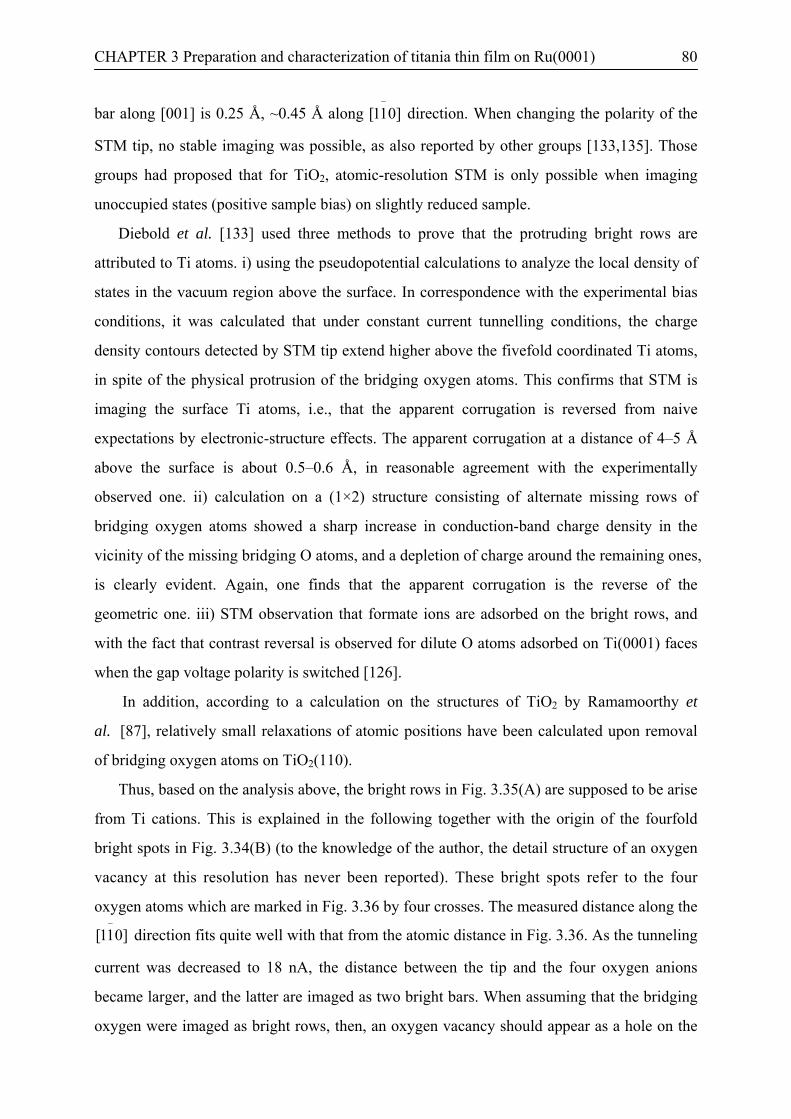
CHAPTER 3 Preparation and characterization of titania thin film on Ru(0001) 80
bar along [001] is 0.25 Å, ~0.45 Å along direction. When changing the polarity of the
STM tip, no stable imaging was possible, as also reported by other groups [133,135]. Those
groups had proposed that for TiO
]011[−
2, atomic-resolution STM is only possible when imaging
unoccupied states (positive sample bias) on slightly reduced sample.
Diebold et al. [133] used three methods to prove that the protruding bright rows are
attributed to Ti atoms. i) using the pseudopotential calculations to analyze the local density of
states in the vacuum region above the surface. In correspondence with the experimental bias
conditions, it was calculated that under constant current tunnelling conditions, the charge
density contours detected by STM tip extend higher above the fivefold coordinated Ti atoms,
in spite of the physical protrusion of the bridging oxygen atoms. This confirms that STM is
imaging the surface Ti atoms, i.e., that the apparent corrugation is reversed from naive
expectations by electronic-structure effects. The apparent corrugation at a distance of 4–5 Å
above the surface is about 0.5–0.6 Å, in reasonable agreement with the experimentally
observed one. ii) calculation on a (1×2) structure consisting of alternate missing rows of
bridging oxygen atoms showed a sharp increase in conduction-band charge density in the
vicinity of the missing bridging O atoms, and a depletion of charge around the remaining ones,
is clearly evident. Again, one finds that the apparent corrugation is the reverse of the
geometric one. iii) STM observation that formate ions are adsorbed on the bright rows, and
with the fact that contrast reversal is observed for dilute O atoms adsorbed on Ti(0001) faces
when the gap voltage polarity is switched [126].
In addition, according to a calculation on the structures of TiO2 by Ramamoorthy et
al. [87], relatively small relaxations of atomic positions have been calculated upon removal
of bridging oxygen atoms on TiO2(110).
Thus, based on the analysis above, the bright rows in Fig. 3.35(A) are supposed to be arise
from Ti cations. This is explained in the following together with the origin of the fourfold
bright spots in Fig. 3.34(B) (to the knowledge of the author, the detail structure of an oxygen
vacancy at this resolution has never been reported). These bright spots refer to the four
oxygen atoms which are marked in Fig. 3.36 by four crosses. The measured distance along the
direction fits quite well with that from the atomic distance in Fig. 3.36. As the tunneling
current was decreased to 18 nA, the distance between the tip and the four oxygen anions
became larger, and the latter are imaged as two bright bars. When assuming that the bridging
oxygen were imaged as bright rows, then, an oxygen vacancy should appear as a hole on the
]011[−

CHAPTER 3 Preparation and characterization of titania thin film on Ru(0001) 81
bright rows, which in fact, is not the case. This is a strong argument for the first interpretation
with the Ti cations being imaged. When looking into the structures in between the bright rows
in Fig. 3.35(A), some bright spots can be imaged also. By comparison to the atomic model in
Fig. 3.36, they can be attributed to the oxygen atoms residing along the direction in ]011[−
AA AA
Figure 3.36: Schematic drawing of the TiO2(110) surface [136]: top view (top) and side view (bottom). Also indicated were single and double bridging oxygen vacancies.
between the fivefold Ti rows, as marked by “A” in Fig.3.36. Recent theoretical studies [137]
have shown that, when the vacuum gap is very small, O atoms may also be resolved due to
additional topography contrast. Note that the exponentially decreasing tails of the oxygen
wave functions were shown to contribute significantly to the tunneling current at small tip-
surface distances [102,138,139]. Thus, it can be concluded that the bright rows in the STM
images along [001] direction are fivefold Ti, what is in comparison with the literature.
CHAPTER 3 Preparation and characterization of titania thin film on Ru(0001) 82
3.3 Conclusions The preparation of titania films on Ru(0001), from submonolayer to 10 ML, was studied by
STM, XPS, AES and LEED. For coverages of less than 2 ML, the films are relatively flat and
consist of small triangular structural units. The oxidation states are a mixture of Ti4+ and Ti3+,
indicating that the phase does not correspond to a stoichiometric TiO2 layer.
The structure and composition of the films changed considerably upon annealing to
higher temperatures, 900 K and 1000 K. Flash annealing to 1000 K in UHV leads to an
ordered triangle structure and zig-zag structures. Flash annealing to 1000 K in O2 leads to an
increase of the oxygen content. Furthermore, it causes the triangular structure to disappear and
leads to imperfect coincidence structure (Moiré pattern). This structure can be explained by a
superposition of the Ru lattice with a non-rotated, hexagonal overlayer with a atomic lattice
constant of 0.3 nm. A model for the overlayer is proposed, which includes two close packed
oxygen layers with a Ti layer in the octahedral holes in between.
The growth mode of the rutile TiO2 thin film on Ru(0001) at 1000 K in O2 was proven to
be layer-plus-islands (Stranski-Krastanov) mode. Thermal stability studies showed that the
oxidation state and surface structure of TiO2 films up to 10 ML are very sensitive to the
treatment after deposition and the specific conditions, e.g., the O2 pressure, the annealing
temperature and time for reactive annealing in an O2 atmosphere. Fully oxidized and ordered
rutile TiO2 films with (110)-(1×1) surface structure were prepared reproducibly on Ru(0001).
CHAPTER 4 Au supported on TiO2 thin film studied by STM, XPS and CO-TPD 83
CHAPTER 4 Au supported on TiO2 thin film studied by STM, XPS and
CO-TPD
This chapter concentrates on the deposition of Au on TiO2(110)/Ru and the characterization
of the Au particles formed in this process. The height distribution and shape of Au particles at
different Au-coverages with and without post-annealing after deposition were investigated by
STM. X-ray photoelectron spectroscopy was used to characterize the electronic properties of
the supported Au particles at different coverages supported. In addition, CO-TPD was used to
characterize the interaction of CO with the surface of TiO2(110) film supported on Ru(0001)
and with Au/ TiO2(110)/Ru(0001).

CHAPTER 4 Au supported on TiO2 thin film studied by STM, XPS and CO-TPD 84
4.1 Introduction
As a noble metal, gold has some unique chemical properties. For example, gold has a high
cohesive energy and exhibits the highest electronegativity of all metals. Its electron affinity is
larger than that of oxygen (that is why gold does not react directly with other electronegative
elements such as sulfur or oxygen [140]). Gold also has a unique ability to interact with itself,
known as aurophilic bonding, which allows for the formation of superstructures of gold
containing molecules [141]. All of these unique properties originate from its atomic and
electronic structure. Due to the large size of its nucleus, relativistic effects become critically
important to an evaluation of gold chemistry [133-137].
It has been known that relativistic effects are indeed of importance in the chemistry of the
heavier elements. For atoms with an atomic number larger than 50, the 1s electrons are
sufficiently influenced by the nuclear mass that their speed approaches that of light and their
mass increases. The innermost s orbital therefore contracts, and the outer s shells also shrink.
Electrons in p orbitals are also affected to some extent, but those in d and f orbitals less,
because their probability of being close to the nucleus is low. The d and f electrons are,
however, better screened because of the relative contractions of the s and p shells, and their
orbitals, therefore, increase in energy and expand radially. The so-called ‘‘relativistic
contraction’’ of the 6s orbital (i.e., rrel/rnonrel ) becomes greater when moving across the Third
Transition Series and is largest for gold. For the next elements (Pt), where the 6p electron
shell is filled, the effect becomes less marked [140]. The net effect of the relativity factor is
therefore to add to the ‘lanthanide contraction’. A second effect is the strengthen of binding of
the 6s electron, accounting for the high electronegativity and nobility of gold [140].
Relativistic effects are therefore critically important to understand the chemistry of gold [142-
144]. Hence, in an indirect way relativistic effects are also responsible for the catalytic
properties of gold [140].
The surfaces of a gold crystal are inert even towards reactive gases such as H2 or O2. In
gold the filled d-band gives rise to repulsion when an adsorbate such as H2 comes in contact
with the surface due to filling of the anti-bonding orbital. Second, the degree of orbital
overlap with the adsorbates is very high for gold as compared to silver or copper. This results
in a large energy cost for orthogonalization and thus makes the adsorptive character of gold
also unique [145]. Further studies on CO, O2 chemisorption on Au [48] found that, in general,
CHAPTER 4 Au supported on TiO2 thin film studied by STM, XPS and CO-TPD 85
the adsorption is very weak and always occurs on step edges or on rough areas of the surface,
and not on the terraces. The latter finding is one of the reasons why generally adsorption of
molecules is stronger on smaller Au particles, which have a higher density of steps.
Analogously to other metals, when the size of metal particles is less than 2-3 nm, there are
several properties that distinguish them from the corresponding bulk material [146,147]. If the
particles are supported on oxides, they can exhibit even further different characteristics as
compared with the bulk materials, because the support can have a considerable influence on
them [148].
In this chapter, we bridge the “material gap” in catalysis studies by fabricating a model
catalyst. The catalyst was prepared by thermal evaporation of Au on TiO2(110)-(1×1) film on
Ru(0001) at room temperature. The preparation of the TiO2 support film has been described in
detail in the previous chapter. After characterizing the model system with STM and XPS, the
interaction of CO with the surface of the catalyst is studied using CO-TPD. The goal of the
studies in this chapter is to characterize the TiO2 supported Au particles (growth and
properties).
4.2 Au supported on TiO2 studied by STM and XPS 4.2.1 Previous studies An understanding of metal particles supported on solid substrates is important in
heterogeneous catalysis [149,150]. The morphology, thermal stability, metal-support
interaction and chemical reactivity of metal particles have been studied extensively and
reviewed by Goodman’s [151] and Madey’s group [68] and recently by Freund et al.[48]. The
size-dependent electronic structure of metal particles was also investigated by many other
groups [147,152-156].
It was found earlier that Au particles start to nucleate at bridging oxygen vacancies on the
rutile TiO2(110) surface, which can be observed at 130 K. At Au coverages of less than 0.15
ML and at 300 K, Au monomers are mobile on the surface of titania and form islands which
are several atomic layers high depending on the coverage. Under these circumstances steps on
the substrate are preferential sites for nucleation and growth [157]. Hence, the nucleation sites
for Au on TiO2(110) depends strongly on the Au coverage and temperature of the substrate.
One should also note that the concept of energy minimization in principle only holds in
thermodynamic equilibrium and that the appearance of the growth modes may be limited by
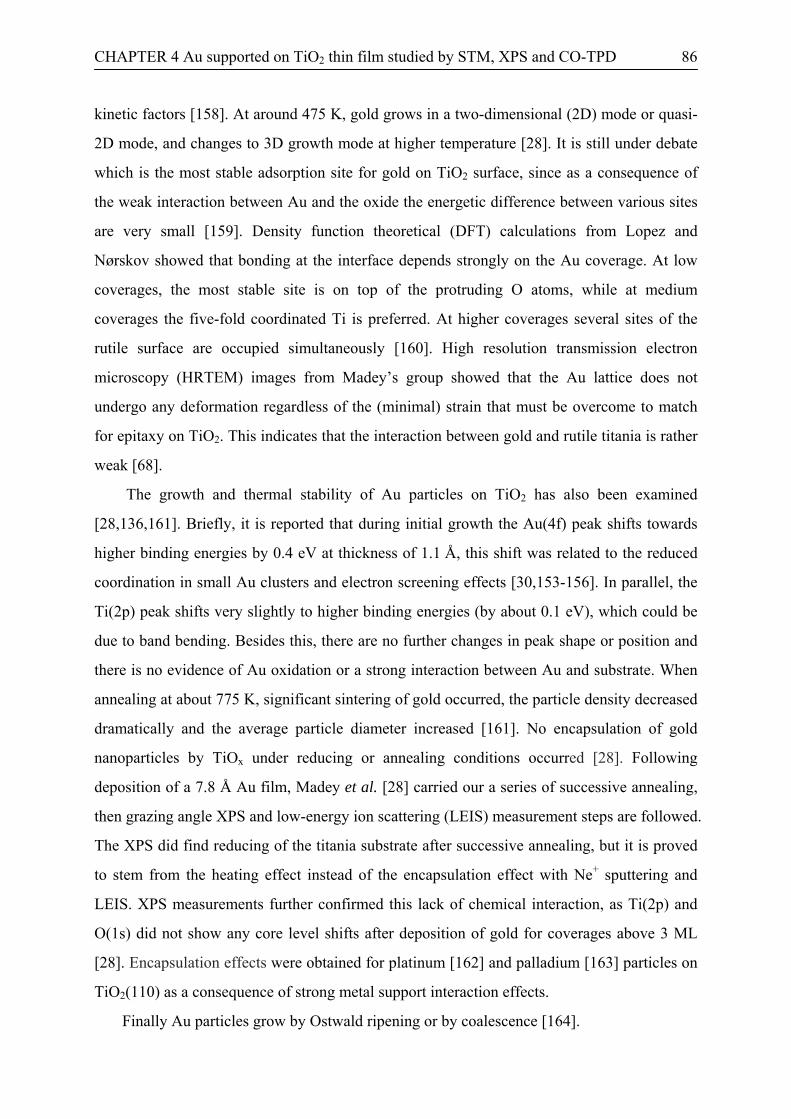
CHAPTER 4 Au supported on TiO2 thin film studied by STM, XPS and CO-TPD 86
kinetic factors [158]. At around 475 K, gold grows in a two-dimensional (2D) mode or quasi-
2D mode, and changes to 3D growth mode at higher temperature [28]. It is still under debate
which is the most stable adsorption site for gold on TiO2 surface, since as a consequence of
the weak interaction between Au and the oxide the energetic difference between various sites
are very small [159]. Density function theoretical (DFT) calculations from Lopez and
Nørskov showed that bonding at the interface depends strongly on the Au coverage. At low
coverages, the most stable site is on top of the protruding O atoms, while at medium
coverages the five-fold coordinated Ti is preferred. At higher coverages several sites of the
rutile surface are occupied simultaneously [160]. High resolution transmission electron
microscopy (HRTEM) images from Madey’s group showed that the Au lattice does not
undergo any deformation regardless of the (minimal) strain that must be overcome to match
for epitaxy on TiO2. This indicates that the interaction between gold and rutile titania is rather
weak [68].
The growth and thermal stability of Au particles on TiO2 has also been examined
[28,136,161]. Briefly, it is reported that during initial growth the Au(4f) peak shifts towards
higher binding energies by 0.4 eV at thickness of 1.1 Å, this shift was related to the reduced
coordination in small Au clusters and electron screening effects [30,153-156]. In parallel, the
Ti(2p) peak shifts very slightly to higher binding energies (by about 0.1 eV), which could be
due to band bending. Besides this, there are no further changes in peak shape or position and
there is no evidence of Au oxidation or a strong interaction between Au and substrate. When
annealing at about 775 K, significant sintering of gold occurred, the particle density decreased
dramatically and the average particle diameter increased [161]. No encapsulation of gold
nanoparticles by TiOx under reducing or annealing conditions occurred [28]. Following
deposition of a 7.8 Å Au film, Madey et al. [28] carried our a series of successive annealing,
then grazing angle XPS and low-energy ion scattering (LEIS) measurement steps are followed.
The XPS did find reducing of the titania substrate after successive annealing, but it is proved
to stem from the heating effect instead of the encapsulation effect with Ne+ sputtering and
LEIS. XPS measurements further confirmed this lack of chemical interaction, as Ti(2p) and
O(1s) did not show any core level shifts after deposition of gold for coverages above 3 ML
[28]. Encapsulation effects were obtained for platinum [162] and palladium [163] particles on
TiO2(110) as a consequence of strong metal support interaction effects.
Finally Au particles grow by Ostwald ripening or by coalescence [164].
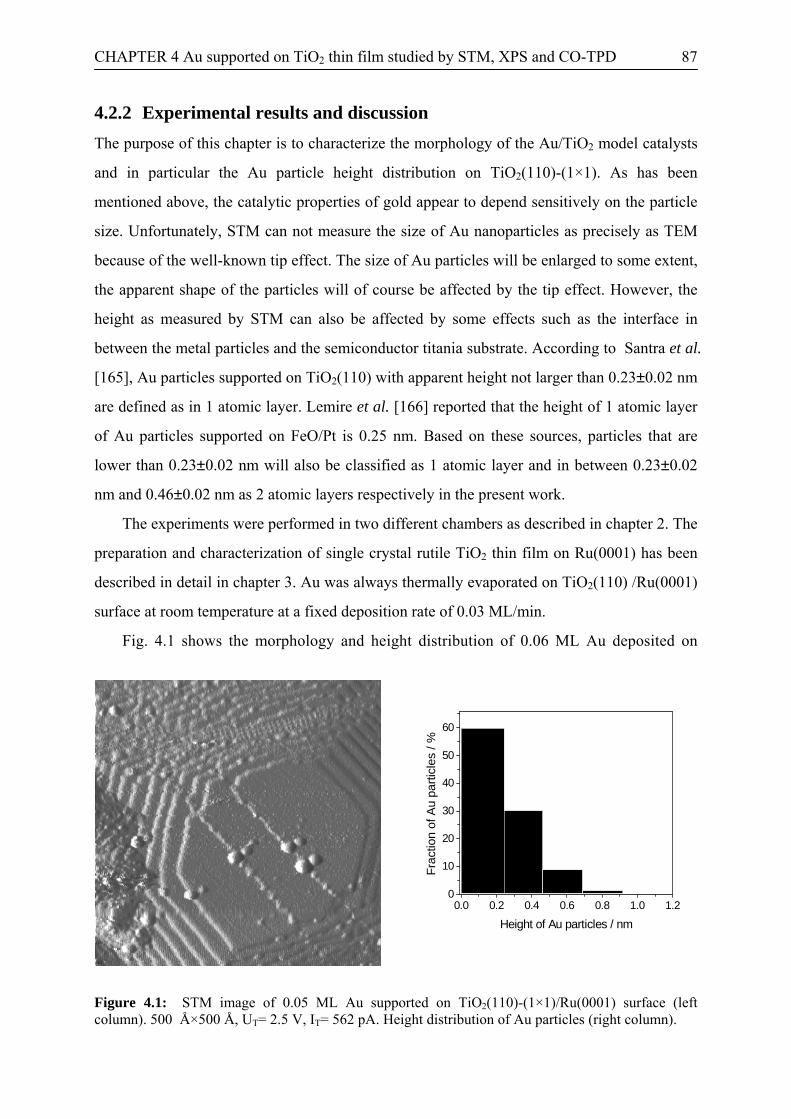
CHAPTER 4 Au supported on TiO2 thin film studied by STM, XPS and CO-TPD 87
4.2.2 Experimental results and discussion The purpose of this chapter is to characterize the morphology of the Au/TiO2 model catalysts
and in particular the Au particle height distribution on TiO2(110)-(1×1). As has been
mentioned above, the catalytic properties of gold appear to depend sensitively on the particle
size. Unfortunately, STM can not measure the size of Au nanoparticles as precisely as TEM
because of the well-known tip effect. The size of Au particles will be enlarged to some extent,
the apparent shape of the particles will of course be affected by the tip effect. However, the
height as measured by STM can also be affected by some effects such as the interface in
between the metal particles and the semiconductor titania substrate. According to Santra et al.
[165], Au particles supported on TiO2(110) with apparent height not larger than 0.23±0.02 nm
are defined as in 1 atomic layer. Lemire et al. [166] reported that the height of 1 atomic layer
of Au particles supported on FeO/Pt is 0.25 nm. Based on these sources, particles that are
lower than 0.23±0.02 nm will also be classified as 1 atomic layer and in between 0.23±0.02
nm and 0.46±0.02 nm as 2 atomic layers respectively in the present work.
The experiments were performed in two different chambers as described in chapter 2. The
preparation and characterization of single crystal rutile TiO2 thin film on Ru(0001) has been
described in detail in chapter 3. Au was always thermally evaporated on TiO2(110) /Ru(0001)
surface at room temperature at a fixed deposition rate of 0.03 ML/min.
Fig. 4.1 shows the morphology and height distribution of 0.06 ML Au deposited on
0.0 0.2 0.4 0.6 0.8 1.0 1.20
10
20
30
40
50
60
Frac
tion
of A
u pa
rticl
es /
%
Height of Au particles / nm
Figure 4.1: STM image of 0.05 ML Au supported on TiO2(110)-(1×1)/Ru(0001) surface (left column). 500 Å×500 Å, UT= 2.5 V, IT= 562 pA. Height distribution of Au particles (right column).

CHAPTER 4 Au supported on TiO2 thin film studied by STM, XPS and CO-TPD 88
TiO2(110)-(1×1) thin film at 300 K. The TiO2 substrate is ordered but has a high density of
step edges, which are decorated by Au particles. The particle density is lower on terraces than
at the edges. Au 3D (0.8 nm high, ~2.4 nm in diameter) particles on the edges and 2D (0.3 nm
high, ~1.2 nm in diameter) particles on the terraces can be seen. Most of the particles have
nucleated at the edges, while only a small part nucleated on the terraces, consistent with
previous studies [157,167,168].
The corresponding morphologies for coverages of 0.1 ML, 0.3 ML and 0.6 ML are
shown in Figs. 4.2, 4.3 and 4.4. From these data it can be seen that most of the Au particles
0.0 0.2 0.4 0.6 0.8 1.0 1.20
10
20
30
40
50
60
Frac
tion
of A
u pa
rticl
es /
%
Height / nm
Figure 4.2: STM image of 0.1 ML Au supported on TiO2(110)-(1×1)/Ru(0001) surface (left column). 500 Å×500 Å, UT= 2.5 V, IT= 562 pA. Height distribution of Au particles (right column).
0.0 0.2 0.4 0.6 0.8 1.0 1.20
10
20
30
40
50
60
Frac
tion
of A
u pa
rticl
es /
%
Height / nm
Figure 4.3: STM image of 0.3 ML Au supported on TiO2(110)-(1×1)/Ru(0001) surface (left column). 500 Å×500 Å, UT= 2.5 V, IT= 562 pA. Height distribution of Au particles (right column).
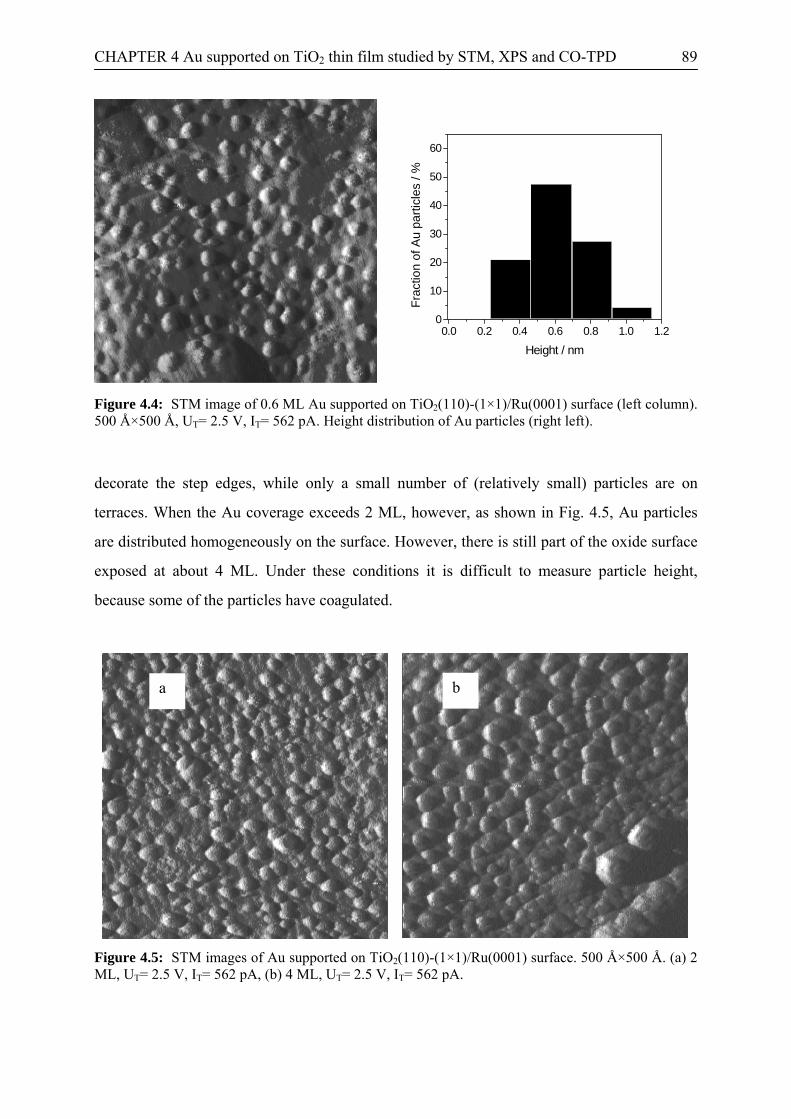
CHAPTER 4 Au supported on TiO2 thin film studied by STM, XPS and CO-TPD 89
0.0 0.2 0.4 0.6 0.8 1.0 1.20
10
20
30
40
50
60
Frac
tion
of A
u pa
rticl
es /
%
Height / nm
Figure 4.4: STM image of 0.6 ML Au supported on TiO2(110)-(1×1)/Ru(0001) surface (left column). 500 Å×500 Å, UT= 2.5 V, IT= 562 pA. Height distribution of Au particles (right left).
decorate the step edges, while only a small number of (relatively small) particles are on
terraces. When the Au coverage exceeds 2 ML, however, as shown in Fig. 4.5, Au particles
are distributed homogeneously on the surface. However, there is still part of the oxide surface
exposed at about 4 ML. Under these conditions it is difficult to measure particle height,
because some of the particles have coagulated.
b a
Figure 4.5: STM images of Au supported on TiO2(110)-(1×1)/Ru(0001) surface. 500 Å×500 Å. (a) 2 ML, UT= 2.5 V, IT= 562 pA, (b) 4 ML, UT= 2.5 V, IT= 562 pA.
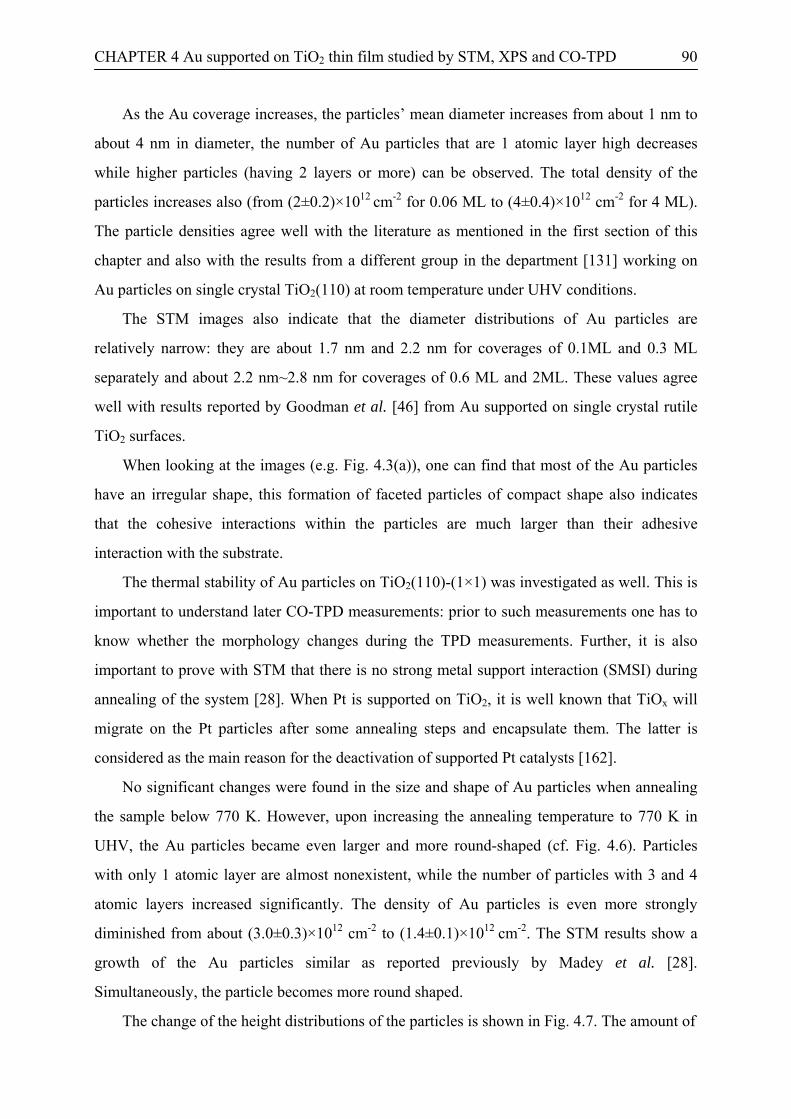
CHAPTER 4 Au supported on TiO2 thin film studied by STM, XPS and CO-TPD 90
As the Au coverage increases, the particles’ mean diameter increases from about 1 nm to
about 4 nm in diameter, the number of Au particles that are 1 atomic layer high decreases
while higher particles (having 2 layers or more) can be observed. The total density of the
particles increases also (from (2±0.2)×1012 cm-2 for 0.06 ML to (4±0.4)×1012 cm-2 for 4 ML).
The particle densities agree well with the literature as mentioned in the first section of this
chapter and also with the results from a different group in the department [131] working on
Au particles on single crystal TiO2(110) at room temperature under UHV conditions.
The STM images also indicate that the diameter distributions of Au particles are
relatively narrow: they are about 1.7 nm and 2.2 nm for coverages of 0.1ML and 0.3 ML
separately and about 2.2 nm~2.8 nm for coverages of 0.6 ML and 2ML. These values agree
well with results reported by Goodman et al. [46] from Au supported on single crystal rutile
TiO2 surfaces.
When looking at the images (e.g. Fig. 4.3(a)), one can find that most of the Au particles
have an irregular shape, this formation of faceted particles of compact shape also indicates
that the cohesive interactions within the particles are much larger than their adhesive
interaction with the substrate.
The thermal stability of Au particles on TiO2(110)-(1×1) was investigated as well. This is
important to understand later CO-TPD measurements: prior to such measurements one has to
know whether the morphology changes during the TPD measurements. Further, it is also
important to prove with STM that there is no strong metal support interaction (SMSI) during
annealing of the system [28]. When Pt is supported on TiO2, it is well known that TiOx will
migrate on the Pt particles after some annealing steps and encapsulate them. The latter is
considered as the main reason for the deactivation of supported Pt catalysts [162].
No significant changes were found in the size and shape of Au particles when annealing
the sample below 770 K. However, upon increasing the annealing temperature to 770 K in
UHV, the Au particles became even larger and more round-shaped (cf. Fig. 4.6). Particles
with only 1 atomic layer are almost nonexistent, while the number of particles with 3 and 4
atomic layers increased significantly. The density of Au particles is even more strongly
diminished from about (3.0±0.3)×1012 cm-2 to (1.4±0.1)×1012 cm-2. The STM results show a
growth of the Au particles similar as reported previously by Madey et al. [28].
Simultaneously, the particle becomes more round shaped.
The change of the height distributions of the particles is shown in Fig. 4.7. The amount of
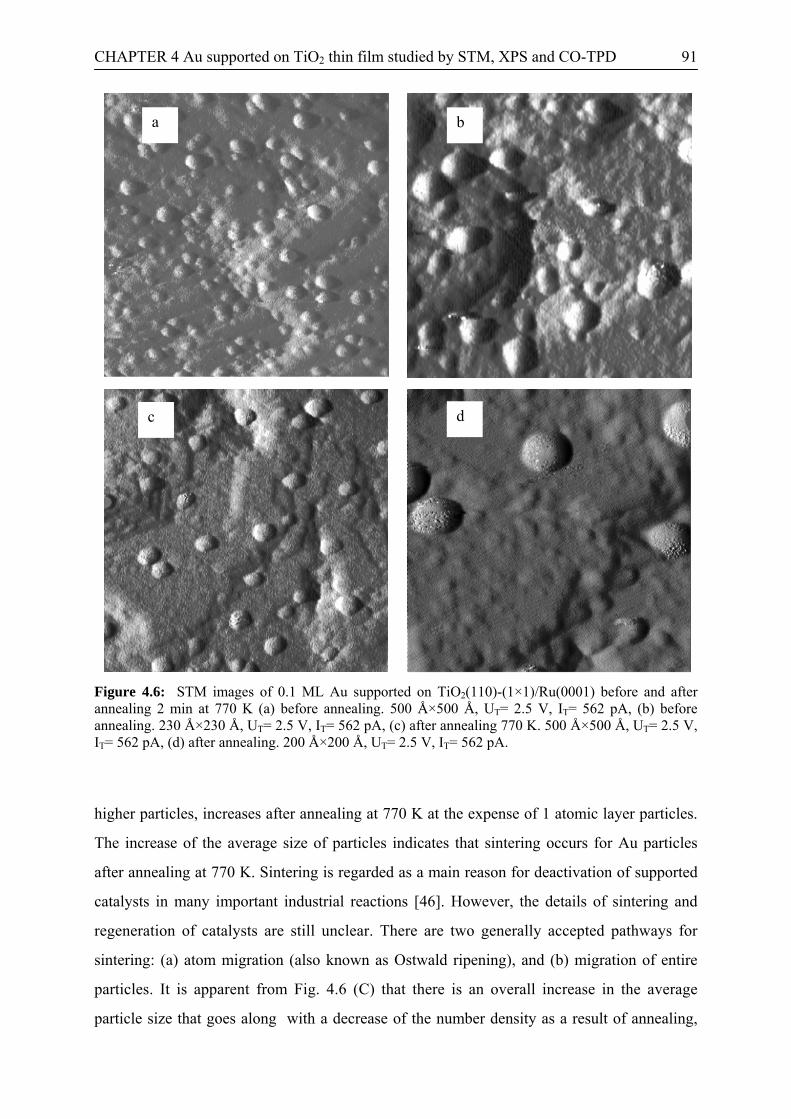
CHAPTER 4 Au supported on TiO2 thin film studied by STM, XPS and CO-TPD 91
a b
d c
Figure 4.6: STM images of 0.1 ML Au supported on TiO2(110)-(1×1)/Ru(0001) before and after annealing 2 min at 770 K (a) before annealing. 500 Å×500 Å, UT= 2.5 V, IT= 562 pA, (b) before annealing. 230 Å×230 Å, UT= 2.5 V, IT= 562 pA, (c) after annealing 770 K. 500 Å×500 Å, UT= 2.5 V, IT= 562 pA, (d) after annealing. 200 Å×200 Å, UT= 2.5 V, IT= 562 pA.
higher particles, increases after annealing at 770 K at the expense of 1 atomic layer particles.
The increase of the average size of particles indicates that sintering occurs for Au particles
after annealing at 770 K. Sintering is regarded as a main reason for deactivation of supported
catalysts in many important industrial reactions [46]. However, the details of sintering and
regeneration of catalysts are still unclear. There are two generally accepted pathways for
sintering: (a) atom migration (also known as Ostwald ripening), and (b) migration of entire
particles. It is apparent from Fig. 4.6 (C) that there is an overall increase in the average
particle size that goes along with a decrease of the number density as a result of annealing,
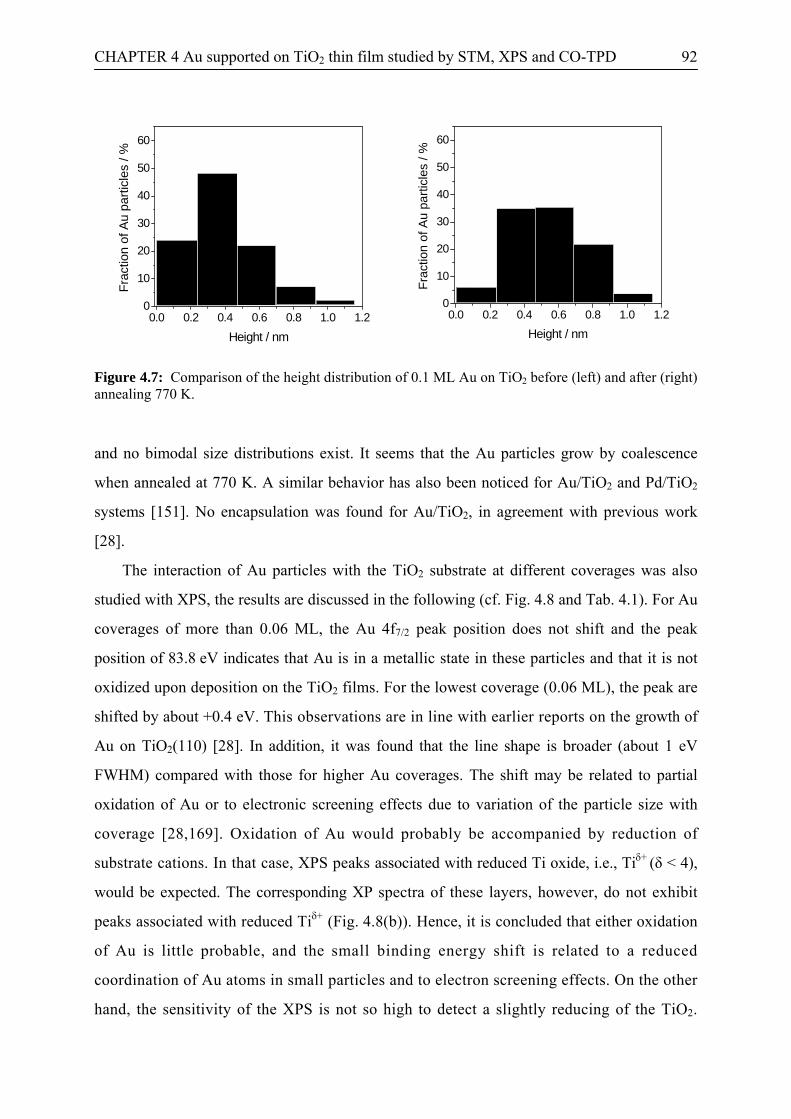
CHAPTER 4 Au supported on TiO2 thin film studied by STM, XPS and CO-TPD 92
0.0 0.2 0.4 0.6 0.8 1.0 1.20
10
20
30
40
50
60
Fr
actio
n of
Au
parti
cles
/ %
Height / nm
0.0 0.2 0.4 0.6 0.8 1.0 1.20
10
20
30
40
50
60
Frac
tion
of A
u pa
rticl
es /
%
Height / nm
Figure 4.7: Comparison of the height distribution of 0.1 ML Au on TiO2 before (left) and after (right) annealing 770 K.
and no bimodal size distributions exist. It seems that the Au particles grow by coalescence
when annealed at 770 K. A similar behavior has also been noticed for Au/TiO2 and Pd/TiO2
systems [151]. No encapsulation was found for Au/TiO2, in agreement with previous work
[28].
The interaction of Au particles with the TiO2 substrate at different coverages was also
studied with XPS, the results are discussed in the following (cf. Fig. 4.8 and Tab. 4.1). For Au
coverages of more than 0.06 ML, the Au 4f peak position does not shift and the peak
position of 83.8 eV indicates
7/2
that Au is in a metallic state in these particles and that it is not
oxidized upon deposition on the TiO2 films. For the lowest coverage (0.06 ML), the peak are
shifted by about +0.4 eV. This observations are in line with earlier reports on the growth of
Au on TiO (110) 2 [28]. In addition, it was found that the line shape is broader (about 1 eV
FWHM) compared with those for higher Au coverages. The shift may be related to partial
oxidation of Au or to electronic screening effects due to variation of the particle size with
coverage [28,169]. Oxidation of Au would probably be accompanied by reduction of
substrate cations. In that case, XPS peaks associated with reduced Ti oxide, i.e., Ti (δ < 4),
would be expected. The corresponding XP
δ+
spectra of these layers, however, do not exhibit
peaks associated with reduced Tiδ+ (Fig. 4.8(b)). Hence, it is concluded that either oxidation
of Au is little probable, and the small binding energy shift is related to a reduced
coordination of Au atoms in small particles and to electron screening effects. On the other
hand, the sensitivity of the XPS is not so high to detect a slightly reducing of the TiO2.
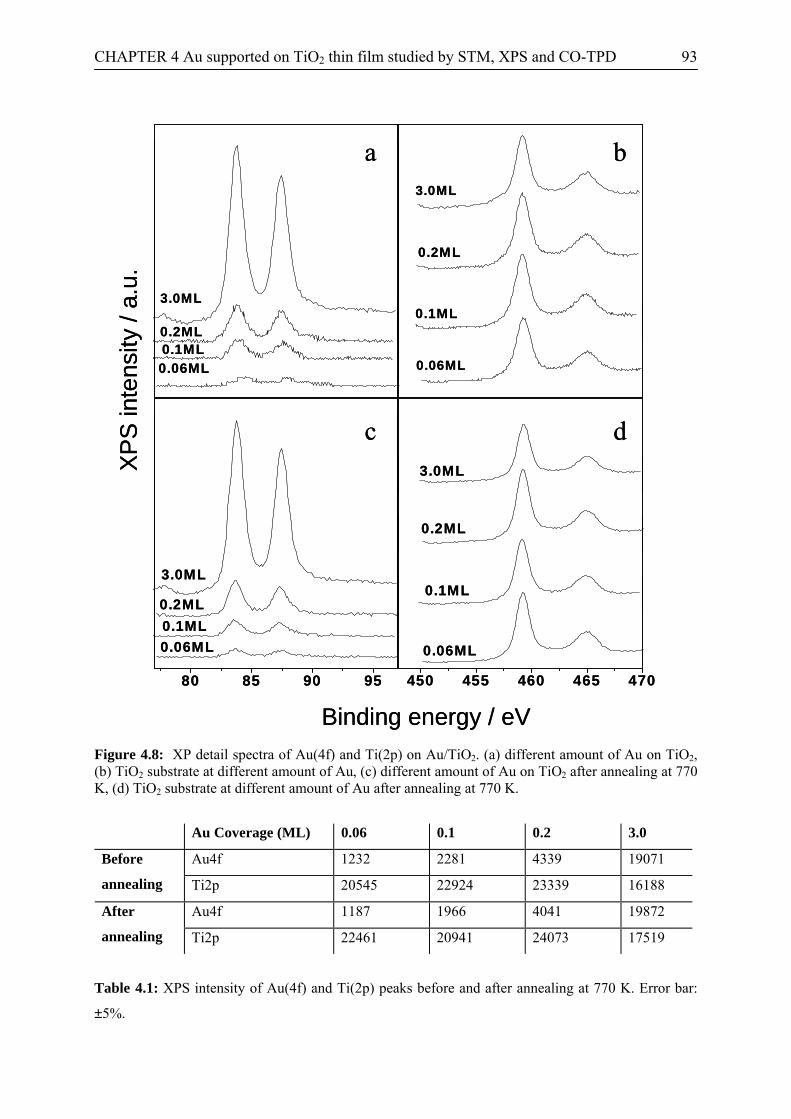
CHAPTER 4 Au supported on TiO2 thin film studied by STM, XPS and CO-TPD 93
0.06ML
0.1ML
0.2ML
3.0ML
0.06ML
0.1ML
0.2ML
3.0ML
80 85 90 95
0.06ML
0.1ML
0.2ML
3.0ML
450 455 460 465 470
0.06ML
0.1ML
0.2ML
3.0ML
a
c
b
d
XP
S in
tens
ity/ a
.u.
Binding energy / eV
0.06ML
0.1ML
0.2ML
3.0ML
0.06ML
0.1ML
0.2ML
3.0ML
80 85 90 95
0.06ML
0.1ML
0.2ML
3.0ML
450 455 460 465 470
0.06ML
0.1ML
0.2ML
3.0ML
a
c
b
d
XP
S in
tens
ity/ a
.u.
Binding energy / eV
Figure 4.8: XP detail spectra of Au(4f) and Ti(2p) on Au/TiO2. (a) different amount of Au on TiO2, (b) TiO2 substrate at different amount of Au, (c) different amount of Au on TiO2 after annealing at 770 K, (d) TiO2 substrate at different amount of Au after annealing at 770 K.
Au Coverage (ML) 0.06 0.1 0.2 3.0
Au4f 1232 2281 4339 19071 Before
annealing Ti2p 20545 22924 23339 16188
Au4f 1187 1966 4041 19872 After
annealing Ti2p 22461 20941 24073 17519
Table 4.1: XPS intensity of Au(4f) and Ti(2p) peaks before and after annealing at 770 K. Error bar:
±5%.
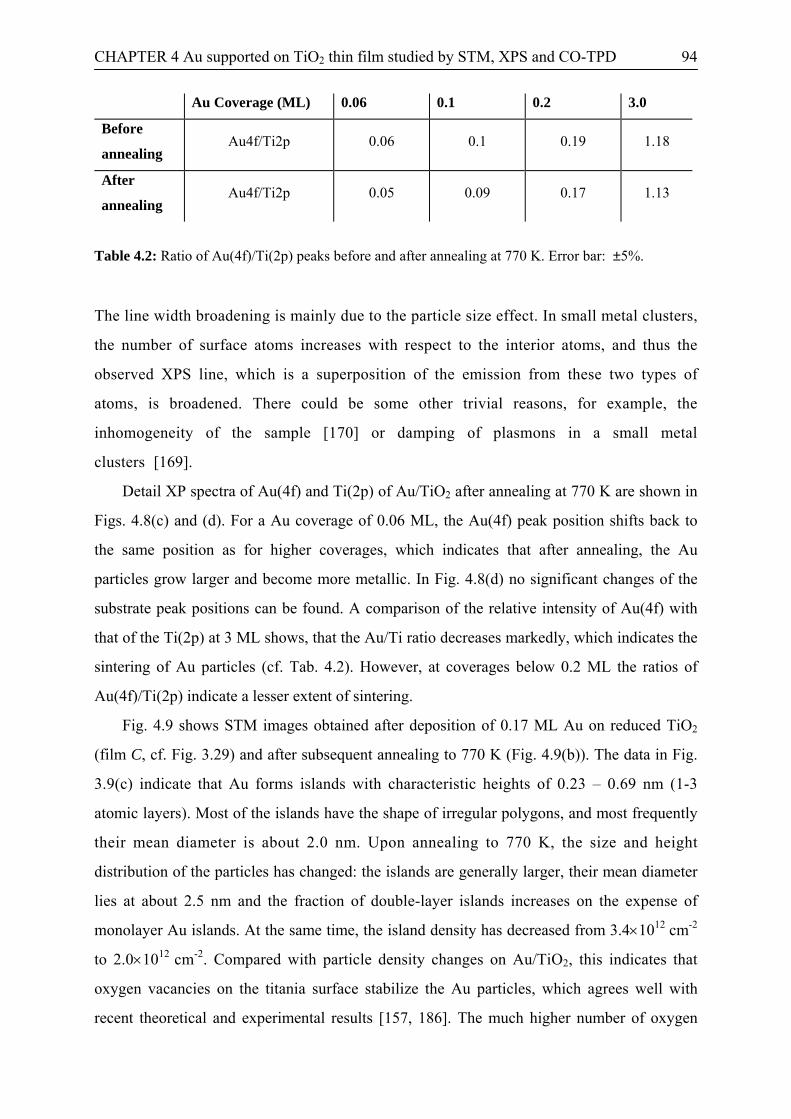
CHAPTER 4 Au supported on TiO2 thin film studied by STM, XPS and CO-TPD 94
Au Coverage (ML) 0.06 0.1 0.2 3.0
Before
annealing Au4f/Ti2p 0.06 0.1 0.19 1.18
After
annealing Au4f/Ti2p 0.05 0.09 0.17 1.13
Table 4.2: Ratio of Au(4f)/Ti(2p) peaks before and after annealing at 770 K. Error bar: ±5%.
The line width broadening is mainly due to the particle size effect. In small metal clusters,
the number of surface atoms increases with respect to the interior atoms, and thus the
observed XPS line, which is a superposition of the emission from these two types of
atoms, is broadened. There could be some other trivial reasons, for example, the
inhomogeneity of the sample [170] or damping of plasmons in a small metal
clusters [169].
Detail XP spectra of Au(4f) and Ti(2p) of Au/TiO2 after annealing at 770 K are shown in
Figs. 4.8(c) and (d). For a Au coverage of 0.06 ML, the Au(4f) peak position shifts back to
the same position as for higher coverages, which indicates that after annealing, the Au
particles grow larger and become more metallic. In Fig. 4.8(d) no significant changes of the
substrate peak positions can be found. A comparison of the relative intensity of Au(4f) with
that of the Ti(2p) at 3 ML shows, that the Au/Ti ratio decreases markedly, which indicates the
sintering of Au particles (cf. Tab. 4.2). However, at coverages below 0.2 ML the ratios of
Au(4f)/Ti(2p) indicate a lesser extent of sintering.
Fig. 4.9 shows STM images obtained after deposition of 0.17 ML Au on reduced TiO2
(film C, cf. Fig. 3.29) and after subsequent annealing to 770 K (Fig. 4.9(b)). The data in Fig.
3.9(c) indicate that Au forms islands with characteristic heights of 0.23 – 0.69 nm (1-3
atomic layers). Most of the islands have the shape of irregular polygons, and most frequently
their mean diameter is about 2.0 nm. Upon annealing to 770 K, the size and height
distribution of the particles has changed: the islands are generally larger, their mean diameter
lies at about 2.5 nm and the fraction of double-layer islands increases on the expense of
monolayer Au islands. At the same time, the island density has decreased from 3.4×1012 cm-2
to 2.0×1012 cm-2. Compared with particle density changes on Au/TiO2, this indicates that
oxygen vacancies on the titania surface stabilize the Au particles, which agrees well with
recent theoretical and experimental results [157, 186]. The much higher number of oxygen
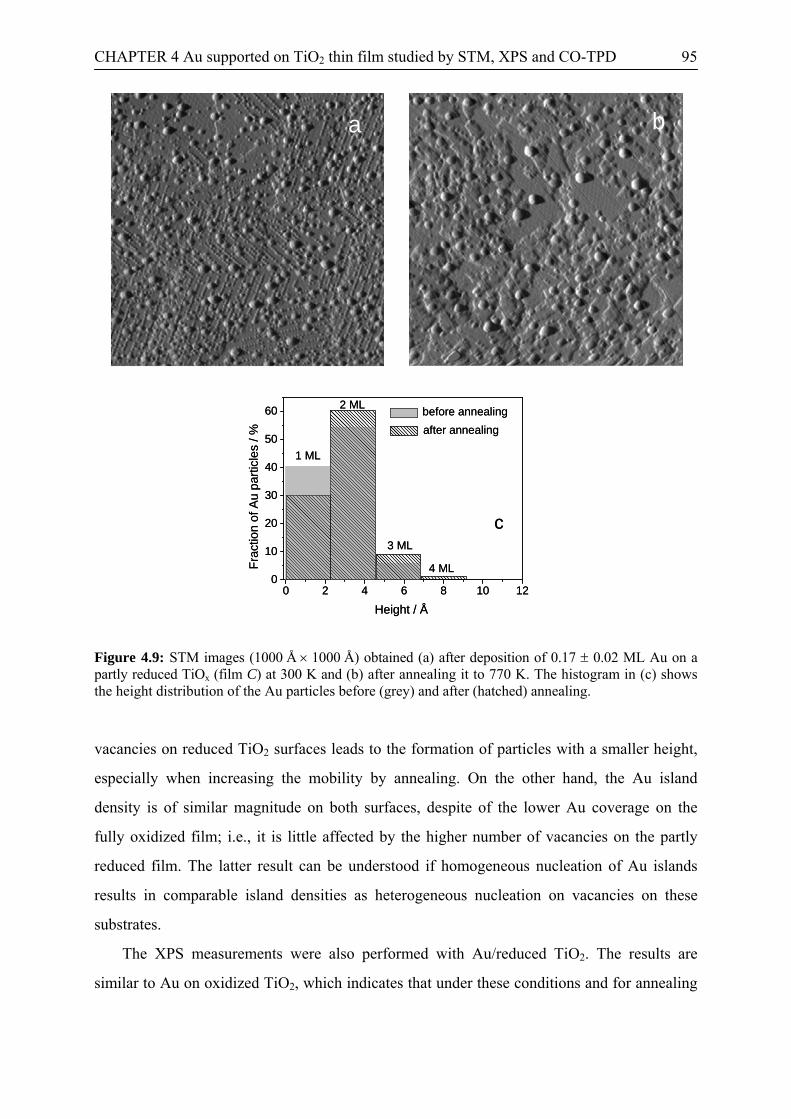
CHAPTER 4 Au supported on TiO2 thin film studied by STM, XPS and CO-TPD 95
aa
bb
0 2 4 6 8 10 120
10
20
30
40
50
60
4 ML
3 ML
2 ML
after annealing
Frac
tion
of A
u pa
rticl
es /
%
Height / Å
before annealing
1 ML
c
0 2 4 6 8 10 120
10
20
30
40
50
60
4 ML
3 ML
2 ML
after annealing
Frac
tion
of A
u pa
rticl
es /
%
Height / Å
before annealing
1 ML
c
Figure 4.9: STM images (1000 Å × 1000 Å) obtained (a) after deposition of 0.17 ± 0.02 ML Au on a partly reduced TiOx (film C) at 300 K and (b) after annealing it to 770 K. The histogram in (c) shows the height distribution of the Au particles before (grey) and after (hatched) annealing.
vacancies on reduced TiO2 surfaces leads to the formation of particles with a smaller height,
especially when increasing the mobility by annealing. On the other hand, the Au island
density is of similar magnitude on both surfaces, despite of the lower Au coverage on the
fully oxidized film; i.e., it is little affected by the higher number of vacancies on the partly
reduced film. The latter result can be understood if homogeneous nucleation of Au islands
results in comparable island densities as heterogeneous nucleation on vacancies on these
substrates.
The XPS measurements were also performed with Au/reduced TiO2. The results are
similar to Au on oxidized TiO2, which indicates that under these conditions and for annealing
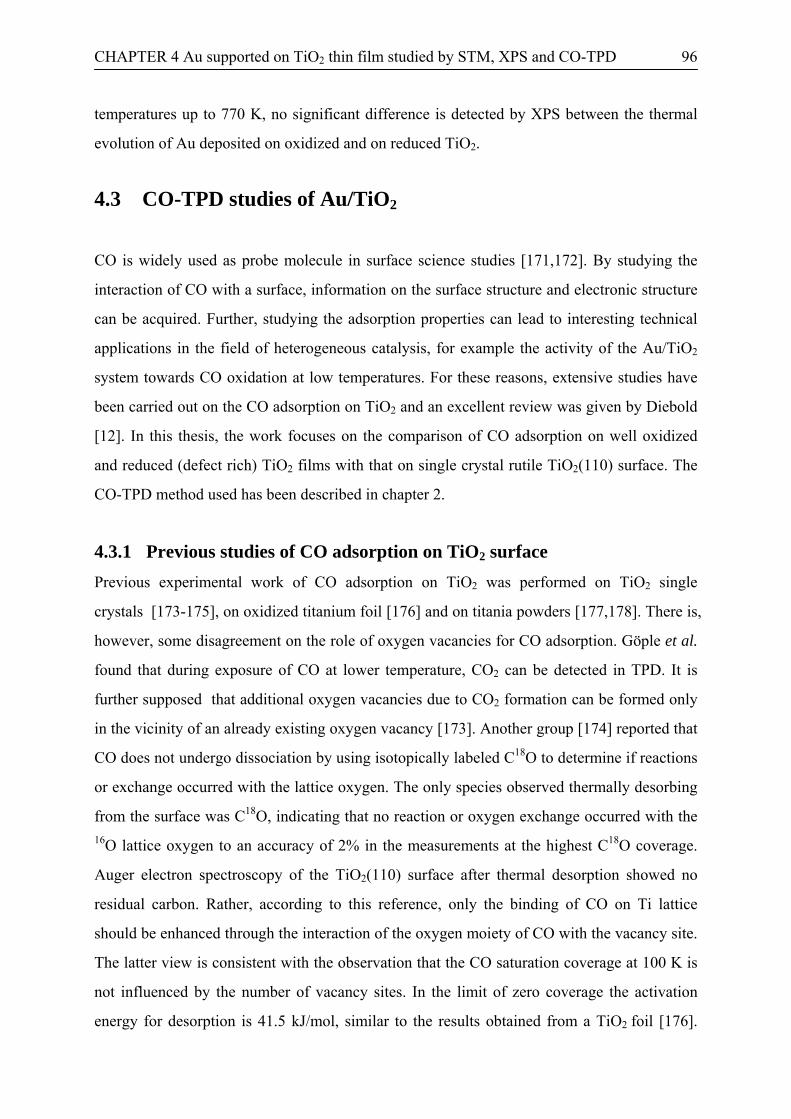
CHAPTER 4 Au supported on TiO2 thin film studied by STM, XPS and CO-TPD 96
temperatures up to 770 K, no significant difference is detected by XPS between the thermal
evolution of Au deposited on oxidized and on reduced TiO2.
4.3 CO-TPD studies of Au/TiO2
CO is widely used as probe molecule in surface science studies [171,172]. By studying the
interaction of CO with a surface, information on the surface structure and electronic structure
can be acquired. Further, studying the adsorption properties can lead to interesting technical
applications in the field of heterogeneous catalysis, for example the activity of the Au/TiO2
system towards CO oxidation at low temperatures. For these reasons, extensive studies have
been carried out on the CO adsorption on TiO2 and an excellent review was given by Diebold
[12]. In this thesis, the work focuses on the comparison of CO adsorption on well oxidized
and reduced (defect rich) TiO2 films with that on single crystal rutile TiO2(110) surface. The
CO-TPD method used has been described in chapter 2.
4.3.1 Previous studies of CO adsorption on TiO2 surface Previous experimental work of CO adsorption on TiO2 was performed on TiO2 single
crystals [173-175], on oxidized titanium foil [176] and on titania powders [177,178]. There is,
however, some disagreement on the role of oxygen vacancies for CO adsorption. Göple et al.
found that during exposure of CO at lower temperature, CO2 can be detected in TPD. It is
further supposed that additional oxygen vacancies due to CO2 formation can be formed only
in the vicinity of an already existing oxygen vacancy [173]. Another group [174] reported that
CO does not undergo dissociation by using isotopically labeled C18O to determine if reactions
or exchange occurred with the lattice oxygen. The only species observed thermally desorbing
from the surface was C18O, indicating that no reaction or oxygen exchange occurred with the 16O lattice oxygen to an accuracy of 2% in the measurements at the highest C18O coverage.
Auger electron spectroscopy of the TiO2(110) surface after thermal desorption showed no
residual carbon. Rather, according to this reference, only the binding of CO on Ti lattice
should be enhanced through the interaction of the oxygen moiety of CO with the vacancy site.
The latter view is consistent with the observation that the CO saturation coverage at 100 K is
not influenced by the number of vacancy sites. In the limit of zero coverage the activation
energy for desorption is 41.5 kJ/mol, similar to the results obtained from a TiO2 foil [176].
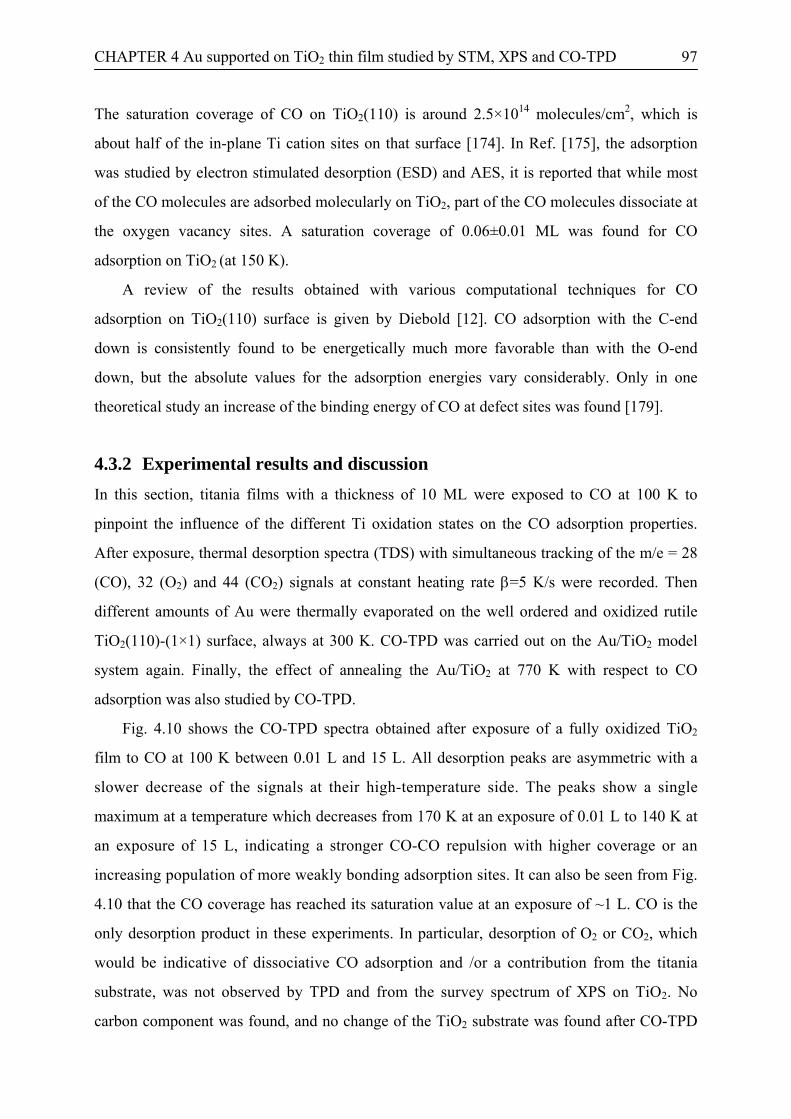
CHAPTER 4 Au supported on TiO2 thin film studied by STM, XPS and CO-TPD 97
The saturation coverage of CO on TiO2(110) is around 2.5×10¹⁴ molecules/cm2, which is
about half of the in-plane Ti cation sites on that surface [174]. In Ref. [175], the adsorption
was studied by electron stimulated desorption (ESD) and AES, it is reported that while most
of the CO molecules are adsorbed molecularly on TiO2, part of the CO molecules dissociate at
the oxygen vacancy sites. A saturation coverage of 0.06±0.01 ML was found for CO
adsorption on TiO2 (at 150 K).
A review of the results obtained with various computational techniques for CO
adsorption on TiO2(110) surface is given by Diebold [12]. CO adsorption with the C-end
down is consistently found to be energetically much more favorable than with the O-end
down, but the absolute values for the adsorption energies vary considerably. Only in one
theoretical study an increase of the binding energy of CO at defect sites was found [179].
4.3.2 Experimental results and discussion In this section, titania films with a thickness of 10 ML were exposed to CO at 100 K to
pinpoint the influence of the different Ti oxidation states on the CO adsorption properties.
After exposure, thermal desorption spectra (TDS) with simultaneous tracking of the m/e = 28
(CO), 32 (O2) and 44 (CO2) signals at constant heating rate β=5 K/s were recorded. Then
different amounts of Au were thermally evaporated on the well ordered and oxidized rutile
TiO2(110)-(1×1) surface, always at 300 K. CO-TPD was carried out on the Au/TiO2 model
system again. Finally, the effect of annealing the Au/TiO2 at 770 K with respect to CO
adsorption was also studied by CO-TPD.
Fig. 4.10 shows the CO-TPD spectra obtained after exposure of a fully oxidized TiO2
film to CO at 100 K between 0.01 L and 15 L. All desorption peaks are asymmetric with a
slower decrease of the signals at their high-temperature side. The peaks show a single
maximum at a temperature which decreases from 170 K at an exposure of 0.01 L to 140 K at
an exposure of 15 L, indicating a stronger CO-CO repulsion with higher coverage or an
increasing population of more weakly bonding adsorption sites. It can also be seen from Fig.
4.10 that the CO coverage has reached its saturation value at an exposure of ~1 L. CO is the
only desorption product in these experiments. In particular, desorption of O2 or CO2, which
would be indicative of dissociative CO adsorption and /or a contribution from the titania
substrate, was not observed by TPD and from the survey spectrum of XPS on TiO2. No
carbon component was found, and no change of the TiO2 substrate was found after CO-TPD

CHAPTER 4 Au supported on TiO2 thin film studied by STM, XPS and CO-TPD 98
100 200 300 400 500
15 L 7.5 L 3.8 L 0.4 L 0.2 L 0.1 L 0.01 L bkg
Temperature / K
PC
O /
a.u.
Figure 4.10: CO-TPD from a TiO2(110)-(1×1) film supported on Ru(0001).
either.
By comparison with TPD data for CO desorption from Ru(0001), the saturation CO
coverage on the fully oxidized TiO2 substrate can be evaluated to be 0.1 ML. Assuming first
order desorption kinetics and a preexponential factor of 1×10¹⁴ s-1, the activation energy for
CO desorption can be determined to between 45 kJ/mole at low coverage and 37 kJ/mole at
saturation coverage, obtained from an analysis of these data using the Redhead approximation
[47] which has been introduced in chapter 2. The calculated activation energies for CO
desorption vs. CO coverage are plotted in Fig. 4.11. These values are in excellent agreement
with earlier results obtained by Linsebigler et al. [174] on single crystal rutile TiO2(110).
CO adsorption/desorption experiments were also carried out on reduced titania, which
was prepared by annealing the fully oxidized TiO2 film at 900 K for 120 s. The corresponding
XP detail spectrum of Ti(2p) after such treatment is shown in Fig. 4.12. Here, the ratio
Ti3+/Ti4+ is 0.26. The CO-TPD spectra are similar to those obtained after adsorption on TiO2
film, but a small portion of the CO molecules desorb up to 350 K on reduced TiO2, as can be
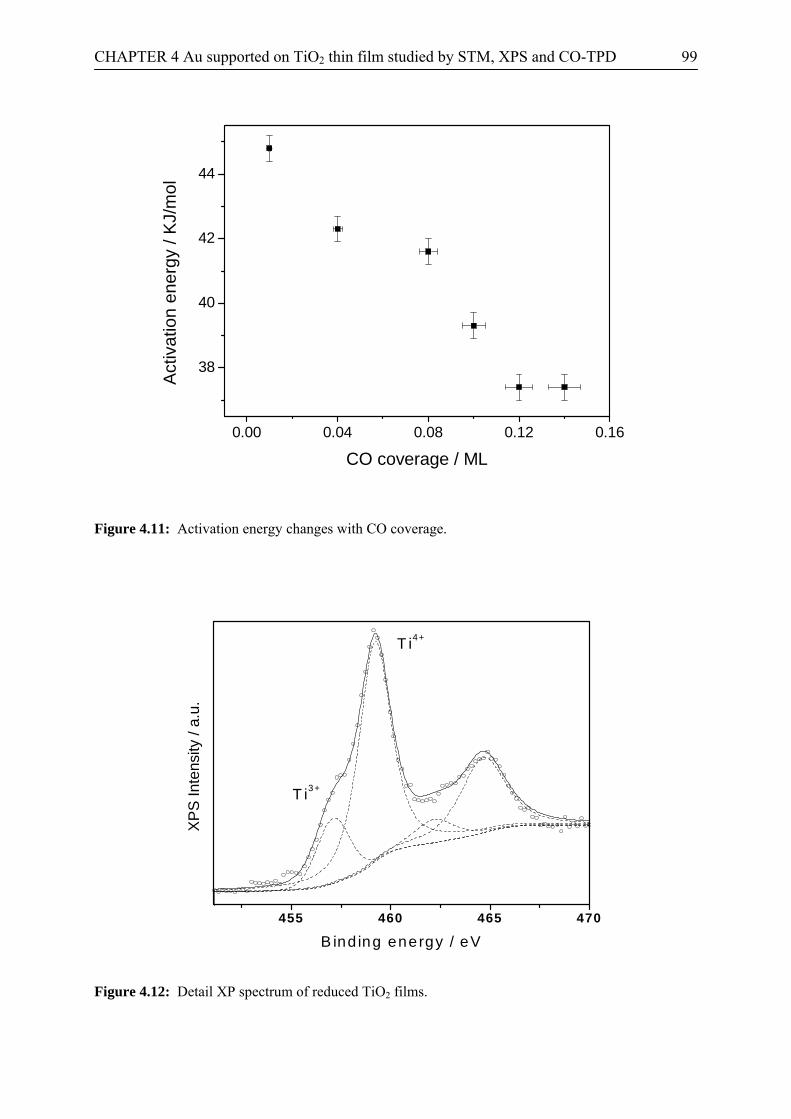
CHAPTER 4 Au supported on TiO2 thin film studied by STM, XPS and CO-TPD 99
0.00 0.04 0.08 0.12 0.16
38
40
42
44
Act
ivat
ion
ener
gy /
KJ/
mol
CO coverage / ML
Figure 4.11: Activation energy changes with CO coverage.
455 460 465 470
B ind ing energy / eV
XPS
Inte
nsity
/ a.
u.
T i3+
T i4+
Figure 4.12: Detail XP spectrum of reduced TiO2 films.
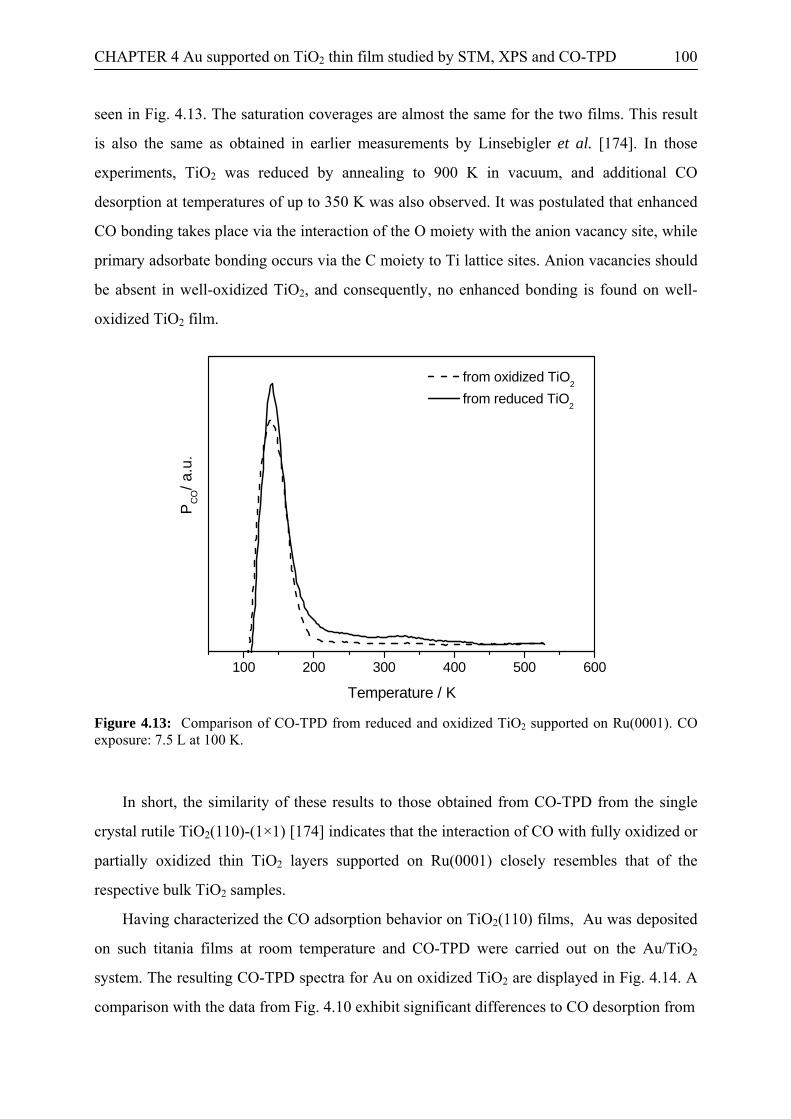
CHAPTER 4 Au supported on TiO2 thin film studied by STM, XPS and CO-TPD 100
seen in Fig. 4.13. The saturation coverages are almost the same for the two films. This result
is also the same as obtained in earlier measurements by Linsebigler et al. [174]. In those
experiments, TiO2 was reduced by annealing to 900 K in vacuum, and additional CO
desorption at temperatures of up to 350 K was also observed. It was postulated that enhanced
CO bonding takes place via the interaction of the O moiety with the anion vacancy site, while
primary adsorbate bonding occurs via the C moiety to Ti lattice sites. Anion vacancies should
be absent in well-oxidized TiO2, and consequently, no enhanced bonding is found on well-
oxidized TiO2 film.
100 200 300 400 500 600
from oxidized TiO2
from reduced TiO2
Temperature / K
PC
O/ a
.u.
Figure 4.13: Comparison of CO-TPD from reduced and oxidized TiO2 supported on Ru(0001). CO exposure: 7.5 L at 100 K.
In short, the similarity of these results to those obtained from CO-TPD from the single
crystal rutile TiO2(110)-(1×1) [174] indicates that the interaction of CO with fully oxidized or
partially oxidized thin TiO2 layers supported on Ru(0001) closely resembles that of the
respective bulk TiO2 samples.
Having characterized the CO adsorption behavior on TiO2(110) films, Au was deposited
on such titania films at room temperature and CO-TPD were carried out on the Au/TiO2
system. The resulting CO-TPD spectra for Au on oxidized TiO2 are displayed in Fig. 4.14. A
comparison with the data from Fig. 4.10 exhibit significant differences to CO desorption from
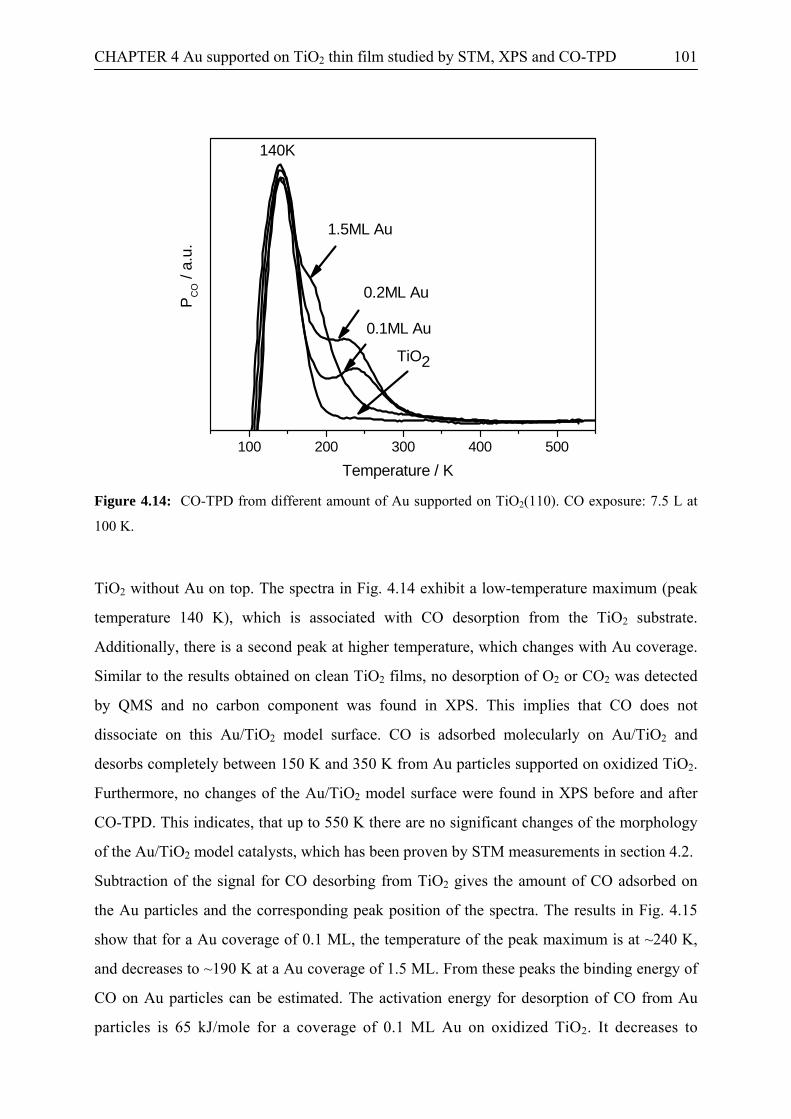
CHAPTER 4 Au supported on TiO2 thin film studied by STM, XPS and CO-TPD 101
100 200 300 400 500
TiO2
0.1ML Au
0.2ML Au
140K
Temperature / K
PC
O /
a.u.
1.5ML Au
Figure 4.14: CO-TPD from different amount of Au supported on TiO2(110). CO exposure: 7.5 L at
100 K.
TiO2 without Au on top. The spectra in Fig. 4.14 exhibit a low-temperature maximum (peak
temperature 140 K), which is associated with CO desorption from the TiO2 substrate.
Additionally, there is a second peak at higher temperature, which changes with Au coverage.
Similar to the results obtained on clean TiO2 films, no desorption of O2 or CO2 was detected
by QMS and no carbon component was found in XPS. This implies that CO does not
dissociate on this Au/TiO2 model surface. CO is adsorbed molecularly on Au/TiO2 and
desorbs completely between 150 K and 350 K from Au particles supported on oxidized TiO2.
Furthermore, no changes of the Au/TiO2 model surface were found in XPS before and after
CO-TPD. This indicates, that up to 550 K there are no significant changes of the morphology
of the Au/TiO2 model catalysts, which has been proven by STM measurements in section 4.2.
Subtraction of the signal for CO desorbing from TiO2 gives the amount of CO adsorbed on
the Au particles and the corresponding peak position of the spectra. The results in Fig. 4.15
show that for a Au coverage of 0.1 ML, the temperature of the peak maximum is at ~240 K,
and decreases to ~190 K at a Au coverage of 1.5 ML. From these peaks the binding energy of
CO on Au particles can be estimated. The activation energy for desorption of CO from Au
particles is 65 kJ/mole for a coverage of 0.1 ML Au on oxidized TiO2. It decreases to
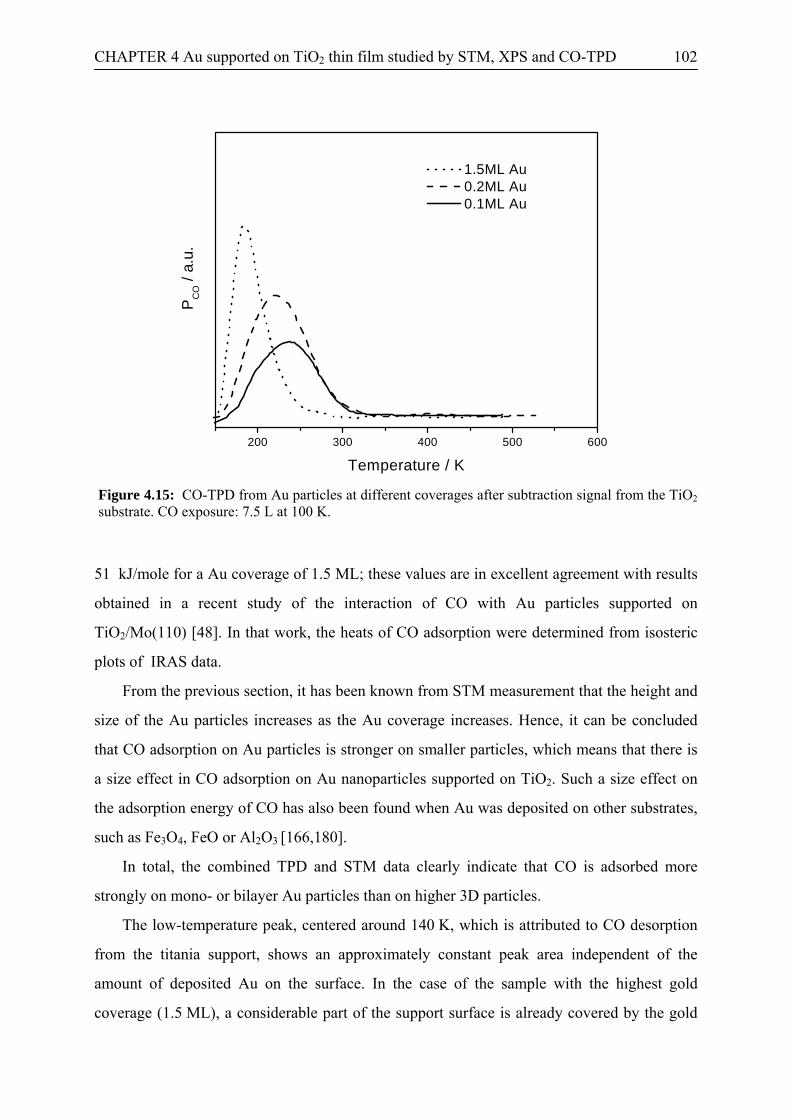
CHAPTER 4 Au supported on TiO2 thin film studied by STM, XPS and CO-TPD 102
200 300 400 500 600
1.5ML Au 0.2ML Au 0.1ML Au
Temperature / K
PC
O /
a.u.
Figure 4.15: CO-TPD from Au particles at different coverages after subtraction signal from the TiO2 substrate. CO exposure: 7.5 L at 100 K.
51 kJ/mole for a Au coverage of 1.5 ML; these values are in excellent agreement with results
obtained in a recent study of the interaction of CO with Au particles supported on
TiO2/Mo(110) [48]. In that work, the heats of CO adsorption were determined from isosteric
plots of IRAS data.
From the previous section, it has been known from STM measurement that the height and
size of the Au particles increases as the Au coverage increases. Hence, it can be concluded
that CO adsorption on Au particles is stronger on smaller particles, which means that there is
a size effect in CO adsorption on Au nanoparticles supported on TiO2. Such a size effect on
the adsorption energy of CO has also been found when Au was deposited on other substrates,
such as Fe3O4, FeO or Al2O3 [166,180].
In total, the combined TPD and STM data clearly indicate that CO is adsorbed more
strongly on mono- or bilayer Au particles than on higher 3D particles.
The low-temperature peak, centered around 140 K, which is attributed to CO desorption
from the titania support, shows an approximately constant peak area independent of the
amount of deposited Au on the surface. In the case of the sample with the highest gold
coverage (1.5 ML), a considerable part of the support surface is already covered by the gold

CHAPTER 4 Au supported on TiO2 thin film studied by STM, XPS and CO-TPD 103
particles (30-40 %) and a concomitant decrease of the CO adsorption on the titania support is
expected. The constancy of the low temperature peak therefore implies that, at least for the
sample with the highest gold coverage, additional desorption from the gold particles
contributes to this peak as well. For the samples with lower gold coverages (0.1 ML and
0.2 ML), it is difficult to assert if additional CO desorption from the Au particles is involved
in the low temperature peak, because the surface percentage covered by the Au particles is
relatively low. The observance of a low temperature contribution for the CO desorption from
Au model catalysts is in line with observations by Shaikhutdinov et al. [166] and by Winkler
et al. [203] for CO desorption from Au modified alumina or iron oxide films, where
noticeable CO desorption was always found in the temperature range between 100 and 150 K.
Winkler et al. [203] attributed this low temperature peak to desorption from the terraces of the
Au particles. Considering, however, that the CO saturation coverage on TiO2 at 100 K is
~0.1 ML and that the loss of CO desorption from TiO2 must be compensated by a similar
amount of CO desorption from Au nanoparticles, this assignment is not straightforward.
Either the CO saturation adsorption on the facets of the Au particles is rather low, around 5 –
10% of a monolayer, or CO desorption from the 3D Au particles at 140 K results from
desorption of undercoordinated sites on these particles and/or perimeter sites. A low
saturation coverage on the facets would point to a bulklike CO adsorption behavior on these
sites, since low saturation CO coverages have also been observed previously on smooth Au
single crystal surfaces [204-206]. On the other hand, the total amount of CO desorption would
also be compatible with desorption from undercoordinates Au sites on these particles [193].
Hence, a definite identification of the CO adsorption sites responsible for CO desorption at
140 K is not possible from the data available so far.
As has been mentioned earlier in this thesis, the sintering of Au particles could be the
main reason for catalyst deactivation. A similar process takes place when the catalysts are
annealed at elevated temperatures. It has been already shown by STM that annealing the
catalysts at 770 K for 2 min leads to growth of the Au particles. Moreover, in CO-TPD a
significant annealing effect was also found when the Au/TiO2 catalysts were annealed at the
same temperature, as shown in Fig. 4.16. A comparison of the CO desorption peak from
Au/TiO2 before and after annealing shows that the peak shape and position at 140 K
(assigned to desorption from TiO2) did not change, but the peak which is attributed to CO
desorption from Au particles, changes significantly. After subtraction of the signal arising
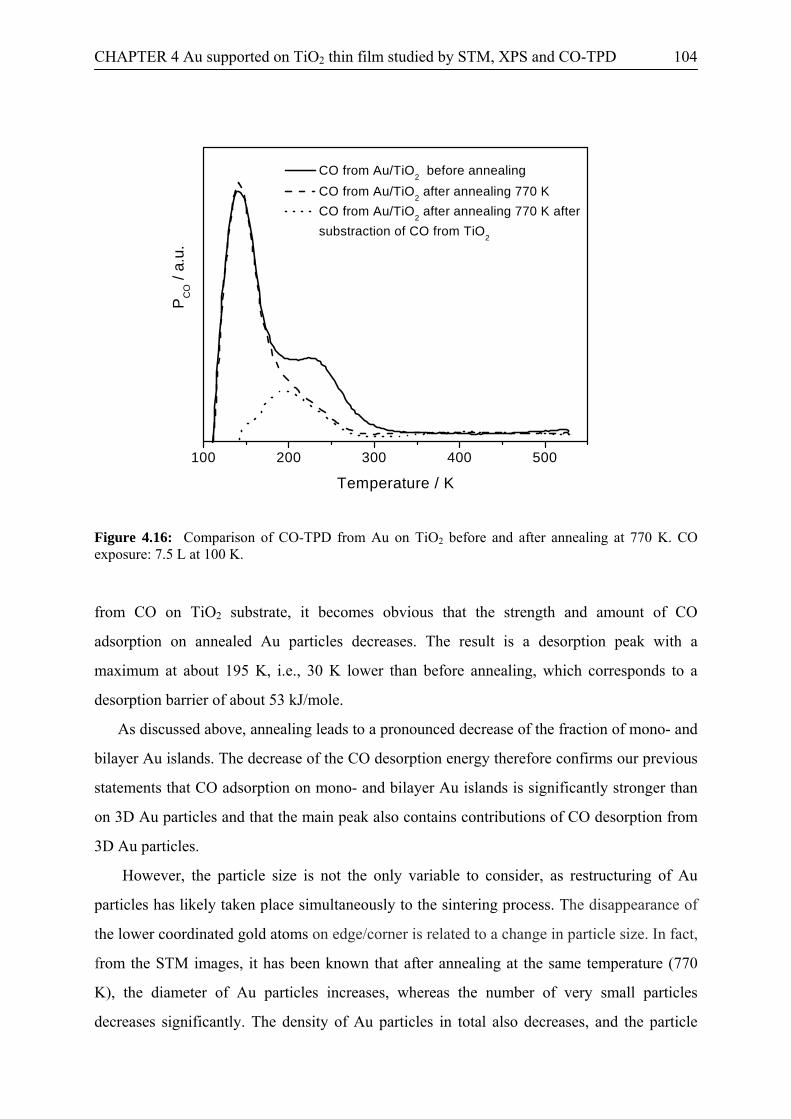
CHAPTER 4 Au supported on TiO2 thin film studied by STM, XPS and CO-TPD 104
100 200 300 400 500
CO from Au/TiO2 before annealing CO from Au/TiO2 after annealing 770 K CO from Au/TiO2 after annealing 770 K after
substraction of CO from TiO2
Temperature / K
PC
O /
a.u.
Figure 4.16: Comparison of CO-TPD from Au on TiO2 before and after annealing at 770 K. CO exposure: 7.5 L at 100 K.
from CO on TiO2 substrate, it becomes obvious that the strength and amount of CO
adsorption on annealed Au particles decreases. The result is a desorption peak with a
maximum at about 195 K, i.e., 30 K lower than before annealing, which corresponds to a
desorption barrier of about 53 kJ/mole.
As discussed above, annealing leads to a pronounced decrease of the fraction of mono- and
bilayer Au islands. The decrease of the CO desorption energy therefore confirms our previous
statements that CO adsorption on mono- and bilayer Au islands is significantly stronger than
on 3D Au particles and that the main peak also contains contributions of CO desorption from
3D Au particles.
However, the particle size is not the only variable to consider, as restructuring of Au
particles has likely taken place simultaneously to the sintering process. The disappearance of
the lower coordinated gold atoms on edge/corner is related to a change in particle size. In fact,
from the STM images, it has been known that after annealing at the same temperature (770
K), the diameter of Au particles increases, whereas the number of very small particles
decreases significantly. The density of Au particles in total also decreases, and the particle
CHAPTER 4 Au supported on TiO2 thin film studied by STM, XPS and CO-TPD 105
shape in many cases becomes more rounded. However, there is no change of the TiO2
substrate.
As mentioned above, it has been widely acknowledged that there is a size effect in CO-
TPD from other metal particles supported on oxides, and it is also of paramount importance
for the reactivity of the catalysts. Goodman et al. [46] found that when 2.5-3 nm Au particles
are present on the TiO2 surface, the model catalyst is most active for CO oxidation at low
temperatures. These authors proposed based on scanning tunneling spectroscopy (STS) data
that the transition from metallic to nonmetallic Au particles occurs also at this size range, and
they attributed this finding to a quantum size effect. Their conclusion was that the nonmetallic
properties of small Au particles make the catalysts active, because with decreasing size the
quasi-continuum of the Au metal states will eventually degenerate into a set of discrete states
that would give rise to the strong ability of the Au nanoparticles to adsorb molecules, such as
CO and O2 [181]. Based on this analysis, we may also attribute the size effect in CO-TPD of
Au/TiO2 to the metal to nonmetal transition of Au particles.
However, there are also arguments opposing the size effect. Cheshnovsky et al. [147]
argued that in a metal-to-nonmetal transition for unsupported metal particles, in general, a
precise determination of the transition size is impossible for particles of mono-valent or
bivalent metals. In these cases, a phase transition cannot be uniquely defined at some definite
size or size range. One can usually observe in particles a gradual increase in the DOS at EF,
with pronounced variations brought about not only by the influence of the particle boundary,
but also and often dominantly by electron-lattice interactions. Freund et al. [166] showed that
CO is adsorbed more strongly on low coordinated atoms on Au particles, and there are more
low coordinated atoms on smaller particles. The particle size effects are therefore not
attributed to quantum size effects, but rather to the presence of undercoordinated gold atoms
in very small particles. The same group and Hammer et al. [182] also proposed that CO
adsorbs on Au atoms at the metal/support periphery rather than on top of an Au(111) layer, in
other words, it is a shape effect. Actually, it has long been widely agreed that the shape effect
can be the main factor in CO chemisorption or in heterogeneous catalysis [7,183,184]. Hansen
et al. [183] found that the nano-crystals undergo dynamic reversible shape changes in
response to changes in the gaseous environment. They suggested that nanoparticle dynamics
must be included in the description of catalytic and other properties of nano-materials.
Baiker’s group [184] found that the activity of Au/TiO2 was much higher than Au/ZrO2 when
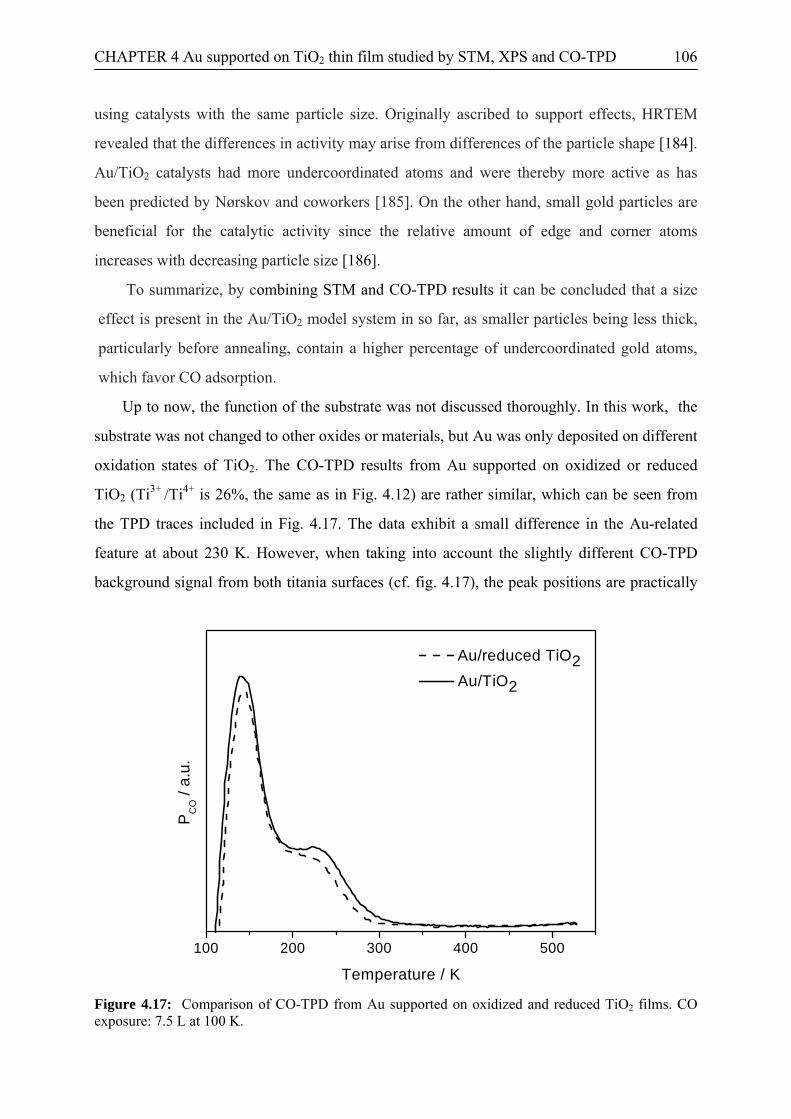
CHAPTER 4 Au supported on TiO2 thin film studied by STM, XPS and CO-TPD 106
using catalysts with the same particle size. Originally ascribed to support effects, HRTEM
revealed that the differences in activity may arise from differences of the particle shape [184].
Au/TiO2 catalysts had more undercoordinated atoms and were thereby more active as has
been predicted by Nørskov and coworkers [185]. On the other hand, small gold particles are
beneficial for the catalytic activity since the relative amount of edge and corner atoms
increases with decreasing particle size [186].
To summarize, by combining STM and CO-TPD results it can be concluded that a size
effect is present in the Au/TiO2 model system in so far, as smaller particles being less thick,
particularly before annealing, contain a higher percentage of undercoordinated gold atoms,
which favor CO adsorption.
Up to now, the function of the substrate was not discussed thoroughly. In this work, the
substrate was not changed to other oxides or materials, but Au was only deposited on different
oxidation states of TiO2. The CO-TPD results from Au supported on oxidized or reduced
TiO2 (Ti3+ /Ti4+ is 26%, the same as in Fig. 4.12) are rather similar, which can be seen from
the TPD traces included in Fig. 4.17. The data exhibit a small difference in the Au-related
feature at about 230 K. However, when taking into account the slightly different CO-TPD
background signal from both titania surfaces (cf. fig. 4.17), the peak positions are practically
Figure 4.17: Comparison of CO-TPD from Au supported on oxidized and reduced TiO2 films. CO exposure: 7.5 L at 100 K.
100 200 300 400 500
Au/reduced TiO2 Au/TiO2
Temperature / K
PC
O /
a.u.
CHAPTER 4 Au supported on TiO2 thin film studied by STM, XPS and CO-TPD 107
identical, and the difference is merely due to an intensity difference, with a higher intensity on
the reduced Au/TiO2 model catalyst. From our STM measurements, it is known that the Au
particles on reduced surfaces have a lower height compared to particles on oxidized surfaces
(at comparable Au coverage). The amount of CO adsorption on more strongly adsorbing Au
sites on mono- or bilayer Au islands is therefore expected to be higher on the reduced film.
On the other side, it has been shown that the binding strength of adsorbates is also influenced
by the interaction of the metal particles with the support [207]. In our case, the stronger
interaction of the Au particles with the vacancies in the reduced surface should lead to a
weakening of the CO adsorption bond, using simple bond-order conservation arguments. In
that case, the CO adsorption energy on mono- and bilayer Au islands should be shifted to
lower values, for larger 3D Au islands these effects are likely to be very small. Considering
also the uncertainties in the respective Au coverages it is not possible to separate these two
counteracting effects in the TPD spectra, where the Au-related CO desorption signal appears
roughly at the same temperature for the reduced surface and the oxidized surface.
TPR experiments performed by exposing the model catalyst to a CO and O2 mixture (10-7
mbar CO, 10-7 mbar O2, 100 K, 10 s) show no CO2 formation in the subsequent temperature
ramp, confirming earlier results that catalytic oxidation of CO is not possible upon low tem-
perature adsorption of the molecular species under UHV conditions [174], but requires either
dissociated oxygen on the surface [208] or other types of activated oxygen [194]. On the
other hand, a strong dependence of the CO oxidation rate on the pressure of the reaction gas
(CO + O2) was observed in measurements of the CO oxidation kinetics in the millibar to sub-
millibar range over disperse supported Au/TiO2 catalysts [209]. Furthermore, CO2 formation
was observed in pulse experiments admitting alternately CO and O2 pulses to a supported
Au/TiO2 catalyst during the CO pulses, indicating that active oxygen was formed and
remained adsorbed on the catalyst under these experimental conditions (1015 particles per 300
µs pulse, background pressure 10-7 mbar, 300 - 350 K) [67,210]. Comparing these obser-
vations with our present results, it is clear that after low temperature coadsorption of CO and
O2 desorption of CO at about 200 K is much more facile than CO oxidation. This result does
not contradict the other results mentioned above. The absence of detectable CO2 formation in
the present experiments can easily be understood by the sensitivity of the present experiment
being too low− CO oxidation rates compatible with the above results would be well below the
detection limit of the present experiment, and by the rapid desorption of CO and the resulting

CHAPTER 4 Au supported on TiO2 thin film studied by STM, XPS and CO-TPD 108
low COad coverages at reaction temperatures. Basic differences between disperse supported
Au/TiO2 catalysts and planar model catalysts do not need to be invoked.
4.4 Conclusions As the first conclusion of this chapter, it has been shown by STM that dispersed Au
nanoparticles with narrow height and size distributions can be prepared by thermal
evaporation on the rutile TiO2(110) films supported on Ru (0001).
When the Au coverage is lower than or up to 0.06 ML, the height of most of the Au
particles is 1 atomic layer, and their mean diameter is around 1 nm. As the Au coverage is
increased, particles with 2 and 3 atomic layers are formed, and their mean diameter increases
to about 2-3 nm. At higher coverages (for example, 4 ML in the present case), the height of
the particles is difficult to measure because Au particles are piled together. The mean
diameter of particles increases to about 4-5 nm, while less (<10%) smaller particles coexist.
After annealing at 770 K, there is no encapsulation of the Au particles by the titania
substrate. The mean diameter of the Au particles increases and the shape of the particles
becomes more rounded, in parallel the particle density decreases. The XPS results on Au
supported on rutile TiO2(110) films show no strong interaction between Au particles on
TiO2(110) substrate, which agrees well with the literature.
CO-TPD from rutile TiO2(110) thin film on Ru(0001) shows the same results as reported
for CO desorption from single crystal rutile TiO2(110), which indicates that the interaction
between the surface of the rutile TiO2(110) thin film and CO is the same as that on single
crystal bulk rutile TiO2(110). Finally, CO-TPD from Au/TiO2 model catalysts combined with
STM results indicate that CO adsorption on Au/TiO2 depends sensitively on the particle size
or shape.

CHAPTER 5 Kinetic measurements of CO oxidation on Au/TiO2 model catalysts in HPC 109
CHAPTER 5 Kinetic measurements of CO oxidation on Au/TiO2 model
catalysts in a high pressure cell
In this chapter preliminary kinetic measurements of CO oxidation on Au/TiO2 model catalysts
in a high pressure (HP) cell are carried out, the size/shape dependence of activity is discussed.
CHAPTER 5 Kinetic measurements of CO oxidation on Au/TiO2 model catalysts in HPC 110
5.1 Introduction
In the previous chapters the methods for preparing Au/TiO2 model catalysts and the
characterization with surface analytical methods such as STM, AES, XPS and CO-TPD have
been discussed in detail. It has been learned that the surface structure of titania thin films
prepared under the conditions as described in chapter 3 is rutile TiO2(110)-(1×1) and that they
have the same chemisorption properties towards CO as the surface of single crystal bulk rutile
TiO2(110)-(1×1). When Au is evaporated on such films at room temperature, nanoparticles of
Au with a narrow height distribution can be prepared. CO-TPD from Au/TiO2 proved that
both the substrate of TiO2 as well as Au particles can adsorb CO at temperatures below 300 K,
and the adsorption characteristics of CO depend markedly on the morphology of the Au
nanoparticles.
All measurements discussed in the previous chapters were done in a UHV chamber.
Based on those data, it is still difficult to explain the mechanism of CO oxidation because of
the well-known “pressure gap” in catalysis, which has been discussed in chapter 1.
To address the basic issues related to the CO oxidation over supported Au catalysts, it is
necessary to investigate the kinetics of CO oxidation on Au particles on TiO2(110)-(1×1) film
under reaction conditions as similar as possible to those used in actual technological
applications. For this purpose, the experiments described below were performed in the high
pressure cell attached to the UHV chamber as described in detail in chapter 2.
This chapter introduces the previous results from real catalysts and model catalysts are
summarized, followed by experimental results and their discussion in this work.
To analyze and study heterogeneous catalysis from the point view of reaction kinetics,
one generally assumes that a transition state is formed between the active site on the catalyst
surface and the reacting molecule(s). The reaction rate is then determined by the number of
active sites on the surface. Using this concept, one can define a turnover frequency (TOF)
which is the number of molecules reacting per site per second.
The TOF can be expressed in the case of CO oxidation on Au particles supported on TiO2
as:
CHAPTER 5 Kinetic measurements of CO oxidation on Au/TiO2 model catalysts in HPC 111
DA
TkVp
atomsgoldsurfaceofnumbers
moleculesproductionCO
NrTOF
AuAu
gasB
celltotal
⋅⋅⋅
⋅⋅⋅∆
===σθ
][2 (5.1)
where:
r -reaction rate
N -number of active sites
∆ - change of proportion of CO2
ptotal - total pressure
Vcell - volume of HP-cell
θAu - gold coverage
σAu - surface density /cm2
A - surface area of Ruthenium single crystal
D - dispersion
The dispersion of the particles is the ratio of exposed atoms vs. the total number of atoms.
It depends directly on the particles size, normally, the dispersion decreases as the particles
size increases. Many physical chemistry properties of metal particles (optical, electronic etc.)
are related to their dispersion.
True bimolecular heterogeneous catalytical reaction processes generally can proceed
according to the following mechanisms:
(1) Langmuir-Hinshelwood mechanism. Here, both reactants are adsorbed on the
surface. When they arrive at neighboring active sites of surface they can react to form
a product. Most bimolecular surface reactions are assumed to proceed in this way.
(2) Eley-Rideal mechanism. Here, one of the reactants is adsorbed and reacts with
another reactant which directly impinges on the first one from the gas phase.
There is another mechanism called Mars-van Krevelen mechanism [1]. The
characteristic feature of this mechanism is that some products of the reaction leave the solid
catalyst surface with one or more constituents of the catalysts lattice [187]. For example [69],
if the CO-covered RuO2(110) surface is briefly heated to 600 K, not only CO but also CO2
comes off the surface, i.e., holes (oxygen vacancy) are formed in the originally perfect RuO2
surface. This effect is attributed to the partial removal of O atoms from the substrate lattice by

CHAPTER 5 Kinetic measurements of CO oxidation on Au/TiO2 model catalysts in HPC 112
reaction with CO to CO2. Subsequent exposure to O2 at elevated temperatures restores the
original defect-free surface structure. Such a redox mechanism was first proposed by Mars
and van Krevelen [187].
5.2 Previous studies of CO oxidation on Au/TiO2
As mentioned in the section of introduction, because of the nobility of metal Au, extensive
studies on CO oxidation over supported Au catalysts started only about three decades ago.
Among the systems that have been studied, Au supported on TiO2 catalysts is the most
intensively investigated system, and many results are available in the literature. Here, in this
section, it is not intended to review all these results in detail which has been done by several
groups already [6,7,30,47,48]. Only results that are essential for the reaction kinetics and the
reaction mechanism of CO oxidation on Au/TiO2 are summarized.
Concerning the mechanism of CO oxidation on Au/TiO2, it is generally agreed on that the
activity is among others a complex function of the morphology and interaction of Au particles
with TiO2 support. Compared to other structure insensitive CO oxidation reactions [5], the
oxidation of CO over Au catalysts is remarkably sensitive to the contact structure between the
Au particles and the support, the type of support, and the morphology of the Au particles.
Actually, the influence of the catalyst preparation method on the activity also arises from this
finding, because different morphologies of Au particles can easily be obtained with different
preparation methods. For example, the interaction between Au and anatase TiO2(112) is
stronger than that between Au and rutile TiO2(110) [188], but there is no strong metal-support
interaction (SMSI) effect in either of these cases [28]. It was suggested that the reactions
might take place at the perimeter around the Au particles [47]. This hypothesis was further
affirmed by a study using an inversely supported catalyst [189].
With regard to the support, there are also lots of contrary arguments. Results from
Haruta’s group proved that when the support is an acidic oxide, the activity is poor. However,
on semiconducting metal oxides such as TiO2, Fe2O3 and NiO or on the insulating oxides
Al2O3 and SiO2, the catalytic activity is of similar magnitude. In addition, Au particles on
semiconductor metal oxide catalysts are relatively stable [190]. Schubert et al. [191]
suggested that metal oxide-supported Au catalysts can be grouped into two categories with
respect to CO oxidation, which are characterized by the support material and differ also in the
CHAPTER 5 Kinetic measurements of CO oxidation on Au/TiO2 model catalysts in HPC 113
reaction mechanism. One group consists of Au particles on inert support materials, such as
SiO2, Al2O3, or MgO. This type of catalyst is less active. Catalysts of this type with a higher
activity can be prepared as well, but the gold has to be in a highly dispersed state. The activity
of these catalysts shows a strong dependence on the size of the gold particles [191]. The
second group of catalysts consists of Au particles supported on reducible transition metal
oxides such as Fe2O3. They exhibit a significantly larger activity for CO oxidation, which is
attributed to their ability to provide reactive oxygen. The presence of an oxygen reservoir on
the support reduces the dependence of the turnover frequency on the gold particle diameter,
since on those catalysts oxygen dissociation is no longer rate-limiting. As a consequence, the
TOF is not governed by particle size effects as for inert support materials [191]. Recently,
Clausen et al. [192,193] carried out a study on the CO oxidation activity of Au particles
supported on different substrates, such as Au/TiO2, Au/MgAl2O4, and Au/Al2O3 catalysts.
Based on the idea that the CO oxidation on Au catalysts requires low-coordinated Au atoms,
the turn over frequency per Au atom located at the corners of the Au particles was calculated.
The results showed that the difference in catalytic activity of a Au catalyst with a reducible
and irreducible support can be explained by a difference in Au particle geometry only.
The size effect of the gold particles was proven to be the most important effect in the
catalytic activity of Au/TiO2, even though some studies involving real catalysts reported that
size effects are not critical for the catalytic activity [184]. Furthermore, there are many
different interpretations of the size effect. Goodman et al. [46] attributed it to a quantum size
effect and suggested that the nonmetallic nature of very small Au particles leads to a high
catalytic activity. It was also suggested that the most active Au particles are those with a
height of two to three atomic-layers, these two-dimensional Au islands may exhibit an
unusual activity as compared to their 3D counterparts [46,194]. However, though providing a
wealth of spectroscopic details, still many features are unexplained [147,156,195-197]. The
nonmetal to metal transitions usually occurs for even smaller clusters, and thus the electronic
properties of the nanoparticles are possible modified by an interaction with the supporting
material [197]. Freund et al. [48] argued that the size effect is not a quantum effect, it rather
originates from the low-coordination of Au atoms in small particles. Density functional theory
(DFT) calculations on various gold configurations show that the interaction between CO and
O2 molecules depends on the coordination number of the gold atoms [160,198]. The
interaction between CO and O2 molecules and gold atoms in a high coordination number (>8),
CHAPTER 5 Kinetic measurements of CO oxidation on Au/TiO2 model catalysts in HPC 114
which are present in the dense (100) and (111) surfaces of gold, is repulsive, and thus these
atoms are expected to not be catalytically active. However, on Au atoms with lower
coordination numbers, CO and O2 adsorption is feasible [160,198], indicating that the
presence of such low-coordinated Au atoms is required in an active catalyst. In fact, the
catalytic activity may change by several orders of magnitude due to the effect of the Au–Au
coordination number, which makes this effect dominant and crucial for catalysis by Au [198].
Several infrared studies have provided strong experimental evidence of the calculated
relationship between Au coordination number and CO or oxygen interaction by demonstrating
that CO adsorbs on edge and corner sites of Au particles, independent of the size or thickness
of the Au particles [48,166]. Recently, the determination of how many gold atoms are located
in those positions in a given supported catalyst has been achieved through a recently
developed method, in which the size and volume of the individual Au particles measured by
scanning transmission electron microscopy (STEM) is combined with the Au–Au
coordination number determined by extended X-ray absorption fine structure (EXAFS)
analysis [193].
Henry [7] also proposed that the edges, corner, or step sites are the active centers for
adsorption and further reaction. The relative numbers of these particular sites depend on the
shape of the particle, i.e., according to Henry, the shape of the particles is critical. Haruta [47]
also questioned the mechanism proposed by Goodman. He argued that in Goodman´s work
the transition of the electronic state was measured for one specific Au cluster of a defined
diameter by STS, whereas the catalytic activity was measured for an entire Au/TiO2 model
catalysts with a particle size distribution.
No direct experimental evidence for the activation of oxygen atoms, which subsequently
react with CO at the Au particle, has been provided. Moreover, it is unclear whether oxygen is
adsorbed dissociatively or non-dissociatively at the catalytically active sites.
Based on all available arguments and results, the most probable pathways for CO
oxidation over supported Au catalysts can be depicted as shown in Figure 5.1 [32]. In addition
to the mechanisms summarized above, there are further controversial issues with respect to
the reaction mechanism. For example, it was found in many studies with real
catalysts [199,200] that the presence of water may enhance the catalyst performance due to
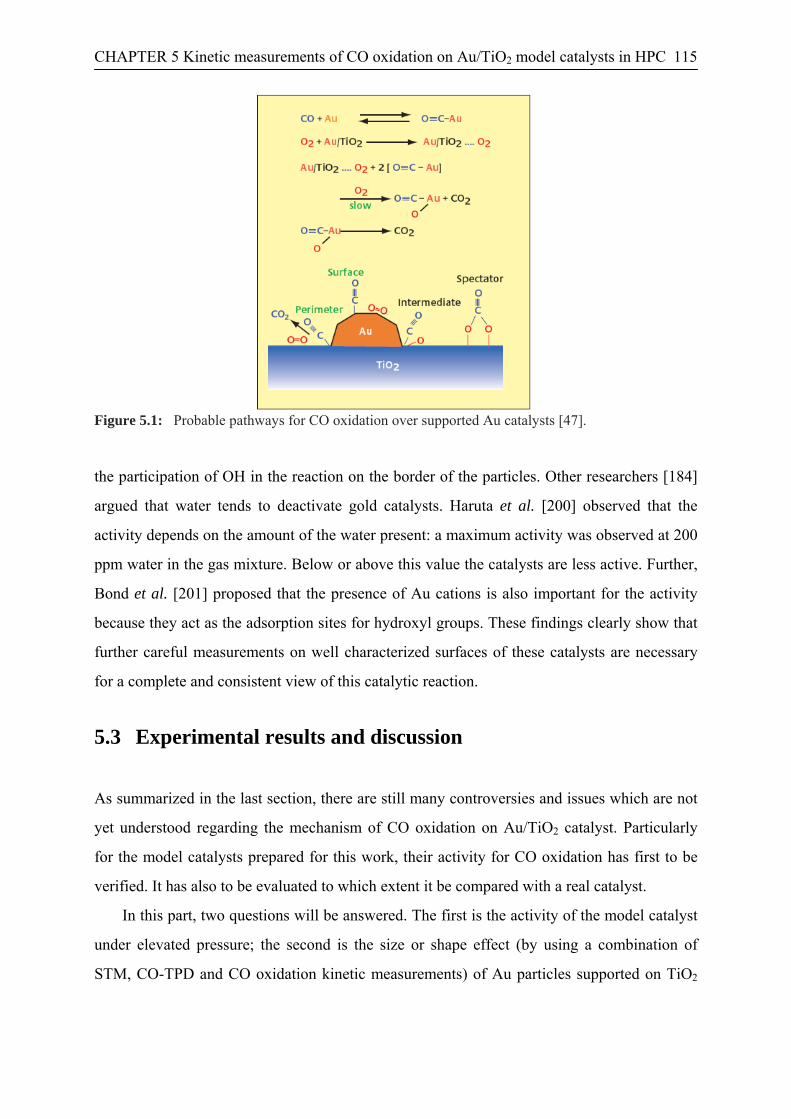
CHAPTER 5 Kinetic measurements of CO oxidation on Au/TiO2 model catalysts in HPC 115
Figure 5.1: Probable pathways for CO oxidation over supported Au catalysts [47].
the participation of OH in the reaction on the border of the particles. Other researchers [184]
argued that water tends to deactivate gold catalysts. Haruta et al. [200] observed that the
activity depends on the amount of the water present: a maximum activity was observed at 200
ppm water in the gas mixture. Below or above this value the catalysts are less active. Further,
Bond et al. [201] proposed that the presence of Au cations is also important for the activity
because they act as the adsorption sites for hydroxyl groups. These findings clearly show that
further careful measurements on well characterized surfaces of these catalysts are necessary
for a complete and consistent view of this catalytic reaction.
5.3 Experimental results and discussion As summarized in the last section, there are still many controversies and issues which are not
yet understood regarding the mechanism of CO oxidation on Au/TiO2 catalyst. Particularly
for the model catalysts prepared for this work, their activity for CO oxidation has first to be
verified. It has also to be evaluated to which extent it be compared with a real catalyst.
In this part, two questions will be answered. The first is the activity of the model catalyst
under elevated pressure; the second is the size or shape effect (by using a combination of
STM, CO-TPD and CO oxidation kinetic measurements) of Au particles supported on TiO2
CHAPTER 5 Kinetic measurements of CO oxidation on Au/TiO2 model catalysts in HPC 116
thin film. Detailed analysis of the results of the kinetic and IR measurements and the role of
defects and the water content of the gas will be presented in the dissertation of T.Diemant.
The kinetic measurements were carried out in the HP cell attached to the TPD chamber,
as described in chapter 2. While another team in our group deposited Au particles on single
crystal TiO2(110) [131] and used this system as model catalyst, here results are presented for a
study on the catalytical activity of Au on thin film rutile TiO2(110) model catalysts. The
preparation and characterization of the thin rutile film have been described in chapter 3 and
chapter 4. In some experiments, Au was also deposited on both TiO2 covered sides of the
crystal to increase the CO2 production rate.
After calibration of the QMS and determination of the background CO2 production rate
by the QMS, HP cell and the sample holder (see section 2.3), the kinetics of CO oxidation on
the Au/TiO2 model catalysts was investigated in a mixture of CO and O2 in the HP cell. The
experiments were carried out in the following manner. The fully oxidized TiO2 thin film
(thickness about 10ML) was prepared on both sides of a Ru(0001) single crystal substrate.
Following that, Au was deposited on TiO2 film at 300 K at the desired coverage. Finally, the
sample was characterized by XPS. Then the sample was transferred into the HP cell. During
sample preparation, the filament of the QMS was switched on. When the sample was ready,
CO and O2 were mixed to a certain fixed pressure ratio in the gas mixing chamber at room
temperature. Subsequently, the mixture was dosed into the reactor with the Au/TiO2 catalyst
through the gas handling system. When the pressure approached the desired value, further gas
supply was sealed off, and the catalyst was heated with a heating ramp of 1 K/s to the selected
reaction temperature. As soon as the catalyst temperature reached the preset value, the QMS
software started recording data. The current intensities as measured by the QMS amplifier
were recorded either continuously in a multiplex mode or in mass scans from M1 to M50
every 5 min. In the latter case, between each recording the filament was switched off
automatically, and it was switched on 10 sec before the next recording. This way the
undesired production of CO2 by the filament could be eliminated more effectively. If mass
scans were recorded, the signal intensities were extracted from the mass scans. In the
multiplex mode, QMS signals related to CO, O2 and CO2 were recorded in every experimental
run. Measurements with a duration of up to 3 hours were carried out in this manner. With
corrections for the sensitivity factors of the QMS for CO, O2 and CO2 (they are 1.09, 0.62, 0.9
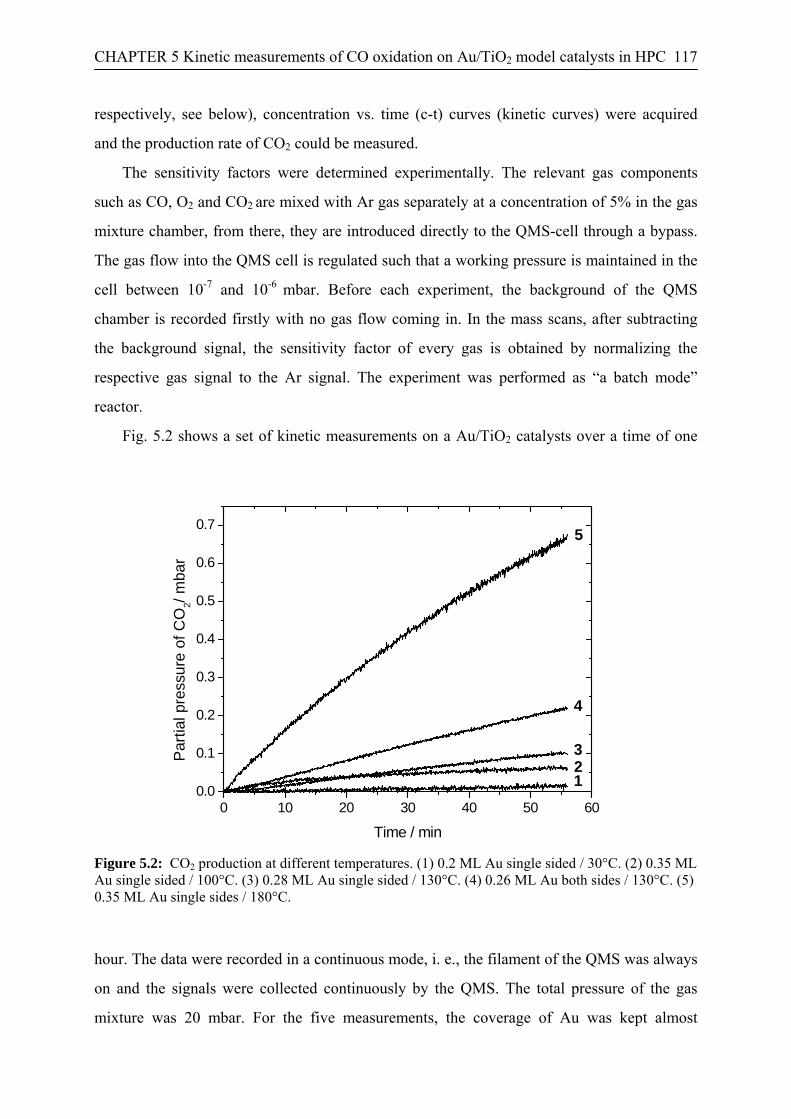
CHAPTER 5 Kinetic measurements of CO oxidation on Au/TiO2 model catalysts in HPC 117
respectively, see below), concentration vs. time (c-t) curves (kinetic curves) were acquired
and the production rate of CO2 could be measured.
The sensitivity factors were determined experimentally. The relevant gas components
such as CO, O2 and CO2 are mixed with Ar gas separately at a concentration of 5% in the gas
mixture chamber, from there, they are introduced directly to the QMS-cell through a bypass.
The gas flow into the QMS cell is regulated such that a working pressure is maintained in the
cell between 10-7 and 10-6 mbar. Before each experiment, the background of the QMS
chamber is recorded firstly with no gas flow coming in. In the mass scans, after subtracting
the background signal, the sensitivity factor of every gas is obtained by normalizing the
respective gas signal to the Ar signal. The experiment was performed as “a batch mode”
reactor.
Fig. 5.2 shows a set of kinetic measurements on a Au/TiO2 catalysts over a time of one
0 10 20 30 40 50 600.0
0.1
0.2
0.3
0.4
0.5
0.6
0.75
4
321
Par
tial p
ress
ure
of C
O2/
mba
r
Time / min Figure 5.2: CO2 production at different temperatures. (1) 0.2 ML Au single sided / 30°C. (2) 0.35 ML Au single sided / 100°C. (3) 0.28 ML Au single sided / 130°C. (4) 0.26 ML Au both sides / 130°C. (5) 0.35 ML Au single sides / 180°C.
hour. The data were recorded in a continuous mode, i. e., the filament of the QMS was always
on and the signals were collected continuously by the QMS. The total pressure of the gas
mixture was 20 mbar. For the five measurements, the coverage of Au was kept almost
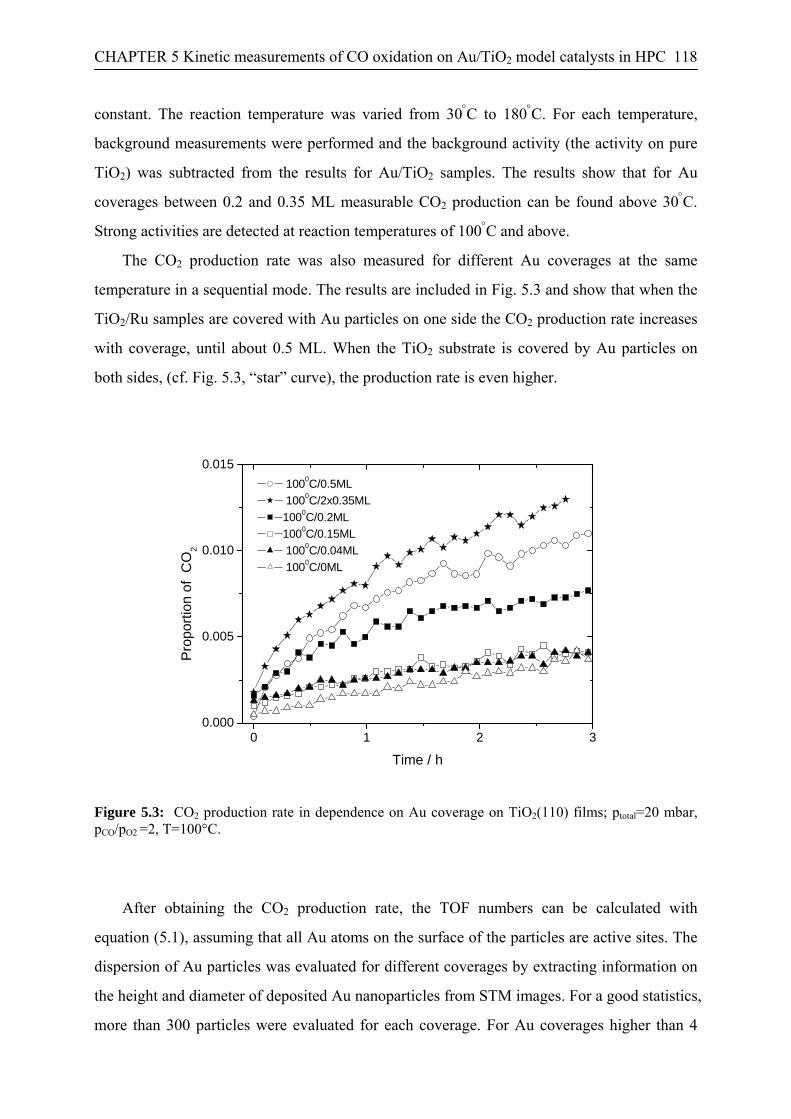
CHAPTER 5 Kinetic measurements of CO oxidation on Au/TiO2 model catalysts in HPC 118
constant. The reaction temperature was varied from 30°C to 180°C. For each temperature,
background measurements were performed and the background activity (the activity on pure
TiO2) was subtracted from the results for Au/TiO2 samples. The results show that for Au
coverages between 0.2 and 0.35 ML measurable CO2 production can be found above 30°C.
Strong activities are detected at reaction temperatures of 100°C and above.
The CO2 production rate was also measured for different Au coverages at the same
temperature in a sequential mode. The results are included in Fig. 5.3 and show that when the
TiO2/Ru samples are covered with Au particles on one side the CO2 production rate increases
with coverage, until about 0.5 ML. When the TiO2 substrate is covered by Au particles on
both sides, (cf. Fig. 5.3, “star” curve), the production rate is even higher.
0 1 2 30.000
0.005
0.010
0.015 1000C/0.5ML 1000C/2x0.35ML1000C/0.2ML1000C/0.15ML 1000C/0.04ML 1000C/0ML
Pro
porti
on o
f C
O2
Time / h
Figure 5.3: CO2 production rate in dependence on Au coverage on TiO2(110) films; ptotal=20 mbar, pCO/pO2 =2, T=100°C.
After obtaining the CO2 production rate, the TOF numbers can be calculated with
equation (5.1), assuming that all Au atoms on the surface of the particles are active sites. The
dispersion of Au particles was evaluated for different coverages by extracting information on
the height and diameter of deposited Au nanoparticles from STM images. For a good statistics,
more than 300 particles were evaluated for each coverage. For Au coverages higher than 4

CHAPTER 5 Kinetic measurements of CO oxidation on Au/TiO2 model catalysts in HPC 119
ML, it is difficult to measure the height of Au particles and the dispersion of Au particles are
estimated. The dependence of the TOF on the Au particle coverage at constant temperature
and pressure of gas mixture (total pressure at 20 mbar, CO:O2=2:1) is shown in Fig. 5.4. The
TOFs are rather small for a coverage below 0.1 ML. Above 0.1 ML the TOF rises
pronouncedly and at Au coverage at about 1.5 ML, it has a maximum value of about 0.25 s-1.
Following that, the TOFs decreases to about 0.05 s-1 as the Au coverage increases.
From the STM measurements in chapter 4, it has been learned that at coverages lower
than 0.1 ML, most of the Au particles are one atomic layer high, however, above 0.1 ML,
0 2 4 6 8 100.0
0.1
0.2
0.3
0.4
T = 100 0CpTotal = 20 mbarpCO / pO2
= 2
Gold Coverage /ML
TOF
/(site
s)-1
Figure 5.4: CO oxidation turnover frequencies as a function of Au coverage on TiO2(110) films; ptotal=20 mbar, pCO/pO2 =2, T=100°C.
most of the gold particles have a height of more than one layer. Together with Fig. 5.4, it
implies that the one atomic layer high Au particles supported on TiO2 are not active for CO
oxidation, instead, Au particles with 2 to 4 atomic layers high are most active. This is almost
in line with the results from Valden et al. [149] except that the intensity of activity in this
work is lower.
In chapter 4, it has been shown that the size and height of Au particles increase with the
coverage. Therefore, it can be affirmed that there is a Au particle size effect in the CO
oxidation on Au/TiO2 model catalyst from (cf. 5.4). In addition, it has also been discussed
CHAPTER 5 Kinetic measurements of CO oxidation on Au/TiO2 model catalysts in HPC 120
from CO-TPD that the geometry (size and shape) play an important role in CO adsorption on
Au nanoparticles supported on TiO2. The total amount of CO desorption would be compatible
with desorption from undercoordinates Au sites on the particles. May be this can be correlated
to the geometry effect of Au particles in CO oxidation. Since precise shape determination
from STM measurement is difficult on account of the tip effect, a quantitative analysis of
TOF on dependence of defect sites on Au particles will not be given. Other effects, including
strain, support-induced effects, electronic effects, and charging of the Au atoms, may also
contribute to the catalytic activity of the Au particles, but their influence is significantly
smaller. This is in line with several infrared studies which have proved that CO is adsorbed on
edge and corner sites of Au particles [48,166,202].
5.4 Conclusions
In an effort to bridge the “material gap” and “pressure gap” between real and model catalysis
and as a step towards an understanding of the mechanism of the CO oxidation, the kinetics of
that reaction were studied preliminary in a well-characterized Au/TiO2/Ru model system. The
activity of the model catalysts (TOF=0.25 s-1) in a high pressure cell under similar conditions
as in real catalysts studies indicates that the Au/TiO2 model catalyst and the HP cell in this
work can be applied successfully in bridging the “material and pressure gaps”. Furthermore, a
Au coverage dependence of the CO oxidation on Au/TiO2 model catalysts was also found.
The model catalysts are little active at very low Au coverages, however, their activity
increases to the maximum at about 1.5 ML and decreases again at higher coverages.
CHAPTER 6 Summary and outlook 121
CHAPTER 6
Summary and outlook
This thesis consists of three main parts. First, a high pressure cell for the measurement of
reaction kinetics of model catalysts and in situ PM-FTIR spectroscopy was designed and
manufactured. This cell is made from a single piece of stainless steel. Because of its low leak
rate, it can be used as batch-mode as well as flow reactor. Calibration and test measurements
of the performance of the HP cell showed that the background CO2 signal resulting from
reaction at the wall of the cell, the QMS source and the sample holder are low compared with
that from the sample, i.e., Au/TiO2 model catalysts at sample temperature >50°C. This shows
that the HP cell can be reliably used for studying reaction kinetics.
In the second part of this work the objective was to prepare and characterize a model
catalyst, which helps to bridge the “material gap” in catalysis studies. Because of its
widespread applications and important role in catalysis studies, Au nanoparticles supported on
TiO2(110)-(1×1) is chosen as model catalyst. For this work, TiO2 thin films were deposited on
Ru(0001) to study also different preparation conditions of the catalyst support. As a relatively
independent work, the growth of titania thin films on Ru(0001) and their thermal stability
were extensively studied. The chemical composition was characterized by XPS or AES after
each preparation step, and the morphology and atomic surface structure of the deposited
ultrathin titania films, with a thickness between sub-monolayer and 2 ML, were investigated
by STM. A structure model was proposed with the help of LEED results for ultrathin titania

CHAPTER 6 Summary and outlook 122
film deposited on Ru(0001) under specific experimental conditions, including post-annealing
in oxygen. This model consists of two close packed oxygen layers with a Ti layer in the
octahedral holes in between, with a lattice constant of 0.3 nm. For the ultrathin films of titania
which were annealed in UHV, other structures were found.
Further growth of the titania films was studied up to a thickness of about 5 ML. It was
shown that rutile TiO2 films, that were exposed to O2 at 1000 K during the preparation, grow
via the layer-plus-islands or Stranski-Krastanov mode.
Thermal stability studies of even thicker films indicated that the oxidation state and
surface structure of TiOx films with a thickness of up to 10 ML are sensitive to the post-
deposition treatment conditions (e.g. the pressure of oxygen, the annealing temperature and
annealing time) and depend on the initial growth stages of the film as well. Fully oxidized and
ordered rutile TiO2 films could be prepared reproducibly on Ru(0001) under specific, well-
defined experimental conditions. High resolution STM images show that under those
preparation conditions the surface structure of the titania films on Ru(0001) is that of rutile
TiO2(110)-(1×1). Well oxidized TiO2(110) prepared in this work were also characterized by
adsorption and desorption of CO. Those TPD results showed that the interaction of CO with
the surface of the thin TiO2 films on Ru(0001) is the same as that of CO with the (1×1)
surface of single crystal rutile TiO2(110).
As the last step in the preparation of Au/TiO2 model catalyst, gold was evaporated on the
TiO2(110) films at room temperature in order to produce supported Au nanoparticles. The
resulting morphologies were characterized by STM again. Height distributions of the Au
particles were investigated and compared to real catalysts and other Au/single crystal TiO2
model catalysts, and XPS was applied to study the interaction between the Au nanoparticles
and the TiO2 support. It turned out that the Au particles were not oxidized under our
conditions. Also, no reduction of TiO2 was found after the deposition of Au. Further CO-TPD
measurements on these model catalysts indicated that the adsorption strength of CO on Au
particles depends pronouncedly on the Au coverage (or particle size). CO has completely
desorbed from the Au particles at about room temperature.
In the third part of this work the catalytic activity of the Au/TiO2 model system was
investigated preliminarily by kinetic measurements in the HP cell at elevated pressure (up to
several mbar) in order to learn more about the catalytic activity in the “pressure gap” in
catalysis. The detection of catalytic activity under conditions closely related to real catalyst
CHAPTER 6 Summary and outlook 123
studies demonstrates that this work represents a successful step towards bridging the “material
gap” and “pressure gap”. A Au “coverage-dependence” effect was found in the reaction of
CO oxidation on the Au/TiO2 model system.
For future work, there are still many interesting open questions and exciting
opportunities, in particular with the new HP cell attached to the UHV system. For instance, it
should be possible to follow the evolution of surface species by using in situ PM-IRAS, not
only for CO oxidation, but in other catalytic reactions as well. More specific for the system
studied here, it may also be interesting to investigate the effect of a modified support on the
reaction. e. g., different oxidation states and surface structures of TiO2 (e. g., anatase) may be
prepared by thermal evaporation methods and the reaction may be studied on such a support.
In addition, well-defined defects on the oxide surface would certainly affect the growth of Au
particles on titania and also the electron distribution between the interface of Au nanoparticles
and titania substrate. This may also affect the catalytical properties.
As discussed above, according to several studies hydroxyl species from dissociated water
contribute significantly to the catalytical activities. For this reason, the effect of water on the
catalytic activities should be interesting to study on model catalysts with the new
experimental set-up.
Finally, an in situ investigation with the high pressure scanning tunneling microscopy
would be highly desirable in order to “watch” the working catalyst and the morphological
modifications that take place on its surface. Together with PM-IRAS and combined with
powerful new theoretical methodologies this promises to add new dimensions to our
fundamental understanding of surface catalyzed reactions.
Bibliography 124
Bibliography
Bibliography
[1] R. A. van Santen and J. W. Niemantsverdriet, Chemical Kinetics and Catalysis (A Division of Plenum Publishing Corporation, New York and London, 1995).
[2] G. Ertl, "Untersuchung von oberflächenreaktionen mittels beugung langsamer elektronen (LEED) I. Wechselwirkung von O2 und N2O mit (110)-,(111)- und (100)-Kupfer-Oberflächen," Surf.Sci. 6, 208-232 (1967).
[3] D. R. Kahn, E. E. Petersen, and G. A. Somorjai, "The Hydrogenolysis of Cyclopropane on A Platinum Stepped Single Crystal at Atmospheric Pressure," J.Catal. 34, 294-306 (1974).
[4] P. J. Berlowitz, C. H. F. Peden, and D. W. Goodman, "Kinetics of CO Oxidation on Single-Crystal Pd, Pt, and Ir," J.Phys.Chem. 92, 5213-5221 (1988).
[5] G. Ertl, "Reactions at Well-defined Surfaces," Surf.Sci. 299/300, 742-754 (1994).
[6] C. T. Campbell, "Ultrathin Metal Films and Particles on Oxide Surfaces: Structural, Electronic and Chemisorptive Properties," Surf.Sci.Rep. 27, 1-111 (1997).
[7] C. R. Henry, "Surface Studies of Supported Model Catalysts," Surf.Sci.Rep. 31, 235-325 (1998).
[8] H.-J. Freund, "Clusters and Islands on Oxides: From Catalysis via Electronics and Magnetism to Optics," Surf.Sci. 500, 271-299 (2002).
[9] S. J. Tauster, S. C. Fung, and R. L. Garten, "Strong Metal-Support Interactions. Group 8 Noble Metals Supported on TiO2," J.Am.Chem.Soc. 170-175 (1978).
[10] D. W. Goodman, "Model catalysts: From Imagining to Imaging A Working Surface," J.Catal. 216, 213-222 (2003).
Bibliography 125
[11] W. Weiss and G. A. Somorjai, "Preparation and Structure of 1-8 Monolayer Thick Epitaxial Iron Oxide Films Grown on Pt(111)," J.Vac.Sci.Technol.A 11, 2138-2144 (1993).
[12] U. Diebold, " The Surface Science of Titanium Dioxide," Surf.Sci.Rep. 48, 53-229 (2003).
[13] M. C. Asensio, M. Kerker, D. P. Woodruff, A. V. de Carvalho, A. Fernandez, A. R. Gonzalez-Elipe, M. Fernandez-Garcia, and J. C. Conesa, "The Growth of Thin Ti and TiOx Film on Pt(111): Morphology and Oxidation States," Surf.Sci. 273, 31-39 (1992).
[14] M. C. Wu, C. A. Estrada, J. S. Corneille, and D. W. Goodman, "Model Surface Studies of Metal Oxides: Adsorption of Water and Methanol on Ultrathin MgO Films on Mo(100)," J.Chem.Phys. 96, 3892-(1992).
[15] J. W. He, J. S. Corneille, C. A. Estrada, M. C. Wu, and D. W. Goodman, "CO Interaction With Ultrathin MgO Films on Mo (110) Surface Studied by Infra-red Reflection-absorption Spectroscopy, Temperature Programmed Desorption, and X-ray Photoelectron Spectroscopy," J.Vac.Sci.Technol.A 10, 2248-2252 (1992).
[16] X. Xu, J. W. He, and D. W. Goodman, "A Surface Spectroscopic Study of Metal-Support Interactions: Model Studies of Copper on Thin SiO2 Films," Surf.Sci. 284, 103-108 (1993).
[17] X. Xu and D. W. Goodman, "Structural and Chemisorptive Properties of Model Catalysts: Copper Supported on SiO2 Thin Films," J.Phys.Chem. 97, 683-689 (1993).
[18] X. Xu and D. W. Goodman, "An Infrared and Kinetic Study of CO Oxidation on Model Silica-Supported Palladium Catalysts from 10-9 to 15 Torr ," J.Phys.Chem. 97, 7711-7718 (1993).
[19] K. Coulter, X. Xu, and D. W. Goodman, "Structural and Catalytic Properties of Model Supported Nickel Catalysts," J.Phys.Chem. 98, 1245-1249 (1994).
[20] M. C. Wu and D. W. Goodman, "Particulate Cu on Ordered Al2O3: Reactions With Nitric Oxide and Carbon Monoxide," J.Phys.Chem. 98, 9874-9881 (1994).
[21] P. J. Chen and D. W. Goodman, "Epitaxial Growth of Ultrathin Al2O3 Films on Ta(110)," Surf.Sci. 312, L767-L773 (1994).
[22] A. B. Boffa, H. C. Galloway, P. W. Jacobs, J. J. Benitez, J. D. Batteas, M. Salmeron, A. T. Bell, and G. A. Somorjai, "The Growth and Structure of Titanium Oxide Films on Pt(111) Investigated by LEED, XPS, ISS, and STM," Surf.Sci. 326, 80-92 (1995).
[23] W. S. Oh, C. Xu, D. Y. Kim, and D. W. Goodman, "Preparation and Characterization of Epitaxial Titanium Oxide Films on Mo(100)," J.Vac.Sci.Technol.A 15, 1710-1716 (1997).
[24] F. Rittner, R. Fink, B. Boddenberg, and V. Staemmler, "Growth and Structure of Ultrathin FeO Films on Pt(111) Studied by STM and LEED," Phys.Rev.B 57, 7240-7251 (1998).
[25] Q. Guo, "Titanium Oxide Films Grown on Mo(110)," Surf.Sci. 437, 49-60 (1999).

Bibliography 126
[26] T. Maeda, Y. Kobayashi, and K. Kishi, "Growth of Ultra-thin Titanium Oxide on Cu(100), Fe/Cu(100) and Ordered Ultra-thin Iron Oxide Studied by Low-energy Electron Diffraction and X-ray Photoelectron Spectroscopy," Surf.Sci. 436, 249-258 (1999).
[27] S. Surnev, G. Kresse, M. Sock, M. G. Ramsey, and F. P. Netzer, "Surface Structures of Ultrathin Vanadium Oxide Films on Pd(111)," Surf.Sci. 495, 91-106 (2001).
[28] L. Zhang, R Persaud, and T. E. Madey, "Ultrathin Metal Films on A Metal Oxide surface: Growth of Au on TiO2(110)," Phys.Rev.B 56, 10549-10557 (1997).
[29] T. V. Choudhary and D. W. Goodman, "Oxidation Catalysis by Supported Gold Nano-clusters," Topics in Catal. 21, 25-34 (2002).
[30] D. W. Goodman, "Model Studies in Catalysis Using Surface Science Probes," Chem.Rev. 95, 523-536 (1995).
[31] J. Schwank, " Catalytic Gold-Applications of Elemental Au in Heterogeneous Catalysis," Gold Bull. 16, 103-(1983).
[32] M. Haruta, N. Yamada, T. Kobayashi, and S. Iijima, "Gold Catalysts Prepared by Coprecipitation for Low-temperature Oxidation of Hydrogen and of Carbon Monoxide," J.Catal. 115., 301-309 (1989).
[33] V. E. Henrich and P. A. Cox, The Surface Science of Metal Oxides (Cambridge University Press, Cambridge, 1994).
[34] B. L. M. Hendriksen, S. C. Bobaru, and J. W. M. Frenken, "Looking at Heterogeneous Catalysis at Atmospheric Pressure Using Tunnel Vision," Topics in Catal. 36, 43-53 (2005).
[35] D. W. Goodman, R. D. Kelley, T. E. Madey, and J. T. Yates Jr, "Kinetics of the Hydrogenation of CO over a Single Crystal Nickel Catalyst," J.Catal. 63, 226-234 (1980).
[36] H. P. Bonzel and H. J. Krebs, "On the Chemical Nature of the Carbonaceous Deposits on Iron After CO Hydrogenation," Surf.Sci. 91, 499-513 (1980).
[37] C. T. Campbell and M. T. Paffett, "Model Studies of Ethylene Epoxidation Catalyzed by the Ag(110) Surface," Surf.Sci. 139, 396-416 (1984).
[38] J. Miragliotta, R. S. Polizotti, P. Rabinowitz, S. D. Cameron, and R. B. Hall, "Infrared-visible Sum-frequency Generation Spectra of CO on Ni(100)," Appl.Phys.A 51, 221-225 (1990).
[39] X. Su, P. S. Cremer, Y. R. Shen, and G. A. Somorjai, "High-Pressure CO Oxidation on Pt(111) Monitored with Infrared-Visible Sum Frequency Generation (SFG)," J.Am.Chem.Soc. 119, 3994-4000 (1997).
[40] T. Dellwig, G. Rupprechter, H. Unterhalt, and H.-J. Freund, "Bridging the Pressure and Materials Gaps: High Pressure Sum Frequency Generation Study on Supported Pd Nanoparticles," Phys.Rev.Lett. 85, 776-779 (2000).
Bibliography 127
[41] G. A. Beitel, A. Laskov, H. Oosterbeek, and E. W. Kuipers, "Polarization Modulation Infrared Reflection Absorption Spectroscopy of CO Adsorption on Co(0001) Under A High-Pressure Regime," J.Phys.Chem. 100, 12494-12502 (1996).
[42] E. Ozensoy, D. C. Meier, and D. W. Goodman, "Polarization Modulation Infrared Reflection Absorption Spectroscopy at Elevated Pressures: CO Adsorption on Pd(111) at Atmospheric Pressures," J.Phys.Chem.B 106, 9367-9371 (2002).
[43] H. Bluhm, M. Hävecker, A. Knop-Gericke, E. Kleimenov, and R.Schlögl, "Methanol Oxidation on a Copper Catalyst Investigated Using in Situ X-ray Photoelectron Spectroscopy," J.Phys.Chem.B 108, 14340-14347 (2004).
[44] G. A. Somorjai, "New Model Catalysts (platinum nanoparticles) and New Techniques (SFG and STM) for Studies of Reaction Intermediates and Surface Restructuring at High Pressures During Catalytic Reactions," Appl.Surf.Sci. 121, 1-19 (1997).
[45] A. Kolmakov and D. W. Goodman, "Scanning Tunneling Microscopy of Au Clusters on TiO2(110): CO Oxidation at Elevated Pressures," Surf.Sci. 490, L597-L601 (2001).
[46] M. Valden, S. Pak, X. Lai, and D. W. Goodman, "Structure Sensitivity of CO Oxidation over Model Au/TiO2 Catalysts," Catal.Lett. 56, 7-10 (1998).
[47] M. Haruta, "Gold as a Novel Catalyst in the 21st Century: Preparation, Working Mechanism and Applications," Gold Bull. 37, 27-36 (2004).
[48] R. Meyer, C. Lemire, Sh. K. Shaikhutdinov, and H.-J. Freund, "Surface Chemistry of Catalysis by Gold," Gold Bull. 37, 72-124 (2004).
[49] K.E. Kopatzki, "Sauerstoffadsorption, Oxidbildung und Homeoepitaxie auf Ni(100) Oberflächen - eine Untersuchung mit dem Rastertunnelmikroskop," (1994)
[50] D. W. Blakely, E. I. Kozak, B. A. Sexton, and G. A. Somorjai, "New Instrumentation and Techniques to Monitor Chemical Surface Reactions on Single Crystals over a Wide Pressure Range (10-8 - 105 torr) in the Same Apparatus," J.Vac.Sci.Technol. 13, 1091-1096 (1976).
[51] A. Z. Moshfegh and A. Ignatiev, "Combined High-pressure Photocatalytic Reactor-UHV System and Sample Transfer Device," Rev.Sci.Instrum. 59, 2202-2205 (1988).
[52] A. Garcia and M. E. Kordesch, "Sample Tilting Mechanism and Transfer System for High Temperature Thin Film Deposition and Ultrahigh Vacuum Photoelectron Emission Spectroscopy," J.Vac.Sci.Technol.A 11, 461-463 (1993).
[53] T. A. Jachimowski and J. Lauterbach, "A Combined High-pressure Reaction Cell-Ultrahigh Vacuum Chamber with Sample Transfer System," Rev.Sci.Instrum. 69, 2757-2761 (1998).
[54] W. Reichl, G. Rosina, G. Rupprechter, C. Zimmermann, and K. Hayek, "Ultrahigh Vacuum Compatible all-glass High Pressure Reaction Cell for Accurate and Reproducible Measurement of Small Reaction Rates," Rev.Sci.Instrum. 71, 1495-1499 (2000).

Bibliography 128
[55] K. Y. Kung, P. Chen, F. Wei, G. Rupprechter, Y. R. Shen, and G. A. Somorjai, "Ultrahigh Vacuum High-pressure Reaction System for 2-infrared 1-visible Sum Frequency Generation Studies," Rev.Sci.Instrum. 72, 1806-1809 (2001).
[56] A. Ludviksson, J. Yoshihara, and C. T. Campbell, "A High Pressure Cell and Transfer Rod for Ultrahigh Vacuum Chambers," Rev.Sci.Instrum. 66, 4370-4374 (1995).
[57] J. Szanyi and D. W. Goodman, "Combined Elevated Pressure Reactor and Ultrahigh Vacuum Surface Analysis System," Rev.Sci.Instrum. 64, 2350-2352 (1993).
[58] A. L. Cabrera, N. D. Spencer, E. Kozak, P. W. Davies, and G. A. Somorjai, "Improved Instrumentation to Carry out Surface Analysis and to Monitor Chemical Surface Reaction in situ on Small Area Catalysts over a Wide Pressure Range (10-8-105 Torr)," Rev.Sci.Instrum. 53, 1888-1893 (1982).
[59] T. G. Rucker, k. Franck, D. Colomb, M. A. Logan, and G. A. Somorjai, "Novel High-Pressure Isolation Cell Capable of Reaching 120 atm Mounted in an UHV Chamber," Rev.Sci.Instrum. 58, 2292-2294 (1987).
[60] T. Yamada, T. Misono, K. Tanaka, and Y. Murata, "A New Type of Instrumentation Designed for the Study of Chemical Reactions on Single-crystal Surfaces," J.Vac.Sci.Technol. 7, 2808-2812 (1989).
[61] Y. N. Wang, R. McAllister, R. G. Herman, G. W. Simmons, and K. Klier, "Design and Construction of a Simple UHV-compatible High-pressure Reaction Cell," Rev.Sci.Instrum. 63, 5767-5770 (1992).
[62] M. Johansson, J. Hoffmann. Jørgensen, and I. Chorkendorff, "Combined High-Pressure Cell-ultrahigh Vacuum System for Fast Testing of Model Metal Alloy Catalysts Using Scanning Mass Spectrometry," Rev.Sci.Instrum. 75, 2082-2092 (2004).
[63] K. E. Keck, B. Kasemo, and A. Höglund, "UHV-compatible Reaction Cell for Combined High-and Low-pressure Studies of Surface Reactions," Rev.Sci.Instrum. 54, 574-578 (1983).
[64] J. J. Vajo, W. Tsai, and W. H. Weinberg, "Versatile Microreactor for Studies of Gas-Surface Catalytic Reactions Between 10-7 and 1000 Torr," Rev.Sci.Instrum. 56, 1439-1442 (1985).
[65] S. Ichikawa and M. S. Wilson, "Sample Transfer System for Surface Studies in Wide Pressure Range (10-7-105Pa)," Rev.Sci.Instrum. 58, 317-319 (1987).
[66] F. Kießlich, P. M. Prechtl, H. Gerhard, M. A. Liauw, N. Popovska, and G. Emig, "Entwicklung eines Dosierkonzepts für kleinste Volumenströme," Chemie Ingenieur Technik 75, 349-354 (2003).
[67] R. Leppelt, B. Schumacher, T. Häring, M. Kinne, and R. J. Behm, "Low-pressure Microreactor System for Kinetic Studies on High Surface Area Catalysts in the Pressure Gap," Rev.Sci.Instrum. 76, 024102-1-024102-6 (2005).
[68] F. Cosandey, L. Zhang, and T. E. Madey, "Effect of Substrate Temperature on the Epitaxial Growth of Au on TiO2(110)," Surf.Sci. 474, 1-13 (2001).

Bibliography 129
[69] H. Over, Y. D. Kim, A. P. Seitsonen, S. Wendt, E. Lundgren, M. Schmid, P. Varga, A. Morgante, and G. Ertl, "Atomic-Scale Structure and Catalytic Reactivity of the RuO2(110) Surface," Science 287, 1474-1476 (2000).
[70] B. Schumacher, Y. Denkwitz, V. Plzak, M. Kinne, and R. J. Behm, "Kinetic, Mechanism, and the Influence of H2 on the CO Oxidation Reaction on a Au/TiO2 Catalyst," J.Catal. 224, 449-462 (2004).
[71] G. Binning, H. Rohrer, Ch. Gerber, and E. Weibel, "Surface Studies by Scanning Tunneling Microscopy," Phys.Rev.Lett. 49, 57-61 (1982).
[72] Tit-Wah Hui, http://www.chembio.uoguelph.ca/educmat/chm729/STMpage/stmtutor .htm
[73] J. Bardeen, "Tunneling From a Many-particle Point of View," Phys.Rev.Lett. 6, 57-59 (1961).
[74] J. Tersoff and D. R. Hamann, "Theory of the Scanning Tunneling Microscope," Phys.Rev.B 31, 805-813 (1985).
[75] F. Besenbacher, "Scanning Tunneling Microscopy Studies of Metal Surfaces," Rep.Prog.Phys. 59, 1737-1802 (1996).
[76] S. Hüfner, Photoelectron Spectroscopy: Principles and Applications (Springer, Berlin, New York, Barcelona, Budapest, Hong Kong, London, Milan, Paris, Santa Clara, Singapore, Tokyo, 1995).
[77] A. L. Robinson, Soft X-ray Spectromicroscopy: Materials Characterization on a Microscale (Advanced Light Source and Department of Energy Publication, 1997).
[78] D. Briggs and M. P. Seah, Practical Surface Analysis-Auger and X-ray Photoelectron Spectroscopy (John Wiley & Sons, Chichester, New York, Brisbane, Toronto, Singapore, 1990).
[79] H. Lueth, Surfaces and Interfaces of Solid Materials (Springer, Berlin; Heidelberg; New York; London; Paris; Tokyo; Hong Kong; Barcelona; Budapest, 1995).
[80] C. C. Chang, "Analytical Auger Electron Spectroscopy," Characterization of Solid Surfaces, (Plenum Press, New York, London ) 509-561 (1974).
[81] A. R. Chourasia and D. R. Chopra, Handbook of Instrumental Techniques for Analytical Chemistry ( 1996).
[82] P. A. Redhead, "Thermal Desorption of Gases," Vacuum 12, 203-211 (1962).
[83] M. S. Chen, W. T. Wallace, D. Kumar, Z. Yan, K. K. Gath, Y. Cai, Y. Kuroda, and D. W. Goodman, "Synthesis of Well-ordered Ultra-thin Titanium Oxide Films on Mo(112)," Surf.Sci. 581, L115-L121 (2005).
[84] T. V. Ashworth and G. Thronton, "Thin Film TiO2 on Nickel(110): An STM Study," Thin Solid Films 400, 43-45 (2001).
Bibliography 130
[85] L. S. Dubrovinsky, N. A. Dubrovinskaia, V. Swamy, J. Muscat, R. Ahuja, B. Holm, and B. Johansson, "The Hardest Known Oxide," Nature 410, 653-654 (2001).
[86] M. J. J. Jak, C. Konstapel, A. van Kreuningen, J. Chrost, J. Verhoeven, and J. W. M. Frenken, "The influence of Substrate Defects on the Growth Rate of Palladium Nanoparticles on a TiO2(110) Surface," Surf.Sci. 474, 28-36 (2001).
[87] M. Ramamoorthy, R. D. King-Smith, and D. Vanderbild, "Defects on TiO2(110) Surfaces," Phys.Rev.B 49, 7709-7715 (1994).
[88] S. Takakusagi, K. Fukui, and Y. Iwasawa, "STM Study on Structures of Two Kinds of Wide Strands Formed on TiO2(110)," Surf.Sci.Lett. 523, L41-L46 (2003).
[89] M. Ashino, Y. Sugawara, S. Morita, and M. Ishikawa, "Atomic Resolution Noncontact Atomic Force and Scanning Tunneling Microscopy of TiO2(110)-(1×1) and (1×2): Simultaneous Imaging of Surface Structures and Electronic States," Phys.Rev.Lett. 86, 4334-4337 (2001).
[90] M. Ashino, T. Uchihashi, K. Yokoyama, Y. Sugawara, S. Morita, and M. Ishikawa, "STM and Atomic-resolution Noncontact AFM of an Oxygen-deficient TiO2(110) Surface," Phys.Rev.B 61, 13955-13959 (2000).
[91] Q. Guo, I. Cocks, and E. M. Williams, "Surface Structure of (1×2) Reconstructed TiO2(110) Studied Using Electron Stimulated Desorption Ion Angular Distribution," Phys.Rev.Lett. 77, 3851-3854 (1996).
[92] P. J. Møller and M. C. Wu, "Surface Geometrical Structure and Incommensurate Growth: Ultrathin Cu Films on TiO2(110)," Surf.Sci. 224, 265-276 (1989).
[93] A. Szabo and T. Engel, "Structural Studies of TiO2(110) Using Scanning Tunneling Microscopy," Surf.Sci. 329, 241-254 (1995).
[94] P. W. Murray, N. G. Condon, and G. Thornton, "Effect of Stoichiometry on the Structure of TiO2(110)," Phys.Rev.B 51, 10989-10997 (1995).
[95] H. Onishi and Y. Iwasawa, "Reconstruction of TiO2(110) Surface: STM Study with Atomic-scale Resolution ," Surf.Sci. 313, L783-L789 (1994).
[96] M. Sander and T. Engel, "Atomic Level Structure of TiO2(110) as a Function of Surface Oxygen Coverage," Surf.Sci.Lett. 302, L302-L268 (1994).
[97] M. Li, W. Hebenstreit, U. Diebold, M. A. Henderson, D. R. Jennison, P. A. Schultz, and M. P. Sears, "Oxygen-induced Reconstructing of the Rutile TiO2(110)-(1×1) Surface: A Comprehensive Study," Surf.Sci. 437, 173-190 (1999).
[98] D. Vogtenhuber, R. Podloucky, A. Neckel, S. G. Steinemann, and A. J. Freeman, "Electronic Structure and Relaxed Geometry of the TiO2(100) Rutile Surface," Phys.Rev.B 49, 2099-2103 (1994).
[99] P. Reinhardt and B. A. Heß, "Electronic and Geometric Structure of Rutile Surfaces," Phys.Rev.B 50, 12015-12024 (1994).

Bibliography 131
[100] P. J. D. Lindan, N. M. Harrison, and J. A. White, "First-principles Spin-polarized Calculations on the Reduced and Reconstructed TiO2(110) Surface," Phys.Rev.B 55, 15919-15927 (1997).
[101] K. F. Ferrisa and L. Q. Wang, "Electronic Structure Calculations of Small Molecule Adsorbates on (110) and (100) TiO2," J.Vac.Sci.Technol.A 16, 956-960 (1998).
[102] A. T. Paxton and L. Thieˆn-Nga, "Electronic Structure of Reduced Titanium Dioxide," Phys.Rev.B 57, 1579-1584 (1998).
[103] M. Ramamoorthy, R. D. King-Smith, and D. Vanderbild, "First Principle Calculations of the Energetic Stoichiometric TiO2 Surface," Phys.Rev.B 49, 16721-16727 (1994).
[104] S. P. Bates, G. Kresse, and M. J. Gillan, "A Systematic Study of the Surface Energetics and Structure of TiO2 (110) by First Principles Calculation," Surf.Sci. 385, 386-394 (1997).
[105] J. Goniakowski and C. Noguera, "Electronic Structure of Clean Insulating Oxide Surfaces I. A Numerical Approach," Surf.Sci. 319, 68-80 (1994).
[106] J. Purton, D. W. Bullett, P. W. Oliver, and S. C. Parker, "Electronic Structure and Atomistic Simulations of the Ideal and Defective Surfaces of Rutile," Surf.Sci. 336, 166-180 (1995).
[107] N. Yu and J. W. Halley, "Electronic Structure of Point Defect in Rutile TiO2," Phys.Rev.B 51, 4768-4776 (1995).
[108] J. Goniakowski and C. Noguera, "Atomic and Electronic Structure of Steps and Kinks on MgO(100) and MgO(110)," Surf.Sci. 323, 191-204 (1995).
[109] M. Casarin, C. Maccota, and A. Vittadini, "Molecular Chemisorption on TiO2(110): A Local Point of View," J.Phys.Chem.B 102, 10745-10752 (1998).
[110] P. K. Schelling, N. Yu, and J. W. Halley, "Self-consistent Tight-binding Atomic-relaxation Model of Titanium Dioxide," Phys.Rev.B 58, 1279-1293 (1998).
[111] S. Munnix and M. Schmeits, "Origin of Defect States on the Surface of TiO2," Phys.Rev.B 31, 3369-3371 (1985).
[112] Z. H. Barber, "The Control of Thin Film Deposition and Recent Developments in Oxide Film Growth," J.Mater.Chem. 16, 334-344 (2006).
[113] H. C. Galloway, J. J. Benitez, and M. Salmeron, "The Structure of Monolayer Films of FeO on Pt( 111)," Surf.Sci. 298, 127-133 (1993).
[114] G. H. Vurens, D. R. Strongin, M. Salmeron, and G. A. Somorjai, "An ISS and AES Study of Alkali Induced Sintering of an Iron Oxide Monolayer Adsorbed on Pt(111)," Surf.Sci. 199, L387-L393 (1988).
[115] S. A. Chambers, "Epitaxial Growth and Properties of Thin Film Oxide," Surf.Sci.Rep. 39, 105-180 (2000).
Bibliography 132
[116] J. A. Venables, G. D. T. Spiller, and M. Hanücken, "Nucleation and Growth of Thin Film," Rep.Prog.Phys. 47, 399-459 (1984).
[117] J. A. Venables, "Nucleation and Growth Processes in Thin Film Formation," J.Vac.Sci.Technol.B. 4, 870-873 (1986).
[118] C. Argile and G. E. Rhead, "Adsorbed Layer and Thin Film Growth Modes Monitored by Auger Electron Spectroscopy," Surf.Sci.Rep. 10, 277-356 (1989).
[119] J. A. Venables, "Atomic Processes in Crystal Growth," Surf.Sci. 299/300, 798-817 (1994).
[120] A. J. Melmed, "Influence of Adsorbed Gas on Surface Diffusion and Nucleation," J.Appl.Phys. 37, 275-279 (1966).
[121] M. K. Hiebs and L. Lassak, "Structural and Electrical Properties of Chronium and Nickel Films Evaporated in the Presence of Oxygen," Thin Solid Films 20, 63-73 (1974).
[122] S. S. Kim and B. T. Lee, "Effects of Oxygen Pressure on the Growth of Pulsed Laser Deposited ZnO films on Si(001)," Thin Solid Films 446, 307-312 (2004).
[123] J. P. S. Badyal, A. J. Gellman, R. W. Judd, and R. M. Lambert, "Single Crystal Modeling of the SMSI Phenomenon: Structure, Composition, and Electronic Effects and CO Chemisorption at the Ru(0001)/TiOx Interface," Catal.Lett. 1, 41-50 (1988).
[124] W. J. Lo, Y. W. Chung, and G. A. Somorjai, "Electron Spectroscopy Studies of the Chemisorption of O2, H2, and H2O on the TiO2(110) Surface with Varied Stoichiometry: Evidence in chemisorption," Surf.Sci. 71, 199-219 (1978).
[125] Y. W. Chung, W. J. Lo, and G. A. Somorjai, "Low Energy Electron Diffraction and Electron Spectroscopy Studies of the Clean (110) and (100) Titanium Dioxide (rutile) Crystal Surface," Surf.Sci. 64, 588-602 (1977).
[126] D. Gonbeau, C. Guimon, G. Pfister-Guillouzo, A. Levasseur, G. Meunier, and R. Dormoy, "XPS Study of Thin Films of Titanium Oxysulfides," Surf.Sci. 254, 81-89 (1991).
[127] G. Lu, S. L. Bernasek, and J. Schwartz, "Oxidation of a Polycrystalline Titanium Surface by Oxygen and Water," Surf.Sci. 458, 80-90 (2000).
[128] A. Azoulay, N. Shamir, E. Fromm, and M. H. Mintz, "The Initial Interactions of Oxygen with Polycrystalline Titanium Surfaces," Surf.Sci. 370, 1-16 (1997).
[129] C. J. Powell and A. Jablonski, "NIST Electron Inelastic-Mean-Free-Path Database," (2000).
[130] M. Aizawa and S. L. Anderso, "Deposition Dynamics and Chemical Properties of Size-selected Ir Clusters on TiO2," Surf.Sci. 542, 253-275 (2003).
[131] S. Kielbassa, M. Kinne, and R. J. Behm, "Thermal Stability of Au Nanoparticles in O2 and Air on Fully Oxidized TiO2(110) Substrates at Elevated Pressures. An AFM/XPS Study of Au/TiO2 Model Systems," J.Phys.Chem.B 108, 19184-19190 (2004).

Bibliography 133
[132] L. J. Clarke, Surface crystallography: An Introduction to Low Energy Electron Diffraction (A Wiley-Interscience Publication, Chichester, New York, Brisbane, Toronto, Singapore, 1985).
[133] U. Diebold, J. F. Anderson, K. O. Ng, and D. Vanderbilt, "Evidence for the Tunneling Site on Transition-Metal Oxides: TiO2(110)," Phys.Rev.Lett. 77, 1322-1325 (1996).
[134] S. Wendt, R. Schaub, J. Matthiesen, E. K. Vestergaard, E. Wahlstro¨m, M. D. Rasmussen, P. Thostrup, L. M. Molina, E. Lægsgaard, I. Stensgaard, B. Hammer, and F. Besenbacher, "Oxygen Vacancies on TiO2(110) and Their Interaction with H2O and O2: A Combined High-resolution STM and DFT Study," Surf.Sci. 598, 226-245 (2005).
[135] X. Lai and C. Xu, "Synthesis and Structure of Al Clusters Supported on TiO2(110): A Scanning Tunneling Microscopy Study," J.Vac.Sci.Technol.A 16, 2562-2564 (1998).
[136] C. Xu, X. Lai, G. W. Zajac, and D. W. Goodman, "Scanning Tunneling Microscopy studies of the TiO2(110) surface: Structure and the Nucleation Growth of Pd," Phys.Rev.B 56, 13464-13482 (1997).
[137] K. O. Ng and D. Vanderbilt, "Structure and Apparent Topography of TiO2(110) Surfaces," Phys.Rev.B 56, 10544-10548 (1997).
[138] O. Gülseren, R. James, and D. W. Bullett, "Theoretical Analysis of STM Experiments at Rutile TiO2 surface," Surf.Sci. 377-379, 150-154 (1997).
[139] R. E. Tanner, M. R. Castell, and G. A. D. Briggs, "High Resolution Scanning Tunneling Microscopy of the Rutile TiO2(110) Surface," Surf.Sci. 412-413, 672-680 (1998).
[140] G. C. Bond and D. T. Thompson, "Catalysis by Gold," Catal.Rev.Sci.Eng. 41, 319-388 (1999).
[141] H. Schmidbaur, "The Aurophilicity Phenomenon: A Decade of Experimental Findings, Theoretical Concepts and Emerging Applications," Gold Bull. 33, 3-10 (2000).
[142] P. Pyykko and J. P. Claux, "Relativity and the Periodic System of Elements," Acc.Chem.Res. 12, 276-281 (1979).
[143] K. Pitzer, "Relativistic Effects on Chemical Properties," Acc.Chem.Res. 12, 271-276 (1979).
[144] P. Pyykko, "Relativity, Gold, Closed-Shell Interactions, and CsAuNH3," Angew.Chem.Int.Edit. 41, 3573-3578 (2002).
[145] B. Hammer and J. K. Norskov, "Why Gold is the Noblest of All the Metals," Nature 376, 238-240 (1995).
[146] W. P. Halperin, "Quantum Size Effects in Metal Particles," Rev.Mod.Phys. 58, 533-603 (1986).
Bibliography 134
[147] B. Issendorff and O. Cheshnovsky, "Metal to Insulator Transitions in Clusters," Annu.Rev.Phys.Chem. 56, 549-580 (2005).
[148] G. C. Bond, "The Origins of Particle Size Effects in Heterogeneous Catalysis," Surf.Sci. 156, 996-981 (1985).
[149] M. Valden, X. Lai, and D. W. Goodman, "Onset of Catalytic Activity of Gold Clusters on Titania with the Appearance of Nanometallic Properties," Science 281, 1647-1650 (1998).
[150] D. W. Goodman, "Chemical and Spectroscopic Studies of Metal Oxide Surfaces," J.Vac.Sci.Technol.A 14, 1526-1531 (1996).
[151] A. K. Santra and D. W. Goodman, "Oxide-supported Metal Clusters: Models for Heterogeneous Catalysts," J.Phys.: Condens.Matter 14, R31-R62 (2002).
[152] M. G. Mason, L. J. Gerenser, and S. T. Lee, "Electronic Structure of Catalytic Metal Clusters Studied by XPS," Phys.Rev.Lett. 39, 288-291 (1977).
[153] G. K. Wertheim, S. B. Dicenzo, and S. E. Yougquist, "Unit Charge on Supported Gold Clusters in Photoemission Final State," Phys.Rev.Lett. 51, (1983).
[154] G. K. Wertheim, S. B. Dicenzo, and D. N. E. Buchanan, "Noble- and Transition-metal Clusters: The d Band of Silver and Palladium," Phys.Rev.B 33, (1986).
[155] G. K. Wertheim and S. B. Dicenzo, "Cluster Growth and Core-electron Binding Energies in Supported Metal Clusters," Phys.Rev.B 37, 844-847 (1988).
[156] S. B. Dicenzo, S. D. Berry, and E. H. Jr. Hartford, "Photoelectron Spectroscopy of Single Size Au-cluster Collected on Substrate," Phys.Rev.B 38, 8465-8468 (1988).
[157] E. Wahlström, N. Lopez, R. Schaub, P. Thostrup, A. Rønnau, C. Africh, E. Lægsgaard, J. K. Nørskov, and F. Besenbacher, "Bonding of Gold Nanoclusters to Oxygen Vacancies on Rutile TiO2(110)," Phys.Rev.Lett. 90, 026101-1-026101-4 (2003).
[158] U. Diebold, J. M. Pan, and T. E. Madey, "Growth Mode of Untrathin Cu Layer on TiO2(110)," Phys.Rev.B 47, 3868-3876 (1994).
[159] A. Vijay and G. Mills, "Adsorption of Gold on Stoichiometric and Reduced Rutile TiO2 (110) surfaces," J.Chem.Phys. 118, 6536-6551 (2003).
[160] N. Lopez and J. K. Nørskov, "Catalytic CO Oxidation by a Gold Nanoparticle: A Density Functional Study," J.Am.Chem.Soc. 124, 11262-11263 (2002).
[161] J. R. Kitchin, M. A. Barteau, and J. G. Chen, "A Comparison of Gold and Molybdenum Nanoparticles on TiO2(110)-(1×2) Reconstructed Single Crystal Surfaces," Surf.Sci. 526, 323-331 (2003).
[162] O. Dulub, W. Hebenstreit, and U. Diebold, "Imaging Cluster Surfaces with Atomic Resolution: The Strong Metal-Support Interaction State of Pt Supported on TiO2(110)," Phys.Rev.Lett. 84, 3646-3649 (2000).

Bibliography 135
[163] M. Bowker, P. Stone, R. Bennett, and N. Perkins, "CO Adsorption on a Pd/TiO2(110) Model Catalyst," Surf.Sci. 497, 155-165 (2002).
[164] C. E. J. Mitchell, A. Howard, M. Carney, and R. G. Egdell, "Direct Observation of Behavior of Au Nanoclusters on TiO2 at Elevated Temperatures," Surf.Sci. 490, 196-210 (2001).
[165] A. K. Santra, A. Kolmakov, F. Yang, and D. W. Goodman, "Growth of Au on TiO2 (110) on a Cluster by Cluster Basis," Jpn.J.Appl.Phys. 42, 4795-4798 (2003).
[166] C. Lemire, R. Meyer, and H.-J. Freund, "CO Adsorption on Oxide Supported Gold: From Small Clusters to Monolayer Islands and Three-dimensional Nanoparticles," Surf.Sci. 552, 27-34 (2004).
[167] Y. Maeda, T. Fujitani, S. Tsubota, and M. Haruta, "Size and Density of Au Particles Deposited on TiO2(110)-(1x1) and Cross-linked (1×2) Surfaces," Surf.Sci. 562, 1-6 (2004).
[168] N. Spiridis, J. Haber, and J. Korecki, "STM Studies of Au Nano-clusters on TiO2(110)," Vacuum 63, 99-105 (2001).
[169] T. T. P. Cheung, "X-Ray Photoemission of Small Platinum and Palladium Clusters," Surf.Sci. 140, 151-164 (1984).
[170] M. G. Mason, "Electronic Structure of Supported Small Metal Clusters," Phys.Rev.B 28, 748-762 (1983).
[171] J. T. Yates Jr, "Chemisorption on Surfaces-A Historical Look at a Representative Adsorbates: Carbon Monoxide," Surf.Sci. 299, 731-741 (1994).
[172] G. A. Somorjai, Introduction to surface chemistry and catalysis (Wiley Interscience, New York, 1994).
[173] W. Göpel, G. Rocker, and P. Feierabend, "Intrinsic Defects on TiO2(110): Interaction with Chemisorbed O2, H2,CO and CO2," Phys.Rev.B 28, 3427-3438 (1983).
[174] A. Linsebigler, G. Lu, and J. T. Yates Jr, "CO Chemisorption on TiO2(110): Oxygen Vacancy Site Influence on CO Adsorption," J.Chem.Phys. 103, 9438-9443 (1995).
[175] M. C. Torquemada, J. L. de Segovia, and E. Roman, "Reactivity of CO on a TiO2 (110) Defective Surface Studied by Electron Stimulated Desorption," Surf.Sci. 337, 31-39 (1995).
[176] G. B. Rauppt and J. A. Dumesic, "Adsorption of CO, CO2, H2, and H2O on Titania Surfaces With Different Oxidation States," J.Phys.Chem. 89, 5240-5246 (1985).
[177] Y. Iizuka, H. Fujiki, N. Yamauchi, T. Chijiiwa, S. Arai, S. Tsubota, and M. Haruta, "Adsorption of CO on Gold Supported TiO2," Catal.today. 36, 115-123 (1997).
[178] D. D. Beck and J. M. White, "Catalytic Reduction of CO with Hydrogen Sulfide. 3. Study of Adsorption of O2, CO, and CO Coadsorbed with H2S on Anatase and Rutile Using Auger Electron Spectroscopy and Temperature-Programmed Desorption," J.Phys.Chem. 90, 3132-3136 (1986).

Bibliography 136
[179] H. Kobayashi and M. Yamaguchi, "Ab initio MO Study of Adsorption of CO Molecule on TiO2 Surfaces," Surf.Sci. 214, 466-476 (1989).
[180] Sh. K. Shaikhutdinov, R. Meyer, D. Lahav, M. Bäumer, T. Klüner, and H.-J. Freund, "Determination of Atomic Structure of the Metal-Oxide Interface: Pd Nanodeposits on an FeO(111) Film," Phys.Rev.Lett. 91, 076102-1-076102-4 (2003).
[181] M. Valden, "Low Dimentional Surface Physics and Chemistry: TiO2 Supported Au Nanoclusters," 1-16 (2000).
[182] L. M. Molina, M. D. Rasmussen, and B. Hammer, "Adsorption of O2 and Oxidation of CO at Au Nanoparticles Supported by TiO2(110)," J.Chem.Phys. 120, 7673-7680 (2004).
[183] P. L. Hansen, J. B. Wagner, S. Helveg, J. R. R. Nielsen, B. S. Clausen, and H. Topsoe, "Atom-Resolved Imaging of Dynamic Shape Changes in Supported Copper Nanocrystals ," Science 295, 2053-2055 (2002).
[184] J.-D. Grundwaldt and A. Baiker, "Gold/Titania Interfaces and Their Role in Carbon Monoxide Oxidation," J.Phys.Chem.B 103, 1002-1012 (1999).
[185] S. R. Bahn, N. Lopez, J. K. No.rskov, and K. W. Jacobsen, "Adsorption-induced Restructuring of Gold Nanochains," Phys.Rev.B 66, 81405-1-81405-4 (2002).
[186] N. Lopez, J. K. Nørskov, T. V. W. Janssens, A. Carlsson, A. Puig-Molina, B. S. Clausen, and J.-D. Grundwaldt, "The Adhesion and Shape of Nanosized Au Particles in a Au/TiO2 Catalyst," J.Catal. 225, 86-94 (2004).
[187] P. Mars and D. W. van Krevelen, "Oxidations Carried Out by Means of Vanadium Oxide Catalysts," Special Supplement to Chemie Engenieering Science 3, 41-57 (1954).
[188] T. Akita, K. Tanaka, S. Tsubota, and M. Haruta, "Analytical High Resolution TEM Study of Supported Gold Catalysts: Orientation Relationship Between Au Particles and TiO2 Supports," J-Electr.Micros. 49, 657-662 (2000).
[189] Z. M. Liu and M. A. Vannice, "CO and O2 Adsorption on Model Au/TiO2 Systems," Catal.Lett. 43, 51-54 (1997).
[190] M. Haruta, "When Gold Is Not Noble: Catalysis by Nanoparticles," The Chemical Record 3, 75-87 (2003).
[191] M. M. Schubert, S. Hackenberg, A. C. van Veen, M. Muhler, V. Plzak, and R. J. Behm, "CO Oxidation Over Supported Gold Catalysts-"inert" and "active" Support Materials and Their Role for the Oxygen Supply During Reaction," J.Catal. 197, 113-122 (2001).
[192] Ton. V. W. Janssens, A. Carlsson, A. Puig-Molina, and B. S. Clausen, "Relation Between Nanoscale Au Particle Structure and Activity for CO Oxidation on Supported Gold Catalysts," J.Catal. 240, 108-113 (2006).
Bibliography 137
[193] A. Carlsson, A. Puig-Molina, and T. V. W. Janssens, "New Method for Analysis of Nanoparticle Geometry in Supported fcc Metal Catalysts with Scanning Transmission Electron Microscopy," J.Phys.Chem.B 110, 5286-5293 (2006).
[194] V. A. Bondzie, S. C. Parker, and C. T. Campbell, "The Kinetics of CO Oxidation by Adsorbed Oxygen on Well-defined Gold Particles on TiO2(110)," Catal.Lett. 63, 143-151 (1999).
[195] R. Busani, M. Folkers, and O. Cheshnovsky, "Direct Observation of Band-Gap Closure in Mercury Clusters," Phys.Rev.Lett. 81, 3836-3839 (1998).
[196] J. A. Alonso, "Electronic and Atomic Structure, and Magnetism of Transition-Metal Clusters," Chem.Rev. 100, 637-677 (2000).
[197] H G. Boyen, Th. Herzog, G. Kästle, F. Weigl, P. Ziemann, J. P. Spatz, M. Möller, R. Wahrenberg, M. G. Garnier, and P. Oelhafen, "X-ray Photoelectron Spectroscopy Study on Gold Nanoparticles Supported on Diamond," Phys.Rev.B 65, 075412-1-075412-4 (2002).
[198] N. Lopez, T. V. W. Janssens, B. S. Clausen, Y. Xu, M. Mavrikakis, T. Bligaard, and J. K. Nørskov, "On the Origin of the Catalytic Activity of Gold Nanoparticles for Low-temperature CO Oxidation," J.Catal. 223, 232-235 (2004).
[199] F. Boccuzzi and A. Chiorino, "FTIR Study of CO Oxidation on Au/TiO2 at 90 K and Room Temperature. An Insight into the Nature of the Reaction Centers," J.Phys.Chem.B 104, 5414-5416 (2000).
[200] G. C. Bond and D. T. Thompson, "Gold-Catalysed Oxidation of Carbon Monoxide," Gold Bull. 33, 41-51 (2000).
[201] H. H. Kung, M. C. Kung, and C. K. Costello, "Supported Au Catalysts for Low Temperature CO Oxidation," J.Catal. 216, 425-432 (2003).
[202] F. Boccuzzi, A. Chiorino, M. Manzoli, P. Lu, T. Akita, S. Ichikawa, and M. Haruta, "Au/TiO2 Nanosized samples: A catalytic TEM and FTIR Study of the Effect of Calcination Temperature on the CO Oxidation," J.Catal. 202, 256-267 (2001).
[203] C. Winkler, A.J. Carew, S. Haq, and R. Raval, "Carbon Monoxide on Alumina Single Crystal Surfaces with Gold Nanoparticles," Langmuir 19 (2003) 717.
[204] G. McElhiney and J. Pritchard, "The Adsorption of Xe and CO on Au(110)," Surf.Sci. 60 (1976) 397.
[205] J.M. Gottfried, K.J. Schmidt, S.L.M. Schroeder, and K. Christmann, "Adsorption of Carbon Monoxide on Au(110)-(1×2)," Surf. Sci. 536 (2003) 206. [206] C. Zhang, H. He, and K.-I. Tanaka, " Perfect Catalytic Oxidation of Formaldehyde Over a Pt/TiO2 Catalyst at Room Temperature," Catalysis Communications 6 (2005) 211. [207] C.T. Campbell, A.W. Grant, D.E. Starr, S.C. Parker, and V.A. Bondzie, " Model Oxide-supported Metal Catalysts: Energetics, Particle Thickness, Chemisorption and

Bibliography 138
Catalytic properties," Topics in Catalysis 14 (2001) 43. [208] J.M. Gottfried and K. Christmann, " Oxidation of Carbon Monoxide Over Au(110)- (1×2)," Surf. Sci. 566-568 (2004) 1112. [209] T. Diemant, B. Schumacher, R. Leppelt, Z. Zhao, H. Rauscher, and R. J. Behm, " Kinetic and PM-FTIR Study of CO Oxidation on Au/TiO2 Model Catalysts," to be publ.. [210] M. Olea and Y. Iwasawa, "Transient Studies on Carbon Monoxide Oxidation Over Supported Gold Catalysts: Support Effects," Appl. Catal. A 275 (2004) 35.
Acknowledgements 139
Acknowledgements
The work in the thesis has profited tremendously from long standing support and invaluable
advice from the group senior Prof. R.J. Behm. He lead me into the palace of science and
teaches me how to become a qualified scientist. What I learned from him will profit my life in
the future. I thank him gratefully. I acknowledge gratefully PD.Dr. H. Rauscher and PD.Dr. J.
Bansmann. They spent their precious time on helping me with the measurements, discussions
and in the proof reading of this thesis. Dr. H. Hoster is also appreciated gratefully because of
his kind help with the STM measurements and the powerful software for STM image analysis
developed by him.
I would like to thank Prof. U. Diebold appreciatively for having shown interest in the field
of titania by directing me on experiments for a few weeks.
During the course of my PhD studies in the AOK group, I have cooperated and interacted
with a large number of people. I would specifically like to thank my principal collaborators
Dipl.Chem. T. Diemant, we worked together on the design and test of high pressure cell and
kinetic measurements of CO oxidation on model catalyst Au/TiO2. In addition, I would like to
thank Dipl.Chem. A. Männig for the collaborating work on ultrathin titania oxide film on Ru.
I have profited from discussions with many people in the department, notably, Dr. B.
Schumacher, Dr. S. Gopalakrishnan, Dipl.Chem. S. Kielbassa, Dipl.Chem T. Hager,
Dipl.Chem. R. Leppelt, Dr. J. Cai, Dr. H.S. Wang, and Dr. Y.X. Chen. Mr. T. Häring and Mr.
G. Bräth are appreciated for their efficient technical support. Ms. Botzenhart is also
appreciated for her kind help.
Acknowledgements 140
I have enjoyed a fruitful collaboration with Dipl.Chem. D. Rosenthal from Prof. K.
Christmann’s group at the Institut für Chemie, Bereich Physikalische und Theoretische Chemie,
Freie Universität Berlin.
A number of people have made suggestions for improvements during the making of this
thesis. Prof. Z.Y. Chen commented on parts of the thesis. Last, but not least, my scientific
endeavors have been impossible were it not for the caring support from X.M. Wang, my lovely
wife.
I thank the Deutsche Forschungsgemeinschaft for the financial support within Be 1201/9 in
the priority programme 1091 “Bridging the Pressure and Materials Gap in Heterogeneous
Catalysis”.

Curriculum vitae 141
Curriculum vitae
Name: Zhong Zhao
Date of Birth: June 04, 1968
City: Lan Zhou
Nationality: China
Education:
1986.9-1990.7 Bachelor of engineer
Hua zhong university of science and technology.
Wu Han, Hu Bei, China.
1993.9-1996.9 Master of physics science
Topic: Preparation and characterization of gas-sensitive ZnO nano-particle
thin film.
Xi’an JiaoTong University and Lan zhou institute of physics.
Lan Zhou, Gan Su, China.
2001.9- Study for PhD
Topic: Bridging the Material and Pressure gaps in Catalysis Studies by
Au/TiO2/Ru Model Catalysts and UHV attached High Pressure Cell.
Dept. Surface Chemistry and Catalysis, University of Ulm.
Ulm, Germany.
Employment:
1990.9-1993.9 Vacuum physics and technology

Curriculum vitae 142
1996.9-2000.9 Portable leak test technology with QMS and LB thin film.
Lanzhou institute of physics.
Lan Zhou, Gan Su, China.
2000.10-2001.9 Surface science as a visiting scholar: Interaction between oxygen
impurities and Al adatoms on Al (111) and its effect on nucleation and
growth.
I. Institut of physics, RWTH-Aachen, Aachen, Germany.