Embed Size (px)
Citation preview
8/4/2019 110922-Tom Barthold-Joint Deficit Cmte Testimony
http://slidepdf.com/reader/full/110922-tom-barthold-joint-deficit-cmte-testimony 1/86
1
TESTIMONY OF THE STAFF OF THE JOINT COMMITTEE ON TAXATION
BEFORE THE JOINT SELECT COMMITTEE ON DEFICIT REDUCTION
SEPTEMBER 22, 2011
My name is Thomas A. Barthold. I am the Chief of Staff of the Joint Committee onTaxation. It is my pleasure this morning to provide a brief overview of the Federal tax system.
You asked if I could emphasize the income taxation of individuals and corporations. My writtentestimony provides additional details and includes an appendix with further information.Members have separately been provided with several charts and tables to which I will refer during my oral testimony.
The staff of the Joint Committee on Taxation is nonpartisan and serves the entireCongress. The staff of the Joint Committee on Taxation includes experienced professionaleconomists, attorneys, and accountants, who assist Members of the majority and minority partiesin both houses of Congress on tax legislation.
JOINT COMMITTEE ON TAXATIONSeptember 22, 2011
JCX-49-11

8/4/2019 110922-Tom Barthold-Joint Deficit Cmte Testimony
http://slidepdf.com/reader/full/110922-tom-barthold-joint-deficit-cmte-testimony 2/86
2
I. OVERVIEW OF THE FEDERAL INCOME TAX SYSTEM
A. Historical Federal Receipts by Source
Figure 1 below shows aggregate Federal receipts by source for 2011. The individualincome tax is the largest source of Federal revenue, comprising 47.1 percent of the total Federalrevenues, while social insurance (employment) taxes1 are the second largest source of revenue at just over 35.3 percent. No other single source constitutes more than ten percent of Federalrevenue.
1 The principal social insurance (employment) taxes are the Federal Insurance Contributions Act (FICA)and Self-Employment Contributions Act (SECA) taxes that fund the Social Security and Medicare systems.

8/4/2019 110922-Tom Barthold-Joint Deficit Cmte Testimony
http://slidepdf.com/reader/full/110922-tom-barthold-joint-deficit-cmte-testimony 3/86
3
Individual Income Tax
47.1%
Corporate Income
8.3%
Social Insurance
35.3%
Excises
3.1%
Estate & Gift
0.4%
Other
5.9%
Figure 1.−Federal Receipts by Source, 2011
Source: Congressional Budget Office, August 2011 baseline.

8/4/2019 110922-Tom Barthold-Joint Deficit Cmte Testimony
http://slidepdf.com/reader/full/110922-tom-barthold-joint-deficit-cmte-testimony 4/86
4
Figure 2 below shows Federal receipts by source as a percentage of all Federal receiptsfrom 1950 to 2010. The individual income tax has always been the largest source of Federalrevenue, oscillating around its average share of 44.8 percent over this period. The corporate andexcise taxes have declined as a percentage of all revenues, and social insurance taxes have risensubstantially from around 10 percent of the total in the early 1950s to levels generally varying
between 35 and 40 percent in recent years.
0.0
10.0
20.0
30.0
40.0
50.0
60.0
P
e
r
c
e
n
t
Figure 2.−Federal Receipts by Source as Share of Total Receipts
Estate and Gift
Taxes
ExciseTaxes
Employment Taxes
Corporate Income
Taxes
Individual Income Tax
Source: Office of Management and Budget; Historical Tables, Budget of the U.S. Government, Fiscal Year 2012 and S taff of the Joint Commit tee on Taxation Calculations .
Estate and Gift
Taxes
ExciseTaxes
Employment Taxes
Corporate Income
Taxes
Individual Income Tax

8/4/2019 110922-Tom Barthold-Joint Deficit Cmte Testimony
http://slidepdf.com/reader/full/110922-tom-barthold-joint-deficit-cmte-testimony 5/86
5
Figure 3 below shows receipts as a percentage of GDP from 1934 to the present. Since1950, total Federal receipts have averaged 17.9 percent of GDP. The drop in receipts as a percent of GDP in 2009 and 2010 (to 14.9 percent) reflects the impact of both the economicrecession and the legislated tax reductions of the American Recovery and Reinvestment Tax Actof 2009.2 Receipts as a share of GDP have not been this low since 1950.
0.0
5.0
10.0
15.0
20.0
25.0
1
9 3 4
1
9 3 6
1
9 3 8
1
9 4 0
1
9 4 2
1
9 4 4
1
9 4 6
1
9 4 8
1
9 5 0
1
9 5 2
1
9 5 4
1
9 5 6
1
9 5 8
1
9 6 0
1
9 6 2
1
9 6 4
1
9 6 6
1
9 6 8
1
9 7 0
1
9 7 2
1
9 7 4
1
9 7 6
1
9 7 8
1
9 8 0
1
9 8 2
1
9 8 4
1
9 8 6
1
9 8 8
1
9 9 0
1
9 9 2
1
9 9 4
1
9 9 6
1
9 9 8
2
0 0 0
2
0 0 2
2
0 0 4
2
0 0 6
2
0 0 8
2
0 1 0
Year
Figure 3.−Federal Receipts as a Percentage of GDP
Sources: Office of Management and Budget, Historical Tables, Budget of the U. S. government, Fiscal Year 2012, Table 2.3.
2 Pub. L. No. 111-5.

8/4/2019 110922-Tom Barthold-Joint Deficit Cmte Testimony
http://slidepdf.com/reader/full/110922-tom-barthold-joint-deficit-cmte-testimony 6/86
6
Figure 4 below shows total projected Federal revenues by source over the current budget period, through 2021.
The increase in social insurance receipts in 2012 reflects the expiration of the temporary(for 2011 only) reduction in employee social insurance taxes by 2 percentage points. Theincrease in individual receipts in 2013 reflects the expiration of numerous provisions of theEconomic Growth and Tax Relief Reconciliation Act of 2001,3 the Jobs and Growth Tax Relief Reconciliation Act of 2003,
4and the American Recovery and Reinvestment Tax Act of 2009.
5
0
500
1,000
1,500
2,000
2,500
3,000
3,500
4,000
4,500
5,000
2010
Actual
2011 2012 2013 2014 2015 2016 2017 2018 2019 2020 2021
B i l l i o n s o f D o l l a r s
Federal Fiscal Years
Figure 4.−Projected Federal Revenues through 2021
Individual Income
Social Insurance
Corporate Income
Excises
Estate & Gift
Other
Total Revenues
Source: Congressional Budget Office, January 2011 baseline.
3 Pub. L. No. 107-16.
4 Pub. L. No. 108-27.
5 Pub. L. No. 111-5.

8/4/2019 110922-Tom Barthold-Joint Deficit Cmte Testimony
http://slidepdf.com/reader/full/110922-tom-barthold-joint-deficit-cmte-testimony 7/86
7
Figure 5 below shows the same projections as Figure 4 above as a percentage of GDP.Total revenues are projected to rise from about 15 percent of GDP currently to about 20 percentof GDP by 2014, rising gradually to about 21 percent of GDP in 2021.
0.0%
5.0%
10.0%
15.0%
20.0%
25.0%
2010Actual
2011 2012 2013 2014 2015 2016 2017 2018 2019 2020 2021
P e r c e n t a g e o
f G D P
Federal Fiscal Years
Figure 5.− Projected Federal Revenues as a Percentage of GDP
Individual Income
Social Insurance
Corporate Income
Excises
Estate & Gift
Other
Total Revenues
Source: Congressional Budget Office, January 2011 baseline.

8/4/2019 110922-Tom Barthold-Joint Deficit Cmte Testimony
http://slidepdf.com/reader/full/110922-tom-barthold-joint-deficit-cmte-testimony 8/86
8
B. Variety of Business Organizations
The preceding figures have showed the importance of the individual income tax andcorporate income tax to the Federal tax system. However, it is important to recognize that not all businesses are organized as corporations and, consequently, the taxation of active businessincome occurs both for taxpayers that file Form 1120 (the corporate income tax return) and for taxpayer who file Form 1040 (the primary individual income tax return).
Businesses may be organized under a number of different legal forms. Owners of a business sometimes conduct their activities as sole proprietorships, which do not involve a legalentity separate from the owner. However, for a variety of business or other reasons, a businessoften is conducted through a separate legal entity. Common reasons to use a separate legal entityinclude the ability to pool the capital and other resources of multiple owners, the protection of limited liability accorded by State law to the owners of qualifying entities (but generally not tosole proprietors), and an improved ability to access capital markets for investment capital.
The tax consequences of using a separate entity depend on the type of entity throughwhich the business is conducted. Partnerships, certain closely held corporations that elect to betaxed under subchapter S of the Code (referred to as “S corporations”), 6 and limited liabilitycompanies that are treated as partnerships are treated for Federal income tax purposes as passthrough entities whose owners take into account the income (whether or not distributed) or loss of the entity on their own tax returns.
In contrast, the income of a C corporation7 is taxed directly at the corporate level.Shareholders are taxed on dividend distributions of the corporation’s after-tax income.Shareholders are also taxed on any gain (including gain attributable to undistributed corporateincome) on the disposition of their shares of stock of the corporation. Thus, the income of a C
corporation may be subject to tax at both the corporate and shareholder levels.8
6 To be eligible to make an election under subchapter S a corporation must generally (1) be an eligibledomestic corporation; (2) not have more than 100 shareholders (taking into account applicable attribution rules); (3)have as shareholders only individuals (other than nonresident aliens), estates, certain trusts and certain tax-exemptorganizations; and (4) have only one class of stock.
7 A C corporation is a corporation that is subject to subchapter C of the Code, which provides rules for corporate and shareholder treatment of corporate distributions and adjustments. C corporations generally are subjectto the corporate-level tax rate structure set forth in section 11 of the Code.
8
Business entities also include specialized corporations which are not subject to entity level tax, or whichare allowed a deduction for distributions to shareholders, under the Federal income tax rules. Federal tax rulesapplicable to these entities generally require that they distribute substantially all their income and require that theymeet other specified limitations on activities, assets, and types of income, for example. These types of entitiesinclude regulated investment companies (RICs) (mutual funds in common parlance), real estate investment trusts(REITs), real estate mortgage investment conduits (REMICs), and cooperatives. In addition, some businessactivities are conducted through tax-exempt entities, whether as activities subject to unrelated business income tax(UBIT), or as permitted under the Federal tax rules relating to tax-exempt organizations.

8/4/2019 110922-Tom Barthold-Joint Deficit Cmte Testimony
http://slidepdf.com/reader/full/110922-tom-barthold-joint-deficit-cmte-testimony 9/86
9
Figure 6 below shows the change in number of different types of business returns for the period 1978 through 2008.
0
5,000,000
10,000,000
15,000,000
20,000,000
25,000,000
1 9 7 8
1 9 7 9
1 9 8 0
1 9 8 1
1 9 8 2
1 9 8 3
1 9 8 4
1 9 8 5
1 9 8 6
1 9 8 7
1 9 8 8
1 9 8 9
1 9 9 0
1 9 9 1
1 9 9 2
1 9 9 3
1 9 9 4
1 9 9 5
1 9 9 6
1 9 9 7
1 9 9 8
1 9 9 9
2 0 0 0
2 0 0 1
2 0 0 2
2 0 0 3
2 0 0 4
2 0 0 5
2 0 0 6
2 0 0 7
2 0 0 8
N u m b e r o f R e t u r n s
Year
Figure 6. −Number of Different Types of Business Returns, 1978-2008
Non-Farm Sole Props
C Corporations
S Corporations
Partnerships
Farms
Source: Internal Revenue Service, Statistics of Income, published and unpublished data.
8/4/2019 110922-Tom Barthold-Joint Deficit Cmte Testimony
http://slidepdf.com/reader/full/110922-tom-barthold-joint-deficit-cmte-testimony 10/86
10
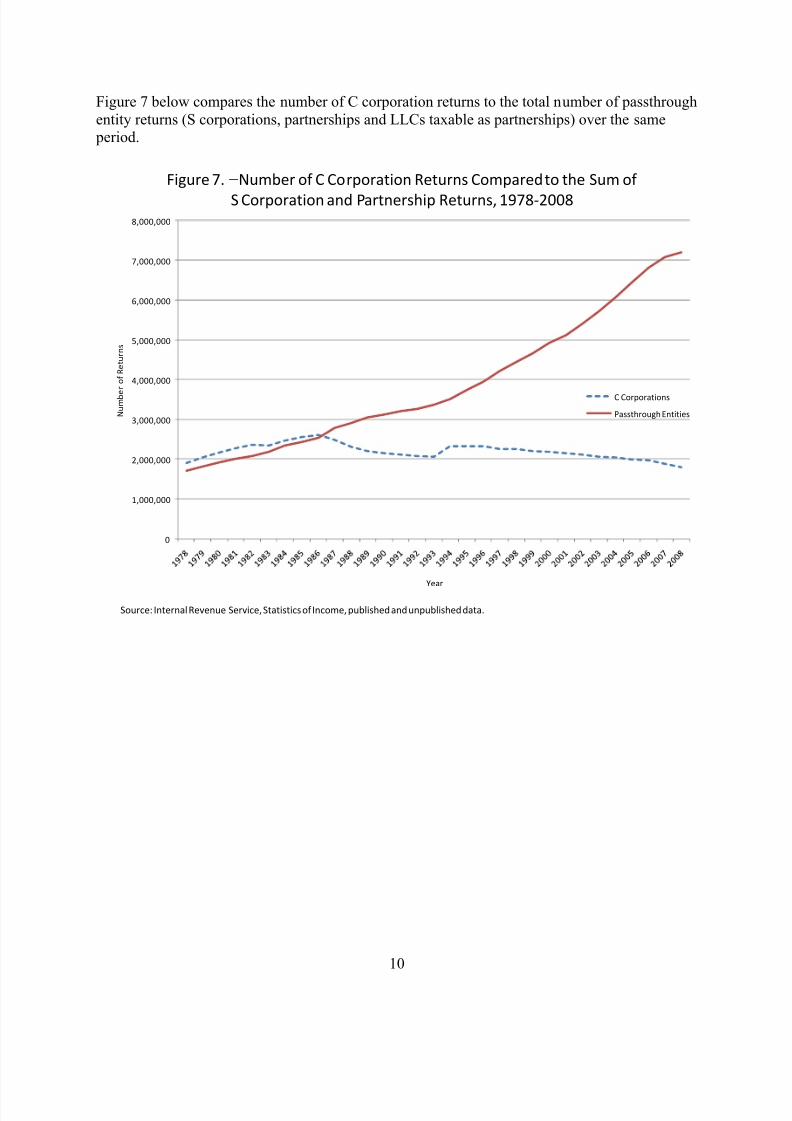
Figure 7 below compares the number of C corporation returns to the total number of passthroughentity returns (S corporations, partnerships and LLCs taxable as partnerships) over the same period.
0
1,000,000
2,000,000
3,000,000
4,000,000
5,000,000
6,000,000
7,000,000
8,000,000
N u m b e
r o f R e t u r n s
Year
Figure 7. −Number of C Corporation Returns Compared to the Sum of
S Corporation and Partnership Returns, 1978-2008
C Corporations
Passthrough Entities
Source: Internal Revenue Service, Statistics of Income, published and unpublished data.

8/4/2019 110922-Tom Barthold-Joint Deficit Cmte Testimony
http://slidepdf.com/reader/full/110922-tom-barthold-joint-deficit-cmte-testimony 11/86
11
Figure 8 below shows the income of various business forms as a percentage of GDP over the period 1980 through 2008.
-2%
0%
2%
4%
6%
8%
10%
12%
1980 1985 1990 1995 2000 2005
C Corporations S Corporations Partnerships Nonfarm Sole Proprietorships
Figure 8.−Aggregate Net Income (less deficit) as a Percentage of GDP
1980 - 2008
Source: IRS Statistics on Income.

8/4/2019 110922-Tom Barthold-Joint Deficit Cmte Testimony
http://slidepdf.com/reader/full/110922-tom-barthold-joint-deficit-cmte-testimony 12/86
12
Figure 9 below shows projected business income earned by sole proprietorships, reportedon Schedule C, and income reported on Schedule E, over the period 2011 - 2021. While totaladjusted gross income is forecast to increase somewhat more than 70 percent over this period, passthrough income reported on individual returns (the sum of income reported on Schedules Cand E) goes up by over 80 percent. Growth in this passthrough income is driven by growth in
Schedule E income, which is projected to more than double.
0
100
200
300
400
500
600
700
800
900
1,000
2011 2012 2013 2014 2015 2016 2017 2018 2019 2020 2021
B i l l i o n s o f D o l l a r s
Calendar Years
Figure 9.—Projected Schedule C and Schedule E Income, 2011 - 2021
Schedule C Income
Schedule E Income
Source: Joint Committee on Taxation.

8/4/2019 110922-Tom Barthold-Joint Deficit Cmte Testimony
http://slidepdf.com/reader/full/110922-tom-barthold-joint-deficit-cmte-testimony 13/86
13
II. OVERVIEW OF THE INDIVIDUAL INCOME TAX
A. Structure of the Individual Income Tax
In general
An income tax is imposed on individual citizens and residents of the United States. 9 Thetax is based on an individual’s taxable income. An individual computes his or her taxableincome by reducing gross income by the sum of (i) the deductions allowable in computingadjusted gross income, (ii) the standard deduction (or itemized deductions, at the election of thetaxpayer), and (iii) the deduction for personal exemptions. Graduated tax rates are then appliedto a taxpayer’s taxable income to determine his or her income tax liability. Lower rates apply tonet capital gain and qualified dividend income. A taxpayer may also be subject to an alternativeminimum tax. A taxpayer may reduce his or her income tax liability by certain tax credits. Inthe remainder of this section of the document, the broad structure of the individual income taxsystem is outlined, and certain parameters of the individual tax system are highlighted for selected years beginning with 1975.10
Gross income
Gross income means “income from whatever source derived” other than certain itemsspecifically excluded from gross income. Sources of gross income generally include, amongother things, compensation for services, interest, dividends, capital gains, rents, royalties,alimony and separate maintenance payments, annuities, income from life insurance andendowment contracts (other than certain death benefits), pensions, gross profits from a trade or business, income in respect of a decedent, and income from S corporations, partnerships, 11 andtrusts or estates.
12Exclusions from gross income include death benefits payable under a life
insurance contract, interest on certain tax-exempt State and local bonds, employer-provided
9 Foreign tax credits generally are available against U.S. income tax imposed on foreign source income tothe extent of foreign income taxes paid on that income. A nonresident alien generally is subject to the U.S.individual income tax only on income with a sufficient nexus to the United States.
10 For more information regarding individual tax rates and the individual tax base, see Joint Committee on
Taxation, Federal Tax Treatment of Individuals (JCS-43-11), September 12, 2011, and Joint Committee onTaxation, Present Law and Historical Overview of the Federal Tax System (JCS-1-11)), January 18, 2011.
11 In general, partnerships and S corporations are treated as passthrough entities for Federal income tax purposes. Thus, no Federal income tax is imposed at the entity level. Rather, income of these entities is passed
through and taxed to the partners and shareholders, whether distributed or not.12 In general, estates and trusts (other than grantor trusts) pay an individual income tax on the taxable
income of the estate or trust. Items of income which are distributed or required to be distributed under governinglaw or under the terms of the governing instrument generally are included in the income of the beneficiary and notthe estate or trust. Estates and trusts determine their tax liability using a special tax rate schedule and may be subjectto the alternative minimum tax. Certain trusts are treated as being owned by grantors in whole or in part for tax purposes; in such cases, the grantors are taxed on the income of the trust.

8/4/2019 110922-Tom Barthold-Joint Deficit Cmte Testimony
http://slidepdf.com/reader/full/110922-tom-barthold-joint-deficit-cmte-testimony 14/86
14
health insurance, employer-provided pension contributions, and certain other employer-provided benefits.
Adjusted gross income
An individual’s adjusted gross income (“AGI”) is determined by subtracting certain“above-the-line” deductions from gross income. These deductions include, among other things,trade or business expenses, losses from the sale or exchange of property, deductions attributableto rents and royalties, contributions to pensions and other retirement plans, certain movingexpenses, and alimony payments.
Taxable income
In order to determine taxable income, an individual reduces AGI by any personalexemption deductions and either the applicable standard deduction or his or her itemizeddeductions. Table 1 below summarizes the amount of personal exemptions for selected years between 1975 and 2011. Personal exemptions generally are allowed for the taxpayer, his or her
spouse, and any dependents. Beginning in 1985, the amount of the personal exemption wasindexed annually for inflation during the preceding year.
Table 1.−Personal Exemption and Standard Deduction,
Selected Calendar Years 1975-2011
1975 1985 1990 1995 2000 2005 2011
Personal Exemption $750 $1,040 $2,050 $2,500 $2,800 $3,200 $3,700
Standard Deduction
Single Individual $1,600* $2,390 $3,250 $3,900 $4,400 $5,000 $5,800
Head of Household $1,600* $2,390 $4,750 $5,750 $6,450 $7,300 $8,500
Married Couples FilingJointly
$1,900* $3,540 $5,450 $6,550 $7,350 $10,000 $11,600
Married Individual FilingSeparately
$950* $1,770 $2,725 $3,275 $3,675 $5,000 $5,800
* Shows minimum standard deduction.
A taxpayer may also reduce AGI by the amount of the applicable standard deduction. The
basic standard deduction varies depending upon a taxpayer’s filing status. Also, an additionalstandard deduction is allowed with respect to any individual who is elderly or blind.13
13 For 2011, the additional amount is $1,150 for married taxpayers (for each spouse meeting the applicablecriteria) and surviving spouses. The additional amount for single individuals and heads of households is $1,450. If an individual is both blind and aged, the individual is entitled to two additional standard deductions, for a totaladditional amount of $2,300 or $2,900, as applicable.

8/4/2019 110922-Tom Barthold-Joint Deficit Cmte Testimony
http://slidepdf.com/reader/full/110922-tom-barthold-joint-deficit-cmte-testimony 15/86
15
In lieu of taking the applicable standard deduction, an individual may elect to itemizedeductions. The deductions that may be itemized include State and local income taxes (or, inlieu of income, sales taxes), real property and certain personal property taxes, home mortgageinterest, charitable contributions, certain investment interest, medical expenses (in excess of 7.5 percent of AGI), casualty and theft losses (in excess of 10 percent of AGI and in excess of $100
per loss), and certain miscellaneous expenses (in excess of two percent of AGI).
In recent decades there have been many changes to the individual income tax base. Theincreased availability of pre-tax contributions to Individual Retirement Arrangements14 (commonly called “IRAs”) followed by the subsequent curtailment of their availability15 and thetaxation of a portion of Social Security and Railroad Retirement Tier 1 benefits
16are two items
which affect the measurement of gross income for some taxpayers. The enactment of pre-taxelective contributions under tax-qualified employer-sponsored retirement plans and theenactment of “pre-tax elective benefits” designed to respond to increased health-care costs areexamples of changes to adjusted gross income.17 The calculation of taxable income has beenaffected by the numerous changes to itemized deductions. Examples of such changes include thecreation of the two-percent floor on miscellaneous itemized deductions,
18changes to the tax
treatment of moving expenses,19 and changes to the floor on the itemized deduction for medicalexpenses.20 Another significant change to the individual income tax base was the enactment of alimitation on passive activity losses, which may affect an individual’s tax liability on certain business investments.
Tax liability
In general
A taxpayer’s net income tax liability is the greater of (1) regular individual income taxliability reduced by credits allowed against the regular tax, or (2) tentative minimum tax reduced
by credits allowed against the minimum tax.
14 The Economic Recovery Tax Act of 1981 (Pub. L No. 97-34).
15 The Tax Reform Act of 1986 (Pub. L. No. 99-514).
16 The Social Security Amendments of 1983 (Pub. L. No. 98-21), as amended by the Railroad RetirementSolvency Act of 1983 (Pub. L. No. 98-76) and the Consolidated Budget Reconciliation Act of 1985 (Pub. L. No. 99-272). The Omnibus Budget Reconciliation Act of 1993 (Pub. L. No. 103-66).
17 The Revenue Act of 1978 (Pub. L. No. 95-600).
18
The Tax Reform Act of 1986 (Pub. L. No. 99-514).19 The Omnibus Budget Reconciliation Act of 1993 (Pub. L. No. 103-66).
20 The Internal Revenue Act of 1954 (Pub. L. No. 83-59) set the floor at three percent, the 1982 Tax andEquity Fiscal Responsibility Act (Pub. L. No. 97-248) raised the floor to 5 percent, the Tax Reform Act of 1986(Pub. L. No. 99-514) raised the floor to 7.5 percent, and the Patient Protection and Affordable Care Act (Pub. L. No.111-148) raised the floor to 10 percent (for taxable years beginning after December 31, 2012).

8/4/2019 110922-Tom Barthold-Joint Deficit Cmte Testimony
http://slidepdf.com/reader/full/110922-tom-barthold-joint-deficit-cmte-testimony 16/86
16
Regular tax liability
To determine regular tax liability, a taxpayer generally must apply the tax rate schedules(or the tax tables) to his or her regular taxable income. The rate schedules are broken intoseveral ranges of income, known as income brackets, and the marginal tax rate increases as ataxpayer’s income increases.
Separate rate schedules apply based on an individual’s filing status. Table 2 shows theindividual income tax rate schedule for 2011. It should be noted that these rates will change in2013 when individual income tax rates will increase from the current rates of 10, 15, 25, 28, 33,and 35 percent to the rates of 15, 28, 31, 36, and 39.6 percent.
Table 2.–Federal Individual Income Tax Rates for 2011
Single Individuals
If taxable income is: Then income tax equals:
Not over $8,500 10% of the taxable income
Over $8,500 but not over $34,500 $850 plus 15% of the excess over $8,500
Over $34,500 but not over $83,600 $4,750 plus 25% of the excess over $34,500
Over $83,600 but not over $174,400 $17,025 plus 28% of the excess over $83,600
Over $174,400 but not over $379,150 $42,449 plus 33% of the excess over $174,400
Over $379,150 $110,016.50 plus 35% of the excess over $379,150
Heads of Households
Not over $12,150 10% of the taxable income
Over $12,150 but not over $46,250 $1,215 plus 15% of the excess over $12,150
Over $46,250 but not over $119,400 $6,330 plus 25% of the excess over $46,250
Over $119,400 but not over $193,350 $24,617.50 plus 28% of the excess over $119,400
Over $193,350 but not over $379,150 $45,323.50 plus 33% of the excess over $193,350
Over $379,150 $106,637.50 plus 35% of the excess over $379,150

8/4/2019 110922-Tom Barthold-Joint Deficit Cmte Testimony
http://slidepdf.com/reader/full/110922-tom-barthold-joint-deficit-cmte-testimony 17/86
17
Married Individuals Filing Joint Returns and Surviving Spouses
Not over $17,000 10% of the taxable income
Over $17,000 but not over $69,000 $1,700 plus 15% of the excess over $17,000
Over $69,000 but not over $139,350 $9,500 plus 25% of the excess over $69,000Over $139,350 but not over $212,300 $27,087.50 plus 28% of the excess over $139,350
Over $212,300 but not over $379,150 $47,513.50 plus 33% of the excess over $212,300
Over $379,150 $102,574 plus 35% of the excess over $379,150
Married Individuals Filing Separate Returns
Not over $8,500 10% of the taxable income
Over $8,500 but not over $34,500 $850 plus 15% of the excess over $8,500
Over $34,500 but not over $69,675 $4,750 plus 25% of the excess over $34,500
Over $69,675 but not over $106,150 $13,543.75 plus 28% of the excess over $69,675
Over $106,150 but not over $189,575 $23,756.75 plus 33% of the excess over $106,150
Over $189,575 $51,287 plus 35% of the excess over $189,575

8/4/2019 110922-Tom Barthold-Joint Deficit Cmte Testimony
http://slidepdf.com/reader/full/110922-tom-barthold-joint-deficit-cmte-testimony 18/86
18
Figure 10 below shows the top tax bracket rate and income level at which it begins toapply for married tax payers filing jointly for selected years. Figure 11 shows the bottom rateand the income level at which it would begin to apply for married taxpayers filing jointly,calculated as the sum of the standard deduction and two personal exemptions.
1975
70%
$808,680
1985
50%
$341,708
1990
28%$54,009
1995
39.6%
$366,127
2000
39.6%
$364,264
2011
35%
$373,650
2013
39.6%
$379,101
0%
10%
20%
30%
40%
50%
60%
70%
80%
90%
1970 1975 1980 1985 1990 1995 2000 2005 2010 2015
T o p T a x R a t e
Figure 10.−Individual Income Tax Top Brackets and Rates,
Joint Filers Selected Years (Real 2010 Dollars)
Height = Top Rate; Size = Top Bracket Threshold
Note: For 1975 the maximum rate on earned income was 50 percent.

8/4/2019 110922-Tom Barthold-Joint Deficit Cmte Testimony
http://slidepdf.com/reader/full/110922-tom-barthold-joint-deficit-cmte-testimony 19/86
19
1975
14%
$13,748
1985
11%
$11,362
1990
15%
$15,895
1995
15%
$16,486
2000
15%
$16,359
2011
10%
$18,700
0%
2%
4%
6%
8%
10%
12%
14%
16%
18%
1970 1975 1980 1985 1990 1995 2000 2005 2010 2015
Figure 11.−Individual Income Tax Bottom Rates and Bracket Thresholds,
Joint Filers; Selected Years [Real 2010 Dollars]
Height= Bottom Rate; Size = Sum of Personal Exemptions and Standard Deduc tion for Joint Filers
Capital gains
In general
In general, gain or loss reflected in the value of an asset is not recognized for income tax purposes until a taxpayer disposes of the asset. On the sale or exchange of a capital asset, anygain generally is included in income. However, any net capital gain of an individual generally istaxed at rates lower than rates applicable to ordinary income. Net capital gain is the excess of the net long-term capital gain for the taxable year over the net short-term capital loss for the year.Gain or loss is treated as long-term if the asset is held for more than one year.
Capital losses generally are deductible in full against capital gains. In addition,
individual taxpayers may deduct capital losses against up to $3,000 of ordinary income in eachyear. Any remaining unused capital losses may be carried forward indefinitely to another taxable year.
A capital asset generally means any property except (1) inventory, stock in trade, or property held primarily for sale to customers in the ordinary course of the taxpayer’s trade or business, (2) depreciable or real property used in the taxpayer’s trade or business, (3) specifiedliterary or artistic property, (4) business accounts or notes receivable, (5) certain U.S.

8/4/2019 110922-Tom Barthold-Joint Deficit Cmte Testimony
http://slidepdf.com/reader/full/110922-tom-barthold-joint-deficit-cmte-testimony 20/86
20
publications, (6) certain commodity derivative financial instruments, (7) hedging transactions,and (8) business supplies. In addition, the net gain from the disposition of certain property usedin the taxpayer’s trade or business is treated as long-term capital gain. Gain from the dispositionof depreciable personal property is not treated as capital gain to the extent of all previousdepreciation allowances. Gain from the disposition of depreciable real property is generally not
treated as capital gain to the extent of the depreciation allowances in excess of the allowancesavailable under the straight-line method of depreciation.
Tax credits
An individual may reduce his or her tax liability by any available tax credits.
Refundable tax credits
The two most widely used refundable credits are the earned income tax credit (the“EITC”) and the child tax credit.
Earned income tax credit.−
The EITC generally equals a specified percentage of wages upto a maximum credit amount. The maximum credit amount applies over a certain income rangeand then diminishes to zero over a certain income range. In 2011, the maximum EITC is $5,751for taxpayers with more than two qualifying children, $5,112 for taxpayers with two qualifyingchildren, $3,094 for taxpayers with one qualifying child, and $464 for taxpayers with noqualifying children.
The EITC is phased out along certain phase-out ranges. In 2011, the phase-out range is$7,590 to $13,660 for no qualifying children, $16,690 to $36,052 for one qualifying child,$16,690 to $40,964 for two qualifying children, and $16,690 to $43,998 for three or morequalifying children. Also for 2011, the phase-out threshold for married couples filing a joint
return is increased by $5,080.
After 2012 the larger EITC for three or more qualifying children and the higher phase-outthreshold for married couples filing a joint return are repealed. Additionally, certain of the rulesof the credit return to pre-2001 law.
Progression of the EITC
Although the basic structure of the EITC is unchanged since its enactment in 1975, themaximum credit has been increased several times since enactment by expanding the applicable percentage of the credit and the base against which that percentage is applied (includingadjusting the EITC for number of qualifying children). Also, the beginning point of the phase-
out range has been raised as has the length of the phase-out range. Finally, the dollar amounts of the credit have been automatically adjusted for inflation. In all, these changes have had theeffect of further expanding the availability of the EITC.

8/4/2019 110922-Tom Barthold-Joint Deficit Cmte Testimony
http://slidepdf.com/reader/full/110922-tom-barthold-joint-deficit-cmte-testimony 21/86
21
As originally enacted in 1975, the credit was 10 percent of the first $4,000 of earnedincome
21(i.e., a maximum credit of $400). The credit began to be phased out for filing units
with earned income (or AGI, if greater) above $4,000, and was entirely phased out for filingunits with income of $8,000. The EITC was not adjusted for inflation in 1975.
Thus, an eligible EITC recipient in 1975 with $4,000 of income ($16,844 in today’sdollars) received the maximum $400 ($1,684 in today’s dollars). In 2011, a similarly situatedtaxpayer (i.e., one with $16,844 in income) would receive today’s maximum amounts if married($3,094, $5,112, or $5,751 with one, two, or more than two children, respectively). Anunmarried filer would receive just shy of these maximum amounts as his income is just over thestart of the phaseout threshold of $16,690. In 1975, a taxpayer without children was not eligiblefor the EITC. In 2011, a taxpayer with $16,844 in income but without a qualifying child would be phased out of the EITC.
A taxpayer earning $8,000 in 1975 would receive no EITC, while a similarly situatedtaxpayer (i.e., one with $33,688 in income today) would receive $378, $1,532, or $2,171 if anunmarried filer with one, two, or more than two children, respectively. If married, the taxpayerswould receive $1,190, $2,602, or $3,241 depending on whether he had one, two, or more thantwo children, respectively. In 2011, a taxpayer with $33,688 in income but without a qualifyingchild would be phased out of the EITC.
Child tax credit.−For 2011, the child tax credit generally is $1,000 for each qualifyingchild.22 The credit is allowable against the regular tax and, for taxable years beginning beforeJanuary 1, 2012, is allowed against the AMT.
The child tax credit is phased out for individuals with income over certain thresholds.The phase out rate is $50 for each $1,000 of modified AGI23 (or a fraction thereof) in excess of the threshold. For married taxpayers filing joint returns, the threshold is $110,000. For
taxpayers filing single or head of household returns, the threshold is $75,000. For marriedtaxpayers filing separate returns, the threshold is $55,000. These thresholds are not indexed for inflation.
To the extent the child tax credit exceeds the taxpayer’s tax liability, the taxpayer iseligible for a refundable credit (the additional child tax credit) equal to 15 percent of earnedincome in excess of a threshold dollar amount (the “earned income” formula). For 2011, the
21 Earned income is defined as the sum of wages, salaries, tips, and other taxable employee compensation plus net self-employment earnings.
22
A qualifying child is an individual for whom the taxpayer can claim a dependency exemption and who isa son or daughter of the taxpayer (or a descendant of either), a stepson or stepdaughter of the taxpayer, or an eligiblefoster child of the taxpayer.
23 For these purposes modified AGI is computed by increasing the taxpayer’s AGI by the amountotherwise excluded under Code sections 911, 931, and 933 (relating to the exclusion of income of U.S. citizens or residents living abroad; residents of Guam, American Samoa, and the Northern Mariana Islands; and residents of Puerto Rico, respectively).

8/4/2019 110922-Tom Barthold-Joint Deficit Cmte Testimony
http://slidepdf.com/reader/full/110922-tom-barthold-joint-deficit-cmte-testimony 22/86
22
child tax credit is refundable up to the greater of: (1) 15 percent of the taxpayer’s earned incomein excess of $3,000; or (2) for families with three or more children, the amount by which thetaxpayer’s social security taxes exceed the taxpayer’s earned income.
After 2012, the maximum child tax credit is $500 for each qualifying child and is onlyrefundable for families with three or more children if the taxpayer’s social security taxes exceedthe taxpayer’s earned income. The maximum child tax credit after 2012 is equivalent to thecredit as originally enacted in the Taxpayer Relief Act of 1997.
24Before 1997, taxpayers could
not claim tax credits based solely on the number of dependent children. Instead, they weregenerally able to claim a personal exemption for each of these dependents. The Taxpayer Relief Act of 1997 provided for a child tax credit of $500 ($400 for 1998) for taxable years beginningafter December 31, 1997. The Economic Growth and Tax Relief Reconciliation Act of 2001increased the maximum child tax credit from $500 to $1000 over a number of years and madeother changes to the child tax credit.
25
Nonrefundable tax credits
Nonrefundable personal credits include the foreign tax credit, child and dependent carecredit, education credits, retirement savings contributions credit, child tax credit, residentialenergy efficient property credit, nonbusiness energy property credit, and expenses of elderly or disabled.
Alternative minimum tax liability
In general
An alternative minimum tax is imposed on an individual, estate, or trust in an amount bywhich the tentative minimum tax exceeds the regular income tax for the taxable year. The
tentative minimum tax is the sum of: (1) 26 percent of so much of the taxable excess as does notexceed $175,000 ($87,500 in the case of a married individual filing a separate return) and (2) 28 percent of the remaining taxable excess. The taxable excess is so much of the alternativeminimum taxable income (“AMTI”) as exceeds the exemption amount. The maximum tax rateson net capital gain and dividends used in computing the regular tax are also used in computingthe tentative minimum tax. AMTI is the taxpayer’s taxable income increased by the taxpayer’s“tax preference items” and adjusted by redetermining the tax treatment of certain items in amanner that negates the deferral of income resulting from the regular tax treatment of thoseitems.
The exemption amounts for 2011 are: (1) $74,450 in the case of married individualsfiling a joint return and surviving spouses; (2) $48,450 in the case of unmarried individuals other than surviving spouses; (3) $37,225 in the case of married individuals filing separate returns; and(4) $22,500 in the case of an estate or trust. The exemption amounts are phased out by an
24 Pub. L. No. 105-34.
25 Pub. L. No. 107-16.

8/4/2019 110922-Tom Barthold-Joint Deficit Cmte Testimony
http://slidepdf.com/reader/full/110922-tom-barthold-joint-deficit-cmte-testimony 23/86
23
amount equal to 25 percent of the amount by which the individual’s AMTI exceeds:(1) $150,000 in the case of married individuals filing a joint return and surviving spouses;(2) $112,500 in the case of other unmarried individuals; and (3) $75,000 in the case of marriedindividuals filing separate returns or an estate or a trust. These amounts are not indexed for inflation.
Among the preferences and adjustments applicable to the individual alternative minimumtax are accelerated depreciation on certain property used in a trade or business, circulationexpenditures, research and experimental expenditures, certain expenses and allowances related tooil and gas and mining exploration and development, certain tax-exempt interest income, and a portion of the amount of gain excluded with respect to the sale or disposition of certain small business stock. In addition, personal exemptions, the standard deduction, and certain itemizeddeductions, such as State and local taxes and miscellaneous deductions items, are not allowed toreduce alternative minimum taxable income.

8/4/2019 110922-Tom Barthold-Joint Deficit Cmte Testimony
http://slidepdf.com/reader/full/110922-tom-barthold-joint-deficit-cmte-testimony 24/86
24
B. Largest Tax Expenditures for Individuals
The following Table 3 shows the ten largest tax expenditures for individuals estimatedfor the period 2010-2014. The Appendix includes the top ten tax expenditures for five-year periods beginning with 1975-1979. Several items have consistently been among the top tenlargest individual tax expenditures. Four have made the top ten lists in all eight of the five-year periods. These four items are: (1) the exclusion of employer contributions for health care andhealth insurance premiums; (2) the net exclusion of pension contributions and earnings:employer plans;
26(3) the deduction for mortgage interest on owner-occupied homes; and (4) the
deduction for nonbusiness State and local taxes (other than State and local property taxes onowner-occupied homes). Two items have been on the top ten list seven out of eight times: (1) theexclusion of untaxed Social Security and railroad retirement benefits, and (2) the deduction for charitable contributions. Two items have been on the top ten list six out of eight times: (1) thededuction for State and local property taxes on owner-occupied homes, and (2) the reduced rateof tax on dividends and long-term capital gains.
27
26 This item represents a combination of two items appearing on Table 3, (1) net exclusion of pensioncontributions and earnings: Defined benefit plans, and (2) net exclusion of pension contributions and earnings:Defined contribution plans, which are shown as a single combined item on the Tables for periods prior to 2010-2014in the Appendix.
27 Dividends have been included in this category for periods during which a reduced tax rate applies tothem.

8/4/2019 110922-Tom Barthold-Joint Deficit Cmte Testimony
http://slidepdf.com/reader/full/110922-tom-barthold-joint-deficit-cmte-testimony 25/86
25
Table 3.−Largest Tax Expenditures, Individual 2010-2014
Tax Expenditure
Total Amount
(2010-2014)
(Billions of dollars)
Exclusion of employer contributions for health care, health insurance premiums, and long-term care insurance premiums
659.4
Deduction for mortgage interest on owner-occupied homes 484.1
Reduced rates of tax on dividends and long-term capital gains 402.9
Net exclusion of pension contributions and earnings: Defined contribution plans
303.2
Earned income credit 268.8
Deduction of nonbusiness State and local government income, sales and personal property taxes
237.3
Net exclusion of pension contributions and earnings: Defined benefit plans 212.2
Exclusions of capital gains at death 194.0
Deductions for charitable contributions, other than for education and health 182.4
Exclusion of untaxed social security and railroad retirement benefits 173.0

8/4/2019 110922-Tom Barthold-Joint Deficit Cmte Testimony
http://slidepdf.com/reader/full/110922-tom-barthold-joint-deficit-cmte-testimony 26/86
26
III. OVERVIEW OF THE CORPORATE INCOME TAX
A. Structure of the Corporate Income Tax
Since its inception in 1909, the Federal income tax assessed on the earnings of corporations as entities separate and apart from their owners has undergone significant changes, both with respect to the corporate income tax rate structure and the tax base. The following verygenerally describes the corporate income tax as it exists today, an abbreviated history of thecorporate income tax rates, and certain significant changes to the corporate income tax base.28
In general
Corporations organized under the laws of any of the 50 States (and the District of Columbia) generally are subject to the U.S. corporate income tax on their worldwide taxableincome.
29
The taxable income of a corporation generally is comprised of gross income less
allowable deductions. Gross income generally is income derived from any source, includinggross profit from the sale of goods and services to customers, rents, royalties, interest (other thaninterest from certain indebtedness issued by State and local governments), dividends, gains fromthe sale of business and investment assets, and other income.
Allowable deductions include ordinary and necessary business expenses, such as salaries,wages, contributions to profit-sharing and pension plans and other employee benefit programs,repairs, bad debts, taxes (other than Federal income taxes), contributions to charitableorganizations (subject to an income limitation), advertising, interest expense, certain losses,selling expenses, and other expenses. Expenditures that produce benefits in future taxable yearsto a taxpayer’s business or income-producing activities (such as the purchase of plant and
equipment) generally are capitalized and recovered over time through depreciation, amortizationor depletion allowances. A net operating loss incurred in one taxable year typically may becarried back two years or carried forward 20 years and allowed as a deduction in another taxableyear. Deductions are also allowed for certain amounts despite the lack of a direct expenditure bythe taxpayer. For example, a deduction is allowed for all or a portion of the amount of dividendsreceived by a corporation from another corporation (provided certain ownership requirements aresatisfied). Moreover, a deduction is allowed for a portion of the amount of income attributable tocertain manufacturing activities.
28
For a more information regarding corporate historic corporate tax rates and the corporate income tax base see the Appendix to this document, Joint Committee on Taxation, Present Law and Background Relating to
Selected Business Income Provisions (JCX-34-11), June 1, 2011, and Joint Committee on Taxation, Present Law
and Historical Overview of the Federal Tax System (JCX-1-11), January 18, 2011.
29 Foreign tax credits generally are available against U.S. income tax imposed on foreign source income tothe extent of foreign income taxes paid on that income. A foreign corporation generally is subject to the U.S.corporate income tax only on income with a sufficient nexus to the United States.

8/4/2019 110922-Tom Barthold-Joint Deficit Cmte Testimony
http://slidepdf.com/reader/full/110922-tom-barthold-joint-deficit-cmte-testimony 27/86
27
The Code also specifies certain expenses that typically may not be deducted, such asexpenses associated with earning tax-exempt income,
30certain entertainment expenses, certain
executive compensation in excess of $1,000,000 per year, a portion of the interest on certainhigh-yield debt obligations that resemble equity, and fines, penalties, bribes, kickbacks andillegal payments.
In contrast to the treatment of capital gains in the individual income tax, no separate ratestructure exists for corporate capital gains. Thus, the maximum rate of tax on the net capitalgains of a corporation is 35 percent. A corporation may not deduct the amount of capital lossesin excess of capital gains for any taxable year. Disallowed capital losses may be carried back three years or carried forward five years.
Like individuals, corporations may reduce their tax liability by any applicable tax credits.Tax credits applicable to businesses are listed in the Appendix, relating to the general businesscredit. Credits generally are determined based on a percentage of the cost associated with theunderlying activity and generally are subject to certain limitations.
Affiliated group
Domestic corporations that are affiliated through 80 percent or more corporate ownershipmay elect to file a consolidated return in lieu of filing separate returns. For purposes of calculating tax liability, corporations filing a consolidated return generally are treated asdivisions of a single corporation; thus, the losses (and credits) of one corporation generally canoffset the income (and thus reduce the otherwise applicable tax) of other affiliated corporations.
Alternative minimum tax
A corporation is subject to an alternative minimum tax which is payable, in addition to all
other tax liabilities, to the extent that it exceeds the corporation’s regular income tax liability.The tax is imposed at a flat rate of 20 percent on alternative minimum taxable income in excessof a $40,000 exemption amount.31 Credits that are allowed to offset a corporation’s regular taxliability generally are not allowed to offset its minimum tax liability. If a corporation pays thealternative minimum tax, the amount of the tax paid is allowed as a credit against the regular taxin future years.
Alternative minimum taxable income is the corporation’s taxable income increased bythe corporation’s tax preference items and adjusted by determining the tax treatment of certainitems in a manner that negates the deferral of income resulting from the regular tax treatment of those items. Among the preferences and adjustments applicable to the corporate alternativeminimum tax are accelerated depreciation on certain property, certain expenses and allowances
30 For example, the carrying costs of tax-exempt State and local obligations and the premiums on certainlife insurance policies are not deductible.
31 The exemption amount is phased out for corporations with income above certain thresholds, and iscompletely phased out for corporations with alternative minimum taxable income of $310,000 or more.

8/4/2019 110922-Tom Barthold-Joint Deficit Cmte Testimony
http://slidepdf.com/reader/full/110922-tom-barthold-joint-deficit-cmte-testimony 28/86
28
related to oil and gas and mining exploration and development, certain amortization expensesrelated to pollution control facilities, net operating losses and certain tax-exempt interest income.In addition, corporate alternative minimum taxable income is increased by 75 percent of theamount by which the corporation’s “adjusted current earnings” exceeds its alternative minimumtaxable income (determined without regard to this adjustment). Adjusted current earnings
generally are determined with reference to the rules that apply in determining a corporation’searnings and profits.
A corporation with average annual gross receipts of not more than $7.5 million is exemptfrom the alternative minimum tax.
Treatment of corporate distributions
The taxation of a corporation generally is separate and distinct from the taxation of itsshareholders. A distribution by a corporation to one of its shareholders generally is taxable as adividend to the shareholder to the extent of the corporation’s current or accumulated earningsand profits, and such a distribution is not a deductible expense of the corporation.32 Thus, the
amount of a corporate dividend generally is taxed twice: once when the income is earned by thecorporation and again when the dividend is distributed to the shareholder.
33Although subject to
a second tax when distributed, shareholders in a corporation may benefit from deferral of this taxon undistributed corporate income (e.g., corporate income reinvested in the business).
Amounts received by a shareholder in complete liquidation of a corporation generally aretreated as full payment in exchange for the shareholder’s stock. A liquidating corporationrecognizes gain or loss on the distributed property as if such property were sold to the distributeefor its fair market value. However, if a corporation liquidates a subsidiary corporation of whichit has 80 percent or more control, no gain or loss generally is recognized by either the parentcorporation or the subsidiary corporation.
32 A distribution in excess of the earnings and profits of a corporation generally is a tax-free return of capital to the shareholder to the extent of the shareholder’s adjusted basis (generally, cost) in the stock of thecorporation; such distribution is a capital gain if in excess of basis. A distribution of property other than cash
generally is treated as a taxable sale of such property by the corporation and is taken into account by theshareholder at the property’s fair market value. A distribution of common stock of the corporation generally is nota taxable event to either the corporation or the shareholder.
33 This double taxation is mitigated by a reduced maximum tax rate of 15 percent generally applicable todividend income of individuals (prior to 2013). Note that amounts paid as interest to the debtholders of acorporation generally are subject to only one level of tax (at the recipient level) because the corporation generally isallowed a deduction for the amount of interest expense paid or accrued.

8/4/2019 110922-Tom Barthold-Joint Deficit Cmte Testimony
http://slidepdf.com/reader/full/110922-tom-barthold-joint-deficit-cmte-testimony 29/86
29
Tax treatment of foreign activities of U.S. corporations34
The United States employs a worldwide tax system, under which domestic corporationsgenerally are taxed on all income, whether derived in the United States or abroad. Incomeearned by a domestic parent corporation from foreign operations conducted by foreign corporatesubsidiaries generally is subject to U.S. tax when the income is distributed as a dividend to thedomestic parent corporation. Until that repatriation, the U.S. tax on the income generally isdeferred. However, certain anti-deferral regimes may cause the domestic parent corporation to be taxed on a current basis in the United States on certain categories of passive or highly mobileincome earned by its foreign corporate subsidiaries, regardless of whether the income has beendistributed as a dividend to the domestic parent corporation. The main anti-deferral regimes inthis context are the controlled foreign corporation rules of subpart F35 and the passive foreigninvestment company rules.36 A limited credit against U.S. tax is generally available for foreigntax imposed on foreign-source income, whether the income is earned directly by the domesticcorporation, repatriated as an actual dividend, or included in the domestic parent corporation’sincome under one of the anti-deferral regimes.37
Corporate income tax rates
A corporation’s regular income tax liability generally is determined by applying theappropriate tax rate to its taxable income. Table 4 below provides a compilation of the marginalrates of tax imposed on corporate income in 2011.
34 For more information regarding the tax treatment of the foreign activities of U.S. corporations, see JointCommittee on Taxation, Background and Selected Issues Related to the U.S. International Tax System and Systems
that Exempt Foreign Business Income (JCX-33-11), May 20, 2011; Present Law and Issues in U.S. Taxation of
Cross-Border Income (JCX-42-11), September 6, 2011; The Impact of International Tax Reform: Background and
Selected Issues Relating to U.S. International Tax Rules and the Competitiveness of U.S Businesses (JCX-22-06),
June 21, 2006; and Economic Efficiency and Structural Analyses of Alternative U.S. Tax Policies for Foreign Direct Investment (JCX-55-08), June 25, 2008.
35 Secs. 951-964.
36 Secs. 1291-1298.
37 Secs. 901, 902, 960, 1291(g).

8/4/2019 110922-Tom Barthold-Joint Deficit Cmte Testimony
http://slidepdf.com/reader/full/110922-tom-barthold-joint-deficit-cmte-testimony 30/86
30
Table 4.–Federal Corporate Income Tax Rate Structure in 2011
Corporate Taxable Income
Income Tax Rate
(percent)
First $50,000 15
$50,001-$75,000 25$75,001-$100,000 34$100,001-$335,000 39* $335,001-$10,000,000 34$10,000,001-$15,000,000 35$15,000,001-$18,333,333 38* Over $18,333,333 35* Rates higher than the top bracket rate reflect phaseouts of the benefit from the lower bracket rates
and are not technically the top corporate statutory rate.
Figure 12 below shows the top statutory corporate income tax rate and income thresholdat which the rate begins to apply for selected years.
1975
48%
$202,170
1985
46%
$202,170
1990
34%
$124,829
1995
35%
$14,273,950
2000
35%
$12,632,695
2011
35%
$10,000,000
0%
10%
20%
30%
40%
50%
60%
1970 1975 1980 1985 1990 1995 2000 2005 2010 201
T o p T a x R a t e
Note: Bubble size not to scale
Figure 12.−Corporate Income Tax Top Rate and Bracket Threshold
Selected Years [Real 2010 Dollars]
Significant modifications to the corporate income tax base
The following discussion summarizes certain significant modifications to the corporateincome tax base in the last few decades. In addition to affecting corporations, many of theFederal income tax provisions discussed below apply to all businesses.

8/4/2019 110922-Tom Barthold-Joint Deficit Cmte Testimony
http://slidepdf.com/reader/full/110922-tom-barthold-joint-deficit-cmte-testimony 31/86
31
Investment tax credit.−From 1962 through 1985 the Code from time to time allowed aninvestment tax credit. The investment tax credit was originally seven percent (three percent inthe case of certain public utilities) of the cost of capital investments in new tangible personal property and certain depreciable real property. The investment tax credit was suspended duringthe years 1966 and from 1969-1971. The credit was revived in 1972 and then increased to a rate
of ten percent in 1975. The Tax Reform Act of 1986 largely repealed the investment tax creditin an effort to equate effective tax rates with statutory tax rates and to rationalize the taxtreatment of different assets.
Depreciation.−For Federal income tax purposes, a taxpayer is allowed to recover throughannual depreciation deductions the cost of certain property used in a trade or business or for the production of income. The amount of the depreciation deduction allowed with respect totangible property for a taxable year is determined under the modified accelerated cost recoverysystem (“MACRS”). Under MACRS, different types of property generally are assignedapplicable recovery periods and depreciation methods. The MACRS depreciation categoriesgenerally are set out in the Code and Internal Revenue Service guidance.38
Generally, the depreciation deduction calculation is a function of the capital investmentin depreciable property, the recovery period, and the cost recovery method. Recovery periodsand rates of recovery have varied over time. For example, prior to 1981, the depreciation systemwas based on estimated useful lives determined either by using facts and circumstances or byusing guideline lives in Treasury guidance.39 The useful lives were generally applied to calculatedepreciation deductions using a straight-line method. The Economic Recovery Tax Act of 198140 replaced the prior law depreciation system with the Accelerated Cost Recovery System(“ACRS”) which significantly accelerated depreciation on tangible property.41 The Tax ReformAct of 1986 created MACRS. At times, Congress has enacted temporary bonus depreciationrules.
Section 179 expensing.−
In lieu of depreciation, a taxpayer with a sufficiently smallamount of annual investment may elect to deduct (or “expense”) such costs under section 179.The rules of section 179 were originally enacted in 1958 and the amount allowed to be expensedhas generally increased over time.42 Under a temporary provision enacted in 2010, for taxableyears beginning in 2011, the maximum amount that a taxpayer may expense is $500,000 of thecost of qualifying property placed in service for the taxable year. The $500,000 amount isreduced (but not below zero) by the amount by which the cost of qualifying property placed inservice during the taxable year exceeds $2 million. For taxable years beginning in 2012 and
38 Sec. 168; Rev. Proc. 87-56, 1987-2 C.B. 674.
39 See Rev. Proc. 62-21, 1962-2 C.B. 418, for guideline useful lives.
40 Pub. L. No. 97-34.
41 Pub. L. No. 97-34, sec. 201.
42 Pub. L. No. 85-866. sec. 204.

8/4/2019 110922-Tom Barthold-Joint Deficit Cmte Testimony
http://slidepdf.com/reader/full/110922-tom-barthold-joint-deficit-cmte-testimony 32/86
32
thereafter, the limitation amount is $125,000 and the phaseout threshold amount is $500,000,adjusted for inflation.
Amortization of goodwill and certain other intangible assets.−Prior to 1993, goodwill wasnot an amortizable asset and the amortization of other intangible assets was generally based onfacts and circumstances. The Code was amended in 1993 to specify a 15-year amortization period for acquired goodwill and certain other intangible assets.43
Deduction for income attributable to domestic production activities.−The American JobsCreation Act of 2004
44created a deduction for income attributable to domestic production
activities. The allowance of a deduction equal to a specified percentage of certain qualifyingdomestic production activities income has the effect of lowering the tax rate applicable to incomefrom such activities. For taxable years beginning in 2005 or 2006, the deduction is three percentof the income from manufacturing, construction, and certain other activities specified in theCode. For taxable years beginning in 2007, 2008 and 2009, the deduction is equal to six percent.Beginning in 2010, the percentage is generally
45nine percent.
46
43 Pub. L. No. 103-66.
44 Pub. L. No. 108-357.
45 In the case of oil related qualified production activities income, for any taxable year beginning after 2009, the percentage is reduced by three percent of the least of: (1) oil related qualified production activities income
of the taxpayer for the taxable year; (2) qualified production activities income of the taxpayer for the taxable year; or (3) taxable income (determined without regard to the deduction for income attributable to domestic manufacturingactivities).
46 At the fully phased-in nine percent deduction, a corporation is taxed at a rate of 35 percent on only 91 percent of qualifying income, resulting in an effective tax rate on qualifying income of 31.85 percent (0.91 x 0.35 =0.3185). A similar reduction applies to the graduated rates applicable to individuals with qualifying domestic production activities income.

8/4/2019 110922-Tom Barthold-Joint Deficit Cmte Testimony
http://slidepdf.com/reader/full/110922-tom-barthold-joint-deficit-cmte-testimony 33/86
33
B. Overview of Business Entities Other Than Corporations
Significant business activity is conducted through entities other than corporations. Such business entities include passthrough entities such as partnerships (including limited liabilitycompanies (“LLCs”)) and S corporations. For Federal income tax purposes, these passthroughentities generally are not subject to tax at the entity level. Rather, the owners − that is, partnersor S corporation shareholders − are subject to tax on their shares of the entity’s income, gain,loss, deduction, and credit, whether or not distributed.
47The tax treatment of passthrough
entities differs from the generally applicable entity level tax on income of C corporations. Inaddition, noncorporate business income is generated by sole proprietorships and farms.48
Allowable deductions for businesses conducted in passthrough entity form are generallythe same as allowable deductions for businesses conducted in corporate form. However, thecalculation of these deductions is affected by the fact that they are taken into account for tax purposes by the partners or S corporation shareholders rather than by the partnership or Scorporation at the entity level.
There are no limitations on the identity of a partner in a partnership under present law.Thus, a partner in a business conducted through a partnership (including an LLC taxable as a partnership) can generally be an individual, a corporation, or another partnership, for example.Permissible shareholders of S corporations are restricted to individuals (other than nonresidentaliens), estates, certain trusts, and certain tax-exempt organizations, and may not exceed 100 innumber (taking into account applicable attribution rules).
47 Partners and S corporation shareholders who are individuals generally report this income on Schedule E.
48 This income is generally reported by individuals on Schedules C and F.

8/4/2019 110922-Tom Barthold-Joint Deficit Cmte Testimony
http://slidepdf.com/reader/full/110922-tom-barthold-joint-deficit-cmte-testimony 34/86
34
C. Largest Corporate Tax Expenditures
The following Table 5 shows the ten largest corporate tax expenditures estimated for the period 2010-2014. The Appendix includes top ten tax expenditures for five-year periods beginning with 1975-1979. Although the composition of the top ten lists has changed over time,two items have been in the list of top ten expenditures for the entire period: the exclusion of interest on general purpose State and local debt, and some form of accelerated depreciation.49 Reduced rates for an initial amount of corporate income has been in the top ten since 1980-1985.A tax benefit for research expenses (either through a deduction or a tax credit) has been on thelist for seven out of the eight periods.
Table 5.−Largest Tax Expenditures, Corporate 2010-2014
Tax Expenditure Total Amount
(2010-2014)
(Billions of dollars)
Deferral of active income of controlled foreign corporations 70.6
Exclusion of interest on public purpose State and local governmentdebt
45.3
Deduction for income attributable to domestic production activities 43.2
Inventory property sales source rule exception 38.0
Depreciation of equipment in excess of alternative depreciation system 37.1
Inclusion of income arising from business indebtedness discharged bythe reacquisition of a debt instrument
28.8
Tax credit for low-income housing 27.0
Expensing of research and experimental expenditures 25.6
Inventory methods and valuation: Last in first out 20.0
Reduced rates for first $10,000,000 of corporate taxable income 15.9
49 The tax expenditure item relating to accelerated depreciation (a function of asset basis, recovery period,and depreciation method) is a measure of the depreciation allowed in excess of the amount allowed in a normativesystem, though the terminology describing it has changed in the tax law over the years.

8/4/2019 110922-Tom Barthold-Joint Deficit Cmte Testimony
http://slidepdf.com/reader/full/110922-tom-barthold-joint-deficit-cmte-testimony 35/86
35
IV. REFORMING TAX EXPENDITURES AND THE NATIONAL COMMISSION
ON FISCAL RESPONSIBILITY AND REFORM
A. The National Commission's General Approach to Tax Reform
In their report, the National Commission on Fiscal Responsibility and Reform (the“Commission”) concluded that “[t]ax reform should lower tax rates, reduce the deficit, simplifythe tax code, reduce the tax gap, and make America the best place to start a business and create jobs.”50 The Commission proposed eliminating most income tax expenditures and using therevenue to lower marginal tax rates and to reduce projected deficits. The proposed approach isconsistent with much commentary over the years that a tax system with a broad base and lowrates generally promotes market efficiency and growth.
It is possible that part of the motivation of the Commission was the recognition of thegrowth in number and value of tax expenditures. Figure 13 below displays a simple count of provisions identified as tax expenditures with an estimated value in excess of $50 million asreported in the document published annually by the staff of the Joint Committee on Taxation. 51
50 The National Commission on Fiscal Responsibility and Reform, The Moment of Truth, December 2010, p. 28.
51 The annual publication also lists other tax expenditure provisions, identified as quantitatively de minimis tax expenditures, that do not meet a $50 million threshold. The Appendix to this testimony includes a list of taxexpenditures that have been added to the Code since the passage of the Tax Reform Act of 1986.

8/4/2019 110922-Tom Barthold-Joint Deficit Cmte Testimony
http://slidepdf.com/reader/full/110922-tom-barthold-joint-deficit-cmte-testimony 36/86
36
0
50
100
150
200
250
300
Year
Figure 13.−Joint Committee on Taxation Count of Tax Expenditures, 1980-2010
Source: Joint Committee on Taxation staff.
B. Considerations for Congress in Assessing the National Commission's Approach
Two concerns
The course proposed by the Commission appears clear. However, I think it is importantto emphasize today that the Commission's proposed course is not simply achieved. I say this for two reasons.
• First, it is not clear as a matter of crafting legislation what it means to eliminate all taxexpenditures and start from a clean slate.
• Second, the dollar value of tax expenditures, as calculated by the staff of the JointCommittee on Taxation, is not the same as the estimated revenue effect to the FederalTreasury from elimination or reform of any such provision.
What replaces a repealed tax expenditure?
The Congressional Budget and Impoundment Control Act of 1974 defines taxexpenditures as “revenue losses attributable to provisions of the Federal tax law which allow aspecial exclusion, exemption, or deduction from gross income or which provide a special credit,

8/4/2019 110922-Tom Barthold-Joint Deficit Cmte Testimony
http://slidepdf.com/reader/full/110922-tom-barthold-joint-deficit-cmte-testimony 37/86
37
a preferential rate of tax, or a deferral of tax liability.”52 Tax expenditures are defined relative toa more theoretically pure income tax. Thus, tax expenditures include any reductions in incometax liabilities that result from special tax provisions that provide tax benefits to particular taxpayers relative to this hypothetical income tax. Because the notion of a tax expenditure ismeasured against a hypothetical world, eliminating tax expenditures can involve many
significant policy questions.
Example: home mortgage interest deduction
As noted above, one of the largest individual tax expenditure provisions is thedeductibility of home mortgage interest expense by individuals. What does it mean to eliminatethis tax expenditure? As of what date would mortgage interest no longer be deductible? Wouldthe repeal apply to all existing mortgages or only to mortgages undertaken after the effectivedate? Either choice could be said to substantially eliminate the tax expenditure. These decisionswill affect taxpayer’s behavior regarding owning versus renting, the size of a home that they maychoose to purchase, as well as the amount of debt they undertake and the choice of assets thatthey may retain in their portfolios. These decisions will affect the magnitude of revenues thatredound to the Federal Treasury from the elimination of the tax expenditure and, as discussed below, these revenues will generally be less than the value of the estimated tax expenditure.
Example: employer de minimis fringe benefit--exercise room on site
Another example, while small in size, is employer de minimis fringe benefits. Currently,for example, the employer provision of an amenity like an exercise room on site is an allowabledeductible expense for the business but is not included in the income of the employee. Howwould this tax expenditure be eliminated? Would the deduction be denied to the employer? Or would there be an attempt to value the benefit and require that it be included in the income of theemployer?
Example: employer-provided pension benefits53
Another significant individual tax expenditure arises because pension benefits that accrueto individuals, either in defined contribution pension plans or in defined benefit pension plans,are not subject to the individual income tax. In the case of an employer's contribution to anindividual's defined contribution pension plan, elimination of the tax expenditure could mean:counting the employer's specific dollar contribution as part of the individual's current taxableincome. But the treatment of existing accounts is less clear. Would existing accounts still benefit from deferral of tax on earnings?
It is even less clear what elimination of this tax expenditure means in the context of adefined benefit accrual. Often the accrual value attributable to any specific individual dependsupon economic outcomes that are not currently known to either the employer or the employee.
52 Congressional Budget and Impoundment Control Act of 1974 (Pub. L. No. 93-344), sec. 3(3).
53 The Commission did not propose eliminating this tax expenditure.

8/4/2019 110922-Tom Barthold-Joint Deficit Cmte Testimony
http://slidepdf.com/reader/full/110922-tom-barthold-joint-deficit-cmte-testimony 38/86
38
Specifically, the accrual value often depends upon the number of years of service that theemployee ultimately provides to the employer and to the employee's as yet unknown highestsalary level. How policymakers might develop the rules to value and tax this current taxexpenditure benefit is not obvious.
Summary
These three examples demonstrate that eliminating many tax expenditures is not an easylegislative task. It is a task that involves many important decisions for policymakers.
Tax expenditure estimates compared to estimates of changed Federal revenues
A tax expenditure calculation is not the same as a revenue estimate for the repeal of thetax expenditure provision for three reasons. First, unlike revenue estimates, tax expenditurecalculations do not incorporate the effects of the behavioral changes of affected individuals or entities that are anticipated to occur in response to the repeal of a tax expenditure provision.Second, tax expenditure calculations are concerned with changes in the reported tax liabilities of
taxpayers. Because tax expenditure analysis focuses on tax liabilities as opposed to Federalgovernment tax receipts, there is no concern for the short-term timing of tax payments. Revenueestimates are concerned with changes in Federal tax receipts that are affected by the timing of alltax payments. Third, some of the tax provisions that provide an exclusion from income alsoapply to the FICA tax base, and the repeal of the income tax provision would automaticallyincrease FICA tax revenues as well as income tax revenues. This FICA effect would be reflectedin revenue estimates, but is not considered in tax expenditure calculations. There may also beinteractions between income tax provisions and other Federal taxes such as excise taxes and theestate and gift taxes.
If a tax expenditure provision were repealed, it is likely that the repeal would be made
effective for taxable years beginning after a certain date. Because most individual taxpayershave taxable years that coincide with the calendar year, the repeal of a provision affecting theindividual income tax most likely would be effective for taxable years beginning after December 31 of a certain year. However, the Federal government’s fiscal year begins October 1. Thus, therevenue estimate for repeal of a provision would show a smaller revenue gain in the first fiscalyear than in subsequent fiscal years. This is due to the fact that the repeal would be effectiveafter the start of the Federal government’s fiscal year. The revenue estimate might also reflectsome delay in the timing of the revenue gains as a result of the taxpayer tendency to postpone or forgo changes in tax withholding and estimated tax payments, and very often repeal or modification of a tax provision includes transition relief that would not be captured in a taxexpenditure calculation.

8/4/2019 110922-Tom Barthold-Joint Deficit Cmte Testimony
http://slidepdf.com/reader/full/110922-tom-barthold-joint-deficit-cmte-testimony 39/86
39
APPENDIX
A. Overview of Other Federal Taxes
1. Social insurance (employment) taxes
Social Security benefits and certain Medicare benefits are financed primarily by payrolltaxes on covered wages and self-employment income. The Federal Insurance Contributions Act(“FICA”) imposes a tax on employers based on the amount of wages paid to an employee duringthe year. The tax is composed of two parts: (1) the old age, survivors, and disability insurance(“OASDI”) tax equal to 6.2 percent of covered wages up to the taxable wage base ($106,800 in2011); and (2) the Medicare hospital insurance (“HI”) tax amount equal to 1.45 percent of covered wages. In addition to the tax on employers, each employee is subject to FICA taxesequal to the amount of tax imposed on the employer. For calendar year 2011, the employeeOASDI rate is reduced by two percentage points to 4.2 percent. The employee tax generallymust be withheld and remitted to the Federal government by the employer.
54Self-employed
taxpayers are subject to payroll tax under the Self-Employment Contributions Act (“SECA”).
The earnings base is indexed each year automatically according to a statutory formula.Any increase in the earnings base is based on the increase in average wages in the economy.55
As part of the Omnibus Budget Reconciliation Act of 1993,56 the earnings base for the HI portion of the tax was removed, making all earnings taxable for HI purposes, effective starting in1994.
The social insurance tax rate and taxable wage base have increased over time. Table A-1 below shows the evolution of the taxable wage base and rates of tax since 1975.
54 The OASDI and HI payroll tax is generally collected as a single tax with portions of it allocated by
statute among three separate trust funds (OASI, DI and HI).55 The earnings base can only increase in a year in which there was an increase in benefits under the cost-
of-living adjustment (COLA) formula. If there was no increase in benefits, the earnings base is prohibited fromincreasing. Sec. 230(a) of the Social Security Act. Since there was no increase in benefits from 2009 through 2011,the earnings base remained constant from 2009 through 2011 as well.
56 Pub. L. No. 103-66.

8/4/2019 110922-Tom Barthold-Joint Deficit Cmte Testimony
http://slidepdf.com/reader/full/110922-tom-barthold-joint-deficit-cmte-testimony 40/86
40
Table A-1.−Social Insurance Taxable Wage Base and Rates of Tax
Year
Annual
Maximum
Taxable
Wage Base
Contribution Rate for Both
Employers and Employees
(Percent of Covered Earnings)
Contribution Rate for
Self-Employed Persons
Total OASDI HI Total OASDI HI
1975 $14,100 5.85 4.95 0.9 7.9 7.0 0.9
1976 $15,300 5.85 4.95 0.9 7.9 7.0 0.9
1977 $16,500 5.85 4.95 0.9 7.9 7.0 0.9
1978 $17,700 6.05 5.05 1.00 8.1 7.1 1.0
1979 $22,900 6.13 5.08 1.05 8.1 7.05 1.05
1980 $25,900 6.13 5.08 1.05 8.1 7.05 1.05
1981 $29,700 6.65 5.35 1.3 9.3 8.0 1.3
1982 $32,400 6.7 5.4 1.3 9.35 8.05 1.3
1983 $35,700 6.7 5.4 1.3 9.35 8.05 1.3
19841 $37,800 7.0 5.7 1.3 14.00 11.4 2.6
1985 $39,600 7.05 5.7 1.35 14.10 11.4 2.7
1986 $42,000 7.15 5.7 1.45 14.30 11.4 2.9
1987 $43,800 7.15 5.7 1.45 14.30 11.4 2.91988 $45,000 7.51 6.06 1.45 15.02 12.12 2.9
1989 $48,000 7.51 6.06 1.45 15.02 12.12 2.9
1990 $51,300 7.65 6.2 1.45 15.3 12.4 2.9
1991 $53,400 7.65 6.2 1.45 15.3 12.4 2.9
1992 $55,500 7.65 6.2 1.45 15.3 12.4 2.9
1993 $57,600 7.65 6.2 1.45 15.3 12.4 2.9
1994 $60,600 7.65 6.2 1.45 15.3 12.4 2.9
1995 $61,200 7.65 6.2 1.45 15.3 12.4 2.9
1996 $62,700 7.65 6.2 1.45 15.3 12.4 2.9
1997 $65,400 7.65 6.2 1.45 15.3 12.4 2.9
1998 $68,400 7.65 6.2 1.45 15.3 12.4 2.9
1999 $72,600 7.65 6.2 1.45 15.3 12.4 2.9
2000 $76,200 7.65 6.2 1.45 15.3 12.4 2.9
2001 $80,400 7.65 6.2 1.45 15.3 12.4 2.9
2002 $84,900 7.65 6.2 1.45 15.3 12.4 2.9
2003 $87,900 7.65 6.2 1.45 15.3 12.4 2.9
2004 $87,900 7.65 6.2 1.45 15.3 12.4 2.9
2005 $90,000 7.65 6.2 1.45 15.3 12.4 2.9
2006 $94,200 7.65 6.2 1.45 15.3 12.4 2.9
2007 $97,500 7.65 6.2 1.45 15.3 12.4 2.9
2008 $102,000 7.65 6.2 1.45 15.3 12.4 2.92009 $106,800 7.65 6.2 1.45 15.3 12.4 2.9
2010 $106,800 7.65 6.2 1.45 15.3 12.4 2.9
2011 $106,800 [2] [2] 1.45 13.3 10.4 2.91 For 1984 only, employees were allowed a credit of 0.3 percent of taxable wages against their FICA tax
liability, reducing the effective rate to 6.7 percent.
2 The Tax Relief, Unemployment Insurance Reauthorization, and Job Creation Act of 2010 reduced theFICA tax rate for employees by two percentage points for 2011. Specifically, the employer OASDI rate remains at6.2 while the employee rate is reduced to 4.2.

8/4/2019 110922-Tom Barthold-Joint Deficit Cmte Testimony
http://slidepdf.com/reader/full/110922-tom-barthold-joint-deficit-cmte-testimony 41/86
41
2. Estate and gift tax
The United States generally imposes a gift tax on transfers of property by gift made by aU.S. citizen or resident, whether made directly or indirectly and whether made in trust or otherwise. 57 Nonresident aliens are subject to the gift tax with respect to transfers of tangiblereal or personal property where the property is located in the United States at the time of the gift.An estate tax generally is imposed on the taxable estate of any person who was a citizen or resident of the United States at the time of death and on certain property held by a nonresidentalien if the property is located in the United States at the time of death.
58The estate tax is
imposed on the estate of the decedent and generally is based on the fair market value of the property passing at death. The taxable estate generally equals the worldwide gross estate lesscertain allowable deductions. Since 1976, a generation-skipping transfer tax also has beenimposed on certain transfers to “skip persons,” generally, beneficiaries in a generation more thanone generation below that of the transferor.
Prior to 1976, the estate and gift tax systems were two separate systems. The Tax
Reform Act of 197659 unified the estate and gift taxes, with a single graduated rate table for bothcumulative inter vivos gifts and taxable transfers at death. Since that time, the top marginalestate and gift tax rate has decreased significantly, from 70 percent in 1977 to 35 percent in2011. The 1976 Act also combined separate estate and gift tax exemptions into a single “unifiedcredit,” which effectively exempts a certain dollar value in gifts or bequests from gift or estatetax. The exemption value of the unified credit has increased significantly since that time, from$120,667 in 1977 to $5 million in 2011.60
The Economic Growth and Tax Relief Reconciliation Act of 2001 (“EGTRRA”)61 gradually reduced the estate and generation skipping transfer taxes through 2009, and generallyrepealed the estate and generation-skipping transfer taxes for one year in 2010. The Tax Relief,
Unemployment Insurance Reauthorization, and Job Creation Act of 201062
generally reinstatedthe estate and generation-skipping transfer taxes for 2010, but allowed a decedent’s executor to
57 In determining their taxable gifts, taxpayers are permitted to exclude every year a specified dollar valueof gifts to another person, provided the gift is a gift of a present interest in property. The gift tax annual exclusionhas increased over time, from $3,000 in 1975 to $13,000 in 2011.
58 Assets acquired from a decedent generally receive a fair market value (“stepped up”) basis. In general,the tax basis of assets acquired by gift is carried over from the donor of the gift. Gifts and bequests generally areexcluded from the recipient’s gross income for income tax purposes.
59 Pub. L. No. 94-455.
60 Through 1976, and again from 2004 through 2010, the exemption value of the unified credit for estateand gift tax purposes differed. The generation-skipping transfer tax rate equals the highest marginal estate tax rate,and the generation-skipping transfer tax exemption equals the estate tax exemption in effect for the year.
61 Pub. L. No. 107-16.
62 Pub. L. No. 111-312.

8/4/2019 110922-Tom Barthold-Joint Deficit Cmte Testimony
http://slidepdf.com/reader/full/110922-tom-barthold-joint-deficit-cmte-testimony 42/86
42
elect out of the new regime (such that an estate tax would not apply); the Act set the generation-skipping transfer tax rate at zero percent.
The estate and gift tax laws include special rules, which have become more generousover time, for gifts or bequests to a spouse. Prior to 1976, for example, a marital deduction was permitted for 50 percent of the value of property transferred through an estate from a deceasedspouse to the surviving spouse. The 1976 Act provided a 100-percent marital deduction for thefirst $250,000 of property transferred to a surviving spouse. Since 1981, the estate and gift taxlaws generally have provided for unlimited deductions for gifts and bequests to spouses.
The estate and gift tax laws also include a number of special, preferential rules for transfers of interests in closely held businesses and farms, including special valuation rules andrules that allow for installment payment of estate taxes under certain circumstances. For example, a provision included in the 1976 Act generally permits a decedent’s executor to valuefarm and other business real property for estate tax purposes at its current-use value instead of atits highest and best use value for estate tax purposes, subject to a maximum reduction in value.
63
This maximum reduction in value subject to tax has increased over time, from $500,000 in 1981to $1 million in 2011.
Table A-2 below shows the evolution since 1975 of the gift tax annual exclusion, theestate and gift tax exemptions, the highest statutory estate and gift tax rates, and the thresholdabove which such rates apply.
Table A-2.–Estate and Gift Tax Rates and Exemption Amounts, 1975-2011
Year
Annual gift
exclusion
Exemption value of
unified credit
(gift exemption when
not unified)
Threshold of
highest statutory
tax rate
Highest statutory
tax rate (percent)
1975-1976 $3,000 $60,000 ($30,000) $10 million 57.75 gift; 77 estate
1977 $3,000 $120,667 $5 million 70
1978 $3,000 $134,000 $5 million 70
1979 $3,000 $147,333 $5 million 70
1980 $3,000 $161,563 $5 million 70
1981 $10,000 $175,625 $5 million 70
1982 $10,000 $225,000 $4 million 65
1983 $10,000 $275,000 $3.5 million 60
1984 $10,000 $325,000 $3 million 55
1985 $10,000 $400,000 $3 million 55
1986 $10,000 $500,000 $3 million 55
1987-1997 $10,000 $600,000 $3 million 55
1998 $10,000 $625,000 $3 million 55
63 Sec. 2032A.

8/4/2019 110922-Tom Barthold-Joint Deficit Cmte Testimony
http://slidepdf.com/reader/full/110922-tom-barthold-joint-deficit-cmte-testimony 43/86
43
Year
Annual gift
exclusion
Exemption value of
unified credit
(gift exemption when
not unified)
Threshold of
highest statutory
tax rate
Highest statutory
tax rate (percent)
1999 $10,000 $650,000 $3 million 55
2000-2001 $10,000 $675,000 $3 million 552002 $11,000 $1 million $2.5 million 50
2003 $11,000 $1 million $2 million 49
2004 $11,000 $1.5 million ($1 million) $2 million 48
2005 $11,000 $1.5 million ($1 million) $2 million 47
2006 $12,000 $2 million ($1 million) $2 million 46
2007-2008 $12,000 $2 million ($1 million) $1.5 million 45
2009 $13,000 $3.5 million ($1 million) $1.5 million 45
201064 $13,000 $5 million ($1 million) $500,00065 35
2011 $13,000 $5 million $500,00066 35
3. Excise taxes
In general
The Federal tax system imposes excise taxes on selected goods and services.67
Inaddition to excise taxes the primary purpose of which is revenue production, excise taxes also areimposed to promote adherence to other policies (e.g., penalty excise taxes). Generally, excisetaxes are taxes imposed on a per unit or ad valorem (i.e., percentage of price) basis on the
64
Under the 2010 Act, executors of estates of decedents who die during 2010 generally may elect to havethe EGTRRA 2010 estate tax and basis rules apply as if the estate tax provisions of the 2010 Act had never beenenacted. In the event of such an election: (1) no estate tax would apply; (2) the generation skipping transfer taxwould remain in effect with a $5 million exemption and a zero-percent rate; (3) The gift tax exemption and ratewould be $1 million and 35 percent; and (4) basis of assets acquired from the decedent would take a modified carry-over basis under section 1022.
65 The 2010 Act modifies the rate table in section 2001(c) to provide for a $500,000 threshold for thehighest statutory rate of 35 percent. However, the estate and gift tax exemptions for 2010 exceed this thresholdamount, with the result that any transfers up to the exemption amounts will not be taxed. Therefore, in practice, the35-percent rate applies only to 2010 transfers that exceed a taxpayer’s estate or gift tax exemptions, and any lower marginal rates listed in the section 2001(c) rate table will not apply.
66
The 2010 Act modifies the rate table in section 2001(c) to provide for a $500,000 threshold for thehighest statutory rate of 35 percent. However, the estate and gift tax exemptions for 2011 exceed this thresholdamount, with the result that any transfers up to the exemption amounts will not be taxed. Therefore, in practice, the35-percent rate applies only to 2011 transfers that exceed a taxpayer’s estate or gift tax exemptions, and any lower marginal rates listed in the section 2001(c) rate table will not apply.
67 For a more detailed description of Federal excise taxes, see, Joint Committee on Taxation , Present Law
and Background Information on Federal Excise Taxes (JCS-1-11), January 2011.

8/4/2019 110922-Tom Barthold-Joint Deficit Cmte Testimony
http://slidepdf.com/reader/full/110922-tom-barthold-joint-deficit-cmte-testimony 44/86
44
production, importation, or sale of a specific good or service. Among the goods and servicessubject to U.S. excise taxes are motor fuels, alcoholic beverages, tobacco products, firearms, air and ship transportation, certain environmentally hazardous activities and products, coal,telephone communications, certain wagers, and vehicles lacking in fuel efficiency.68
In 2010, the Congress enacted several new excise taxes. These taxes are: the Patient-Centered Outcomes Research Trust Fund taxes;69 the annual fee on branded prescription pharmaceutical manufacturers and importers;
70the excise tax on indoor tanning services;
71the
excise tax on certain medical devices;72 the annual fee on health insurance providers;73 the excisetaxes on individuals without minimum essential health coverage;74 the excise tax on certain largeemployers not offering health care coverage;
75the excise tax on insurers for high-cost employer-
sponsored health coverage;76 and the foreign procurement excise tax.77
Revenues from certain Federal excise taxes are dedicated to trust funds (e.g., theHighway Trust Fund) for designated expenditure programs. Revenues from other excise taxes(e.g., alcoholic beverages) go to the General Fund for general purpose expenditures.
The largest excise taxes in terms of revenue (for fiscal year 2009) are those for gasolinemotor fuels ($25.1 billion), domestic cigarettes ($11.0 billion), diesel motor fuel ($8.5 billion),and domestic air ticket taxes ($7.3 billion).
The following summarizes the key changes to the alcohol, cigarette, and motor fuelexcise taxes since 1975.
68 See Joint Committee on Taxation, Study of the Overall State of the Federal Tax System and
Recommendations for Simplification, Pursuant to Section 8022(3)(B) of the Internal Revenue Code of 1986 (JCS-3-01), April 2001, pp. 478-516 for discussion of various Federal excise taxes.
69 Sec. 4375 (relating to health insurance); and sec. 4376 (relating to self-insured health plans).
70 Sec. 9008 of Pub. L. No 111-148, as amended by sec. 1404 of Pub. L. No. 111-152.
71 Sec. 5000B.
72 Sec. 4191.
73 Sec. 9010 of Pub. L. No. 111-148, as amended by sec. 10905 of such Act, as further amended by sec.1406 of Pub. L. No. 111-152.
74 Sec. 5000A.
75 Sec. 4980H.
76 Sec. 4980I.
77 Sec. 5000C.

8/4/2019 110922-Tom Barthold-Joint Deficit Cmte Testimony
http://slidepdf.com/reader/full/110922-tom-barthold-joint-deficit-cmte-testimony 45/86
45
Alcohol
Taxes are imposed at different rates for distilled spirits, beer, and wines, and are imposedon these products when produced or imported. Table A-3 below shows the alcohol excise taxrates since 1975.
A-3.−
Alcohol Excise Taxes
Type of Alcohol 1975 1985 1990-PresentDistilled Spirits (per proof gallon) $10.50 $12.50 $13.50Beer (per barrel) 9.0 9.0 18.0Wines (per wine gallon)
“Still wines” not more than 14 percentalcohol
.17 .17 1.07
“Still wines” 14-21% alcohol .67 .67 1.57“Still wines” 21-24% alcohol 2.25 2.25 3.15“Still wines” more than 24% alcohol Taxed as spirits Taxed as Spirits Taxed as SpiritsChampagne and sparkling wines 3.40 3.40 3.40Artificially carbonated wines 2.40 2.40 3.30
Cigarettes
In 1975 the excise tax rate on small cigarettes was eight cents per pack, the same rate thathad been in effect since 1951.
78Table A-4 below shows the cigarette excise tax rates since 1975.
Table A-4.−Cigarette Excise Tax Rates
Year1975 -
1981
1982 -
1990
1991 -
1992
1993 -
1996
1997 -
2008
2009 -
Present
Small CigarettesTax Rate(cents per pack)
8 16 20 24 39 100.66
Motor fuels
The tax on gasoline in 1975 was four cents per gallon and the revenues raised from thetax were allocated to the Highway Trust Fund (“HTF”), created by the Highway Revenue Act of
78 Small cigarettes are those weighing three pounds or less per thousand.

8/4/2019 110922-Tom Barthold-Joint Deficit Cmte Testimony
http://slidepdf.com/reader/full/110922-tom-barthold-joint-deficit-cmte-testimony 46/86
46
1956.79 The tax on diesel fuel was also four cents per gallon in 1975. Table A-5 below showsmotor fuel excise tax rates since 1975.
Table A-5.−Motor Fuel Excise Tax Rates
Year 1975 1983 1984 1987 19901993-
Present(1)
Gasoline(cents per gallon)
4 9 9 9.1 14.1 18.4
Diesel (cents per gallon) 4 9 15 15.1 20.1 24.4
1 The current gasoline and diesel rates of 18.4 cents per gallon and 24.4 cents per gallon, respectively, consist of 18.3 cents per gallon (gasoline) and 24.3 cents per gallon (diesel) allocated to the HTF, and 0.1 cent per gallonallocated to the Leaking Underground Storage Tank Trust Fund.
79 Pub. L. No. 84-627.

8/4/2019 110922-Tom Barthold-Joint Deficit Cmte Testimony
http://slidepdf.com/reader/full/110922-tom-barthold-joint-deficit-cmte-testimony 47/86
47
B. Historical Federal Receipts by Source - Supplemental Material
Tables A-6 through A-8 below show data from 1950 to 2010 on the aggregate receiptscollected from the individual income tax, the corporate income tax, social insurance taxes, excisetaxes, the estate and gift taxes, and other receipts. Table A-6 shows the aggregate revenuescollected by source, in millions of dollars.
Table A-7 shows the same aggregate revenues by source, but as a percentage of GrossDomestic Product (“GDP”). As a share of GDP, the individual income tax has generallyoscillated around its average value of eight percent over this period of time. By contrast,corporate income taxes and excise taxes have generally declined as a share of GDP during this period, while social insurance taxes have risen substantially as a share of GDP over this period.In 2010, total taxes averaged 14.9 percent of GDP, well below the average of the 1950-2010 period of 17.9 percent.
Table A-8 shows Federal receipts by source as a percentage of all Federal receipts.
Reflecting the same facts as above, the individual income tax has oscillated around its averageshare over this period of 44.8 percent, the corporate and excise taxes have declined as a percentage of all revenues, and social insurance taxes have risen substantially from around 10 percent of the total in the early 1950s to levels generally varying between 35 and 40 percent inrecent years. Social insurance taxes as a share of all taxes reached a historic high of 42.3 percentin 2009, owing to sharp declines in individual and corporate income taxes.
Figure A-1 shows the components of adjusted gross income as a percentage of totaladjusted gross income from 1950 to 2008. Since 1980, salary and wage income has fallen as ashare of adjusted gross income, while business net income has risen substantially.

8/4/2019 110922-Tom Barthold-Joint Deficit Cmte Testimony
http://slidepdf.com/reader/full/110922-tom-barthold-joint-deficit-cmte-testimony 48/86
48
Individual Corporate Estate
Fiscal Income Income Employment[1] Excise and Gift Other[2]
Year Tax Tax Taxes Taxes Taxes Receipts Total
1950 15,755 10,449 4,338 7,550 698 653 39,443
1951 21,616 14,101 5,674 8,648 708 870 51,616
1952 27,934 21,226 6,445 8,852 818 892 66,167
1953 29,816 21,238 6,820 9,877 881 976 69,6081954 29,542 21,101 7,208 9,945 934 971 69,701
1955 28,747 17,861 7,862 9,131 924 926 65,451
1956 32,188 20,880 9,320 9,929 1,161 1,109 74,587
1957 35,620 21,167 9,997 10,534 1,365 1,307 79,990
1958 34,724 20,074 11,239 10,638 1,393 1,568 79,636
1959 36,719 17,309 11,722 10,578 1,333 1,588 79,249
1960 40,715 21,494 14,683 11,676 1,606 2,317 92,492
1961 41,338 20,954 16,439 11,860 1,896 1,900 94,388
1962 45,571 20,523 17,046 12,534 2,016 1,985 99,676
1963 47,588 21,579 19,804 13,194 2,167 2,228 106,560
1964 48,697 23,493 21,963 13,731 2,394 2,337 112,613
1965 48,792 25,461 22,242 14,570 2,716 3,037 116,817
1966 55,446 30,073 25,546 13,062 3,066 3,642 130,835
1967 61,526 33,971 32,619 13,719 2,978 4,009 148,822
1968 68,726 28,665 33,923 14,079 3,051 4,529 152,973
1969 87,249 36,678 39,015 15,222 3,491 5,227 186,882
1970 90,412 32,829 44,362 15,705 3,644 5,855 192,807
1971 86,230 26,785 47,325 16,614 3,735 6,450 187,139
1972 94,737 32,166 52,574 15,477 5,436 6,919 207,309
1973 103,246 36,153 63,115 16,260 4,917 7,109 230,799
1974 118,952 38,650 75,071 16,844 5,035 8,702 263,224
1975 122,386 40,621 84,534 16,551 4,611 10,387 279,090
1976 131,603 41,409 90,769 16,963 5,216 12,101 298,060
1977 157,626 54,892 106,485 17,548 7,327 11,681 355,559
1978 180,988 59,952 120,967 18,376 5,285 13,993 399,561
1979 217,841 65,677 138,939 18,745 5,411 16,690 463,302
1980 244,069 64,600 157,803 24,329 6,389 19,922 517,112
1981 285,917 61,137 182,720 40,839 6,787 21,872 599,272
1982 297,744 49,207 201,498 36,311 7,991 25,015 617,766
1983 288,938 37,022 208,994 35,300 6,053 24,256 600,562
1984 298,415 56,893 239,376 37,361 6,010 28,382 666,438
1985 334,531 61,331 265,163 35,992 6,422 30,598 734,037
1986 348,959 63,143 283,901 32,919 6,958 33,275 769,155
1987 392,557 83,926 303,318 32,457 7,493 34,536 854,288
1988 401,181 94,508 334,335 35,227 7,594 36,393 909,238
1989 445,690 103,291 359,416 34,386 8,745 39,576 991,105
1990 466,884 93,507 380,047 35,345 11,500 44,674 1,031,958
1991 467,827 98,086 396,016 42,402 11,138 39,519 1,054,988
1992 475,964 100,270 413,689 45,569 11,143 44,574 1,091,208
1993 509,680 117,520 428,300 48,057 12,577 38,201 1,154,335
1994 543,055 140,385 461,475 55,225 15,225 43,202 1,258,5661995 590,244 157,004 484,473 57,484 14,763 47,822 1,351,790
1996 656,417 171,824 509,414 54,014 17,189 44,195 1,453,053
1997 737,466 182,293 539,371 56,924 19,845 43,333 1,579,232
1998 828,586 188,677 571,831 57,673 24,076 50,885 1,721,728
1999 879,480 184,680 611,833 70,414 27,782 53,263 1,827,452
2000 1,004,462 207,289 652,852 68,865 29,010 62,713 2,025,191
2001 994,339 151,075 693,967 66,232 28,400 57,069 1,991,082
2002 858,345 148,044 700,760 66,989 26,507 52,491 1,853,136
2003 793,699 131,778 712,978 67,524 21,959 54,376 1,782,314
2004 808,959 189,371 733,407 69,855 24,831 53,691 1,880,114
2005 927,222 278,282 794,125 73,094 24,764 56,124 2,153,611
2006 1,043,908 353,915 837,821 73,961 27,877 69,387 2,406,869
2007 1,163,472 370,243 869,607 65,069 26,044 73,550 2,567,985
2008 1,145,747 304,346 900,155 67,334 28,844 77,565 2,523,991
2009 915,308 138,229 890,917 62,483 23,482 74,570 2,104,989
2010 898,549 191,437 864,814 66,909 18,885 122,130 2,162,724
[1] Em ployment taxes compris e old-age and survivors insurance, disability insurance, hospital insurance, railroadretirement, railroad social security equivalent account, employment insurance, employee share of Federal employees
retirement, and certain non-Federal employees retirement.
[2] Other receipts are primarily compose d of [1] customs duti es and fees, and [2] deposits of earnings by the Federal
Reserve system.
Source: Office of Management and Budget, Historical Tables, Budget of the U.S. Government, Fiscal Year 2012, Tab les 2.1 and 2.5, and JCT calculations.
Table A-6.−Aggregate Federal Receipts by Source, 1950-2010
[millions of dollars]

8/4/2019 110922-Tom Barthold-Joint Deficit Cmte Testimony
http://slidepdf.com/reader/full/110922-tom-barthold-joint-deficit-cmte-testimony 49/86
49
Individual Estate
Fiscal Income Corporate Employment[1] Excise and Gift Other[2]
Year Tax Tax Taxes Taxes Taxes Receipts Total
1950 5.8 3.8 1.6 2.8 0.3 0.2 14.4
1951 6.8 4.4 1.8 2.7 0.2 0.3 16.1
1952 8.0 6.1 1.8 2.5 0.2 0.3 19.0
1953 8.0 5.7 1.8 2.7 0.2 0.3 18.7
1954 7.8 5.6 1.9 2.6 0.2 0.3 18.51955 7.3 4.5 2.0 2.3 0.2 0.2 16.5
1956 7.5 4.9 2.2 2.3 0.3 0.3 17.5
1957 7.9 4.7 2.2 2.3 0.3 0.3 17.7
1958 7.5 4.4 2.4 2.3 0.3 0.3 17.3
1959 7.5 3.5 2.4 2.2 0.3 0.3 16.2
1960 7.8 4.1 2.8 2.3 0.3 0.4 17.8
1961 7.8 4.0 3.1 2.2 0.4 0.4 17.8
1962 8.0 3.6 3.0 2.2 0.4 0.3 17.6
1963 7.9 3.6 3.3 2.2 0.4 0.4 17.8
1964 7.6 3.7 3.4 2.1 0.4 0.4 17.6
1965 7.1 3.7 3.2 2.1 0.4 0.4 17.0
1966 7.3 4.0 3.4 1.7 0.4 0.5 17.3
1967 7.6 4.2 4.0 1.7 0.4 0.5 18.4
1968 7.9 3.3 3.9 1.6 0.4 0.5 17.6
1969 9.2 3.9 4.1 1.6 0.4 0.6 19.7
1970 8.9 3.2 4.4 1.6 0.4 0.6 19.0
1971 8.0 2.5 4.4 1.5 0.3 0.6 17.3
1972 8.1 2.7 4.5 1.3 0.5 0.6 17.6
1973 7.9 2.8 4.8 1.2 0.4 0.5 17.6
1974 8.3 2.7 5.2 1.2 0.4 0.6 18.3
1975 7.8 2.6 5.4 1.1 0.3 0.7 17.9
1976 7.6 2.4 5.2 1.0 0.3 0.7 17.1
1977 8.0 2.8 5.4 0.9 0.4 0.6 18.0
1978 8.2 2.7 5.5 0.8 0.2 0.6 18.0
1979 8.7 2.6 5.6 0.7 0.2 0.7 18.5
1980 9.0 2.4 5.8 0.9 0.2 0.7 19.0
1981 9.4 2.0 6.0 1.3 0.2 0.7 19.6
1982 9.2 1.5 6.3 1.1 0.2 0.8 19.2
1983 8.4 1.1 6.1 1.0 0.2 0.7 17.5
1984 7.8 1.5 6.2 1.0 0.2 0.7 17.3
1985 8.1 1.5 6.4 0.9 0.2 0.7 17.7
1986 7.9 1.4 6.4 0.7 0.2 0.8 17.5
1987 8.4 1.8 6.5 0.7 0.2 0.7 18.4
1988 8.0 1.9 6.7 0.7 0.2 0.7 18.2
1989 8.3 1.9 6.7 0.6 0.2 0.7 18.4
1990 8.1 1.6 6.6 0.6 0.2 0.8 18.0
1991 7.9 1.7 6.7 0.7 0.2 0.7 17.8
1992 7.6 1.6 6.6 0.7 0.2 0.7 17.5
1993 7.7 1.8 6.5 0.7 0.2 0.6 17.51994 7.8 2.0 6.6 0.8 0.2 0.6 18.0
1995 8.0 2.1 6.6 0.8 0.2 0.7 18.4
1996 8.5 2.2 6.6 0.7 0.2 0.6 18.8
1997 9.0 2.2 6.6 0.7 0.2 0.5 19.2
1998 9.6 2.2 6.6 0.7 0.3 0.6 19.9
1999 9.6 2.0 6.6 0.8 0.3 0.6 19.8
2000 10.2 2.1 6.6 0.7 0.3 0.6 20.6
2001 9.7 1.5 6.8 0.6 0.3 0.6 19.5
2002 8.1 1.4 6.6 0.6 0.3 0.5 17.6
2003 7.2 1.2 6.5 0.6 0.2 0.5 16.2
2004 6.9 1.6 6.3 0.6 0.2 0.5 16.1
2005 7.5 2.2 6.4 0.6 0.2 0.5 17.3
2006 7.9 2.7 6.3 0.6 0.2 0.5 18.2
2007 8.4 2.7 6.3 0.5 0.2 0.5 18.5
2008 8.0 2.1 6.3 0.5 0.2 0.5 17.5
2009 6.5 1.0 6.3 0.4 0.2 0.5 14.9
2010 6.2 1.3 6.0 0.5 0.1 0.8 14.9
1950-2010 Avg. 8.0 2.8 5.0 1.3 0.3 0.5 17.9
[1] Employment taxes compris e old-age and survivors ins urance, disability insurance, hospital insurance, railroad
retirement, railroad Social Security equivalent account, employment insurance, employee share of Federal employees
retirement, and certain non-Federal employees retirement.
[2] Other receipts are primarily composed of (1) customs duties and fees, and (2) deposits of earnings by the Federal
Reserve system.
Source: Office of Managem ent and Budget, Historical Tables, Budget of the U.S. Government, Fiscal Year 2012, Table 2.3;
Economic Report of the President, 2011, Table B-78 for fiscal year GDP Figures.
Table A-7.−Federal Receipts by Source, As a Percentage of GDP, 1950-2010

8/4/2019 110922-Tom Barthold-Joint Deficit Cmte Testimony
http://slidepdf.com/reader/full/110922-tom-barthold-joint-deficit-cmte-testimony 50/86
50
Individual Estate
Fiscal Income Corporate Employment[1] Excise and Gift Other[2]
Year Tax Tax Taxes Taxes Taxes Receipts
1950 39.9 26.5 11.0 19.1 1.8 1.7
1951 41.9 27.3 11.0 16.8 1.4 1.7
1952 42.2 32.1 9.7 13.4 1.2 1.31953 42.8 30.5 9.8 14.2 1.3 1.4
1954 42.4 30.3 10.3 14.3 1.3 1.4
1955 43.9 27.3 12.0 14.0 1.4 1.4
1956 43.2 28.0 12.5 13.3 1.6 1.5
1957 44.5 26.5 12.5 13.2 1.7 1.6
1958 43.6 25.2 14.1 13.4 1.7 2.0
1959 46.3 21.8 14.8 13.3 1.7 2.0
1960 44.0 23.2 15.9 12.6 1.7 2.5
1961 43.8 22.2 17.4 12.6 2.0 2.0
1962 45.7 20.6 17.1 12.6 2.0 2.0
1963 44.7 20.3 18.6 12.4 2.0 2.1
1964 43.2 20.9 19.5 12.2 2.1 2.1
1965 41.8 21.8 19.0 12.5 2.3 2.6
1966 42.4 23.0 19.5 10.0 2.3 2.8
1967 41.3 22.8 21.9 9.2 2.0 2.7
1968 44.9 18.7 22.2 9.2 2.0 3.0
1969 46.7 19.6 20.9 8.1 1.9 2.8
1970 46.9 17.0 23.0 8.1 1.9 3.0
1971 46.1 14.3 25.3 8.9 2.0 3.4
1972 45.7 15.5 25.4 7.5 2.6 3.3
1973 44.7 15.7 27.3 7.0 2.1 3.1
1974 45.2 14.7 28.5 6.4 1.9 3.3
1975 43.9 14.6 30.3 5.9 1.7 3.7
1976 44.2 13.9 30.5 5.7 1.7 4.1
1977 44.3 15.4 29.9 4.9 2.1 3.3
1978 45.3 15.0 30.3 4.6 1.3 3.5
1979 47.0 14.2 30.0 4.0 1.2 3.6
1980 47.2 12.5 30.5 4.7 1.2 3.9
1981 47.7 10.2 30.5 6.8 1.1 3.6
1982 48.2 8.0 32.6 5.9 1.3 4.0
1983 48.1 6.2 34.8 5.9 1.0 4.0
1984 44.8 8.5 35.9 5.6 0.9 4.3
1985 45.6 8.4 36.1 4.9 0.9 4.2
1986 45.4 8.2 36.9 4.3 0.9 4.3
1987 46.0 9.8 35.5 3.8 0.9 4.0
1988 44.1 10.4 36.8 3.9 0.8 4.0
1989 45.0 10.4 36.3 3.5 0.9 4.01990 45.2 9.1 36.8 3.4 1.1 4.3
1991 44.3 9.3 37.5 4.0 1.1 3.7
1992 43.6 9.2 37.9 4.2 1.0 4.1
1993 44.2 10.2 37.1 4.2 1.1 3.3
1994 43.1 11.2 36.7 4.4 1.2 3.4
1995 43.7 11.6 35.8 4.3 1.1 3.5
1996 45.2 11.8 35.1 3.7 1.2 3.0
1997 46.7 11.5 34.2 3.6 1.3 2.7
1998 48.1 11.0 33.2 3.3 1.4 3.0
1999 48.1 10.1 33.5 3.9 1.5 2.9
2000 49.6 10.2 32.2 3.4 1.4 3.1
2001 49.9 7.6 34.9 3.3 1.4 2.9
2002 46.3 8.0 37.8 3.6 1.4 2.8
2003 44.5 7.4 40.0 3.8 1.2 3.1
2004 43.0 10.1 39.0 3.7 1.3 2.9
2005 43.1 12.9 36.9 3.4 1.1 2.6
2006 43.4 14.7 34.8 3.1 1.2 2.9
2007 45.3 14.4 33.9 2.5 1.0 2.9
2008 45.4 12.1 35.7 2.7 1.1 3.1
2009 43.5 6.6 42.3 3.0 1.1 3.5
2010 41.5 8.9 40.0 3.1 0.9 5.6
1950-2010 Avg. 44.8 15.7 27.7 7.3 1.5 3.0
[1] Em ployment taxes compris e old-age and survivors insurance, disabil ity insurance, hospital ins urance, railroad
retirement, railroad Social Security equivalent account, employment insurance, employee share of Federal employees
retirement, and certain non-Federal employees retirement.
[2] Other receipts are primarily composed of (1) customs duties a nd fees, and (2) deposits of earnings by the Federal
Reserve system.
Source: Office of Management and Budget, Historical Tables, Budget of the U.S. Government, Fiscal Year 2012, Table 2.2.
Table A-8.−Federal Receipts by Source, As a Percentage of Total Revenues,
1950-2010

8/4/2019 110922-Tom Barthold-Joint Deficit Cmte Testimony
http://slidepdf.com/reader/full/110922-tom-barthold-joint-deficit-cmte-testimony 51/86
51
0%
10%
20%
30%
40%
50%
60%
70%
80%
90%
100%
0%
2%
4%
6%
8%
10%
12%
14%
16%
18%
20%
1 9 5 0
1 9 5 2
1 9 5 4
1 9 5 6
1 9 5 8
1 9 6 0
1 9 6 2
1 9 6 4
1 9 6 6
1 9 6 8
1 9 7 0
1 9 7 2
1 9 7 4
1 9 7 6
1 9 7 8
1 9 8 0
1 9 8 2
1 9 8 4
1 9 8 6
1 9 8 8
1 9 9 0
1 9 9 2
1 9 9 4
1 9 9 6
1 9 9 8
2 0 0 0
2 0 0 2
2 0 0 4
2 0 0 6
2 0 0 8
P e r c e n t o f T o t a l A G I - - " S a l a r i e s a n d W a g e s " O N L Y
P e r c e n t o f T
o t a l A G I - - A
l l E x c e p t " S a l a r i e s a n d W a g e s "
Figure A-1.−Components of AGI as Percentage of Total, 1950-2008
Interest
Dividends
Business Net Income
Net Capital Gains
All Other Income
Salaries and Wages
(Scale on Right Side of
Chart)
Source: Internal Revenue Service

8/4/2019 110922-Tom Barthold-Joint Deficit Cmte Testimony
http://slidepdf.com/reader/full/110922-tom-barthold-joint-deficit-cmte-testimony 52/86
52
C. Variety of Business Organizations - Supplemental Data
Table A-9.−Number of Different Types of Business Returns, 1978-2008
Year
Non-Farm
Sole Props
C
Corporations
S
Corporations Partnerships Farms Total1978 8,908,289 1,898,100 478,679 1,234,157 2,704,794 15,224,019
1979 9,343,603 2,041,887 514,907 1,299,593 2,605,684 15,805,674
1980 9,730,019 2,165,149 545,389 1,379,654 2,608,430 16,428,641
1981 9,584,790 2,270,931 541,489 1,460,502 2,641,254 16,498,966
1982 10,105,515 2,361,714 564,219 1,514,212 2,689,237 17,234,897
1983 10,703,921 2,350,804 648,267 1,541,539 2,710,044 17,954,575
1984 11,262,390 2,469,404 701,339 1,643,581 2,694,420 18,771,134
1985 11,928,573 2,552,470 724,749 1,713,603 2,620,861 19,540,256
1986 12,393,700 2,602,301 826,214 1,702,952 2,524,331 20,049,498
1987 13,091,132 2,484,228 1,127,905 1,648,035 2,420,186 20,771,486
1988 13,679,302 2,305,598 1,257,191 1,654,245 2,367,527 21,263,863
1989 14,297,558 2,204,896 1,422,967 1,635,164 2,359,718 21,920,303
1990 14,782,738 2,141,558 1,575,092 1,553,529 2,321,153 22,374,070
1991 15,180,722 2,105,200 1,696,927 1,515,345 2,290,908 22,789,102
1992 15,495,419 2,083,652 1,785,371 1,484,752 2,288,218 23,137,412
1993 15,848,119 2,063,124 1,901,505 1,467,567 2,272,407 23,552,722
1994 16,153,871 2,318,614 2,023,754 1,493,963 2,242,324 24,232,526
1995 16,423,872 2,321,048 2,153,119 1,580,900 2,219,244 24,698,183
1996 16,955,023 2,326,954 2,304,416 1,654,256 2,188,025 25,428,674
1997 17,176,486 2,257,829 2,452,254 1,758,627 2,160,954 25,806,150
1998 17,398,440 2,260,757 2,588,081 1,855,348 2,091,845 26,194,4711999 17,575,643 2,210,129 2,725,775 1,936,919 2,067,883 26,516,349
2000 17,902,791 2,184,795 2,860,478 2,057,500 2,086,789 27,092,353
2001 18,338,190 2,149,105 2,986,486 2,132,117 2,006,871 27,612,769
2002 18,925,517 2,112,230 3,154,377 2,242,169 1,995,072 28,429,365
2003 19,710,079 2,059,631 3,341,606 2,375,375 1,997,116 29,483,807
2004 20,590,691 2,039,631 3,518,334 2,546,877 2,004,898 30,700,431
2005 21,467,566 1,987,171 3,684,086 2,763,625 1,981,249 31,883,697
2006 22,074,953 1,968,032 3,872,766 2,947,116 1,958,273 32,821,140
2007 23,122,698 1,878,956 3,989,893 3,096,334 1,989,690 34,077,571
2008 22,614,483 1,797,278 4,049,943 3,146,006 1,948,054 33,555,764
Source: Internal Revenue Service, Statistics of Income, published and unpublished data.

8/4/2019 110922-Tom Barthold-Joint Deficit Cmte Testimony
http://slidepdf.com/reader/full/110922-tom-barthold-joint-deficit-cmte-testimony 53/86
53
Table A-10.− Distribution of C Corporations, 2008
Cumulative Percent
Firms classified by assets
Numberof
Returns
Total Assets
(millions) Returns Total Assets
$0 or less 296,074 0 16.47% 0.00%
$1 to $25,000 363,899 2,668 36.72% 0.00%
$25,001 to $50,000 136,343 4,695 44.31% 0.01%
$50,001 to $100,000 174,776 11,908 54.03% 0.03%
$100,001 to $250,000 253,837 39,698 68.15% 0.08%
$250,001 to $500,000 181,186 64,539 78.24% 0.17%
$500,001 to $1,000,000 139,966 98,766 86.02% 0.30%
$1,000,001 to $10,000,000 193,443 549,528 96.79% 1.05%
$10,000,001 to $50,000,000 29,932 654,387 98.45% 1.94%$50,000,001 to $100,000,000 7,290 519,178 98.86% 2.65%
More than $100,000,000 20,530 71,486,474 100.00% 100.00%
All Assets 1,797,278 73,431,840
Cumulative Percent
Firms classified by receipts
Number
of
Returns
Total
Receipts
(millions) Returns
Total
Receipts
$0 or less 223,061 -15,496 12.41% -0.07%
$1 to $2,500 46,820 49 15.02% -0.07%
$2,501 to $5,000 29,231 113 16.64% -0.07%
$5,001 to $10,000 42,501 317 19.01% -0.07%
$10,001 to $25,000 98,843 1,671 24.51% -0.06%
$25,001 to $50,000 108,038 3,996 30.52% -0.04%
$50,001 to $100,000 154,729 11,337 39.13% 0.01%
$100,001 to $250,000 276,747 45,667 54.53% 0.23%
$250,001 to $500,000 212,272 77,224 66.34% 0.59%
$500,001 to $1,000,000 195,168 141,202 77.20% 1.26%
$1,000,001 to $10,000,000 337,815 1,020,309 95.99% 6.07%
$10,000,001 to $50,000,000 52,541 1,092,809 98.91% 11.22%
More than $50,000,000 19,510 18,843,110 100.00% 100.00%
All Receipts 1,797,278 21,222,309
* Details do not add to totals due to rounding.
Source: JCT calculations on SOI data.

8/4/2019 110922-Tom Barthold-Joint Deficit Cmte Testimony
http://slidepdf.com/reader/full/110922-tom-barthold-joint-deficit-cmte-testimony 54/86
54
Table A-11.− Distribution of S Corporations, 2008
Cumulative Percent
Firms classified by assets
Numberof
Returns
TotalAssets
(millions) Returns Total Assets
$0 or less 722,118 0 17.83% 0.00%
$1 to $25,000 1,002,508 7,857 42.58% 0.23%
$25,001 to $50,000 415,105 14,177 52.83% 0.65%
$50,001 to $100,000 415,052 28,505 63.08% 1.50%
$100,001 to $250,000 568,719 90,348 77.12% 4.18%
$250,001 to $500,000 345,585 122,359 85.66% 7.81%
$500,001 to $1,000,000 239,203 167,535 91.56% 12.79%
$1,000,001 to $10,000,000 301,953 839,356 99.02% 37.72%
$10,000,001 to $50,000,000 32,765 644,961 99.83% 56.87%$50,000,001 to $100,000,000 3,611 250,689 99.92% 64.31%
More than $100,000,000 3,326 1,201,517 100.00% 100.00%
All Assets 4,049,944 3,367,304
Cumulative Percent
Firms classified by receipts
Number
of
Returns
Total
Receipts
(millions) Returns Total Receipts
$0 or less 552,003 -8,165 13.63% -0.14%
$1 to $2,500 96,972 100 16.02% -0.14%
$2,501 to $5,000 54,264 198 17.36% -0.14%
$5,001 to $10,000 80,680 597 19.36% -0.13%
$10,001 to $25,000 219,584 3,750 24.78% -0.07%
$25,001 to $50,000 260,228 9,718 31.20% 0.09%
$50,001 to $100,000 400,774 29,242 41.10% 0.57%
$100,001 to $250,000 707,617 117,275 58.57% 2.51%
$250,001 to $500,000 536,784 191,812 71.83% 5.68%
$500,001 to $1,000,000 467,402 331,675 83.37% 11.17%
$1,000,001 to $10,000,000 585,763 1,637,854 97.83% 38.27%
$10,000,001 to $50,000,000 73,682 1,476,065 99.65% 62.69%
More than $50,000,000 14,192 2,253,935 100.00% 100.00%
All Receipts 4,049,944 6,044,056
* Details do not add to totals due to rounding.
Source: JCT calculations on SOI data.

8/4/2019 110922-Tom Barthold-Joint Deficit Cmte Testimony
http://slidepdf.com/reader/full/110922-tom-barthold-joint-deficit-cmte-testimony 55/86
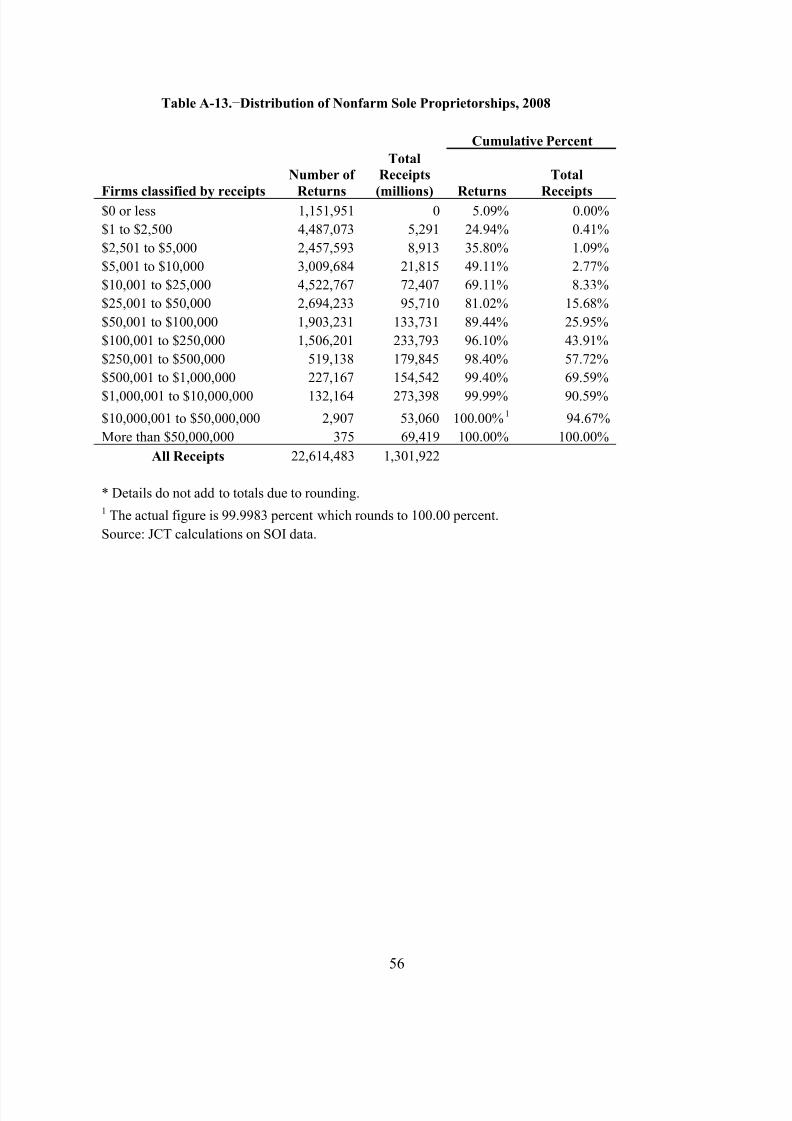
8/4/2019 110922-Tom Barthold-Joint Deficit Cmte Testimony
http://slidepdf.com/reader/full/110922-tom-barthold-joint-deficit-cmte-testimony 56/86
56
Table A-13.−Distribution of Nonfarm Sole Proprietorships, 2008
Cumulative Percent
Firms classified by receipts
Number of
Returns
Total
Receipts
(millions) Returns
Total
Receipts$0 or less 1,151,951 0 5.09% 0.00%
$1 to $2,500 4,487,073 5,291 24.94% 0.41%
$2,501 to $5,000 2,457,593 8,913 35.80% 1.09%
$5,001 to $10,000 3,009,684 21,815 49.11% 2.77%
$10,001 to $25,000 4,522,767 72,407 69.11% 8.33%
$25,001 to $50,000 2,694,233 95,710 81.02% 15.68%
$50,001 to $100,000 1,903,231 133,731 89.44% 25.95%
$100,001 to $250,000 1,506,201 233,793 96.10% 43.91%
$250,001 to $500,000 519,138 179,845 98.40% 57.72%
$500,001 to $1,000,000 227,167 154,542 99.40% 69.59%
$1,000,001 to $10,000,000 132,164 273,398 99.99% 90.59%
$10,000,001 to $50,000,000 2,907 53,060 100.00%1 94.67%
More than $50,000,000 375 69,419 100.00% 100.00%
All Receipts 22,614,483 1,301,922
* Details do not add to totals due to rounding.1 The actual figure is 99.9983 percent which rounds to 100.00 percent.
Source: JCT calculations on SOI data.

8/4/2019 110922-Tom Barthold-Joint Deficit Cmte Testimony
http://slidepdf.com/reader/full/110922-tom-barthold-joint-deficit-cmte-testimony 57/86
57
Table A-14a.−Distribution of Net Income by Gross Receipts and Entity Type, 2008
Net Income (millions of dollars)
Firms classified by receipts
S
Corporations Partnerships
Nonfarm Sole
Proprietorships
$0 or less -12,897 -132,165 -4,479$1 to $2,500 -558 -703 -6,687
$2,501 to $5,000 -392 -280 -417
$5,001 to $10,000 -752 -917 6,311
$10,001 to $25,000 -1,541 -1,791 29,049
$25,001 to $50,000 -1,190 -2,309 33,783
$50,001 to $100,000 1,641 -2,088 43,637
$100,001 to $250,000 9,874 -888 65,726
$250,001 to $500,000 13,076 -67 40,290
$500,001 to $1,000,000 20,007 1,770 27,883
$1,000,001 to $10,000,000 83,359 25,270 26,740
$10,000,001 to $50,000,000 54,503 18,052 2,166
More than $50,000,000 74,896 206,921 505
All Receipts 240,026 110,806 264,508
Table A-14b.−Percent of Firms with a Net Operating Loss
by Gross Receipts and Entity Type, 2008
Firms classified by receipts
S
Corporations Partnerships
Nonfarm Sole
Proprietorships
$0 or less 58 27 83
$1 to $2,500 77 70 40
$2,501 to $5,000 69 56 30
$5,001 to $10,000 58 65 22
$10,001 to $25,000 52 54 15
$25,001 to $50,000 45 49 13
$50,001 to $100,000 34 41 12
$100,001 to $250,000 30 39 12
$250,001 to $500,000 31 37 12
$500,001 to $1,000,000 28 39 12
$1,000,001 to $10,000,000 26 33 18
$10,000,001 to $50,000,000 26 33 34More than $50,000,000 21 28 59
All Receipts 38 34 25
* Details do not add to totals due to rounding.
Source: JCT calculations on SOI data.

8/4/2019 110922-Tom Barthold-Joint Deficit Cmte Testimony
http://slidepdf.com/reader/full/110922-tom-barthold-joint-deficit-cmte-testimony 58/86
58
Table A-15a.−Distribution of Net Income by Gross Receipts of C Corporations, 2008
Firms classified by receipts Net Income (millions of dollars)
$0 or less -72,237$1 to $2,500 -956
$2,501 to $5,000 -483
$5,001 to $10,000 -789
$10,001 to $25,000 -1,577
$25,001 to $50,000 -1,830
$50,001 to $100,000 -2,502
$100,001 to $250,000 -4,500
$250,001 to $500,000 -3,848
$500,001 to $1,000,000 -3,985
$1,000,001 to $10,000,000 -8,585
$10,000,001 to $50,000,000 26,220
More than $50,000,000 819,389
All Receipts 744,316
Table A-15b.−Percent of C Corporations with a Net Operating Loss by
Gross Receipts, 2008
Firms classified by receipts C Corporations
$0 or less 71
$1 to $2,500 67
$2,501 to $5,000 60$5,001 to $10,000 54
$10,001 to $25,000 56
$25,001 to $50,000 52
$50,001 to $100,000 51
$100,001 to $250,000 46
$250,001 to $500,000 46
$500,001 to $1,000,000 42
$1,000,001 to $10,000,000 35
$10,000,001 to $50,000,000 31
More than $50,000,000 32
All Receipts 48
* Details do not add to totals due to rounding.
Source: JCT calculations on SOI data.

8/4/2019 110922-Tom Barthold-Joint Deficit Cmte Testimony
http://slidepdf.com/reader/full/110922-tom-barthold-joint-deficit-cmte-testimony 59/86
59
D. Corporate Income Tax Supplement - General Business Credits
The general business credit is the sum of various business credits determined under theCode. The component credits of the general business credit are listed below.
The general business credit may not reduce a taxpayer’s net income tax below an amountequal to the taxpayer’s tentative minimum tax (or, if greater, 25 percent of so much of thetaxpayer’s regular tax liability as exceeds $25,000). For purposes of applying this rule to certaincredits (the alcohol fuels credit, the low-income housing credit, portions of the renewableelectricity production credit, the employer Social Security credit, the railroad track maintenancecredit, the small employer health insurance credit, the energy credit, the rehabilitation credit, andwork opportunity credit), the tentative minimum tax is treated as being zero.
General business credits determined in a taxable year that exceed the amount allowable inthat year generally may be carried back one year and forward up to 20 years. Credits for small businesses determined in 2010 were allowed a five-year carryback.
Table A-16.−Components of the General Business Credit for 2011*
Provision Description
Rehabilitation credit (sec. 47) Credit for restoring certain pre-1936 buildings and certain historic buildings
Energy credit (sec. 48) Credit for investing in certain solar, geothermal, fuel cell, andother energy property
Advanced coal project credit (sec. 48A) Credit for investing in advanced coal power facilities
Gasification project credit (sec. 48B) Credit for investing in gasification facilities
Advanced energy project credit (sec. 48C) Credit for investing in facilities that manufacture certain renewable power or other advanced energy equipment or products
Work opportunity credit (sec. 51) Credit for hiring employees from certain targeted groups
Alcohol fuels credit (sec. 40) Credit for producing ethanol and other alcohol fuels
Research credit (sec. 41) Credit for conducting research in the United States
Low-income housing credit (sec. 42) Credit for owners of qualified low-income rental housing
Disabled access credit (sec. 44) Credit to offset costs incurred by small businesses to comply withthe Americans With Disabilities Act of 1990
Renewable electricity production credit(sec. 45)
Credit for producing power from wind, biomass, and other renewable resources
Empowerment zone employment credit(sec. 1396)
Credit for employing people in certain designated areas with highlevels of unemployment and poverty
Indian employment credit (sec. 45A) Credit for employing native Americans living and working onIndian reservations

8/4/2019 110922-Tom Barthold-Joint Deficit Cmte Testimony
http://slidepdf.com/reader/full/110922-tom-barthold-joint-deficit-cmte-testimony 60/86
60
Table A-16.−Components of the General Business Credit for 2011*
Provision Description
Employer Social Security credit (sec. 45B) Credit for an employer’s portion of Social Security taxes paid onemployee cash tips in excess of the minimum wage
Orphan drug credit (sec. 45C) Credit for clinical testing of drugs used to treat certain rarediseases or conditions
New markets tax credit (sec. 45D) Credit for investing in community development entities, whichserve low income communities
Small employer pension plan startup costcredit (45E)
Credit for small employers that start qualified pension plans
Employer-provided child care credit(sec. 45F)
Credit for building or running an employer-provided child carefacility
Railroad track maintenance credit (sec.45G) Credit for railroad track maintenance expenses
Biodiesel fuels credit (sec. 40A) Credit for producing biodiesel
Distilled spirits credit (sec. 5011) Credit to wholesalers, distillers, and importers of distilled spiritsthat approximates the interest cost resulting from the earlyimposition of certain excise taxes
Advanced nuclear power production credit(sec. 45J)
Credit for producing nuclear power at advanced nuclear power facilities
New energy efficient homes credit (sec. 45L) Credit for building energy efficient homes
Energy efficient appliance credit (sec. 45M) Credit for manufacturing energy efficient appliances
Alternative fuel refueling property credit(sec. 30C)
Credit for installing certain biofuel, electric, and alternative fuelrefueling property
Mine rescue team training credit (sec. 45N) Credit for training mine rescue team employees
Agricultural chemicals security credit(sec. 45O)
Credit for conducting backgrounds checks, installing securitydevices, and taking other measures to safeguard certain fertilizersand pesticides used on farms
Differential wage payment credit (sec. 45P) Credit for small employers who supplement the military pay of their employees called to active duty
Carbon dioxide sequestration credit(sec. 45Q)
Credit for sequestering industrial source carbon dioxide
Alternative motor vehicle credit (sec. 30B) Credit for fuel cell vehicles and hybrid vehicle conversions
Plug-in electric drive motor vehicle credit(secs. 30 and 30D)
Credit for plug-in electric drive motor vehicles
Small employer health insurance credit(sec. 45R)
Credit for small employers who provide health insurance to their employees
* Excludes expired and phased-out credits.

8/4/2019 110922-Tom Barthold-Joint Deficit Cmte Testimony
http://slidepdf.com/reader/full/110922-tom-barthold-joint-deficit-cmte-testimony 61/86
61
E. New Tax Expenditures since the Tax Reform Act of 1986
The Tax Reform Act of 198680
“represents one of the most comprehensive revisions of the Federal income tax system since its inception.”81 Among other considerations, Congress wasconcerned that erosion of the tax base required tax rates to be higher than otherwise would benecessary. With the elimination of various tax expenditures and other preferences and theenactment of other base-broadening provisions, the Act sharply reduced individual income taxrates. The Act retained some of the tax expenditures most widely utilized by individuals and business tax expenditures believed to be beneficial to the economy.
Numerous changes to the Code have been enacted in subsequent tax legislation. Theinformation that follows provides a list of the new tax expenditures contained in legislation sincethe passage of the Tax Reform Act of 1986.82 Modifications and extensions of pre-existing taxexpenditures are not listed. Items are grouped by the legislation by which they were created.Items that have since expired are shown in italics.
Technical and Miscellaneous Revenue Act of 1988, enacted on November 10, 1988 (Pub.L. No. 100-647).
• Exclusion of income from United States savings bonds used to pay higher educationtuition and fees
Omnibus Budget Reconciliation Act of 1990, enacted on November 5, 1990 (Pub. L. No.101-508).
• Enhanced oil recovery credit
• Credit for small producers of ethanol
• Credit for cost of providing access for disabled individuals
• Credit for health insurance costs for coverage of children
• Reduced rate of tax on capital gains (effective with increase in individual income taxrates)
80 Pub. L. No. 99-514.
81 Joint Committee on Taxation, General Explanation of the Tax Reform Act of 1986 (JCS-10-87), May 4,1987, p. 6.
82 This list may not be exhaustive. Differences in the methodology for (1) identifying tax expenditures(including negative tax expenditures) generally, (2) determining what constitutes a new provision versus amodification or extension of an existing provision, and (3) determining whether a provision is de minimis may yielda different list of provisions.

8/4/2019 110922-Tom Barthold-Joint Deficit Cmte Testimony
http://slidepdf.com/reader/full/110922-tom-barthold-joint-deficit-cmte-testimony 62/86
62
Omnibus Budget Reconciliation Act of 1993, enacted on August 10, 1993 (Pub. L. No.103-66).
• Exclusion for gain from certain small business stock
• Rollover of gain from sale of publicly traded securities into specialized small business
investment companies
• Tax incentives for businesses in empowerment zones, enterprise communities, and
rural development investment areas
• Accelerated depreciation for property on Indian reservations
• Indian employment credit
• Modification of passive loss rules for certain real estate professionals
• Modification of unrelated business taxable income rules relating to real estate
• Exclusion of income from discharge of indebtedness incurred in connection with
qualified real property
• Credit for portion of employer paid FICA taxes on tips
Small Business Job Protection Act of 1996, enacted on August 20, 1996 (Pub. L. No.104-188).
• Deferral of gain on involuntary conversions resulting from Presidentially-declareddisasters
• Exclusion of contributions in aid of construction for water and sewer utilities
• Adoption tax credit
• Exclusion of employer adoption assistance programs
• Deferral of tax on earnings of qualified State tuition programs
• Tax-free transfer of assets from common trust funds to mutual funds
Health Insurance Portability and Accountability Act of 1996, enacted on August 21, 1996(Pub. L. No. 104-191).
• Medical savings accounts
Taxpayer Relief Act of 1997, enacted on August 5, 1997 (Pub. L. No. 105-34),
• Tax credit for taxpayers with qualifying children under the age of 17
• HOPE and Lifetime Learning credits for tuition for post-secondary education
• Exclusion of earnings of trust or custodial accounts for paying higher educationexpenses
• Deduction for interest on qualified higher education loans
8/4/2019 110922-Tom Barthold-Joint Deficit Cmte Testimony
http://slidepdf.com/reader/full/110922-tom-barthold-joint-deficit-cmte-testimony 63/86
63
• Credit for holders of qualified zone academy bonds
• Tax incentives for D.C. Enterprise Zones
• D.C. first-time homebuyer tax credit
• Welfare-to-work tax credit
• Income averaging for farmers
• Expensing of environmental remediation expenditures
• Tax refund to Amtrak based on the carryback of its net operating losses against the
tax attributes of its predecessor railroads
• Exclusion for certain disaster mitigation payments
• Exclusion of survivor annuities paid to families of public safety officers killed in theline of duty
Tax and Trade Relief Extension Act of 1998, as part of the Omnibus Consolidated andEmergency Supplemental Appropriations Act, 1999 (Pub. L. No. 105-277).
• Special five-year carryback period for net operating losses attributable to farming
FSC Repeal and Extraterritorial Income Exclusion Act of 2000, enacted on November 15,2000 (Pub. L. No. 106-519).
• Extraterritorial income exclusion
Community Renewal Tax Relief Act of 2000, incorporated by reference in theConsolidated Appropriations Act, 2001, enacted on December 2, 2000 (Pub. L. No. 106-554).
• Renewal community tax incentives
• New markets tax credit
Economic Growth and Tax Relief Reconciliation Act of 2001, enacted on June 7, 2001(Pub. L. No. 107-16).
• Deduction for qualified higher education expenses
• Tax credit for employers who provide child care for employees
• Exclusion for certain restitution payments made to individuals who were persecuted
for racial or religious reasons by Nazi Germany or other Axis regimes
• Credit for certain individuals for elective deferrals and IRA contributions
• Nonrefundable credit for administrative and retirement-education expenses for new pension plans adopted by small businesses
• Treatment of electing Alaska Native Settlement Trusts

8/4/2019 110922-Tom Barthold-Joint Deficit Cmte Testimony
http://slidepdf.com/reader/full/110922-tom-barthold-joint-deficit-cmte-testimony 64/86
64
Job Creation and Worker Assistance Act of 2002, enacted on March 9, 2002 (Pub. L. No.107-147).
• Additional first-year depreciation deduction for qualified property to which thegeneral rules of MACRS apply
• Above the line deduction for teacher classroom expenses
• Additional first-year depreciation deduction for qualified New York Liberty Zone property
• Authority to issue $8 billion of tax-exempt private activity bonds to finance theconstruction and rehabilitation of nonresidential real property and residential rentalreal property in the New York Liberty Zone
• Authority for one additional advance refunding for certain bonds for facilities locatedin New York City
• A five-year recovery period was provided for qualified New York Liberty Zone
leasehold improvement property
Trade Act of 2002, enacted on August 6, 2002 (Pub. L. No. 107-210).
• Tax credit for the purchase of health insurance coverage by certain taxpayers
Jobs and Growth Tax Relief Reconciliation Act of 2003, enacted on May 28, 2003 (Pub.L. No. 108-27).
• Reduced rates of tax on qualified dividends
Military Family Tax Relief Act of 2003, enacted on November 11, 2003 (Pub. L. No.108-121).
• Exclusion for amounts received under Department of Defense HomeownersAssistance Program
• Deduction for overnight travel expenses of National Guard and Reserve members
Medicare Prescription Drug, Improvement, and Modernization Act of 2003, enacted onDecember 8, 2003 (Pub. L. No. 108-173).
• Exclusion of untaxed Medicare benefits: Prescription drug insurance (Part D)
• Exclusion of subsidies to employers who maintain prescription drug plans for Medicare retirees
• Health savings accounts
American Jobs Creation Act of 2004, enacted on October 22, 2004 (Pub. L. No. 108-357).
• Production activity deduction

8/4/2019 110922-Tom Barthold-Joint Deficit Cmte Testimony
http://slidepdf.com/reader/full/110922-tom-barthold-joint-deficit-cmte-testimony 65/86
65
• Deduction of film and television production costs
• Tax credit for expenditures for maintaining railroad tracks
• Elective “tonnage tax” in lieu of corporate income tax on taxable income from certainshipping activities
• Tax credit for biodiesel blenders
• Charitable deduction for certain expenses incurred in carrying out sanctioned whalingactivities
• Incentives for small refiners to comply with EPA sulfur regulations
• Exclusion of interest on State and local government bonds for qualified green building and sustainable design projects
• Deferral of gain from the disposition of electric transmission property to implementFederal Energy Regulatory Commission restructuring policy
H.R. 241, enacted on January 7, 2005 (Pub. L. No. 109-1).
• Accelerated deduction for cash contributions for Indian Ocean tsunami victims
The Safe, Accountable, Flexible, Efficient Transportation Equity Act: A Legacy for Users, enacted on August 10, 2005 (Pub. L. No. 109-59).
• Tax credit for the cost of carrying tax-paid distilled spirits in wholesale inventories
• Exclusion of interest on State and local government qualified private activity bondsfor highway projects and rail-truck transfer facilities
Energy Tax Incentives Act of 2005, enacted on August 8, 2005 (Pub. L. No. 109-58).
• Tax credit for the holders of clean renewable energy bonds
• Tax credit for the production of electricity from qualifying advanced nuclear power facilities
• Tax credits for investments in clean coal power generation facilities
• Temporary election for refiners to expense up to 50 percent of the cost of qualified property used in the refining of liquid fuels
• Two-year amortization for certain geological and geophysical costs incurred in
connection with oil and gas exploration
• Deduction for expenditures on qualified energy-efficient commercial building property
• Tax credit for the purchase of qualified energy efficiency improvements to existinghomes
• Tax credit for the production of certain energy-efficient appliances

8/4/2019 110922-Tom Barthold-Joint Deficit Cmte Testimony
http://slidepdf.com/reader/full/110922-tom-barthold-joint-deficit-cmte-testimony 66/86
66
• Tax credit for the purchase of qualified photovoltaic property and qualified solar water heating property used exclusively for purposes other than heating swimming pools and hot tubs
• Tax credit for eligible contractors for the construction of qualified energy-efficienthomes
• Tax credits for alternative technology vehicles
• Tax credit for the cost of installing clean-fuel vehicle refueling property
• Temporary five-year carryback period for a portion of the net operating losses of certain electric utility companies
• Tax credits for biodiesel fuels
The Katrina Emergency Tax Relief Act of 2005, enacted on September 23, 2005 (Pub. L. No. 109-73).
• Tax credit for employee retention for employers affected by Hurricanes Katrina, Rita,and Wilma
• Additional personal exemption for taxpayers who provide 60 days or more of freehousing in their personal residence to individuals displaced by Hurricane Katrina
• Exclusion for the income from certain discharges of nonbusiness debt owed byindividuals harmed by Hurricane Katrina
The Gulf Opportunity Zone Act of 2005, enacted on December 21, 2005 (Pub. L. No.109-135).
• Additional first-year depreciation deduction for qualified Gulf Opportunity Zone property
• Partial expensing for Gulf Opportunity Zone clean-up costs
• Ten-year carryback period for casualty losses of Gulf Opportunity Zone public utility property by reason of Hurricane Katrina
• Five-year carryback period for net operating losses attributable to expenses
• Tax credit for the holders of Gulf Tax Credit Bonds
• Five-year carryback period for casualty losses of public utility property attributable toHurricane Katrina
• Tax credit for Gulf Opportunity Zone employers providing in-kind lodging for employees and income exclusion for the employees
Tax Increase Prevention and Reconciliation Act of 2005, enacted on May 17, 2006 (Pub.L. No. 109-222).
• Exclusion for earnings of certain environmental settlement funds

8/4/2019 110922-Tom Barthold-Joint Deficit Cmte Testimony
http://slidepdf.com/reader/full/110922-tom-barthold-joint-deficit-cmte-testimony 67/86
67
• Reduced rates of tax for gains from the sale or exchange of self-created musicalworks
• Elective five-year amortization of expenses paid or incurred for the creation or acquisition of musical compositions
The Tax Relief and Health Care Act of 2006, enacted on December 20, 2006 (Pub. L. No.109-432).
• Tax credit for corporate income earned in American Samoa
• Special depreciation allowance for cellulosic biomass ethanol plant property
• Partial expensing for investments in advanced mine safety equipment
• Credit for costs incurred in training qualified mine rescue team employees
• Deduction for premiums paid or accrued for qualified mortgage insurance
• 25-percent exclusion from gross income for capital gains from the conservation saleof a qualifying mineral or geothermal interest located on eligible Federal land
Hokie Spirit Memorial Fund, enacted December 19, 2007 (Pub. L. No. 110-141).
• Exclusion of amounts received from the Hokie Spirit Memorial Fund, established bythe Virginia Tech Foundation
Mortgage Forgiveness Debt Relief Act of 2007, enacted December 20, 2007 (Pub. L. No.110-142).
• Exclusion of indebtedness income arising from discharge of qualified principal
residence indebtedness
• Exclusion of benefits provided to volunteer firefighters and emergency medicalresponders
Economic Stimulus Act of 2008, enacted February 13, 2008 (Pub. L. No. 110-185)
• Recovery rebates for individual taxpayers
• Additional first year depreciation deduction for qualified property
Food, Conservation, and Energy Act of 2008, enacted May 22, 2008 (Pub. L. No. 110-
234 and 110-246).
• Exclusion of Conservation Reserve Program payments from SECA tax for individualsreceiving Social Security retirement or disability payments
• Deduction for endangered species recovery expenditures
• Credit for cellulosic biofuel
• Tax credit bonds for qualified forestry conservation projects

8/4/2019 110922-Tom Barthold-Joint Deficit Cmte Testimony
http://slidepdf.com/reader/full/110922-tom-barthold-joint-deficit-cmte-testimony 68/86
68
• Agricultural chemicals security tax credit
Heroes Earnings Assistance and Relief Tax Act of 2008, enacted June 17, 2008 (Pub. L. No. 110-245).
• Employer wage credit for activated military reservists
• Exclusion of certain State and local payments to military personnel
Housing and Economic Recovery Act of 2008, enacted July 30, 2008 (Pub. L. No. 110-289).
• First time homebuyer credit
• Additional standard deduction for State and local real property taxes
• Bonds guaranteed by Federal Home Loan Banks eligible for treatment as tax-exempt bonds
Emergency Economic Stabilization Act of 2008, Energy Improvement and Extension Actof 2008, and Tax Extenders and Alternative Minimum Tax Relief Act of 2008, enacted October 3, 2008 (Pub. L. No. 110-343).
• New clean renewable energy bonds
• Credit for carbon dioxide sequestration
• Alternative motor vehicle credit and plug in electric vehicle credit
• Qualified energy conservation bonds
• Accelerated recovery period for depreciation of smart meters and smart grid system
• Special depreciation allowance for certain reuse and recycling property
• Treatment of amounts received in connection with the Exxon Valdez litigation.
• Tax exempt bond financing for the Midwestern Disaster Area
• Expensing for certain demolition and clean up costs
• Tax credit bonds
• Additional personal exemption for housing displaced individuals in the MidwesternDisaster area
• Mileage reimbursements to charitable volunteers excluded from gross income
• Exclusions for certain cancellations of indebtedness by reason of Midwesterndisasters
• Expensing of qualified disaster expenses
• Special depreciation allowance for qualified disaster property
• Increased expensing for qualified disaster assistance property

8/4/2019 110922-Tom Barthold-Joint Deficit Cmte Testimony
http://slidepdf.com/reader/full/110922-tom-barthold-joint-deficit-cmte-testimony 69/86
69
The American Recovery and Reinvestment Act of 2009, enacted on February 17, 2009(Pub. L. No. 111-5).
• Making work pay credit
• Exclusion from gross income for up to $2,400 of unemployment compensation
• Deduction for any State or local sales or excise tax imposed on the purchase of a newcar, light truck, motorcycle, or motor home
• Election to receive an investment credit in lieu of a renewable electricity productioncredit
• Credit for alternative motor vehicles
• Deferral of income arising from business indebtedness discharged by thereacquisition of a debt instrument
• Credit for investment in advanced energy property
• Issuance of recovery zone economic development bonds and recovery zone facility bonds
• Tribal economic development bonds
• Suspension of classification of tax-exempt interest on certain bonds as a tax preference for AMT purposes
• Qualified school construction bonds
• Build America bonds
• Credit against income taxes owed for tax year 2009 for individuals who receive agovernment pension or annuity from work not covered by social security
• Premium subsidy for COBRA continuation coverage for unemployed workers andtheir families
Hiring Incentives to Restore Employment Act, enacted on March 18, 2010 (Pub. L. No.111-147).
• Credit for retention of certain newly hired workers
Patient Protection and Affordable Care Act, enacted March 23, 2010 (Pub. L. No. 111-148), in combination with the Health Care and Education Reconciliation Act of 2010, enactedMarch 30, 2010 (Pub. L. No. 111-152).
• Credits and subsidies for participation in exchanges
• Tax credit for small businesses purchasing employer insurance
• Annual fees imposed on any covered entity engaged in the business of providinghealth insurance with respect to United States health risks are not deductible asordinary and necessary business expenses

8/4/2019 110922-Tom Barthold-Joint Deficit Cmte Testimony
http://slidepdf.com/reader/full/110922-tom-barthold-joint-deficit-cmte-testimony 70/86
70
• Limits on deductible compensation for insurance companies
• Exclusion of Indian health care benefits
• Therapeutic research credit
• Surtax on unearned income
The Small Business Jobs Act of 2010, enacted on September 27, 2010 (Pub. L. No. 111-240).
• Extended carryback period for eligible small business credits from one year to fiveyears

8/4/2019 110922-Tom Barthold-Joint Deficit Cmte Testimony
http://slidepdf.com/reader/full/110922-tom-barthold-joint-deficit-cmte-testimony 71/86
71
F. Historical Trends in the Largest Tax Expenditures, Individual and Corporate
Individual Tax Expenditures
The tables below illustrate in five-year segments the top ten largest tax expenditures for
individuals since 1975.
Table A-17.−Largest Tax Expenditures, Individual 1975-1979
Tax Expenditure
Total Amount
(1975-1979)
(Billions of dollars)
Exclusion of capital gains at death 37.6
Deduction for nonbusiness State and local taxes (other than State and
local property taxes on owner-occupied homes)
37.3
Net exclusion of pension contributions and earnings: employer plans 32.4
Capital gain (other than farming and timber) 32.0
Deduction for mortgage interest on owner-occupied homes 25.7
Exclusion of employer contributions to medical insurance premiumsand medical care
21.2
Deduction for State and local property taxes on owner-occupied homes 21.0
Exclusion of untaxed social security and railroad retirement benefits 17.7
Deduction for charitable contributions, other than for education and health 16.9
Exclusion of unemployment insurance benefits 13.6

8/4/2019 110922-Tom Barthold-Joint Deficit Cmte Testimony
http://slidepdf.com/reader/full/110922-tom-barthold-joint-deficit-cmte-testimony 72/86
72
Table A-18.−Largest Tax Expenditures, Individual 1980-1984
Tax Expenditure
Total Amount
(1980-1984)
(Billions of dollars)
Deduction for nonbusiness State and local taxes (other than State andlocal property taxes on owner-occupied homes)
104.9
Exclusion of employer contributions to medical insurance premiums andmedical care
91.5
Deduction for mortgage interest on owner-occupied homes 89.5
Net exclusion of pension contributions and earnings: employer plans 85.5
Capital gains (other than farming and timber) 80.4
Deduction for State and local property taxes on owner-occupied homes 53.2
Exclusion of untaxed social security and railroad retirement benefits 53.1
Deduction for charitable contributions, other than for education andhealth
39.4
Deduction for medical expenses 23.2
Exclusion of interest on life insurance savings 23.0

8/4/2019 110922-Tom Barthold-Joint Deficit Cmte Testimony
http://slidepdf.com/reader/full/110922-tom-barthold-joint-deficit-cmte-testimony 73/86
73
Table A-19.−Largest Tax Expenditures, Individual 1985-1989
Tax Expenditure
Total Amount
(1985-1989)
(Billions of dollars)
Net exclusion of pension contributions and earnings: employer plans 334.6
Deduction for nonbusiness State and local taxes (other than State and local property taxes on owner-occupied homes)
143.5
Exclusion of employer contributions to medical insurance premiums andmedical care
133.4
Capital gains, other than agricultural, timber, iron ore and coal 111.0
Deduction for mortgage interest on owner-occupied homes 75.6
Exclusion of untaxed social security and railroad retirement benefits 71.6
Deduction for charitable contributions, other than for education and health 62.4
Deduction for State and local property tax on owner-occupied homes 61.7
Individual retirement plans 59.3
Deduction for nonmortgage interest in excess of investment income 41.1

8/4/2019 110922-Tom Barthold-Joint Deficit Cmte Testimony
http://slidepdf.com/reader/full/110922-tom-barthold-joint-deficit-cmte-testimony 74/86
74
Table A-20.−Largest Tax Expenditures, Individual 1990-1994
Tax Expenditure
Total Amount
(1990-1994)
(Billions of
dollars)
Net exclusion of pension contributions and earnings: employer plans 272.9
Exclusions of contributions by employers for medical insurance premiums andmedical care
205.5
Deduction for mortgage interest on owner-occupied homes 133.5
Exclusion of untaxed social security and railroad retirement benefits 127.2
Deduction of nonbusiness State and local government income and personal property taxes (other than State and local property taxes on owner-occupiedhomes)
109.4
Deferral of capital gains on sales of principal residences 57.4
Deduction for charitable contributions, other than for education and health 55.8
Exclusion of interest on general purpose State and local government debts 54.1
Individual retirement plans 52.5
Deduction for State and local property tax on owner-occupied homes 43.5

8/4/2019 110922-Tom Barthold-Joint Deficit Cmte Testimony
http://slidepdf.com/reader/full/110922-tom-barthold-joint-deficit-cmte-testimony 75/86
75
Table A-21.−Largest Tax Expenditures, Individual 1995-1999
Tax Expenditure
Total Amount
(1995-1999)
(Billions of dollars)
Net exclusion of pension contributions and earnings: employer plans 391.6
Deduction for mortgage interest on owner-occupied homes 302.1
Exclusion of employer contributions for medical insurance premiums andmedical care
269.7
Deduction of nonbusiness State and local government income and personal property taxes (other than State and local property taxes on owner-occupiedhomes)
139.0
Exclusion of untaxed social security and railroad retirement benefits 125.5
Deferral of capital gains on sales of principal residences 79.4
Exclusion of capital gains at death 77.5
Deduction for charitable contributions, other than for education and health 77.0
Deduction for State and local property tax on owner-occupied homes 76.8
Exclusion on investment income on life insurance and annuity contracts 61.8

8/4/2019 110922-Tom Barthold-Joint Deficit Cmte Testimony
http://slidepdf.com/reader/full/110922-tom-barthold-joint-deficit-cmte-testimony 76/86
76
Table A-22.−Largest Tax Expenditures, Individual 2000-2004
Tax Expenditure
Total Amount
(2000-2004)
(Billions of dollars)
Net exclusion of pension contributions and earnings: employer plans 416.0
Exclusion of employer contributions for health care, health insurance premiums, and long-term care insurance premiums
324.1
Deduction for mortgage interest on owner-occupied homes 301.4
Reduced rates of tax on long-term capital gains 194.6
Deduction of nonbusiness State and local government income and personal property taxes (other than State and local property taxes on owner-occupiedhomes)
190.0
Exclusion of capital gains at death 136.1
Exclusion of untaxed social security and railroad retirement benefits 131.9
Deduction of charitable contributions, other than for education and health 124.3
Exclusion of investment income on life insurance and annuity contracts 121.8
Deduction for State and local property taxes on owner-occupied residences 101.3

8/4/2019 110922-Tom Barthold-Joint Deficit Cmte Testimony
http://slidepdf.com/reader/full/110922-tom-barthold-joint-deficit-cmte-testimony 77/86
77
Table A-23.−Largest Tax Expenditures, Individual 2005-2009
Tax Expenditure
Total Amount
(2005-2009)(Billions of dollars)
Net exclusion of pension contributions and earnings: employer plans 567.8
Exclusion of employer contributions for health care, health insurance premiums, and long-term care insurance premiums
493.7
Deduction for mortgage interest on owner-occupied homes 434.2
Reduced rates of tax on dividends and long-term capital gains 356.8
Tax credit for children under age 17 231.7
Exclusions of capital gains at death 215.6
Earned income credit 195.1
Deduction of nonbusiness State and local government income, sales and personal property taxes
185.8
Deductions for charitable contributions, other than for education and health 159.2
Exclusion of benefits provided under cafeteria plans 134.4

8/4/2019 110922-Tom Barthold-Joint Deficit Cmte Testimony
http://slidepdf.com/reader/full/110922-tom-barthold-joint-deficit-cmte-testimony 78/86
78
Table A-24.−Largest Tax Expenditures, Individual 2010-2014
Tax Expenditure
Total Amount
(2010-2014)
(Billions of dollars)
Exclusion of employer contributions for health care, health insurance premiums, and long-term care insurance premiums
659.4
Deduction for mortgage interest on owner-occupied homes 484.1
Reduced rates of tax on dividends and long-term capital gains 402.9
Net exclusion of pension contributions and earnings: Defined benefit plans 303.2
Earned income credit 268.8
Deduction of nonbusiness State and local government income, sales and personal property taxes
237.3
Net exclusion of pension contributions and earnings: Defined contribution plans
212.2
Exclusions of capital gains at death 194.0
Deductions for charitable contributions, other than for education and health 182.4
Exclusion of untaxed social security and railroad retirement benefits 173.0

8/4/2019 110922-Tom Barthold-Joint Deficit Cmte Testimony
http://slidepdf.com/reader/full/110922-tom-barthold-joint-deficit-cmte-testimony 79/86
79
Corporate Tax Expenditures
The tables below illustrate in five-year segments the top ten largest corporate taxexpenditures since 1975.
Table A-25.−
Largest Tax Expenditures, Corporate 1975-1979
Tax Expenditure Total Amount
(1975-1979)
(Billions of dollars)
Investment Credit 29.0
Corporate surtax exemption 22.0
Exclusion of interest on general purpose State and local debt 15.7
Asset depreciation range 8.2
Deferral of income of domestic international sales corporations 6.8
Excess of percentage over cost depletion 6.2
Expensing of construction period interest and taxes 5.3
Capital gain: corporate (other than farming and timber) 4.5
Financial institutions: excess bad debt reserves 3.6
Expensing of research and development expenditures 3.5

8/4/2019 110922-Tom Barthold-Joint Deficit Cmte Testimony
http://slidepdf.com/reader/full/110922-tom-barthold-joint-deficit-cmte-testimony 80/86
80
Table A-26.−Largest Tax Expenditures, Corporate 1980-1984
Tax Expenditure Total Amount
(1980-1984)
(Billions of dollars)
Investment Credit, other than for TRASOPs and for rehabilitatedstructures
89.4
Reduced rates on first $100,000 of corporate taxable income 41.6
Exclusion of interest on general purpose State and local debt 21.9
Asset depreciation range 18.9
Exclusion of interest on State and local housing bonds 12.0
Expensing of research and development expenditures 11.3
Expensing of exploration and development costs 9.6
Deferral of income of domestic international sales corporations 8.0
Excess of percentage over cost depletion 7.5
Excess bad debt reserves of financial institutions 5.2
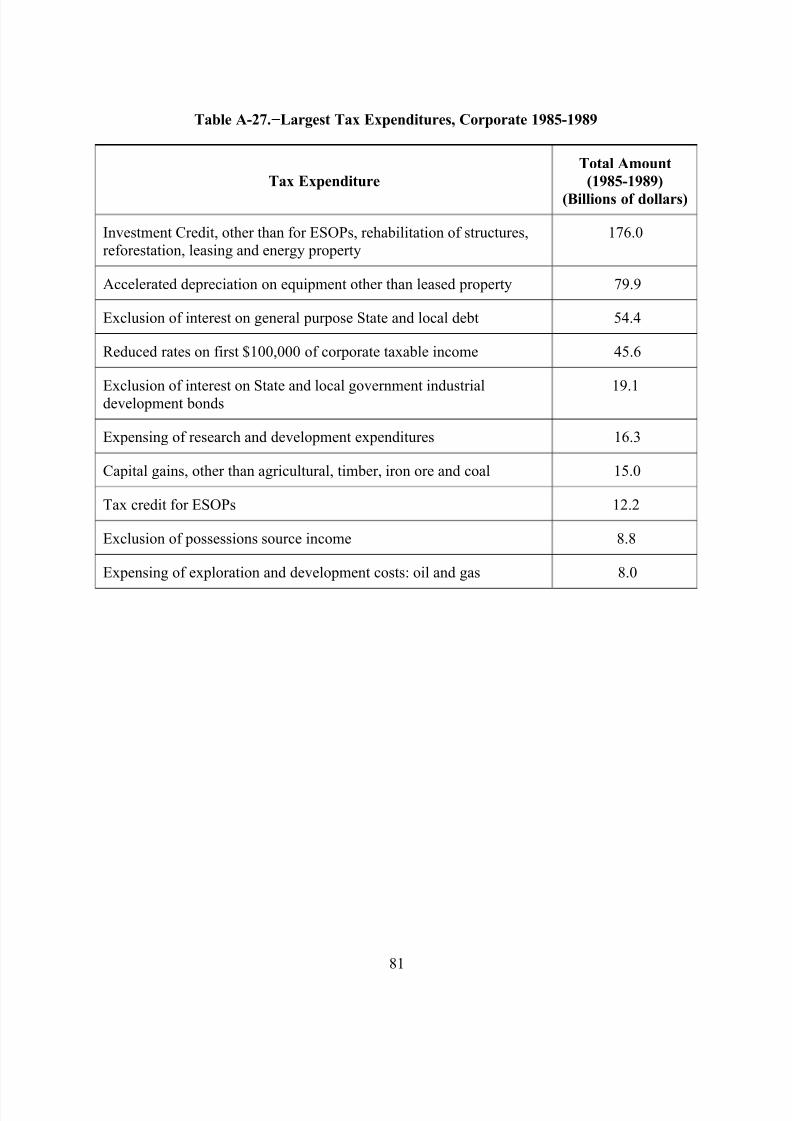
8/4/2019 110922-Tom Barthold-Joint Deficit Cmte Testimony
http://slidepdf.com/reader/full/110922-tom-barthold-joint-deficit-cmte-testimony 81/86
81
Table A-27.−Largest Tax Expenditures, Corporate 1985-1989
Tax Expenditure Total Amount
(1985-1989)
(Billions of dollars)
Investment Credit, other than for ESOPs, rehabilitation of structures,reforestation, leasing and energy property
176.0
Accelerated depreciation on equipment other than leased property 79.9
Exclusion of interest on general purpose State and local debt 54.4
Reduced rates on first $100,000 of corporate taxable income 45.6
Exclusion of interest on State and local government industrialdevelopment bonds 19.1
Expensing of research and development expenditures 16.3
Capital gains, other than agricultural, timber, iron ore and coal 15.0
Tax credit for ESOPs 12.2
Exclusion of possessions source income 8.8
Expensing of exploration and development costs: oil and gas 8.0

8/4/2019 110922-Tom Barthold-Joint Deficit Cmte Testimony
http://slidepdf.com/reader/full/110922-tom-barthold-joint-deficit-cmte-testimony 82/86
82
Table A-28.−Largest Tax Expenditures, Corporate 1990-1994
Tax Expenditure Total Amount
(1990-1994)
(Billions of dollars)
Depreciation of equipment in excess of alternative depreciation system 70.9
Reduced rates on first $75,000 of corporate taxable income 28.6
Inventory property sales source rule exception 15.9
Merger rules for banks and thrift institutions 11.7
Exclusion and tax credit for corporations with possessions source
income
11.5
Deduction of unpaid loss reserves for property and casualty insurancecompanies
8.2
Expensing of research and development expenditures 8.1
Investment credit other than ESOPs, rehabilitation of structures,reforestation and energy property
7.1
Exclusion of interest on general purpose State and local governmentdebt
6.6
Exclusion of income of foreign sales corporations 4.3

8/4/2019 110922-Tom Barthold-Joint Deficit Cmte Testimony
http://slidepdf.com/reader/full/110922-tom-barthold-joint-deficit-cmte-testimony 83/86
83
Table A-29.−Largest Tax Expenditures, Corporate 1995-1999
Tax Expenditure Total Amount
(1995-1999)
(Billions of dollars)
Depreciation of equipment in excess of alternative depreciation system 97.7
Reduced rates for first $10,000,000 of corporate taxable income 21.7
Tax credit for section 936 income 19.7
Inventory property sales source rule exception 18.3
Exclusion of interest on general purpose State and local government
debt
17.5
Depreciation on buildings other than rental housing in excess of alternative depreciation system
13.0
Special treatment of life insurance company reserves 12.5
Deduction of unpaid property loss reserves for property and casualtyinsurance companies
9.7
Exclusion of income of foreign sales corporations 7.5
Deferral of income of controlled foreign corporations 5.7

8/4/2019 110922-Tom Barthold-Joint Deficit Cmte Testimony
http://slidepdf.com/reader/full/110922-tom-barthold-joint-deficit-cmte-testimony 84/86
84
Table A-30.−Largest Tax Expenditures, Corporate, 2000-2004
Tax Expenditure
Total Amount
(2000-2004)
(Billions of dollars)
Depreciation of equipment in excess of alternative depreciation system 119.0
Exclusion of interest on public purpose State and local governmentdebt
27.2
Reduced rates for first $10,000,000 of corporate taxable income 22.0
Inventory property sales source rule exception 22.0
Deferral of active income of controlled foreign corporations 19.8
Tax credit for Puerto Rico and possession income, and Puerto Ricoeconomic activity
17.6
Tax credit for qualified research expenditures 17.3
Exclusion of income of foreign sales corporations 15.6
Expensing of research and experimental expenditures 14.9
Deduction for unpaid property loss reserves for property and casualty
insurance companies
14.7

8/4/2019 110922-Tom Barthold-Joint Deficit Cmte Testimony
http://slidepdf.com/reader/full/110922-tom-barthold-joint-deficit-cmte-testimony 85/86
85
Table A-31.−Largest Tax Expenditures, Corporate 2005-2009
Tax Expenditure Total Amount
(2005-2009)
(Billions of dollars)
Depreciation of equipment in excess of alternative depreciation system 71.3
Exclusion of interest on public purpose State and local governmentdebt
38.3
Inventory property sales source rule exception 30.9
Expensing of research and experimental expenditures 28.5
Deferral of active income of controlled foreign corporations 25.8
Reduced rates for first $10,000,000 of corporate taxable income 23.7
Deduction for income attributable to domestic production activities 19.8
Tax credit for low-income housing 17.5
Exclusion of investment income on life insurance and annuity contracts 12.8
Tax credit for qualified research expenditures 10.7

8/4/2019 110922-Tom Barthold-Joint Deficit Cmte Testimony
http://slidepdf.com/reader/full/110922-tom-barthold-joint-deficit-cmte-testimony 86/86
Table A-32.−Largest Tax Expenditures, Corporate 2010-2014
Tax Expenditure
Total Amount
(2010-2014)(Billions of dollars)
Deferral of active income of controlled foreign corporations 70.6
Exclusion of interest on public purpose State and local governmentdebt
45.3
Deduction for income attributable to domestic production activities 43.2
Inventory property sales source rule exception 38.0
Depreciation of equipment in excess of alternative depreciation system 37.1
Inclusion of income arising from business indebtedness discharged bythe reacquisition of a debt instrument
28.8
Tax credit for low-income housing 27.0
Expensing of research and experimental expenditures 25.6
Inventory methods and valuation: Last in first out 20.0
Reduced rates for first $10,000,000 of corporate taxable income 15.9