Embed Size (px)
Citation preview

WOOL472/572 Wool Biology and Metrology 11 - 1 ©2009 The Australian Wool Education Trust licensee for educational activities University of New England
11. Wool Colour Measurement
Errol Wood
Learning objectives On completion of this topic you should be able to:
• Describe how the human visual system works • Explain the terms colour matching functions, illuminant spectral energy function and the
spectral reflectance function and describe how they are used to calculate the tristimulus values
• Explain the terms lightness, hue and saturation and how they describe a three-dimensional colour space
• Describe the colour space for the CIELAB system in terms of the opponent colours • Explain the operating principles of a modern colour spectrophotometer, defining the key
parts of the instrument • Compare two instrument geometries mostly used for colour measurement • Explain the importance of colour measurement for wool and why there is a wide variation in
wool colour • Explain the specific requirements in wool colour measurement regarding sample
preparation, its presentation to the instrument and the calibration procedure • Interpret tristimulus results in the new D25/10o colour space • Differentiate between the base colour and as-is colour of wool
Key terms and concepts Light receptors, visible spectrum, colour matching functions, standard observer, hue, saturation (chroma), lightness (value), opponent colour space, illuminant spectral energy, spectral reflectance, tristimulus values, chromaticity diagram, CIELAB system, filter colorimeter, spectrophotometer, instrument geometry, light sources, brightness Y, yellowness Y-Z, fleece discolouration, unscourable yellow, reference wool, ceramic tile, wool cell, base colour, as-is colour, ΔY, near infrared reflectance
Introduction to the topic Colour is one of the most important wool properties because it provides the best indication of the ‘dyeing potential’ of a grower’s lot or an export consignment. Wool of poor colour cannot be used to produce a yarn with a light pastel shade, and extremely poor colour may be associated with microbial damage of the fibres. It is necessary to distinguish between the three types of colour associated with wool: • Greasy colour – the colour of wool in the fleece, before any processing • Clean colour – the colour of wool after industrial wool scouring (often referred to as ‘as-is’
colour) • Base colour – the colour of a wool sample after it has been subjected to a very thorough
cleaning treatment, as preparation for colour measurement. While there is a wide variation in wool colour, even wools of superior colour have a creamy colour in comparison with the bright, white colour, and consistency of colour that is typical of synthetic fibres. These differences place more importance on being able to measure wool colour objectively. Colour measurement as a general technique is not new. The principles were laid down in 1931 by the Commission Internationale de l’Eclairage (CIE) (http://www.cie.co.at/), and methods for measuring a wide range of products (paint, paper, plastics, etc) were soon developed. Wool colour measurement dates back to research at the Wool Research Organisation of New Zealand

11 - 2 – WOOL472/572 Wool Biology and Metrology ©2009 The Australian Wool Education Trust licensee for educational activities University of New England
(WRONZ) and the publication of the New Zealand Standard NZS 8707 in 1977 for the measurement of scoured wool colour. Further work at WRONZ extended the colour test to encompass greasy wool, and within five years 90% of wools offered for sale at auction in New Zealand were being measured for colour. Subsequent work in Australia resulted in Australian Standard AS3546 for the measurement of average yellowness in greasy wool and wool in scoured or carbonised form. Collaboration between New Zealand and Australian organisations resulted in completion of the international standard IWTO-56 for the measurement of the colour of raw wool. This standard accommodates the differing wool types found in each country. Today, colour measurement is firmly entrenched in New Zealand because it provides vital information for specifying its wool for trading purposes. Utilisation in Australia is much lower, with a very small proportion of grower lots offered for sale at auction being tested for colour. For example, in 2004/2005 only 0.5% of lots (or 0.8% of bales) were tested for colour in Australia – see AWTA testing statistics (http://www.awta.com.au/Publications/Statistics/key_data/KTD.htm). The most common type of wool tested for colour was skirting types with 2.7% of lots, while fleece type lots and carding type lots were 0.3% and 0.0% respectively. The general principles of colour measurement are covered in the text by Hunter and Harold (1987). Two relevant Woolwise presentations have been prepared by Lindsay (Lindsay 1999a,b). A large amount of information on colour and colorimetry is available of the intenet (see Useful Web Sites). The review paper by Wood outlines the use of colour measurement in the New Zealand wool industry (Wood 2002). The proceedings of a wool industry forum reviewing the introduction of colour measurement is also informative (Massey Wool Association 1986). The final issue of Wool Technology and Sheep Breeding (Anon 2004) lists the papers that have been published in the journal since 1973 on colour measurement theory and the applications to wool in Australia and New Zealand.
11.1 The basics of colour and colour measurement Colour and the human eye Colour should be a simple concept, but beyond the basics it is actually a very complex, highly mathematical subject (Hunter and Harold 1987). The human eye contains two types of light-sensitive cells (http://www.glenbrook.k12.il.us/ gbssci/phys/Class/refrn/u14l6a.html). The least common of these cells, the cones, are about 6-7 million in number and are concentrated in the centre of the eye called the fovea. The fovea is the area of the eye that receives light from where we are directly looking at. Cones are sensitive to colour and are of two types – one type is sensitive to red and green light while the other is sensitive to yellow and blue light. The second type of light receptor are rods. These number about 150 million and are responsible for peripheral vision. Rods are more sensitive in dim light but cannot detect colour. The primary goal in measuring colour (colorimetry) is to model the human eye. Ideally the instrument used for this purpose should have perfect agreement with what your brain tells you your eye is seeing. It is important to remember that colour does not exist beyond the interpretation provided by visual system. What we perceive as colour is simply the energy contained in the various wavelengths in the visible spectrum of light. There is no red, green or blue, nor yellow, magenta or white – only the wavelengths of electromagnetic energy to which the eye is sensitive. Two major difficulties in precisely matching instrumentation to the human eye are: 1. the iris enables the eye to adapt to a wide range of light intensities 2. the response of the eye is very non-linear with respect to its response to the wavelengths
across the visible spectrum.
WOOL472/572 Wool Biology and Metrology 11 - 3 ©2009 The Australian Wool Education Trust licensee for educational activities University of New England
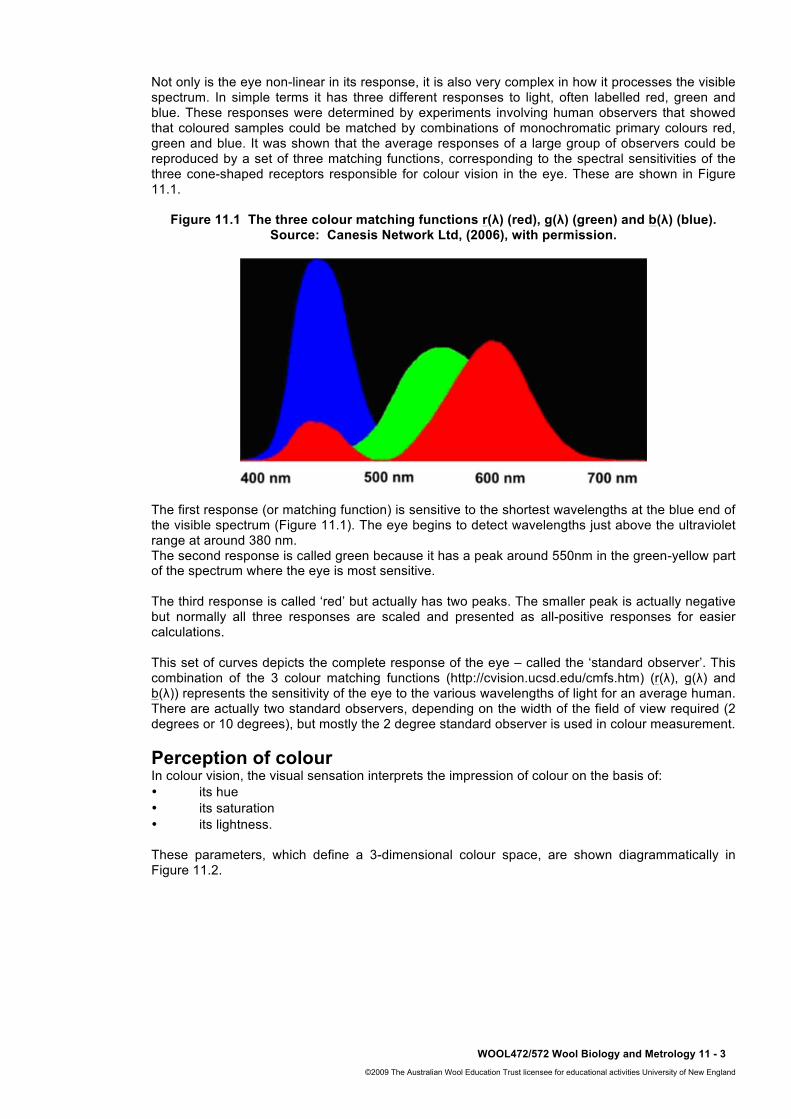
Not only is the eye non-linear in its response, it is also very complex in how it processes the visible spectrum. In simple terms it has three different responses to light, often labelled red, green and blue. These responses were determined by experiments involving human observers that showed that coloured samples could be matched by combinations of monochromatic primary colours red, green and blue. It was shown that the average responses of a large group of observers could be reproduced by a set of three matching functions, corresponding to the spectral sensitivities of the three cone-shaped receptors responsible for colour vision in the eye. These are shown in Figure 11.1.
Figure 11.1 The three colour matching functions r(λ) (red), g(λ) (green) and b(λ) (blue). Source: Canesis Network Ltd, (2006), with permission.
The first response (or matching function) is sensitive to the shortest wavelengths at the blue end of the visible spectrum (Figure 11.1). The eye begins to detect wavelengths just above the ultraviolet range at around 380 nm. The second response is called green because it has a peak around 550nm in the green-yellow part of the spectrum where the eye is most sensitive. The third response is called ‘red’ but actually has two peaks. The smaller peak is actually negative but normally all three responses are scaled and presented as all-positive responses for easier calculations. This set of curves depicts the complete response of the eye – called the ‘standard observer’. This combination of the 3 colour matching functions (http://cvision.ucsd.edu/cmfs.htm) (r(λ), g(λ) and b(λ)) represents the sensitivity of the eye to the various wavelengths of light for an average human. There are actually two standard observers, depending on the width of the field of view required (2 degrees or 10 degrees), but mostly the 2 degree standard observer is used in colour measurement. Perception of colour In colour vision, the visual sensation interprets the impression of colour on the basis of: • its hue • its saturation • its lightness. These parameters, which define a 3-dimensional colour space, are shown diagrammatically in Figure 11.2.

11 - 4 – WOOL472/572 Wool Biology and Metrology ©2009 The Australian Wool Education Trust licensee for educational activities University of New England
Figure 11.2 Relationship between lightness, hue and saturation. Source: Canesis Network Ltd, (2006), with permission.
Hue The hue is the attribute that gives rise to colour names – i.e. violet, blue, green orange, red, etc. and is often represented by a colour circle. This attribute is approximately equivalent to the dominant wavelength in the light. However, not all hues can be represented by spectral colours because there is no single wavelength of light which has the magenta hue – it may be produced by an equal mixture of red and blue. There are many mixtures of wavelengths which can produce the same perceived hue. The achromatic line from black through grey to white in the centre of the colour circle represents light that has no hue. This is sometimes called the lightness (or value) axis. Saturation The saturation (or purity) is determined by how far from the central grey (lightness) axis towards the pure hue at the outer edge that a colour is perceived to be. A pastel tint is said to have low saturation while a pure colour is said to have high saturation. The terms colourfulness and chroma are also used to describe the degree of saturation. The achromatic line in the centre of the colour circle also represents zero saturation. Lightness The third attribute is associated with an object’s ability to reflect or transmit light, and is called lightness, value and sometimes (incorrectly) brightness. It ranges from zero lightness (or black) to maximum lightness (or white). Figure 11.3 shows for a specific hue (red), how saturation and lightness may change. The range for saturation extends from grey (on the achromatic central axis shown as a dashed line) to the most vivid shade for the hue. The range for lightness extends from black through to white.

WOOL472/572 Wool Biology and Metrology 11 - 5 ©2009 The Australian Wool Education Trust licensee for educational activities University of New England
Figure 11.3 Variation in ‘redness’ with varying lightness and saturation. Source: Canesis Network Ltd, (2006), with permission.
Colour spaces We consider colour to be three-dimensional in that three independent attributes are required to characterise it. A point in colour space, representing a specific colour is specified by three coordinates. Figure 11.2 shows one colour space, based on hue, saturation and lightness (with cylindrical coordinates), but many alternative colour spaces (http://www.colorcube.com/articles/models/model. htm) are possible. Figure 11.4 shows opponent colour space (http://faculty.washington.edu/chudler/eyecol.html) which has rectangular coordinates. This approach follows the idea that somewhere between the eye and the brain, information from cone receptors in the eye gets coded into light-dark, red-green, and yellow-blue signals. The concept follows the "opponent" basis that colours cannot be red and green at the same time, or yellow and blue at the same time. However, colours can be considered as combinations of red and yellow, red and blue, green and yellow, and green and blue. Figure 11.4 Opponent colour space. Source: Canesis Network Ltd, (2006), with permission.

11 - 6 – WOOL472/572 Wool Biology and Metrology ©2009 The Australian Wool Education Trust licensee for educational activities University of New England
Principles of colorimetry Colorimetry allows coloured objects to be described, ordered, and compared. These operations must be accomplished in a consistent repeatable manner, in order to allow successful communication of colour information, which is essential if satisfactory industrial colour control is to be achieved. Colour is an aspect of visual perception that is neither easy to define nor easy to measure. It is a sensation whereby a human observer can distinguish differences between two fields of view, where such differences are caused by spectral composition differences in the observed radiant energies. Colour is: • A sensation, dependent upon the observer • Only of interest if the observer can distinguish differences in sensations • Caused by spectral (wavelength-by-wavelength) energy compositions (distributions) • The spectral energy compositions that are sensed by the eye/brain system of the human
observer, result from both sources of light, and objects that modify light. Although various systems have been developed for the measurement and ordering of colour, the most important system is the CIE system. First published in 1931, this colorimetric system is based on the principle that the colour of an object is a combination of light, object, and observer properties. The CIE (Commission Internationale de l'Eclairage) (http://www.cie.co.at/) is the international organization concerned with standards and methods for measuring light and colour. Elements which cause the colour stimulus
The CIE system is based on the premise that the stimulus for colour is provided by the proper combination of a source of light, an object, and an observer. The sensation of an object's colour is produced by the combination of: • A light source – illuminating an object • An object – reflecting or transmitting light to an observer • An observer – sensing the reflected light. The combination of these three elements is considered on a spectral (i.e. wavelength-by-wavelength) basis. 1. Light source Electromagnetic energy propagates in the form of waves, which can be described by their wavelengths or their frequencies. The wavelengths of these waves are minute distances, with 1 nanometer (nm) equal to 10-9 meters. Humans can "see" electromagnetic energy over a range of wavelengths from about 400nm (violet) to 700nm (red). Hence, this part of the electromagnetic spectrum is called the visible (or colour) spectrum. Light sources can be described by their relative energy outputs, wavelength-by-wavelength, as described mathematically by the function E(λ). Such functions are called relative spectral energy (or power) distributions. The colour producing effects of light sources result from the relative amounts of energy they produce across all visible wavelengths, not the absolute amounts of energy produced. Light sources may also be described by their colour temperatures. The colour temperature of a source is the temperature of a black body radiator that is most similar to the source. A blackbody radiator is an ideal surface that absorbs all energy incident upon it, and re-emits all this energy. The spectral output distribution of an incandescent (tungsten) lamp approximates a blackbody at the same temperature. Colour temperatures are typically presented using degrees Kelvin (°K).

WOOL472/572 Wool Biology and Metrology 11 - 7 ©2009 The Australian Wool Education Trust licensee for educational activities University of New England
The CIE has published spectral output data for various types of light sources (illuminants), in order to facilitate and standardize colorimetric computations. These illuminants include: • D65 – daylight, colour temperature 6500K • A – tungsten, colour temperature 2856K • F2 – fluorescent, cool white. CIE Illuminant spectral output data is used in the process of calculating the colour of illuminated objects. 2. Optical characteristics of coloured objects The spectral distribution of light reflected from an object depends upon: • the spectral distribution of the light illuminating the object, and • how the object modifies the incident light. For opaque objects, reflectance is determined by the following optical characteristics: • Surface reflection – diffuse (rough surface), or directional (smooth surface) reflection • Absorption – light enters the object and does not emerge (on a wavelength-by wavelength
basis), as it is converted to heat • Scattering – light enters the object and is deflected (on a wavelength-by-wavelength basis);
and is then eventually absorbed, or exits the object. The reflectance of an object is determined by spectrophotometric measurement, with calibration relative to an ideal white and a perfect black standard surface. Spectral reflectance curves, graphical plots of the reflectance data, are often a useful way of presenting this information. Reflectance data (of the object), is used in the process of calculating the colour of the object. 3. Observer The human eye/brain system senses colour through three types of sensors (cones), located in the eye's retina. These cones are sensitive to light in three different wavelength bands, referred to as the L, M, and S bands. Processing of the cone signals, by the brain, eventually yields output sensations interpreted as red, green, and blue (and/or combinations and differences of these primary colours). There are two CIE standard observers that can be used when computing CIE tristimulus values. They are: • 2° Observer (CIE - 1931 system) - for small objects • 10° Observer (CIE -1964 system) - for large objects. The colour matching functions (http://cvision.ucsd.edu/cmfs.htm) of these observers r(λ ), g(λ) and b(λ), which are specified by tabulated data wavelength-by-wavelength, are utilized in the tristimulus calculations. These are outlined in the following section. Tristimulus values CIE tristimulus values (http://hyperphysics.phy-astr.gsu.edu/hbase/vision/colper.html) X, Y, and Z, are coordinates of colour sensation, and form the foundation of the CIE colour space. The CIE system, like the human eye, derives a set of three signals from the spectral characteristics of the light source and the illuminated object, and the colour matching functions of the detector. The CIE tristimulus values are calculated by the spectral integration (i.e. multiplication and addition) of the following data function on a wavelength-by-wavelength basis: • A selected CIE Illuminant (D65, A, F2, etc.) with the spectral energy function E(λ) • An objects' spectrophotometric reflectance measurement (R(λ)) • A selected CIE observer (2° or 10°) as defined by the functions r(λ), g(λ) and b(λ).

11 - 8 – WOOL472/572 Wool Biology and Metrology ©2009 The Australian Wool Education Trust licensee for educational activities University of New England
Because each of the functions E, R, r, g and b is just a list of numbers (tabulated against wavelength), the task of obtaining X, Y and Z is simply a computational exercise. The formula for the tristimulus values are as follows: X = Σ E(λ).r(λ ).R(λ) Y = Σ E(λ).g(λ ).R(λ) Z = Σ E(λ).b(λ ).R(λ) where the summation sign Σ indicates that at each wavelength (over the range 400 – 700 nm) the appropriate values for E, colour matching function (r,g or b) and R are to be multiplied together, and the result to be summed over all wavelengths. Three numerical values are obtained. The calculation process is illustrated graphically in Figure 11.5.
Figure 11.5 Calculation of the tristimulus values X, Y and Z from the illuminant spectral energy function E, an object’s spectral reflectance function and the three functions r, g and
b of the standard observer. Source: Canesis Network Ltd, (2006), with permission.
As an example, the calculation of X Y and Z for a red object, using D65 illuminant and the CIE 2o standard observer values for r, g and b is shown in Table 11.1. Table 11.1 Data for X, Y Z calculation (for Illuminant D65 and 1931 2o observer). Source: Wood (2002). Wavelength
λ (nm) Light source
E Object
R Colour matching functions E.R.r E.R.g E.R.b
r g b
400 82.8 0.0817 0.0143 0.0004 0.0679 0.0967 0.0027 0.4593 410 91.5 0.1047 0.0435 0.0012 0.2074 0.4167 0.0115 1.9869 420 93.4 0.1287 0.1344 0.0040 0.6456 1.6156 0.0481 7.7605
. . . . . . . . .
. . . . . . . . .
. . . . . . . . . 680 78.3 0.8264 0.0468 0.0170 0.0000 3.0283 1.1000 0.0000 690 69.7 0.8301 0.0227 0.0082 0.0000 1.3134 0.4744 0.0000 700 71.6 0.8319 0.0114 0.0041 0.0000 0.6790 0.2442 0.0000
X=3.2 Y=20.9 Z=12.7 At a wavelength of 400 nm, the product of 82.8, 0.0817 and 0.0004 gives an answer of 0.0027 for the product E x R x g at this wavelength. Adding up the product column for all wavelengths in the range 400 – 700 nm gives a total of 20.9 for the tristimulus value of Y for the object being measured. With the associated values of X = 33.2 and X = 12.7, the object has a red colour (i.e. X is dominant over Y and Z).
WOOL472/572 Wool Biology and Metrology 11 - 9 ©2009 The Australian Wool Education Trust licensee for educational activities University of New England
Chromaticity co-ordinates While the X, Y, and Z tristimulus values define particular colours it is difficult to relate the tristimulus values of a sample to its colour appearance. This is because the colour depends not only on the stimulus but also on surrounding colours and the performance of the eye. However, the higher the Y value, the lighter a sample will look. Thus if Y = 80 then the sample will appear light while if Y = 3 the sample will appear dark. To represent the other two dimensions of colour it is usual to define ‘chromaticity coordinates’ x, y and z, and then plot y against z: From the above equations it follows that x + y + z = 1 for all colours. Therefore, it is only necessary to quote two of the chromaticity coordinates, and these can be plotted on a two-dimensional graph. Such a plot is called a ‘chromaticity diagram’ (http://hyperphysics.phy-astr.gsu.edu/hbase/vision/cieprim.html) (figure 11.6). The curve is composed of single wavelengths of light. While this diagram shows the different colours as discrete regions, in practice they merge into each other seamlessly. The outline to the coloured regions encompasses all the hues that can be seen by the eye. In the centre of the white region is the ‘achromatic point’ A. Any line drawn through this point links complementary colours such as orange and blue-green, yellow and blue, etc. A specific colour is represented by a point within this region. For example the point B, with coordinates (x=0.31, y=4.6) represents a yellowish green colour. Drawing a line through this point will shows a pair of wavelengths of light that can be combined to produce that colour. For example, it can be shown that the pair of spectral colours blue-green (λ ~ 490nm) and yellow green (λ ~ 565nm) can produce the colour represented by point B. The combination of wavelengths is not unique because many lines can be drawn through the same point. Also, if a line is drawn between any two colours on the diagram, all the colours on the line between then can be created by combining those colours in proportion to the distances to the desired point.
X
X + Y + Z x =
Y
X + Y + Z
y =
Z
X + Y + Z
z =

11 - 10 – WOOL472/572 Wool Biology and Metrology ©2009 The Australian Wool Education Trust licensee for educational activities University of New England
Figure 11.6 Chromaticity diagram. Source: Canesis Network Ltd, (2006), with permission.
These x, y and z values are utilized in the computation of CIE L*a*b* coordinates (where colours are described and ordered), and CIE L*a*b* colour differences (where colours are compared). CIE 1976 L*a*b* (CIELAB) system The CIELAB colour space (http://www.colorsystem.com/projekte/Grafik/54lab/01lab.htm) can be visualized as a three dimensional space, where every colour can be uniquely located. The location of any colour in the space is determined by its three colour coordinates; L* (lightness), a* (red/green), and b* (yellow/blue). This colour space is now the most widely used method for measuring and ordering object colour. It is routinely employed throughout the world by those controlling the colour of textiles, inks, paints, plastics, paper, printed materials, and other objects. It is sometimes referred to as the CIELAB colour difference metric. Its predecessor, the 1931 CIE system, provided the means of describing and ordering colours. Through its system of colour coordinates and associated diagrams, this system also facilitated the comparison of colours. Graphical and numeric data were used to describe colours (and differences) using functions such as: Y, x, y, purity, and dominant wavelength. Although the 1931 system proved useful, its practical application was limited as it did not express differences between colours in a uniform perceptual manner. The visual perceptions of differences (in lightness, purity, and dominant wavelength) were not usually consistent with the numeric information available from the system. The 1976 CIELAB system improved on the 1931 system by organizing colours so that numeric differences between colours agreed consistently well with visual perceptions. This improvement facilitated and simplified the communication of colour difference information between parties. The CIELAB colour coordinates (of an object) are determined as follows:
1. The object is measured by a spectrophotometer or similar instrument in which: a. A standard light source (illuminant) is utilised, and b. An observer (2° or 10°) is selected
2. Tristimulus values (X, Y, Z) are computed from the light-object-observer data 3. L*, a*, and b* are transformed (computed) from the X, Y, Z data, using the CIE 1976
equations.
WOOL472/572 Wool Biology and Metrology 11 - 11 ©2009 The Australian Wool Education Trust licensee for educational activities University of New England
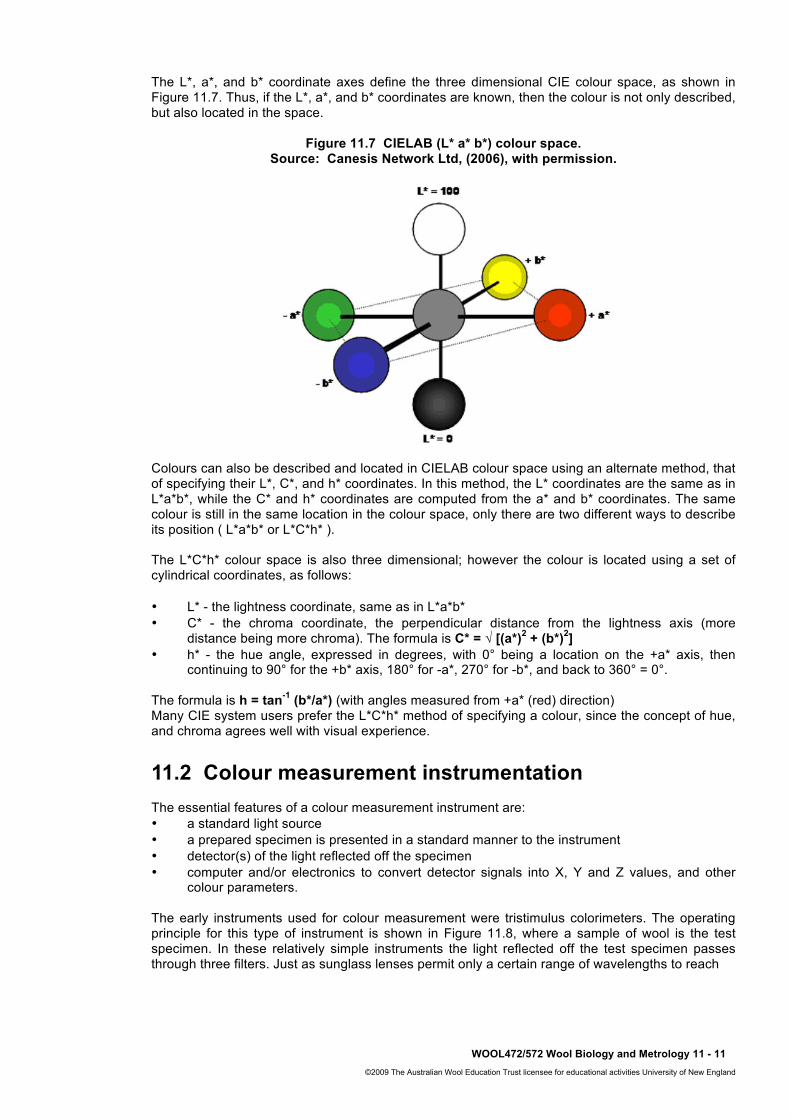
The L*, a*, and b* coordinate axes define the three dimensional CIE colour space, as shown in Figure 11.7. Thus, if the L*, a*, and b* coordinates are known, then the colour is not only described, but also located in the space.
Figure 11.7 CIELAB (L* a* b*) colour space. Source: Canesis Network Ltd, (2006), with permission.
Colours can also be described and located in CIELAB colour space using an alternate method, that of specifying their L*, C*, and h* coordinates. In this method, the L* coordinates are the same as in L*a*b*, while the C* and h* coordinates are computed from the a* and b* coordinates. The same colour is still in the same location in the colour space, only there are two different ways to describe its position ( L*a*b* or L*C*h* ). The L*C*h* colour space is also three dimensional; however the colour is located using a set of cylindrical coordinates, as follows: • L* - the lightness coordinate, same as in L*a*b* • C* - the chroma coordinate, the perpendicular distance from the lightness axis (more
distance being more chroma). The formula is C* = √ [(a*)2 + (b*)2] • h* - the hue angle, expressed in degrees, with 0° being a location on the +a* axis, then
continuing to 90° for the +b* axis, 180° for -a*, 270° for -b*, and back to 360° = 0°. The formula is h = tan-1 (b*/a*) (with angles measured from +a* (red) direction) Many CIE system users prefer the L*C*h* method of specifying a colour, since the concept of hue, and chroma agrees well with visual experience.
11.2 Colour measurement instrumentation The essential features of a colour measurement instrument are: • a standard light source • a prepared specimen is presented in a standard manner to the instrument • detector(s) of the light reflected off the specimen • computer and/or electronics to convert detector signals into X, Y and Z values, and other
colour parameters. The early instruments used for colour measurement were tristimulus colorimeters. The operating principle for this type of instrument is shown in Figure 11.8, where a sample of wool is the test specimen. In these relatively simple instruments the light reflected off the test specimen passes through three filters. Just as sunglass lenses permit only a certain range of wavelengths to reach

11 - 12 – WOOL472/572 Wool Biology and Metrology ©2009 The Australian Wool Education Trust licensee for educational activities University of New England
the eye, these filters permit only a limited range of wavelengths in the red, green and blue regions of the spectrum to pass through to light-sensitive detectors. The wavelength responses of the filters are carefully designed to match the colour response functions (r, g and b), and hence the three signals from the detectors correspond to the X, Y and Z values of the wool.
Figure 11.8 Principle of a tristimulus colorimeter. Source: Canesis Network Ltd, (2006), with permission.
More sophisticated instruments, called colour spectrophotometers, are now mostly used for measuring the colour of wool. The operating principle of a spectrophotometer is shown in Figure 11.9. In this instrument the light reflected off the wool interacts with a reflection grating (http://www.lot-oriel.com/pdf_uk/all/grating_physic.pdf) or similar device. The grating, which is a series of finely cut lines into a glass plate, splits the light into its component wavelengths, similar to the way in which a prism disperses light into its various colours. The detector senses each of these wavelengths in turn, and its signal is converted into X, Y and Z values by the computer.
Figure 11.9 Principle of the colour spectrophotometer. Source: Canesis Network Ltd, (2006), with permission.
Geometry The term "geometry" refers to the placement of a sample relative to the light source and measuring lens in a spectrophotometer. The most common geometries found in modern instruments are diffuse/8 and 45/0. Each instrument has a particular area where it is most useful. In a diffuse/8 spectrophotometer, the sample is illuminated by use of an integrating sphere as indicated in Figure 11.10.

WOOL472/572 Wool Biology and Metrology 11 - 13 ©2009 The Australian Wool Education Trust licensee for educational activities University of New England
Figure 11.10 Integrating sphere spectrophotometer. Source: Canesis Network Ltd, (2006), with permission.
Light that enters the sphere from the light source reflects off the coated interior surface of the sphere and strikes the sample from all angles. The reflected light is then measured at an angle of eight degrees relative to a perpendicular line drawn from the sample. This type of spectrophotometer tends to minimize the influence of surface irregularities on the light reflected from the sample, allowing measurement of reflectance due to colour rather than surface variations. The 45/0 spectrophotometer depicted in Figure 11.11 makes use of one or more light sources to illuminate the sample at an angle of 45° with a lens placed at 0° to measure the amount of light reflected from the sample surface. This type of instrument is said to be more sensitive to surface irregularities than the diffuse/8 instrument and measures "appearance" as well as colour. For this reason, 45/0 instruments are often used in quality control applications where differences in surface texture and finish are important.
Figure 11.11 45/0 spectrophotometer geometry. Source: Canesis Network Ltd, (2006), with permission.
Because of the differences between the readings produced on these types of instruments, reflectance data cannot be transferred between two systems unless instruments with the same geometry are used. There will still be some difference in readings produced on two instruments with the same geometry due to manufacturing variance, but the colour difference between two samples measured on two instruments will be similar. The international standard for wool colour measurement (IWTO-56-03) specifies a 45/0 geometry.

11 - 14 – WOOL472/572 Wool Biology and Metrology ©2009 The Australian Wool Education Trust licensee for educational activities University of New England
Light sources Spectrophotometers make use of one of two light sources - either a tungsten filament bulb which is similar to a common projector bulb, or a xenon flash bulb which is similar to the flash bulb of a camera. Certain guidelines should be followed depending upon the type of bulb being used. Tungsten filament bulbs burn continuously and generate a considerable amount of heat. For this reason, temperature and light sensitive samples should not be placed at the instrument port until immediately prior to measurement of the sample. Extended exposure of some samples to the heat and light from the tungsten filament bulb will cause a dramatic change in the colour of the sample. Xenon flash bulbs do not generate heat so there is no concern for the sample heating previously mentioned. These bulbs are, however, very rich in ultraviolet energy. This ultraviolet energy will excite any fluorescing chemicals or dyes present in the samples and will lead to inaccurate colour match predictions. Viewing area Spectrophotometers typically come equipped with a range of aperture sizes to allow measurement of both small and large samples. It is always preferable to use the largest aperture size possible to minimize the influence of sample variability, but smaller ports may be used as necessary for measuring even the smallest of samples. Samples measured with small apertures will require additional readings to insure minimal measurement error. Instrument diagnostics Prior to measuring samples on the spectrophotometer, perform diagnostic tests to check the accuracy of the measurements. These tests should include a drift test to check for read to read repeatability, a diagnostic tile test to insure long term repeatability, and a standardization, or calibration with a white tile. Only the white tile calibration is required daily while the other diagnostic tests can be performed on a weekly basis. Any poor test results should be resolved prior to measuring any samples. Long term stability of the instrument is critical due to the fact that standards and dye primaries are often used for many years. Modern instruments can present results in different colour spaces (e.g. X Y Z, L* a* b*, L a b, etc.).
11.3 Application of colour measurement to wool The importance of colour in wool Good wool colour is extremely important for yarns or fabrics that are to be dyed to pale pastel shades. As dyeing is an additive process, it is not possible, without using temporary optical bleaching effects, to produce a shade that is lighter than the original substrate colour (Lindsay 1999a). Additionally, as the natural creamy-yellow component of wool is not stable, pale colours on yellow wools may fade quickly because the strength of the yellow component has been reduced. Poor wool colour may also be an indicator of other processing faults, such as tenderness or wool degradation.

WOOL472/572 Wool Biology and Metrology 11 - 15 ©2009 The Australian Wool Education Trust licensee for educational activities University of New England
Figure 11.12 shows the effect of different levels of yellowness on the ability to dye a blue shade.
Figure 11.12 Effect of wool yellowness on dyeing quality (top row – undyed wool, middle row – dyed wool, bottom row – dyed and carded wool). Note: the Y-Z values are expressed
in C/2o colour space. Source: Wood (2006).
Sources of wool discolouration The sources of various types of wool discolouration are thoroughly discussed by Henderson (Henderson 1968). The most general source of discolouration is diffuse yellowness which is most apparent in crossbred wools shorn late in the season and which have grown in warm, moist conditions. Although this discolouration is largely scourable, its presence tends to obscure the subjective assessment of the clean wool colour. Where long-woolled sheep are subjected to prolonged periods of warm, moist conditions after their fleece has become thoroughly wetted, an unscourable yellowness called canary stain may develop. This condition, which may appear as either discrete bands in the fleece or in extreme cases spread throughout the fleece, is particularly prevalent in cotted wools. Other forms of discolouration are caused by bacterial action within the fleece. Most scour out although others are permanent and in a few cases may also damage the fibre. Yellowing of the fleece can be minimised in New Zealand by shearing in late winter/early spring, before the onset of moist warm conditions cause yellowness to develop. Figure 11.13 shows the variation in yellowness throughout the year.
Figure 11.13 Variation in wool yellowness throughout the growing season. Source: Wools of New Zealand.

11 - 16 – WOOL472/572 Wool Biology and Metrology ©2009 The Australian Wool Education Trust licensee for educational activities University of New England
Researchers at Lincoln University have developed a predictive test for the propensity of wool to yellow in the fleece. There is some evidence that propensity to yellowing is genetically based and can therefore be reduced in a flock by selection, based on the results of the predictive test (Reid 1998). Wool colour can also be affected by natural staining. Although faecal material is usually scourable, unscourable breakdown products of pigments in grass may affect the colourfastness of some pastel shades to sunlight. Urine stains are unscourable and wool tends to be permanently discoloured if it becomes very muddy. The high correlation between base colour of greasy merino wool and the corresponding colour is the top, especially with respect to yellowness, has been demonstrated (Mahar and Osborne 1996). Dark fibres Australian and New Zealand wools are largely free of coloured fibres, compared with wools of many other countries. Coloured fibres may either be naturally pigmented (black fibres) or stained by urine. Pigmented fibres in wool may occur through contamination from coloured sheep running in a white mob or poor shed practices. Alternatively, they may arise through the presence of small patches of black wool on white sheep. Levels of perhaps 20 fibres per 100g of top may be specified as limits before discounts on price apply. This corresponds to around four staples of stained or coloured fibres per bale so that great care is required to keep all such wool out of coloured fibre free lines required for the spinning of high quality yarns (http://www.awta.com.au/Publications/Marketing/DMF_Risk/GG_IWTO_Evian 2004.pdf). While a dark fibre detector (http://www.tft.csiro.au/news/pdf/Dark Fibre detector.pdf), developed by CSIRO, is available to highlight dark fibres in web, sliver or top to facilitate the counting of these fibres, it cannot be used as a pre-sale wool test. Instead, a scheme has been developed in Australia where a ‘dark and medullated fibre risk rating’ (http://www.awta.com/au/Publications/ /Marketing/DMF_Risk/DMFR_Scheme.htm) is assigned to wool sale lots, based on various breed, sex, age, husbandry and clip preparation criteria. The test method for dark and medullated fibres is explained in an AWTA Newsletter article (http://www.awta.com.au/Publications/Newsletter/2004 _August/Aug_2004_For_Technophiles.pdf). Colour stability Greasy wool will also eventually discolour in storage over a timeframe of 6-12 months; the more yellow the original colour, the sooner and more marked will be the change. Another colour stability issue, especially with carpet wools, and other wool interior textiles subjected to sunlight, is the problem of photobleaching. The ultraviolet component in sunlight tends to rapidly bleach the creamy colour and this causes a shift in the shade of a dyed product. A time scale of just a few days is involved. However, the Lanalbin APB technology (http://www.canesis.com/Brochures/Product_Lanalbin.pdf), developed by Canesis, eliminates this problem by applying an agent to the fibre that photoyellows at the same rate that the wool substrate photobleaches. The net result is a stable colour for the product even when subjected to prolonged, intense sunlight. History of wool colour measurement The measurement of wool colour for commercial purposes began in the 1970’s after several years of research at the Wool Research Organisation of New Zealand (WRONZ) (Hammersley and Thompson 1974). From this work the first recognised national standard (NZS 8707:1977) was introduced for scoured wool in 1977. In 1984 this standard was widened in scope to include greasy wool and it became the basis for the trading of wool using colour measurement (Massey Wool Association 1986).

WOOL472/572 Wool Biology and Metrology 11 - 17 ©2009 The Australian Wool Education Trust licensee for educational activities University of New England
In 1988 the International Wool Textile Organisation (IWTO) produced a draft test method for wool colour (IWTO-DTM-56) based on the New Zealand standard. This draft test method ultimately became a full IWTO test method IWTO-56-03. The method was based on the now obsolete C/2 illuminant. While the colour test was rapidly adopted in New Zealand for the commercial testing of greasy wools prior to sale, the uptake in Australia has been lower. This is largely because there is a widespread belief that the bulk of Australian wool is white and bright and a test result would add little value. Certainly, a typical merino fleece is generally whiter and brighter than a typical crossbred fleece. Furthermore, most Australian wool in produced in drier regions where deterioration in wool colour due to humidity and moisture is less prevalent. As a result, the demand for colour testing in Australia has actually fallen during the past decade, with colour testing of sale lots dropping from 20% in 1997/98 (Lindsay 1999b) to around 2% in 2000/2001 (Wood 2002). According to the most recently available data from the Australian Wool Testing Authority (http://www.awta.com.au/Publications/Statistics/Statistics.htm) the test is now being requested on less than 1% of sale lots. However, the view that the test is unimportant in Australia is only partly correct because considerable quantities of wool typed as light, medium and heavy unscourable colour are produced. These wools are identified based on visual assessment of the greasy wool. However, the colour of greasy wool is a poor indicator of the colour of the same wool after it has been scoured. This poor correlation is due to the effects of wool grease and dust on colour, both of which are removed by scouring. On the other hand, colour measurement on wool is firmly entrenched in New Zealand, with close to 100% utilisation on greasy auction lots, because it provides vital information for wool trading purposes. The wool clip shows a wide variation in colour, from near-white merino to highly discoloured oddments. Colour varies through the season (see Figure 11.12) and from location to location because of climatic differences. It will vary from season to season depending on the weather, and breed, environment, shearing time and on-farm practices also have an influence. Sample preparation Samples of wool for commercial testing are supplied as core samples, mostly being extracted in a broker’s store or a wool scour. To obtain consistent, meaningful results it is essential that the specimen of wool presented for colour measurement is in the cleanest, most homogeneous possible state. The results obtained from such a specimen define the ‘base colour’ of then wool. If scoured wool is tested without a further cleaning treatment then the results define the ‘as-is colour’ of the wool. Greasy wool is never tested for colour without a thorough prior cleaning treatment. The IWTO test method does not prescribe the procedure for cleaning the wool sample, instead it states “the essential requirements for sample preparation for colour measurement are that the wool be cleaned of contaminants (e.g. grease, dirt, vegetable matter etc.), well-blended and conditioned. The procedures used in sample preparation should be such that the base colour of the wool is not altered” (IWTO-56-03). To meet these requirements the test houses have machines for preparing samples that are: • free of wool grease, suint and dirt • thoroughly blended • randomised (with respect to fibre orientation) • free of vegetable matter and other particulate contaminants • open (as opposed to being entangled). A sample destined for colour measurement is usually in the form of cores. It is subjected to agitated scouring in hot water and detergent, hydroextracted then dried. This is followed by opening of the clumps of fibre, removal of particulate contaminants and the mixing of the fibres by a mechanical carding action. The IWTO test method prescribes the Shirley Analyser (http://www.sdlatlas.com/ html/f102a.html) machine.

11 - 18 – WOOL472/572 Wool Biology and Metrology ©2009 The Australian Wool Education Trust licensee for educational activities University of New England
The colour of wool can be influenced by many factors during sample preparation: • Quality of the water used for scouring the samples • Drying – prolonged drying at 105oC can yellow some wools and should be avoided • Air quality in the laboratory – during drying and conditioning large volumes of air are passed
over the wool. If this air contains dust this may become trapped in the wool sample • Shirley Analysing – the perforated cage of the machine and any surfaces that come into
contact with the wool must be checked to ensure that contaminants are not transferred to the sample
• Fluorescent lighting – extended exposure, especially in close proximity, can change the colour of the wool.
While colour results are less influenced by wool regain variations than other parameters, wool prepared for colour measurement in usually conditioned in a standard atmosphere for a fixed period. Presenting the sample to the instrument Unlike solid materials which may require colour measurement, wool and other fibrous materials must be restrained behind a glass window to present a flat, uniform surface to the instrument. A wool cell or a piston in a cylindrical chamber is used to compress a wool specimen against a glass window to a constant density or constant pressure. It is inevitable that some losses of radiant energy will occur, due to the presence of the glass. To obtain consistent results and good agreement with other instruments it is necessary to standardise the following (Townsend and Hammersley 1992): • the packing density to which the wool is compressed • the thickness and quality of glass used for the cell window • the distance of the cell window from the port of the instrument. Wool cells specified by IWTO (IWTO-56-03) are of two types, constant density cells and constant pressure cells. The former requires a fixed mass of wool to be loaded whereas the latter requires a minimum mass of wool. Repositioning the sample for multiple readings improves the precision of the colour results reported. The IWTO test method requires that four measurements of each tristimulus values be obtained either by: 1) using one test specimen, measuring each end, split the specimen and reassemble it to
produce two new measurement faces and again measure each face, or 2) use two test specimens and measure two faces on each. Range checks are required to ensure that the required level of precision is achieved in the test results. Instrument calibration When the initial research and development into wool colour measurement was being undertaken it was realised that it was difficult to achieve acceptable agreement between laboratories and between different instruments in the same laboratory. The solution to the calibration problem was to provide sets of calibration wools, in the form of accurately measured, homogeneous tops. Since 1977 WRONZ provided a reference wool service for wool testing laboratories around the world. The justification for this approach was that a colour instrument should be calibrated using a material in the same form as the material to be measured. Given the relatively primitive instruments available at the time of the introduction of colour measurement to the wool industry, this view was quite valid. When filter-based colorimeters were more widely used, the reference wool approach to calibration was arguably the best way to reduce the observed differences between instruments (Hammersley and Townsend 1993). The design of modern instruments has reduced the necessity of using the reference wool approach for instrument calibration. In 2002 it was replaced by a method involving the use of standard ceramic tiles. This was prompted by perceived problems associated with the durability of wool as a reference material and shifts in assigned colour results between different deliveries of reference wool (Lindsay 1996a, b). As well as the tiles being robust and exceptionally stable, it was
WOOL472/572 Wool Biology and Metrology 11 - 19 ©2009 The Australian Wool Education Trust licensee for educational activities University of New England
demonstrated by extensive interlaboratory trials (http://www.awta.com.auPublications/Research_ Papers/Colour.htm) that modern colour instruments could be satisfactorily calibrated using them. Another reason for dispensing with wool for calibration was that the measurements provided with the reference wool samples were not directly traceable to the internationally accepted CIE colour standards. The use of certified ceramic tiles now provides a stable, durable, reproducible material for wool colour instrument calibration. Coinciding with the change in reference material was the move to replace the obsolete illuminant C/2o with a newer illuminant D65. It was realised that with C/2o materials that fluoresce can give misleading results, so that D65 became the more accepted source of ‘standard daylight’. In addition, a new observer angle of 10o was introduced because it was generally believed that the 2o observer did not represent a realistic simulation of human assessment of colour. The latest version of the colour test method (IWTO 56-03) incorporates these changes and brings the wool industry into line with other industries, especially textile dyeing, which use colour measurement. However, it was inevitable that the results provided by the wool testing laboratories would shift. Interpretation of wool colour results The colour spectrophotometer delivers results as tristimulus values X, Y and Z. While all three are quoted on a wool test certificate, in practice only two parameters are necessary. They are: Y which is closely related to the lightness of the wool and is often called ‘brightness’, and Y – Z which is related to the ‘yellowness’ of the wool. The wool industry has found these two parameters form a necessary and sufficient set to specify the colour of wool for trading purposes. While the higher the Y value the better the colour of the wool (bright instead of dull and dingy), the Y-Z value should be as low as possible (light cream as opposed to yellow or even darker). In the more than 25 years since the colour testing of wool was introduced, the international wool textile industry (i.e. growers, scourers, brokers, wool buyers, spinners and dyers) has become confident and experienced in using the test results expressed in terms of Y and Y-Z. The recent changes to the wool colour test outlined previously mean that shifts in these parameters have been inevitable; i.e. Y has increased by 4-6 units and Z has reduced by 2-5 units so that Y-Z has increased by approximately 8-9 units (see http://www.wooltesting.sgs.com/iwto_circular_58_02.pdf). As a guide, Table 11.2 shows how brightness Y and yellowness Y-Z have changed for wools of various colours. Table 11.2 Comparison of colour results for different wool types. Source NZWTA.
Level Brightness Y Level Yellowness Y – Z D65/10 C/2 D65/10 C/2 Very bright >70 >66 Very white <9 <-2 Bright 68-70 64-66 White 9-10.5 -2 – 0 Average 64-68 60-64 Slightly creamy 10.5-12.5 0-3 Slightly dingy
59-64 56-60 Creamy 12.5-14.5 3-6
Dingy <59 <56 Quite yellow 14.5-16 6-8 Heavily
stained/yellow >16 >8
It must be noted that the Y and Y-Z results for good colour wools are quite different for fine and coarse wools. While premium quality Merino wools may often be described as bright and white, the best of the Romney wools do not often score better than the average brightness and creamy yellowness level.
11 - 20 – WOOL472/572 Wool Biology and Metrology ©2009 The Australian Wool Education Trust licensee for educational activities University of New England
To assist the international wool industry with the management of these significant shifts in colour results, conversion formulae (or baremes) have been provided in IWTO 56-03. Base colour and ‘as-is’ colour The base colour of wool is the result obtained by applying the IWTO test (in a test house) to a sample of wool that has been cleaned as thoroughly as possible. The ‘as-is’ colour is the result that might be obtained in a wool scour where a sample taken from the dryer is measured without any further cleaning. Commercially scoured wool is not perfectly clean but always contains some contaminating dirt. Therefore, it is inevitable that the as-is colour of a wool will be inferior to its base colour. The difference in the Y tristimulus values between two samples of the same wool (one prepared as for the base colour test and the other taken directly from the scour) provides a measure of the effectiveness of commercial scouring (along with residual grease content result). The parameter of interest, ΔY, is defined as:
ΔY = Ybase – Yas-is
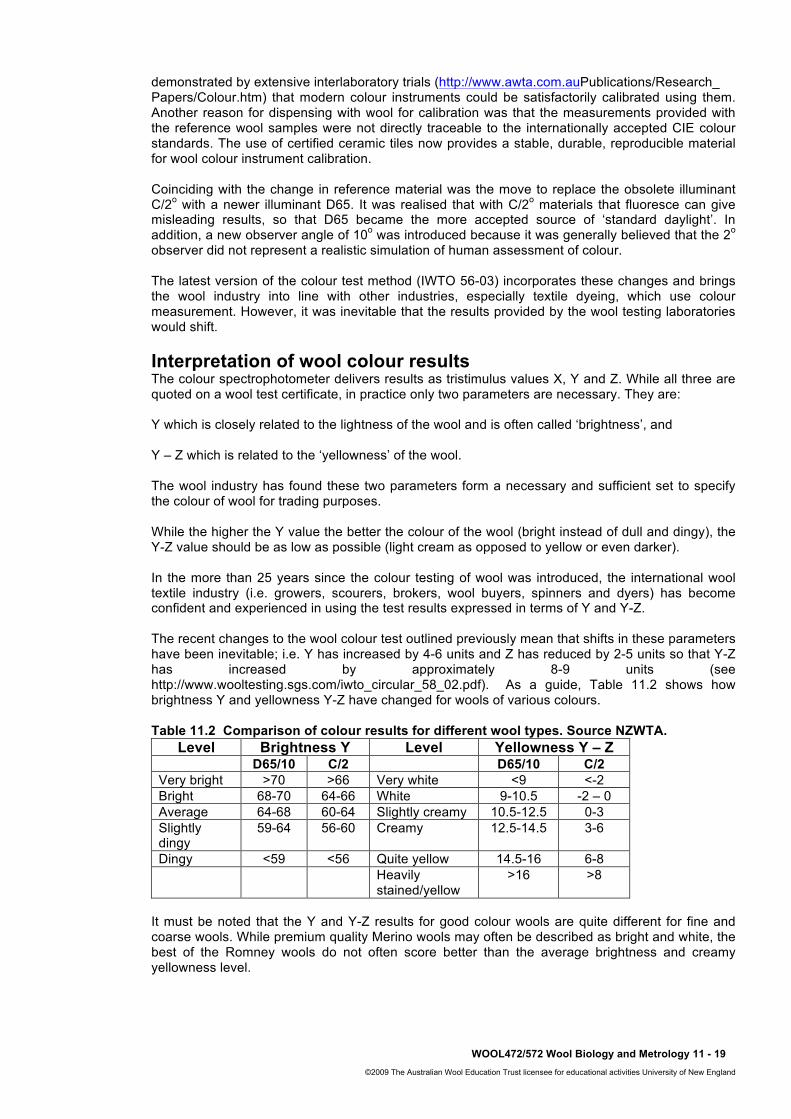
ΔY is strongly influenced by the scouring conditions, for example, the concentration of detergent (Figure 11.14) and the flowdown (water discharge) rate (Figure 11.15). A close correlation between ΔY and the level of residual grease on the wool is evident. The Canesis Glacial (http://www.canesis.com/Brochures/Glacial.pdf) process for the scouring of wool optimises the treatment conditions so that the whitest, brightest and cleanest wool possible is delivered, and ΔY becomes as small as practicable.
Figure 11.14 Effect of detergent concentration on ΔY. Source: Wood (2006).
Figure 11.15 Effect of flowdown on ΔY. Source: Wood (2006).
WOOL472/572 Wool Biology and Metrology 11 - 21 ©2009 The Australian Wool Education Trust licensee for educational activities University of New England
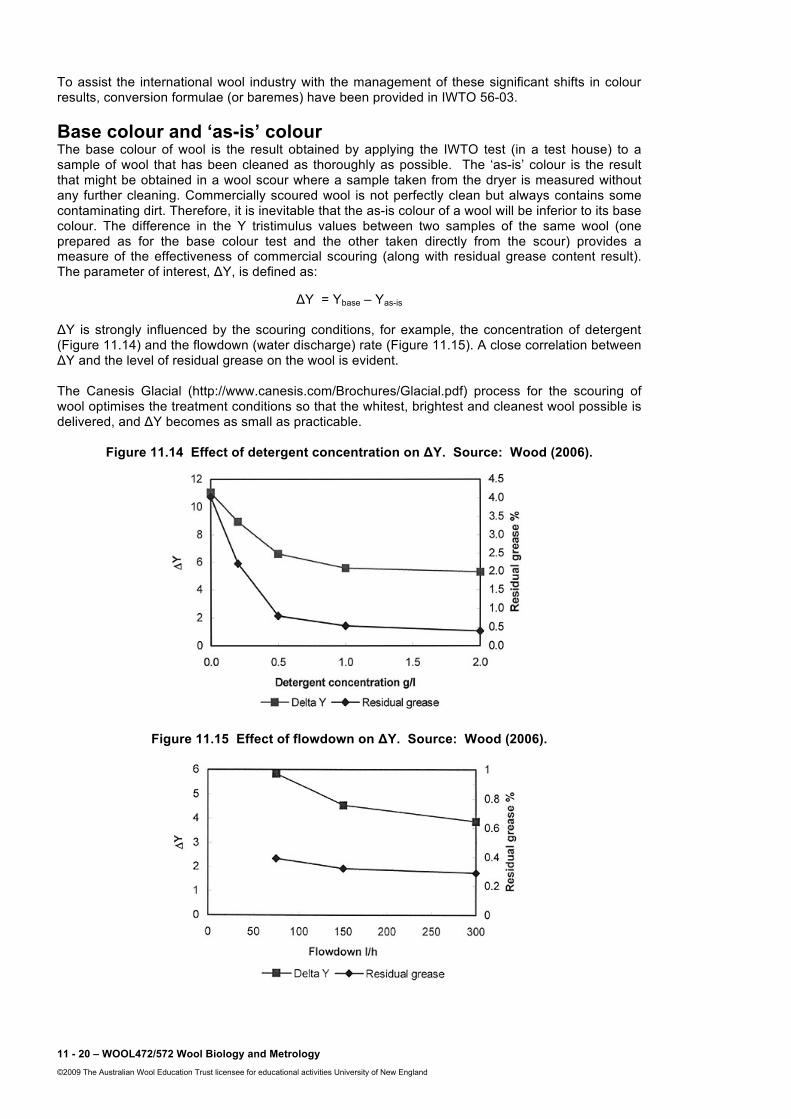
11.4 NIR instrumentation for wool colour measurement Modern near infrared reflectance (NIR) instruments are able to measure the tristimulus values for scoured wool (Hammersley and Townsend 1994). They mostly use a diffraction grating that disperses light into its component wavelengths (Figure 11.16) for detection by infrared and visible light sensors. Unlike earlier NIR instruments, which were filter-based, the modern instruments are not restricted to the invisible near infrared region but also can operate in the visible region of the electromagnetic spectrum.
Figure 11.16 Principle of wool colour measurement using NIR. Source: Walls (2002).
Unlike colorimeters and spectrophotometers, NIR instruments measure colour indirectly, i.e. from the influence of the features of interest (e.g. moisture content, residual grease content, etc) on the reflectance of radiation in the near infrared region of the electromagnetic spectrum. Consequently, these instruments must be calibrated using wools with a wide range of properties that encompass the range which will be measured in everyday use. For example, to calibrate a NIR instrument for colour measurement, numerous wool samples which have been measured by the conventional IWTO method for colour and which span the range of Y and Y-Z are required. Most New Zealand wool scours have NIR technology installed to measure on a bale-by-bale basis the moisture content, residual grease and colour of the wool leaving the scouring line. The Canesis-developed NIRASPEC-S system is the most advanced online instrument for the quality control of scoured wool in the world (Figure 11.17).

11 - 22 – WOOL472/572 Wool Biology and Metrology ©2009 The Australian Wool Education Trust licensee for educational activities University of New England
Figure 11.17 NiraSpec instrument in a wool scour, showing the sample delivery system and computer. Source: Wood (2006).
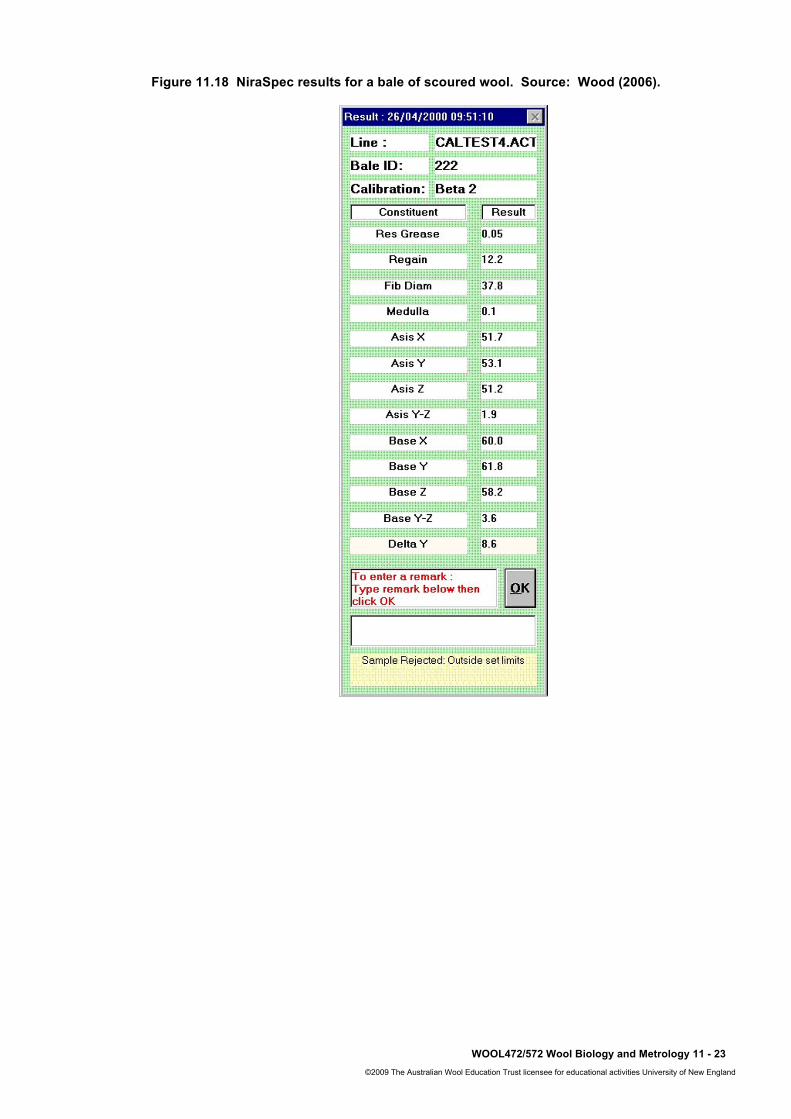
Core samples are sent pneumatically to the instrument for measurement and then discharged into a receptacle, without requiring any handling by operators. The suite of test results, which include estimates of base colour and as-is colour, are displayed on the computer monitor within one minute (Figure 11.18). The availability of such comprehensive information in a rapid manner enables adjustments to optimise the various operations of the scour to be made as required.
WOOL472/572 Wool Biology and Metrology 11 - 23 ©2009 The Australian Wool Education Trust licensee for educational activities University of New England
Figure 11.18 NiraSpec results for a bale of scoured wool. Source: Wood (2006).

11 - 24 – WOOL472/572 Wool Biology and Metrology ©2009 The Australian Wool Education Trust licensee for educational activities University of New England
Readings ³
The following readings are available on CD: 1. Baxter, P. 2001, Stability of wool colour, Massey Wool Association Conference: Colour, the
ABC of XYZ. 2. Harold, R.W. 2001, An introduction to appearance analysis, secondsight, Graphic Arts
Technical Foundation, No. 84. 3. Tawil, J. Colorimetry: Light, object, viewer and the rubber ruler, International
Cinematographers Guild, Woods, M. (ed.). 4. Wood, E.J. The Basics of Wool Colour Measurement, Canesis Network Ltd.
Activities Available on WebCT
Multi-Choice Questions Submit answers via WebCT
Useful Web Links Available on WebCT
Assignment Questions Choose ONE question from ONE of the
topics as your assignment. Short answer questions appear on WebCT. Submit your answer via WebCT
Summary Summary Slides are available on CD Colour is one of the most important wool properties because it provides the best indication of the ‘dyeing potential’ of a grower’s lot or an export consignment. Wool of poor colour cannot be used to produce a yarn with a light pastel shade, and extremely poor colour may be associated with microbial damage of the fibres. Colour measurement as a general technique is not new. The principles were laid down in 1931 by the Commission Internationale de l’Eclairage (CIE, http://www.cie.co.at/), and methods for measuring a wide range of products (paint, paper, plastics, etc) were soon developed. The introduction of colour measurement to the wool industry began in the 1970s and it is now a mature test for wool, both for greasy and scoured wool. Colour measurement is firmly entrenched in New Zealand because it provides vital information for specifying its wool for trading purposes. Utilisation in Australia is much lower, with a very small proportion of grower lots offered for sale at auction currently being tested for colour. While a range of illuminants and instrument geometries have been used in various colour applications over the years, the wool industry has now standardised on the D65 illuminant with a viewing angle of 10 degrees. The key tristimulus values reported are Y (brightness) and Y-Z (yellowness). Before outlining how colour measurement has been applied to wool, the topic first outlines relevant aspects of colour perception, theory and instrumentation. Recent changes to the IWTO-prescribed testing methodology for wool and the use of near infrared reflectance technology to the measurement of scoured wool colour are also covered.
WOOL472/572 Wool Biology and Metrology 11 - 25 ©2009 The Australian Wool Education Trust licensee for educational activities University of New England
References Anon 2004, 1954–2004 Subject Index, Wool Technology and Sheep Breeding., Vol. 52, pp.278-
345. Hammersley, M.J. and Thompson, B. 1974, Wool Colour Measurement, WRONZ Communication
No. C27. Hammersley, M.J. and Townsend, P.E. 1993, Wool Colour Measurement, WRONZ Communication
No. C125. Hammersley, M.J. and Townsend, P.E. 1994, Exploiting the Shorter Wavelengths Including Colour,
Proceedings of International Conference on Near-infrared Spectroscopy. Henderson, A.E. 1968, Growing Better Wool, A.H. and A.W. Reed, Wellington. Hunter, R.S. and Harold, R.W. 1987, The Measurement of Appearance, 2nd edn, John Wiley and
Sons Inc, ISBN 0-471-83006-2. IWTO-DTM-56, Draft Test Method for the Measurement of Colour of Raw Wool, International Wool
Textile Organisation Draft Test Method. IWTO-56-03, Method for the Measurement of Colour of Raw Wool, International Wool Textile
Organisation Test Method. Lindsay, A. 1996a, The measurement of wool colour in CIE colour space, Wool Technology and
Sheep Breeding., Vol. 44, No. 2, 138–162. Lindsay, A. 1996b, The use of regression equations to predict the colour of wool using ceramic tile
calibration, Wool Technology and Sheep Breeding., Vol. 44, No. 3, pp 238–245. Lindsay, A. 1999a, Colour Measurement Theory, Woolwise PowerPoint presentation, CRC for
Premium Quality Wool. Lindsay, A. 1999b, The Measurement of Wool Colour, Woolwise PowerPoint presentation, CRC for
Premium Quality Wool. Mahar, T.J. and Osborne, L. 1996, The relationship between the clean colour of commercial
consignments of greasy wool and the colour of the resulting top and noil, Wool Technology and Sheep Breeding., Vol. 44, No. 3, 219–237.
Massey Wool Association 1986, Colour Measurement in Wool – A Forum Discussion, Wool, pp. 39–49.
New Zealand Wool Testing Authority Ltd. (NZWTA), Colour Measurement, information brochure, available from http://www.nzwta. co.nz/docs/colour_measurement. pdf
Reid, T.C. 1998, Wool yellowing, Wool Technology and Sheep Breeding., Vol. 46, No. 4, pp. 318–337.
Townsend, P.E. and Hammersley, M.J. 1992, The Measurement of Wool Colour: Effects of Packing Density, Regain and Fibre Length, WRONZ Report No. R198.
Walls, R.J. 2002, Principles of Colour Measurement, information brochure, Canesis Network Ltd. Wood, E.J. 2002, The Basics of Wool Colour Measurement, Wool Technology and Sheep
Breeding., Vol. 50, No. 2, pp. 121–132. Wools of New Zealand, Variations in Wool Yellowness, NZ Wool Industries Handbook.
Glossary of terms
Absorption Dissipation of the energy of electromagnetic waves into another form as it interacts with matter
Achromatic A colour such as black, grey or white that has zero saturation (or chroma)
Additive primaries When red green and blue are combined at 100% intensity, white light is produced
As-is colour The colour results obtained from scoured wool, which has received no further cleaning before testing
11 - 26 – WOOL472/572 Wool Biology and Metrology ©2009 The Australian Wool Education Trust licensee for educational activities University of New England
Base colour The colour results obtained from a wool in its cleanest possible form
Black The absence of all reflected light when an object absorbs all light
Brightness An object appears to emit or reflect more or less light
Brightness (wool) The tristimulus value Y is used to represent the brightness of wool (i.e. bright as opposed to dul/dingy)
Calibration To check or adjust the results produced by an instrument
Chroma An object appears saturated with a particular colour
CIE International Commission on Illumination, the main international organisation concerned with colour and colour measurement
CIELAB Colour space in which values L*, a* and b* are plotted at right angles to each other to form a 3-dimensional coordinate system
CIE standard illuminants
Spectral data for 4 types of light sources which are used in place of actual measurements of the light source
CIE standard observer
A hypothetical observer having the tristimulus colour mixture recommended in 1931 by CIE for a 2o viewing angle
CIE tristimulus values Amounts of the three components, designated as X, Y and Z, necessary in a 3 colour mixture to match a colour
CIE chromaticity coordinates
x and y values that specify the location of colour within the CIE chromaticity diagram
CIE chromaticity diagram
A two-dimensional graph of the chromaticity coordinates x and y which shows the colour spectrum locus (i.e. for monochromatic light in the range 380-770 nm)
Colorant Dye, pigment or other agent used to impart colour to a material
Colour matching Procedure for establishing visual equivalence of two colours
Colour matching functions
Relative amounts of three additive primaries required to match each wavelength of light – usually refers to CIE Standard Observer
Colour space A three-dimensional geometrical representation of colours that can be seen
Colour temperature A measurement of the colour of light radiated by an object while it is being heated. Lower temperatures such as 2400oK are red while high temperatures such as 9300oK are blue
Colour wheel The continuum of colours in the visible spectrum arranged into a circle
Colorimeter An optical measurement instrument that responds to colour similarly to the human eye by filtering light into its dominant regions of red, green and blue
D65 (Illuminant D) The CIE standard illuminant that represents a colour temperature of 6504oK
WOOL472/572 Wool Biology and Metrology 11 - 27 ©2009 The Australian Wool Education Trust licensee for educational activities University of New England
Discolouration The departure of wool from its ideal colour (white or light cream) due to microbial action, soiling or staining
Dispersion The separation of light into its constituent wavelengths using a prism or grating
Electromagnetic spectrum
The wide band of electromagnetic waves, as measured by wavelength Only e-m waves in the range 380 – 720 nm are visible, producing light
Fluorescent lamp A discharge lamp of the low pressure mercury type in which most light is emitted by layers of phosphors excited by the ultraviolet radiation of the discharge
Hue The basic colour of an object such as “red”, “green”, “purple”. Defined by its angular position on a colour wheel or similar
Illuminant Incident luminous energy defined by its spectral distribution
Illuminant C CIE standard illuminant for tungsten illumination that simulates average daylight, bluish in colour, with colour temperature of 6774oK
Incandescent lamp A source in which light is produced by means of an element (e.g. a tungsten filament) heated to incandescence by the passage of an electric current
IWTO International Wool Textile Organisation, the international body that oversees the trading of wool, including the development of appropriate test methods
Lightness The attribute of visual perception where an object appears to emit or reflect more or less light
Monochromatic Light consisting of one wavelength
Nanometer (nm) Unit of length equal to 10-9 meter, a common unit for wavelengths
Near infrared reflectance
The technique of measuring the amount of electromagnetic radiation that is reflected by a material in the near infrared region
Opponent colours The three pairs of opponent colours – black/white, red/green and yellow/blue can be assigned mutually perpendicular axes which define a three dimensional colour space
Perception The acquiring of information about the external world by means of the senses
Photoreceptor The cone and rod shaped cells in the retina of the eye that are excited by visible wavelengths, then send signals to the brain where the sensation of colour is perceived
Primary colours The dominant regions of the visible spectrum: red, green and blue; and their opposite colours cyan, magenta and yellow
Reflectance The percentage of light that is reflected by an object
Reflection grating A glass plate ruled with finely-space parallel lines that enables incident light to be dispersed into its component colours (much as a compact disc does)

11 - 28 – WOOL472/572 Wool Biology and Metrology ©2009 The Australian Wool Education Trust licensee for educational activities University of New England
Saturation The attribute of colour perception that expresses the amount of departure from a neutral grey of the same lightness; also referred to as chroma
Shade (a) A colour produced by a dye or pigment, or (b) an expression of colour difference from a reference dyeing such that another dye must be added to produce a match
Shirley Analyser A small carding machine, originally developed for separating trash from a sample of cotton fibres and randomising the fibres
Spectral curve The ‘fingerprint’ of a colour – a graphical representation of a colour’s spectral data
Spectral data The most precise description of the colour of an object. The percentage of light is measured at close intervals across its spectrum of wavelengths and can be represented by a spectral curve
Spectrum Arrangement of electromagnetic energy in order of increasing (or decreasing) wavelength
Subtractive primaries Cyan, magenta and yellow. When all three are combined at 100% on white paper, black is produced
Tristimulus A method for communicating or generating a colour using three stimuli
Unscourable yellow Yellowness in a wool fleece that cannot be removed by scouring
Visible spectrum The region of the electromagnetic spectrum between 380 and 720 nm. Wavelengths in this range span the sensation of colour when viewed by the human eye
Wavelength Light is composed of electromagnetic waves; the wavelength is the distance between two successive peaks
White light Light that contains all wavelengths of the visible spectrum at uniform intensity – an ideal that cannot be achieved with most light sources
Yellowness The difference between the two tristimulus values Y-Z that numerically describes the level of creaminess or yellowness of wool
![DIALux4[1].0- · PDF filedialux 2 plugin. 1.X. plugin , plugin. luminaire selection Plugin plugin . home page, Intenet Explorer](https://img.pdfslide.us/doc/110x75/5a715aac7f8b9a98538cccda/dialux410-wwwpowerengineeringblogfacomssuacirkhadamatkarkonanarticlesbarghdialux4-learningpdfpdf.jpg)