Embed Size (px)
Citation preview

Leckie, R.M., Sigurdsson, H., Acton, G.D., and Draper, G. (Eds.), 2000Proceedings of the Ocean Drilling Program, Scientific Results, Vol. 165
11. HIGH-RESOLUTION, DOWNHOLE, AND NONDESTRUCTIVE CORE MEASUREMENTS FROM SITES 999 AND 1001 IN THE CARIBBEAN SEA: APPLICATION
TO THE LATE PALEOCENE THERMAL MAXIMUM1
Ursula Röhl2 and Lewis J. Abrams3
ABSTRACT
Pelagic sediments recording an extreme and short-lived global warming event, the Late Paleocene Thermal Maximum(LPTM), were recovered from Hole 999B (Colombian Basin) and Holes 1001A and 1001B (lower Nicaraguan Rise) in theCaribbean Sea during Ocean Drilling Program Leg 165. The LPTM consists of a 0.3–0.97 m calcareous claystone to claystonehorizon. High-resolution downhole logging (Formation MicroScanner [FMS]), standard downhole logs (resistivity, velocity,density, natural gamma ray, and geochemical log), and non-destructive chemical and physical property (multisensor core logger[MSCL] and X-ray fluorescence [XRF] core scanner) data were used to identify composite sections from parallel holes and torecord sedimentological and environmental changes associated with the LPTM.
Downhole logging data indicate an abrupt and distinct difference in physical and chemical properties that extend for tens ofmeters above and below the LPTM. These observations indicate a rapid environmental change at the LPTM, which persistsbeyond the LPTM anomaly. Comparisons of gamma-ray attenuation porosity evaluator (GRAPE) densities from MSCL log-ging on split cores with FMS resistivity values allows core-to-log correlation with a high degree of accuracy. High-resolutionmagnetic susceptibility measurements of the cores are compared with elemental concentrations (e.g., Fe, Ca) analyzed by high-resolution XRF scanning.
The high-resolution data obtained from several detailed core and downhole logging methods are the key to the constructionof composite sections, the correlation of both adjacent holes and distant sites, and core-log integration. These continuous-depthseries reveal the LPTM as a multiphase event with a nearly instantaneous onset, followed by a much different set of physicaland chemical conditions of short duration, succeeded by a longer transition to a new, more permanent set of environmental cir-cumstances. The estimated duration of these “phases” are consistent with paleontological and isotopic studies of the LPTM.
INTRODUCTION AND BACKGROUND
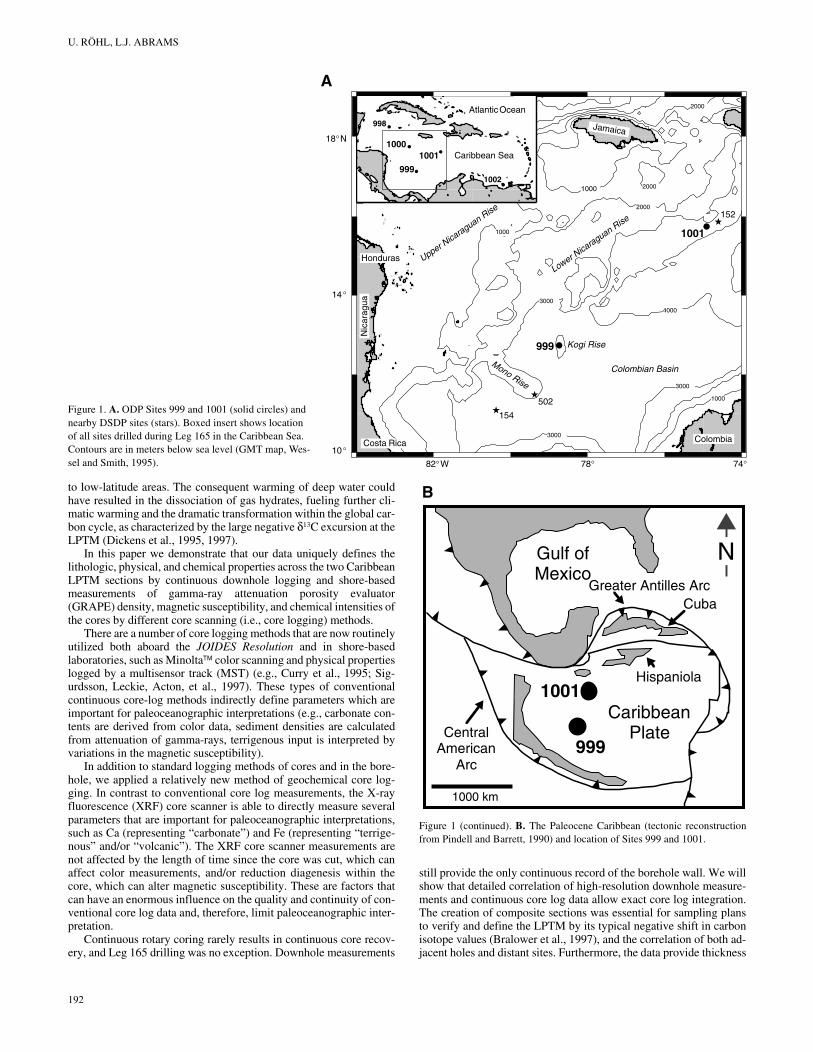
To infer paleoceanographic information from physical and chem-ical characteristics of sediment it is necessary to obtain the most con-tinuous and accurate measurements possible. Standard analyticalmethods for discrete samples are noncontinuous, time consuming,and expensive. Relatively fast core logging methods and certainhigh-resolution downhole measurements can now obtain continuousdata at much finer scales (down to millimeter scale) than are practicalfor individual sampling methods. In addition, logging methods arenondestructive and, in the case of downhole measurements, recorddata continuously over nonrecovered and recovered intervals of theborehole. These enormous advantages are important for the relativelylong Ocean Drilling Program (ODP) cores and especially for criticalboundaries, which were major objectives of Leg 165 (Fig. 1A).
One especially interesting and important paleoceanographic epi-sode sampled at two sites during Leg 165 is known as the Late Paleo-cene Thermal Maximum (LPTM) (Kennett and Stott, 1991; Zachos etal., 1993), which occurred approximately 55 Ma in the late PaleoceneEpoch. Figure 1B shows the location of drill sites in the Caribbean ofthe Paleocene. The LPTM represents a relatively short but most pro-nounced event of global warming and is associated with dramaticchanges in the biosphere and ocean circulation. Oxygen isotoperecords indicate a rapid (<10 k.y.) warming of high-latitude surfaceand deep waters (Kennett and Stott, 1991; Shackleton, 1986; Zachos
1Leckie, R.M., Sigurdsson, H., Acton, G.D., and Draper, G. (Eds.), 2000. Proc.ODP, Sci. Results, 165: College Station, TX (Ocean Drilling Program).
2Geosciences Department, Bremen University, P.O. Box 33 04 40, D-28334 Bre-men, Federal Republic of Germany. [email protected]
3Department of Earth Sciences, University of North Carolina at Wilmington, 601South College Road, Wilmington, NC 28403-3297 U.S.A.
et al., 1993). The large negative excursion of δ18O is coeval with alarge, short-term decrease in δ13C in both marine and terrestrialrecords and a major global extinction of benthic foraminifers (Kennettand Stott, 1991; Pak and Miller, 1992; Thomas and Shackleton,1996). The event is believed to have been associated with a temporarychange in dominant deep-water sources from high to low latitudes(Pak and Miller, 1992; Eldholm and Thomas, 1993). The resulting de-crease in dissolved oxygen content of warmer deep waters is likely themajor cause of the mass extinction of benthic foraminifers (Kennettand Stott, 1990, 1991; Thomas and Shackleton, 1996). Isotope excur-sions and the benthic faunal extinction occurred rapidly (<105 yr)(Kennett and Stott, 1991; Aubry et al., 1996), and isotope values andspecies richness returned to pre-excursion levels in ~50,000 yr (Ken-nett and Stott, 1991; Thomas and Shackleton, 1996). Prior to Leg 165,sediments documenting the LPTM were identified in deep sea se-quences of the Southern Oceans (Kennett and Stott, 1991), the IndianOcean (Zachos et al., 1992), the equatorial Pacific (Bralower et al.,1995), and the Atlantic (Pak and Miller, 1992; Thomas and Shackle-ton, 1996).
The long-term warming of the late Paleocene climate may be re-lated to elevated levels of atmospheric CO2, perhaps caused by thevoluminous CO2 degassing of the effusive eruptions from the NorthAtlantic igneous province (Eldholm and Thomas, 1993). However, itappears that only high latitudes warmed significantly, whereas equa-torial areas remained at much the same temperature as today(Shackleton and Boersma, 1981; Bralower et al., 1995). Bralower etal. (1997) proposed that a circum-Caribbean volcanic episode, docu-mented by abundant ash layers found interbedded within rocks con-taining the LPTM layer of Sites 999 and 1001, may have resulted inshort-term atmospheric cooling preferentially at low latitudes. Thispreferential cooling at low latitudes would act to decrease the differ-ence between high- and low-latitude sea-surface temperatures(SSTs), perhaps triggering a change of deep-water sources from high-
191
U. RÖHL, L.J. ABRAMS
Colombian Basin
999
1001
152
502
154
Honduras
Costa Rica
Caribbean Sea
Atlantic Ocean
999
10011000
998
1002
Kogi Rise
10°
14°
74°78°82°W
2000
1000
4000
3000
3000
2000
2000
1000
1000
18°N
Upper Nica
raguan Rise
3000
Mono Rise
Lower Nica
raguan Rise
Colombia
Nic
arag
ua
Jamaica
A
Figure 1. A. ODP Sites 999 and 1001 (solid circles) and nearby DSDP sites (stars). Boxed insert shows location of all sites drilled during Leg 165 in the Caribbean Sea. Contours are in meters below sea level (GMT map, Wes-sel and Smith, 1995).
to low-latitude areas. The consequent warming of deep water couldhave resulted in the dissociation of gas hydrates, fueling further cli-matic warming and the dramatic transformation within the global car-bon cycle, as characterized by the large negative δ13C excursion at theLPTM (Dickens et al., 1995, 1997).
In this paper we demonstrate that our data uniquely defines thelithologic, physical, and chemical properties across the two CaribbeanLPTM sections by continuous downhole logging and shore-basedmeasurements of gamma-ray attenuation porosity evaluator(GRAPE) density, magnetic susceptibility, and chemical intensities ofthe cores by different core scanning (i.e., core logging) methods.
There are a number of core logging methods that are now routinelyutilized both aboard the JOIDES Resolution and in shore-basedlaboratories, such as Minolta color scanning and physical propertieslogged by a multisensor track (MST) (e.g., Curry et al., 1995; Sig-urdsson, Leckie, Acton, et al., 1997). These types of conventionalcontinuous core-log methods indirectly define parameters which areimportant for paleoceanographic interpretations (e.g., carbonate con-tents are derived from color data, sediment densities are calculatedfrom attenuation of gamma-rays, terrigenous input is interpreted byvariations in the magnetic susceptibility).
In addition to standard logging methods of cores and in the bore-hole, we applied a relatively new method of geochemical core log-ging. In contrast to conventional core log measurements, the X-rayfluorescence (XRF) core scanner is able to directly measure severalparameters that are important for paleoceanographic interpretations,such as Ca (representing “carbonate”) and Fe (representing “terrige-nous” and/or “volcanic”). The XRF core scanner measurements arenot affected by the length of time since the core was cut, which canaffect color measurements, and/or reduction diagenesis within thecore, which can alter magnetic susceptibility. These are factors thatcan have an enormous influence on the quality and continuity of con-ventional core log data and, therefore, limit paleoceanographic inter-pretation.
Continuous rotary coring rarely results in continuous core recov-ery, and Leg 165 drilling was no exception. Downhole measurements
192
still provide the only continuous record of the borehole wall. We willshow that detailed correlation of high-resolution downhole measure-ments and continuous core log data allow exact core log integration.The creation of composite sections was essential for sampling plansto verify and define the LPTM by its typical negative shift in carbonisotope values (Bralower et al., 1997), and the correlation of both ad-jacent holes and distant sites. Furthermore, the data provide thickness
1000 km
CaribbeanPlate
Hispaniola
CubaGreater Antilles Arc
Gulf of Mexico
1001
999
N
CentralAmerican
Arc
B
Figure 1 (continued). B. The Paleocene Caribbean (tectonic reconstructionfrom Pindell and Barrett, 1990) and location of Sites 999 and 1001.
LATE PALEOCENE THERMAL MAXIMUM EVIDENCE
estimates of the LPTM claystone, time estimates of the onset andduration of the LPTM, and constraints on the occurrence and distribu-tion of associated ash layers. Together these observations further de-fine the dramatic oceanographic, climatic, and paleoenvironmentalchanges associated with the LPTM event.
METHODS
Core Logging
We used continuous measurements of physical properties of thecores: the MST aboard JOIDES Resolution (Sigurdsson, Leckie,Acton, et al., 1997) and the split core multisensor core logger (MSCL,GEOTEK, Surrey, UK; Weaver and Schultheiss, 1990; Gunn andBest, 1998) from the Geosciences Department of Bremen University,which we temporarily took to the Bremen ODP repository. TheMSCL includes instruments that measure magnetic susceptibility anddensity. Magnetic susceptibility data were collected at 1 cm intervalsusing a Bartington point sensor, which is more accurate for measur-ing half cores and gives much higher spatial resolution than the loopsensor. Densities were also determined from GRAPE measurementsrecorded at 1 cm intervals (Boyce, 1976).
Shipboard GRAPE density values (obtained by MST) do notmatch the magnitude of the shipboard wet bulk density data (indexproperties of individual samples) below 400 meters below seafloor(mbsf) at Site 999 (Sigurdsson, Leckie, Acton, et al., 1997). Thecores at these depths do not fill the liner because of the increased in-duration of the sediments. The gamma-ray attenuation processingaboard ship assumed a core diameter corresponding to a filled liner;therefore, the resulting GRAPE density values are too low (Sigurds-son, Leckie, Acton, et al., 1997). In order to compare shore-based andshipboard GRAPE measurements, the shore-based GRAPE densityvalues are normalized to the shipboard GRAPE density data.
The chemical element composition of the cored material was an-alyzed using a new XRF core scanner. The XRF core scanner is anon-destructive analysis system for scanning the surface of archivehalves of cores. The instrument was developed and built at the Neth-erlands Institute for Sea Research (NIOZ, Texel). The generalmethod and some calibration procedures are described by Jansen etal. (1998).
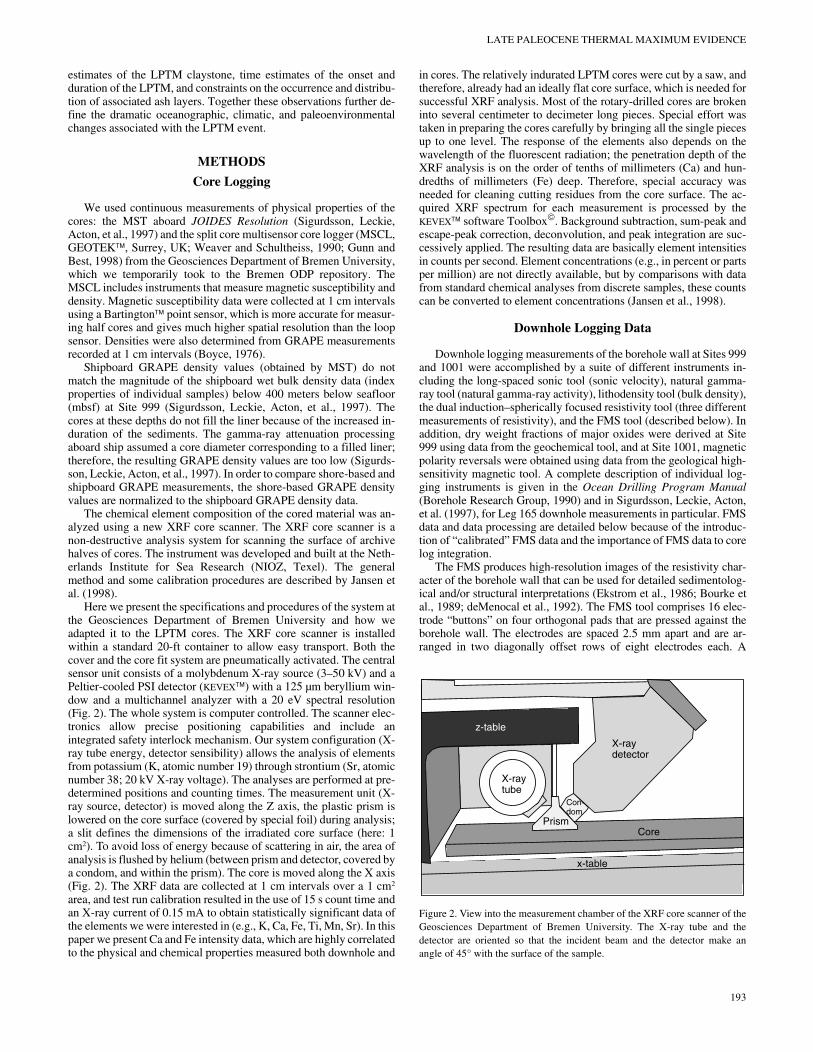
Here we present the specifications and procedures of the system atthe Geosciences Department of Bremen University and how weadapted it to the LPTM cores. The XRF core scanner is installedwithin a standard 20-ft container to allow easy transport. Both thecover and the core fit system are pneumatically activated. The centralsensor unit consists of a molybdenum X-ray source (3–50 kV) and aPeltier-cooled PSI detector (KEVEX) with a 125 µm beryllium win-dow and a multichannel analyzer with a 20 eV spectral resolution(Fig. 2). The whole system is computer controlled. The scanner elec-tronics allow precise positioning capabilities and include anintegrated safety interlock mechanism. Our system configuration (X-ray tube energy, detector sensibility) allows the analysis of elementsfrom potassium (K, atomic number 19) through strontium (Sr, atomicnumber 38; 20 kV X-ray voltage). The analyses are performed at pre-determined positions and counting times. The measurement unit (X-ray source, detector) is moved along the Z axis, the plastic prism islowered on the core surface (covered by special foil) during analysis;a slit defines the dimensions of the irradiated core surface (here: 1cm2). To avoid loss of energy because of scattering in air, the area ofanalysis is flushed by helium (between prism and detector, covered bya condom, and within the prism). The core is moved along the X axis(Fig. 2). The XRF data are collected at 1 cm intervals over a 1 cm2
area, and test run calibration resulted in the use of 15 s count time andan X-ray current of 0.15 mA to obtain statistically significant data ofthe elements we were interested in (e.g., K, Ca, Fe, Ti, Mn, Sr). In thispaper we present Ca and Fe intensity data, which are highly correlatedto the physical and chemical properties measured both downhole and
in cores. The relatively indurated LPTM cores were cut by a saw, andtherefore, already had an ideally flat core surface, which is needed forsuccessful XRF analysis. Most of the rotary-drilled cores are brokeninto several centimeter to decimeter long pieces. Special effort wastaken in preparing the cores carefully by bringing all the single piecesup to one level. The response of the elements also depends on thewavelength of the fluorescent radiation; the penetration depth of theXRF analysis is on the order of tenths of millimeters (Ca) and hun-dredths of millimeters (Fe) deep. Therefore, special accuracy wasneeded for cleaning cutting residues from the core surface. The ac-quired XRF spectrum for each measurement is processed by theKEVEX software Toolbox. Background subtraction, sum-peak andescape-peak correction, deconvolution, and peak integration are suc-cessively applied. The resulting data are basically element intensitiesin counts per second. Element concentrations (e.g., in percent or partsper million) are not directly available, but by comparisons with datafrom standard chemical analyses from discrete samples, these countscan be converted to element concentrations (Jansen et al., 1998).
Downhole Logging Data
Downhole logging measurements of the borehole wall at Sites 999and 1001 were accomplished by a suite of different instruments in-cluding the long-spaced sonic tool (sonic velocity), natural gamma-ray tool (natural gamma-ray activity), lithodensity tool (bulk density),the dual induction–spherically focused resistivity tool (three differentmeasurements of resistivity), and the FMS tool (described below). Inaddition, dry weight fractions of major oxides were derived at Site999 using data from the geochemical tool, and at Site 1001, magneticpolarity reversals were obtained using data from the geological high-sensitivity magnetic tool. A complete description of individual log-ging instruments is given in the Ocean Drilling Program Manual(Borehole Research Group, 1990) and in Sigurdsson, Leckie, Acton,et al. (1997), for Leg 165 downhole measurements in particular. FMSdata and data processing are detailed below because of the introduc-tion of “calibrated” FMS data and the importance of FMS data to corelog integration.
The FMS produces high-resolution images of the resistivity char-acter of the borehole wall that can be used for detailed sedimentolog-ical and/or structural interpretations (Ekstrom et al., 1986; Bourke etal., 1989; deMenocal et al., 1992). The FMS tool comprises 16 elec-trode “buttons” on four orthogonal pads that are pressed against theborehole wall. The electrodes are spaced 2.5 mm apart and are ar-ranged in two diagonally offset rows of eight electrodes each. A
Core
X-raydetector
X-raytube
z-table
x-table
Prism
Con-dom
Figure 2. View into the measurement chamber of the XRF core scanner of theGeosciences Department of Bremen University. The X-ray tube and thedetector are oriented so that the incident beam and the detector make anangle of 45° with the surface of the sample.
193
U. RÖHL, L.J. ABRAMS
focused electrical current flows between electrodes and variations incurrent intensity are measured. These measurements reflect resistivityvariations, are recorded every 0.25 cm, have a 0.5 cm vertical resolu-tion, and have a maximum penetration depth of 25 cm. In contrast,conventional downhole measurements are recorded every 15 cm andhave vertical resolutions ranging from 15 cm to 2 m (deMenocal et al.,1992). Thus, the sampling rate for FMS is 60 times greater than con-ventional logs, with resolution capabilities 30–400 times greater thanconventional logs. This fine-scale resolution makes FMS the down-hole measurement that is most comparable in scale to measurementsmade on whole core and individual samples, as well as providingvisual comparisons to core photographs.
The FMS tool string contains a general purpose inclinometry tool(GPIT) that orients the measurements relative to magnetic norththrough the use of a magnetometer and records variation in upholespeed through the use of an accelerometer. Standard processing uti-lizes information from the GPIT and converts variations in currentintensity as recorded on 16 individual electrodes on each pad intospatially oriented, variable-intensity color or gray-scale images of theborehole wall. The FMS images reveal relative variations in boreholeresistivity but do not provide a direct quantitative value of formationresistivity.
Resistivity in this environment is primarily controlled by electro-lytic conduction of pore fluids and/or cation exchange on the surfacesof clays and other conductive minerals (Bourke et al., 1989). Thus,images of resistivity variations reflect changing chemical and physi-cal properties of the borehole such as porosity, mineralogy, indura-tion, grain size, and chemistry of pore fluids.
The standard presentation of FMS data as variable-intensity gray-scale images are often visually similar to split cores or black andwhite photographs of the cores. Although visual correlations can bestriking, they can not easily be quantitatively interpreted. In addition,all other core measurements are presented as a digital depth series ofdiscrete data values, which are not always easily correlated to gray-scale images. In order to expand the use of FMS data as a linkbetween core and all other discrete measurements, FMS relative re-sistivities are scaled to the absolute resistivity measured with theshallow spherically focused resistivity log (SFLU), and a digitaldepth series of scaled FMS resistivity values are extracted.
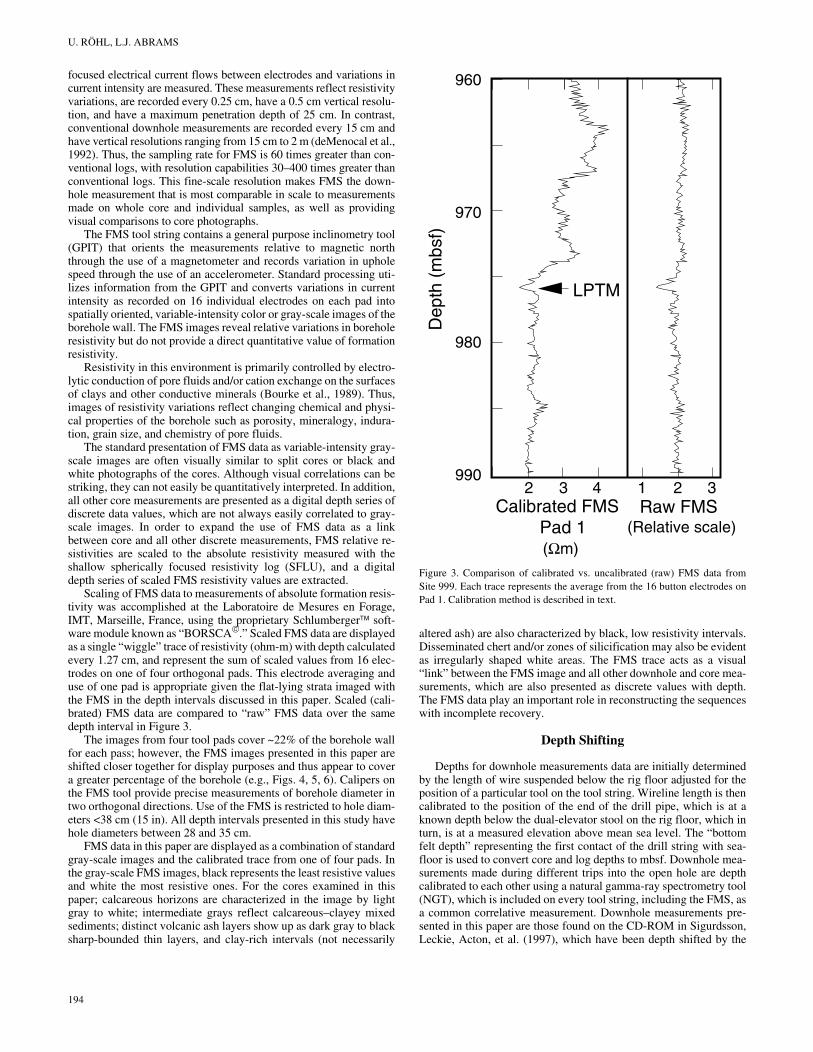
Scaling of FMS data to measurements of absolute formation resis-tivity was accomplished at the Laboratoire de Mesures en Forage,IMT, Marseille, France, using the proprietary Schlumberger soft-ware module known as “BORSCA.” Scaled FMS data are displayedas a single “wiggle” trace of resistivity (ohm-m) with depth calculatedevery 1.27 cm, and represent the sum of scaled values from 16 elec-trodes on one of four orthogonal pads. This electrode averaging anduse of one pad is appropriate given the flat-lying strata imaged withthe FMS in the depth intervals discussed in this paper. Scaled (cali-brated) FMS data are compared to “raw” FMS data over the samedepth interval in Figure 3.
The images from four tool pads cover ~22% of the borehole wallfor each pass; however, the FMS images presented in this paper areshifted closer together for display purposes and thus appear to covera greater percentage of the borehole (e.g., Figs. 4, 5, 6). Calipers onthe FMS tool provide precise measurements of borehole diameter intwo orthogonal directions. Use of the FMS is restricted to hole diam-eters <38 cm (15 in). All depth intervals presented in this study havehole diameters between 28 and 35 cm.
FMS data in this paper are displayed as a combination of standardgray-scale images and the calibrated trace from one of four pads. Inthe gray-scale FMS images, black represents the least resistive valuesand white the most resistive ones. For the cores examined in thispaper; calcareous horizons are characterized in the image by lightgray to white; intermediate grays reflect calcareous–clayey mixedsediments; distinct volcanic ash layers show up as dark gray to blacksharp-bounded thin layers, and clay-rich intervals (not necessarily
194
altered ash) are also characterized by black, low resistivity intervals.Disseminated chert and/or zones of silicification may also be evidentas irregularly shaped white areas. The FMS trace acts as a visual“link” between the FMS image and all other downhole and core mea-surements, which are also presented as discrete values with depth.The FMS data play an important role in reconstructing the sequenceswith incomplete recovery.
Depth Shifting
Depths for downhole measurements data are initially determinedby the length of wire suspended below the rig floor adjusted for theposition of a particular tool on the tool string. Wireline length is thencalibrated to the position of the end of the drill pipe, which is at aknown depth below the dual-elevator stool on the rig floor, which inturn, is at a measured elevation above mean sea level. The “bottomfelt depth” representing the first contact of the drill string with sea-floor is used to convert core and log depths to mbsf. Downhole mea-surements made during different trips into the open hole are depthcalibrated to each other using a natural gamma-ray spectrometry tool(NGT), which is included on every tool string, including the FMS, asa common correlative measurement. Downhole measurements pre-sented in this paper are those found on the CD-ROM in Sigurdsson,Leckie, Acton, et al. (1997), which have been depth shifted by the
Dep
th (
mbs
f)
960
970
980
9902 3 4 1 32
LPTM
Calibrated FMS
(Ωm) Pad 1
Raw FMS(Relative scale)
Figure 3. Comparison of calibrated vs. uncalibrated (raw) FMS data fromSite 999. Each trace represents the average from the 16 button electrodes onPad 1. Calibration method is described in text.
LA
TE
PA
LE
OC
EN
E T
HE
RM
AL
MA
XIM
UM
EV
IDE
NC
E
195
970
980
FMSNatural gamma ra
(API)
8 10O3
%)
7.5SiO2
(wt%)
12.5 37.5FeO
(wt%)
1.25 3.75
Dep
th (
mbs
f)
960
970
980
990
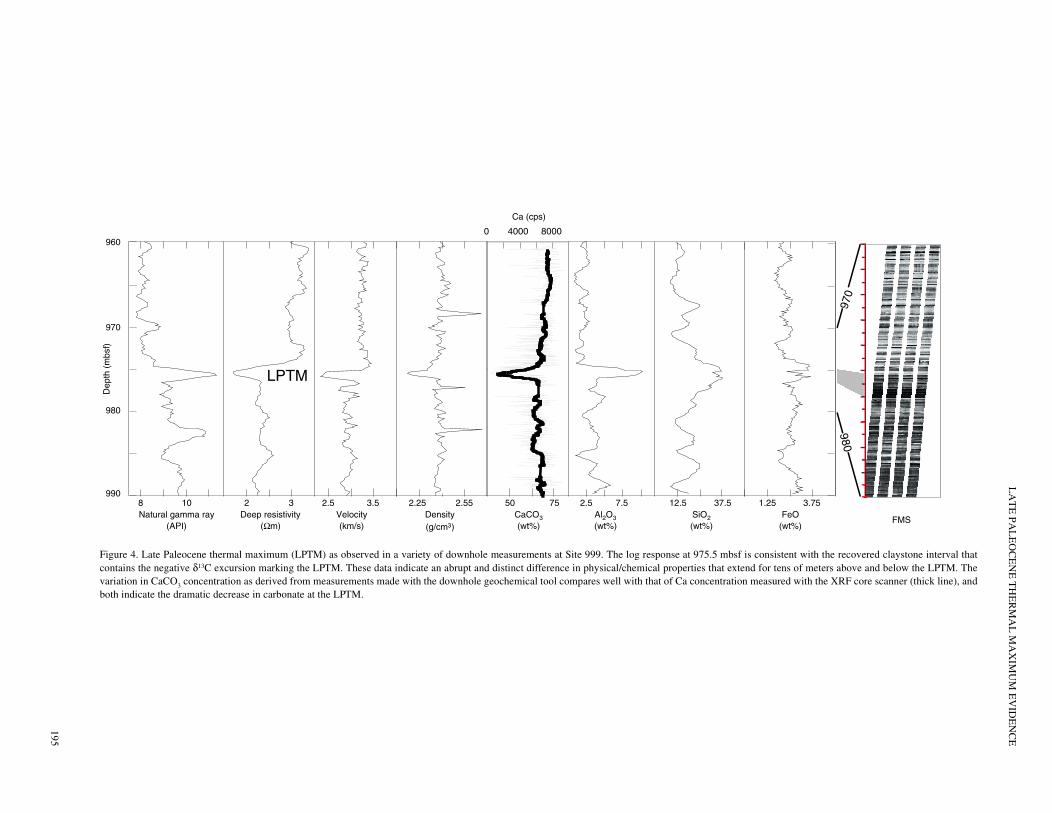
Figure 4. Late Paleocene The log response at 975.5 mbsf is consistent with the recovered claystone interval thatcontains the negative δ13C cal/chemical properties that extend for tens of meters above and below the LPTM. Thevariation in CaCO3 conce ell with that of Ca concentration measured with the XRF core scanner (thick line), andboth indicate the dramati
y2 2.5 2.25 50
Deep resistivity(Ωm)
3Velocity (km/s)
3.5Density (g/cm3)
2.55CaCO3
(wt%)
75Al2(wt
2.5
LPTM
0 4000 8000
Ca (cps)
thermal maximum (LPTM) as observed in a variety of downhole measurements at Site 999. excursion marking the LPTM. These data indicate an abrupt and distinct difference in physi
ntration as derived from measurements made with the downhole geochemical tool compares wc decrease in carbonate at the LPTM.
U. RÖHL, L.J. ABRAMS
974
975
976
977
Dep
th (
mbs
f)
Pad 1
FMS image Pad 1 FMS (Ωm)
GRAPE density (g/cm3)
Iron (cps)
Magnet. suscept. (SI)
δ 13C Calcium (cps)
0 +21 1.5 2 2.5 3 1.4 1.8 0 4000 100 2004000 8000 -10 -6
Ash 1Ash 2
Ash 3 LPT
M in
terv
al
LPT
M c
lay
(‰)Coreimage
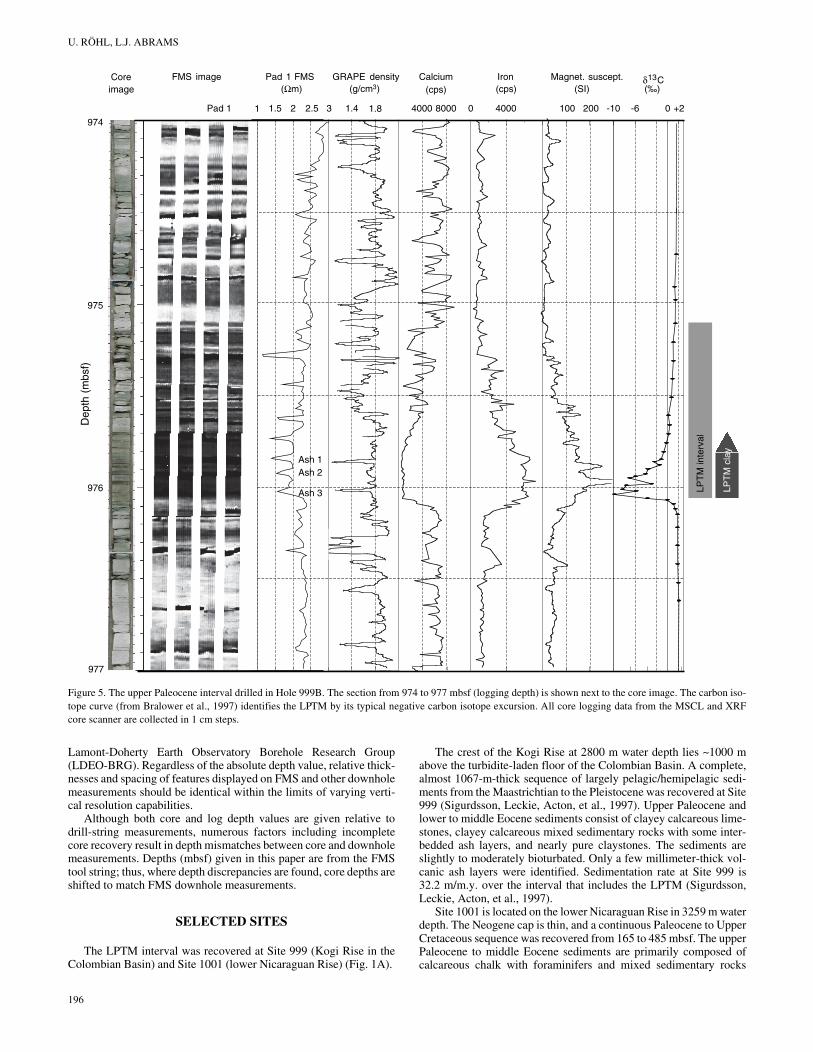
Figure 5. The upper Paleocene interval drilled in Hole 999B. The section from 974 to 977 mbsf (logging depth) is shown next to the core image. The carbon iso-tope curve (from Bralower et al., 1997) identifies the LPTM by its typical negative carbon isotope excursion. All core logging data from the MSCL and XRFcore scanner are collected in 1 cm steps.
Lamont-Doherty Earth Observatory Borehole Research Group(LDEO-BRG). Regardless of the absolute depth value, relative thick-nesses and spacing of features displayed on FMS and other downholemeasurements should be identical within the limits of varying verti-cal resolution capabilities.
Although both core and log depth values are given relative todrill-string measurements, numerous factors including incompletecore recovery result in depth mismatches between core and downholemeasurements. Depths (mbsf) given in this paper are from the FMStool string; thus, where depth discrepancies are found, core depths areshifted to match FMS downhole measurements.
SELECTED SITES
The LPTM interval was recovered at Site 999 (Kogi Rise in theColombian Basin) and Site 1001 (lower Nicaraguan Rise) (Fig. 1A).
196
The crest of the Kogi Rise at 2800 m water depth lies ~1000 mabove the turbidite-laden floor of the Colombian Basin. A complete,almost 1067-m-thick sequence of largely pelagic/hemipelagic sedi-ments from the Maastrichtian to the Pleistocene was recovered at Site999 (Sigurdsson, Leckie, Acton, et al., 1997). Upper Paleocene andlower to middle Eocene sediments consist of clayey calcareous lime-stones, clayey calcareous mixed sedimentary rocks with some inter-bedded ash layers, and nearly pure claystones. The sediments areslightly to moderately bioturbated. Only a few millimeter-thick vol-canic ash layers were identified. Sedimentation rate at Site 999 is32.2 m/m.y. over the interval that includes the LPTM (Sigurdsson,Leckie, Acton, et al., 1997).
Site 1001 is located on the lower Nicaraguan Rise in 3259 m waterdepth. The Neogene cap is thin, and a continuous Paleocene to UpperCretaceous sequence was recovered from 165 to 485 mbsf. The upperPaleocene to middle Eocene sediments are primarily composed ofcalcareous chalk with foraminifers and mixed sedimentary rocks
LATE PALEOCENE THERMAL MAXIMUM EVIDENCE
1 1.5D
epth
(m
bsf
)238
239
240
241
242
0.8 1.2 1.6Pad 4
A
B
A
A
B
A
I
J
K
H
G
F
E
LPTM LP
TM
inte
rval
LP
TM
cla
y
800040000 0 2000 4000 2-1 0 1
LPTM
50 150 2500
NOT RECOVERED
FMS Image Pad 4 FMS(Ω m)
HoleA/B
GRAPE(g/cm3)
Calcium(cps)
Magn. susc.(SI)
Iron(cps)
δ 13C(‰)
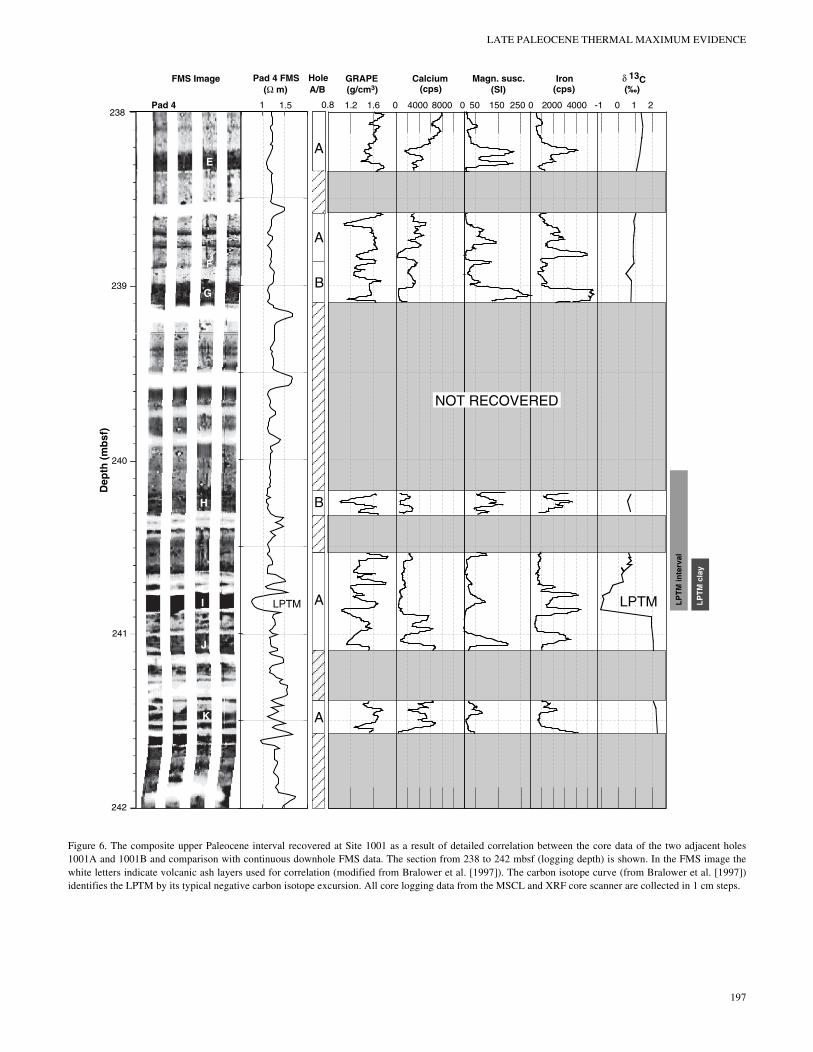
Figure 6. The composite upper Paleocene interval recovered at Site 1001 as a result of detailed correlation between the core data of the two adjacent holes1001A and 1001B and comparison with continuous downhole FMS data. The section from 238 to 242 mbsf (logging depth) is shown. In the FMS image thewhite letters indicate volcanic ash layers used for correlation (modified from Bralower et al. [1997]). The carbon isotope curve (from Bralower et al. [1997])identifies the LPTM by its typical negative carbon isotope excursion. All core logging data from the MSCL and XRF core scanner are collected in 1 cm steps.
197
U. RÖHL, L.J. ABRAMS
with clay and minor chert and volcanic ash layers. Sedimentation ratefor the latest Paleocene and earliest Eocene interval is 37.4 m/m.y.(Sigurdsson, Leckie, Acton, et al., 1997). The upper Paleocene sedi-ments at Site 1001 are characterized by more pronounced pure lime-stone or claystone end members, whereas at Site 999, the sedimentsare generally dominated by the mixed clayey calcareous sedimenttypes and pure end members are less represented.
Benthic foraminifer assemblages indicate a lower-bathyal toupper-abyssal (1500–2500 m) late Paleocene water depth for Site999; and Site 1001 was toward the lower end of this range. Paleomag-netic studies indicate that both sites were closer to the equator in thelate Paleocene (~10°N) (Sigurdsson, Leckie, Acton, et al., 1997;Acton et al., Chap. 9, this volume) and Site 999 was more proximalto the Central American Arc (Fig. 1B).
These sites provide a unique data set for examining lithologicvariability around the LPTM and the relationship to physical andchemical properties determined by logging. Prior to Legs 165 and171B the majority of drill sites penetrating upper Paleocene sectionseither did not obtain any downhole logging data (e.g., Sites 690 and865) or very limited downhole data in high latitude and shallowmarine environments. For example, only natural gamma-ray down-hole logs for the Paleocene–Eocene interval were described for a wellin the North Sea by Knox (1996) and Neal (1996). In contrast to mostother deep-sea sites sampling this interval, sediments and logs ob-tained from Holes 999B, 1001A, and 1001B provide a completerecord of the LPTM, and along with Site 865 in the Western Pacificand Leg 171B sites in the Western Atlantic, also provide relativelyrare high-resolution records of low-latitude deep-sea Paleogenestratigraphy (e.g., Bralower et al., 1995; Norris, Kroon, Klaus, et al.,1998).
Because of the relatively wide lithologic range consisting of theend members: nannofossil foraminifer limestones, clays, and volca-nic ashes, and in combination with the incomplete recovery, we un-dertook a high-resolution investigation of physical and chemicalproperties of both the recovered cores and of the borehole wall usingstandard and high-resolution downhole logs. The LPTM interval inthe cores of Holes 999B, 1001A, and 1001B consists of 0.3–0.97-m-thick clay-rich horizons with significantly lower carbonate contentscompared to the surrounding chalks, limestones, and clayey calcare-ous mixed sediments with some ash layers (Sigurdsson, Leckie,Acton, et al., 1997). Because of the high burial depth (~975 mbsf), theLPTM cores of Hole 999B are relatively lithified (porosity of 22%–27.5%, P-wave velocity of 3.1–3.5 km/s) and contain less water (8.5–11.8 wt% water). The LPTM Cores 165-1001A-27R and 165-1001B-6R, drilled on the Lower Nicaraguan Rise at 235–242 mbsf, contain25–31 wt% water and still have 50%–61% porosity (Sigurdsson,Leckie, Acton, et al., 1997).
RESULTS
Site 999
Downhole Measurements
Downhole measurements reveal a distinct anomaly centered at~975.5 mbsf, which consists of local maxima in total gamma-raycounts, SiO2, Al2O3, and FeO, with local minima in sonic velocity,density, resistivity, and CaCO3 values (Fig. 4). These co-varying ex-treme logging values extend for less than a meter. There is also a dis-tinct change in mean log values below and above the anomaly (e.g.,natural gamma ray, resistivity, velocity, Al2O3). This abrupt changein logging values extends uniformly for 10–15 m above and belowthe anomaly.
The FMS image reveals a 97-cm-thick interval (975.09–976.06mbsf; Figs. 4, 5) of relatively low resistivities (dark gray–black). Theanomaly in standard downhole logs is centered on this interval
198
(~975.5 mbsf; Fig. 4). The darkest area (lowest resistivity) in theFMS image from 975.69 to 976.06 mbsf (37 cm thick) lies at the baseof this generally low resistivity zone.
The calibrated FMS resistivity curve reveals a 1.5–2.0 m transi-tion zone between the minimum resistivity values (<2 ohm-m) at thelog anomaly, which grade up to greater than 3.0 ohm-m at ~974 mbsfwithout returning to pre-anomaly values (Fig. 5). The calibrated FMSresistivity curve also shows four distinct minima within the 37-cm-thick, low resistivity zone.
Core Logs
Two characteristic low GRAPE density peaks were identified at975.85 and 976.02 mbsf within a narrow zone of nearly constant den-sity from 975.6 to 976.25 mbsf (Fig. 5). The density values above andbelow this zone show much more variability, especially the overlyinginterval.
The calcium intensities (in cps) reflect the relative variation ofthis element. The Ca intensities are relatively constant from 976.06to 977 mbsf. An abrupt decrease is at 976.05 mbsf, and a transitionalzone back to higher values starts at 975.8 mbsf (Fig. 5). Both theGRAPE density data and the Ca intensities are more variable above975.6 mbsf than below 976.2 mbsf. The iron intensities (Fe, cps) arenegatively correlated to the calcium values. Between 976.06 and 977mbsf there are more variations in the Fe intensities than within the in-terval characterized by low-Ca intensities. Three Fe intensity peaksare at 975.85, 975.94, and 976.05 mbsf; the sharp peak at 975.94mbsf is the most prominent one. The magnetic susceptibility valuesgenerally correlate well with the Fe intensities (Fig. 5). Sharp peaksare easy to identify at 975.94 and 976.05 mbsf.
Core Log Integration and Interpretation
The correlation of core data to downhole measurements is essen-tial for holes with incomplete recovery. Fortunately, at Site 999 morethan three quarters of the drilled hole is represented by cores (76.1%overall and 87.7% over the LPTM interval). Log-to-core correlationsfor the LPTM interval at Site 999 are most easily obtained by firstmatching the general character of the largest anomaly in the datafrom downhole measurements to core-log measurements and inter-preting the logging response in terms of varying lithology and poros-ity.
The co-varying, extreme downhole logging values that extend forless than a meter at ~975.5 mbsf (Fig. 4) are indicative of a much lessindurated zone with relatively high clay content. A significant anom-aly is also apparent in the core log data. The minimum in Ca countscorrespond to maxima in Fe counts and magnetic susceptibility. Thisresponse is also indicative of a carbonate-poor, clay-rich interval(original core depth = 975.23–975.65 mbsf). It is clear that there is adramatic anomaly in measurements common to both downhole andcore logs (e.g., CaCO3 vs. Ca, FeO vs. Fe; Fig. 4) as well as co-varying measurements (e.g., high Fe counts and gamma-ray countsboth responding to increased clay content). The nearly identicalmatch in downhole log depth and core depth makes this an unequiv-ocal correlation. In general, all these logging responses are consistentwith the recovery of a claystone layer (975.15–975.7 mbsf coredepth) within bioturbated, clayey, calcareous, mixed sediment (Sig-urdsson, Leckie, Acton, et al., 1997).
Both the core logs and downhole logs show that an abrupt litho-logic, physical, and chemical transition occurred in association withthe recovered claystone. The identification of this claystone as theLPTM claystone is confirmed by shipboard biostratigraphy and,more critically, by the distinct negative δ13C excursion that character-izes the LPTM at other drill sites worldwide (Bralower et al., 1997).The LPTM claystone (or LPTM clay) is defined as the interval con-taining the anomalous δ13C minima. The δ13C anomaly has an abrupt
LATE PALEOCENE THERMAL MAXIMUM EVIDENCE
onset as it does at other sites, and this marks the base of the LPTMclay. The depth of the LPTM clay base is most accurately determinedby the FMS in cases where recovery is not 100% and is well definedat 976.06 mbsf by the abrupt onset of low resistivities (Figs. 4, 5).Thus, core log depths are shifted by 40 cm to align the onset of corelog anomalies (e.g., Ca, Fe) and the δ13C anomaly to the base of theFMS-defined LPTM claystone interval.
The generally good correlation between GRAPE density, carbon-ate content (Ca, cps), and high FMS resistivity reflects moreindurated, less porous nature of the higher carbonate sediment. In con-trast, the correlation of iron intensities, magnetic susceptibility, andlower FMS resistivity characterizes the relatively soft, highly porous,clayey sediments with relatively high amounts of pore water.
The LPTM anomaly in standard downhole logs is centered on the97-cm-thick zone (975.09–976.06 mbsf, Fig. 5) of relatively lowFMS resistivity, and encompasses the 55-cm-thick claystone recov-ered in core interval 165-999B-51R-5, 75–150 cm (Sigurdsson,Leckie, Acton, et al., 1997). In addition, XRF Ca and Fe counts re-main both below and above pre-LPTM levels throughout this inter-val, respectively. The darkest area (lowest resistivity) in the FMS im-age from 975.69 to 976.06 mbsf (37 cm thick) lies at the base of thisgenerally low-resistivity zone and correlates to the negative δ13C ex-cursion, Ca minimum, Fe and magnetic susceptibility maximum, andan interval of less variable GRAPE density values (Fig. 5).
The nearly constant minimum Ca intensities and maximum Fe in-tensities, as well as the extreme δ13C values extend over an ~25 cminterval. Thus, we define the thickness of the LPTM clay as 25–37 cmat the base of a broader region (97 cm) referred to as the LPTM inter-val where carbonate content remains relatively low. The LPTM con-sists of a greenish gray, partly fine-laminated claystone (see core im-age, Fig. 5). Comparison with shipboard carbonate data obtainedfrom analyses of discrete samples (Sigurdsson, Leckie, Acton, et al.,1997 and Bralower et al., 1997) with measured Ca intensity varia-tions of ~200 to >8000 cps reflect carbonate contents from <0.5% (inthe LPTM clay) to up to 68% CaCO3 (in the post-LPTM interval).The abrupt onset of the FMS resistivity anomaly followed by a tran-
sition zone is similar to the pattern displayed by Ca, Fe, and magneticsusceptibility values (Figs. 4, 5).
Macroscopically we identified three mm-thick ash layers withinthe LPTM clay (layers “Ash 1” to “Ash 3” in fig. 5 of Bralower et al.,1997). The calibrated FMS resistivity curve shows four distinct min-ima within the LPTM claystone. Three of these minima are inter-preted to be caused by the three observed mm-thick volcanic ash lay-ers with characteristic low resistivity values. The local maxima ingamma-ray counts marking the LPTM anomaly is dominated by largeconcentrations of thorium (rather than potassium or uranium), whichsupports a volcanic contribution to the claystone. These low-resistiv-ity “ash peaks” of the FMS curve have counterparts in the GRAPEdensity, magnetic susceptibility, and iron intensity curves. The twominima in GRAPE density appear correlated to “Ash 3” and “Ash 1.”In the Fe intensity and magnetic susceptibility curves we identified allthree ash layers: “Ash 3" is more pronounced in the Fe and “Ash 2”and “Ash 1” in the magnetic susceptibility curve. The fourth resistiv-ity minima in the FMS resistivity curve at 975.75 mbsf may indicatea fourth ash layer, which is not lithologically apparent in the cores.
Site 1001Downhole Measurements
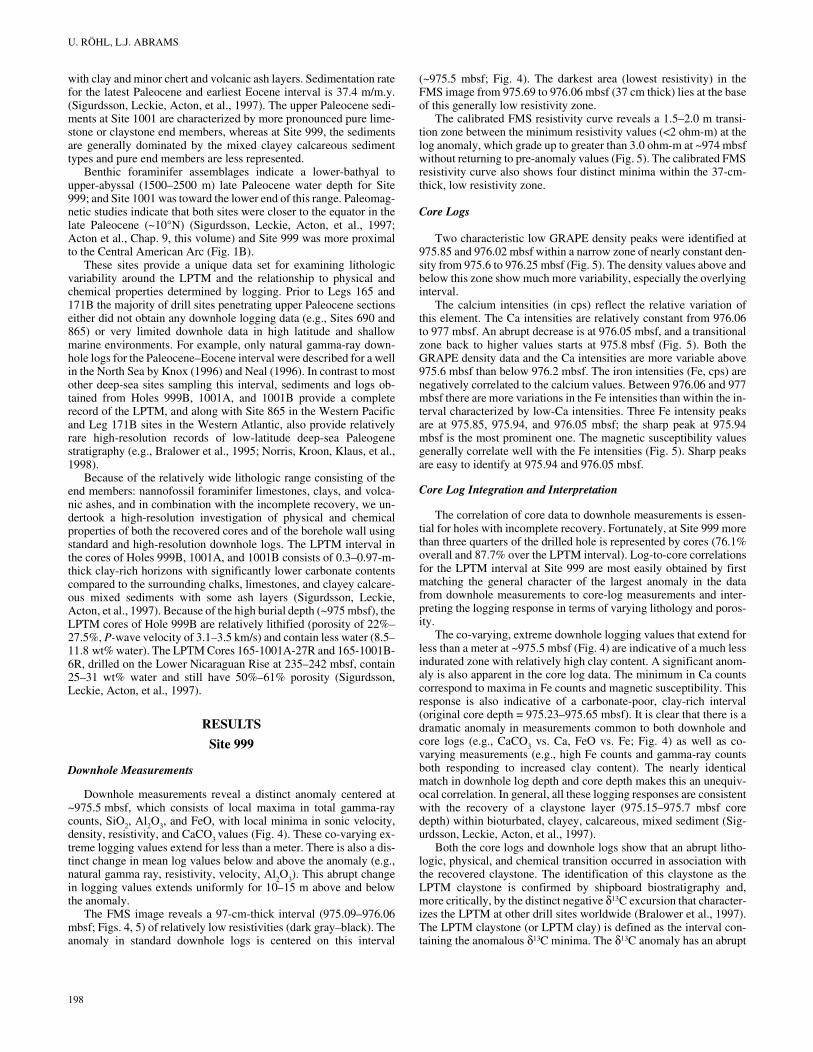
Downhole measurements (note: geochemical data were not col-lected at Site 1001) reveal a relatively broad and less distinct anom-aly compared to that observed at Site 999. The anomaly is best repre-sented by a maximum in natural gamma-ray counts and minimumsonic velocity and FMS resistivity (Fig. 7) and is centered at ~240–241 mbsf.
The absolute minimum in FMS resistivity represented by thedarkest area in the FMS image extends for only 9.2 cm, from 240.775to 240.864 mbsf (Fig. 6). The broad anomaly in standard downholelogs is centered on this interval (~240.8 mbsf, Fig. 7).
The calibrated FMS resistivity curve displays distinctly differentmean values below and above the anomaly (Fig. 7) and these trendsextend uniformly for 10–15 m. In addition, the calibrated FMS resis-
Natural Gamma Ray(API)
10 15 2.0Velocity (km/s)
2.25FMS
1.25 1.75
Chron 24rend
53.347 Ma212.2 mbsf
Chron 24ronset
55.904 Ma254.4 mbsf
LPTM Clay onset240.86 mbsf55.542 Ma
210
220
230
240
250
Dep
th (
mbs
f)
(Ωm)
Figure 7. Late Paleocene thermal maximum (LPTM) as observed in selected downhole measurements at Site 1001. The log response at 240.8 mbsf is consistent with the recovered claystone interval that contains the nega-tive δ13C excursion marking the LPTM. The location of onset and termination of magnetochron C24r is also determined by downhole measurements (i.e., GHMT, V. Louvel and B. Galbrun, unpubl. data). The best estimate for the onset of the LPTM is 55.542 Ma, assuming a sed-imentation rate of 37.4 m/m.y. based on nannofossil iden-tification (Sigurdsson, Leckie, Acton, et al., 1997) and employing the Cande and Kent (1995) time scale. Note the distinct difference in resistivity above and below the LPTM and the short transition to lower resistivities prior to the LPTM.
199
U. RÖHL, L.J. ABRAMS
tivity curve reveals a 3-m-long transition prior to the anomaly ratherthan post-LPTM as observed at Site 999 (Fig. 5).
Core Logs
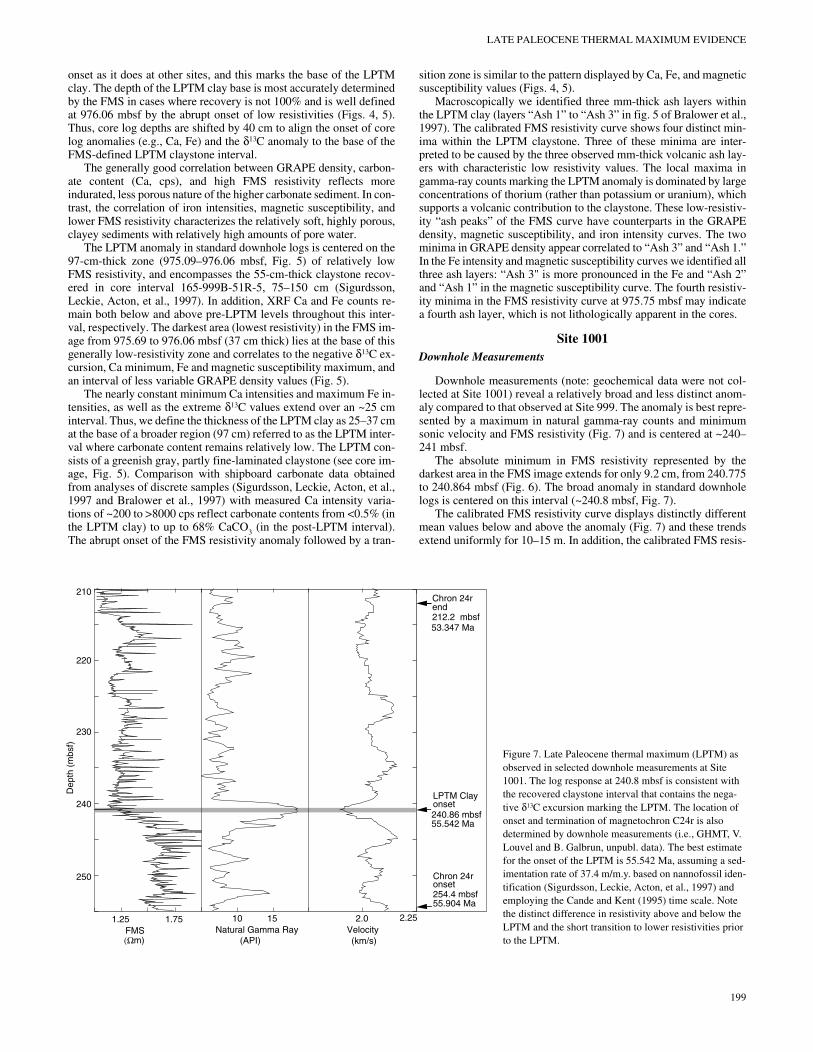
The magnetic susceptibility and the calcium intensity curves forboth LPTM Cores 165-1001A-27R and 165-1001B-6R are negativelycorrelated (Fig. 8). In general, the magnetic susceptibility values arerelatively low, but some zones have magnetic susceptibility values upto 200 SI. The calcium intensities show a range from ~100 to 10,000cps. The highest Ca intensity values found between 239.45 and240.3 mbsf of Section 165-1001A-27R-3 could not be identified inCore 165-1001B-6R. The core data from 238.55 to 239.45 mbsf inHole 1001A and 237.8 to 238.4 mbsf in Hole 1001B show generallylow Ca intensities and higher susceptibility values.
Core Correlation and Core Log Integration
Core recovery at Site 1001 was considerably poorer than at Site999 (54.7% in Hole 1001A, 66.8% in Hole 1001B). The cores cover-ing the LPTM interval in Holes 1001A and 1001B are only 5.34 m(55% recovery) and 4.23 m long (44% recovery), respectively. Thecorrelation of core data to downhole measurements is essential forreconstructing a single section from two adjacent cores in holes withsuch poor recovery. Reconstruction of a more complete section fromHoles 1001A and 1001B was accomplished using FMS, core log data,and matching of distinguishing features, such as ash layers. Log-to-core correlations for the LPTM interval in particular are initiated byidentifying log responses that distinguished the LPTM so clearly atSite 999.
The logging response in the upper Paleocene–lower Eocene por-tion of Hole 1001A can be interpreted in terms of the varying propor-tions of the primary constituents in the recovered samples (i.e., clay,chalk, chert, and varying amounts of volcanic ash) and to their rela-tive porosities. The poor recovery is probably related to the generallyhigher frequency of lithologic alternations and the presence of chertinterbedded with much less indurated material (i.e., clay rather thanclaystone, chalk rather than limestone). The magnetic susceptibilityis generally low because of the relatively high carbonate content (upto 82.9%, Bralower et al., 1997), but the more clayey intervals, theLPTM clay, and altered volcanic ash horizons show magnetic sus-ceptibility maxima. The wide variety of different lithologies rangingfrom pure limestones to pure claystones with transitional mixed sed-iment types is mirrored by the large range of Ca and Fe intensities andis apparent on the FMS image.
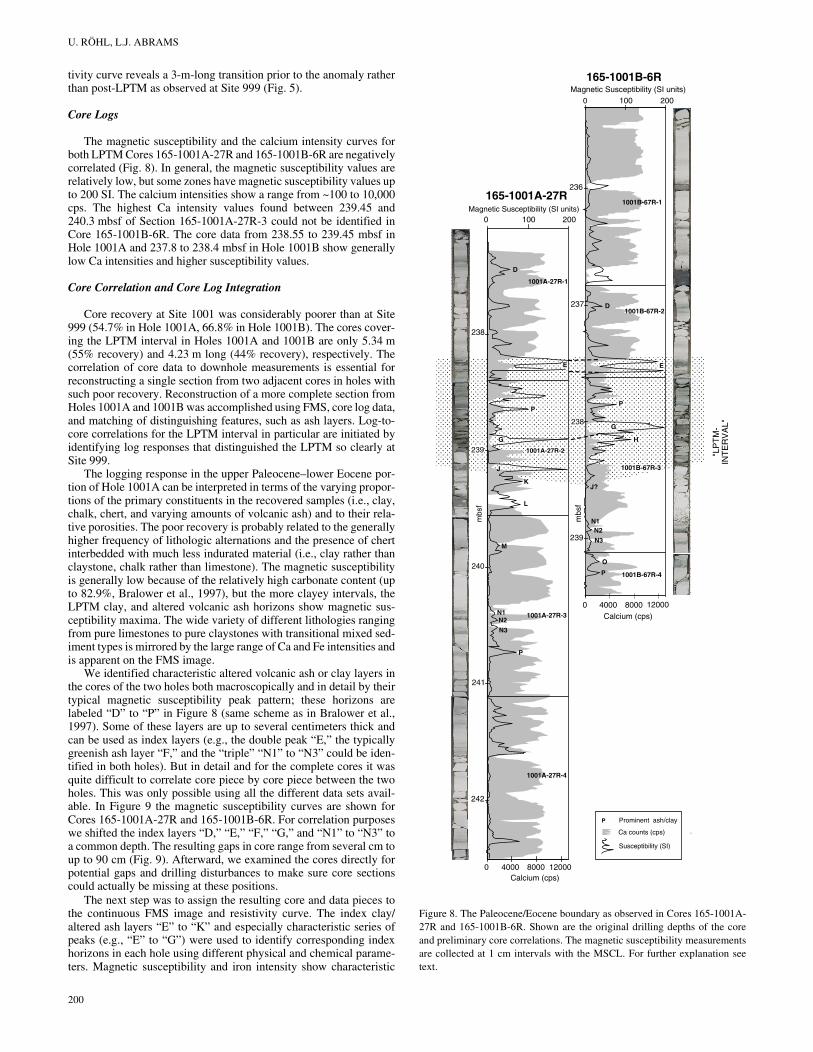
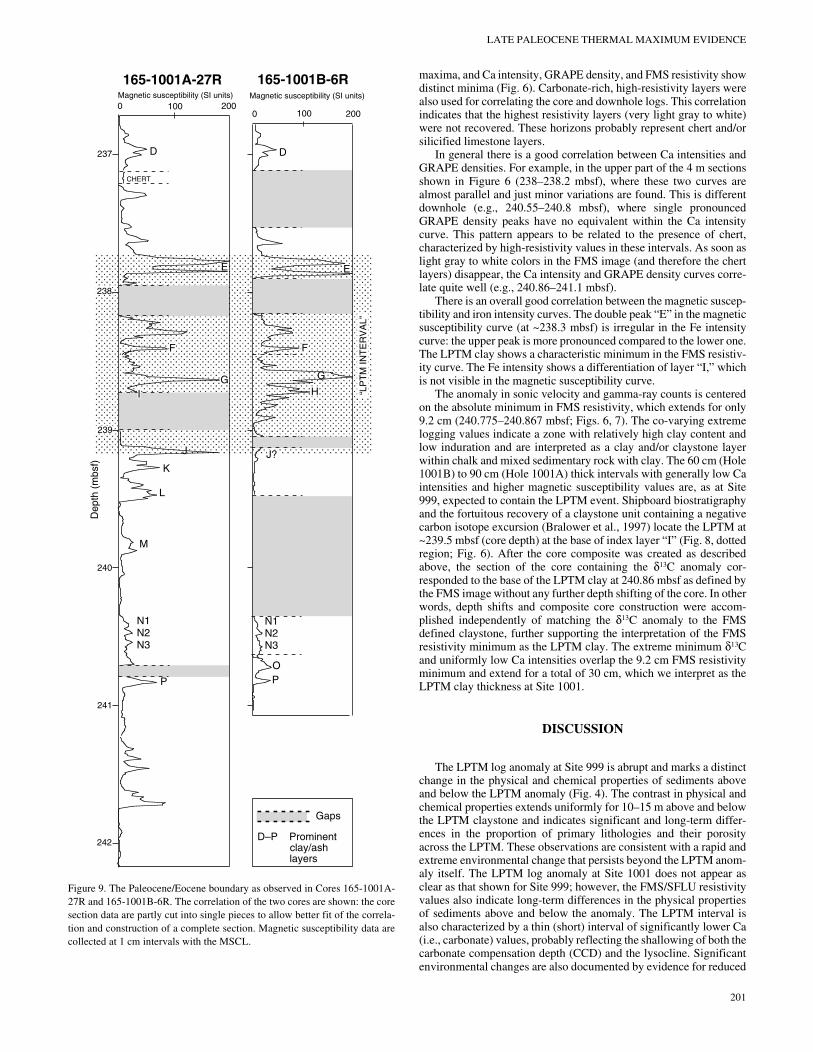
We identified characteristic altered volcanic ash or clay layers inthe cores of the two holes both macroscopically and in detail by theirtypical magnetic susceptibility peak pattern; these horizons arelabeled “D” to “P” in Figure 8 (same scheme as in Bralower et al.,1997). Some of these layers are up to several centimeters thick andcan be used as index layers (e.g., the double peak “E,” the typicallygreenish ash layer “F,” and the “triple” “N1” to “N3” could be iden-tified in both holes). But in detail and for the complete cores it wasquite difficult to correlate core piece by core piece between the twoholes. This was only possible using all the different data sets avail-able. In Figure 9 the magnetic susceptibility curves are shown forCores 165-1001A-27R and 165-1001B-6R. For correlation purposeswe shifted the index layers “D,” “E,” “F,” “G,” and “N1” to “N3” toa common depth. The resulting gaps in core range from several cm toup to 90 cm (Fig. 9). Afterward, we examined the cores directly forpotential gaps and drilling disturbances to make sure core sectionscould actually be missing at these positions.
The next step was to assign the resulting core and data pieces tothe continuous FMS image and resistivity curve. The index clay/altered ash layers “E” to “K” and especially characteristic series ofpeaks (e.g., “E” to “G”) were used to identify corresponding indexhorizons in each hole using different physical and chemical parame-ters. Magnetic susceptibility and iron intensity show characteristic
200
@@@@@@@@@@@@@@@@@@@@@@@@@@@@@@@@@@@@@@@@@@@@@@@@@@@@@@@@@@@@@@@@@@@@@@@@@@@@@@@@@@@@@@@@@@@@@@@@@@@@@@@@@@@@@@@@@@@@@@@@@@@@@@@@@@@@@@@@@@@@@@@@@@@@@@@@@@@@@@@@@@@@@@@@@@@@@@@@@@@@@@@@@@@@@@@@@@@@@@@@@@@@@@@@@@@@@@@@@@@@@@@@@@@@@@@@@@@@@@@@@@@@@@@@@@@@@@@@@@@@@@@@@@@@@@@@@@@@@@@@@@@@@@@@@@@@@@@@@@@@@@@@@@@@@@@@@@@@@@@@@@@@@@@@@@@@@@@@@@@@@@@@@@@@@@@@@@@@@@@@@@@@@@@@@@@@@@@@@@@@@@@@@@@@@@@@@@@@@@@@@@@@@@@@@@@@@@@@@@@@@@@@@@@@@@@@@@@@@@@@@@@@@@@@@@@@@@@@@@@@@@@@@@@@@@@@@@@@@@@@@@@@@@@@@@@@@@@@@@@@@@@@@@@@@@@@
ÀÀÀÀÀÀÀÀÀÀÀÀÀÀÀÀÀÀÀÀÀÀÀÀÀÀÀÀÀÀÀÀÀÀÀÀÀÀÀÀÀÀÀÀÀÀÀÀÀÀÀÀÀÀÀÀÀÀÀÀÀÀÀÀÀÀÀÀÀÀÀÀÀÀÀÀÀÀÀÀÀÀÀÀÀÀÀÀÀÀÀÀÀÀÀÀÀÀÀÀÀÀÀÀÀÀÀÀÀÀÀÀÀÀÀÀÀÀÀÀÀÀÀÀÀÀÀÀÀÀÀÀÀÀÀÀÀÀÀÀÀÀÀÀÀÀÀÀÀÀÀÀÀÀÀÀÀÀÀÀÀÀÀÀÀÀÀÀÀÀÀÀÀÀÀÀÀÀÀÀÀÀÀÀÀÀÀÀÀÀÀÀÀÀÀÀÀÀÀÀÀÀÀÀÀÀÀÀÀÀÀÀÀÀÀÀÀÀÀÀÀÀÀÀÀÀÀÀÀÀÀÀÀÀÀÀÀÀÀÀÀÀÀÀÀÀÀÀÀÀÀÀÀÀÀÀÀÀÀÀÀÀÀÀÀÀÀÀÀÀÀÀÀÀÀÀÀÀÀÀÀÀÀÀÀÀÀÀÀÀÀÀÀÀÀÀÀÀÀÀÀÀÀÀÀÀÀÀÀÀÀÀÀÀÀÀÀÀÀÀÀÀÀÀÀÀÀÀÀÀÀÀÀÀÀÀÀÀÀÀÀÀÀÀÀÀÀÀÀÀÀÀÀÀÀÀÀÀÀÀÀÀÀÀÀÀÀÀÀÀÀÀÀÀÀÀÀÀÀÀÀÀÀÀÀÀÀÀÀÀÀÀÀÀÀÀÀÀÀÀÀÀÀÀÀÀÀÀÀÀÀÀÀÀÀÀÀÀÀÀÀÀÀÀÀÀÀÀÀÀÀÀÀÀÀÀÀÀÀÀÀÀÀÀÀÀÀÀÀÀÀÀÀÀÀÀÀÀÀÀÀÀÀÀÀÀÀÀÀÀÀÀÀÀÀÀÀÀÀÀÀÀÀÀÀÀÀÀÀÀÀÀÀÀÀÀÀÀÀÀÀÀÀÀÀÀÀÀÀÀÀÀ
0 4000 8000 12000
0 4000 8000 12000
0 100 200Magnetic Susceptibility (SI units)
0 100 200Magnetic Susceptibility (SI units)
236
237
239
1001B-67R-4
1001B-67R-1
1001B-67R-3
1001B-67R-2
238
240
241
242
1001A-27R-1
1001A-27R-2
1001A-27R-3
1001A-27R-4
D
D
E E
FF
G
G H
J
J?K
M
N1
N1N2
N2
N3
N3
O
P
P
Calcium (cps)
165-1001B-6R
165-1001A-27R
L
P
Ca counts (cps)
Prominent ash/clay
Susceptibility (SI)
"LP
TM
-IN
TE
RV
AL"
mbs
f
mbs
f
Calcium (cps)
1001A-27R-2
P
G
G
P
H
E E
1001B-67R-3
238
239
Figure 8. The Paleocene/Eocene boundary as observed in Cores 165-1001A-27R and 165-1001B-6R. Shown are the original drilling depths of the coreand preliminary core correlations. The magnetic susceptibility measurementsare collected at 1 cm intervals with the MSCL. For further explanation seetext.
LATE PALEOCENE THERMAL MAXIMUM EVIDENCE
D
J
L
M
N2N3
N1
P
E
F
G
CHERT
D–P Prominent
Gaps
G
H
OP
F
E
D
J?
N2N3
N1
K
0 200
Magnetic susceptibility (SI units)0 100 200Magnetic susceptibility (SI units)
165-1001A-27R 165-1001B-6R
237
238
239
240
241
242
Dep
th (
mbs
f)
I
100
“LP
TM
INT
ER
VA
L”
clay/ash layers
Figure 9. The Paleocene/Eocene boundary as observed in Cores 165-1001A-27R and 165-1001B-6R. The correlation of the two cores are shown: the coresection data are partly cut into single pieces to allow better fit of the correla-tion and construction of a complete section. Magnetic susceptibility data arecollected at 1 cm intervals with the MSCL.
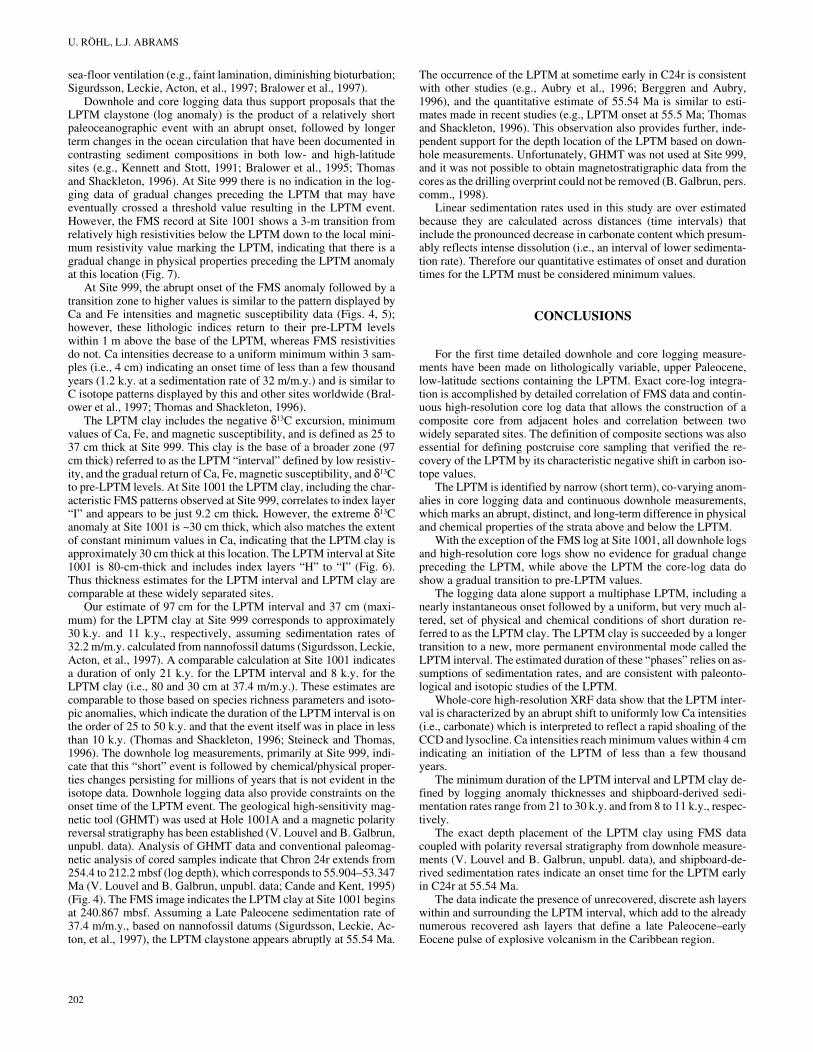
maxima, and Ca intensity, GRAPE density, and FMS resistivity showdistinct minima (Fig. 6). Carbonate-rich, high-resistivity layers werealso used for correlating the core and downhole logs. This correlationindicates that the highest resistivity layers (very light gray to white)were not recovered. These horizons probably represent chert and/orsilicified limestone layers.
In general there is a good correlation between Ca intensities andGRAPE densities. For example, in the upper part of the 4 m sectionsshown in Figure 6 (238–238.2 mbsf), where these two curves arealmost parallel and just minor variations are found. This is differentdownhole (e.g., 240.55–240.8 mbsf), where single pronouncedGRAPE density peaks have no equivalent within the Ca intensitycurve. This pattern appears to be related to the presence of chert,characterized by high-resistivity values in these intervals. As soon aslight gray to white colors in the FMS image (and therefore the chertlayers) disappear, the Ca intensity and GRAPE density curves corre-late quite well (e.g., 240.86–241.1 mbsf).
There is an overall good correlation between the magnetic suscep-tibility and iron intensity curves. The double peak “E” in the magneticsusceptibility curve (at ~238.3 mbsf) is irregular in the Fe intensitycurve: the upper peak is more pronounced compared to the lower one.The LPTM clay shows a characteristic minimum in the FMS resistiv-ity curve. The Fe intensity shows a differentiation of layer “I,” whichis not visible in the magnetic susceptibility curve.
The anomaly in sonic velocity and gamma-ray counts is centeredon the absolute minimum in FMS resistivity, which extends for only9.2 cm (240.775–240.867 mbsf; Figs. 6, 7). The co-varying extremelogging values indicate a zone with relatively high clay content andlow induration and are interpreted as a clay and/or claystone layerwithin chalk and mixed sedimentary rock with clay. The 60 cm (Hole1001B) to 90 cm (Hole 1001A) thick intervals with generally low Caintensities and higher magnetic susceptibility values are, as at Site999, expected to contain the LPTM event. Shipboard biostratigraphyand the fortuitous recovery of a claystone unit containing a negativecarbon isotope excursion (Bralower et al., 1997) locate the LPTM at~239.5 mbsf (core depth) at the base of index layer “I” (Fig. 8, dottedregion; Fig. 6). After the core composite was created as describedabove, the section of the core containing the δ13C anomaly cor-responded to the base of the LPTM clay at 240.86 mbsf as defined bythe FMS image without any further depth shifting of the core. In otherwords, depth shifts and composite core construction were accom-plished independently of matching the δ13C anomaly to the FMSdefined claystone, further supporting the interpretation of the FMSresistivity minimum as the LPTM clay. The extreme minimum δ13Cand uniformly low Ca intensities overlap the 9.2 cm FMS resistivityminimum and extend for a total of 30 cm, which we interpret as theLPTM clay thickness at Site 1001.
DISCUSSION
The LPTM log anomaly at Site 999 is abrupt and marks a distinctchange in the physical and chemical properties of sediments aboveand below the LPTM anomaly (Fig. 4). The contrast in physical andchemical properties extends uniformly for 10–15 m above and belowthe LPTM claystone and indicates significant and long-term differ-ences in the proportion of primary lithologies and their porosityacross the LPTM. These observations are consistent with a rapid andextreme environmental change that persists beyond the LPTM anom-aly itself. The LPTM log anomaly at Site 1001 does not appear asclear as that shown for Site 999; however, the FMS/SFLU resistivityvalues also indicate long-term differences in the physical propertiesof sediments above and below the anomaly. The LPTM interval isalso characterized by a thin (short) interval of significantly lower Ca(i.e., carbonate) values, probably reflecting the shallowing of both thecarbonate compensation depth (CCD) and the lysocline. Significantenvironmental changes are also documented by evidence for reduced
201
U. RÖHL, L.J. ABRAMS
sea-floor ventilation (e.g., faint lamination, diminishing bioturbation;Sigurdsson, Leckie, Acton, et al., 1997; Bralower et al., 1997).
Downhole and core logging data thus support proposals that theLPTM claystone (log anomaly) is the product of a relatively shortpaleoceanographic event with an abrupt onset, followed by longerterm changes in the ocean circulation that have been documented incontrasting sediment compositions in both low- and high-latitudesites (e.g., Kennett and Stott, 1991; Bralower et al., 1995; Thomasand Shackleton, 1996). At Site 999 there is no indication in the log-ging data of gradual changes preceding the LPTM that may haveeventually crossed a threshold value resulting in the LPTM event.However, the FMS record at Site 1001 shows a 3-m transition fromrelatively high resistivities below the LPTM down to the local mini-mum resistivity value marking the LPTM, indicating that there is agradual change in physical properties preceding the LPTM anomalyat this location (Fig. 7).
At Site 999, the abrupt onset of the FMS anomaly followed by atransition zone to higher values is similar to the pattern displayed byCa and Fe intensities and magnetic susceptibility data (Figs. 4, 5);however, these lithologic indices return to their pre-LPTM levelswithin 1 m above the base of the LPTM, whereas FMS resistivitiesdo not. Ca intensities decrease to a uniform minimum within 3 sam-ples (i.e., 4 cm) indicating an onset time of less than a few thousandyears (1.2 k.y. at a sedimentation rate of 32 m/m.y.) and is similar toC isotope patterns displayed by this and other sites worldwide (Bral-ower et al., 1997; Thomas and Shackleton, 1996).
The LPTM clay includes the negative δ13C excursion, minimumvalues of Ca, Fe, and magnetic susceptibility, and is defined as 25 to37 cm thick at Site 999. This clay is the base of a broader zone (97cm thick) referred to as the LPTM “interval” defined by low resistiv-ity, and the gradual return of Ca, Fe, magnetic susceptibility, and δ13Cto pre-LPTM levels. At Site 1001 the LPTM clay, including the char-acteristic FMS patterns observed at Site 999, correlates to index layer“I” and appears to be just 9.2 cm thick. However, the extreme δ13Canomaly at Site 1001 is ~30 cm thick, which also matches the extentof constant minimum values in Ca, indicating that the LPTM clay isapproximately 30 cm thick at this location. The LPTM interval at Site1001 is 80-cm-thick and includes index layers “H” to “I” (Fig. 6).Thus thickness estimates for the LPTM interval and LPTM clay arecomparable at these widely separated sites.
Our estimate of 97 cm for the LPTM interval and 37 cm (maxi-mum) for the LPTM clay at Site 999 corresponds to approximately30 k.y. and 11 k.y., respectively, assuming sedimentation rates of32.2 m/m.y. calculated from nannofossil datums (Sigurdsson, Leckie,Acton, et al., 1997). A comparable calculation at Site 1001 indicatesa duration of only 21 k.y. for the LPTM interval and 8 k.y. for theLPTM clay (i.e., 80 and 30 cm at 37.4 m/m.y.). These estimates arecomparable to those based on species richness parameters and isoto-pic anomalies, which indicate the duration of the LPTM interval is onthe order of 25 to 50 k.y. and that the event itself was in place in lessthan 10 k.y. (Thomas and Shackleton, 1996; Steineck and Thomas,1996). The downhole log measurements, primarily at Site 999, indi-cate that this “short” event is followed by chemical/physical proper-ties changes persisting for millions of years that is not evident in theisotope data. Downhole logging data also provide constraints on theonset time of the LPTM event. The geological high-sensitivity mag-netic tool (GHMT) was used at Hole 1001A and a magnetic polarityreversal stratigraphy has been established (V. Louvel and B. Galbrun,unpubl. data). Analysis of GHMT data and conventional paleomag-netic analysis of cored samples indicate that Chron 24r extends from254.4 to 212.2 mbsf (log depth), which corresponds to 55.904–53.347Ma (V. Louvel and B. Galbrun, unpubl. data; Cande and Kent, 1995)(Fig. 4). The FMS image indicates the LPTM clay at Site 1001 beginsat 240.867 mbsf. Assuming a Late Paleocene sedimentation rate of37.4 m/m.y., based on nannofossil datums (Sigurdsson, Leckie, Ac-ton, et al., 1997), the LPTM claystone appears abruptly at 55.54 Ma.
202
The occurrence of the LPTM at sometime early in C24r is consistentwith other studies (e.g., Aubry et al., 1996; Berggren and Aubry,1996), and the quantitative estimate of 55.54 Ma is similar to esti-mates made in recent studies (e.g., LPTM onset at 55.5 Ma; Thomasand Shackleton, 1996). This observation also provides further, inde-pendent support for the depth location of the LPTM based on down-hole measurements. Unfortunately, GHMT was not used at Site 999,and it was not possible to obtain magnetostratigraphic data from thecores as the drilling overprint could not be removed (B. Galbrun, pers.comm., 1998).
Linear sedimentation rates used in this study are over estimatedbecause they are calculated across distances (time intervals) thatinclude the pronounced decrease in carbonate content which presum-ably reflects intense dissolution (i.e., an interval of lower sedimenta-tion rate). Therefore our quantitative estimates of onset and durationtimes for the LPTM must be considered minimum values.
CONCLUSIONS
For the first time detailed downhole and core logging measure-ments have been made on lithologically variable, upper Paleocene,low-latitude sections containing the LPTM. Exact core-log integra-tion is accomplished by detailed correlation of FMS data and contin-uous high-resolution core log data that allows the construction of acomposite core from adjacent holes and correlation between twowidely separated sites. The definition of composite sections was alsoessential for defining postcruise core sampling that verified the re-covery of the LPTM by its characteristic negative shift in carbon iso-tope values.
The LPTM is identified by narrow (short term), co-varying anom-alies in core logging data and continuous downhole measurements,which marks an abrupt, distinct, and long-term difference in physicaland chemical properties of the strata above and below the LPTM.
With the exception of the FMS log at Site 1001, all downhole logsand high-resolution core logs show no evidence for gradual changepreceding the LPTM, while above the LPTM the core-log data doshow a gradual transition to pre-LPTM values.
The logging data alone support a multiphase LPTM, including anearly instantaneous onset followed by a uniform, but very much al-tered, set of physical and chemical conditions of short duration re-ferred to as the LPTM clay. The LPTM clay is succeeded by a longertransition to a new, more permanent environmental mode called theLPTM interval. The estimated duration of these “phases” relies on as-sumptions of sedimentation rates, and are consistent with paleonto-logical and isotopic studies of the LPTM.
Whole-core high-resolution XRF data show that the LPTM inter-val is characterized by an abrupt shift to uniformly low Ca intensities(i.e., carbonate) which is interpreted to reflect a rapid shoaling of theCCD and lysocline. Ca intensities reach minimum values within 4 cmindicating an initiation of the LPTM of less than a few thousandyears.
The minimum duration of the LPTM interval and LPTM clay de-fined by logging anomaly thicknesses and shipboard-derived sedi-mentation rates range from 21 to 30 k.y. and from 8 to 11 k.y., respec-tively.
The exact depth placement of the LPTM clay using FMS datacoupled with polarity reversal stratigraphy from downhole measure-ments (V. Louvel and B. Galbrun, unpubl. data), and shipboard-de-rived sedimentation rates indicate an onset time for the LPTM earlyin C24r at 55.54 Ma.
The data indicate the presence of unrecovered, discrete ash layerswithin and surrounding the LPTM interval, which add to the alreadynumerous recovered ash layers that define a late Paleocene–earlyEocene pulse of explosive volcanism in the Caribbean region.
LATE PALEOCENE THERMAL MAXIMUM EVIDENCE
ACKNOWLEDGMENTS
We are grateful to the Ocean Drilling Program for inviting us toparticipate on Leg 165, to all members of the Shipboard ScientificParty of Leg 165 for their cooperation aboard the ship, and to the ODPpersonnel and the SEDCO crew who made Leg 165 a success. We es-pecially thank Timothy J. Bralower, Veronique Louvel, and BrunoGalbrun for discussions and free data exchange. U.R acknowledgesthe financial support of the German Research Foundation (DFG),L.J.A. that of JOI-USSAC. We thank Aad Vaars, Bob Koster, andSjerry Van der Gaast (Netherlands Institute for Sea Research, Texel,The Netherlands) for introducing us to the secrets of the XRF CoreScanner. We also thank the Borehole Research Group, LDEO, forpostcruise data processing, and P. Pezard and V. Louvel for their as-sistance with FMS-SFLU calibration at the Laboratoire de Mesuresen Forage, Marseille, France. Valuable reviews and critiques wereprovided by Espen Sletten Andersen, Timothy J. Bralower, and JulieA. Hood.
REFERENCES
Aubry, M.-P., Berggren, W.A., Stott, L., and Sinha, A., 1996. The upperPaleocene–lower Eocene stratigraphic record and the Paleocene/Eoceneboundary carbon isotope excursion: implications for geochronology. InKnox, R.W.O’B., Corfield, R.M., and Dunay, R.E. (Eds.), Correlation ofthe Early Paleogene in Northwestern Europe. Spec. Publ.—Geol. Soc.Am., 101:353–380.
Berggren, W.A., and Aubry, M.-P., 1996. A late Paleocene-early Eocene NWEuropean and North Sea magnetobiochronological correlation network.In Knox, R.W.O’B, Corfield, R.M., and Dunary, R.E. (Eds.), Correlationof the Early Paleogene in Northwest Europe. Spec. Publ.—Geol. Soc.Am., 101:309–352.
Borehole Research Group, 1990. Ocean Drilling Program Logging Manual,LDEO.
Bourke, L., Delfiner, P., Trouiller, J.-C., Fett, T., Grace, M., Luthi, S., Serra,O., and Standen, E., 1989. Using Formation MicroScanner images. Tech.Rev., 37:16–40.
Boyce, R.E., 1976. Definitions and laboratory techniques of compressionalsound velocity parameters and wet-water content, wet-bulk density, andporosity parameters by gravimetric and gamma-ray attenuation tech-niques. In Schlanger, S.O., Jackson, E.D., et al., Init. Repts. DSDP, 33:Washington (U.S. Govt. Printing Office), 931–958.
Bralower, T.J., Thomas, D.J., Zachos, J.C., Hirschmann, M.M., Röhl, U.,Sigurdsson, H., Thomas, E., and Whitney, D.L., 1997. High-resolutionrecords of the late Paleocene thermal maximum and circum-Caribbeanvolcanism: is there a causal link? Geology, 25:963–966.
Bralower, T.J., Zachos, J.C., Thomas, E., Parrow, M., Paull, C.K., Kelly,D.C., Premoli Silva, I., Sliter, W.V., and Lohmann, K.C., 1995. Late Pale-ocene to Eocene paleoceanography of the equatorial Pacific Ocean: sta-ble isotopes recorded at Ocean Drilling Program Site 865, Allison Guyot.Paleoceanography, 10:841–865.
Cande, S.C., and Kent, D.V., 1995. Revised calibration of the geomagneticpolarity timescale for the Late Cretaceous and Cenozoic. J. Geophys.Res., 100:6093–6095.
Curry, W.B., Shackleton, N.J., Richter, C., et al., 1995. Proc. ODP, Init.Repts., 154: College Station, TX (Ocean Drilling Program).
deMenocal, P.B., Bristow, J.F., and Stein, R., 1992. Paleoclimatic applica-tions of downhole logs: Pliocene-Pleistocene results from Hole 798B,Sea of Japan. In Pisciotto, K.A., Ingle, J.C., Jr., von Breymann, M.T.,Barron, J., et al., Proc. ODP, Sci. Results, 127/128 (Pt. 1): College Sta-tion, TX (Ocean Drilling Program), 393–406.
Dickens, G.R., Castillo, M.M., and Walker, J.G.C., 1997. A blast of gas inthe latest Paleocene: simulating first-order effects of massive dissociationof oceanic methane hydrate. Geology, 25:259–262.
Dickens, G.R., O’Neil, J.R., Rea, D.K., and Owen, R.M., 1995. Dissociationof oceanic methane hydrate as a cause of the carbon isotope excursion atthe end of the Paleocene. Paleoceanography, 10:965–971.
Ekstrom, M.P., Dahan, C.A., Chen, M.-Y., Lloyd, P.M., and Rossi, D.J.,1986. Formation imaging with microelectrical scanning arrays. Trans.SPWLA 27th Annu. Logging Symp., Pap. BB.
Eldholm, O., and Thomas, E., 1993. Environmental impact of volcanic mar-gin formation. Earth Planet. Sci. Lett., 117:319–329.
Gunn, D.E., and Best, A.I., 1998. A new automated nondestructive systemfor high resolution multi-sensor core logging of open sediment cores.Geo-Mar. Lett., 18:70–77.
Jansen, J.H.F., Van der Gaast, S.J., Koster, B., and Vaars, A.J., 1998. COR-TEX, a shipboard XRF-scanner for element analyses in split sedimentcores. Mar. Geol., 151:143–153.
Kennett, J.P., and Stott, L.D., 1990. Proteus and Proto-oceanus: ancestralPaleogene oceans as revealed from Antarctic stable isotopic results: ODPLeg 113. In Barker, P.F., Kennett, J.P., et al., Proc. ODP, Sci. Results,113: College Station, TX (Ocean Drilling Program), 865–880.
————, 1991. Abrupt deep-sea warming, paleoceanographic changes andbenthic extinctions at the end of the Palaeocene. Nature, 353:225–229.
Knox, R.W.O’B., 1996. Correlation of the early Paleogene in northwestEurope: an overview. In Knox, R.W.O’B., Corfield, R.M., and Dunay,R.E. (Eds.), Correlation of the early Paleogene in Northwest Europe.Geol. Soc. Spec. Publ. London, 101:1–11.
Neal, J.E., 1996. A summary of Paleogene sequence stratigraphy in north-west Europe and the North Sea. In Knox, R.W., Corfield, R.M., Dunay,R.E. (Eds.), Correlation of the Early Paleogene in Northwest Europe.Geol. Soc. Spec. Publ. London, 101:15–42.
Norris, R.D., Kroon, D., Klaus, A., et al., 1998. Proc. ODP, Init. Repts.,171B: College Station, TX (Ocean Drilling Program).
Pak, D.K., and Miller, K.G., 1992. Paleocene to Eocene benthic foraminiferalisotopes and assemblages: implications for deepwater circulation. Pale-oceanography, 7:405–422.
Pindell, J.L., and Barrett, S.F., 1990. Geologic evolution of the Caribbeanregion: a plate-tectonic perspective. In Dengo, G., and Case, J.E. (Eds.),The Caribbean Region. Geol. Soc. Am., Geol. North. Am. Ser., H:405–432.
Shackleton, N., and Boersma, A., 1981. The climate of the Eocene ocean. J.Geol. Soc. London, 138:153–157.
Shackleton, N.J., 1986. Paleogene stable isotope events. Palaeogeogr., Palae-oclimatol., Palaeoecol., 57:91–102.
Sigurdsson, H., Leckie, R.M., Acton, G.D., et al., 1997. Proc. ODP, Init.Repts., 165: College Station, TX (Ocean Drilling Program).
Steineck, L.P., and Thomas, E., 1996. The latest Paleocene crises in the deepsea: ostracode succession at Maud Rise, Southern Ocean. Geology,24:583–586.
Thomas, E., and Shackleton, N., 1996. The Palaeocene-Eocene benthic fora-miniferal extinction and stable isotope anomalies. In Knox, R.W.O’B.,Corfield, R.M., and Dunay, R.E. (Eds.), Correlation of the Early Paleo-gene in Northwest Europe. Geol. Soc. Spec. Publ. London, 101:401–441.
Weaver, P.P.E., and Schultheiss, P.J., 1990. Current methods for obtaining,logging, and splitting marine sediment cores. Mar. Geophys. Res., 12:85–100.
Wessel, P., and Smith, W.H.F., 1995. New version of the Generic MappingTools released. Eos, 76:329.
Zachos, J.C., Lohmann, K.C., Walker, J.C.G., and Wise, S.W., Jr., 1993.Abrupt climate change and transient climates during the Paleogene: amarine perspective. J. Geol., 101:191–213.
Zachos, J.C., Rea, D.K., Seto, K., Niitsuma, N., and Nomura, R., 1992.Paleogene and early Neogene deep water history of the Indian Ocean:inferences from stable isotopic records. In Duncan, R.A., Rea, D.K.,Kidd, R.B., von Rad, U. and Weissel, J.K. (Eds.), The Indian Ocean: ASynthesis of Results from the Ocean Drilling Program. Am. Geophys.Union, Geophys. Monogr., 70:351–386.
Date of initial receipt: 29 June 1998Date of acceptance: 3 March 1999Ms 165SR-009
203