Embed Size (px)
Citation preview
PHYSICAL REVIEW B VOLUME 45, NUMBER 20
(100) surface segregation in Cu-Ni alloys
15 MAY 1992-II
H. Y. Wang, R. Najafabadi, and D. J. SrolovitzDepartment ofMaterials Science and Engineering, University ofMichigan, Ann Arbor, Michigan 48109
R. LeSarTheoretical Division, Los Alamos National Laboratory, Los Alamos, New Mexico 87545
(Received 4 November 1991)
Atomistic simulations of segregation to the (100) free surface in Ni-Cu alloys have been performed fora wide range of temperatures and compositions within the solid-solution region of the alloy phase dia-gram. In addition to the surface-segregation profile, surface structures, free energies, enthalpies, and en-tropies were determined. These simulations were performed within the framework of the free-energysimulation method, in which an approximate free-energy functional is minimized with respect to atomiccoordinates and atomic-site occupation. For all alloy bulk compositions (0.05 ~ C ~0.95) and tempera-tures (400& T ~ 1000 K) examined, Cu segregates strongly to the surface and Ni segregates to the planesjust below the surface. The width of the segregation profile is limited to approximately three atomicplanes. The resultant segregation profiles are shown to be in good agreement with an empirical segrega-tion theory. A simpler method for determining the equilibrium segregation in terms of the properties ofunrelaxed pure Ni and pure Cu surface data is proposed and shown to be more accurate than the existingempirical segregation analyses. The surface thermodynamic properties depend sensitively on the magni-tude of the surface segregation. The enthalpy, entropy of segregation, and the change in the interlayerspacing adjacent to the surface are shown to vary linearly with the magnitude of the surface segregation.
I. INTRODUCTION
Alloying elements and impurities often segregate to thesurface or near-surface region of a solid. Since many ma-terial properties depend on surface properties, segrega-tion plays an important role in such diverse phenomenaas catalysis, thermionic emission, crystal growth, etc.Therefore, an understanding of these surface phenomenarequires a knowledge of not only the structure of the sur-face, but also the surface composition. The surface com-position, in turn, depends on the surface-segregation ther-modynamics. The focus of the present work is the appli-cation of the recently introduced, free-energy simulationmethod to calculate the equilibrium structure, composi-tion, and thermodynamics of surfaces in alloys. In par-ticular, the present paper examines (100) surfaces in Cu-Ni alloys.
The observation that Cu segregates to surfaces in Cu-Ni alloys was suggested 20 years ago based upon mea-surements of catalytic activity, hydrogen adsorption, andwork-function changes. ' A trace amount of copper inthe bulk was found to produce a large effect on the cata-lytic behavior of Ni, suggesting that copper stronglysegregated to the surface. Experiments employing moremodern surface analytical techniques followed in consid-erable numbers. Although the experimental resultsdiffer somewhat in the degree of Cu enrichment and theconcentration profile, most agree that the Cu concentra-tion on the surfaces increases monotonically with increas-ing bulk Cu concentration. On the other hand, experi-ments by Sakurai et al. , using the time-of-flight (TOF)
atom probe, indicated that for bulk Cu concentrationsgreater than 84 at. %, Ni will segregate to the surface in-stead of Cu. These results have not been confirmed inother studies.
In addition to the experimental studies, there havebeen numerous theoretical investigations of the surfacecomposition of Cu-Ni alloys. These studies have includ-ed Monte Carlo simulations z6
—2s and electronic-structure-method-based investigations. ' Almost allsurface-segregation theories predict that Cu will segre-gate to the surface over the entire Ni-Cu phase diagram.However, one study, using tight-binding theory, didclaim the existence of the reversal of surface segregant asthe phase diagram is traversed. ' They noted that ifthe condition of charge neutrality is imposed in themethod used in Ref. 29, the crossover behavior will occurat 75 at. % bulk Cu concentration. Later, the same au-thors investigated the effects of charge transfer on sur-face segregation and did not obtain the previously report-ed crossover. ' ' They also pointed out that unphysicalvalues of the difference between the Cu-Cu bond and Ni-Ni bond energy are necessary to produce the segregationreversal.
In addition to those described above, there are severaltheoretical methods for determining interfacial segrega-tion, including lattice-gas models (regular solution),Monte Carlo methods, and tight-binding-type theory.The lattice-gas model is a simple model allowing for fair-ly straightforward theoretical analysis, but generallysuffers from an unrealistic treatment of the interactionsbetween the atoms. Some improved regular solution
45 12 028 1992 The American Physical Society

45 (100) SURFACE SEGREGATION IN Cu-Ni ALLOYS 12 029
models ' do allow for limited relaxation of the interac-tion between the particles on the surface, but require anundetermined parameter to account for the degree of therelaxation. Tight-binding theory, ' on the other hand,yields a very accurate description of the interaction be-tween particles, but does not provide a simple method fordetermining the effects of temperature. Recent advancesin Monte Carlo simulations have extended thesemethods to alloy systems where the local compositionmay change during the course of the simulation. Thesemethods may be employed to obtain accurate equilibriumsegregation profile and interfacial structure provided thatthe interatomic potential which describes the interactionsbetween atoms is accurate. Unfortunately, while thismethod does yield equilibrium interfacial structure andcomposition, it has never been successfully used to obtaininterfacial free energies or other basic thermodynamicdata. Monte Carlo calculations also require substantialcomputational resources and hence are generally limitedto supercomputer applications and to studying relativelysmall numbers of interfaces and conditions.
The free-energy simulation method employed in thepresent study ' is based on a number of simple approxi-mations, centered on the concept of effective (or mean-field) atoms that have properties that are aconcentration-weighted mix of those of the different atomtypes. The central approximations in the model are (1)the vibrations of the atoms are accounted for within theframework of the local harmonic (LH) model in whichthe terms of the dynamical matrix that couple vibrationsof different atoms are ignored; (2) a mean-field expressionfor the interaction energy described by embedded-atom-method (EAM) potentials is employed; and (3) theconfigurational entropy is calculated in the ideal-mixinglimit. The most important feature of our method is thatwe develop a simple, approximate expression for thefinite-temperature free energy of the system. Minimizingthe free energy with respect to the positions and the meancomposition of the atomic sites yields the equilibriumstructure, segregation, and free energy, from which allother thermodynamic quantities may be derived.
This method is both physically and mathematicallysimple; yet its most crucial feature may be its computa-tional efficiency. With this efficiency we are able to per-form a large number of calculations to elucidate thetrends in interfacial and segregation thermodynamics as afunction of the experimental parameters, temperature,and bulk composition. In spite of its simplicity, however,this method is also very accurate. In Ref. 35, we reportedpreliminary results on segregation of Cu to X5, 213, andX61 [001] twist grain boundaries and to (100), (110), and(111) free surfaces in the Cu-Ni system. We comparedour prediction with segregation profiles determined fromMonte Carlo (MC) simulations with the same poten-tials ' and found close agreement. In most cases, ourresults were in quantitative agreement with the MC re-sults and, in all cases, the qualitative trends were correct.Successes of the model included the accurate predictionof almost complete segregation of Cu segregation to, andNi enhancement just below, Cu-Ni alloy surfaces. Thus,the model appears to be sufficiently accurate to predict
the dominant physical features of surface segregation.In the present paper, we report the results of a series of
surface-segregation simulations in the Cu-Ni system. Weperformed simulation on (100) surfaces for a wide rangeof bulk concentrations (0 ~ Cc„~1) and temperatures(400 K ~ T ~ 1000 K), which includes the same physicalparameter range as employed in our previous study of theCu-Ni [001] twist boundaries. We find that Cu is thedominant segregant in the Cu-Ni system at both the (100)free surface and the [001] twist grain boundary. Howev-
er, Ni segregates to the second atomic plane from the freesurface while Cu segregates to the second atomic planefrom the grain boundary. The predicted surface- segrega-tion profiles are analyzed in terms of existing segregationtheory. The thermodynamic properties of the surface areshown to vary with the degree of segregation in a simplemanner.
II. SIMULATION METHOD
In this section we outline the free-energy simulationmethod which we employ to determine the equilibriumstructure, composition, and thermodynamics of defects inalloy systems. A more complete description is given else-where. ' In the present approach, we construct an ap-proximate free-energy functional for a multicomponentatomic system and then minimize it with respect to theatomic coordinates and the compositional profile in thematerial. The free energy of a multicomponent systemconsists of several distinguishable parts, including atomicbonding, atomic vibrations, and configurational entropy(i.e., the entropy associated with the relative spatial dis-tribution of the atomic species). For metals, we describethe interactions within the framework of the embedded-atom-method (EAM). ' The effects of atom vibrationsare included within the framework of the local harmonic(LH) model, which is given by
h CO;pA„=ksT g g ln
I p ] 2' gT
where A„ is the vibrational contribution to the free ener-
gy, k~ Tis the thermal energy, h is Planck's constant, N isthe total number of atoms in the system, and N I ct) 2 andco '3 are the three vibrational eigenfrequencies of atom i ~
These frequencies may be determined in terms of the lo-cal dynamical matrix of each atom D; p=B E/Bx; Bx;p,where E is the potential energy determined from sum-ming the interatomic potential and the x;p correspond toatomic displacements of atom i in some coordinate sys-tem. Diagonalization of this 3 X3 matrix yields the threeforce constants k;p for atom i. The vibrational frequen-cies are then determined as co;&=(k,&/m)', where m isthe effective atomic mass. We have demonstrated thatthe approximations inherent in the LH model lead to er-rors in the free energy of perfect close-packed metal crys-tals of the order of 1% at the melting temperature andmuch less at lower temperatures.
Configurational entropy is described on the basis of apoint approximation, which is given as
12 030 WANG, NAJAFABADI, SROLOVITZ, AND LESAR 45
N
S, = —kz g Ic, (i) 1n[c, (i}]+c&(i) ln[cb(i)]], (2)
where Ap is the difference in chemical potential betweenthe a and b atoms. In Eq. (3), A is the total Helmholtzfree energy and E is the potential energy.
The equi1ibrium surface-segregation profile is deter-mined in several steps. First, the properties of the per-fect, uniform composition crystal are determined (see theAppendix). This is done by choosing a composition andthen minimizing the Gibbs free energy, at the tempera-ture and pressure of interest, with respect to the latticeparameter. Differentiating this equilibrium free energywith respect to composition gives the chemical-potentialdifference Ap. Since, at equilibrium, the chemical poten-tial of a component is everywhere constant, we fix thechemical potential differences at their bulk values, intro-duce the appropriate surface, and minimize the grand po-tential with respect to the concentration and position ofeach atomic site.
The geometry of the cell used in the surface simula-tions is divided into two regions. The effective atoms inregion I are completely free to move in response to theforces due to other atoms and the concentration at eachsite is allowed to vary. The atoms in region II, however,are constrained such that region II is a perfect crystalwith the lattice constant and average concentration oneach site appropriate to the simulation temperature, pres-sure, and bulk concentration. The equilibrium atomicconfiguration and the concentration of each effectiveatom are obtained by minimizing Eq. (3) with respect tothe atomic coordinates and the site concentrations (4Nvariables, where N is the number of atoms in the system).In the direction of the surface normal (i.e., the z direc-tion) there are no constraints imposed on the particles,such that the traction in z direction is guaranteed zero.However, since periodic-boundary conditions are im-posed in the x and y directions and the size of the surfacein those directions is fixed by the lattice constant of the
where c,(i) is the concentration of a atoms and cb(i) isthe concentration of b atoms on site i. Since we are in-terested in equilibrium properties, these concentrationsmay be viewed as the time-averaged composition of eachatomic site in a system where the atoms are free todiffuse. In this sense, the atoms are "effective" or"mean-field" atoms. Since we replace real atoms byeffective atoms, the internal energy E, which is defined interms of the interatomic potential, must also be suitablyaveraged over the composition of each atom and its in-teracting neighbors. A method for performing theseaverages for the EAM potentials is described in Ref. 35and 36.
The present simulations were performed within a re-duced grand canonical ensemble, where the total numberof atoms remains fixed but the relative quantities of eachatomic species varies. The appropriate thermodynamicpotential for this type of ensemble is the grand potentialand is given by
N N0= A+by g c,(i)=E+A, —TS, +bp g c,(i), (3)
perfect system, some net stress may develop in the sur-face region. This is appropriate since the surface regionin any but the thinnest films is constrained by the bulkcrystal. The (100) surface, studied herein, was createdsimply by cleaving a single crystal along a (100) plane.The simulations were performed with a total of 20 atomsin each of the (002) planes included. Typically, eight(002) planes were required in order to obtain surface ener-gies that were invariant with respect to increasing thenumber of planes in the simulation cell.
III. RESULTS
(100) Cu-Ni surface simulations were performed at fourdifferent temperatures: 400, 600, 800, and 1000 K. Ateach temperature, between 13 and 15 different bulk com-positions were examined. In order to determine theequilibrium phases present at these temperatures andcompositions, we mapped out the solid region of the Ni-Cu phase diagram. We find that above approximately250 K, the solid is disordered. We have determined themelting points for pure Ni and Cu to be 1665 and 1290 K[38], respectively. These are in reasonable agreementwith Monte Carlo simulation results using the sameEAM potentials (i.e., Ni, 1740 K; and Cu, 1340 K) (Ref.40) and experimental data (i.e., Ni, 1726 K; and Cu, 1358K). Therefore, the temperatures and compositions exam-ined in this study are well within the continuous solid-solution region of the phase diagram. The thermodynam-ic properties of the EAM Cu-Ni crystals over this tem-perature and composition range are reported in the Ap-pendix.
The thermodynamic properties of the surfaces are dis-tinguished from the bulk properties by the subscripts 8or s, where 8 represents bulk (solid-solution) crystalproperties and s refers to surface properties. The surfaceproperties are defined as the difference between the prop-erty of the system containing the surface and that of asolid-solution crystal with the same number of atoms atthe same bulk composition and temperature,X, = [X(surface) —Xs]/A, where X is the thermodynamicproperty of interest (e.g. , free energy, enthalphy, etc. ) andthe surface properties have been normalized by the sur-face area A. The surface properties may be calculated intwo limits. The first is the unsegregated limit, as may befound by rapidly quenching the sample from very hightemperature (where segregation is negligible) to the tem-perature of interest, and its properties are denoted byX, „. The second limit corresponds to equilibrium segre-gation at the temperature of interest and is denoted byX, , The change in the therrnodynarnic properties thatmay be associated with the segregation is given by thedifference between these two values, i.e.,AX, =X, , —X, „.
Following segregation, the Cu concentration of thedifferent (002} planes varies with layer number or dis-tance from the free surface. The Cu concentrations onthe (002) planes parallel to the surface are given by C„,where the subscript n denotes the plane number (e.g., C3is the Cu concentration in the third (002) plane from thesurface). We adopt the notation Cz as the dimensionless
45 (100) SURFACE SEGREGATION IN Cu-Ni ALLOYS 12 031
bulk concentration far from the surface plane.Throughout this paper, all concentrations 0 C ~1 will
refer to the Cu concentration; the Ni concentration is
simply given by 1 —C. The degree of segregation, or ex-cess concentration, is given by the difference between theconcentration on a given atomic plane and the bulk con-centration and is denoted C„„,(=C„—C~). The net ortotal excess segregation is given by the sum of C„, overall (002) planes and is referred to as Cz „=g„C„„,.Note, Cz, is nonzero here, since in the present reducedgrand canonical ensemble calculations the relativeamounts of Cu and Ni are allowed to vary during thecourse of the simulation.
0 I I I I
0.8—
0.6—
04—
+ C,=O
02 % C,=O
x C,=O.6
o C„=0.80.0
0 3 4 5
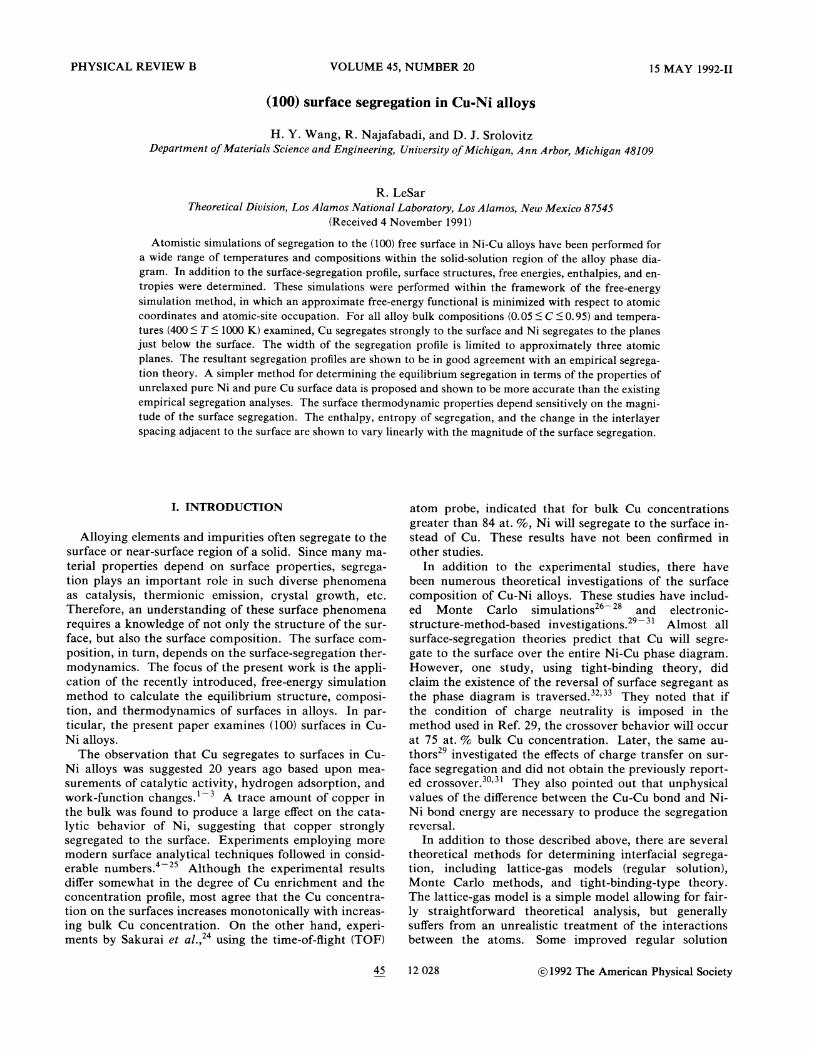
FIG. 1. Concentration of Cu atoms on (002) planes parallelto the surface vs layer number n, where n = 1 corresponds to the(002) plane adjacent to the surface. The temperature is 400 Kand the plus, asterisk, cross, and circle are for bulk concentra-tions of 0.2, 0.4, 0.6, and 0.8, respectively.
A. Segregation profiles
The concentration profile in the vicinity of the (100)surface is shown in Fig. 1 for different bulk concentra-tions C~ at T =400 K. Although the bulk concentrationis varied from 20% to 80% Cu, the Cu concentration atthe surface (n =1) remains approximately constant at97% Cu (+2%). This corresponds to an excess Cu con-centration at the first plane of 76% for Cz =0.2 and 19%for Cii =0.8. Unlike in the X5 [001] twist grain bound-
ary, the second (002) plane from the surface (n =2) ex-hibits Ni segregation, although to a smaller degree thanthe first (002) plane. The third (002) plane also shows Nisegregation with an even smaller magnitude. By thefourth (002) plane from the surface, the Cu concentrationis nearly equal to the bulk concentration. These segrega-tion profiles indicate that the effective width of the freesurface-segregation profile is approximately three (002)planes and that the total excess concentration Cz„, for
C~ less than about 0.5 is dominated by C& „,. %'hen Czis bigger than 0.5, however, the contribution from thesecond layer is quite significant.
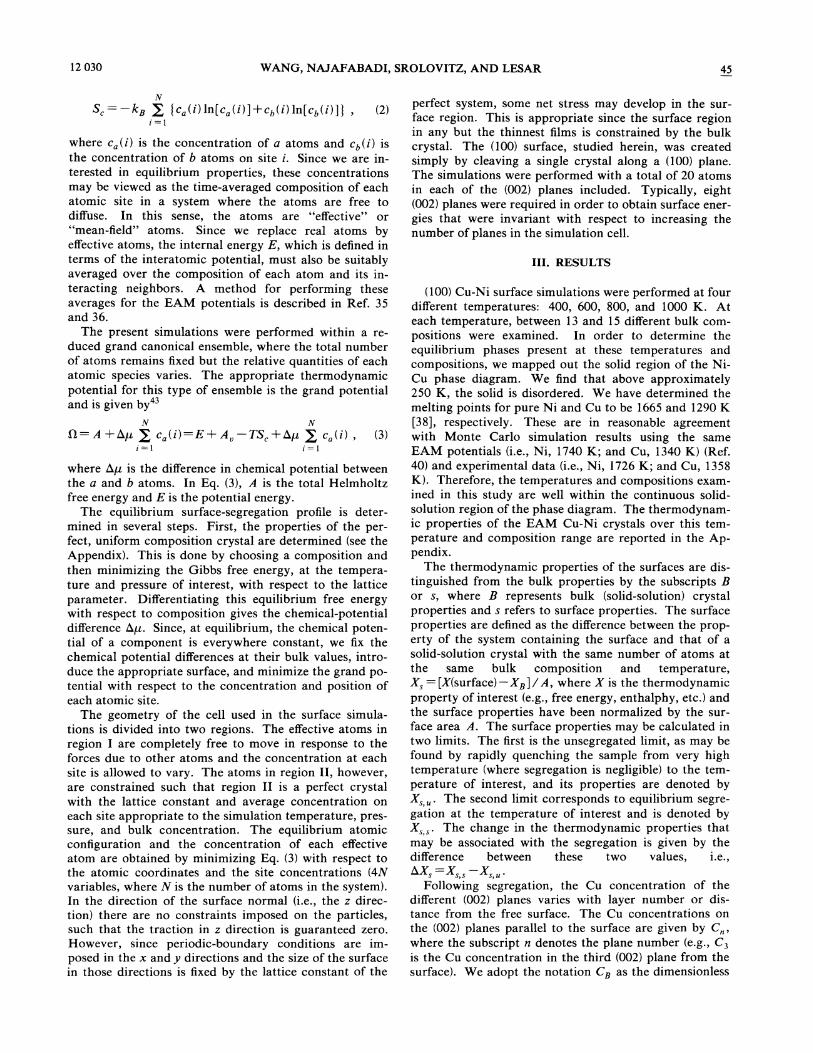
The bulk concentration dependence of the segregationon the different planes may be seen more clearly in Fig.2(a), where the concentration on the first four (002)planes are plotted as a function of the bulk concentrationat 400 K. In this type of plot, the straight line C„=Czcorresponds to zero segregation. Clearly, C„must go tozero as Cz approaches zero and C„must go to one as Czapproaches 1 since in these limits no solute is present. Intoto, these curves show that the first plane has Cu segre-gation, the second and the third planes have Ni segrega-tion as we have seen in Fig. 1. The fourth plane, howev-er, shows very little segregation; when Cz )0.7 there isslight Cu segregation and when Cz &0.7 Ni weaklysegregates. The effects of temperature and bulk concen-tration on the first layer segregation is shown in Fig. 2(b),where we plot C& as a function of the bulk concentrationfor four temperatures. This curve shows that Cu alwayssegregates to the surface, but to a lesser degree with in-creasing temperature.
The relationship between the segregation to the surface(n = 1) and the total segregation may be seen more clear-ly in Fig. 2(c), where we plot Ci „,=Ci —Cz (solid line)and Cz „, (dash-dot-dot line) vs Cz for four different tem-peratures. The maximum degree of segregation alwaysoccurs at C~ (0.5 and shifts to lower Cz with decreasingtemperature. In all cases, the net or total segregation isless than that to the n = 1 (002) plane, due to the predom-inance of Ni segregation for n ~ 2. As the temperature isdecreased and jor the bulk concentration is increased, thelarge segregation of Ni to the second layer yields asignificant difference between Cz, and C, „.Nonethe-less, at the higher temperatures, C, , is still a reasonablygood approximation to C~ „„indicating the sharpness ofthe segregation profile. As the temperature is increasedfrom 400 to 1000 K, both Cz. , and C, „,decrease.
Taken together, the segregation-profile data for the(100) surface in the Cu-Ni system can be summarized asfollows: (1) there is a net segregation of Cu to the surfacefor all bulk concentrations and temperatures, (2) thesegregation profile is effectively limited to the three (002)atomic planes near the surface, (3) Ni segregates to then + 2 planes with a smaller magnitude than the first-layerCu segregation, and (4) the total amount of segregation,the segregation to the first layer, and the difference be-tween these quantities decrease with increasing tempera-ture.
B. Thermodynamics
A11 of the surface thermodynamic properties aredefined as the difference between those properties in thesystem with the surface and that of the bulk (see the Ap-pendix) and normalized by the area of the surface, as de-scribed above. The surface free energy, in the grandcanonical ensemble, is denoted as F, =(0,—0)/ A,where Q, is the grand potential of the system with thesurface, Q is the grand potential for the perfect crystal,

12 032 WANG, NAJAFABADI, SROLOVITZ, AND LESAR 45
and A is the area of the surface. I, is plotted as a func-tion of bulk concentration C~ in Fig. 3 both with (solidcurves) and without (dotted curves) segregation. For thecalculations with segregation, the grand potential is mini-mized with respect to the position and the concentrationof each site, while for the unsegregated surface, the corn-positions of each site are fixed at Cz and the grand poten-tial is minimized only with respect to the atomic coordi-nates. The bulk concentration dependence of the un-segregated surface grand potential is quite simple; theI, „vs C~ curves are approximately linear interpolationsbetween the pure Ni and the pure Cu I, values and theeffect of increasing temperature is simply to shift thesecurves to lower values of I,. This temperature depen-
dence is primarily a consequence of the positive surfaceentropy, as discussed below
The I, vs Cz curves for the segregated surfaces aremuch more complicated than in the unsegregated case.The complexity is introduced by the competition betweenthe various terms that make up the free energy: enthalpy,entropy, and chemical potential. The lower the tempera-ture, the smaller the entropic contribution to the free en-ergy, such that I, , is larger. However, since segregationis more pronounced at lower temperatures, the larger thecontribution from the energy that drives segregation (thisis H Ap—CT „,), and, hence, the smaller the magnitude ofI, , For bulk Cu concentrations less than approximately0.5, I, , is smallest for the lowest temperature studied
1.0 1.0
0.8— 0.8
0.6— 0.6—
04 0.4—
0.2— 0.2—o T=1000K
0..0 I I I I I I I I I I I I I I I I I I I I I I
0.00 0.20 0.40 0.60 0.80 1.00 1.000 I I I I I I I I I I I I I I I I I I I I I I I I0.0.00 0,20 0.40 0.60 0.80
B
~ 0 I I I I
I
I I I I I I I I
I
I I I I
II I I I
+ T=400K
B
0.8—
0.6—
04
0.2—
0.00.00 0.20 0.40 0.60 0.80 1.00
B
FIG. 2. The Cu concentration of the first four (002) planes C& (plus), C, (asterisk), C3 (cross), and C4 (circle) are plotted as func-tions of the bulk concentration Cz at T =400 K (a). The Cu concentration on the first layer C& (b) and the excess concentrations (c)are plotted as functions of the bulk concentration C&. The plus, asterisk, cross, and circle are for 400, 600, 800, and 1000 K, respec-tively. In (c), the solid lines correspond to the first-layer excess concentration C, „„and the dashed lines to the total excess concen-tration CT, .

45 (100) SURFACE SEGREGATION IN Cu-Ni ALLOYS 12 033
1500C,
XX.
1400
I l I 5
}I I i I
i
I I I I
-500—
1300 ~ -1OOO—
1200 -I500—
X
O T=1000K
1 1P0 I i I I I I I I I I I I I I I I I I I I
0.00 0.20 0.40 0.60 0.80 1.00
o T=1000K.
-2ppp i » i I i I I I I I I I I I I
0.00 0.20 0.40 0.60 0.80 1.00
B B
FIG. 3. The surface grand potential vs the bulk concentra-tion. The solid lines are for the segregated surface, while thedashed lines are for the unsegregated surface. The plus, aster-isk, cross, and circle are for 400, 600, 800, and 1000 K, respec-tively.
FIG. 4. The chemical-potential contribution to the grandpotential —Cz „,hp vs the bulk concentration. The plus, aster-isk, cross, and circle are for 400, 600, 800, and 1000 K, respec-tively.
(T =400 K). For Cz )0.5, the smallest surface free ener-
gy is found at the highest temperature studied (T =1000K). These results may be understood by considering theeffects of bulk concentration and temperature on thesegregation behavior [see Fig. 2(c)]. The degree of Cusegregation is greatest at low temperatures and for bulkconcentrations on the Ni-rich side of the phase diagram.In this regime (low T, small Ca), where the degree ofsegregation is a maximum, I, , is a minimum. On theother hand, at high T and large Cz the degree of segrega-tion is small. In this regime, the ordering of the differenttemperature curves in the I, , vs Cz plot are as they arein the absence of segregation.
In order to understand I,„we can examine the termsthat contribute to it independently: the enthalpy H„ theentropic term TS„and the chemical-potential termCz» hp. In Fig. 4, —C&» hp, the contribution of thechemical potential to I,„is plotted against the bulk con-centration, where hp (see Fig. 13) is the chemical-potential difference between Cu and Ni and Cr„, [seeFig. 2(c)] is the total excess concentration of Cu. Thisterm is zero for pure Cu and for pure Ni, since Cz „, iszero there, and has a minimum at 0. 15 & C& &0.35. Theposition of the minimum moves to smaller Cz with de-creasing temperature. For the range of concentrationsand temperatures shown in Fig. 4, hp is positive and is oforder unity (see the Appendix). That —Cr „,b,p is nega-tive indicates that the chemical-potential contributionfavors Cu segregation.
S, is defined as minus the partial derivation of the sur-face grand potential I, with respect to temperature atfixed pressure and chemical potential. Alternatively, S,may be defined as minus the partial derivative of the sur-
face free energy G, with respect to temperature at fixedpressure and composition. S, „was determined from theG, data in this manner. The dependence of the surfaceentropy S, on the bulk concentration Cz is plotted in Fig.5(a) for four different temperatures, with and withoutsegregation. S, „varies only slightly with compositionand temperature in this alloy system; decreasing smooth-ly from its pure Ni to its pure Cu value.
The same numerical method for calculating S, „can-not be applied to the determination of S„since we haveneither a series of I, data at constant chemical potential(at fixed Cz, bp varies with T) nor a series of G, data atconstant surface composition. The method we employedto determine S, , was to equilibrate the surface at a par-ticular temperature T, determine its free energy G ( T),and then evaluate G (T +6 T) and G ( T hT) with the-same surface structure and composition profile equilibrat-ed at temperature T. S, , at T was then determined fromS„=—[G(T+b T) G(T DT)]I2b T.—T—his methodis clearly approximate; however, since the free energy canbe determined rapidly at any temperature for fixed struc-ture and composition profile, it is very eScient. In orderto determine the accuracy of the method, we determinedG ( T + b, T) and G ( T 6T) from full —relaxations atT +hT and T—AT for a few cases in the grain boundarycalculations. We find that if we limit hT to be less than10 K, the values of the entropy determined using the fullyrelaxed and approximate methods differed by less than0.01%. The surface entropy in the segregated case [Fig.5(a)] has a well-defined maximum at Cz (0.2 and a well-defined minimum at Cz ~0.8. Both the low C~ max-imum and the high Cz minimum become more pro-nounced with decreasing temperature. This relativelycomplex behavior may be traced to the fact that the S, ,

12 034 WANG, NAJAFABADI, SROLOVITZ, AND LESAR 45
has two physically different components: configurationaland vibrational.
The surface configurational entropy S, „determinedfrom Eq. (2), is plotted as a function of the bulk concen-tration Cz in Fig. 5(b). Like S, itself, S, , has both low
Cz maxima and high C& minima which become morepronounced with decreasing temperature (i.e., increasingsegregation). S, , must go to zero at both Cs =0 and
Cz =1, since there is no segregation in pure systems. Themaxima in S, , occurs at small Cz where segregation ismost severe and the minima occur at higher Cz, wheresegregation is weak. The values for S, , are negative atthe minimum because the configurational entropy of thebulk is a maximum at C& =0.5 and S, , is the differencebetween the configurational entropy of the system withand without the surface. In fact, the shape of the S, ,
versus composition curve can be reasonably well repro-duced from the composition dependence of the perfect-crystal configurational entropy by replacing Cz on theabscissa of Fig. 15(b) with C& and subtracting the originalperfect-crystal configurational entropy.
The surface vibrational entropy, including both har-monic and anharmonic contributions, may be determinedas S, , =S,—S, , and is plotted as a function of the bulkconcentration in Fig. 5(c). The unsegregated-surface vi-brational entropy (dotted curves) is equal to the total sur-face entropy, since S, , is zero for the unsegregated sur-face. The segregated-surface vibrational entropy (solidcurves) is reminiscent of the dependence of the excesssurface concentration Cz „, on Cs [see Fig. 2(c)j. Thesegregated-surface vibrational entropy exhibits a max-imum at approximately the same C~ as the maximum in
~4p & r & i
I
r & i i
I
i i s0.
+ T=40PK
0.30—
0.15 I I I I
I
I I I I
I
I I f I
I
I I I l
I
I I I I
+ T=400K
0.10
o.os—
0.20— 0.00—
0.10—-0.05—
-0.10—
pp i & g & I i I I s & i i I0.0.00 0.20 0.40 0.60 0.80 1.00
-0.150.00 0.20 0.40 0.60 0.80 1.00
B
0.35 I I
I
I I I I l l I I
I
I I I I
I
I 1 i I
+ T=400K
B
0.30—
0.25—
0.20—
Cf} ) .0.15 =
0 ] P0.00 0.20
I
0.40 0.60 0.80 1.00
B
FIG. 5. (a) The total surface entropy, (b) configurational entropy, (c) and vibrational entropy vs the bulk concentration. The solidlines are for the segregated surface, while the dashed lines are for the unsegregated surface. The plus, asterisk, cross, and circle arefor 400, 600, 800, and 1000 K, respectively.
45 (100) SURFACE SEGREGATION IN Cu-Ni ALLOYS 12 035
the excess concentration, which may be understood interms of the relative magnitude of the vibrational entropyof pure Ni and pure Cu. Figure 15(a) clearly shows thatthe vibrational entropy of Ni is lower than that of Cu andthat the vibrational entropy of the solid solution alloy isnearly a linear interpolation between these limits(Vegard's law). Therefore, the form of the S, „vs C~ plotis directly attributable to the degree of segregationpresent and the linear form of the composition depen-dence of the vibrational entropy.
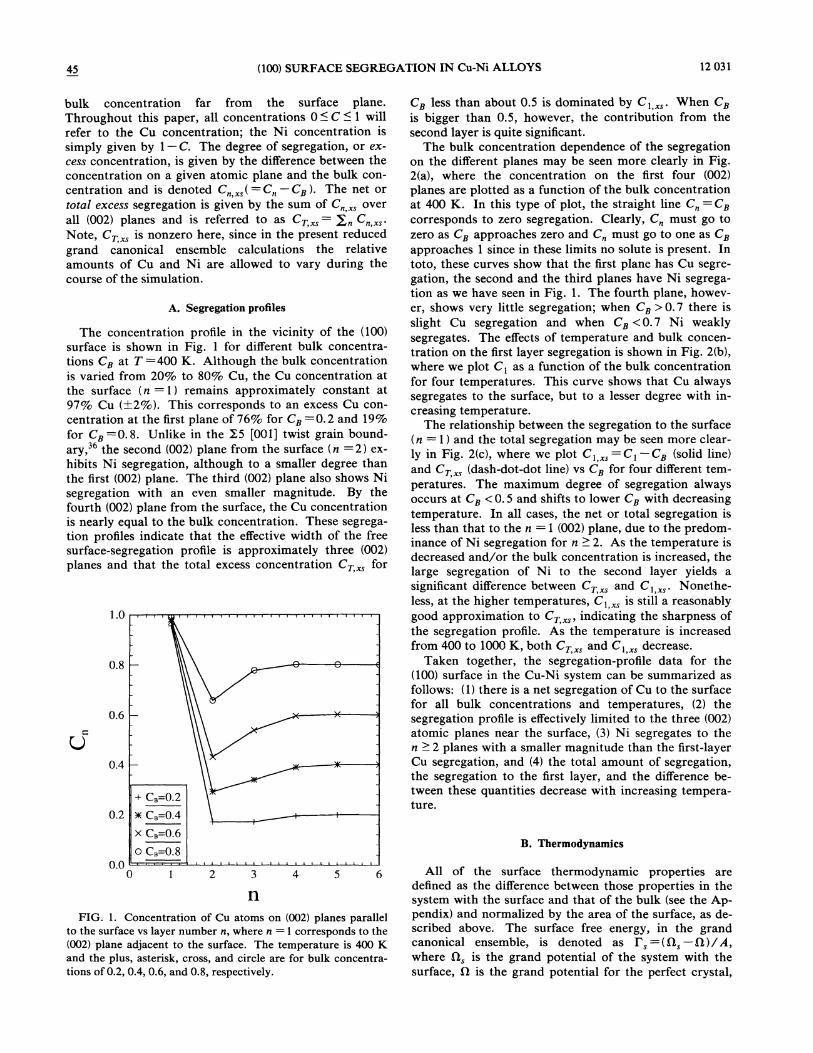
The surface enthalpy may be determined fromknowledge of the surface free energy and the other ther-modynamic data: H, =I,+Cz, hp+ TS, . The depen-dence of H, on the bulk concentration is shown in Fig. 6.Again, the enthalpy of the unsegregated surface (dotted)is very simple, decreasing from the pure Ni to the pureCu value in a nearly linear manner. Furthermore, theenthalpy of the unsegregated surface is only weakly tem-perature dependent. In the case of the segregated surface(solid), the dependence of the surface enthalpy on temper-ature is again reminiscent of the bulk concentrationdependence of the excess surface concentration Cz „,.H, , has a well-defined maximum at small Cz and in-creases with decreasing temperature. As with the vibra-tional entropy, the enthalpy of the perfect crystal exhibitsa nearly linear increase with Cu concentration from asmall value in pure Ni to a larger value in pure Cu (seeFig. 14). Therefore the form of the H, , plot in Fig. 6may be attributed to the bulk concentration dependenceof the Cu segregation and the proportionality between Cuconcentration and the enthalpy. Since H, , —H, „&0,enthalpy discourages segregation (i.e., raises I,). It is, infact, H, —hp Cr, that favors segregation (compare Figs.4 and 6).
The freedom of particles to move in the direction nor-
mal to the surface results in zero net surface traction.Associated with these atomic motions is a change in theseparation between the (002) planes near the surface. Thechange of the separation between the nth and the(n+1)th planes, d„„+„is defined as the difference be-tween the separation of those two planes in a solid withand without a surface. The bulk concentration depen-dence of d& z, dz 3, and d3 ~ is plotted in Figs. 7(a) —7(c),respectively. In the unsegregated cases (dotted line), d
& zdecreases from the value in pure Ni to that in pure Cuwith very little curvature. Except for T=400 K, whered, 2 for an unsegregated surface is negative over thewhole bulk concentration region, d
& 2 is positive at theNi-rich end and negative at the Cu-rich end of the phasediagram. While calculations at T=O for both pure Niand Cu using the present EAM potentials yield negatived
& 2, the common observations of inward surface relaxa-tions may not generally hold at elevated temperatures.For the segregated surfaces (solid line), the value of d& zis generally larger than that of the corresponding un-segregated case, due to the strong first-layer Cu segrega-tion and the fact that Cu atoms are larger than Ni atoms.The exception to this trend is in the region of Cz &0.7and T =400 K, which may be the result of the strong Nisegregation to the second layer. For d23 and d34 theunsegregated curves (dotted line) are simply linear inter-polations between the value for pure Ni and pure Cu.
3 for the segregated surface is always smaller than inthe unsegregated case, due to the Ni segregation to thesecond and the third plane. d3 4 is smaller with segrega-tion than without for Cz &0.8 and larger for Cz &0.8,which may be the result of Ni segregation to the fourthlayer for C~ &0.7 and weak Cu segregation for C~ & 0.7.
IV. DISCUSSION
3500 I I f I
I
I I l I
I
I I I I
I
I I I II
I I i I
+ T=4
3000
2500
2000—
1500—
000 I I I I I I I I I I I I I I I I I I I I I I I I10.00 0.20 0.40 0.60 0.80 1.00
B
FIG. 6. The surface enthalpy H, vs the bulk concentration.The solid lines are for the segregated surface, while the dashedlines are for the unsegregated surface. The plus, asterisk, cross,and circle are for 400, 600, 800, and 1000 K, respectively.
Comparison of the simulation results on the segregatedand unsegregated surfaces demonstrates that the degreeof segregation plays a major role in determining the sur-face thermodynamics. For the unsegregated surface, thesurface properties (such as the free energy, entropy,enthalpy, and expansion) vary with concentration in avery simple, smooth manner and variations with temper-ature simply result in nearly uniform shifts of theproperty-versus-composition curves. The segregated sur-face, on the other hand, shows very complicated behav-ior, which can be understood by examining the differentcontributions to the free energy.
To investigate the nature of the correlations betweensegregation and surface properties, we need to focus onthe thermodynamic properties that depend on the segre-gation and not on the intrinsic properties of the surfaceitself, i.e., the excess thermodynamic properties definedearlier, i.e., ~,=X, , —X, „,where X is the property ofinterest. Figure 8(a) shows the excess vibrational entropyhS, „as a function of the total excess concentrationCr„,. Similarly, Figs. 8(b) and 8(c) show the excessenthalpy hH, and the excess separation between the firsttwo planes hd, z as a function of Cz, . These plots con-

%ANG, NAJAFABADI, SROLOVITZ, AND LESAR
sist of data taken over the entire range of temperatureand concentration reported in the previous section. In allthree cases, we find that there is a linear relationship be-tween these surface thermodynamic properties and thetotal excess concentration. Linear numerical fits to thisdata yield hX, =mCT „, with the slope m =0.190+0.002mJ/m K for AS, „1956+14 mJ/m for EH„and0.0367+0.0004 A for hd 1 z. The configurational contri-bution to the excess surface entropy hS, , does not exhib-it a linear dependence on CT„, due to the explicitlyprescribed nature of the configurational entropy [Eq. (2}j.The excess surface grand potential AI', is approximatelya linear function of CT, . However, due to the presenceof the AS, , term, there is considerably more scatter thanfor AS, „AH„and Ad
& 2.
We have previously calculated the thermodynamicproperties for a grain boundary in Cu-Ni binary alloys asa function of temperature and bulk concentration,where we considered the cases with and without segrega-tion. For the case where no segregation is allowed, thethermodynamic properties of the grain boundaries (e.g. ,free energy, entropy, enthalpy, and the separation be-tween planes at the boundaries} show almost the samescaling with bulk concentration and the temperature aswe find here for the free surface. However, the overallsegregation is different in detail for the two types of inter-faces. First, the width of the boundary in terms of thesegregation profile is somewhat larger for the free surfacethan for the grain boundary. We found the boundarywidth for the grain boundary studied to be approxi-
0..030 I I I I
I
I I I I
I
I I I I
I
I I I I
I
I I I I .000,I I I
I I
I
I I I0
0.020—-0.005
~ 0.010—0
0.000 .—+
-0.010—-0.015—
Q 02Q I I I I I I I I I I I I I I I I I I
0.00 0.20 0.40 0.60 0.80 1.00-0.020
0.00 0.20 0.40 0.60 0.80 1.00
0,001 I I
I
I I I I
B
0.000 )~
-0.001
0~ -0.002 c}
-0.003
-0.004
o T=1000K
0.00 0.20 0.40 0.60 0.80 1.00
B
FIG. 7. The change of the separation between the first three pairs of planes (a) d, 2, (b) d2 „and (c) d3 4 vs the bulk concentration.
The change of the separation between a pair of planes is defined as the difference between the spacing between two atomic planes and
their separation in a perfect crystal. The solid lines are for the segregated surface, while the dashed lines are for the unsegregated
surface. The plus, asterisk, cross, and circle are for 400, 600, 800, 1000 K, respectively.

45 (100) SURFACE SEGREGATION IN Cu-Ni ALLOYS 12 037
mately two layers on each side of the interface. For thesurface studied here, however, the segregation decayssomewhat slower, with a width of three layers instead oftwo. Cu segregates strongly to both grain boundary andfree surface, although the grain-boundary segregationwas found to be weaker than the surface segregation.However the total excess concentration is quite different,due to the tendency for Ni segregation in the second (002)layer from the surface and the Cu segregation to thesecond (002) layer from the grain boundary. As in thefree-surface case, most of the grain-boundary excess ther-modynamic properties exhibit a linear dependence on thetotal excess concentration.
As described above, all of the equilibrium surfaceswere obtained by minimizing the ground potential 0 [Eq.(3)] with respect to the position and the concentration of
C„Cs gFl —C„ l —C,
'"PaC„
(4)
where P= 1 /k' T and F is the free energy of the systemexcluding the configurational entropy
F=E+A„.
Classical theories of segregation, such as Langmuir-McLean and Fowler-Guggenheim models, are based onapproximations to the heat of segregation
each site in the system. Taking the derivative of the min-
imized grand potential Q with respect to the concentra-tion of plane n thus yields an analytic formula for calcu-lating the concentration on plane n,
20 s s s s
~
r s s r
~
s s s s
~
s & s0. 2000 s s
~
& y»~
r I
0.15 1500
0.10 1000
C] 0.0S 500
0.000.00 0.20 0.40 0.60
I I I
0.80 1.0000.00 0.20 0.40 0.60 0.80 1.00
T,XS
~ 035[
~, , s s0
T,XS
0.030
0.025
0.020
0.015
(c)
0.010
0.005
0.0000.00 0.20 0.40 0.60 0.80 1.00
T,xs
FIG 8. (a) The excess surface vibrational entropy AS„(b) excess surface enthalpy EH„and (c) excess separation between the firsttwo (002) planes hd& 2 vs the total excess concentration. All of these quantities are simply the difference between their values with
and without segregation. The plus, asterisk, cross, and circle are for 400, 600, 800, and 1000 K, respectively. The straight lines are fitto all of the data in each figure.

12 038 WANG, NAJAFABADI, SROLOVITZ, AND LESAR 45
Q„(=OF/dC„—t)F/t)C& ). The Langmuir-McLean for-mula is derived on the basis of first-layer segregation,with noninteracting segregants and equivalent segrega-tion sites, i.e., the heat of segregation Q, is a constantThe Fowler and Guggenheim model is somewhat moresophisticated in that nearest-neighbor interactions are in-cluded, and Q& is thus a linear function of the surfaceconcentration,
+20 ZCs —(1+5)Z,C, —(1+5)Z,Cs
+—'z +' 'z1 2 v (7)
0 08
-0.10
-0.12
-0.16—
o T=1000K
I I I I I I I I I I I I I, I-0.0.00 0.20 0.40 0.60 0.80 1.00
FIG. 9. The heat of surface segregation Q,(=OF/BC& —BF/BC&) for the relaxed surface vs the bulk con-centration C&. The plus, asterisk, cross, and circle are for 400,600, 800, and 1000 K, respectively.
Q, =aC, +b,G,where a is a constant that is determined by the coordina-tion number of the segregant sites and the strength of theinteraction between solutes.
Our results for Q& (evaluated as r)F/BC, dF/r—)Cs)are plotted as a function of the bulk concentration C~ inFig. 9. It is clear that Q& is neither a constant nor simplya linear function of the surface concentration, but ismuch closer to a linear function of the bulk concentra-tion. It is not surprising then that the Langmuir-McLeanformula and the Fowler-Guggenheim model are not goodapproximations to the surface segregation found in thepresent study.
A later model ' modified the Fowler-Guggenheimmethod to include interactions within the surface layerand the bulk and also included a parameter 5 whichempirically accounts for surface relaxation. In this mod-el, the heat of surface segregation Q, is given as
[Z„—(Z, +Z, )5]Q, = bHs~b
where AH, „b is related to the difference of the sublima-tion energy between A and B atoms; 0 is the regularsolution parameter defined as E„s —0 5.( e„„+e~s), and
czar, czar, and czar are the interaction energies betweenA-B, A-A, and B-B bonds, respectively; Z„Z„and Zare the number of lateral surface bonds, vertical surfacebonds, and perfect-crystal nearest-neighbors bonds, re-spectively. Within the framework of this model, thevalue of EH,„b is estimated by relating the sublimationenergy and the surface energy. For the (100) surface, thesublimation energy of the pure material H,„b is given by
ZQO'
based upon a simple bond-counting argument, where y isthe surface energy and o. is the area per atom. However,this result is known empirically to underestimate H,„bby about a factor of 2, thus we use H,„b=6yo. and thedifference of the sublimation energy between A atom andB atom is given by
(9)
The regular solution parameter is evaluated by replac-ing one atom of the perfect crystal A with a B atom andthen calculating the difference of the energy betweenthese two crystals. If the atoms interact with nearest-neighbor pair interactions, that difference is roughlyequal to 12(e„s—e„„). Similarly, by replacing one atomof the perfect crystal B with an A atom, we will have thedifference of 12(E„s—Ess). The addition of these twodifferences divided by 24 is the value of Q. Using this ap-proach with the EAM potentials employed in the presentstudy we find bH, „b=0.495 eV/atom and A=0.0042 eV.In order to apply this method of determining the equilib-rium surface segregation, we need to determine the valueof the parameter 5 in Eq. (7). Best fit to our surface-segregation data as a function of bulk concentration andtemperature was obtained with 5=0.16. Figure 10 showsC, versus the bulk concentration results obtained for oursimulation along with the behavior predicted by Eq. (7)with all of the parameters chosen as above. In general,the agreement found between simulation and the empiri-cal 5 formalism is excellent over the entire range of data.The theoretica1 predictions slightly overestimate the rnag-nitude of the Cu surface segregation on the Ni side of thephase diagram and underestimate it on the Cu rich side.
If 5 is set to zero, then Eq. (7) is closely related to theFowler-Guggenheim model, which does not fit the segre-gation results from the simulations. The parameter 5 isintroduced in the model to account for the relaxation ofthe surface. However, since 6 was obtained by fitting tothe simulation data, it probably accounts for other inac-curacies in the theory. These may include interactionsbeyond nearest neighbors, many-body effects, vibrationalentropy, segregation to atomic planes below the surface,etc.
In order to examine the effect of surface relaxations onsurface segregation we compare the heat of segregationQ, with and without relaxation based upon our 400 K
45 (100) SURFACE SEGREGATION IN Cu-Ni ALLOYS 12 039
1.0
0.8
0.6— XI
I
c)
04s I
I
I Is I
s
0.2I
sII
0 p s s s I I s
P.PO 0.20
+ T=400K
x T=6PPK
x T=8PPK
o T=1000K
s s s I s s s s I s s s s I s s s
0.4P 0.60 0.80 1.00
B
p 1p s s s s
I
s s s s
I
s s
I
s
-0.11—
-0.12—
tomic potentials were designed to consistently describethe metals Cu, Ni, Ag, Au, Pd, and Pt and their alloys.Foiles developed another set of EAM potentialsspecifically for the Cu-Ni system. The details of the sur-face segregation results found with the two EAM poten-tials are significantly different. The segregation resultscalculated with these special Cu-Ni potentials are some-what closer to the experimental values. However, the po-tential given by Foiles, Baskes, and Daw is sufficientlyaccurate for the purpose of the present paper, which are
FIG. 10. The Cu concentration on the first layer C& given bythe simulation (symbols) and by Eq. (7) (lines) vs the bulk con-
centration C~. The plus and solid line, asterisk and dotted line,cross and dashed line, and the circle and dashed-dotted line arefor 400, 600, 800, and 1000 K, respectively.
-0.13—Q
-0.14—
-0.15—
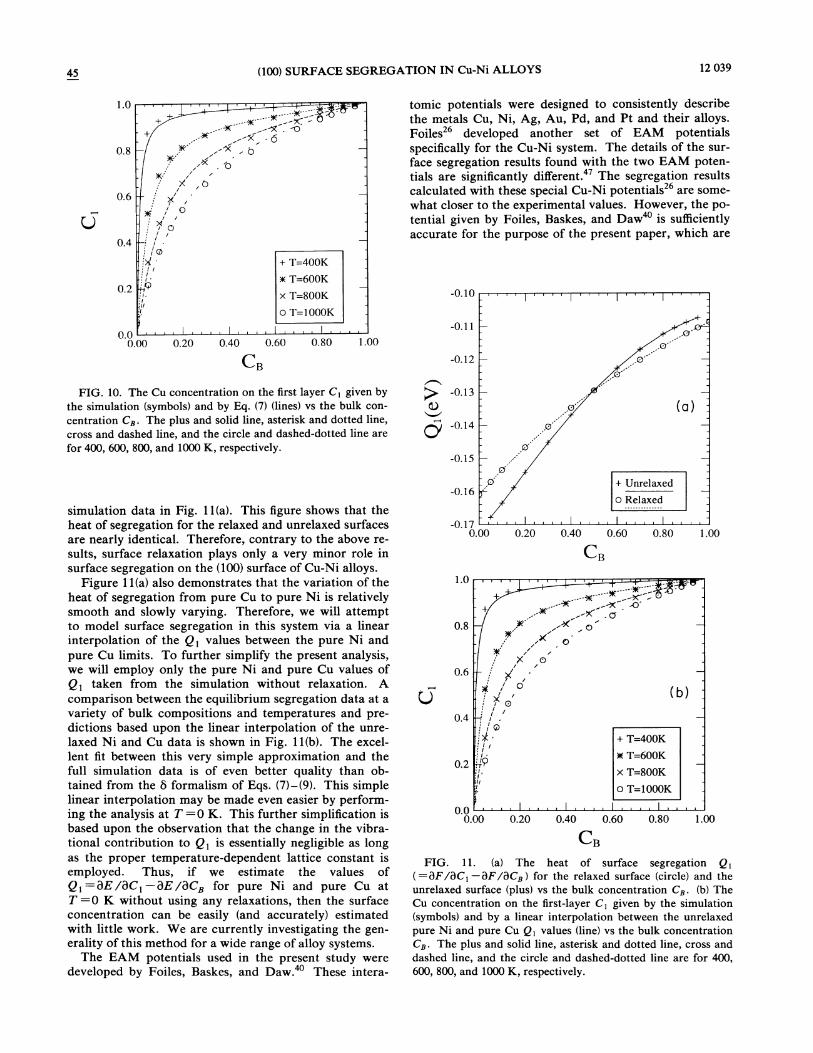
simulation data in Fig. 11(a). This figure shows that theheat of segregation for the relaxed and unrelaxed surfacesare nearly identical. Therefore, contrary to the above re-sults, surface relaxation plays only a very minor role insurface segregation on the (100) surface of Cu-Ni alloys.
Figure 11(a) also demonstrates that the variation of theheat of segregation from pure Cu to pure Ni is relativelysmooth and slowly varying. Therefore, we will attemptto model surface segregation in this system via a linearinterpolation of the Q, values between the pure Ni andpure Cu limits. To further simplify the present analysis,we will employ only the pure Ni and pure Cu values ofQ& taken from the simulation without relaxation. Acomparison between the equilibrium segregation data at avariety of bulk compositions and temperatures and pre-dictions based upon the linear interpolation of the unre-laxed Ni and Cu data is shown in Fig. 11(b). The excel-lent fit between this very simple approximation and thefull simulation data is of even better quality than ob-tained from the 5 formalism of Eqs. (7}—(9}. This simplelinear interpolation may be made even easier by perform-ing the analysis at T =0 K. This further simplification isbased upon the observation that the change in the vibra-tional contribution to Qt is essentially negligible as longas the proper temperature-dependent lattice constant isemployed. Thus, if we estimate the values ofQ, =BE/BC, BE/BCs for pur—e Ni and pure Cu atT=0 K without using any relaxations, then the surfaceconcentration can be easily (and accurately) estimatedwith little work. We are currently investigating the gen-erality of this method for a wide range of alloy systems.
The EAM potentials used in the present study weredeveloped by Foiles, Baskes, and Daw. These intera-
-0.16 j-
0 17 s» s I I
P.PP 0.20 0.40 0.60s I s s s s
0.8P 1.00
B
1.0
0.8
s s, s s sT 1
~&X
G
-es
s /0.6--
I 0
0.4 - I',I g
g ~
~ I
0.2
+ T=400K
% T=600K
x T=800K
o T=1000K
0.00.00 0.20
s s s I s s s s I s s s s I s s s s
0.40 0.60 0.80 1.00
B
FIG. 11. (a) The heat of surface segregation Q,(=OF/BC, —BF/BC&) for the relaxed surface (circle) and theunrelaxed surface (plus) vs the bulk concentration C&. (b) TheCu concentration on the first-layer C& given by the simulation(symbols) and by a linear interpolation between the unrelaxedpure Ni and pure Cu Q, values (line) vs the bulk concentrationC&. The plus and solid line, asterisk and dotted line, cross anddashed line, and the circle and dashed-dotted line are for 400,600, 800, and 1000 K, respectively.

12 040 WANG, NAJAFABADI, SROLOVITZ, AND LESAR 45
to investigate surface-segregation and surface thermo-dynamic trends across a wide range of alloy compositionsand temperatures.
Finally, we note that the data presented here representthe results of approximately 120 atomistic simulations inwhich the equilibrium composition profile and surfacethermodynamics were determined. Since the focus of thecurrent work was to determine trends in surface-segregation behavior, such a large number of simulationswas necessary. The only practical method for performingsimulations on the required scale is the free-energyminimization method used here. Competing methods,such as Monte Carlo simulations in the (reduced) grandcanonical ensemble, require orders of magnitude morecomputer time to achieve similar results (i.e., equilibriumsegregation profiles). In addition, we note that there isessentially no other practical method available to obtainthe free energy of segregation, which played an importantrole in understanding the results. Therefore, althoughthe free-energy simulation methods employed are, by na-ture, approximate, they represent the only viable methodto study trends in segregation thermodynamics.
~ 10 I
I
I I I I
I
I I I I
I
I I 1 I
I
I I I I1
1.00—
0.90—Q
0.80—
+-~~~~
/0.70 —g
/ 0
0.600.00 0.20 0.40 0.60
T=400K
T=600K
T=SOOK
T=1000K
I I I I I I I I
0.80 1.00
B
FIG. 13. The relationship between the Cu concentration andhp.
V. CONCLUSIONS
Atomistic simulations of segregation to (100) free sur-face in Ni-Cu alloys have been performed for a widerange of temperatures and compositions within the solidsolution region of the alloy phase diagram. In addition tothe surface-segregation profile, surface structures, free en-ergies, enthalpies, and entropies were determined. Thesesimulations were performed within the framework of thefree-energy simulation method, in which an approximatefree-energy functional is minimized with respect to atom-ic coordinates and atomic-site occupation. For all alloybulk compositions (0.05 ~ C ~0.95) and temperatures
[400 ~ T (K) & 1000j examined, Cu segregates strongly tothe surface and Ni segregates to the planes just below thesurface. The width of the segregation profile is limited toapproximately three atomic planes. The resultant segre-gation profiles are shown to be in good agreement with anempirical segregation theory. A simpler method fordetermining the equilibrium segregation in terms of theproperties of unrelaxed pure Ni and pure Cu surface datais proposed and shown to be more accurate than existingempirical segregation analyses. The surface thermo-dynamic properties depend sensitively on the magnitudeof the surface segregation. The enthalpy, entropy ofsegregation, and the change in the interlayer spacing ad-
~ 60 « ~ &
I
& & s-3
-3.80— X
X
-4.00—Qf
-4.40 —~~ W ~~ ~~ + T=400K
-4.60 ~ x T=800K
o T=1000K
-4.80 I I I I I I I I I I I I I I I I I I I I I I I I
0.00 0.20 0.40 0.60 0.80 1.00
H~Px~Px
~ x@~&—
P y~r'&p'g
-3.50—
~ -3.70—
-3.90—
-4.10 —r
-4.300.00 0.20
+ T=400K
x T=600K
x T=800K
o T=1000K
I I I I, I I I I I I I
0.40 0.60 0.80I
1.00
-3- .30 I I I I
I
I I I I
I
I I I I
I
I 1 I I
I
1 I l~
B
FIG. 12. The Gibbs free energy G as a function of Cu con-centration at four difterent temperatures.
FIG. 14. The enthalpy H as a function of the bulk Cu con-centration.

(100) SURFACE SEGREGATION IN Cu-Ni ALLOYS
jacent to the surface are shown to vary linearly with themagnitude of the surface segregation.
ACKNOWLEDGMENTS
&e gratefully acknowledge the Division of MaterialsScience of the Once of Basic Energy Sciences of the U. S.Department of Energy (DOE BES DMS), Grant No.F002-88ER45367 for its support of this work. The workof R. L. was also supported, in part, by DOE BES DMS.
APPENDIX
Before the structure, segregation and properties of sur-faces in Cu-Ni alloys can be examined, it is first necessary
x10~
- (0) T=1000K6.00—
8
5.50— T=SOOK
5.00—T=600K
4.50—
4.00—+ re+~» E4oeK
3..00 I I I ~ I I I I i I i I I I I I I I i I I I I I
0.00 0.20 0.40 0.60 0.80 1.00
to determine the properties of perfect crystals in this al-loy system. We determined the structure and propertiesof perfect solid-solution Cu-Ni crystals by minimizing thegrand potential at fixed values of temperature, concentra-tion, and pressure. In the present calculations, we set theexternal pressure to zero. The composition was fixed interms of the chemical-potential difference between Ni andCu atoms. Since the only crystalline structure thatoccurs in the Cu-Ni phase is the face-centered-cubicstructure (above 250 K), the grand potential minimiza-tion was performed with respect to the single-lattice pa-rameter.
The Gibbs free energy 6 is plotted as a function of Cuconcentration at four different temperatures in Fig. 12.The free energy monotonically increases with increasingCu concentration and decreasing temperature. Concen-tration is varied in these simulations by changing thechemical-potential difference hp= —BG/BC+. The rela-tionship between concentration and Ap is nonlinear, asshown in Fig. 13. The slopes of the curves in this plot in-crease with increasing temperature and become horizon-tal in the limit that T goes to zero due to the requisitezero solubility at zero temperature.
The enthalpy H is plotted as a function of bulk concen-tration in Fig. 14. H is equal to the total internal energysince the simulations were performed at zero pressure,and is equal to the potential energy plus 3k& T. The 3k~ Tcomes from the vibrational energy within the classical ap-proximation. The enthalpy increases in a nearly linearmanner as the concentration is increased from pure Ni topure Cu. Increasing temperature simply shifts theenthalpy versus Cz curves to higher enthalpy.
The entropy consists of two parts: vibrational andconfigurational. The vibrational entropy S„ is plottedagainst the bulk concentrations Cz in Fig. 15(a). Like theenthalpy, the vibrational entropy increases with increas-
x10~0 ' pm~wg
0.50— /
t0.40—
0.30—/
/0.20 —I
1-I
0.10 7-I
0.000.00 0.20 0.40 0.60
I I il
I i I I
't
l
i I. . . i
0.80 1.00
3~74 I I I I I I ~ I I I I I
+ C=O.O
% C=0.253 70 —x C=0.50
- o C=0.75- o C=1.0
3.66
I il
i I I I
l
I I i I
l
i i i il
i I ~ I
li i l i
3.62 y-
3.58—
~X
~3K
+
I I I I I
3.54 ~i i i i i » i i I i i i i l i i i i 1 I i I I I I I ~ I I i i I I I i t i I
400 500 600 700 800 900 1000 1100 1200
FIG. 15. (a) The vibrational entropy S, vs the bulk concen-tration C&. (b) Concentration dependence of the configurationalentropy S, .
T(K)FIG. 16. The temperature dependence of the lattice parame-
ter, for five different alloy compositions.

12 042 WANG, NAJAFABADI, SROLOVITZ, AND LESAR 45
ing Cu concentration in a nearly linear manner and in-creasing temperature simply shifts these curves to higherentropy. The concentration dependence of theconfigurational entropy S, is shown in Fig. 15(b). Withinthe simple point approximation employed within thepresent simulations, S, is simply a function of concentra-tion and is independent of atom type or temperature.
Although the free-energy model is harmonic in nature,the fact that the interatomic potentials are anharmonicresult in a nonzero coeScient of thermal expansion. The
temperature dependence of the lattice parameter is indi-cated in Fig. 16 for five different alloy compositions.These curves may be fitted with a second-order polynomi-al, yieldinga(T)=3. 522+4. 55X10 T+1.54X10 Tfor pure Ni and a(T)=3.618+5.02X10 T+2.05X 10 T for pure Cu where T is in kelvin and a (T) is inangstroms. This leads to a room-temperature, linear-expansion coeScient of 1.5 X 10 for Ni and 1.7 X 10for Cu, which in both cases is within 15%%uo of the experi-mental values.
P. Van der Plank and W. M. H. Sachtler, J. Catal. 12, 35(1968).
J. H. Sinfelt, J. L. Carter, and D. J. C. Yates, J. Catal. 24, 283(1972).
V. Ponec and W. M. H. Sachtler, J. Catal. 24, 250 (1972).4T. M. Buck, in Chemistry and Physics of Solid Surfaces IV'
edited by R. Vanselow and R. Howe (Springer-Verlag, Berlin,1982).
A. Joshi, in Interfacial Segregation, edited by W. C. Johnsonand J. M. Blakely (American Society for Metals, Metals Park,OH, 1979).
P. R. Webber, C. E. Rojas, P. J. Dobson, and D. Chadwick,Surf. Sci. 105, 20 (1981).
7K. Wandelt and C. R. Brundle, Phys. Rev. Lett. 46, 1529(1981).
F. J. Kuijers and V. Ponec, Surf. Sci. 68, 294 (1977).C. R. Helms and K. Y. Yu, J. Vac. Sci. Technol. 12, 276 (1975).
' K. Watanabe, M. Hashiba, and T. Yamashina, Surf. Sci. 61,483 (1976).
"G.Ertl and J. Kuppers, Surf. Sci. 24, 104 (1974).'ZD. T. Quinto, V. S. Sundaram, and W. D. Robertson, Surf.
Sci. 28, 504 (1971).' Y. Takasu and H. Shimizu, J. Catal. 29, 479 (1973).' C. R. Helms, J. Catal. 36, 114 (1975).
D. T. Ling, J. N. Miller, I. Lindau, W. E. Spicer, and P. M.Stefan, Surf. Sci. 74, 612 {1978).
6P. J. Durhan, R. G. Jordan, G. S. Schal, and L. T. Wille, Phys.Rev. Lett. 53, 2038 (1984).
' K. Wandelt and C. R. Brundle, Phys. Rev. Lett. 46, 1529(1981).D. G. Swartfager, S. B.Ziemecki, and M. J. Kelly, J. Vac. Sci.Technol. 19, 185 (1981).
9H. H. Brongersma and T. M. Buck, Surf. Sci. 53, 649 (1975).H. H. Brongersma, M. J. Sparnay, and T. M. Buck, Surf, Sci.71, 657 (1978).
2~H. H. Brongersma, P. A. J. Ackermans, and A. D. van
Langeveld, Phys. Rev. B 34, 5974 (1986).Y. S. Ng, T. T. Tsong, and S. B. McLane, Jr., Phys. Rev. Lett.42, 588 (1979).Y. S. Ng, T. T. Tsong, and S. B. McLane, Jr., J. Appl. Phys.5$ 6189 (-108O)
24T. Sakurai, T. Hashizume, A. Jimbo, A. Sakai, and S. Hyodo,Phys. Rev. Lett. 55, 514 (1985).T. Sakurai, T. Hashizume, A. Kobayashi, A. Sakai, S. Hyodo,
Y. Kuk, and H. W. Pickering, Phys. Rev. B 34, 8379 {1986).S. M. Foiles, Phys. Rev. B 32, 7685 (1985).S. M. Foiles, Phys. Rev. B 40, 11502 (1989).J. Eymery and J. C. Joud, Surf. Sci. 231, 419 {1990).S. Mukherjee, J. L. Moran-Lopez, V. Kumar, and K. H. Ben-nemann, Phys. Rev. B 25, 730 (1982).S. Mukherjee and J. L. Moran-Lopez, Frog. Surf. Sci. 25, 139(1987).
'S. Mukherjee and J. L. Moran-Lopez, Surf. Sci. 188, L742(1987).Y. C. Cheng, Phys. Rev. B 34, 7400 (1986).H. F. Lin, C. L. Wang, and Y. C. Cheng, Solid State Commun.59, 253 (1986).F. L. Williams and D. Nason, Surf. Sci. 45, 377 (1974)~
R. Najafabadi, H. Y. Wang, D. J. Srolovitz, and R. LeSar,Acta Metall. Mater. 39, 3071 (1991);H. Y. Wang, R. Najafa-badi, D. J. Srolovitz, and R. LeSar, in Defects in Materials,edited by Paul D. Bristowe, J. Ernest Epperson, J. E.GrifKth, and Z. Lilietal-Weber, MRS Symposia ProceedingsNo. 209 (Materials Research Society, Pittsburgh, 1991).H. Y. Wang, R. Najafabadi, D. J. Srolovitz, and R. LeSar,Philos. Mag. (to be published).R. LeSar, R. Najafabadi, and D. J. Srolovitz, Phys. Rev. Lett.63, 624 (1989)~
8R. LeSar, R. Najafabadi, and D. J. Srolovitz, J. Chem. Phys.94, 5090 (1991).M. S. Daw and M. I. Baskes, Phys. Rev. Lett. 50, 1285 (1983);Phys. Rev. B 29, 643 (1984).S. M. Foiles, M. I. Baskes, and M. S. Daw, Phys. Rev. B 33,7983 (1986).R. Najafabadi, D. J. Srolovitz, and R. LeSar, J. Mater. Res. 5,2663 (1990)~
42R. Najafabadi, D. J. Srolovitz, and R. LeSar, J. Mater. Res. 6,999 (1991).K. Huang, Statistical Mechanics (Wiley, New York, 1963).
44A. P. Sutton and R. W. Balluffi, Crystal Interfaces (OxfordUniversity Press, Oxford, to be published).
45R. H. Fowler and E. A. Guggenheim, Statistical Thermo-
dynamics (Cambridge University Press, Cambridge, 1939).46P. Wynblatt and R. C. Ku, in Interfacial Segregation, edited
bv- %'-.— C.— J~hnson- and J M Bjak@v (A-'0~i~ S~~v f~Metals, Metals Park, OH, 1979), p. 115.R. S. Jones, Phys. Rev. B 41, 3256 (1989).