Embed Size (px)
Citation preview
1915 W. 43rd Avenue Kansas City, Kansas 66103 T: (816)421‐8890 www.manicaarchitecture.com
100% RECONCILED SD
NEW SECTION
MISSION BAY ARENA &
ENTERTAINMENT COMPLEX
100% SD RECONCILIATION MAY 8TH, 2015
1915 W. 43rd Avenue Kansas City, Kansas 66103 T: (816)421‐8890 www.manicaarchitecture.com
100% RECONCILED SD
NEW SECTION
SECTION 10
SUSTAINABILITY

| 10 S e c t i o n
2995 Sidco Drive Nashville, Tennessee 37204 T: (615)383-1113 www.ssr-inc.com
P a g e | 1
100% RECONCILED SDSUSTAINABILITY NARRATIVE
NARRATIVE OUTLINE Sustainable Design
• Scope of Work • Technical Premises and Criteria for Design • Energy and Climate Analyses
o Climate Analysis o Event Center Energy Analysis o Office Tower(s) Energy Analysis
• Campus Sustainable Approach • Event Center Sustainable Approach • Office Tower(s) Sustainable Approach • Alternative Strategies
o Solar PV System o Educational Opportunities
• Tenant Lease LEED Guidelines • Appendices
10 – SUSTAINABLE DESIGN
10.1 – SCOPE OF WORK • LEED® certification criteria, at a minimum level of LEED Gold. • Pursuit of a sustainable and high performing facility, within the project budget and schedule. • Innovative technologies, nature based systems, renewable energy systems, and highly efficient
HVAC options are being investigated for the facilities. • Integrated energy analyses are being utilized for these facilities. The 100% Reconciled SD
Sustainability Narrative builds on the concept phase analysis, 25%, 50% and 75% Narratives, and integrates detailed energy analyses into this phase of the project.
• High performance facility operations, including lowered operational waste, educational experiences for the community and staff, pedestrian and bicycle-friendly transportation options, and sustainable food sourcing will be considered as the project moves forward.
• The project will use a Campus approach for LEED certification. This approach treats the entire site as a shared campus, allowing several LEED credits to be pre-approved under a Campus site application and then referenced by each individual or group of buildings located on the site. The Event Center will pursue LEED for New Construction certification, while the Office Towers will each pursue a LEED for Core and Shell certification as individual projects.
10.2 – TECHNICAL PREMISES AND CRITERIA FOR DESIGN • US Green Building Council- Leadership in Energy and Environmental Design (LEED®) Gold
Certification • 2013 Green Building Code • 2013 California Energy Code • 2013 San Francisco Green Building Code Amendments
| 10 S e c t i o n
2995 Sidco Drive Nashville, Tennessee 37204 T: (615)383-1113 www.ssr-inc.com
P a g e | 2
100% RECONCILED SDSUSTAINABILITY NARRATIVE
10.3 – ENERGY AND CLIMATE ANALYSES
10.3.1 - Overview The SD energy analysis for the Event Center and Mixed-Use Development at Mission Bay Blocks 29-32 in San Francisco, CA shows the major design considerations, assumptions, and results of the climate and energy analyses. Placeholders are utilized in this analysis for pending project details or metrics to be confirmed with the Owner.
The SD analysis serves to:
• Establish energy targets and goals in line with the owner’s expectations. • Compare energy targets and goals to the current design energy model results. • Review the buildings’ usage and energy consumption patterns in order to identify future
modeling adjustments and building-specific Energy Conservation Measures (ECMs). • Investigate the local climate in order to identify driving factors for energy consumption as
well as climate-specific ECMs. • Evaluate the energy and cost savings potential of various Load Reduction measures and
ECMs.
10.3.2 - Primary Project Energy Goals The primary energy-related goal of the project is to reach the highest level of performance within the building program and budget. San Francisco code requires that all new construction projects achieve Gold level certification under the 2009 LEED for New Construction Rating System on selected buildings. Additionally, San Francisco requires a minimum 15% reduction in energy costs when compared to a Baseline building as defined by ASHRAE 90.1-2007, Appendix G as well as show Title 24, Part 6, 2013 Compliance.
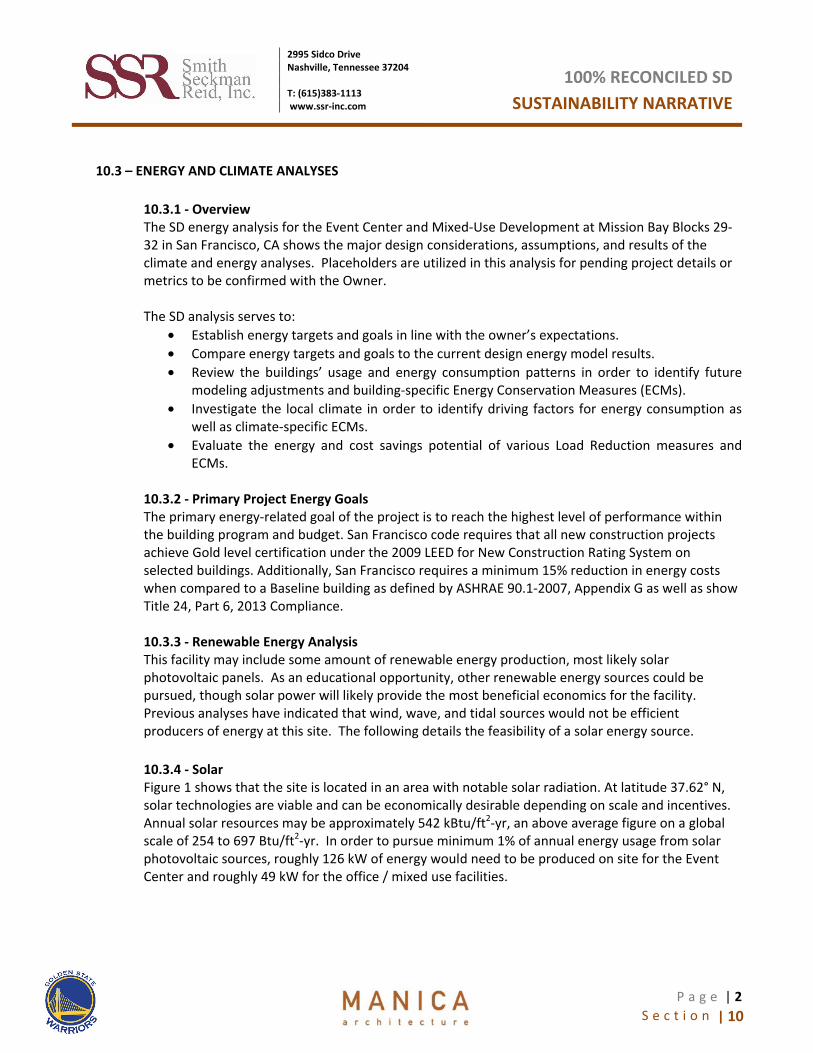
10.3.3 - Renewable Energy Analysis This facility may include some amount of renewable energy production, most likely solar photovoltaic panels. As an educational opportunity, other renewable energy sources could be pursued, though solar power will likely provide the most beneficial economics for the facility. Previous analyses have indicated that wind, wave, and tidal sources would not be efficient producers of energy at this site. The following details the feasibility of a solar energy source. 10.3.4 - Solar Figure 1 shows that the site is located in an area with notable solar radiation. At latitude 37.62° N, solar technologies are viable and can be economically desirable depending on scale and incentives. Annual solar resources may be approximately 542 kBtu/ft2-yr, an above average figure on a global scale of 254 to 697 Btu/ft2-yr. In order to pursue minimum 1% of annual energy usage from solar photovoltaic sources, roughly 126 kW of energy would need to be produced on site for the Event Center and roughly 49 kW for the office / mixed use facilities.

| 10 S e c t i o n
2995 Sidco Drive Nashville, Tennessee 37204 T: (615)383-1113 www.ssr-inc.com
P a g e | 3
100% RECONCILED SDSUSTAINABILITY NARRATIVE
Figure 1. Annual Global Horizontal Solar Radiation
10.3.5 - Economics The California state average electrical and natural gas rates, as published by the DOE Energy Information Administration, were used to evaluate utility costs for the purposes of determining the relative performance of the building options analyzed. Electricity: $0.1457 / kW-hr Natural Gas: $0.781 / therm Actual Utility Rate Structures to be determined with input from the Owner.
| 10 S e c t i o n
2995 Sidco Drive Nashville, Tennessee 37204 T: (615)383-1113 www.ssr-inc.com
P a g e | 4
100% RECONCILED SDSUSTAINABILITY NARRATIVE
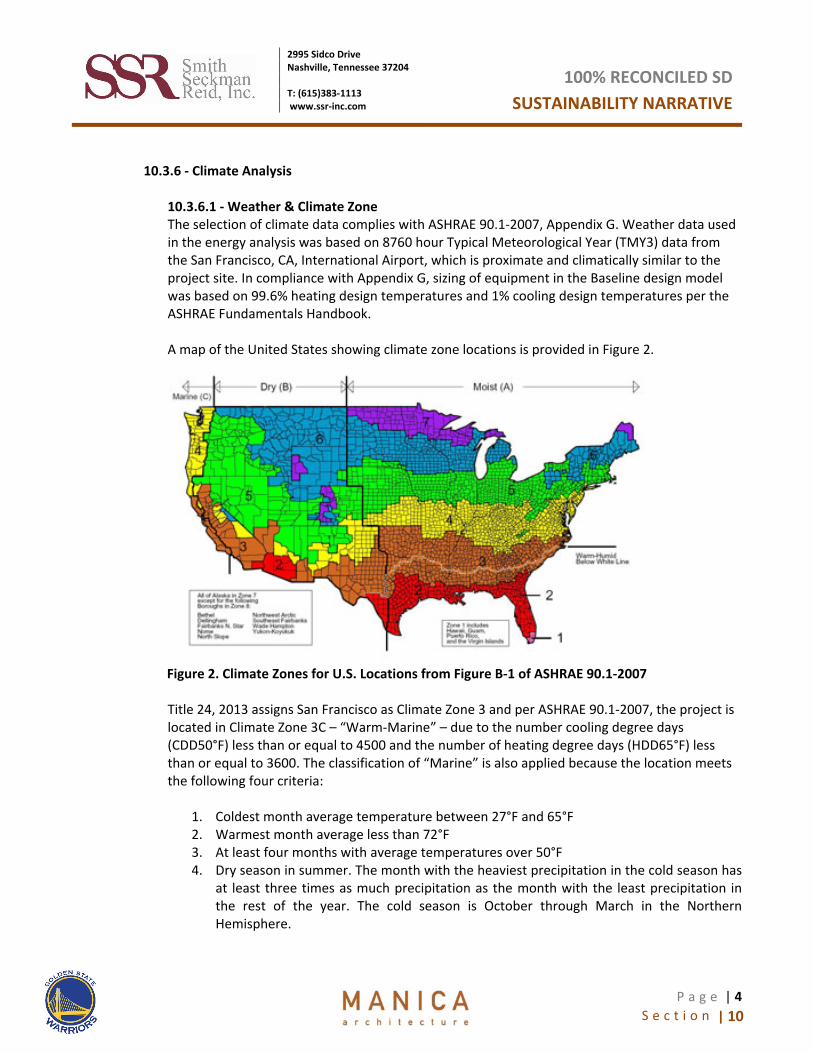
10.3.6 - Climate Analysis 10.3.6.1 - Weather & Climate Zone The selection of climate data complies with ASHRAE 90.1-2007, Appendix G. Weather data used in the energy analysis was based on 8760 hour Typical Meteorological Year (TMY3) data from the San Francisco, CA, International Airport, which is proximate and climatically similar to the project site. In compliance with Appendix G, sizing of equipment in the Baseline design model was based on 99.6% heating design temperatures and 1% cooling design temperatures per the ASHRAE Fundamentals Handbook. A map of the United States showing climate zone locations is provided in Figure 2.
Figure 2. Climate Zones for U.S. Locations from Figure B-1 of ASHRAE 90.1-2007
Title 24, 2013 assigns San Francisco as Climate Zone 3 and per ASHRAE 90.1-2007, the project is located in Climate Zone 3C – “Warm-Marine” – due to the number cooling degree days (CDD50°F) less than or equal to 4500 and the number of heating degree days (HDD65°F) less than or equal to 3600. The classification of “Marine” is also applied because the location meets the following four criteria:
1. Coldest month average temperature between 27°F and 65°F 2. Warmest month average less than 72°F 3. At least four months with average temperatures over 50°F 4. Dry season in summer. The month with the heaviest precipitation in the cold season has
at least three times as much precipitation as the month with the least precipitation in the rest of the year. The cold season is October through March in the Northern Hemisphere.
| 10 S e c t i o n
2995 Sidco Drive Nashville, Tennessee 37204 T: (615)383-1113 www.ssr-inc.com
P a g e | 5
100% RECONCILED SDSUSTAINABILITY NARRATIVE
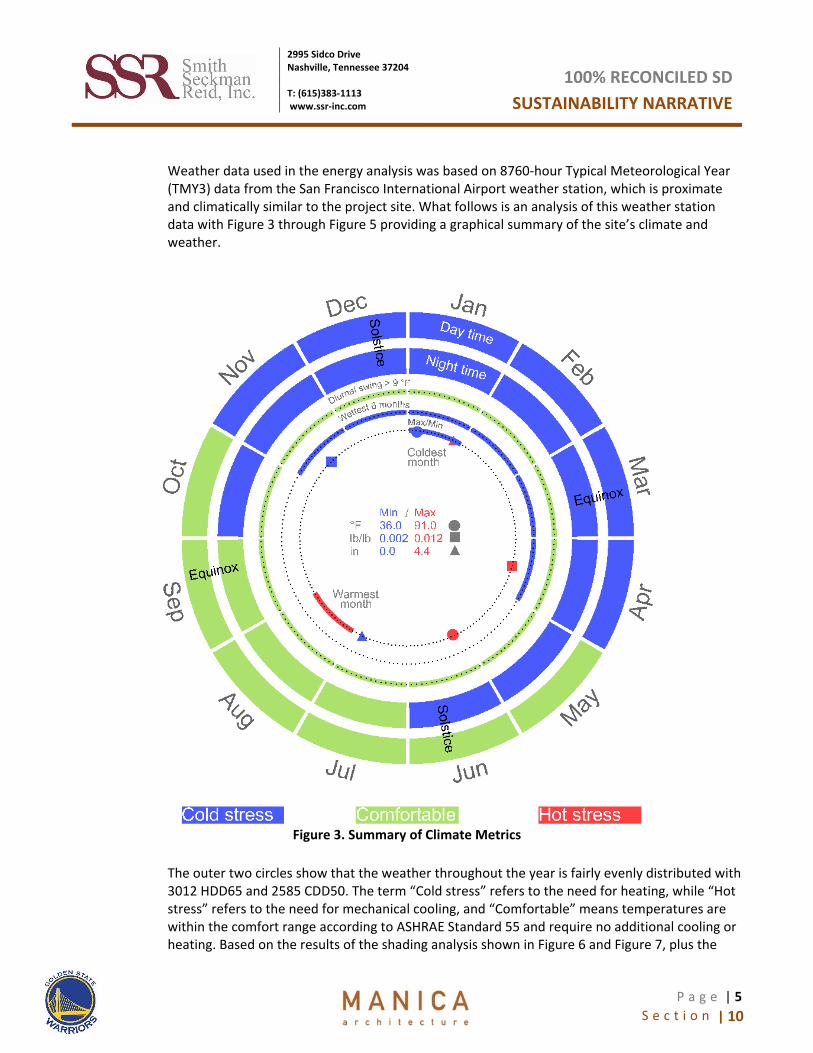
Weather data used in the energy analysis was based on 8760-hour Typical Meteorological Year (TMY3) data from the San Francisco International Airport weather station, which is proximate and climatically similar to the project site. What follows is an analysis of this weather station data with Figure 3 through Figure 5 providing a graphical summary of the site’s climate and weather.
Figure 3. Summary of Climate Metrics
The outer two circles show that the weather throughout the year is fairly evenly distributed with 3012 HDD65 and 2585 CDD50. The term “Cold stress” refers to the need for heating, while “Hot stress” refers to the need for mechanical cooling, and “Comfortable” means temperatures are within the comfort range according to ASHRAE Standard 55 and require no additional cooling or heating. Based on the results of the shading analysis shown in Figure 6 and Figure 7, plus the

| 10 S e c t i o n
2995 Sidco Drive Nashville, Tennessee 37204 T: (615)383-1113 www.ssr-inc.com
P a g e | 6
100% RECONCILED SDSUSTAINABILITY NARRATIVE
large amount of “Cold stress” months shown above it, can be concluded that the building is in a slightly heating-dominant climate. Therefore, climate-specific design strategies will focus more on passive solar heating and high efficiency heating systems. Additionally, due to the overall temperate climate, natural ventilation and free cooling will be taken advantage of as much as possible.
Figure 4. Climate and Weather, shows the number of hours per year that exceed certain temperature ranges typical for this location. Figure 5. Summary of Annual Temperature Distributions, shows the number of hours more specifically based on certain temperature ranges.
Figure 4. Climate and Weather
Figure 5. Summary of Annual Temperature Distributions
10.3.6.2 - Passive Design Strategies – Shading Analysis Due to the cooler climate, the design should maximize solar heat gain in winter to reduce heating energy (Figure 6 and Figure 7). A detailed shading optimization calculation and iteration was developed using the following sun shading charts in an attempt to show the length of shade, if any, would best make use of solar heat gain in the winter and prevent it in the summer. However, based on final optimization results, shading is not strongly beneficial for any orientation in this location.

| 10 S e c t i o n
2995 Sidco Drive Nashville, Tennessee 37204 T: (615)383-1113 www.ssr-inc.com
P a g e | 7
100% RECONCILED SDSUSTAINABILITY NARRATIVE
Figure 6. Sun Shading Chart – December through June
Figure 7. Sun Shading Chart – June through December
| 10 S e c t i o n
2995 Sidco Drive Nashville, Tennessee 37204 T: (615)383-1113 www.ssr-inc.com
P a g e | 8
100% RECONCILED SDSUSTAINABILITY NARRATIVE
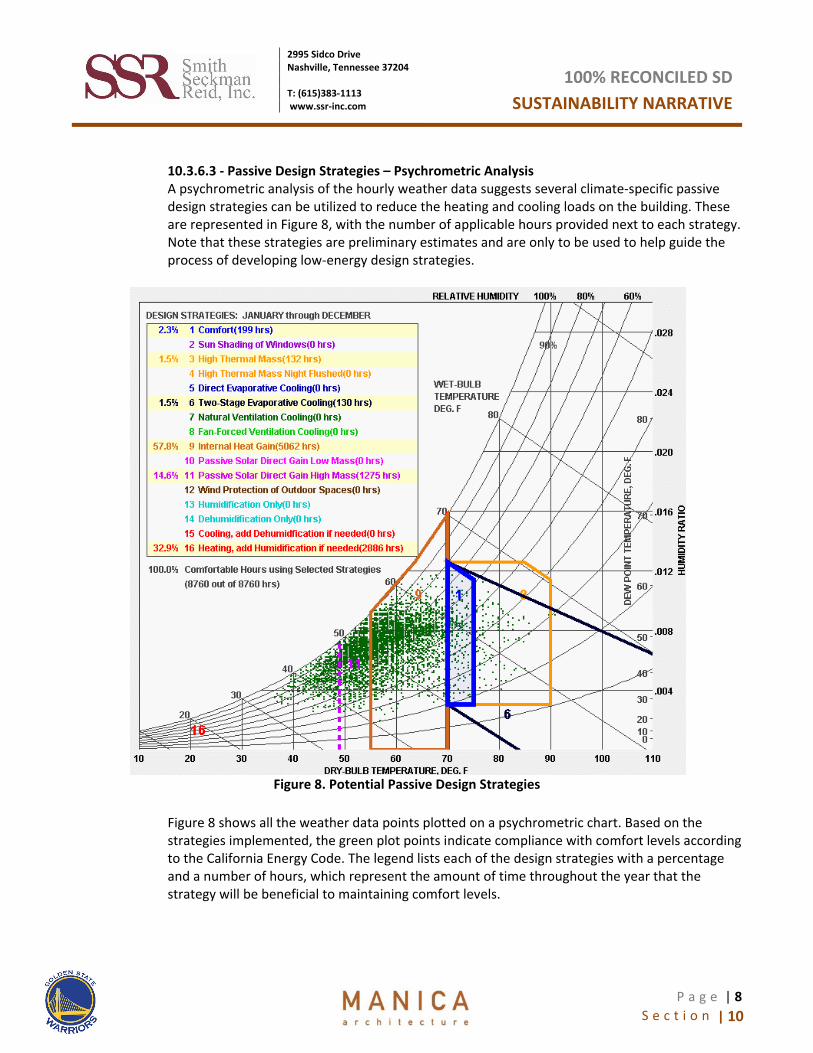
10.3.6.3 - Passive Design Strategies – Psychrometric Analysis A psychrometric analysis of the hourly weather data suggests several climate-specific passive design strategies can be utilized to reduce the heating and cooling loads on the building. These are represented in Figure 8, with the number of applicable hours provided next to each strategy. Note that these strategies are preliminary estimates and are only to be used to help guide the process of developing low-energy design strategies.
Figure 8. Potential Passive Design Strategies
Figure 8 shows all the weather data points plotted on a psychrometric chart. Based on the strategies implemented, the green plot points indicate compliance with comfort levels according to the California Energy Code. The legend lists each of the design strategies with a percentage and a number of hours, which represent the amount of time throughout the year that the strategy will be beneficial to maintaining comfort levels.
| 10 S e c t i o n
2995 Sidco Drive Nashville, Tennessee 37204 T: (615)383-1113 www.ssr-inc.com
P a g e | 9
100% RECONCILED SDSUSTAINABILITY NARRATIVE
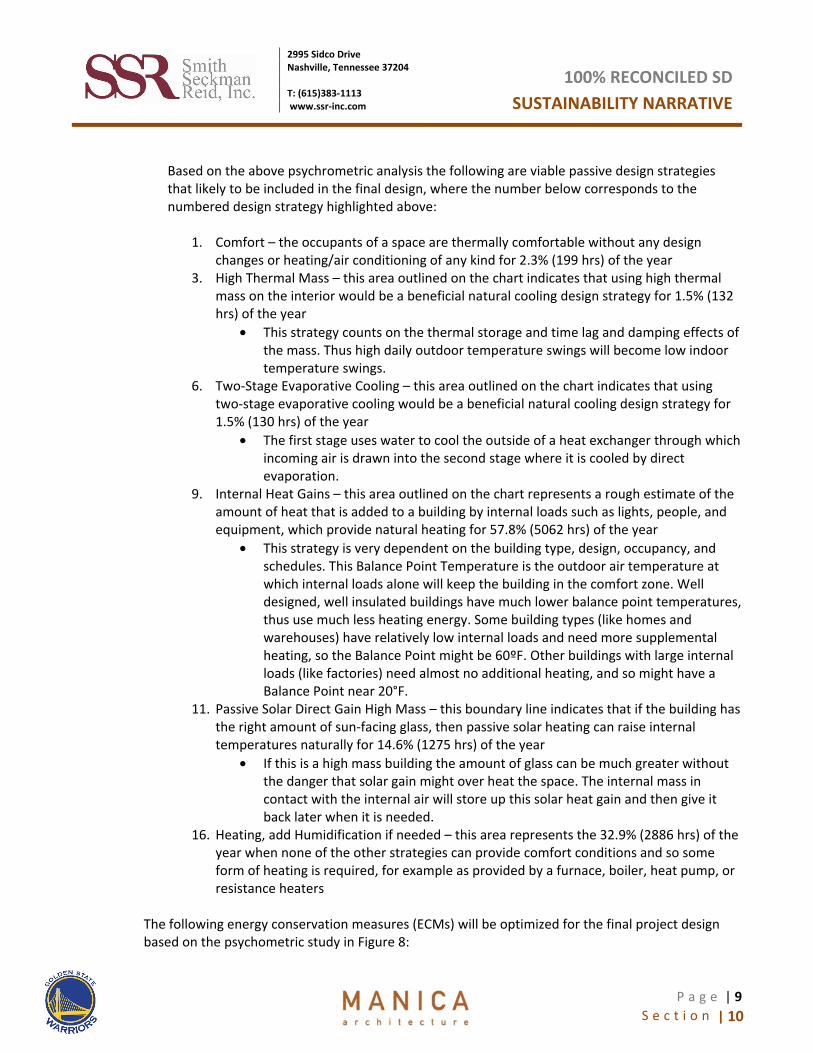
Based on the above psychrometric analysis the following are viable passive design strategies that likely to be included in the final design, where the number below corresponds to the numbered design strategy highlighted above:
1. Comfort – the occupants of a space are thermally comfortable without any design
changes or heating/air conditioning of any kind for 2.3% (199 hrs) of the year 3. High Thermal Mass – this area outlined on the chart indicates that using high thermal
mass on the interior would be a beneficial natural cooling design strategy for 1.5% (132 hrs) of the year
• This strategy counts on the thermal storage and time lag and damping effects of the mass. Thus high daily outdoor temperature swings will become low indoor temperature swings.
6. Two-Stage Evaporative Cooling – this area outlined on the chart indicates that using two-stage evaporative cooling would be a beneficial natural cooling design strategy for 1.5% (130 hrs) of the year
• The first stage uses water to cool the outside of a heat exchanger through which incoming air is drawn into the second stage where it is cooled by direct evaporation.
9. Internal Heat Gains – this area outlined on the chart represents a rough estimate of the amount of heat that is added to a building by internal loads such as lights, people, and equipment, which provide natural heating for 57.8% (5062 hrs) of the year
• This strategy is very dependent on the building type, design, occupancy, and schedules. This Balance Point Temperature is the outdoor air temperature at which internal loads alone will keep the building in the comfort zone. Well designed, well insulated buildings have much lower balance point temperatures, thus use much less heating energy. Some building types (like homes and warehouses) have relatively low internal loads and need more supplemental heating, so the Balance Point might be 60ºF. Other buildings with large internal loads (like factories) need almost no additional heating, and so might have a Balance Point near 20°F.
11. Passive Solar Direct Gain High Mass – this boundary line indicates that if the building has the right amount of sun-facing glass, then passive solar heating can raise internal temperatures naturally for 14.6% (1275 hrs) of the year
• If this is a high mass building the amount of glass can be much greater without the danger that solar gain might over heat the space. The internal mass in contact with the internal air will store up this solar heat gain and then give it back later when it is needed.
16. Heating, add Humidification if needed – this area represents the 32.9% (2886 hrs) of the year when none of the other strategies can provide comfort conditions and so some form of heating is required, for example as provided by a furnace, boiler, heat pump, or resistance heaters
The following energy conservation measures (ECMs) will be optimized for the final project design based on the psychometric study in Figure 8:

| 10 S e c t i o n
2995 Sidco Drive Nashville, Tennessee 37204 T: (615)383-1113 www.ssr-inc.com
P a g e | 10
100% RECONCILED SDSUSTAINABILITY NARRATIVE
• Allow heat gain from equipment, lights, and occupants to reduce heating needs • High performance, low-E glazing should be provided on each façade, but while tinted glass
should be used on east and west sides, clearer glass should be used to facilitate passive solar gain on south side.
• Lower indoor temperature setpoints to the far end of the comfort ranges to reduce heating energy and allow for unoccupied temperature setback controls
• High efficiency heating systems should prove to be cost effective in this climate • Extra insulation might prove cost effective, and will increase occupant comfort by keeping
indoor temperatures more uniform • On warm days ceiling fans or indoor air motion can make it seem cooler by at least 5
degrees F thus less air conditioning is needed
10.3.7 – Event Center Energy Analysis
10.3.7.1 - Event Center Energy Target – LEED EAc1 Points • The 2009 LEED for New Construction rating system requires that any project seeking
certification must demonstrate a 10% energy cost savings relative to a code-compliant building defined by ASHRAE 90.1-2007, Appendix G. After meeting the energy efficiency prerequisite, LEED awards points under Energy and Atmosphere Credit 1 (EAc1) as shown in the Table below. However, San Francisco energy code requires a minimum 15% reduction as well as show Title 24, Part 6, 2013 Compliance. The main energy target of the Event Center is to achieve 24-34% energy cost savings, equivalent to 7-12 LEED EAc1 points. Based on the current design, the energy model shows an energy cost savings (performance rating) of 25.88% relative to a Baseline building design per ASHRAE 90.1-2007, Appendix G. This is equivalent to 7 LEED EAc1 points, as shown in Table 1 below.
Table 1. 2009 LEED-NC EAc1 Point Scale
Points Awarded
% Energy Cost Savings
1 12% 2 14% 3 16% 4 18% 5 20% 6 22% 7 24% 8 26% 9 28%
10 30% 11 32% 12 34%
Event Center Project Target

| 10 S e c t i o n
2995 Sidco Drive Nashville, Tennessee 37204 T: (615)383-1113 www.ssr-inc.com
P a g e | 11
100% RECONCILED SDSUSTAINABILITY NARRATIVE
13 36% 14 38% 15 40% 16 42% 17 44% 18 46% 19 48%
A comparison of the Proposed and Baseline Designs is provided in Figure 9 below.
Figure 9. Comparison of Energy Costs by End Use
10.3.7.2 - Energy Consumption Breakdown Figure 10 and Figure 11 illustrate the breakdown in energy by end use in the Proposed and Baseline building designs. A detailed spreadsheet containing pertinent inputs to the energy model is located at the end of the event center energy model report section.
$0
$50,000
$100,000
$150,000
$200,000
$250,000
Annu
al E
nerg
y Co
sts (
$/yr
)
Proposed Baseline

| 10 S e c t i o n
2995 Sidco Drive Nashville, Tennessee 37204 T: (615)383-1113 www.ssr-inc.com
P a g e | 12
100% RECONCILED SDSUSTAINABILITY NARRATIVE
Figure 10. Percentage of Cost by End Use in Proposed Design
Figure 11. Percentage of Cost by End Use in Baseline Design
For this project process loads make up a significant portion of the overall energy usage “pie.” The process load energy usage category consists of the following according to percentage of total process load energy consumption.
1. Plug Loads (50.05%) – these are estimates from COMNET on a building-area average of 0.79 W/sf based on Court Sports Arena usage. This is the most unpredictable of all process load usages and this estimate is the best guess at actual usage. It includes computers, printers, copiers, projectors, etc.
2. Refrigeration (20.72%) – this includes estimated loads for all coolers, freezers, and all equipment associated with ice events
3. Natural Gas Cooking Equipment (18.84%) 4. Electrical Cooking Equipment (6.97%) 5. Elevators/Escalators (3.43%) 6. Process Lighting (TBD) – this is all lighting that is excluded from the interior lighting
power, but will still contribute to energy usage throughout the year. One source of process lighting for this project is the exit signs.
7. Event and Sports Lighting (TBD) - this is the other source of process lighting for the project and it will be provided for the final energy model run and LEED Submission
Space Cooling12.5%
Space Heating4.1%
Lighting17.1%
Pumps0.1%
Heat Rejection
0.7%
Fans - Interior12.9%
Process Loads26.7%
Savings25.9% Space Cooling
17.1%
Space Heating16.1%
Lighting17.1%
Pumps2.6%
Heat Rejection
7.5%
Fans - Interior12.9%
Process Loads26.7%

| 10 S e c t i o n
2995 Sidco Drive Nashville, Tennessee 37204 T: (615)383-1113 www.ssr-inc.com
P a g e | 13
100% RECONCILED SDSUSTAINABILITY NARRATIVE
Note that without the process load energy the overall energy cost savings for the event center is 35.3%. Therefore, it is recommended that priority be placed on reducing event center process loads and providing accurate schedules for all process equipment types so that the model will more accurately reflect anticipated usage.
10.3.7.3 - Facility Description – Building Use Schedules Fractional utilization schedules for occupants, lights, and equipment and other loads were specified for the building. The building was divided into two categories: Event Center and Office. The Warrior’s Offices, Arena Operations, and Warrior’s Team Offices are categorized as Office and are taken from the ASHRAE 90.1-2007 User’s Manual. The schedules are shown in Figure 12 and Figure 13 and go year-round. These schedules will be finalized based on owner input.
Figure 12. Office Occupancy Schedule
Figure 13. Office Lighting and Equipment Schedule
0
0.2
0.4
0.6
0.8
1
0 1 2 3 4 5 6 7 8 9 101112131415161718192021222324
Frac
tiona
l Usa
ge
Hour
Weekday Saturday Sunday
0
0.2
0.4
0.6
0.8
1
0 1 2 3 4 5 6 7 8 9 101112131415161718192021222324
Frac
tiona
l Usa
ge
Hour
Weekday Saturday Sunday
| 10 S e c t i o n
2995 Sidco Drive Nashville, Tennessee 37204 T: (615)383-1113 www.ssr-inc.com
P a g e | 14
100% RECONCILED SDSUSTAINABILITY NARRATIVE
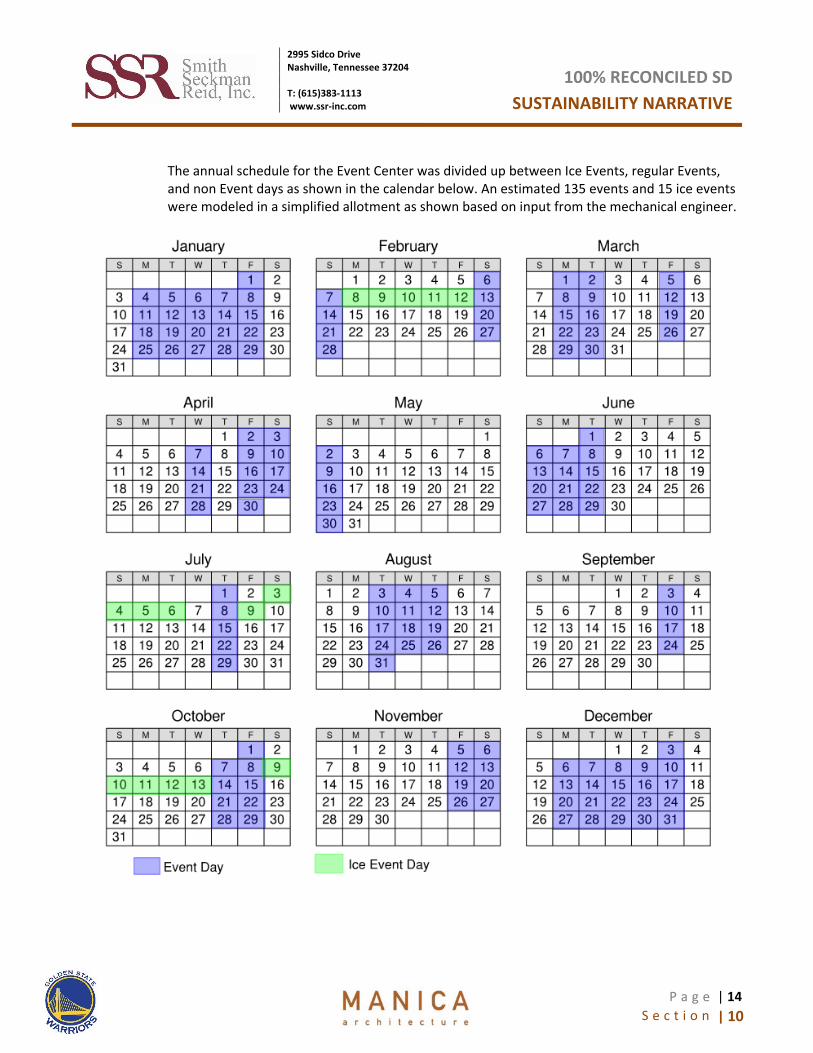
The annual schedule for the Event Center was divided up between Ice Events, regular Events, and non Event days as shown in the calendar below. An estimated 135 events and 15 ice events were modeled in a simplified allotment as shown based on input from the mechanical engineer.
| 10 S e c t i o n
2995 Sidco Drive Nashville, Tennessee 37204 T: (615)383-1113 www.ssr-inc.com
P a g e | 15
100% RECONCILED SDSUSTAINABILITY NARRATIVE
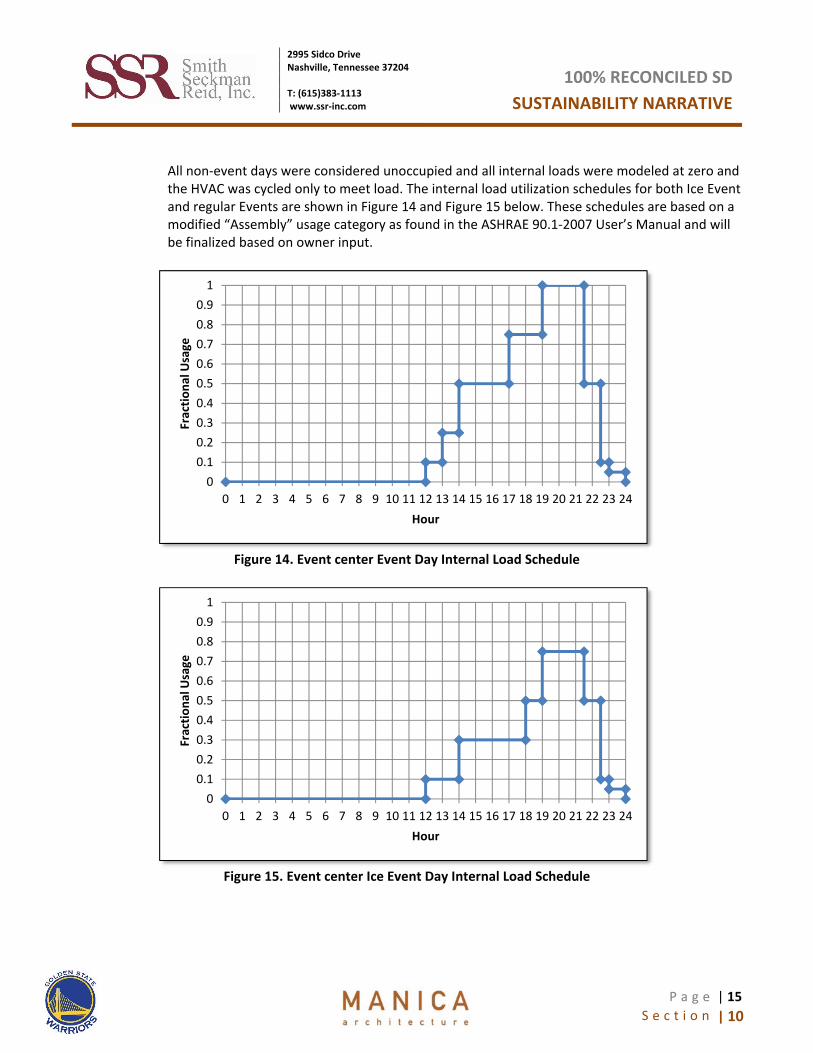
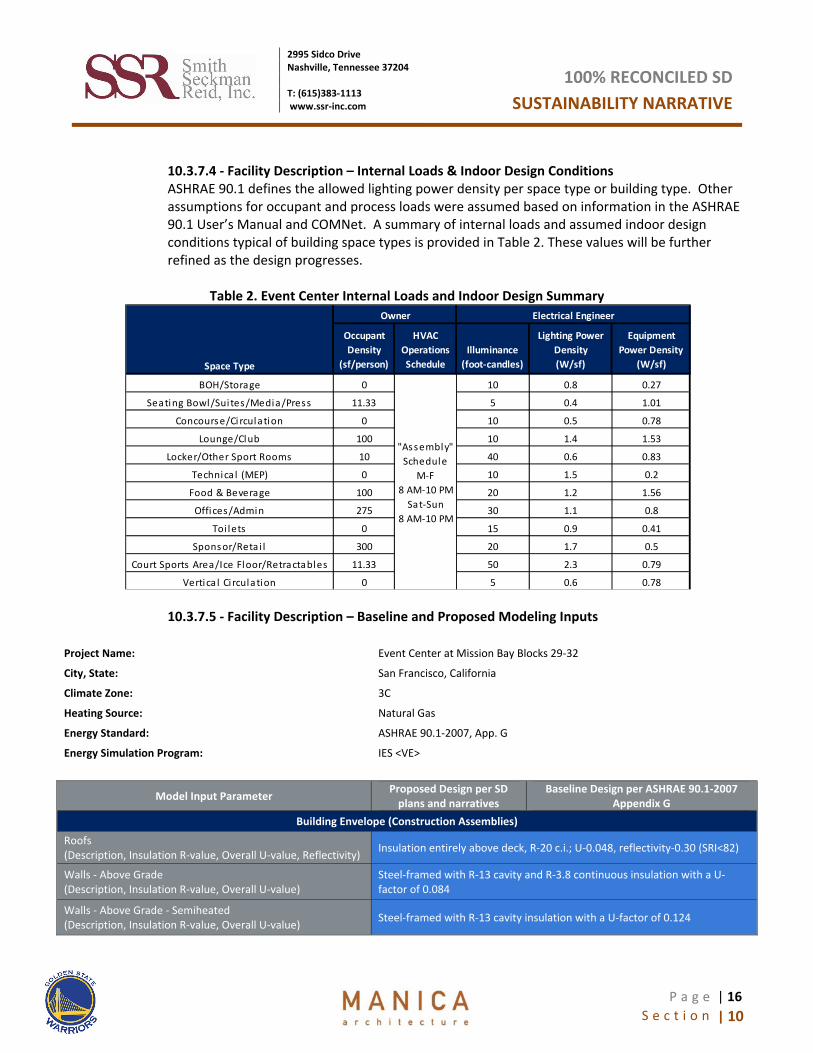
All non-event days were considered unoccupied and all internal loads were modeled at zero and the HVAC was cycled only to meet load. The internal load utilization schedules for both Ice Event and regular Events are shown in Figure 14 and Figure 15 below. These schedules are based on a modified “Assembly” usage category as found in the ASHRAE 90.1-2007 User’s Manual and will be finalized based on owner input.
Figure 14. Event center Event Day Internal Load Schedule
Figure 15. Event center Ice Event Day Internal Load Schedule
00.10.20.30.40.50.60.70.80.9
1
0 1 2 3 4 5 6 7 8 9 10 11 12 13 14 15 16 17 18 19 20 21 22 23 24
Frac
tiona
l Usa
ge
Hour
00.10.20.30.40.50.60.70.80.9
1
0 1 2 3 4 5 6 7 8 9 10 11 12 13 14 15 16 17 18 19 20 21 22 23 24
Frac
tiona
l Usa
ge
Hour
| 10 S e c t i o n
2995 Sidco Drive Nashville, Tennessee 37204 T: (615)383-1113 www.ssr-inc.com
P a g e | 16
100% RECONCILED SDSUSTAINABILITY NARRATIVE
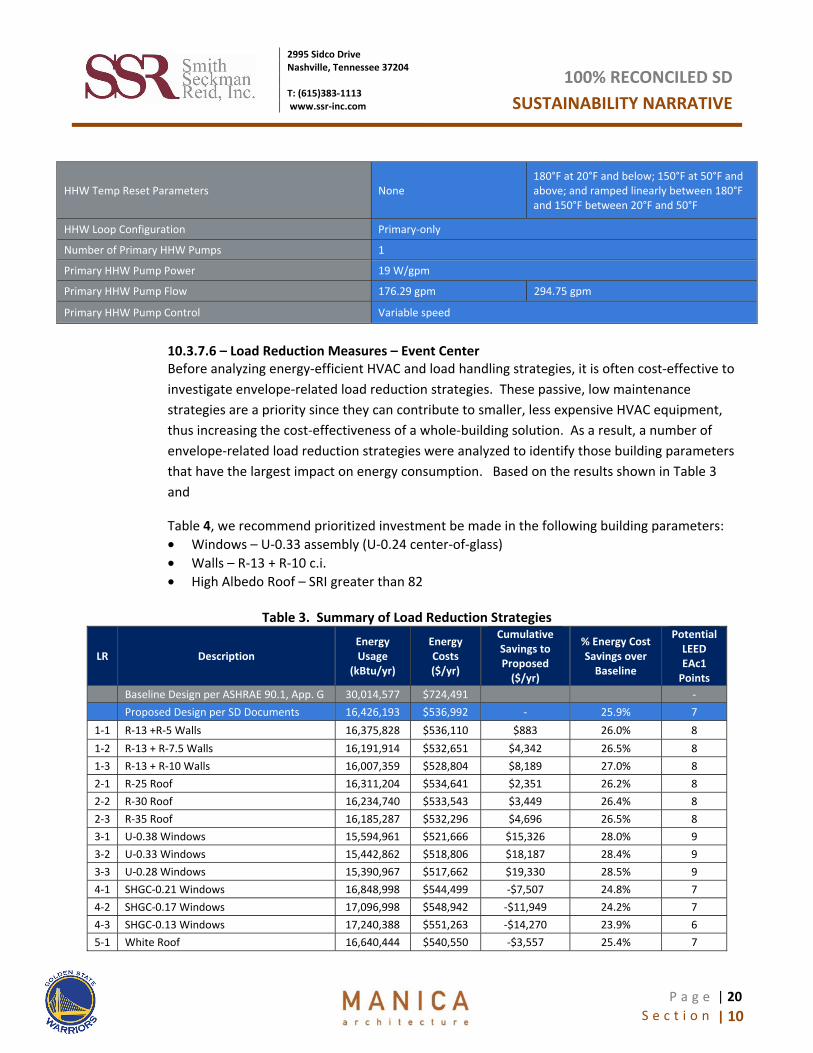
10.3.7.4 - Facility Description – Internal Loads & Indoor Design Conditions ASHRAE 90.1 defines the allowed lighting power density per space type or building type. Other assumptions for occupant and process loads were assumed based on information in the ASHRAE 90.1 User’s Manual and COMNet. A summary of internal loads and assumed indoor design conditions typical of building space types is provided in Table 2. These values will be further refined as the design progresses.
Table 2. Event Center Internal Loads and Indoor Design Summary
10.3.7.5 - Facility Description – Baseline and Proposed Modeling Inputs
Project Name: Event Center at Mission Bay Blocks 29-32
City, State: San Francisco, California
Climate Zone: 3C
Heating Source: Natural Gas
Energy Standard: ASHRAE 90.1-2007, App. G
Energy Simulation Program: IES <VE>
Model Input Parameter Proposed Design per SD plans and narratives
Baseline Design per ASHRAE 90.1-2007 Appendix G
Building Envelope (Construction Assemblies)
Roofs (Description, Insulation R-value, Overall U-value, Reflectivity) Insulation entirely above deck, R-20 c.i.; U-0.048, reflectivity-0.30 (SRI<82)
Walls - Above Grade (Description, Insulation R-value, Overall U-value)
Steel-framed with R-13 cavity and R-3.8 continuous insulation with a U-factor of 0.084
Walls - Above Grade - Semiheated (Description, Insulation R-value, Overall U-value) Steel-framed with R-13 cavity insulation with a U-factor of 0.124
Occupant Density
(sf/person)
HVAC Operations Schedule
Illuminance (foot-candles)
Lighting Power Density (W/sf)
Equipment Power Density
(W/sf)
BOH/Storage 0 10 0.8 0.27
Seating Bowl/Sui tes/Media/Press 11.33 5 0.4 1.01
Concourse/Ci rculation 0 10 0.5 0.78
Lounge/Club 100 10 1.4 1.53
Locker/Other Sport Rooms 10 40 0.6 0.83
Technica l (MEP) 0 10 1.5 0.2
Food & Beverage 100 20 1.2 1.56
Offices/Admin 275 30 1.1 0.8
Toi lets 0 15 0.9 0.41
Sponsor/Retai l 300 20 1.7 0.5
Court Sports Area/Ice Floor/Retractables 11.33 50 2.3 0.79
Vertica l Ci rculation 0 5 0.6 0.78
"Assembly" Schedule
M-F8 AM-10 PM
Sat-Sun8 AM-10 PM
Electrical EngineerOwner
Space Type

| 10 S e c t i o n
2995 Sidco Drive Nashville, Tennessee 37204 T: (615)383-1113 www.ssr-inc.com
P a g e | 17
100% RECONCILED SDSUSTAINABILITY NARRATIVE
Walls - Below Grade (Description, Insulation R-value, Overall C-factor)
8” medium weight concrete block with solid grouted cores and no insulation with a C-factor of 1.140
Exposed Floors (Description, Insulation R-value, Overall U-value) Steel-joist with R-19 insulation with a U-factor of 0.052
Slab-On-Grade Floors (Description, Insulation R-value, Overall F-value) Unheated 6" concrete slabs with no insulation with an F-factor of 0.730
Fenestration and Shading
Vertical fenestration Area (% of Wall area) N/S/E/W Overall 46% 53 / 26 / 45 / 58%
Overall 40% maximum 46 / 23 / 39 / 50%
Vertical Glazing Description, U-factor, SHGC, VLT Curtainwall/Storefront; Assembly U-0.434, SHGC-0.283, VLT-0.415
Metal framing (curtainwall/storefront); Assembly U-0.60, SHGC-0.25, VLT-0.76
HVAC (Air-side)
Primary HVAC Type
Single zone VAV DX units with hot water heating and Indirect/Direct Evaporative Coolers (IDDEC)
System 7 – Packaged VAV with Reheat (one per floor, with exceptions below)
Other HVAC Type
Dedicated Outside Air Unit with IDDEC providing ventilation to Variable Refrigerant Volume fan coil units serving suites, food prep, retail, media, etc. CRAC units serving MEP only spaces Packaged VAV DX units with Hot Water reheat and IDDEC serving Warrior’s Offices, Arena Ops, and Warrior’s Team Offices
System 3 – Packaged Single Zone AC, Exception (b) used since schedules and occupancy for Warrior’s Offices, Warrior’s Team Offices, and Arena Ops differ from rest of event center System 3 – Packaged Single Zone AC, Exception (b) used for bowl area and concourses as peak loads differ from remainder of building
Total Cooling Capacity Auto-sized 115% system coil capacity as auto-sized
Unitary Cooling Capacity Ranges
< 65 MBH, 65-135 MBH, 135-240 MBH, 240-760 MBH, >760 MBH (as determined by load)
> 760 MBH and 240-760 MBH
Unitary Cooling Efficiency
13.0 SEER, 11.0 EER/11.2 IEER, 10.8 EER/11.0 IEER, 9.8 EER/9.9 IEER, and 9.5 EER/9.6 IEER, respectively
9.5 EER/9.6 IEER and 9.8 EER/9.9 IEER
Total Heating Capacity Auto-sized 125% system coil capacity as auto-sized
Unitary Heating Capacity Ranges TBD As auto-sized
Unitary Heating Efficiency TBD 80%

| 10 S e c t i o n
2995 Sidco Drive Nashville, Tennessee 37204 T: (615)383-1113 www.ssr-inc.com
P a g e | 18
100% RECONCILED SDSUSTAINABILITY NARRATIVE
Fan System Operation
Fans operate continuously whenever spaces are occupied and cycle to meet loads when unoccupied
Fans operate continuously whenever spaces are occupied and cycle to meet loads when unoccupied; Variable speed for System 7, Constant Volume for Systems 3
Outdoor Air Design Min Ventilation
As per the 75% SD mechanical schedules, applied on a cfm/sf average per air handling unit
Same as Proposed
HVAC Air-side Economizer Cycle None 75°F dry bulb economizer
Design Airflow Rates (Conditioned Space) Auto-sized - 0.4 cfm/sf minimum airflow setpoints for all terminal units - All airflows allowed to auto-size
Total System Fan Power (Conditioned) 362.03 kW (estimated from auto-sized loads, airflows, and static pressures)
206.28 kW (estimated from auto-sized loads, airflows, and static pressures)
Total Supply Fan Power 326.79 kW 153.35 kW
Total Return / Relief Fan Power 35.24 kW 52.93 kW
Total Exhaust Fan Power (tied to AHUs) TBD TBD
Demand Control Ventilation
- DCV will be designed to meet requirements - Spaces to be modeled in future iterations - Ventilation is modeled as zero during unoccupied hours
- DCV required within the breathing zone for all densely occupied spaces greater than 500 sq. ft. - Spaces required TBD - Ventilation is modeled as zero during unoccupied hours
Supply Air Temperature Reset Parameters None For System 7 – SATR of 5°F under minimum cooling conditions
Lighting
Interior Lighting Power Calc Method Space-by-Space Method as described above
Interior Lighting Power Density (Average) 0.81 W/sf
Automatic Lighting Controls Occupancy sensors in conference/meeting rooms and employee break rooms as required.
Exterior Lighting Power
Tradable – 8.55 kW (estimate) Nontradable – TBD Total – 8.55 kW (estimate)
Tradable – 8.55 kW (estimate) Nontradable – TBD 5% Allowance – 0.4275 kW Total – 8.98 kW (estimate)
Miscellaneous
Receptacle equipment Per COMNET Building Area Method as described above, 0.79 W/sf
Interior Process Lighting TBD: Exit and sports/event lighting

| 10 S e c t i o n
2995 Sidco Drive Nashville, Tennessee 37204 T: (615)383-1113 www.ssr-inc.com
P a g e | 19
100% RECONCILED SDSUSTAINABILITY NARRATIVE
HVAC (Water-side)
Number of Chillers
All AHUs DX with the exception of the low temperature cooling coils required for ice events. Ice event chiller to be modeled as process load.
2 water-cooled centrifugal chillers
Chiller Capacity (Per Chiller) 362 tons each
Chiller Efficiency 6.1 COP (6.4 IPLV)
Chiller Water Loop Supply Temperature 44°F
Chilled Water (CHW) Loop Delta-T 12°F
CHW Loop Temp Reset Parameters 44°F at 80°F and above; 54°F at 60°F and below; and ramped linearly between 44°F and 54°F between 80°F and 60°F
CHW Loop Configuration Primary-Secondary
Number of Primary CHW Pumps 2
Primary CHW Pump Power 11 W/gpm
Primary CHW Pump Flow 723.7 gpm per chiller
Primary CHW Pump Speed Control Constant flow-each primary pump interlocked with associated chiller
Number of Secondary CHW Pumps 1
Secondary CHW Pump Power 11 W/gpm
Secondary CHW Pump Flow 1,447.45 gpm
Secondary CHW Pump Control Variable speed
Number of Cooling Towers
Supplemental cooling tower and common heat rejection loop to be modeled externally through worksheets and calculations and not directly modeled in the energy simulation program.
One
Cooling Tower Fan Power 39.49 kW (19.5 W/gpm)
Cooling Tower Fan Control Two-speed axial fan
Condenser Water (CW) Leaving Temp 85°F
CW Loop Delta-T 10°F
CW Loop Temp Reset Parameters 70°F leaving water where weather permits, floating up to leaving water temperature at design conditions
Number of CW Pumps 2
CW Pump Power 19 W/gpm
CW Pump Flow 2,024.9 gpm total
CW Pump Control Riding the pump curve
Number and Type of Boilers 7 condensing boilers 2 equally-sized natural draft hot water boilers
Total Boiler Capacity 6 boilers at 300 MBH, 1 boiler at 200 MBH
7,371.36 kBtu/h (3,685.68 kBtu/h per boiler)
Boiler Efficiency 95% 80%
Hot Water (HHW) Supply Temp 140°F 180°F
HHW Delta-T 40°F 50°F
| 10 S e c t i o n
2995 Sidco Drive Nashville, Tennessee 37204 T: (615)383-1113 www.ssr-inc.com
P a g e | 20
100% RECONCILED SDSUSTAINABILITY NARRATIVE
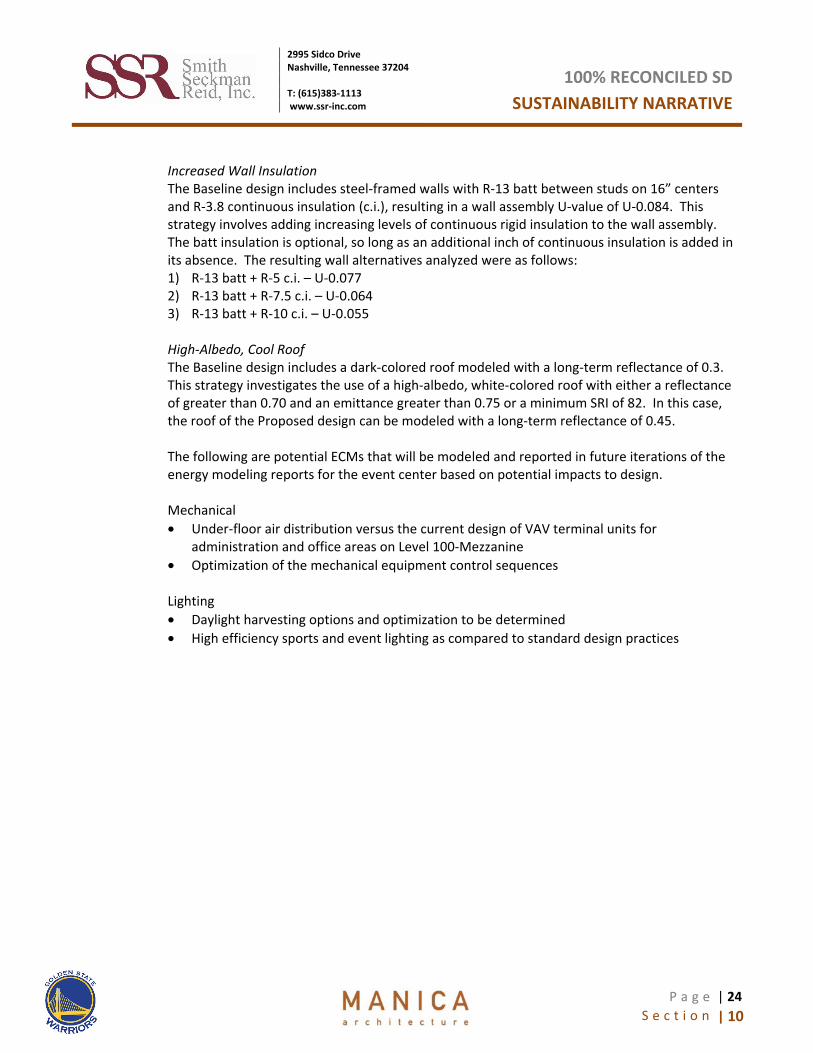
HHW Temp Reset Parameters None 180°F at 20°F and below; 150°F at 50°F and above; and ramped linearly between 180°F and 150°F between 20°F and 50°F
HHW Loop Configuration Primary-only
Number of Primary HHW Pumps 1
Primary HHW Pump Power 19 W/gpm
Primary HHW Pump Flow 176.29 gpm 294.75 gpm
Primary HHW Pump Control Variable speed
10.3.7.6 – Load Reduction Measures – Event Center Before analyzing energy-efficient HVAC and load handling strategies, it is often cost-effective to investigate envelope-related load reduction strategies. These passive, low maintenance strategies are a priority since they can contribute to smaller, less expensive HVAC equipment, thus increasing the cost-effectiveness of a whole-building solution. As a result, a number of envelope-related load reduction strategies were analyzed to identify those building parameters that have the largest impact on energy consumption. Based on the results shown in Table 3 and
Table 4, we recommend prioritized investment be made in the following building parameters: • Windows – U-0.33 assembly (U-0.24 center-of-glass) • Walls – R-13 + R-10 c.i. • High Albedo Roof – SRI greater than 82
Table 3. Summary of Load Reduction Strategies
LR Description Energy Usage
(kBtu/yr)
Energy Costs ($/yr)
Cumulative Savings to Proposed
($/yr)
% Energy Cost Savings over
Baseline
Potential LEED EAc1
Points Baseline Design per ASHRAE 90.1, App. G 30,014,577 $724,491 - Proposed Design per SD Documents 16,426,193 $536,992 - 25.9% 7
1-1 R-13 +R-5 Walls 16,375,828 $536,110 $883 26.0% 8 1-2 R-13 + R-7.5 Walls 16,191,914 $532,651 $4,342 26.5% 8 1-3 R-13 + R-10 Walls 16,007,359 $528,804 $8,189 27.0% 8 2-1 R-25 Roof 16,311,204 $534,641 $2,351 26.2% 8 2-2 R-30 Roof 16,234,740 $533,543 $3,449 26.4% 8 2-3 R-35 Roof 16,185,287 $532,296 $4,696 26.5% 8 3-1 U-0.38 Windows 15,594,961 $521,666 $15,326 28.0% 9 3-2 U-0.33 Windows 15,442,862 $518,806 $18,187 28.4% 9 3-3 U-0.28 Windows 15,390,967 $517,662 $19,330 28.5% 9 4-1 SHGC-0.21 Windows 16,848,998 $544,499 -$7,507 24.8% 7 4-2 SHGC-0.17 Windows 17,096,998 $548,942 -$11,949 24.2% 7 4-3 SHGC-0.13 Windows 17,240,388 $551,263 -$14,270 23.9% 6 5-1 White Roof 16,640,444 $540,550 -$3,557 25.4% 7

| 10 S e c t i o n
2995 Sidco Drive Nashville, Tennessee 37204 T: (615)383-1113 www.ssr-inc.com
P a g e | 21
100% RECONCILED SDSUSTAINABILITY NARRATIVE
Table 4. Cost Impact of Load Reduction Strategies
Figure 16. Energy Cost Savings of Load Reduction Measures
LR DescriptionEnvelope Cost
Change ($)Load Change
(tons)Mech Equip Cost
Change ($)Load Change
(MBH)
Mech Equip Cost Change
($)1-1 R-13 +R-5 Wal ls $41,970 0.51 $7,005 -58.0 -$11,899 $37,076 $883 42.01-2 R-13 + R-7.5 Wal ls $118,574 1.65 $22,545 -157.0 -$32,187 $108,932 $4,342 25.11-3 R-13 + R-10 Wal ls $185,400 2.17 $29,686 -126.6 -$25,955 $189,130 $8,189 23.12-1 R-25 Roof $178,884 -6.15 -$83,988 -83.8 -$17,177 $77,719 $2,351 33.12-2 R-30 Roof $366,147 1.73 $23,688 -256.5 -$52,586 $337,250 $3,449 97.82-3 R-35 Roof $561,788 1.54 $21,034 -219.9 -$45,085 $537,736 $4,696 114.55-1 White Roof Negl igible -11.04 -$150,918 4.1 $841 -$150,077 -$3,557 Immediate
Note 1 - Envelope construction cost determined through RS Means
Note 2 - Cooling and heating equipment costs determined by Clark Construction and Mortenson Construction
Net Construction Cost Change
($)
Energy Cost Savings ($/yr)
Simple Payback
Period (yrs)
Cooling Heating
-$20,000
-$15,000
-$10,000
-$5,000
$0
$5,000
$10,000
$15,000
$20,000
$25,000
Eneg
y Co
st S
avin
gs ($
/yr)

| 10 S e c t i o n
2995 Sidco Drive Nashville, Tennessee 37204 T: (615)383-1113 www.ssr-inc.com
P a g e | 22
100% RECONCILED SDSUSTAINABILITY NARRATIVE
Figure 17. Cooling Load Reductions due to Load Reduction Measures
Figure 18. Heating Load Reductions due to Load Reduction Measures
-4
-2
0
2
4
6
8
10
12Co
olin
g Lo
ad R
educ
tion
(ton
s)
-50
0
50
100
150
200
250
300
Heat
ing
Load
Red
uctio
n (M
BH)

| 10 S e c t i o n
2995 Sidco Drive Nashville, Tennessee 37204 T: (615)383-1113 www.ssr-inc.com
P a g e | 23
100% RECONCILED SDSUSTAINABILITY NARRATIVE
Improved Window Assembly U-values The Proposed Building is assumed to have windows with a center of glass U-value of 0.296 and an overall assembly U-value of U-0.434. By contrast, the Baseline design includes glazings having a whole-window assembly U-value of U-0.60 and a solar heat gain coefficient of SHGC-0.25. This strategy involves using various combinations of Low-E, argon-filled, and/or triple-paned glazings in a thermally broken window frame to reduce heat transfer. For the purpose of this analysis, Viracon glass and Kawneer 1600UT System 2 curtainwall framing was assumed as the basis of design. Table 5 lists potential glazing alternatives, showing the Center-of-Glass U-values, as well as the Window Assembly U-values.
Table 5. Potential Glazing Alternatives Viracon U-values
Description Product Center-of-Glass Window-Assembly
Low-E on #2, Air-filled VE1-2M on Clear 0.29 0.38
Low-E on #2, Argon-filled VE1-2M on Clear 0.24 0.33
Triple-pane, Low-E on #2, Argon-filled VE1-2M on Clear 0.18 0.28
Improved Window Assembly SHGC-values The Proposed Building is assumed to have windows with a solar heat gain coefficients (SHGC) of 0.283 as its basis of design. By contrast, the Baseline Building includes windows with solar heat gain coefficients (SHGCs) of 0.25 at all orientations. This strategy involves using tinted, fritted, or reflective glass types with reduced center-of-glass SHGC values. This lowering of the SHGC is meant to reduce solar heat gain to the space, thereby reducing cooling needed. However, a balance must be struck in climates with moderately cold winters, as a higher SHGC can help to reduce heating costs in the winter. For the purpose of this analysis, Viracon’s website was referenced to identify feasible SHGC alternatives, with the following alternatives tested in the energy model: 1) SHGC-0.21 2) SHGC-0.17 3) SHGC-0.13 Increased Roof Insulation The Baseline design includes a light-weight roof assembly with continuous R-20 insulation entirely above deck, resulting in a roof assembly U-value of U-0.048. This strategy involves adding increasing amounts of insulation to the entire roof, resulting in the following roof alternatives: 1) R-25 continuous insulation (c.i.) – U-0.039 2) R-30 continuous insulation (c.i.) – U-0.032 3) R-35 continuous insulation (c.i.) – U-0.028
| 10 S e c t i o n
2995 Sidco Drive Nashville, Tennessee 37204 T: (615)383-1113 www.ssr-inc.com
P a g e | 24
100% RECONCILED SDSUSTAINABILITY NARRATIVE
Increased Wall Insulation The Baseline design includes steel-framed walls with R-13 batt between studs on 16” centers and R-3.8 continuous insulation (c.i.), resulting in a wall assembly U-value of U-0.084. This strategy involves adding increasing levels of continuous rigid insulation to the wall assembly. The batt insulation is optional, so long as an additional inch of continuous insulation is added in its absence. The resulting wall alternatives analyzed were as follows: 1) R-13 batt + R-5 c.i. – U-0.077 2) R-13 batt + R-7.5 c.i. – U-0.064 3) R-13 batt + R-10 c.i. – U-0.055 High-Albedo, Cool Roof The Baseline design includes a dark-colored roof modeled with a long-term reflectance of 0.3. This strategy investigates the use of a high-albedo, white-colored roof with either a reflectance of greater than 0.70 and an emittance greater than 0.75 or a minimum SRI of 82. In this case, the roof of the Proposed design can be modeled with a long-term reflectance of 0.45. The following are potential ECMs that will be modeled and reported in future iterations of the energy modeling reports for the event center based on potential impacts to design. Mechanical • Under-floor air distribution versus the current design of VAV terminal units for
administration and office areas on Level 100-Mezzanine • Optimization of the mechanical equipment control sequences Lighting • Daylight harvesting options and optimization to be determined • High efficiency sports and event lighting as compared to standard design practices
| 10 S e c t i o n
2995 Sidco Drive Nashville, Tennessee 37204 T: (615)383-1113 www.ssr-inc.com
P a g e | 25
100% RECONCILED SDSUSTAINABILITY NARRATIVE
10.3.8 - Office Tower(s) Energy Analysis
10.3.8.1 - Energy Targets - LEED EAc1 Points • The 2009 LEED for Core & Shell rating system requires that any project seeking
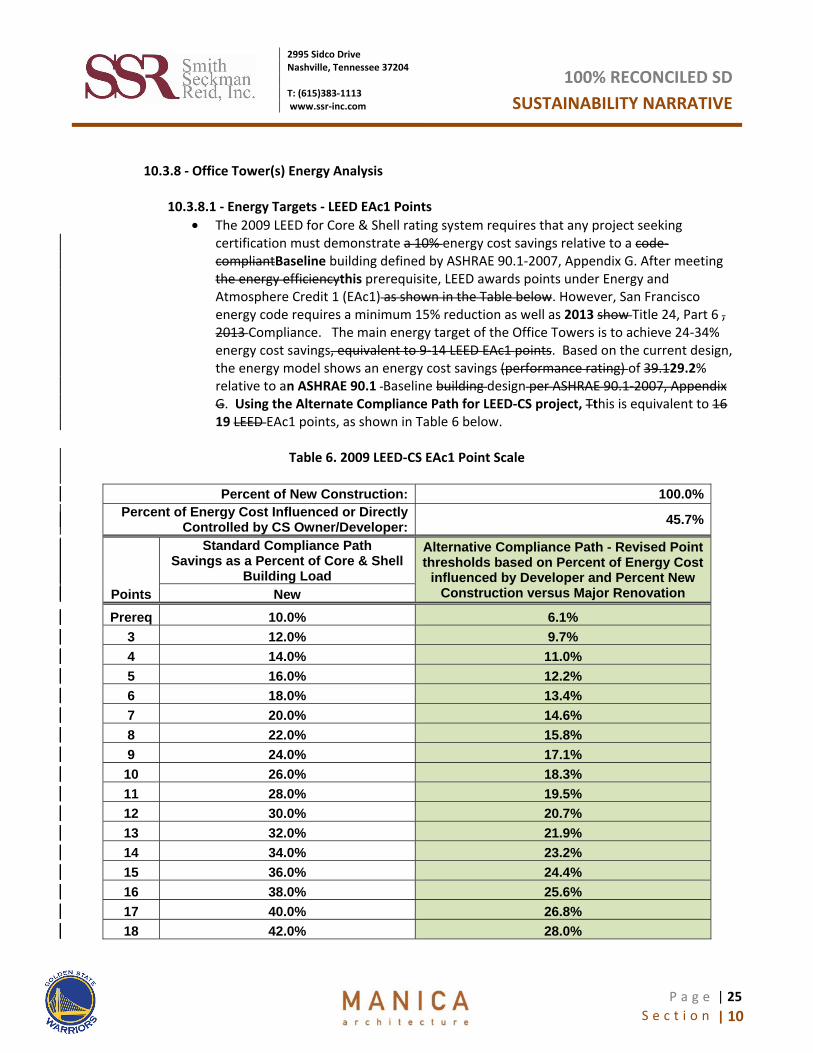
certification must demonstrate a 10% energy cost savings relative to a code-compliantBaseline building defined by ASHRAE 90.1-2007, Appendix G. After meeting the energy efficiencythis prerequisite, LEED awards points under Energy and Atmosphere Credit 1 (EAc1) as shown in the Table below. However, San Francisco energy code requires a minimum 15% reduction as well as 2013 show Title 24, Part 6 , 2013 Compliance. The main energy target of the Office Towers is to achieve 24-34% energy cost savings, equivalent to 9-14 LEED EAc1 points. Based on the current design, the energy model shows an energy cost savings (performance rating) of 39.129.2% relative to an ASHRAE 90.1 Baseline building design per ASHRAE 90.1-2007, Appendix G. Using the Alternate Compliance Path for LEED-CS project, Tthis is equivalent to 16 19 LEED EAc1 points, as shown in Table 6 below.
Table 6. 2009 LEED-CS EAc1 Point Scale
Percent of New Construction: 100.0%
Percent of Energy Cost Influenced or Directly Controlled by CS Owner/Developer: 45.7%
Points
Standard Compliance Path Savings as a Percent of Core & Shell
Building Load
Alternative Compliance Path - Revised Point thresholds based on Percent of Energy Cost
influenced by Developer and Percent New Construction versus Major Renovation New
Prereq 10.0% 6.1% 3 12.0% 9.7% 4 14.0% 11.0% 5 16.0% 12.2% 6 18.0% 13.4% 7 20.0% 14.6% 8 22.0% 15.8% 9 24.0% 17.1% 10 26.0% 18.3% 11 28.0% 19.5% 12 30.0% 20.7% 13 32.0% 21.9% 14 34.0% 23.2% 15 36.0% 24.4% 16 38.0% 25.6% 17 40.0% 26.8% 18 42.0% 28.0%

| 10 S e c t i o n
2995 Sidco Drive Nashville, Tennessee 37204 T: (615)383-1113 www.ssr-inc.com
P a g e | 26
100% RECONCILED SDSUSTAINABILITY NARRATIVE
19 44.0% 29.2% 20 46.0% 30.5% 21 48.0% 31.7%
A comparison of the Proposed and Baseline Designs is provided in Figure 19, Figure 20, and Figure 21 below.
Figure 19. Proposed Design Energy Costs by End Use Figure 20. Baseline Design Energy Costs by End Use
Interior Lighting17.2%
Space Heating11.0%
Space Cooling
3.9%Pumps0.2%
Heat Rejection
0.1%Fans -
Interior7.8%
DHW3.0%
Process Loads27.5%
Savings29.2%
Interior Lighting17.2%
Space Heating23.6%
Space Cooling
6.9%Pumps2.1%
Heat Rejection
3.2%
Fans -Interior16.3%
DHW3.0%
Process Loads27.5%

| 10 S e c t i o n
2995 Sidco Drive Nashville, Tennessee 37204 T: (615)383-1113 www.ssr-inc.com
P a g e | 27
100% RECONCILED SDSUSTAINABILITY NARRATIVE
Figure 21. Comparison of Baseline and Proposed Designs
| 10 S e c t i o n
2995 Sidco Drive Nashville, Tennessee 37204 T: (615)383-1113 www.ssr-inc.com
P a g e | 28
100% RECONCILED SDSUSTAINABILITY NARRATIVE
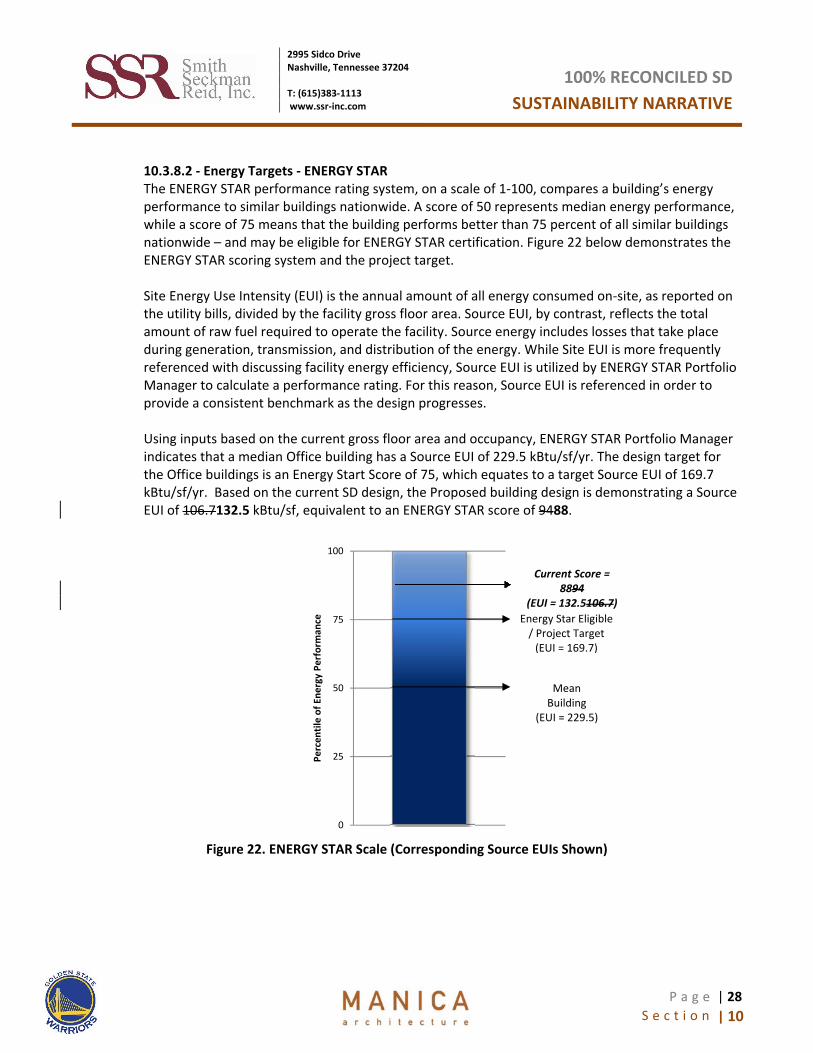
10.3.8.2 - Energy Targets - ENERGY STAR The ENERGY STAR performance rating system, on a scale of 1-100, compares a building’s energy performance to similar buildings nationwide. A score of 50 represents median energy performance, while a score of 75 means that the building performs better than 75 percent of all similar buildings nationwide – and may be eligible for ENERGY STAR certification. Figure 22 below demonstrates the ENERGY STAR scoring system and the project target. Site Energy Use Intensity (EUI) is the annual amount of all energy consumed on-site, as reported on the utility bills, divided by the facility gross floor area. Source EUI, by contrast, reflects the total amount of raw fuel required to operate the facility. Source energy includes losses that take place during generation, transmission, and distribution of the energy. While Site EUI is more frequently referenced with discussing facility energy efficiency, Source EUI is utilized by ENERGY STAR Portfolio Manager to calculate a performance rating. For this reason, Source EUI is referenced in order to provide a consistent benchmark as the design progresses. Using inputs based on the current gross floor area and occupancy, ENERGY STAR Portfolio Manager indicates that a median Office building has a Source EUI of 229.5 kBtu/sf/yr. The design target for the Office buildings is an Energy Start Score of 75, which equates to a target Source EUI of 169.7 kBtu/sf/yr. Based on the current SD design, the Proposed building design is demonstrating a Source EUI of 106.7132.5 kBtu/sf, equivalent to an ENERGY STAR score of 9488.
Figure 22. ENERGY STAR Scale (Corresponding Source EUIs Shown)
0
25
50
75
100
Perc
entil
e of
Ene
rgy
Perf
orm
ance
Mean Building
(EUI = 229.5)
Energy Star Eligible / Project Target
(EUI = 169.7)
Current Score = 8894
(EUI = 132.5106.7)

| 10 S e c t i o n
2995 Sidco Drive Nashville, Tennessee 37204 T: (615)383-1113 www.ssr-inc.com
P a g e | 29
100% RECONCILED SDSUSTAINABILITY NARRATIVE
10.3.8.3 - Facility Description - Building Use Schedules Fractional utilization schedules for occupants, lights, equipment and other loads were specified for the buildings. The schedules currently used for the Office Buildings are based on the “Office” usage categories found in the ASHRAE 90.1-2007 User’s Manual and are shown in Figure 23 through Figure 25. These schedules include modifications to account for typical after-hours usage of lighting and office equipment.
Figure 23. Office Occupancy Schedule
Figure 24. Office Lighting Utilization Schedule
00.10.20.30.40.50.60.70.80.9
1
0 1 2 3 4 5 6 7 8 9 10 11 12 13 14 15 16 17 18 19 20 21 22 23 24
Frac
tiona
l Usa
ge
Hour
Weekday Saturday Sunday
00.10.20.30.40.50.60.70.80.9
1
0 1 2 3 4 5 6 7 8 9 10 11 12 13 14 15 16 17 18 19 20 21 22 23 24
Frac
tiona
l Usa
ge
Hour
Weekday Saturday Sunday
| 10 S e c t i o n
2995 Sidco Drive Nashville, Tennessee 37204 T: (615)383-1113 www.ssr-inc.com
P a g e | 30
100% RECONCILED SDSUSTAINABILITY NARRATIVE
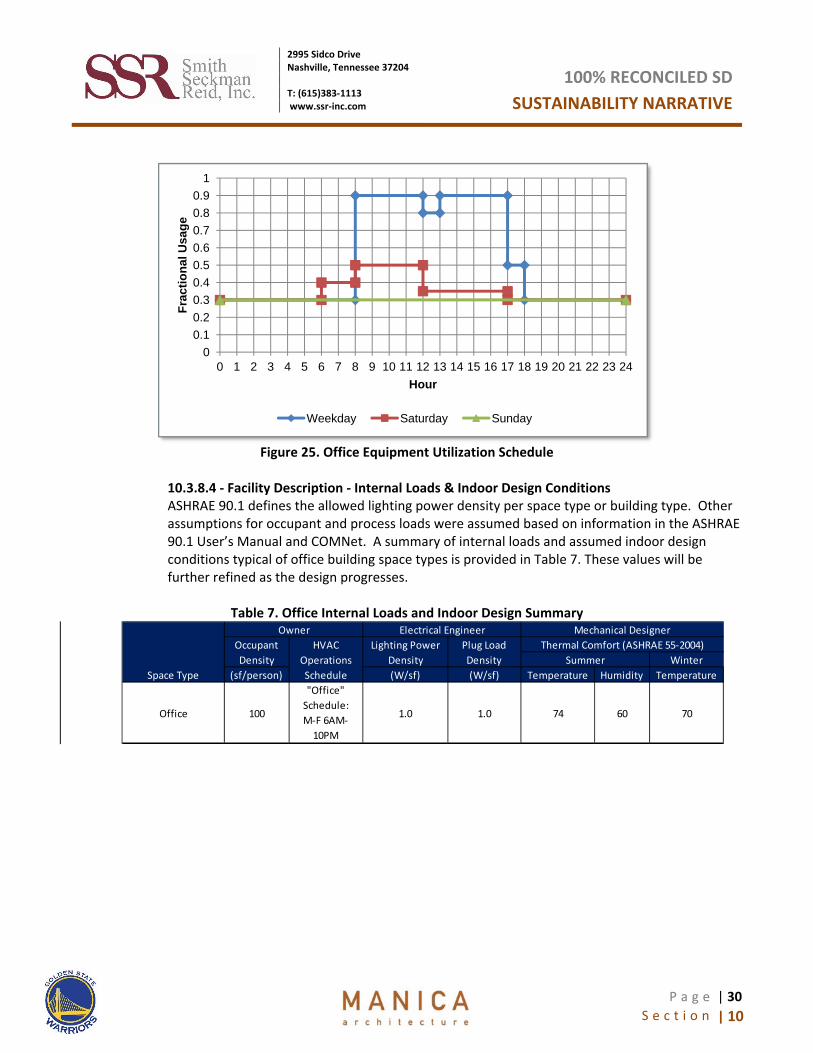
Figure 25. Office Equipment Utilization Schedule
10.3.8.4 - Facility Description - Internal Loads & Indoor Design Conditions ASHRAE 90.1 defines the allowed lighting power density per space type or building type. Other assumptions for occupant and process loads were assumed based on information in the ASHRAE 90.1 User’s Manual and COMNet. A summary of internal loads and assumed indoor design conditions typical of office building space types is provided in Table 7. These values will be further refined as the design progresses.
Table 7. Office Internal Loads and Indoor Design Summary
00.10.20.30.40.50.60.70.80.9
1
0 1 2 3 4 5 6 7 8 9 10 11 12 13 14 15 16 17 18 19 20 21 22 23 24
Frac
tiona
l Usa
ge
Hour
Weekday Saturday Sunday
(sf/person) (W/sf) (W/sf) Temperature Humidity Temperature
Office 100
"Office" Schedule:M-F 6AM-
10PM
1.0 1.0 74 60 70
HVAC Operations Schedule
Lighting Power Density
Plug Load Density
Mechanical DesignerThermal Comfort (ASHRAE 55-2004)
Summer WinterSpace Type
Owner Electrical EngineerOccupant Density

| 10 S e c t i o n
2995 Sidco Drive Nashville, Tennessee 37204 T: (615)383-1113 www.ssr-inc.com
P a g e | 31
100% RECONCILED SDSUSTAINABILITY NARRATIVE
10.3.8.5 - Facility Description - Baseline and Proposed Modeling Inputs
Project Name: Golden State Warriors - Office Buildings City, State: San Francisco, CA
Climate Zone: 3C Heating Source: Electricity
Energy Standard: ASHRAE 90.1-2007, App. G Energy Simulation Program: IES <VE>
Summary of Energy Model Inputs
Model Input Parameter / Energy Efficiency Measure
Proposed Case per SD plans and narratives
Baseline Case per ASHRAE 90.1-2007 Appendix G
Building Envelope (Construction Assemblies)
Roofs Insulation entirely above deck - R-20 c.i.; U-0.048
Roof SRI Roof reflectance to 0.3 (absorptivity=0.7)
Walls - Above Grade Steel-framed, R-13 + R-3.8 c.i.; U-0.084
Exposed Floors Steel-joist floor with R-19 insulation; U-0.052
Slab-On-Grade Floors Unheated, no insulation, F-0.730
Infiltration Rates 0.4 cfm/sf of surface area when tested to 75 Pa per ASTM E779-10
Fenestration and Shading
Vertical fenestration Area (% of Wall area) 69%40% 40%
Vertical Glazing Description Metal Framing (curtainwall/storefront)
Vertical Glazing U-factor 0.434 (Window-Assembly) 0.60 (Window-Assembly)
Vertical Glazing SHGC 0.31283 (Window-Assembly) 0.25 (Window-Assembly)
HVAC (Air-side)
Primary HVAC Type
- Office -– (2) Rooftop (3) AHUs in Penthouse w/ IDEC units, supplemental DX Cooling, and electric heating serve Air Column Units on each floor which pressurize UFAD system; heating with with series, fan-powered electric reheat air terminal unitss - Lobby - (1) Penthouse VAV AHU w/ IDEC, Supplemental DX cooling and electric heating - Retail - CV DOAS with IDEC, supplemental DX cooling, and electric preheat coils provide room-neutral air to spaces; Single-zone, constant volume VRF heat recovery type heat pumps serve space loads
System #8 - VAV Air handling units, CHW cooling, and electric reheat in fan-powered VAV boxes; One System per floor
Unitary Cooling Efficiency IDEC DX - 12 EER / 12.2 IEER VRF - 9.3 EER / 10.4 IEER n/a
Unitary Heating Efficiency Electric Resistance - 100% VRF Heating - 3.2 COP Electric Resistance - 100%
Fan System Operation Fans operate continuously whenever spaces are occupied and cycle to meet loads when unoccupied
| 10 S e c t i o n
2995 Sidco Drive Nashville, Tennessee 37204 T: (615)383-1113 www.ssr-inc.com
P a g e | 32
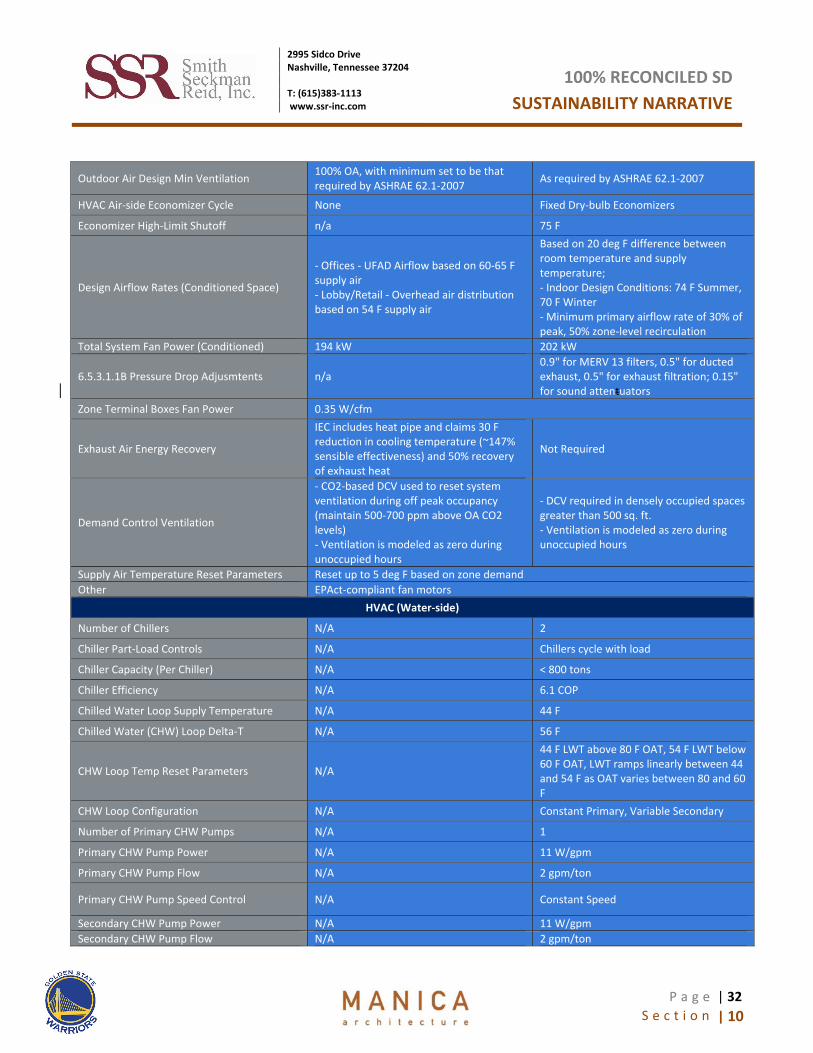
100% RECONCILED SDSUSTAINABILITY NARRATIVE
Outdoor Air Design Min Ventilation 100% OA, with minimum set to be that required by ASHRAE 62.1-2007 As required by ASHRAE 62.1-2007
HVAC Air-side Economizer Cycle None Fixed Dry-bulb Economizers
Economizer High-Limit Shutoff n/a 75 F
Design Airflow Rates (Conditioned Space)
- Offices - UFAD Airflow based on 60-65 F supply air - Lobby/Retail - Overhead air distribution based on 54 F supply air
Based on 20 deg F difference between room temperature and supply temperature; - Indoor Design Conditions: 74 F Summer, 70 F Winter - Minimum primary airflow rate of 30% of peak, 50% zone-level recirculation
Total System Fan Power (Conditioned) 194 kW 202 kW
6.5.3.1.1B Pressure Drop Adjusmtents n/a 0.9" for MERV 13 filters, 0.5" for ducted exhaust, 0.5" for exhaust filtration; 0.15" for sound attentuators
Zone Terminal Boxes Fan Power 0.35 W/cfm
Exhaust Air Energy Recovery
IEC includes heat pipe and claims 30 F reduction in cooling temperature (~147% sensible effectiveness) and 50% recovery of exhaust heat
Not Required
Demand Control Ventilation
- CO2-based DCV used to reset system ventilation during off peak occupancy (maintain 500-700 ppm above OA CO2 levels) - Ventilation is modeled as zero during unoccupied hours
- DCV required in densely occupied spaces greater than 500 sq. ft. - Ventilation is modeled as zero during unoccupied hours
Supply Air Temperature Reset Parameters Reset up to 5 deg F based on zone demand Other EPAct-compliant fan motors
HVAC (Water-side)
Number of Chillers N/A 2
Chiller Part-Load Controls N/A Chillers cycle with load
Chiller Capacity (Per Chiller) N/A < 800 tons
Chiller Efficiency N/A 6.1 COP
Chilled Water Loop Supply Temperature N/A 44 F
Chilled Water (CHW) Loop Delta-T N/A 56 F
CHW Loop Temp Reset Parameters N/A
44 F LWT above 80 F OAT, 54 F LWT below 60 F OAT, LWT ramps linearly between 44 and 54 F as OAT varies between 80 and 60 F
CHW Loop Configuration N/A Constant Primary, Variable Secondary
Number of Primary CHW Pumps N/A 1
Primary CHW Pump Power N/A 11 W/gpm
Primary CHW Pump Flow N/A 2 gpm/ton
Primary CHW Pump Speed Control N/A Constant Speed
Secondary CHW Pump Power N/A 11 W/gpm Secondary CHW Pump Flow N/A 2 gpm/ton
| 10 S e c t i o n
2995 Sidco Drive Nashville, Tennessee 37204 T: (615)383-1113 www.ssr-inc.com
P a g e | 33
100% RECONCILED SDSUSTAINABILITY NARRATIVE
Secondary CHW Pump Speed Control N/A Variable Speed Number of Cooling Towers / Fluid Coolers N/A 1 per chiller Cooling Tower Fan Power N/A 38.2 gpm/hr Cooling Tower Fan Control N/A 2-speed Condenser Water Leaving Temperature N/A 85 F Condenser Water (CW) Loop Delta-T N/A 10 F
CW Loop Temp Reset Parameters N/A Maintain 70 F CT LWT as conditions allow, floating up to design LWT of 85 F
CW Loop Configuration N/A Constant Primary Number of CW Pumps N/A 1 CW Pump Power N/A 19 W/gpm CW Pump Speed Control N/A Constant Speed Other EPAct-compliant pump motors
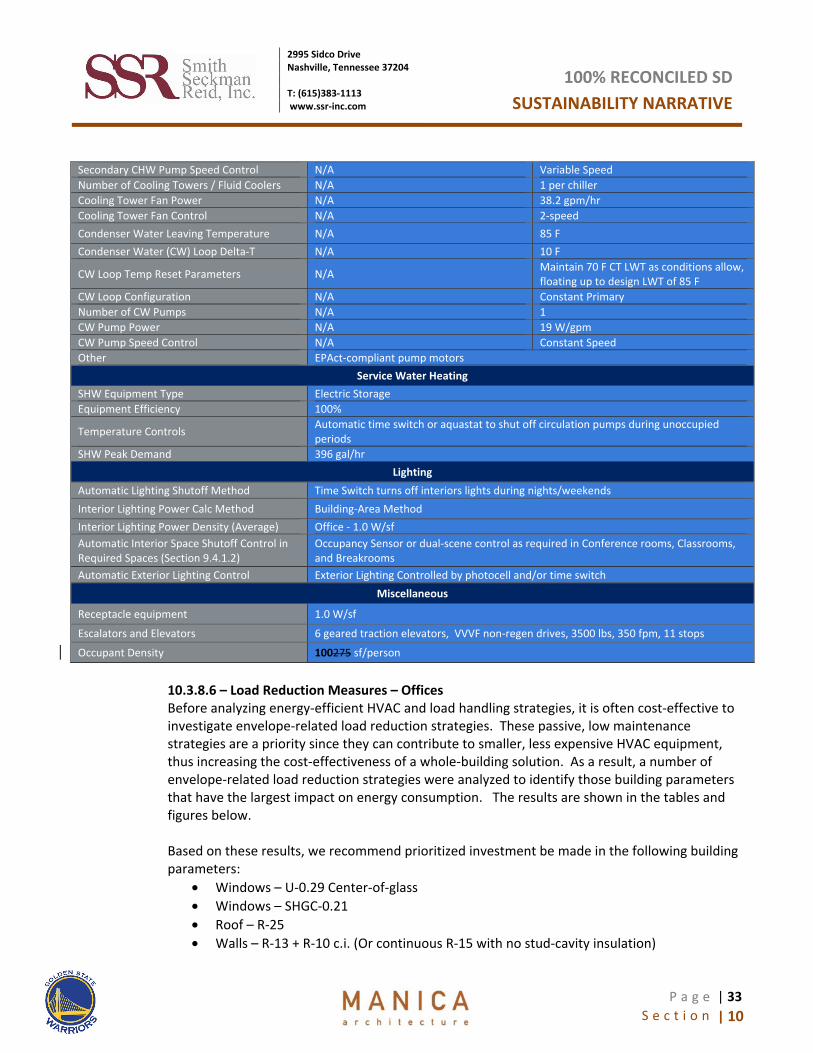
Service Water Heating SHW Equipment Type Electric Storage Equipment Efficiency 100%
Temperature Controls Automatic time switch or aquastat to shut off circulation pumps during unoccupied periods
SHW Peak Demand 396 gal/hr Lighting
Automatic Lighting Shutoff Method Time Switch turns off interiors lights during nights/weekends Interior Lighting Power Calc Method Building-Area Method Interior Lighting Power Density (Average) Office - 1.0 W/sf Automatic Interior Space Shutoff Control in Required Spaces (Section 9.4.1.2)
Occupancy Sensor or dual-scene control as required in Conference rooms, Classrooms, and Breakrooms
Automatic Exterior Lighting Control Exterior Lighting Controlled by photocell and/or time switch Miscellaneous
Receptacle equipment 1.0 W/sf
Escalators and Elevators 6 geared traction elevators, VVVF non-regen drives, 3500 lbs, 350 fpm, 11 stops
Occupant Density 100275 sf/person
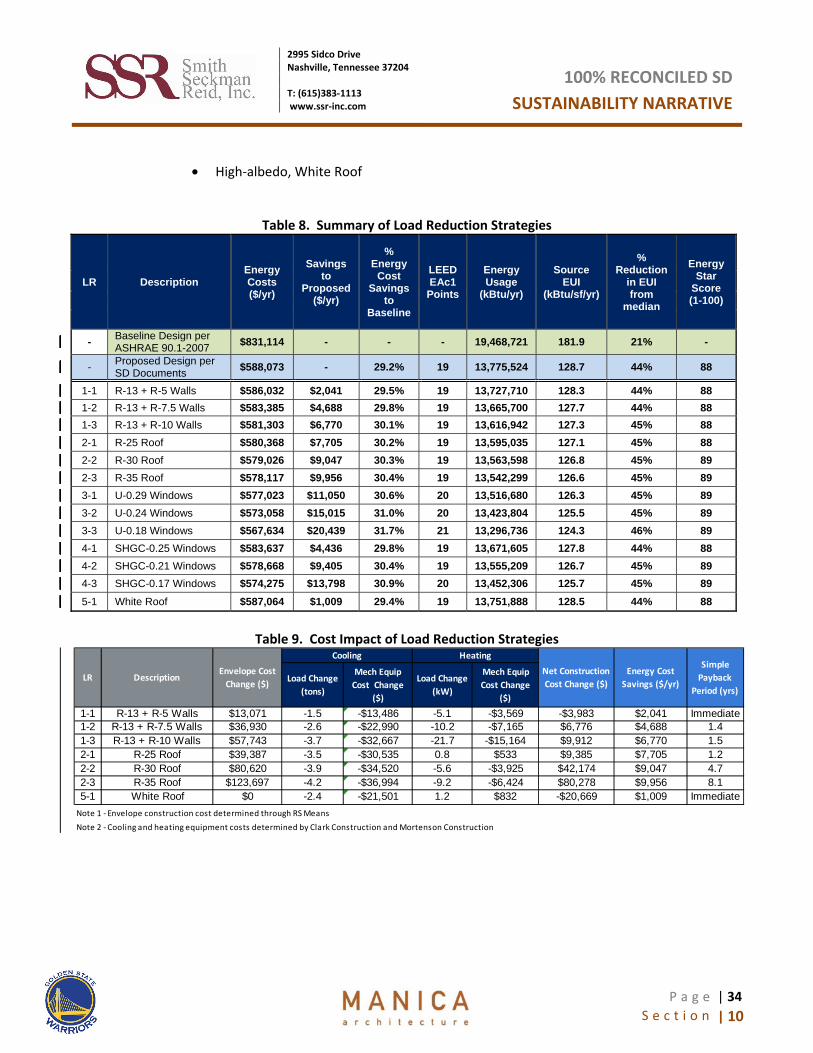
10.3.8.6 – Load Reduction Measures – Offices Before analyzing energy-efficient HVAC and load handling strategies, it is often cost-effective to investigate envelope-related load reduction strategies. These passive, low maintenance strategies are a priority since they can contribute to smaller, less expensive HVAC equipment, thus increasing the cost-effectiveness of a whole-building solution. As a result, a number of envelope-related load reduction strategies were analyzed to identify those building parameters that have the largest impact on energy consumption. The results are shown in the tables and figures below. Based on these results, we recommend prioritized investment be made in the following building parameters:
• Windows – U-0.29 Center-of-glass • Windows – SHGC-0.21 • Roof – R-25 • Walls – R-13 + R-10 c.i. (Or continuous R-15 with no stud-cavity insulation)
| 10 S e c t i o n
2995 Sidco Drive Nashville, Tennessee 37204 T: (615)383-1113 www.ssr-inc.com
P a g e | 34
100% RECONCILED SDSUSTAINABILITY NARRATIVE
• High-albedo, White Roof
Table 8. Summary of Load Reduction Strategies
LR Description Energy Costs ($/yr)
Savings to
Proposed ($/yr)
% Energy
Cost Savings
to Baseline
LEED EAc1
Points
Energy Usage
(kBtu/yr)
Source EUI
(kBtu/sf/yr)
% Reduction
in EUI from
median
Energy Star
Score (1-100)
- Baseline Design per ASHRAE 90.1-2007 $831,114 - - - 19,468,721 181.9 21% -
- Proposed Design per SD Documents $588,073 - 29.2% 19 13,775,524 128.7 44% 88
1-1 R-13 + R-5 Walls $586,032 $2,041 29.5% 19 13,727,710 128.3 44% 88 1-2 R-13 + R-7.5 Walls $583,385 $4,688 29.8% 19 13,665,700 127.7 44% 88 1-3 R-13 + R-10 Walls $581,303 $6,770 30.1% 19 13,616,942 127.3 45% 88 2-1 R-25 Roof $580,368 $7,705 30.2% 19 13,595,035 127.1 45% 88 2-2 R-30 Roof $579,026 $9,047 30.3% 19 13,563,598 126.8 45% 89 2-3 R-35 Roof $578,117 $9,956 30.4% 19 13,542,299 126.6 45% 89 3-1 U-0.29 Windows $577,023 $11,050 30.6% 20 13,516,680 126.3 45% 89 3-2 U-0.24 Windows $573,058 $15,015 31.0% 20 13,423,804 125.5 45% 89 3-3 U-0.18 Windows $567,634 $20,439 31.7% 21 13,296,736 124.3 46% 89 4-1 SHGC-0.25 Windows $583,637 $4,436 29.8% 19 13,671,605 127.8 44% 88 4-2 SHGC-0.21 Windows $578,668 $9,405 30.4% 19 13,555,209 126.7 45% 89 4-3 SHGC-0.17 Windows $574,275 $13,798 30.9% 20 13,452,306 125.7 45% 89
5-1 White Roof $587,064 $1,009 29.4% 19 13,751,888 128.5 44% 88
Table 9. Cost Impact of Load Reduction Strategies
1-1 R-13 + R-5 Walls $13,071 -1.5 -$13,486 -5.1 -$3,569 -$3,983 $2,041 Immediate1-2 R-13 + R-7.5 Walls $36,930 -2.6 -$22,990 -10.2 -$7,165 $6,776 $4,688 1.41-3 R-13 + R-10 Walls $57,743 -3.7 -$32,667 -21.7 -$15,164 $9,912 $6,770 1.52-1 R-25 Roof $39,387 -3.5 -$30,535 0.8 $533 $9,385 $7,705 1.22-2 R-30 Roof $80,620 -3.9 -$34,520 -5.6 -$3,925 $42,174 $9,047 4.72-3 R-35 Roof $123,697 -4.2 -$36,994 -9.2 -$6,424 $80,278 $9,956 8.15-1 White Roof $0 -2.4 -$21,501 1.2 $832 -$20,669 $1,009 Immediate
Note 1 - Envelope construction cost determined through RS MeansNote 2 - Cooling and heating equipment costs determined by Clark Construction and Mortenson Construction
LR DescriptionEnvelope Cost
Change ($) Load Change (tons)
Mech Equip Cost Change
($)
Load Change (kW)
Mech Equip Cost Change
($)
Cooling HeatingNet Construction Cost Change ($)
Energy Cost Savings ($/yr)
Simple Payback
Period (yrs)

| 10 S e c t i o n
2995 Sidco Drive Nashville, Tennessee 37204 T: (615)383-1113 www.ssr-inc.com
P a g e | 35
100% RECONCILED SDSUSTAINABILITY NARRATIVE
Figure 26. Energy Cost Savings of Load Reduction Measures
Figure 27. Cooling Load Reductions due to Load Reduction Measures
0.0
5.0
10.0
15.0
20.0
25.0
30.0
Cool
ing
Load
Red
uctio
n (t
ons)

| 10 S e c t i o n
2995 Sidco Drive Nashville, Tennessee 37204 T: (615)383-1113 www.ssr-inc.com
P a g e | 36
100% RECONCILED SDSUSTAINABILITY NARRATIVE
Figure 28. Heating Load Reductions due to Load Reduction Measures
Improved Window Assembly U-values The Proposed Building is assumed to have windows with an overall assembly U-value of U-0.43. By contrast, the Baseline design includes glazings having a whole-window assembly U-value of U-0.60 and a solar heat gain coefficient of SHGC-0.25. This strategy involves using various combinations of Low-E, argon-filled, and/or triple-paned glazings in a thermally broken window frame to reduce heat transfer. For the purpose of this analysis, Viracon glass and Kawneer 1600UT System 2 curtainwall framing was assumed as the basis of design. Table 10 lists potential glazing alternatives, showing the Center-of-Glass U-values, as well as the corresponding Window Assembly U-values.
Table 10. Potential Glazing Alternatives Viracon U-values
Description Product Center-of-Glass Window-Assembly
Low-E on #2, Air-filled VE1-2M on Clear 0.29 0.38
Low-E on #2, Argon-filled VE1-2M on Clear 0.24 0.33
Triple-pane, Low-E on #2, Argon-filled VE1-2M on Clear 0.18 0.28
-10.0
0.0
10.0
20.0
30.0
40.0
50.0
60.0
70.0He
atin
g Lo
ad R
educ
tion
(kW
)

| 10 S e c t i o n
2995 Sidco Drive Nashville, Tennessee 37204 T: (615)383-1113 www.ssr-inc.com
P a g e | 37
100% RECONCILED SDSUSTAINABILITY NARRATIVE
Improved Window Assembly SHGC-values The Proposed Building is assumed to have windows with a solar heat gain coefficients (SHGC) of 0.283 as its basis of design. By contrast, the Baseline Building includes windows with a SHGC of 0.25 at all orientations. This strategy involves using tinted, fritted, or reflective glass types with reduced center-of-glass SHGC values. This lowering of the SHGC is meant to reduce solar heat gain to the space, thereby reducing cooling needed. However, a balance must be struck in climates with moderately cold winters, as a higher SHGC can help to reduce heating costs in the winter. For the purpose of this analysis, Viracon’s website was referenced to identify feasible SHGC alternatives, with the following alternatives tested in the energy model: 1) SHGC-0.25 2) SHGC-0.21 3) SHGC-0.17 Increased Roof Insulation The Baseline design includes a light-weight roof assembly with continuous R-20 insulation entirely above deck, resulting in a roof assembly U-value of U-0.048. This strategy involves adding increasing amounts of insulation to the entire roof, resulting in the following roof alternatives: 1) R-25 continuous insulation (c.i.) – U-0.039 2) R-30 continuous insulation (c.i.) – U-0.032 3) R-35 continuous insulation (c.i.) – U-0.028 Increased Wall Insulation The Baseline design includes steel-framed walls with R-13 batt between studs on 16” centers and R-3.8 continuous insulation (c.i.), resulting in a wall assembly U-value of U-0.084. This strategy involves adding increasing levels of continuous rigid insulation to the wall assembly. The batt insulation is optional, so long as an additional inch of continuous insulation is added in its absence. The resulting wall alternatives analyzed were as follows: 1) R-13 batt + R-5 c.i. – U-0.077 2) R-13 batt + R-7.5 c.i. – U-0.064 3) R-13 batt + R-10 c.i. – U-0.055 High-Albedo, Cool Roof The Baseline design includes a dark-colored roof modeled with a long-term reflectance of 0.3. This strategy investigates the use of a high-albedo, white-colored roof with either a reflectance of greater than 0.70 and an emittance greater than 0.75 or a minimum SRI of 82. In this case, the roof of the Proposed design can be modeled with a long-term reflectance of 0.45.
| 10 S e c t i o n
2995 Sidco Drive Nashville, Tennessee 37204 T: (615)383-1113 www.ssr-inc.com
P a g e | 38
100% RECONCILED SDSUSTAINABILITY NARRATIVE
10.4 – CAMPUS SUSTAINABLE APPROACH
10.4.1 - Process Overview • The LEED Campus Approach streamlines the LEED certification process for larger and
more complex projects. Multiple building projects that share a site, and are under the control of the same owner, developer, or property management, fall into the criteria of the campus program. Under the Campus Approach, several LEED credits and prerequisites may be reviewed and pre-approved. Once earned, these credits may be claimed by all LEED projects for that campus, though the Campus is not eligible for LEED certification itself. The US Green Building Council (USGBC) defines a campus credit as one that can be attempted for most or all projects within a LEED campus boundary because of shared site features and uniformity in project or management traits.
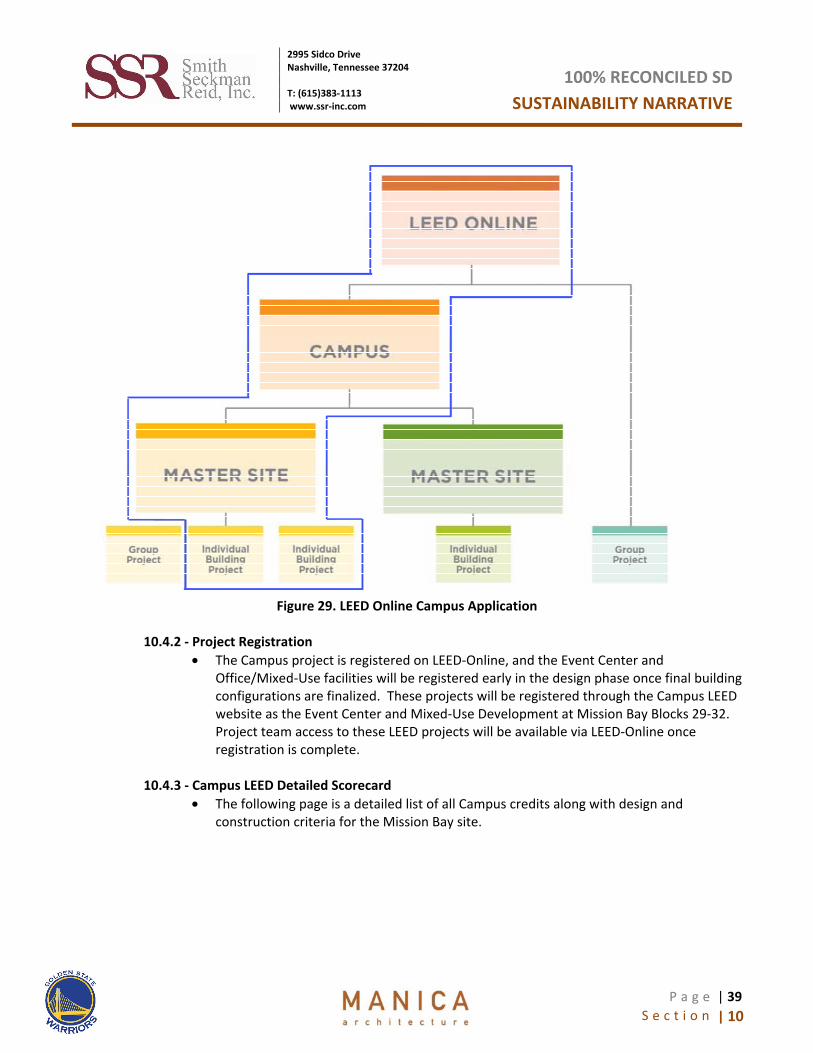
• As highlighted in Figure 29, the Campus project will consist of a Master Site with several individual building projects. The Office/Mixed-Use Development will be utilizing LEED Core and Shell. The North Tower and South Tower, inclusive of the Gatehouse, will pursue LEED individually, earning two separate LEED Gold certifications. The Event Center, inclusive of the Arena, Markethall and Bayfront Terrace, will use LEED for New Construction. Campuses with multiple segregated sites can register multiple LEED Master Sites to create groups of buildings within the campus. For this project the terms Master Site and Campus represent the same single entity within the LEED certification process. Therefore, from this point on the project will be referred to as the “Campus.”
| 10 S e c t i o n
2995 Sidco Drive Nashville, Tennessee 37204 T: (615)383-1113 www.ssr-inc.com
P a g e | 39
100% RECONCILED SDSUSTAINABILITY NARRATIVE
Figure 29. LEED Online Campus Application
10.4.2 - Project Registration
• The Campus project is registered on LEED-Online, and the Event Center and Office/Mixed-Use facilities will be registered early in the design phase once final building configurations are finalized. These projects will be registered through the Campus LEED website as the Event Center and Mixed-Use Development at Mission Bay Blocks 29-32. Project team access to these LEED projects will be available via LEED-Online once registration is complete.
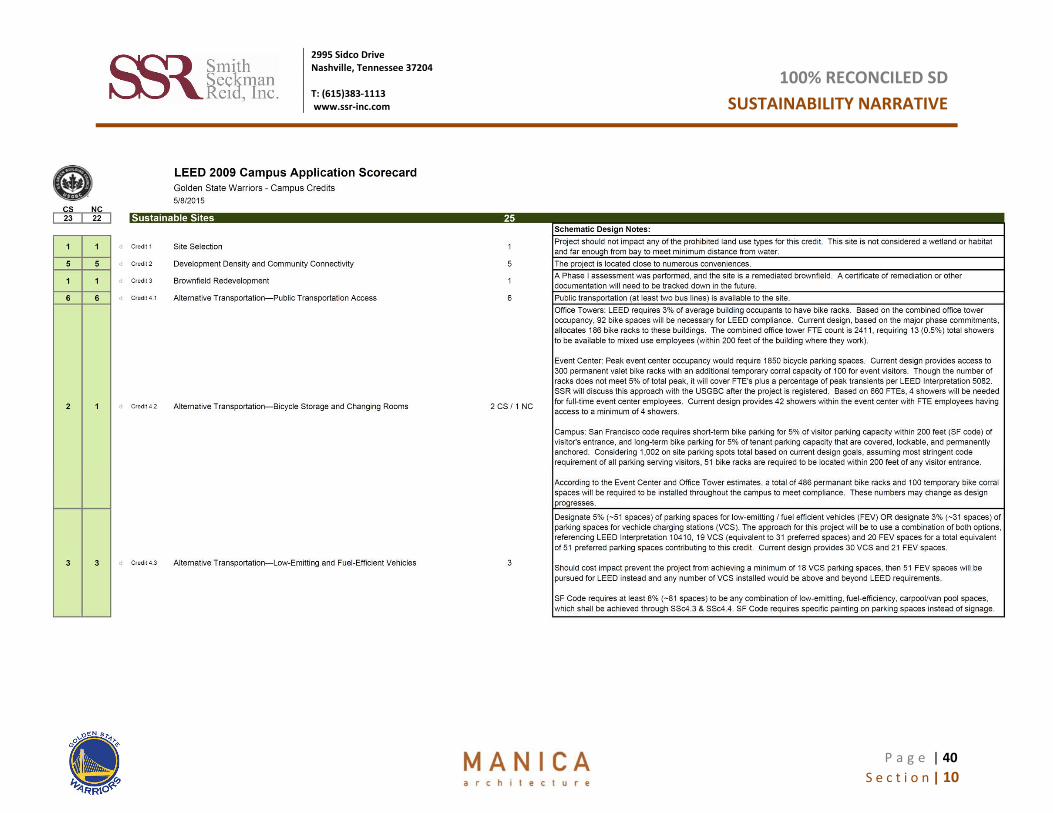
10.4.3 - Campus LEED Detailed Scorecard
• The following page is a detailed list of all Campus credits along with design and construction criteria for the Mission Bay site.
S e c t i o n | 10
2995 Sidco Drive Nashville, Tennessee 37204 T: (615)383-1113 www.ssr-inc.com
P a g e | 40
100% RECONCILED SDSUSTAINABILITY NARRATIVE

S e c t i o n | 10
2995 Sidco Drive Nashville, Tennessee 37204 T: (615)383-1113 www.ssr-inc.com
P a g e | 41
100% RECONCILED SDSUSTAINABILITY NARRATIVE

| 10 S e c t i o n
2995 Sidco Drive Nashville, Tennessee 37204 T: (615)383-1113 www.ssr-inc.com
P a g e | 42
100% RECONCILED SDSUSTAINABILITY NARRATIVE
10.5 – EVENT CENTER SUSTAINABLE APPROACH
10.5.1 - Narrative • The 100% Reconciled SD analysis identifies approximately sixty-eight six (6866) LEED®
points that are available either within the current design or with minor modifications for the Event Center project. These credits are identified on the provided LEED® Credit Checklist under the “Yes” column. An additional seven nine (79) points identified under the “Maybe” column may be possible, pending further research and potentially higher investment. Credits under the “No” column were designated as such based on a higher associated cost or inapplicability to this project.
• With sixty (60) points required for LEED® Gold certification, this project is well positioned to achieve the minimum certification goal. A buffer of five to six (5-6) points above the desired certification threshold is recommended.
• With the Arena, Bayfront Terrace and Markethall being contiguous spaces these facilities will all be included as part of the Event Center’s LEED application.
10.5.2 - Measurement & Verification
• LEED EA credit 5 Measurement and Verification is intended to provide for the ongoing accountability of building energy consumption over time. Through the use of utility invoices, building automation system (BAS) data logging, permanently installed sub-metering, and spot measurements, the facility will measure the actual utility usage of the building for each energy end use for at least 12 months post-occupancy. The method of metering will be primarily through the use of building meters and sub-meters. These meters will record the electrical and natural gas loads as indicated below and in the final M&V plan. These meters are intended to validate the anticipated energy savings indicated in LEED EAc1. See Electrical Narrative (Section 4) for more details on the networked metering system.
| 10 S e c t i o n
2995 Sidco Drive Nashville, Tennessee 37204 T: (615)383-1113 www.ssr-inc.com
P a g e | 43
100% RECONCILED SDSUSTAINABILITY NARRATIVE
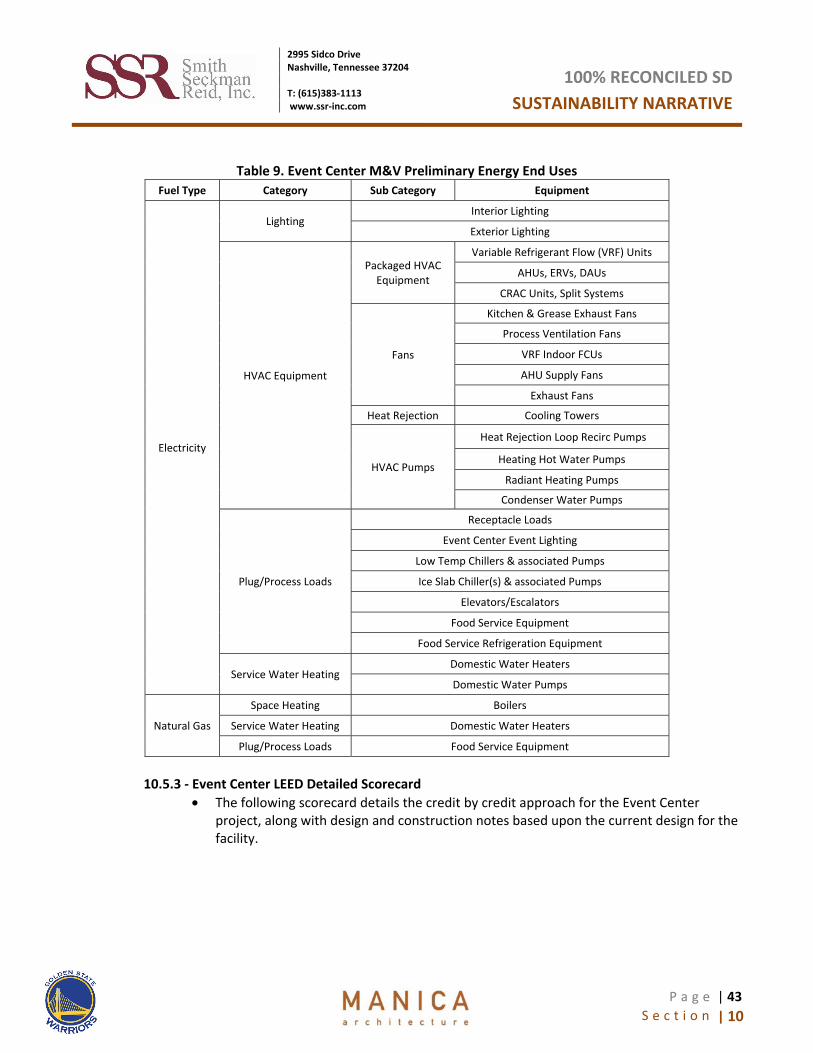
Table 9. Event Center M&V Preliminary Energy End Uses Fuel Type Category Sub Category Equipment
Electricity
Lighting Interior Lighting
Exterior Lighting
HVAC Equipment
Packaged HVAC Equipment
Variable Refrigerant Flow (VRF) Units
AHUs, ERVs, DAUs
CRAC Units, Split Systems
Fans
Kitchen & Grease Exhaust Fans
Process Ventilation Fans
VRF Indoor FCUs
AHU Supply Fans
Exhaust Fans
Heat Rejection Cooling Towers
HVAC Pumps
Heat Rejection Loop Recirc Pumps
Heating Hot Water Pumps
Radiant Heating Pumps
Condenser Water Pumps
Plug/Process Loads
Receptacle Loads
Event Center Event Lighting
Low Temp Chillers & associated Pumps
Ice Slab Chiller(s) & associated Pumps
Elevators/Escalators
Food Service Equipment
Food Service Refrigeration Equipment
Service Water Heating Domestic Water Heaters
Domestic Water Pumps
Natural Gas
Space Heating Boilers
Service Water Heating Domestic Water Heaters
Plug/Process Loads Food Service Equipment
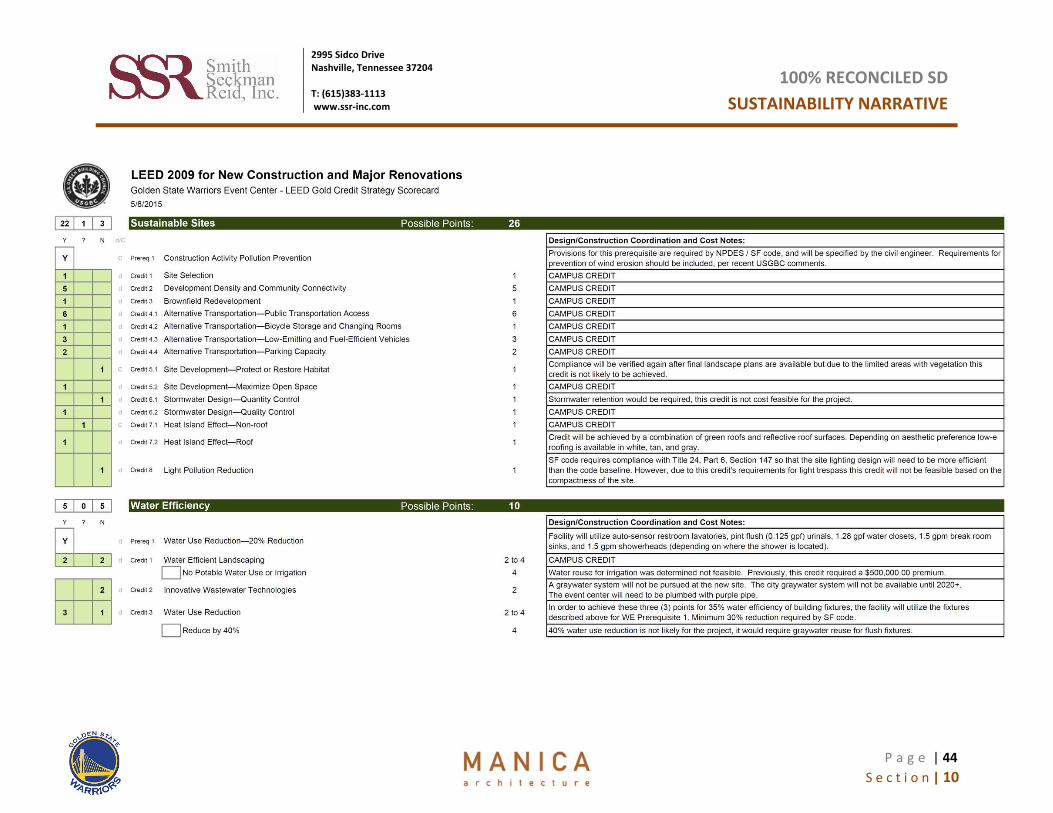
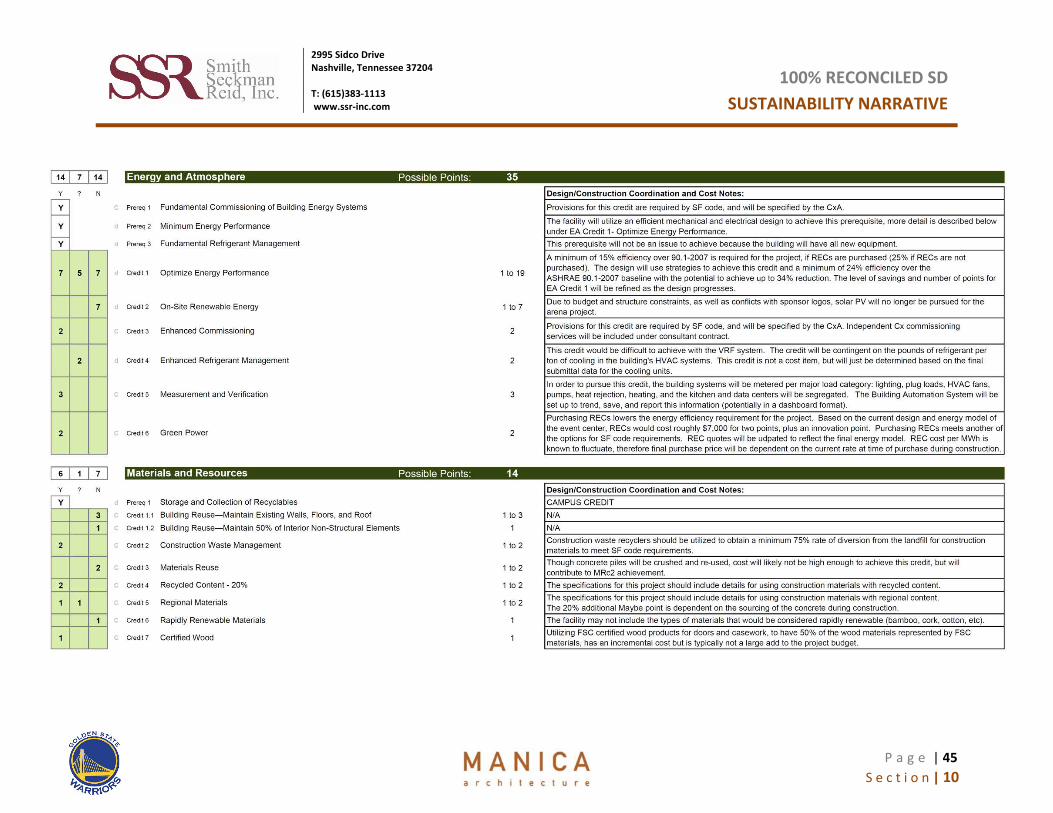
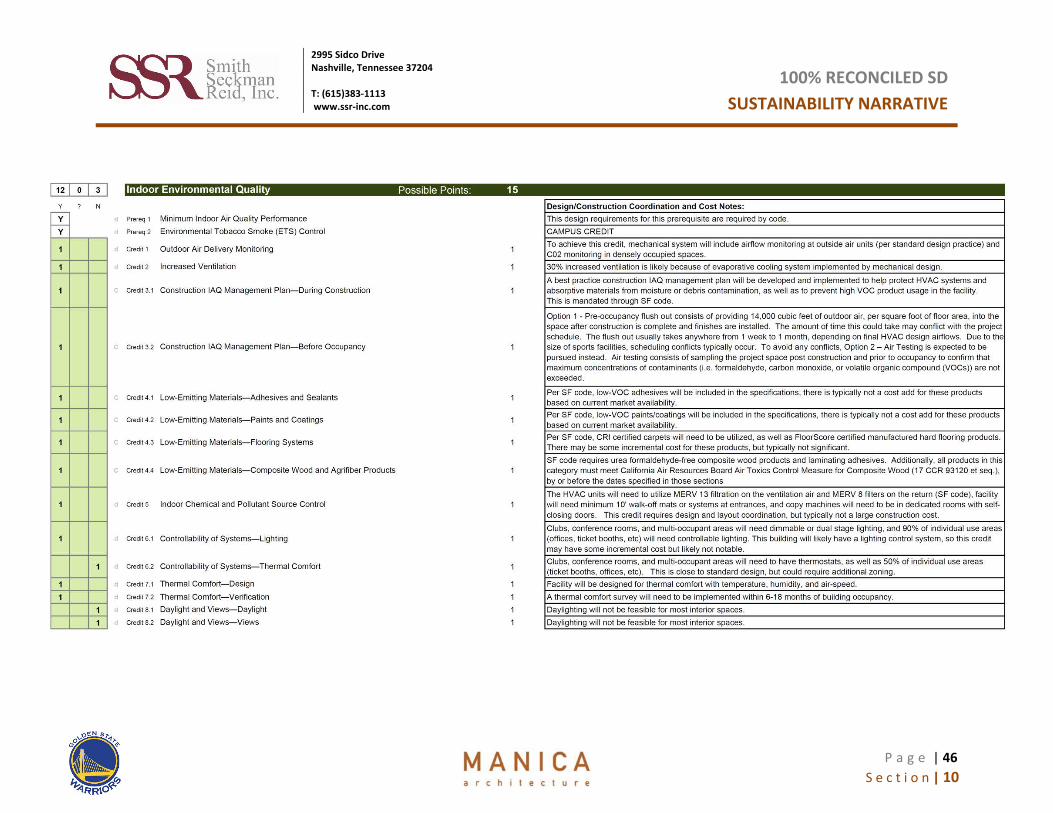
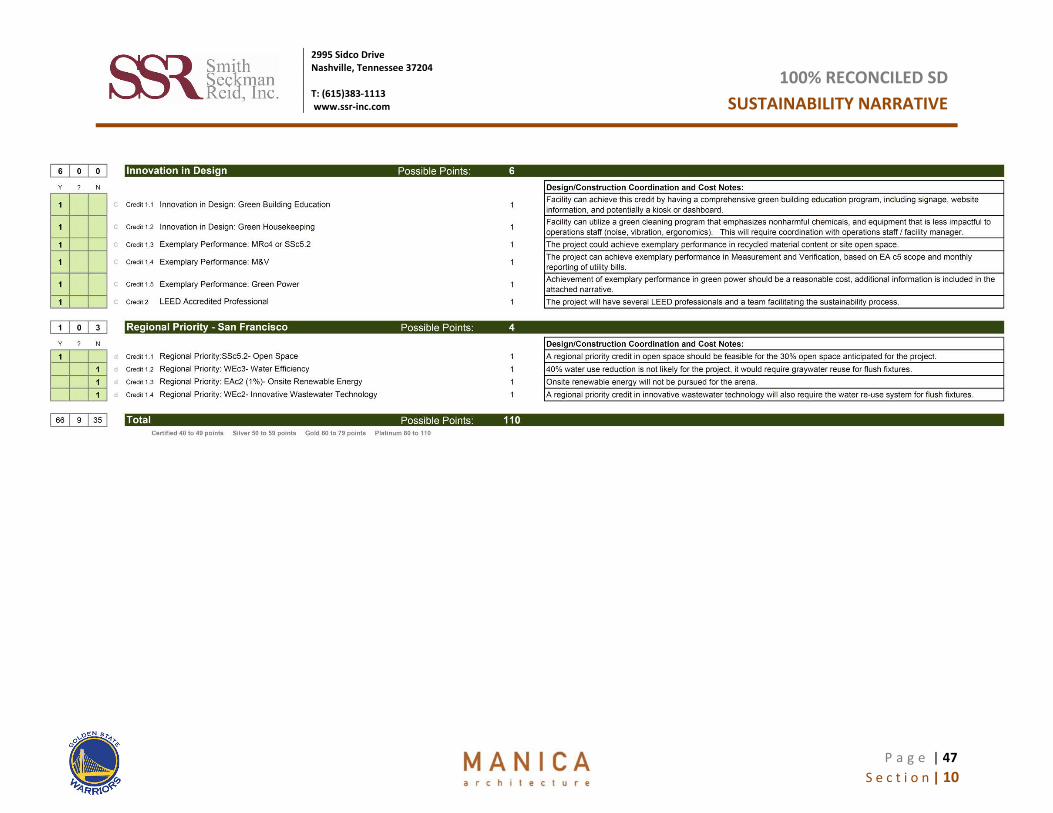
10.5.3 - Event Center LEED Detailed Scorecard
• The following scorecard details the credit by credit approach for the Event Center project, along with design and construction notes based upon the current design for the facility.
S e c t i o n | 10
2995 Sidco Drive Nashville, Tennessee 37204 T: (615)383-1113 www.ssr-inc.com
P a g e | 44
100% RECONCILED SDSUSTAINABILITY NARRATIVE
S e c t i o n | 10
2995 Sidco Drive Nashville, Tennessee 37204 T: (615)383-1113 www.ssr-inc.com
P a g e | 45
100% RECONCILED SDSUSTAINABILITY NARRATIVE
S e c t i o n | 10
2995 Sidco Drive Nashville, Tennessee 37204 T: (615)383-1113 www.ssr-inc.com
P a g e | 46
100% RECONCILED SDSUSTAINABILITY NARRATIVE
S e c t i o n | 10
2995 Sidco Drive Nashville, Tennessee 37204 T: (615)383-1113 www.ssr-inc.com
P a g e | 47
100% RECONCILED SDSUSTAINABILITY NARRATIVE
| 10 S e c t i o n
2995 Sidco Drive Nashville, Tennessee 37204 T: (615)383-1113 www.ssr-inc.com
P a g e | 48
100% RECONCILED SDSUSTAINABILITY NARRATIVE
10.6 – OFFICE TOWER(S) / MIXED USE SUSTAINABLE APPROACH
10.6.1 - Narrative • The 100% Reconciled SD analysis identifies sixty-six seven (6667) LEED® points that are
available either based on current design or with minor modifications, similar to the Event Center project. These credits are identified on the provided LEED® Credit Checklist under the “Yes” column. An additional sixteen twenty (1620) points identified under the “Maybe” column may be possible, pending further research and potentially higher investment. Credits under the “No” column were designated as such based on a higher associated cost or inapplicability to this project.
• With sixty (60) points required for LEED® Gold certification, this project is well positioned to achieve the minimum certification goal. As with the Event Center project, a buffer of five to six (5-6) points above the desired certification threshold is recommended.
10.6.2 - Measurement & Verification
• LEED EA credit 5 Measurement and Verification is intended to provide for the ongoing accountability of building energy consumption over time. Through the use of utility invoices, building automation system (BAS) data logging, permanently installed sub-metering, and spot measurements, the facility will measure the actual utility usage of the building for each energy end use for at least 12 months post-occupancy. The method of metering will be primarily through the use of building meters and sub-meters. These meters will record the electrical and natural gas loads as indicated below and in the final M&V plan. These meters are intended to validate the anticipated energy savings indicated in LEED EAc1. See Electrical Narrative (Section 4) for more details on the networked metering system.
| 10 S e c t i o n
2995 Sidco Drive Nashville, Tennessee 37204 T: (615)383-1113 www.ssr-inc.com
P a g e | 49
100% RECONCILED SDSUSTAINABILITY NARRATIVE
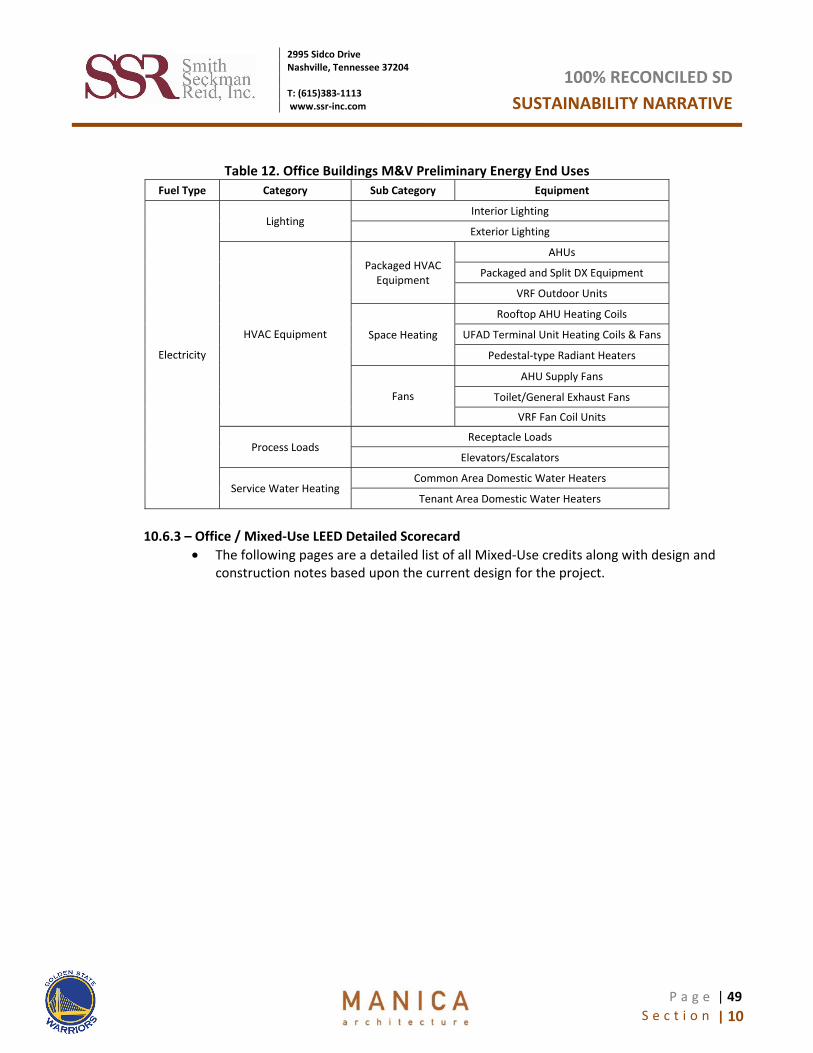
Table 12. Office Buildings M&V Preliminary Energy End Uses Fuel Type Category Sub Category Equipment
Electricity
Lighting Interior Lighting
Exterior Lighting
HVAC Equipment
Packaged HVAC Equipment
AHUs
Packaged and Split DX Equipment
VRF Outdoor Units
Space Heating
Rooftop AHU Heating Coils
UFAD Terminal Unit Heating Coils & Fans
Pedestal-type Radiant Heaters
Fans
AHU Supply Fans
Toilet/General Exhaust Fans
VRF Fan Coil Units
Process Loads Receptacle Loads
Elevators/Escalators
Service Water Heating Common Area Domestic Water Heaters
Tenant Area Domestic Water Heaters
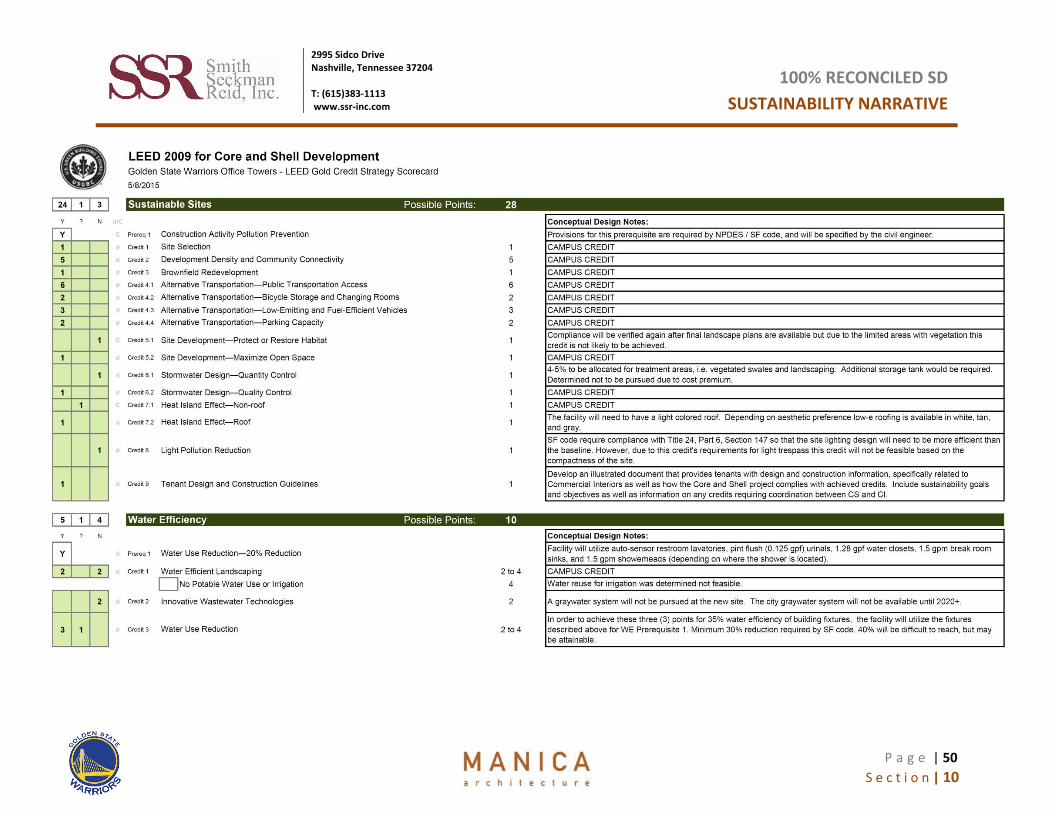
10.6.3 – Office / Mixed-Use LEED Detailed Scorecard
• The following pages are a detailed list of all Mixed-Use credits along with design and construction notes based upon the current design for the project.
S e c t i o n | 10
2995 Sidco Drive Nashville, Tennessee 37204 T: (615)383-1113 www.ssr-inc.com
P a g e | 50
100% RECONCILED SDSUSTAINABILITY NARRATIVE

S e c t i o n | 10
2995 Sidco Drive Nashville, Tennessee 37204 T: (615)383-1113 www.ssr-inc.com
P a g e | 51
100% RECONCILED SDSUSTAINABILITY NARRATIVE

S e c t i o n | 10
2995 Sidco Drive Nashville, Tennessee 37204 T: (615)383-1113 www.ssr-inc.com
P a g e | 52
100% RECONCILED SDSUSTAINABILITY NARRATIVE
| 10 S e c t i o n
2995 Sidco Drive Nashville, Tennessee 37204 T: (615)383-1113 www.ssr-inc.com
P a g e | 53
100% RECONCILED SDSUSTAINABILITY NARRATIVE
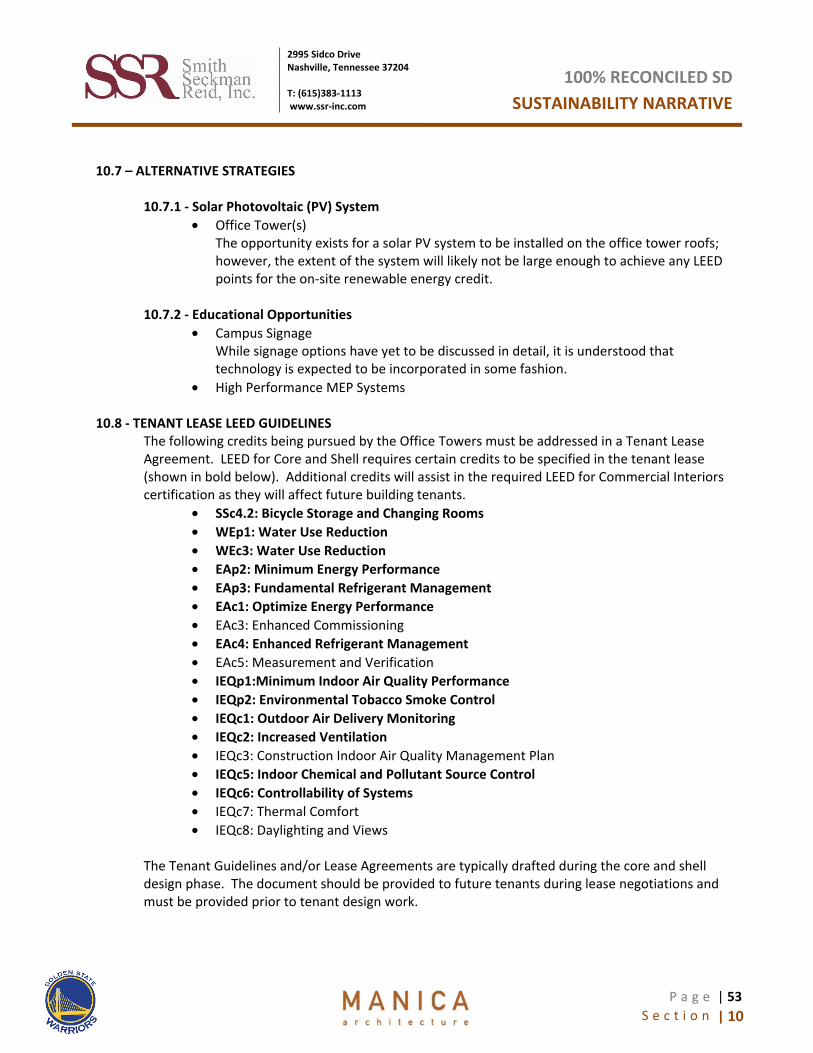
10.7 – ALTERNATIVE STRATEGIES
10.7.1 - Solar Photovoltaic (PV) System • Office Tower(s)
The opportunity exists for a solar PV system to be installed on the office tower roofs; however, the extent of the system will likely not be large enough to achieve any LEED points for the on-site renewable energy credit.
10.7.2 - Educational Opportunities
• Campus Signage While signage options have yet to be discussed in detail, it is understood that technology is expected to be incorporated in some fashion.
• High Performance MEP Systems
10.8 - TENANT LEASE LEED GUIDELINES The following credits being pursued by the Office Towers must be addressed in a Tenant Lease Agreement. LEED for Core and Shell requires certain credits to be specified in the tenant lease (shown in bold below). Additional credits will assist in the required LEED for Commercial Interiors certification as they will affect future building tenants.
• SSc4.2: Bicycle Storage and Changing Rooms • WEp1: Water Use Reduction • WEc3: Water Use Reduction • EAp2: Minimum Energy Performance • EAp3: Fundamental Refrigerant Management • EAc1: Optimize Energy Performance • EAc3: Enhanced Commissioning • EAc4: Enhanced Refrigerant Management • EAc5: Measurement and Verification • IEQp1:Minimum Indoor Air Quality Performance • IEQp2: Environmental Tobacco Smoke Control • IEQc1: Outdoor Air Delivery Monitoring • IEQc2: Increased Ventilation • IEQc3: Construction Indoor Air Quality Management Plan • IEQc5: Indoor Chemical and Pollutant Source Control • IEQc6: Controllability of Systems • IEQc7: Thermal Comfort • IEQc8: Daylighting and Views
The Tenant Guidelines and/or Lease Agreements are typically drafted during the core and shell design phase. The document should be provided to future tenants during lease negotiations and must be provided prior to tenant design work.

| 10 S e c t i o n
2995 Sidco Drive Nashville, Tennessee 37204 T: (615)383-1113 www.ssr-inc.com
P a g e | 54
100% RECONCILED SDSUSTAINABILITY NARRATIVE
10.9 – APPENDICES
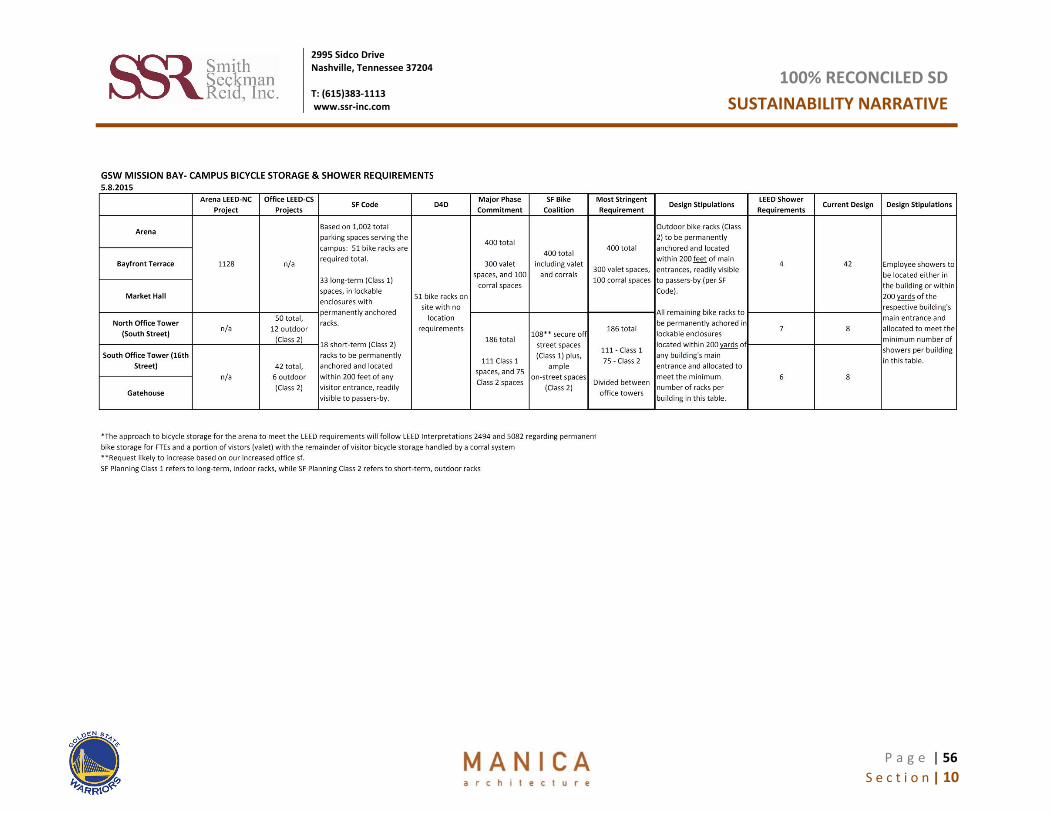
10.9.2 - Bike Rack Counts • This credit represents a sustainability goal that contains overlapping requirements from
LEED and various codes. The final number of bike racks will be determined during the design process, with the maximum number being driven by LEED (which bases its requirements on facility occupancy counts). Appendix A shows a current detailed snapshot of the overlapping bicycle storage requirements. Showers must also be provided for FTEs in the Event Center and mixed-use buildings.
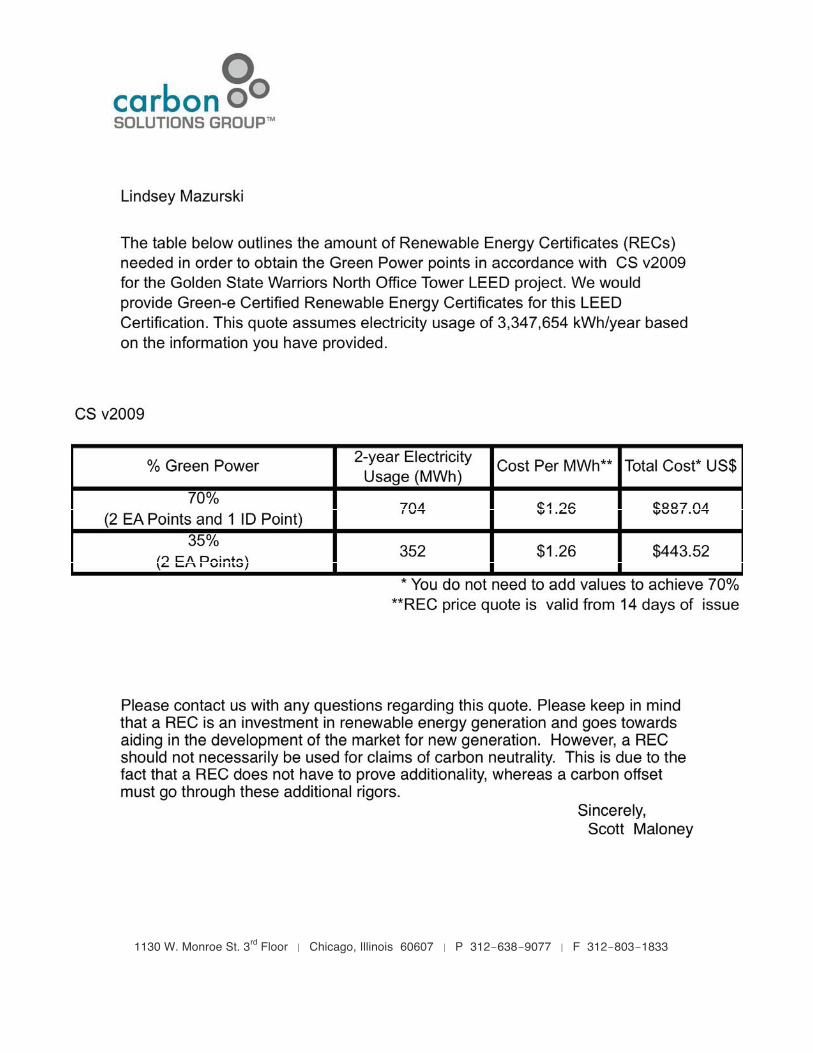
10.9.3 - Green Power Quote
• SSRCx will request updates to the green power quotes once more accurate information is available after final energy models have been completed. Appendix B shows green power estimates for the office towers based on current design. The estimated premium for the Office Towers is $2,000. The estimated premium for the Event Center is $7,000.

| 10 S e c t i o n
2995 Sidco Drive Nashville, Tennessee 37204 T: (615)383-1113 www.ssr-inc.com
P a g e | 55
100% RECONCILED SDSUSTAINABILITY NARRATIVE
APPENDIX A
S e c t i o n | 10
2995 Sidco Drive Nashville, Tennessee 37204 T: (615)383-1113 www.ssr-inc.com
P a g e | 56
100% RECONCILED SDSUSTAINABILITY NARRATIVE

| 10 S e c t i o n
2995 Sidco Drive Nashville, Tennessee 37204 T: (615)383-1113 www.ssr-inc.com
P a g e | 57
100% RECONCILED SDSUSTAINABILITY NARRATIVE
APPENDIX B

�
�
1130 W. Monroe St. 3rd Floor | Chicago, Illinois 60607 | P 312-638-9077 | F 312-803-1833 �
���
�
�
�
�
�
�
�
1130 W. Monroe St. 3rd Floor | Chicago, Illinois 60607 | P 312-638-9077 | F 312-803-1833
�
���
�
�
�
�
�
�
�

�
1130 W. Monroe St. 3rd Floor | Chicago, Illinois 60607 | P 312-638-9077 | F 312-803-1833
�
���
�
�
�
�
�
�
�


![Nov 16 2016 nps presentation west pond[2995]](https://img.pdfslide.us/doc/110x75/58a592fc1a28abaf3e8b4881/nov-16-2016-nps-presentation-west-pond2995.jpg)