Embed Size (px)
Citation preview

1. WHAT ARE THE TYPES OF UNION IN THE PHILIPPINES?
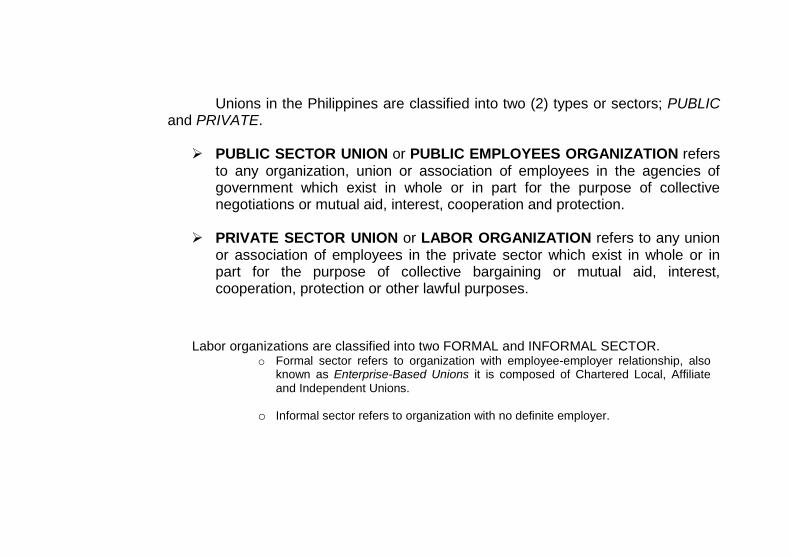
Unions in the Philippines are classified into two (2) types or sectors; PUBLIC and PRIVATE. PUBLIC SECTOR UNION or PUBLIC EMPLOYEES ORGANIZATION refers
to any organization, union or association of employees in the agencies of government which exist in whole or in part for the purpose of collective negotiations or mutual aid, interest, cooperation and protection.
PRIVATE SECTOR UNION or LABOR ORGANIZATION refers to any union
or association of employees in the private sector which exist in whole or in part for the purpose of collective bargaining or mutual aid, interest, cooperation, protection or other lawful purposes.
Labor organizations are classified into two FORMAL and INFORMAL SECTOR. o Formal sector refers to organization with employee-employer relationship, also
known as Enterprise-Based Unions it is composed of Chartered Local, Affiliate and Independent Unions.
o Informal sector refers to organization with no definite employer.

2. HOW MANY REGISTERED LABOR ORGANIZATIONS ARE EXISTING IN THE COUNTRY?
As of September 2013, there are a total of 52,126 existing registered Labor Organizations with more than 3.2 million memberships across the country with the following disaggregation:
• Private Sector Unions: 32.3% of the
total organizations with 16,828 unions and 1,391,621 members;
• Public Sector Unions: 3.4%with 1,776 unions and 462,835 members, and
• Workers Associations: remaining 64.3% with 33,522 total associations with 1,429,966 members.
Public3.4%
Private32.3%
WAS64.3%
Fig. 1 Distribution of Labor Organizations

3. HOW MANY REGISTERED LABOR ORGANIZATIONS ARE THERE IN THE PRIVATE SECTOR?
PRIVATE SECTOR UNIONS
• A total of 16,828 Private Sector Unions composed of 10 Labor Centers, 3 Industry Unions, 135 Federations and 16,680 Enterprise Based Unions.
• Enterprise Based Unions are broken down as follows: o 8,713 Chartered Local Unions with 485,165 reported members; these are
unions that acquired legal personality though the issuance of a chartered certificate by a duly registered federation or national union; and
o 604 Affiliates with 156,562 reported members; these are independent unions
affiliated with federation, national union or chartered local which was subsequently granted independent registration but did not disaffiliate from its federation.
o 7,363 Independent Unions are also recorded with 752,209 reported members;
these are unions that acquired legal personality through independent registration.
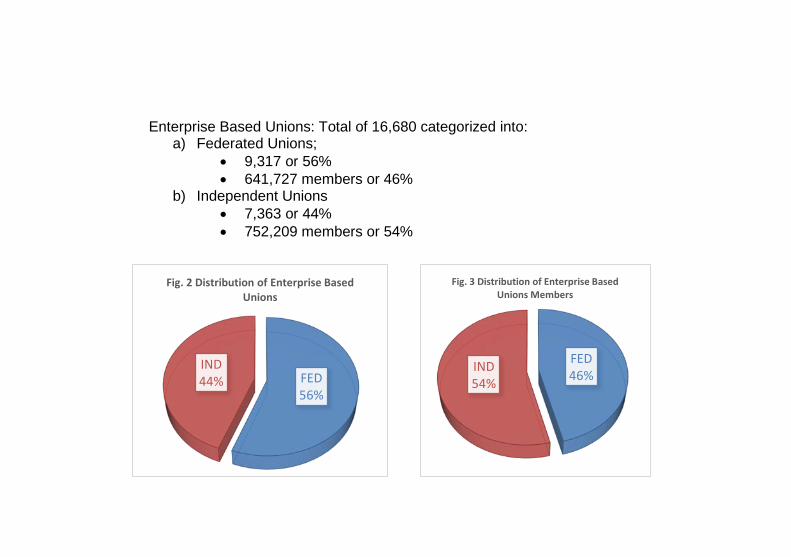
Enterprise Based Unions: Total of 16,680 categorized into:
a) Federated Unions; • 9,317 or 56% • 641,727 members or 46%
b) Independent Unions • 7,363 or 44% • 752,209 members or 54%
FED56%
IND44%
Fig. 2 Distribution of Enterprise Based Unions
FED46%
IND54%
Fig. 3 Distribution of Enterprise Based Unions Members
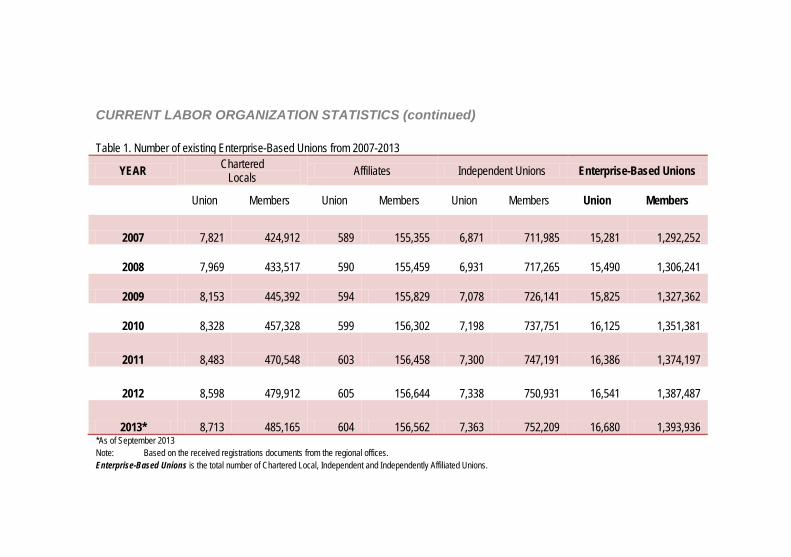
CURRENT LABOR ORGANIZATION STATISTICS (continued)
*As of September 2013 Note: Based on the received registrations documents from the regional offices. Enterprise-Based Unions is the total number of Chartered Local, Independent and Independently Affiliated Unions.
Table 1. Number of existing Enterprise-Based Unions from 2007-2013
YEAR Chartered Locals Affiliates Independent Unions Enterprise-Based Unions
Union Members Union Members Union Members Union Members
2007 7,821 424,912 589 155,355 6,871 711,985 15,281 1,292,252
2008 7,969 433,517 590 155,459 6,931 717,265 15,490 1,306,241
2009 8,153 445,392 594 155,829 7,078 726,141 15,825 1,327,362
2010 8,328 457,328 599 156,302 7,198 737,751 16,125 1,351,381
2011 8,483 470,548 603 156,458 7,300 747,191 16,386 1,374,197
2012 8,598 479,912 605 156,644 7,338 750,931 16,541 1,387,487
2013* 8,713 485,165 604 156,562 7,363 752,209 16,680 1,393,936

4. HOW MANY EMPLOYEES’ ORGANIZATIONS IN THE PUBLIC SECTOR ARE REGISTERED?
EMPLOYERS’ ORGANIZATIONS IN THE PUBLIC SECTOR 1,765 registered Public Sector Unions
with 462,835 members
• 43.2% or 767 unions are in the Local Government Unit with 98,746 members; these include Local Universities/Colleges
• 37.7% or 669 unions belong to the National Government with 262,261 members
• 13.9% or 246 unions in various
State Universities and Colleges with 39,877 members and
• 5.3 % or 94 unions in Government
Owned and Controlled Corporations with 61,951 members.
0 200 400 600 800 1000
NGA
LGU
SUC
GOCC
NGA LGU SUC GOCCUnions 669 767 246 94Members ('000) 268 102 42 57
Fig. 4 Distribution of Public Sector Unions and Members
WORKERS ASSOCIATIONS
There are 32,522 Workers Associations with 1,429,966 members recorded as of September 2013. Workers Associations refers to an association of workers organized for mutual aid and protection of its members or for any legitimate purpose other than collective bargaining.
5. HOW MANY WORKERS’ ORGANIZATIONS ARE REGISTERED?

YES. Data from 2007-2013 shows that there is an average increase of 1.55% of unionized workers in private sector unions and an average increase of 4.9%of unionized worker in public sector unions.
6. IS THE NUMBER OF UNION MEMBERS INCREASING?

8.6%9.0% 9.0%
10.0% 9.9%9.7%
9.3%8
1,212 1,246
1,277 1,297
1,317 1,336
1,357 1
8.0%
8.5%
9.0%
9.5%
10.0%
10.5%
Uni
oniz
atio
n Ra
te
Figure 1. Trends in the Unionization Rate and Number of Union Members (Private Secto
7. WHAT IS THE UNIONIZATION RATE IN THE PHILIPPINES?
Source of Data: Bureau of Labor Relations (BLR); Union Registration data as of June 2013 Bureau of Labor & Employment Statistics (BLES); Employment Data 2004-2011 and 2012 (Preliminary)
From 2004-2012, unionization rate peaked in 2007 for the private sector with 10% total salaried workers, while the lowest was recorded in 2004 with 8.6%. Over the time period it gradually decreased from 9.9% in 2008; 9.7% in 2009; 9.3% in 2010; 8.9% in 2011 and 8.5% in 2012. (See Figure 1)

Over the same period, public sector unionization rate recorded its highest in 2012 with 14.9% of total number of public servants, while the lowest was in 2010 with 12.8%. A growth in union membership is seen over the past years due to the registrations of unions under the national government agencies. (See Figure 2)
13.7% 14.0% 14.1%13.5% 13.5% 13.4%
12.8%
13.6%
14.9%
331 343 352 354 364 384 388 415
448
12.0%
12.5%
13.0%
13.5%
14.0%
14.5%
15.0%
15.5%
04 05 06 07 08 09 10 11 12 -
50
100
150
200
250
300
350
400
450
500
Uni
oniz
atio
n Ra
te
Year
Uni
on M
embe
rs (
'000
)
Figure 2. Trends in the Unionization Rate and Total Number of Union Members (Public Sector)
Unionization Rate Union Members
Source of Data: Bureau of Labor Relations (BLR); Union Registration data as of June 2013 Bureau of Labor & Employment Statistics (BLES); Employment Data 2004-2011 and 2012 (Preliminary)
0
200
Union Members
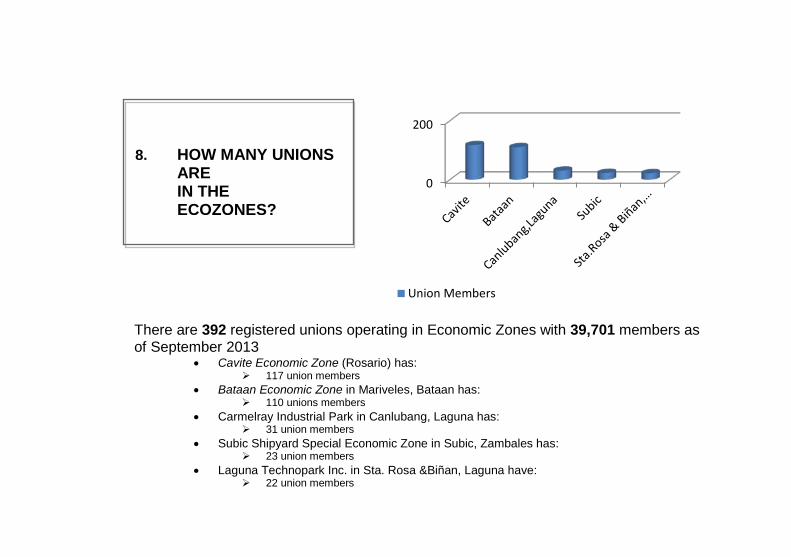
8. HOW MANY UNIONS ARE IN THE ECOZONES?
There are 392 registered unions operating in Economic Zones with 39,701 members as of September 2013
• Cavite Economic Zone (Rosario) has: 117 union members
• Bataan Economic Zone in Mariveles, Bataan has: 110 unions members
• Carmelray Industrial Park in Canlubang, Laguna has: 31 union members
• Subic Shipyard Special Economic Zone in Subic, Zambales has: 23 union members
• Laguna Technopark Inc. in Sta. Rosa &Biñan, Laguna have: 22 union members

CBAs and CBA coverage and Sectoral Distribution
• 1,375 existing registered nationwide or 8.2% of 16,680 Enterprise-Based Unions 803 or 58% negotiated by Affiliated Unions 572 or 42 % negotiated by Independent Unions
• 227,049 members covered or 16.4% of 1,393,936 of total union membership, or
for every 100 union members 16 are covered by the CBA.
123,592 members or 54% are from affiliated unions 103,457 or 46% are from independent unions

9. HOW MANY OF THESE UNIONS HAVE CBAs / CNAs?
• Of the 16,680 registered Enterprise-Based Unions or unions operating in private establishments there are 1,375 registered CBAs covering 227,049 members.
• Majority of the CBAs were negotiated by Affiliated Unions (803 or 58%) while the remaining 42% or 572 CBAs belong to Independent Unions. • Agriculture, Hunting & Forestry which
have the most number of CBAs (101) in the Agriculture sector;
• Manufacturing in Industry sector have 657 CBAs;
• Transport, Storage and Communications (148) in Services sector
AGRICULTURE, 108 ,
8%
INDUSTRY, 737 ,
54%
SERVICES,
513 ,
38%
Fig. 5.1 Distribution of Existing CBAs by Sector

• In terms of CBA workers coverage, Agriculture, Hunting & Forestry
have the most members (27,462) in the Agriculture sector;
Manufacturing in Industry sector
have 72,649 members; Transport, Storage and
Communications with 37,471 in the Services sector.
29,167, 13%
108,444, 47%
90,520, 40%
Fig. 5.2 Distribution of Workers Coverage of the Existing CBAs by Sector
Agriculture
Services
Industry
• In addition to, a total of 118 Collective Negotiation Agreements (CNAs) were recorded with 28,092 workers covered.

10. HOW MANY CBAs WILL SOON EXPIRE?
* Based on the registration documents received by BLR as of September 2013
Table 3. Number of Expiring CBAs by Year (2011-2016)*
YEAR No. of CBA Workers Covered
2013 90 16,155
2014 419 72,154
2015 366 61,665
2016 238 35,965
2017 215 36,348

LIST OF COLLECTIVE BARGAINING AGREEMENTS WITH ANTI-SEXUAL HARRASSMENT PROVISION