Embed Size (px)
Citation preview
8/14/2019 Private household income in the Europian Union regions, 2003
http://slidepdf.com/reader/full/private-household-income-in-the-europian-union-regions-2003 1/12
Statistics
in focus
ECONOMY AND FINANCEGENERAL ANDREGIONAL STATISTICS
25/2007
AuthorAndreas KRÜGER
Contents1. Introduction........................... 2
2. UK regions top the table ......2
3. State intervention narrowsthe range.................................... 3
4. Not all the new MemberStates are catching up.............. 6
5. Dependence on socialtransfers on the increase ......... 7
Pr iva te househo ld incom e int he European Union reg ions ,
2003
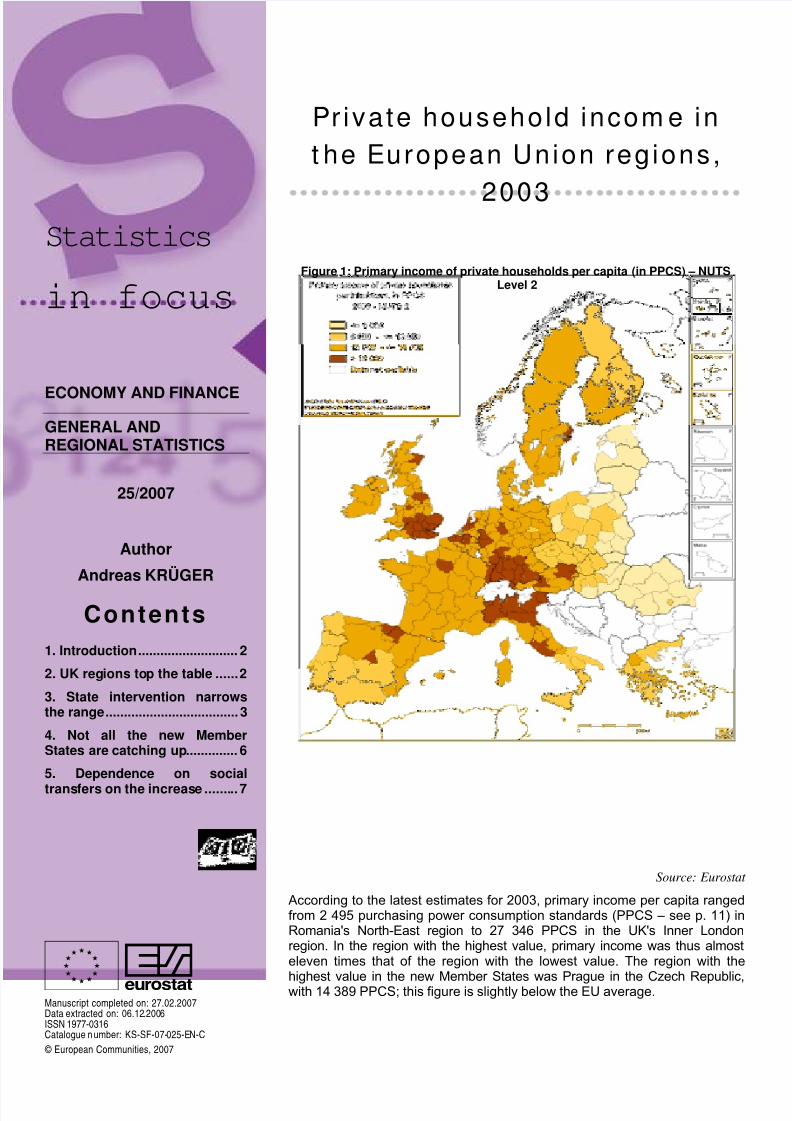
Figure 1: Primary income of private households per capita (in PPCS) – NUTSLevel 2
Source: Eurostat
According to the latest estimates for 2003, primary income per capita rangedfrom 2 495 purchasing power consumption standards (PPCS – see p. 11) inRomania's North-East region to 27 346 PPCS in the UK's Inner Londonregion. In the region with the highest value, primary income was thus almosteleven times that of the region with the lowest value. The region with the
highest value in the new Member States was Prague in the Czech Republic,with 14 389 PPCS; this figure is slightly below the EU average.(
#
Manuscript completed on: 27.02.2007Data extracted on: 06.12.2006ISSN 1977-0316Catalogue number: KS-SF-07-025-EN-C © European Communities, 2007
8/14/2019 Private household income in the Europian Union regions, 2003
http://slidepdf.com/reader/full/private-household-income-in-the-europian-union-regions-2003 2/12
2 Sta t i s t i c s in focus — Economy and finance – General and regional statistics — 25/2007 _______________________ #
1. IntroductionThe indicator most frequently used to measure thewealth of a region is regional gross domestic product(GDP). GDP is usually expressed in purchasing power standards (PPS) and per capita, to make the datacomparable between regions of different size andpurchasing power.
GDP is the total value of goods and services producedin a region by the persons employed in that region,minus the intermediate consumption. However, owing toa wealth of inter-regional flows and State interventions,the GDP generated in a given region does not tally withthe income actually available to the inhabitants of theregion. A more accurate picture of a region’s economicsituation can be obtained only by adding the balance of income accruing to private households.
In market economies with State redistributionmechanisms, a distinction is made between two stagesof private-household income distribution.
The primary distribution of income shows the income of private households generated directly from markettransactions, i.e. the purchase and sale of factors of production and goods. First and foremost here is
compensation of employees, i.e. income from the saleof labour as a factor of production. Private householdsmay also have property income, particularly frominterest, dividends and rents. Then there is also incomefrom operating surplus and self-employment. Interestand rents payable are recorded as negative items for households at the stage of primary distribution. Thebalance of all these transactions is known as theprimary income of private households.
Primary income is used as a basis for calculating thesecondary distribution of income, which shows the Stateredistribution mechanism. All social benefits andtransfers other than in kind are now added to primaryincome, and it is from this total that households mustpay income and wealth taxes, pay social contributionsand make transfers. The balance remaining after thesetransactions have been carried out is known as the
disposable income of private households.Eurostat has had regional data on these incomecategories for private households for a number of yearsnow. These are recorded in the regional nationalaccounts at NUTS level 2.
2. UK regions top the tableFigure 1 shows primary income in the NUTS 2 regionsof the 22 countries featured here. There are clear centres of prosperity in the south of England, Paris,Brussels, northern Italy, Vienna, Madrid, the westernNetherlands, Stockholm, as well as in North Rhine-Westphalia, Hessen, Baden-Württemberg and Bavaria.The north/south divide is clearly visible in both Italy andSpain, and the east/west divide in Germany.
In the new Member States, only the capital regionshave above-average levels of prosperity, particularlyPrague, Bratislava, Közép-Magyarország (Budapest)and Mazowieckie (Warsaw). These and four other Czech regions are the only ones where the primaryincome of households is over half the EU average.
Table 1 shows the ten NUTS 2 regions with the highestand lowest primary income per capita. Of the tenleading regions, five are in the United Kingdom, twoeach in Belgium and Germany and one in France.Compared with 2002, there is one more German regionin this leading group and one Italian region has droppedout.
Of the ten regions with the lowest primary income,seven are in Romania (the whole country with theexception of the Bucharest capital region), the other three being made up of two Polish regions and Latvia.The composition of this group has not changed since2002.
As the figures in Table 1 clearly show, there is still awide range in primary income per capita in the regionsof the 22 countries considered here. For 2003, therange between Inner London and North-East Romaniavaries by a factor of just under 11. In 1998, the
corresponding figure was 11.5. In other words, therehas been a slight narrowing of the gap in primaryincome over the 5-year period.
Within the Member States, the range is much narrower,
the values generally varying by a factor of 1.5 to 2.There are strikingly small ranges in Ireland (factor of 1.2%) and Austria, where the region with the highestprimary income per capita (Vienna) is only 26% higher than that with the lowest (Carinthia). By contrast, therange in all the new Member States varies by a factor of more than 2. The highest value is recorded by Romaniawith almost 2.5.
Table 1: EU regions with the highest/lowest primaryincome in 2003
Primary income of private householdsper capita 2003
in PPCS
Inner London (UK) 27346Berkshire, Buckinghamshire and Oxfordshire (UK) 24604
Île de France (FR) 24483Vlaams-Brabant (BE) 23842Bedfordshire and Hertfordshire (UK) 23825Oberbayern (DE) 23146Surrey, East and West Sussex (UK) 23086Outer London (UK) 22555Brabant Wallon (BE) 22326Stuttgart (DE) 21812…Lubelskie (PL) 4828Latvija (LV) 4731Podkarpackie (PL) 4610Vest (RO) 4143Centru (RO) 3588Nord-Vest (RO) 3374Sud-Est (RO) 3124Sud-Vest (RO) 3023Sud (RO) 2868Nord-Est (RO) 2495
Region
Source:Eurostat
8/14/2019 Private household income in the Europian Union regions, 2003
http://slidepdf.com/reader/full/private-household-income-in-the-europian-union-regions-2003 3/12
______________________ 25/2007 — Economy and finance – General and regional statistics — Sta t i s t i c s in focus 3 #"
When the data for 2003 are compared with those from1998 to illustrate the 5-year trend, it can be seen thatthe ranges between regions in the new Member Statesand Romania are widening, albeit to different extents.One of the main reasons for this is the dynamiceconomic development in the capital regions, asituation that is also clearly reflected in GDP.
By contrast, the regional range in most of the EU-15Member States has changed very little, apart fromsome significant narrowing in Greece and Italy, and aclear widening of the gap in the UK and Finland.
3. State intervention narrows the range
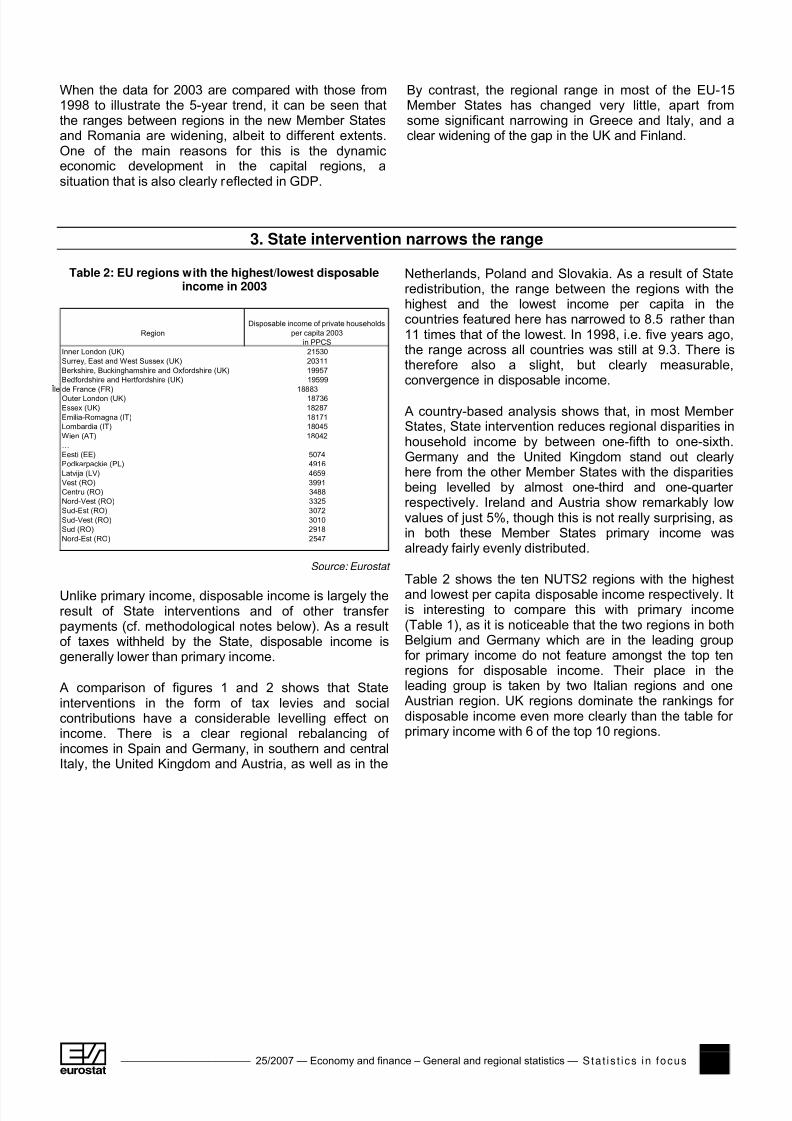
Table 2: EU regions with the highest/lowest disposableincome in 2003
Disposable income of private householdsRegion per capita 2003
in PPCSInner London (UK) 21530Surrey, East and West Sussex (UK) 20311Berkshire, Buckinghamshire and Oxfordshire (UK) 19957Bedfordshire and Hertfordshire (UK) 19599
Île de France (FR) 18883Outer London (UK) 18736Essex (UK) 18287Emilia-Romagna (IT) 18171Lombardia (IT) 18045Wien (AT) 18042…Eesti (EE) 5074Podkarpackie (PL) 4916Latvija (LV) 4659Vest (RO) 3991Centru (RO) 3488Nord-Vest (RO) 3325Sud-Est (RO) 3072Sud-Vest (RO) 3010Sud (RO) 2918Nord-Est (RO) 2547
Source: Eurostat
Unlike primary income, disposable income is largely theresult of State interventions and of other transfer payments (cf. methodological notes below). As a resultof taxes withheld by the State, disposable income isgenerally lower than primary income.
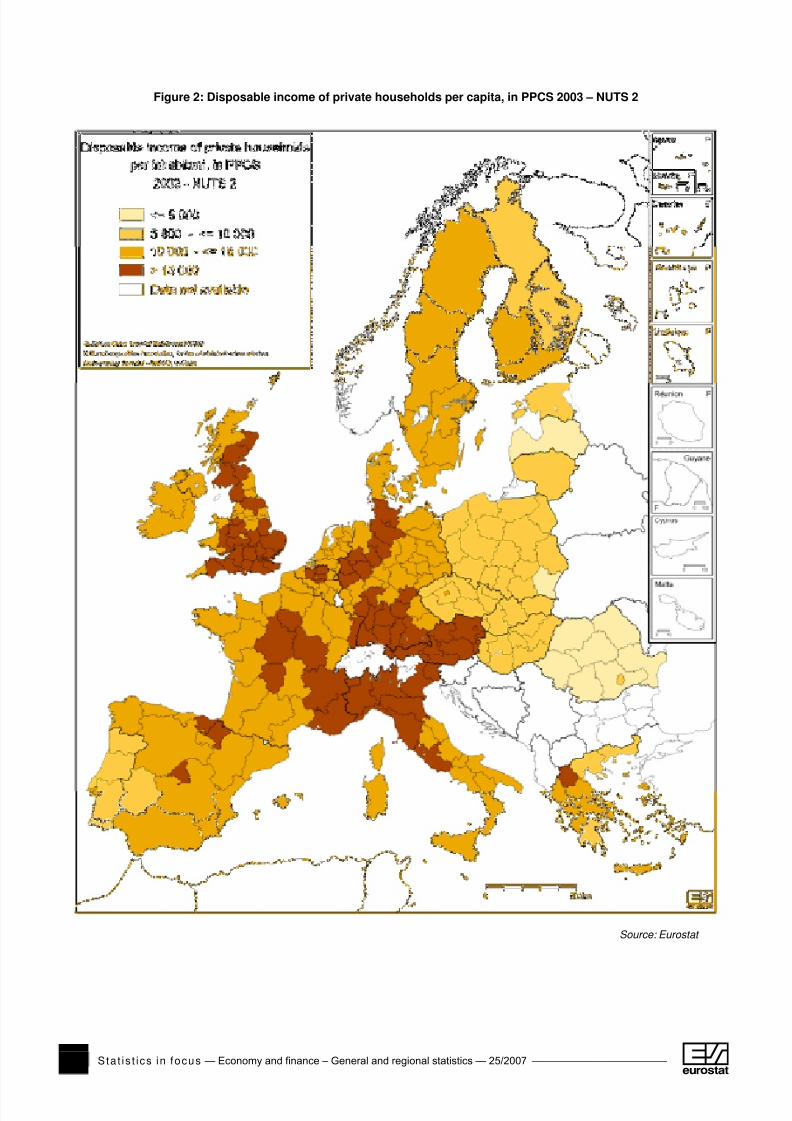
A comparison of figures 1 and 2 shows that Stateinterventions in the form of tax levies and socialcontributions have a considerable levelling effect onincome. There is a clear regional rebalancing of incomes in Spain and Germany, in southern and centralItaly, the United Kingdom and Austria, as well as in the
Netherlands, Poland and Slovakia. As a result of Stateredistribution, the range between the regions with thehighest and the lowest income per capita in thecountries featured here has narrowed to 8.5 rather than11 times that of the lowest. In 1998, i.e. five years ago,the range across all countries was still at 9.3. There istherefore also a slight, but clearly measurable,convergence in disposable income.
A country-based analysis shows that, in most Member States, State intervention reduces regional disparities inhousehold income by between one-fifth to one-sixth.Germany and the United Kingdom stand out clearlyhere from the other Member States with the disparitiesbeing levelled by almost one-third and one-quarter respectively. Ireland and Austria show remarkably lowvalues of just 5%, though this is not really surprising, asin both these Member States primary income wasalready fairly evenly distributed.
Table 2 shows the ten NUTS2 regions with the highestand lowest per capita disposable income respectively. Itis interesting to compare this with primary income(Table 1), as it is noticeable that the two regions in bothBelgium and Germany which are in the leading groupfor primary income do not feature amongst the top tenregions for disposable income. Their place in theleading group is taken by two Italian regions and oneAustrian region. UK regions dominate the rankings for disposable income even more clearly than the table for primary income with 6 of the top 10 regions.
8/14/2019 Private household income in the Europian Union regions, 2003
http://slidepdf.com/reader/full/private-household-income-in-the-europian-union-regions-2003 4/12
4 Sta t i s t i c s in focus — Economy and finance – General and regional statistics — 25/2007 _______________________ #
Figure 2: Disposable income of private households per capita, in PPCS 2003 – NUTS 2
Source: Eurostat
8/14/2019 Private household income in the Europian Union regions, 2003
http://slidepdf.com/reader/full/private-household-income-in-the-europian-union-regions-2003 5/12
______________________ 25/2007 — Economy and finance – General and regional statistics — Sta t i s t i c s in focus 5 #"
Figure 3: Disposable income of private households as % of primary income 2003 – NUTS 2
Source: Eurostat
8/14/2019 Private household income in the Europian Union regions, 2003
http://slidepdf.com/reader/full/private-household-income-in-the-europian-union-regions-2003 6/12
6 Sta t i s t i c s in focus — Economy and finance – General and regional statistics — 25/2007 _______________________ #
At the other end of the scale, the ranking in both tablesis virtually the same. It can be seen, however, that Stateintervention in household incomes in Romania and theBaltic States is on balance comparatively limited.
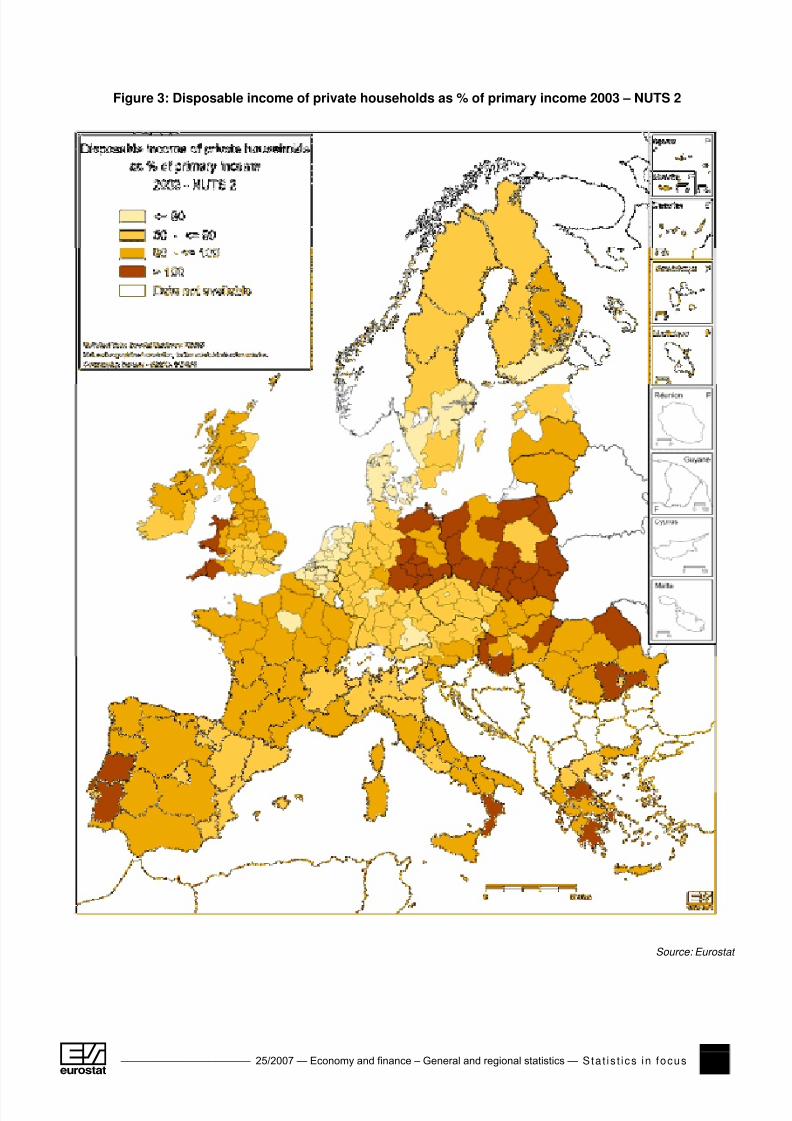
In other countries, the State's intervention in incomedistribution has a varying impact, as can be seen in Map3. The combined effect of State intervention in the formof taxes and social contributions along with other transfers can mean that disposable income may be wellin excess of primary income. In 2003, this was the casein 36 of the 252 regions looked at here. The regionsconcerned are concentrated in Poland (13 of the 16regions), eastern Germany (eight regions) and theUnited Kingdom (four regions). The remainder are anumber of regions in Greece, Hungary, Portugal,Romania and Italy.
As Table 3 shows, disposable income in all but one of these regions exceeds primary income by no more than10%. Most of these regions are comparatively weakeconomically with per capita GDP of less than 75% of the EU-25 average.
A comparison with the situation in 1998 shows thatthere have been substantial changes over this 5-year period. Back then, disposable income was higher thanprimary income in just 26 regions, 7 of these being in
Table 3: EU regions with the highest disposable income inrelation to primary income, 2003
Disposable incomeRegion as % of primary income 2003
Dessau (DE) 110.7Chemnitz (DE) 109.6Halle (DE) 108.5Lubelskie (PL) 108.3Dél-Dunántúl (HU) 107.7VwiCtokrzyskie (PL) 107.6Podkarpackie (PL) 106.6Cornwall and Isles of Scilly (UK) 105.7Észak-Alföld (HU) 105.4Leipzig (DE) 105.1Dresden (DE) 105.0West Wales and The Valleys (UK) 105.0Magdeburg (DE) 104.9Vl> skie (PL) 104.7Ÿódzkie (PL) 104.4
Lubuskie (PL) 104.3Alentejo (PT) 103.9WarmiMsko-Mazurskie (PL) 103.9Centro (PT) 103.7MaŽopolskie (PL) 103.5
Source: Eurostat
Eastern Germany, 6 in Poland and 5 in the UK. The factthat this group has expanded considerably is primarilydue to the increase in the number of Polish regions from6 to 13. In this Member State disposable income islower than primary income only in the economic hubscentred around Warsaw, Gdansk and Poznan.
4. Not all the new Member States are catching upAlongside the regional comparison for a specific year, itis very important to know how incomes in the regionshave developed in comparison with the EU average. Inorder to assess this development, it is necessary touse an EU-21 average, as no data are yet available for Cyprus, Luxembourg, Malta and Slovenia. This EU-21average can, nevertheless, be regarded as a prettygood approximation of the EU-25 average, as the
combined population of the four above-mentionedMember States is less than 1% of the total EU-25population
As Table 4 shows, the development of primary incomeover the 5-year period from 1998-2003 ranges from+18.6 percentage points in Notio Aigaio (Greece) to-19.7 percentage points in Valle d'Aosta (Italy). At thetop and bottom ends of the scale there are significantclusters of regions from just a few countries: for example, of the 20 regions where development hasbeen most dynamic in relative terms, half of these areSpanish and 7 are in the UK, along with one Greek,
one Czech and one Romanian. The opposite end of
the scale is made up of 11 German and 9 Italianregions, providing a clear indication of below-averagemacroeconomic development in these two foundingmembers of the EU.
Another striking feature at the top end of the scale,alongside the concentration in just a few countries, isthat the leading group contains only one region fromthe new Member States (Prague) as well as Bucuresti(Romania). A closer analysis of the data confirms thesuspicion that the catching-up process in most of theregions in the new Member States has not yet been asdynamic as was hoped. This applies in particular toPoland, where only the Swietokrzyskie region has beenable to catch up on the EU-21 average by 0.9percentage points. All the other 15 Polish regionsdropped back in relation to the EU-21 average. In theCzech Republic and Slovakia, a majority of the regionshave lost a little ground compared to the EU average,whereas the capital regions have been able to sustaintheir dynamic development.
8/14/2019 Private household income in the Europian Union regions, 2003
http://slidepdf.com/reader/full/private-household-income-in-the-europian-union-regions-2003 7/12
______________________ 25/2007 — Economy and finance – General and regional statistics — Sta t i s t i c s in focus 7 #"
Table 4: Relative development of primary income as % of the EU-21 average, 2003 compared to 1998
Region Region
Notio Aigaio (EL) 18.6 Köln (DE) -11.8Inner London (UK) 17.9 Schwaben (DE) -11.8Comunidad Foral de Navarra (ES) 16.5 Umbria (IT) -11.9País Vasco (ES) 13.1 Düsseldorf (DE) -12.2Comunidad de Madrid (ES) 12.7 Detmold (DE) -12.2Bedfordshire and Hertfordshire (UK) 12.7 Hannover (DE) -12.4Bucuresti (RO) 12.1 Braunschweig (DE) -12.5Aragón (ES) 12.0 Oberfranken (DE) -12.7Berkshire, Buckinghamshire andOxfordshire (UK) 11.9 Mittelfranken (DE) -13.0Cataluña (ES) 11.8 Lazio (IT) -13.1Praha (CZ) 11.4 Toscana (IT) -13.5Cantabria (ES) 11.1 Liguria (IT) -13.5Surrey, East and West Sussex (UK) 10.0 Oberbayern (DE) -13.7Hampshire and Isle of Wight (UK) 9.5 Veneto (IT) -14.9Kent (UK) 9.4 Piemonte (IT) -15.8East Anglia (UK) 9.2 Lombardia (IT) -15.9Región de Murcia (ES) 9.0 Schleswig-Holstein (DE) -16.6La Rioja (ES) 8.8 Emilia-Romagna (IT) -18.9Andalucía (ES) 8.8 Berlin (DE) -18.9Castilla y León (ES) 8.7 Valle d'Aosta/Vallée d'Aoste (IT) -19.7
Relative development of the primary income of private households per capita (PPCS) as % of the EU-21 average, 2003compared to 1998
Source: Eurostat
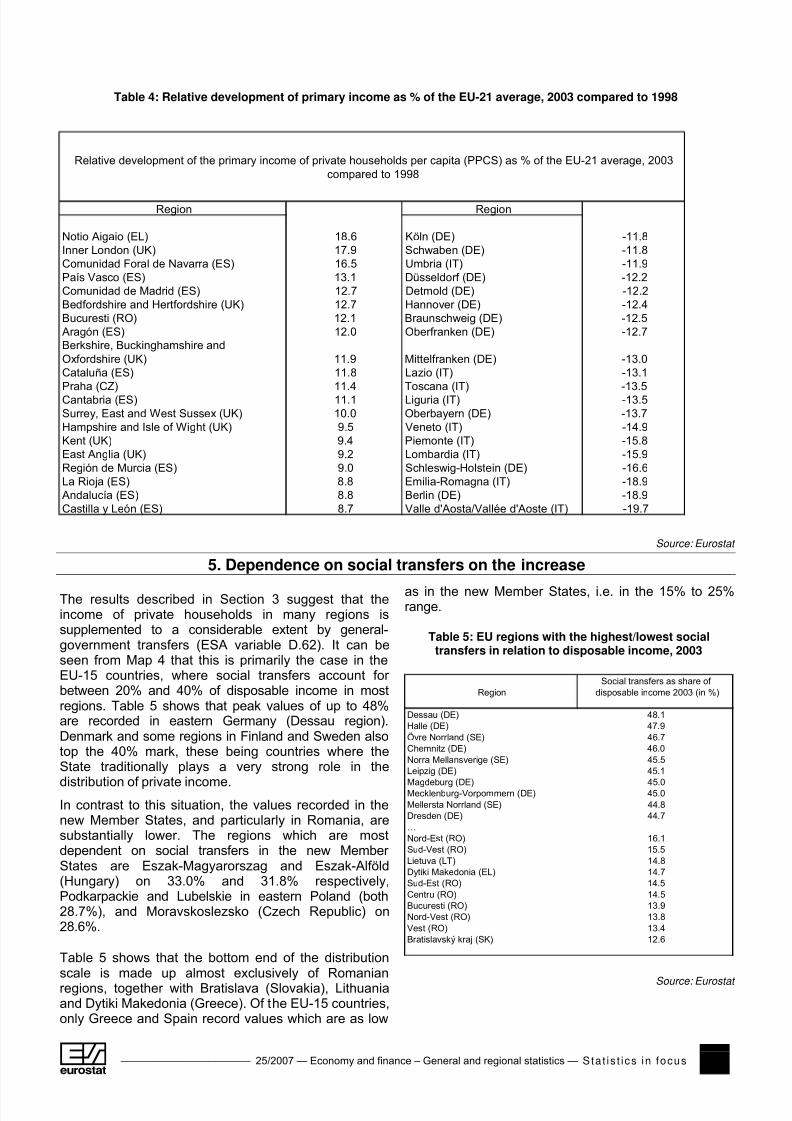
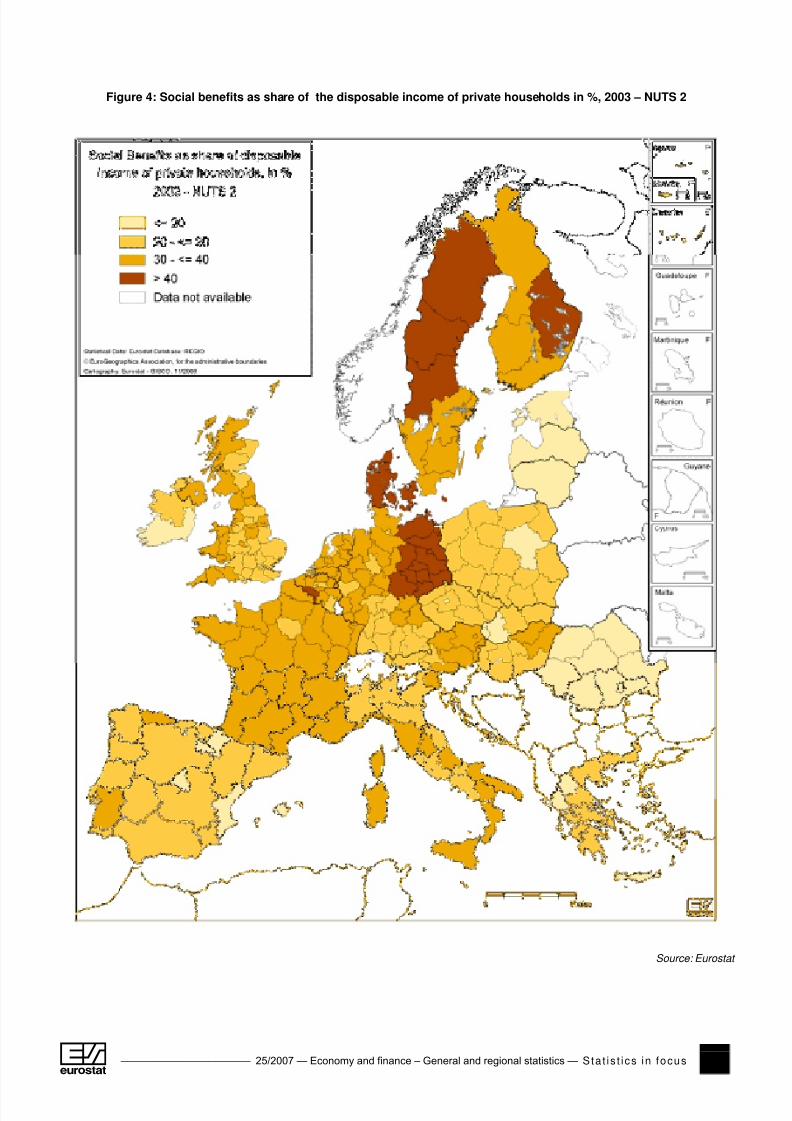
5. Dependence on social transfers on the increase
The results described in Section 3 suggest that theincome of private households in many regions issupplemented to a considerable extent by general-government transfers (ESA variable D.62). It can beseen from Map 4 that this is primarily the case in theEU-15 countries, where social transfers account for between 20% and 40% of disposable income in mostregions. Table 5 shows that peak values of up to 48%are recorded in eastern Germany (Dessau region).Denmark and some regions in Finland and Sweden alsotop the 40% mark, these being countries where theState traditionally plays a very strong role in the
distribution of private income.In contrast to this situation, the values recorded in thenew Member States, and particularly in Romania, aresubstantially lower. The regions which are mostdependent on social transfers in the new Member States are Eszak-Magyarorszag and Eszak-Alföld(Hungary) on 33.0% and 31.8% respectively,Podkarpackie and Lubelskie in eastern Poland (both28.7%), and Moravskoslezsko (Czech Republic) on28.6%.
Table 5 shows that the bottom end of the distributionscale is made up almost exclusively of Romanianregions, together with Bratislava (Slovakia), Lithuaniaand Dytiki Makedonia (Greece). Of the EU-15 countries,only Greece and Spain record values which are as low
as in the new Member States, i.e. in the 15% to 25%range.
Table 5: EU regions with the highest/lowest socialtransfers in relation to disposable income, 2003
Social transfers as share of Region disposable income 2003 (in %)
Dessau (DE) 48.1Halle (DE) 47.9Övre Norrland (SE) 46.7Chemnitz (DE) 46.0Norra Mellansverige (SE) 45.5Leipzig (DE) 45.1
Magdeburg (DE) 45.0Mecklenburg-Vorpommern (DE) 45.0Mellersta Norrland (SE) 44.8Dresden (DE) 44.7…Nord-Est (RO) 16.1Sud-Vest (RO) 15.5Lietuva (LT) 14.8Dytiki Makedonia (EL) 14.7Sud-Est (RO) 14.5Centru (RO) 14.5Bucuresti (RO) 13.9Nord-Vest (RO) 13.8Vest (RO) 13.4Bratislavský kraj (SK) 12.6
Source: Eurostat
8/14/2019 Private household income in the Europian Union regions, 2003
http://slidepdf.com/reader/full/private-household-income-in-the-europian-union-regions-2003 8/12
8 Sta t i s t i c s in focus — Economy and finance – General and regional statistics — 25/2007 _______________________ #
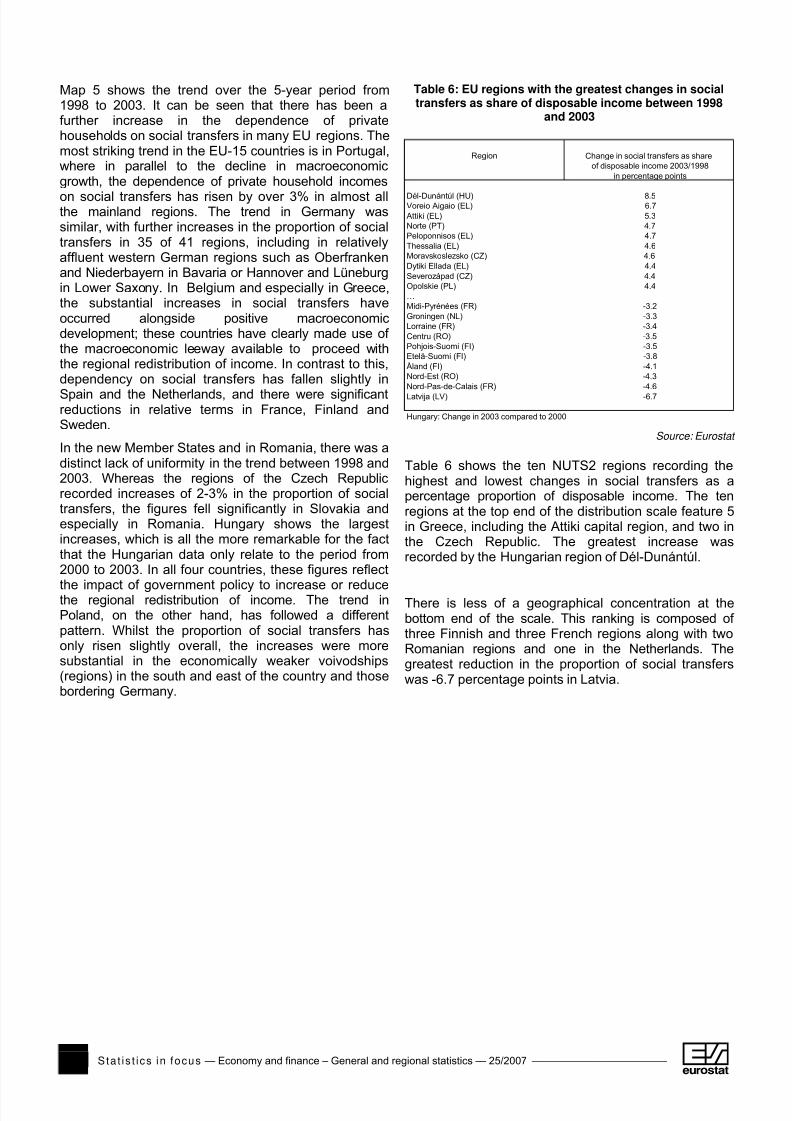
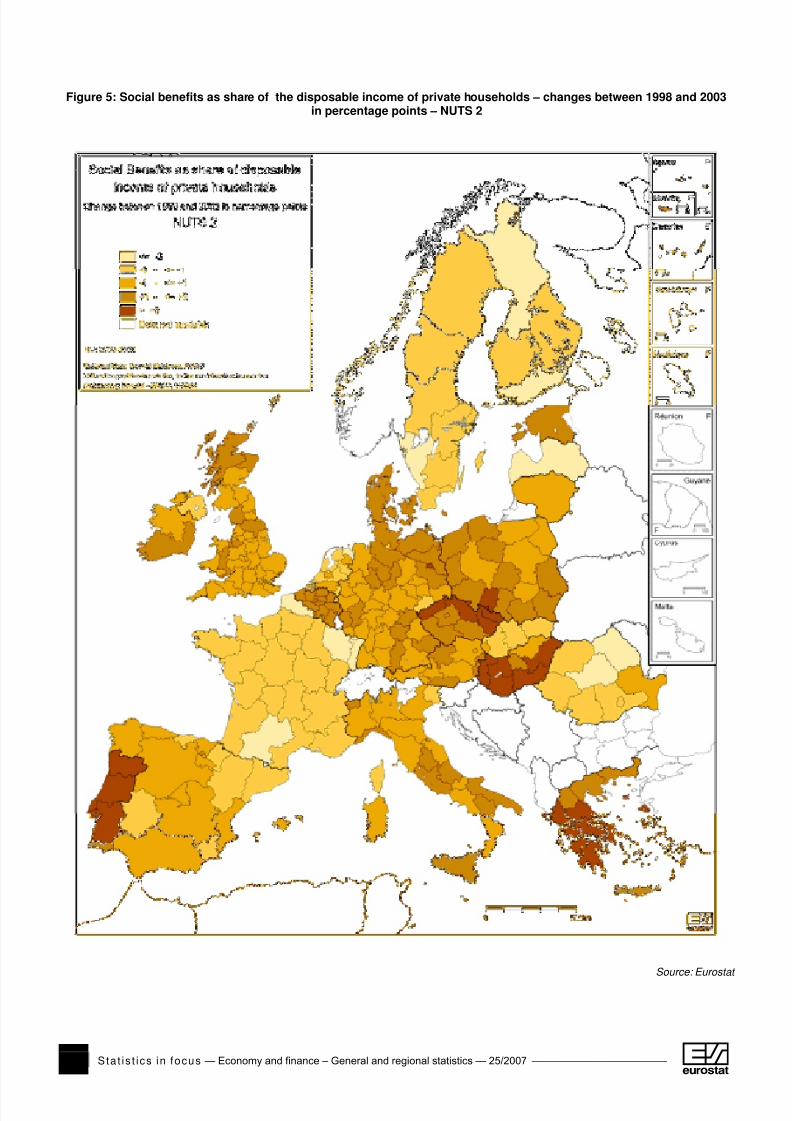
Map 5 shows the trend over the 5-year period from1998 to 2003. It can be seen that there has been afurther increase in the dependence of privatehouseholds on social transfers in many EU regions. Themost striking trend in the EU-15 countries is in Portugal,where in parallel to the decline in macroeconomicgrowth, the dependence of private household incomes
on social transfers has risen by over 3% in almost allthe mainland regions. The trend in Germany wassimilar, with further increases in the proportion of socialtransfers in 35 of 41 regions, including in relativelyaffluent western German regions such as Oberfrankenand Niederbayern in Bavaria or Hannover and Lüneburgin Lower Saxony. In Belgium and especially in Greece,the substantial increases in social transfers haveoccurred alongside positive macroeconomicdevelopment; these countries have clearly made use of the macroeconomic leeway available to proceed withthe regional redistribution of income. In contrast to this,dependency on social transfers has fallen slightly inSpain and the Netherlands, and there were significantreductions in relative terms in France, Finland andSweden.
In the new Member States and in Romania, there was adistinct lack of uniformity in the trend between 1998 and2003. Whereas the regions of the Czech Republicrecorded increases of 2-3% in the proportion of socialtransfers, the figures fell significantly in Slovakia andespecially in Romania. Hungary shows the largestincreases, which is all the more remarkable for the factthat the Hungarian data only relate to the period from2000 to 2003. In all four countries, these figures reflect
the impact of government policy to increase or reducethe regional redistribution of income. The trend inPoland, on the other hand, has followed a differentpattern. Whilst the proportion of social transfers hasonly risen slightly overall, the increases were moresubstantial in the economically weaker voivodships(regions) in the south and east of the country and thosebordering Germany.
Table 6: EU regions with the greatest changes in socialtransfers as share of disposable income between 1998
and 2003
Region Change in social transfers as shareof disposable income 2003/1998
in percentage points
Dél-Dunántúl (HU) 8.5Voreio Aigaio (EL) 6.7Attiki (EL) 5.3Norte (PT) 4.7Peloponnisos (EL) 4.7Thessalia (EL) 4.6Moravskoslezsko (CZ) 4.6Dytiki Ellada (EL) 4.4Severozápad (CZ) 4.4Opolskie (PL) 4.4…Midi-Pyrénées (FR) -3.2Groningen (NL) -3.3Lorraine (FR) -3.4Centru (RO) -3.5Pohjois-Suomi (FI) -3.5Etelä-Suomi (FI) -3.8Åland (FI) -4.1Nord-Est (RO) -4.3Nord-Pas-de-Calais (FR) -4.6Latvija (LV) -6.7
Hungary: Change in 2003 compared to 2000
Source: Eurostat
Table 6 shows the ten NUTS2 regions recording thehighest and lowest changes in social transfers as apercentage proportion of disposable income. The tenregions at the top end of the distribution scale feature 5in Greece, including the Attiki capital region, and two inthe Czech Republic. The greatest increase wasrecorded by the Hungarian region of Dél-Dunántúl.
There is less of a geographical concentration at thebottom end of the scale. This ranking is composed of three Finnish and three French regions along with twoRomanian regions and one in the Netherlands. Thegreatest reduction in the proportion of social transferswas -6.7 percentage points in Latvia.
8/14/2019 Private household income in the Europian Union regions, 2003
http://slidepdf.com/reader/full/private-household-income-in-the-europian-union-regions-2003 9/12
______________________ 25/2007 — Economy and finance – General and regional statistics — Sta t i s t i c s in focus 9 #"
Figure 4: Social benefits as share of the disposable income of private households in %, 2003 – NUTS 2
Source: Eurostat
8/14/2019 Private household income in the Europian Union regions, 2003
http://slidepdf.com/reader/full/private-household-income-in-the-europian-union-regions-2003 10/12
10 Sta t i s t i c s in focus — Economy and finance – General and regional statistics — 25/2007 _______________________ #
Figure 5: Social benefits as share of the disposable income of private households – changes between 1998 and 2003in percentage points – NUTS 2
Source: Eurostat
8/14/2019 Private household income in the Europian Union regions, 2003
http://slidepdf.com/reader/full/private-household-income-in-the-europian-union-regions-2003 11/12
______________________ 25/2007 — Economy and finance – General and regional statistics — Sta t i s t i c s in focus 11 #"
ESSENTIAL INFORMATION – METHODOLOGICAL NOTES
Prior to an analysis of household income, a decisionmust be made about the unit in which data are to beexpressed if comparisons between regions are to bemeaningful. For inter-regional comparisons, regionalGDP is generally expressed in purchasing power standards (PPS), the aim being to allow a volume-based comparison. Data on the income of privatehouseholds should be treated accordingly. Thereforedata on income of private households arerecalculated using PPS consumption components.These are known as PPCS (purchasing power consumption standards).
Eurostat does not yet have a complete set of data atNUTS 2 level. Data are still not available for thefollowing regions: Provincia Autonoma Bolzano and
Provincia Autonoma Trento in Italy, Cyprus,Luxembourg, Malta and Slovenia. Data for Ceuta andMelilla in Spain and the French overseasdepartments are not yet available for all years. Datafor Hungary are available since 2000, and for Romania since 1998. 21 Member States provideddata on a total of 248 regions at NUTS level 2.
Data which reached Eurostat after 16 October 2006are not included in this publication. All the data areavailable online on Eurostat's website (see page 12for the link).
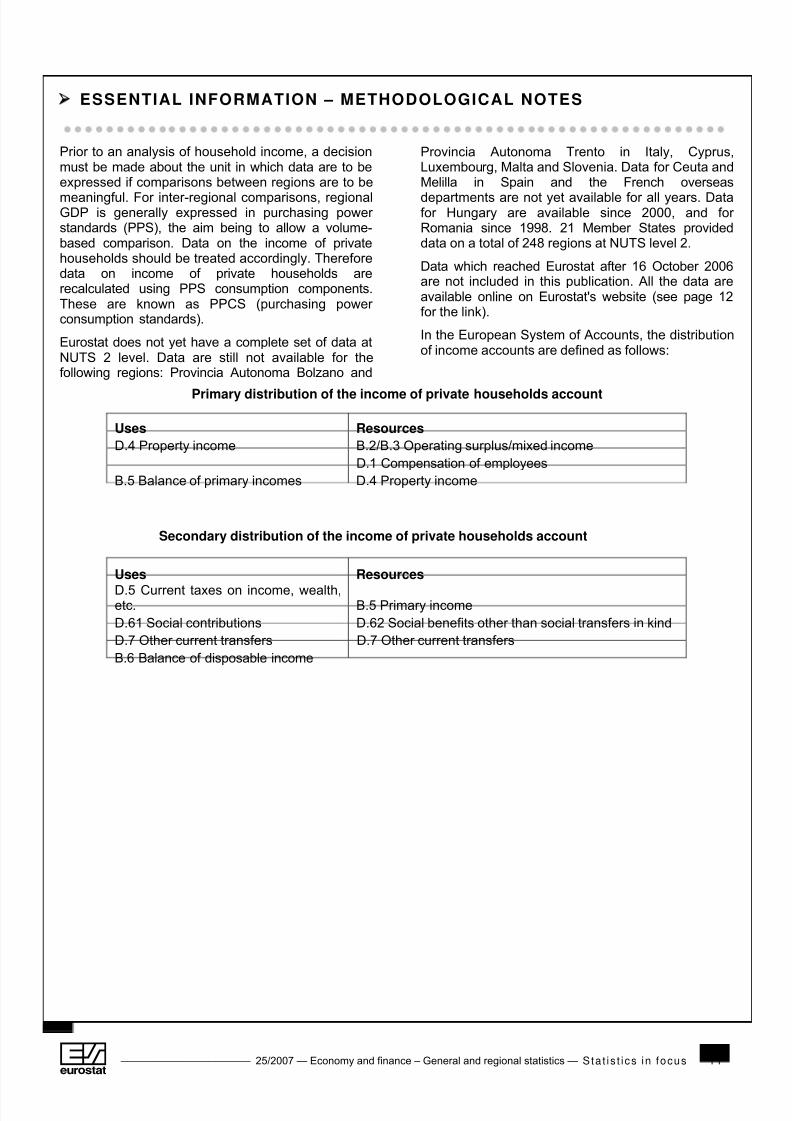
In the European System of Accounts, the distributionof income accounts are defined as follows:
Primary distribution of the income of private households account
Uses ResourcesD.4 Property income B.2/B.3 Operating surplus/mixed income
D.1 Compensation of employeesB.5 Balance of primary incomes D.4 Property income
Secondary distribution of the income of private households account
Uses ResourcesD.5 Current taxes on income, wealth,etc. B.5 Primary incomeD.61 Social contributions D.62 Social benefits other than social transfers in kindD.7 Other current transfers D.7 Other current transfersB.6 Balance of disposable income
8/14/2019 Private household income in the Europian Union regions, 2003
http://slidepdf.com/reader/full/private-household-income-in-the-europian-union-regions-2003 12/12
Further information: Data: EUROSTAT Website/Home page/General and regional statistics/Data
General and regional statistics
European and national short term indicators
Regions
Agriculture
Demographic statistics
Economic accounts - ESA95
Gross domestic product indicators - ESA95
Branch accounts - ESA95
Household accounts - ESA95
Journalists can contact the media supportservice:Bech Building Office A4/125L - 2920 Luxembourg
Tel. (352) 4301 33408
Fax (352) 4301 35349
E-mail: [email protected]
European Statistical Data Support:Eurostat set up with the members of the ‘Europeanstatistical system’ a network of support centres, whichwill exist in nearly all Member States as well as in someEFTA countries.
Their mission is to provide help and guidance to Internetusers of European statistical data.
Contact details for this support network can be found onour Internet site: http://ec.europa.eu/eurostat/
A list of worldwide sales outlets is available at the:
Office for Official Publications of the European Communities.
2, rue Mercier L - 2985 Luxembourg
URL: http://publications.europa.eu E-mail: [email protected]


![Kinship, family and social network · Play 1871], Frederic Le Play started systematically mapping European regions, using a typology of the organisational models of the household](https://img.pdfslide.us/doc/110x75/5e4b467513a20613a5667026/kinship-family-and-social-network-play-1871-frederic-le-play-started-systematically.jpg)