Embed Size (px)
Citation preview

1
Waipaoa River Flood Control Scheme Review

2
Review
• Technical Review Sept 2009
• Steering Committee Oct 2009
• Operations Committee Oct
• Council February 2010
• Preliminary Feedback

3
Review
• Existing Scheme ~ 70 Year• Up to “Bola”• Review includes• Scheme 3A
– Floodways at Lovelock & Ormond loops• Extension to Te Karaka (15 year)• Relocation Mullooly Bend Stopbank

4

5
Options
• 100 Yr – Construct in 6 years• 100 Yr – Construct in 10 years• 150 Yr – Construct in 6 years• 150 Yr – Construct in 10 years• 200 Yr – Construct in 10 years• What Can be done for $1m /yr• What for max $300 / Hectare?

6
Costs of Options
Upgrade Option Cost Total Annual Required(20 Year Loan)
100 Year (3A)(6 years)
$16.9m $1,868,000
100 Year(3A)(10 years)
$16.9m $1,460,000
150 Year (3A)(6 years)
$24.3m $2,655,000
200 Year(3A)(6 years)
$29.2m $3,065,000
<100 Year(3A)Narrower berms
$12.6m $1,000,000

7
Economic Benefit Assessment
• Construction & Maintenance Economic Benefits/Losses Over Lifetime
• Other District Economic Benefits/Losses Over Lifetime
• Benefits/Losses relative to the Economic Risks• Overall Net Economic Benefit to District

8
Economic Benefit AssessmentBenefit / Cost
• 100 Year 5.3
• 150 Year 6.0
• 200 Year 6.9
– Does Not Address Affordability

9
Existing Rating System
• 60 Years Old– Soil Conservation & Rivers Control Act 1941
• Local Govt Rating Act 2002– “Distribution of Benefits”– “Extent contribute to the need”
• Changes in Land Use

10
Proposed Rating System
• Direct Benefit– 6 Categories
• Indirect Benefit– 3 Categories
• Contributors

11
Proposed Rating – Direct Benefit
• Review Existing Class/Land Use
• Depth of Flooding
• Duration of Flooding
• Relative Economic Benefits

12
Proposed Rating – Indirect Benefit
• The large and more diverse economy that is sustained
• Protection to Roads and other Transport Facilities
• Protection of Essential Services• Protection and Enhancement of Services and
Facilities used by the Wider Community.

13
Proposed Rating Review - Contributors
• Land within the Upper Catchment• Sediment and increased water runoff from the
catchment• Natural process• Only where the land use has altered the natural
runoff• MAF Assistance?

14
Proposed Rating Review
• Direct Benefit 65%
• Indirect Benefit 20%
• Contributors 15%

15
Rating Impacts of Options
Upgrade Option
Cost Total Annual
Direct65%
Indirect20%
Contributors15%
100 Year (3A)(6 years)
$16.9m $1,868,000 $1,214,200 $373,600 $280,200
100 Year(3A)(10 years)
$16.9m $1,460,000 $949,000 $292,000 $219,000
150 Year (3A)(6 years)
$24.3m $2,655,000 $1,725,750 $531,000 $398,250
200 Year(3A)(6 years)
$29.2m $3,065,000 $1,992,250 $613,000 $459,750
<100 Year (3A) Narrow Berm
$12.6m $1,000,000 $650,000 $200,000 $150,000

16
Direct BeneficiariesLand Areas for Class (Existing)
• 300 ha A class
• 2500 ha B class
• 500 ha of C class
• 8000 ha of D class

17
ProtectionLevel(Years)
Direct(Class D)
Indirect Contributor
Per $100k (CV) or Per Hectare PerProperty
Per Hectare
<100($1m per yr)
$39 $22 $13.90 $1.07
100 $66 $36.50 $23.50 $1.80
150 $94 $51.50 $33.13 $2.54
200 $120 $66 $42.61 $3.27
Example(Incls Capital & Maintenance)

18
ProtectionLevel(Years)
Direct(Class B)
Indirect Contributor
Per $100k (CV) or Per Hectare PerProperty
Per Hectare
<100($1m per yr)
$134 $73 $13.90 $1.07
100 $225 $124 $23.50 $1.80
150 $318 $175 $33.13 $2.54
200 $409 $225 $42.61 $3.27
Example(Incls Capital & Maintenance)

19
ProtectionLevel(Years)
Direct(Class A)
Indirect Contributor
Per $100k (CV) or Per Hectare PerProperty
Per Hectare
<100($1m per yr)
$204 $112 $13.90 $1.07
100 $345 $190 $23.50 $1.80
150 $486 $268 $33.13 $2.54
200 $626 $344 $42.61 $3.27
Example(Incls Capital & Maintenance)

20
WAIPAOA SCHEME PEAK RATES 10yr works - $12.6 million - less than 100 yr Scheme - $ 1 million Rate requiredCHANGES TO LINTON COST ETC
LESS CONTRIBUTOR
LESS INDIRECT
TOTAL REQUIRED
15% 20% 09/10
Per $100,000
CVPer hectare
Capital ValuePoverty Bay Flats - existing A W1 20,909,847 100.00% 318,231,243 1,000,000 -150,000 -200,000 650,000 204$ 112$ Poverty Bay Flats - existing B W2 152,966,102 65.38% 134$ 73$ Poverty Bay Flats - existing C W3 314,823,105 38.46% 79$ 43$ Poverty Bay Flats - existing D W4 180,805,755 19.23% 39$ 22$ Poverty Bay Flats - existing E W5 536,836,364 7.69% 16$ 9$ Poverty Bay Flats - existing F W6 10,000,000 1.54% 3$ 2$
Area (ha.)Contributor CH 109,000 109,000 100% 140,800 251,400 251,400 2.83$ Per Hectare
CM 70,000 70,000 45% 1.27$ Per HectareCL 1,500 1,500 20% 0.57$ Per Hectare
No. of propertiesIndirect - Gisborne City R & U NG 12,819 12,819 100% 14,387 335,200 335,200 36.91$ Per Property Indirect - inner Zone - PB Flats NI 1,193 1,193 100% 36.91$ Per Property DRA3 - cummuter distance NC 1,500 1,500 25% 9.23$ Per Property
Note the above categories still include elements of
150-yr 3A $24.3TOTAL RATE
RERQUIRED
UAC - Number or properties
RELA
TIVE
PR
OPO
RTIO
NS
EQUIVALENT CV
AREA UAC
RATING CATEGORY NAME
CODE RATING BASIS AREA
21
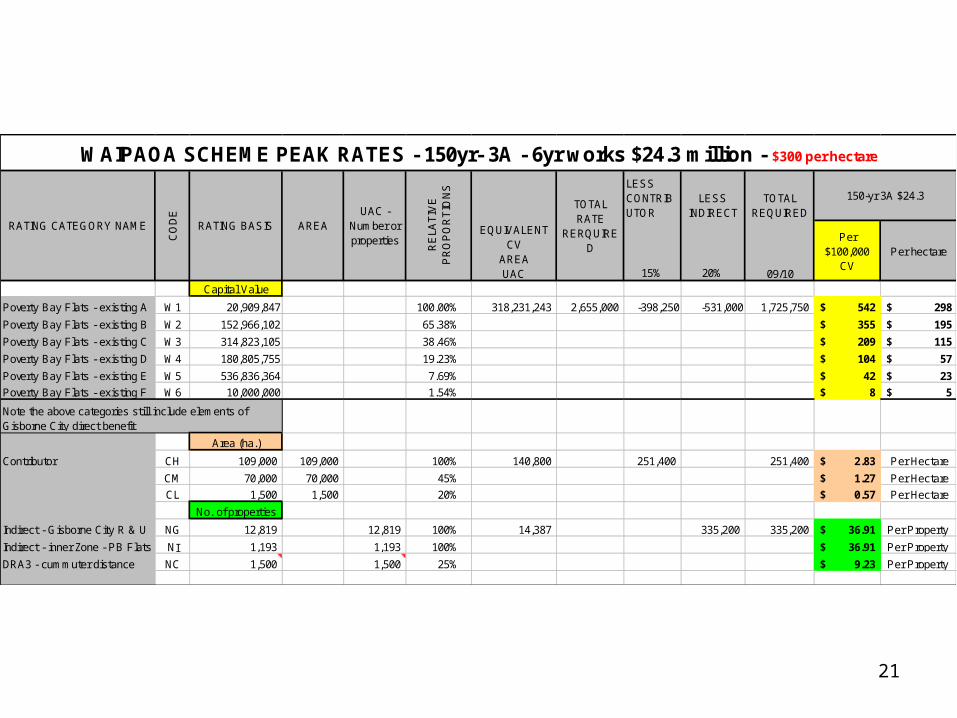
LESS CONTRIBUTOR
LESS INDIRECT
TOTAL REQUIRED
15% 20% 09/10
Per $100,000
CVPer hectare
Capital Value
Poverty Bay Flats - existing A W1 20,909,847 100.00% 318,231,243 2,655,000 -398,250 -531,000 1,725,750 542$ 298$
Poverty Bay Flats - existing B W2 152,966,102 65.38% 355$ 195$
Poverty Bay Flats - existing C W3 314,823,105 38.46% 209$ 115$
Poverty Bay Flats - existing D W4 180,805,755 19.23% 104$ 57$
Poverty Bay Flats - existing E W5 536,836,364 7.69% 42$ 23$
Poverty Bay Flats - existing F W6 10,000,000 1.54% 8$ 5$
Area (ha.)
Contributor CH 109,000 109,000 100% 140,800 251,400 251,400 2.83$ Per Hectare
CM 70,000 70,000 45% 1.27$ Per Hectare
CL 1,500 1,500 20% 0.57$ Per Hectare
No. of properties
Indirect - Gisborne City R & U NG 12,819 12,819 100% 14,387 335,200 335,200 36.91$ Per Property
Indirect - inner Zone - PB Flats NI 1,193 1,193 100% 36.91$ Per Property
DRA3 - cummuter distance NC 1,500 1,500 25% 9.23$ Per Property
RE
LAT
IVE
P
RO
PO
RT
ION
S
TOTAL RATE
RERQUIRED
150-yr 3A $24.3
EQUIVALENT CV
AREA UAC
WAIPAOA SCHEME PEAK RATES - 150yr- 3A - 6yr works $24.3 million - $300 per hectare
Note the above categories still include elements of Gisborne City direct benefit
RATING CATEGORY NAME AREAUAC -
Number or propertiesC
OD
E
RATING BASIS

22
Where to?
• Preliminary Meetings• Feedback• Report to Council• Council Decide on Preferred Option (or Not) for
Consultation• Council Decide on Preferred Rating (or Not) for
Consultation• Ten Year Plan 2012