Embed Size (px)
Citation preview
1
User-friendly presentationof statistics
Creating a dissemination policy and guidelines for developing and transition countries
A cooperation project between PARIS21 and Statistics Norway
Jan Erik KristiansenSenior adviser
Statistics Norway

2
”Publish or perish”!
3
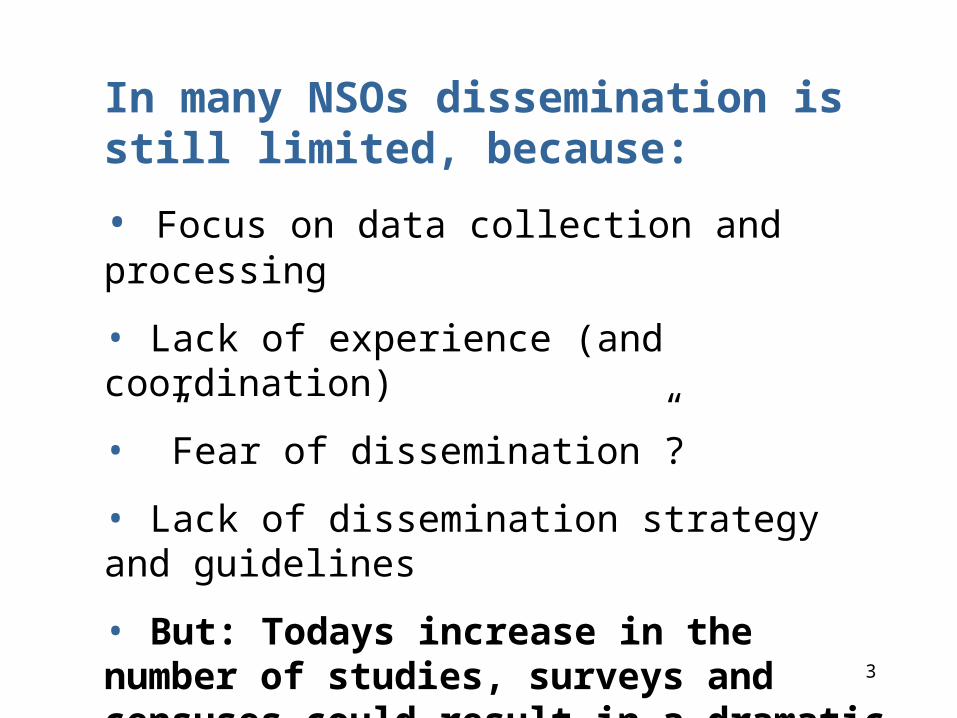
In many NSOs dissemination is still limited, because:
• Focus on data collection and processing
• Lack of experience (and coordination)
• ”Fear of dissemination”?
• Lack of dissemination strategy and guidelines
• But: Todays increase in the number of studies, surveys and censuses could result in a dramatic increase in dissemination:
4
5 7445 7 9 112112 8 347 779 6,3
8 5656 2006=102006=10
135,4 9
45 + 7 12%
5 7445 7 9 112112
7687 8 2 3477
779 6,3
8 5656 2006=102006=10
135,4 9
45 + 7 12%
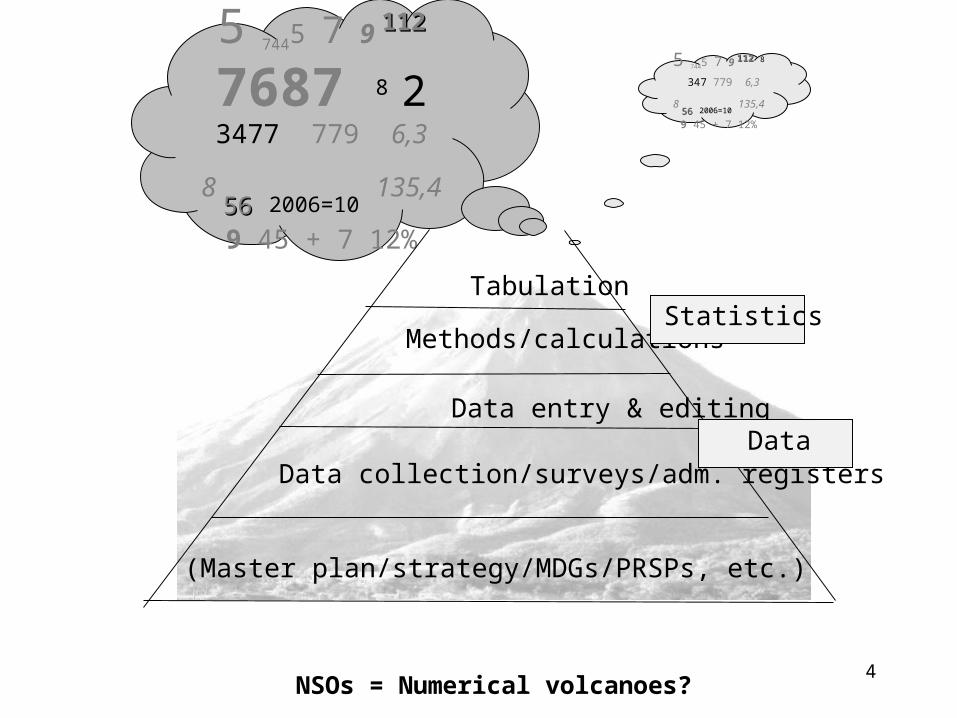
Methods/calculations
Data entry & editing
Data collection/surveys/adm. registers
(Master plan/strategy/MDGs/PRSPs, etc.)
Statistics
Data
Tabulation
NSOs = Numerical volcanoes?

5
Methods/calculations
Data entry & editing
Data collection/surveys/adm. registers
(Master plan/strategy/MDGs/PRSPs/etc.)
User-friendly presentation
Tabulation
6
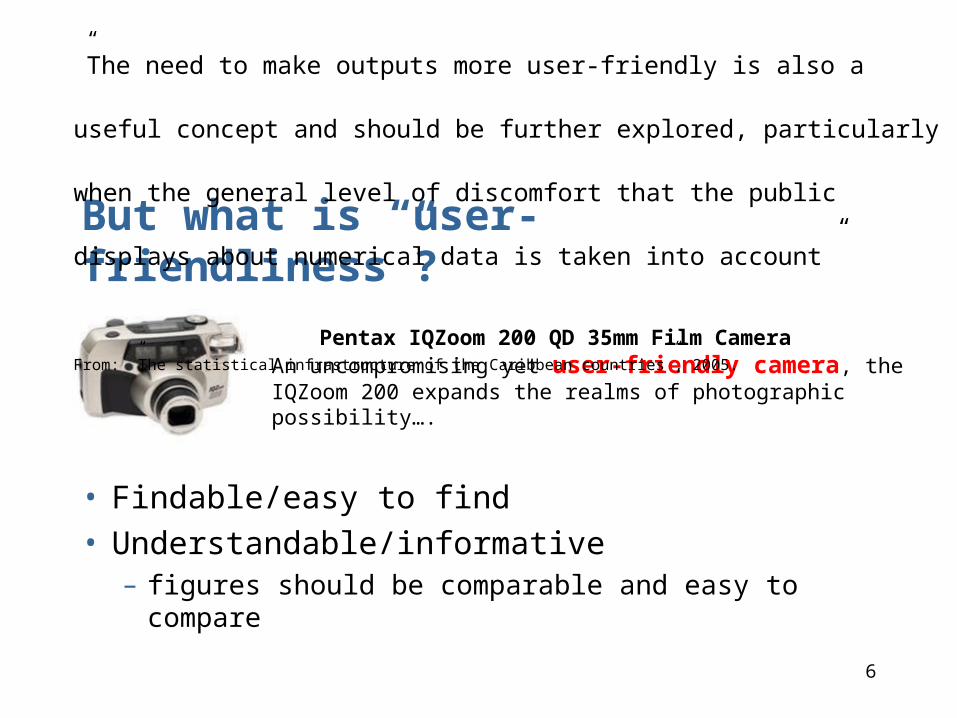
But what is “user-friendliness”?
Pentax IQZoom 200 QD 35mm Film CameraAn uncompromising yet user-friendly camera, the IQZoom 200 expands the realms of photographic possibility….
• Findable/easy to find• Understandable/informative
– figures should be comparable and easy to compare
”The need to make outputs more user-friendly is also a useful concept and should be
further explored, particularly when the general level of discomfort that the public
displays about numerical data is taken into account”
From: ”The statistical infrastructure of the Caribbean countries”, 2005.

7
Examples of not so user-friendly dissemination
Not primarily included to criticize, but to show that improvement of dissemination is often a question of minor changes
Our websites and publications are full of tables and graphs that are ambiguous, meaningless or even misleading.
Also: Examples are easier to understand and remember than general rules and principles

8
“User-friendly”?
From: 2004 Census, Qatar
9
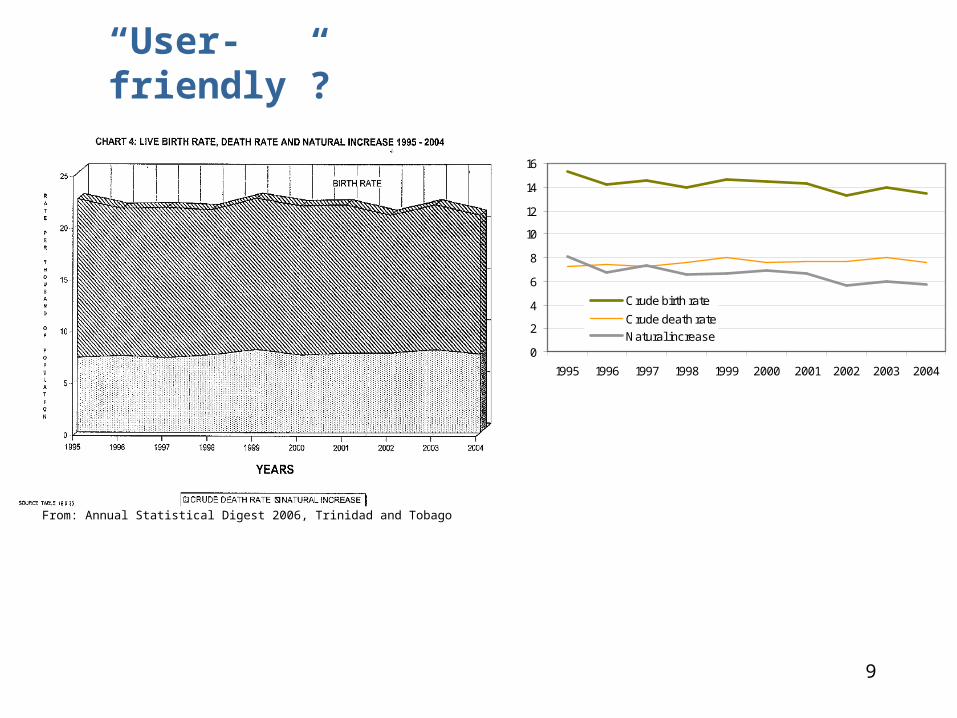
“User-friendly”?
From: Annual Statistical Digest 2006, Trinidad and Tobago
0
2
4
6
8
10
12
14
16
1995 1996 1997 1998 1999 2000 2001 2002 2003 2004
Crude birth rate
Crude death rateNatural increase
10
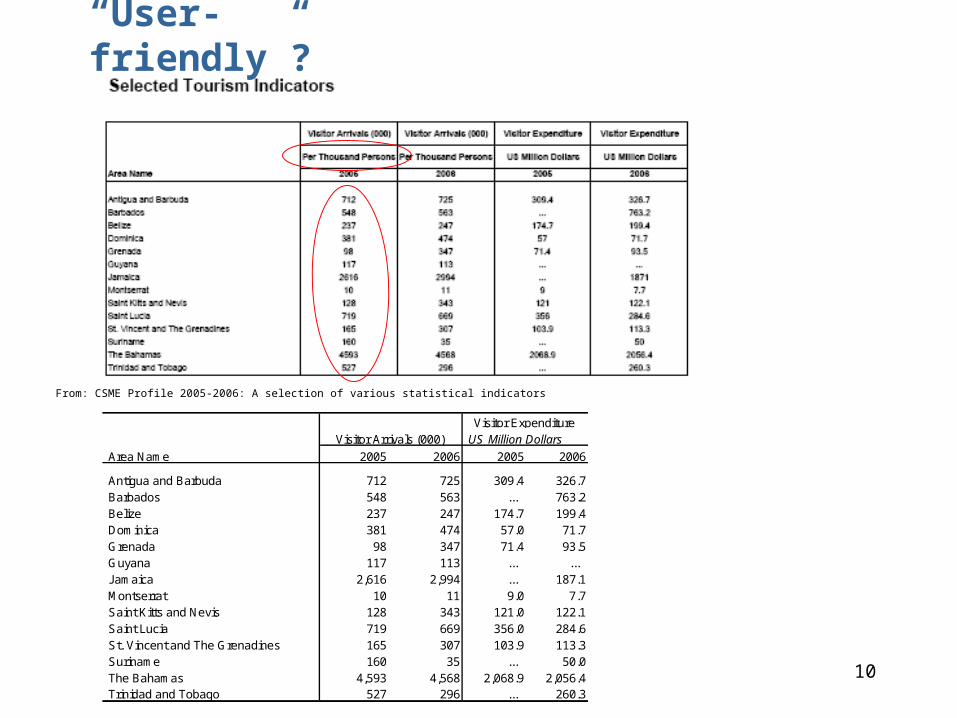
From: CSME Profile 2005-2006: A selection of various statistical indicators
Area Name 2005 2006 2005 2006
Antigua and Barbuda 712 725 309.4 326.7 Barbados 548 563 ... 763.2 Belize 237 247 174.7 199.4 Dominica 381 474 57.0 71.7 Grenada 98 347 71.4 93.5 Guyana 117 113 ... ... Jamaica 2,616 2,994 ... 187.1 Montserrat 10 11 9.0 7.7 Saint Kitts and Nevis 128 343 121.0 122.1 Saint Lucia 719 669 356.0 284.6 St. Vincent and The Grenadines 165 307 103.9 113.3 Suriname 160 35 ... 50.0 The Bahamas 4,593 4,568 2,068.9 2,056.4 Trinidad and Tobago 527 296 ... 260.3
Visitor Expenditure US Million Dollars Visitor Arrivals (000)
“User-friendly”?

11
Literacy rate. Adult men and women
Men Women
1935 30.8 8.0
1945 44.3 13.5
1950 47.7 16.7
1955 56.3 21.3
1960 54.8 21.1
1965 64.7 27.6
etc. : :
From: Statistical Indicators 1923-2004, Turkstat
“User-friendly”?
12
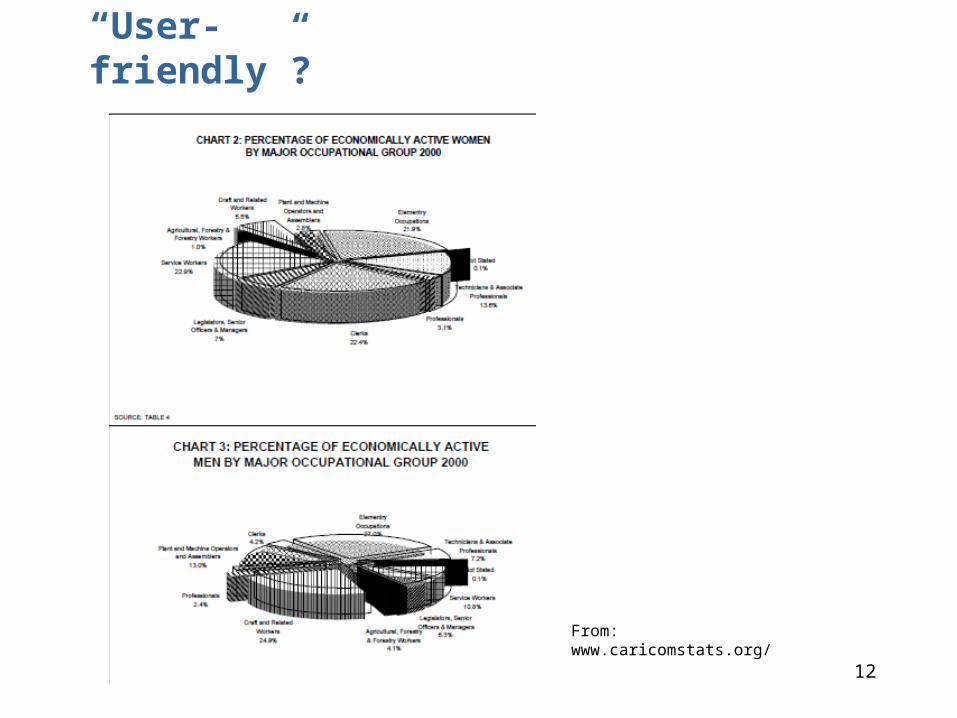
“User-friendly”?
From: www.caricomstats.org/
13
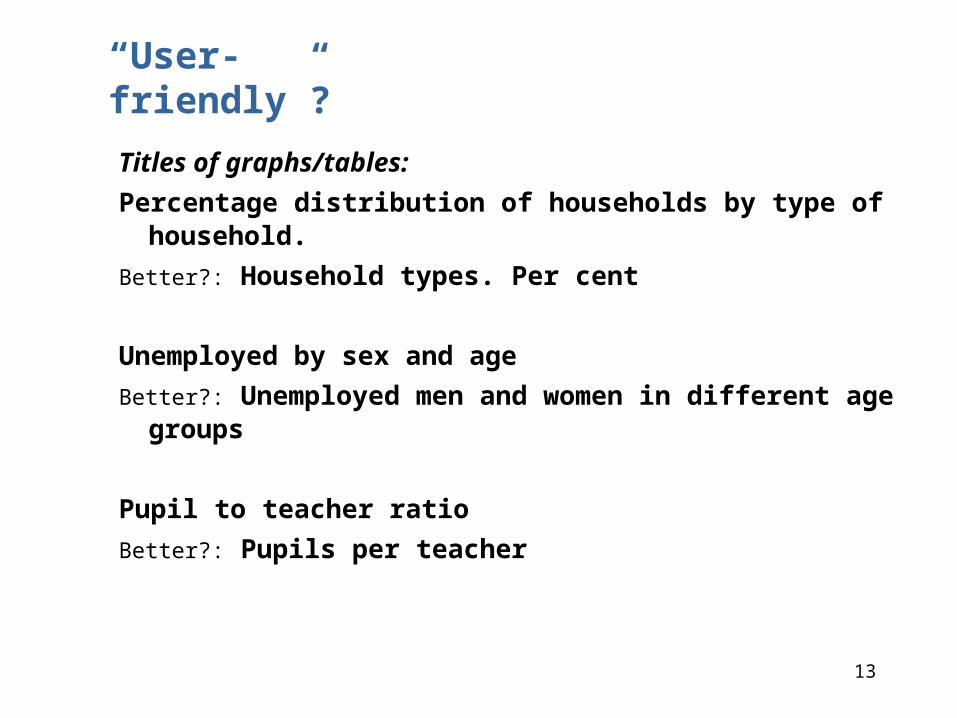
Titles of graphs/tables:
Percentage distribution of households by type of household.
Better?: Household types. Per cent
Unemployed by sex and age
Better?: Unemployed men and women in different age groups
Pupil to teacher ratio
Better?: Pupils per teacher
“User-friendly”?

14
“User-friendly”?
COPYRIGHT 2006-Ministry of Finance, International Financial Services and Economic
Affairs
All rights reserved. No part of this publication may be reproduced or transmitted in any
form or by anymeans, electronic or mechanical, including photocopy, recording, or any
information storage and retrieval system, without permission in writing from the producer.
www.stlucia.gov.lc
Better:
”When using our statistics, please refer to Statistics Xxxxxx (name of NSO) as the
source”
15
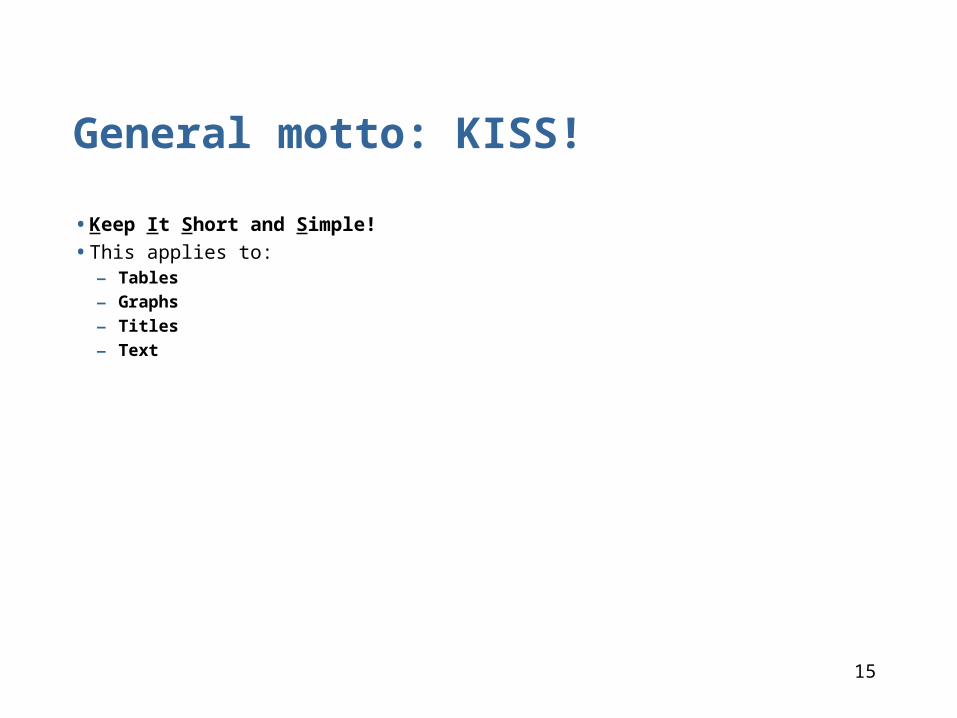
General motto: KISS!
• Keep It Short and Simple!
• This applies to:– Tables
– Graphs
– Titles
– Text
16
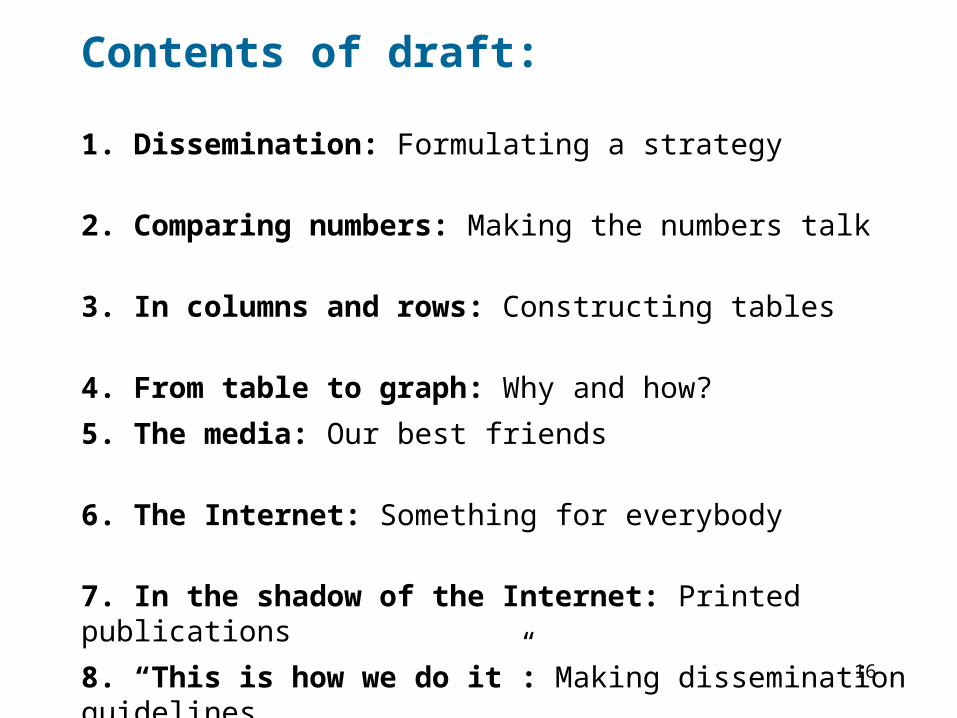
Contents of draft:
1. Dissemination: Formulating a strategy
2. Comparing numbers: Making the numbers talk
3. In columns and rows: Constructing tables
4. From table to graph: Why and how?
5. The media: Our best friends
6. The Internet: Something for everybody
7. In the shadow of the Internet: Printed publications
8. “This is how we do it”: Making dissemination guidelines
Read more? Some suggestions
Appendix I:
This is Norway – What the figures say: An example of a user-friendly publicationAppendix II:
Training for user-friendly dissemination: Some possible topics
17
Target group(s)?
• Chief statisticians/management
• Employees in disseminations units
• Others involved in dissemination
18
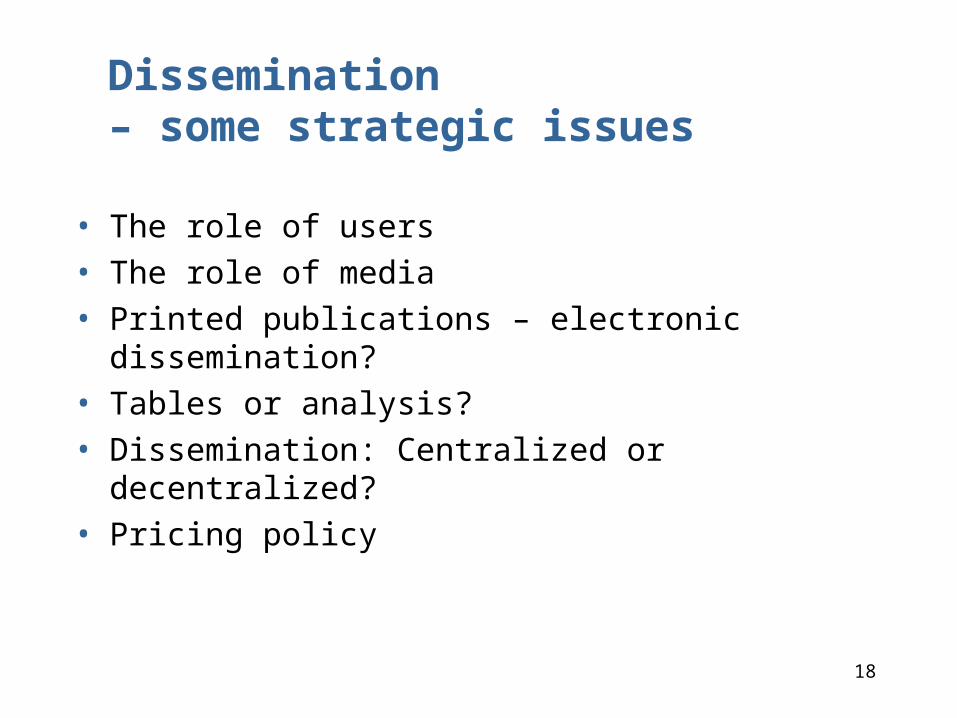
Dissemination – some strategic issues
• The role of users
• The role of media
• Printed publications – electronic dissemination?
• Tables or analysis?
• Dissemination: Centralized or decentralized?
• Pricing policy
19
Users
• The most “important” users?
• “Serving the government”?
20
The role of users?
“User-friendly = “let’s ask the users”?
But many users do not know what they want!
And: We also want to attract new users!
So….
21
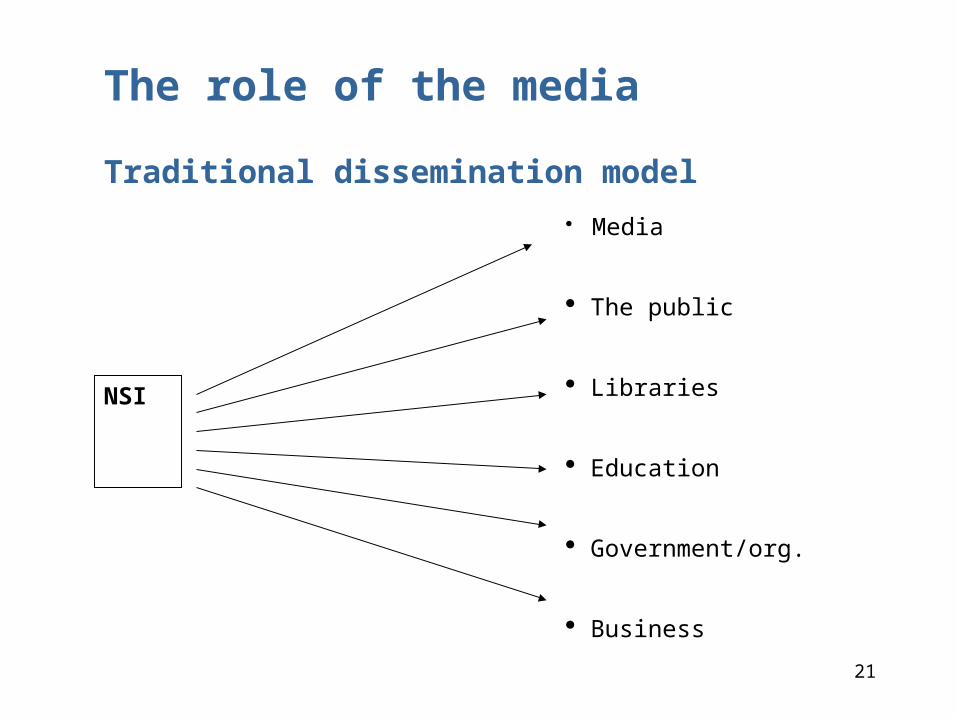
Traditional dissemination model
Media
The public
Libraries
Education
Government/org.
Business
NSI
The role of the media
22
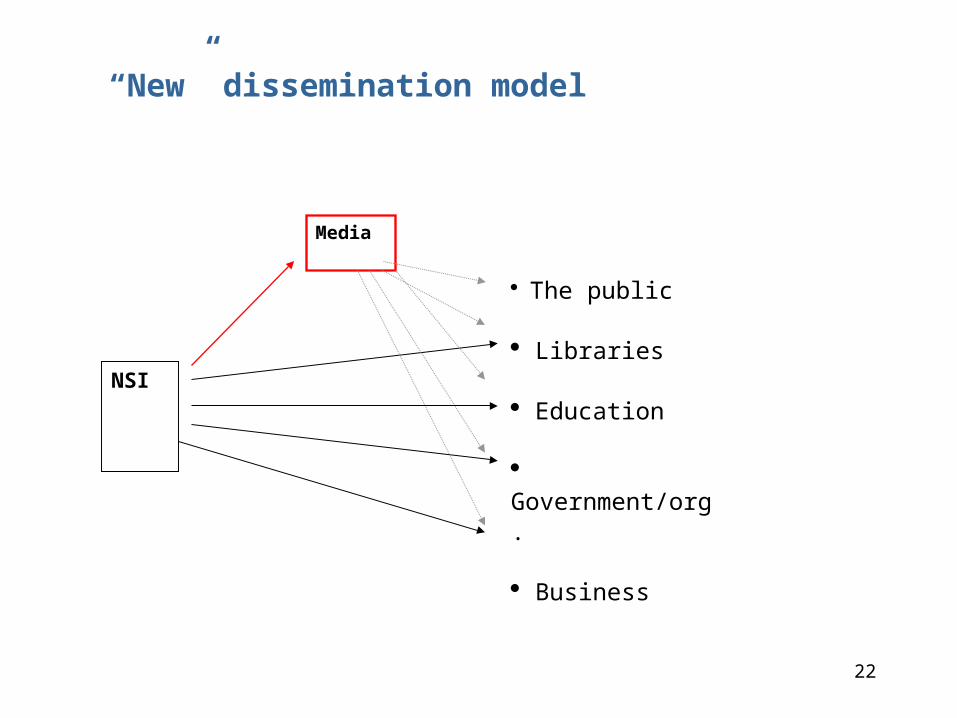
“New” dissemination model
The public
Libraries
Education
Government/org.
Business
NSI
Media
23
The media are of vital importance because:
• They represent an important channel of dissemination
• They help increase the visibility and public recognition of the NSO– and thereby improving the publics trust in statistics
24
Statistician and journalist: Like cat and dog?

25
But: We must cooperate!
Journalists are our best friends

26
An example of “change in attitudes”?
27
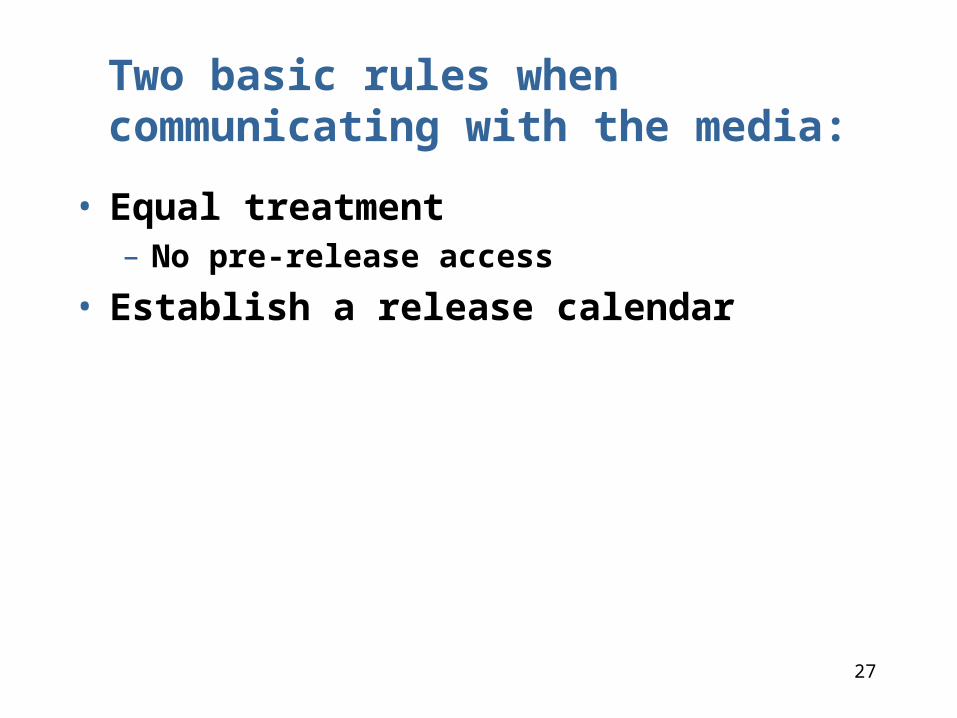
Two basic rules when communicating with the media:
• Equal treatment– No pre-release access
• Establish a release calendar

28
Printed or electronic?
• Yesterday: Printed publication first, then electronic/ Internet
• Today: Parallel publishing: Paper and Internet simultaneously
• Tomorrow: First on the Internet, then printed version.
(In Statistics Norway, an "Internet first"-policy has been implemented. Statistics are since June 1999 released daily on the Internet.).
29
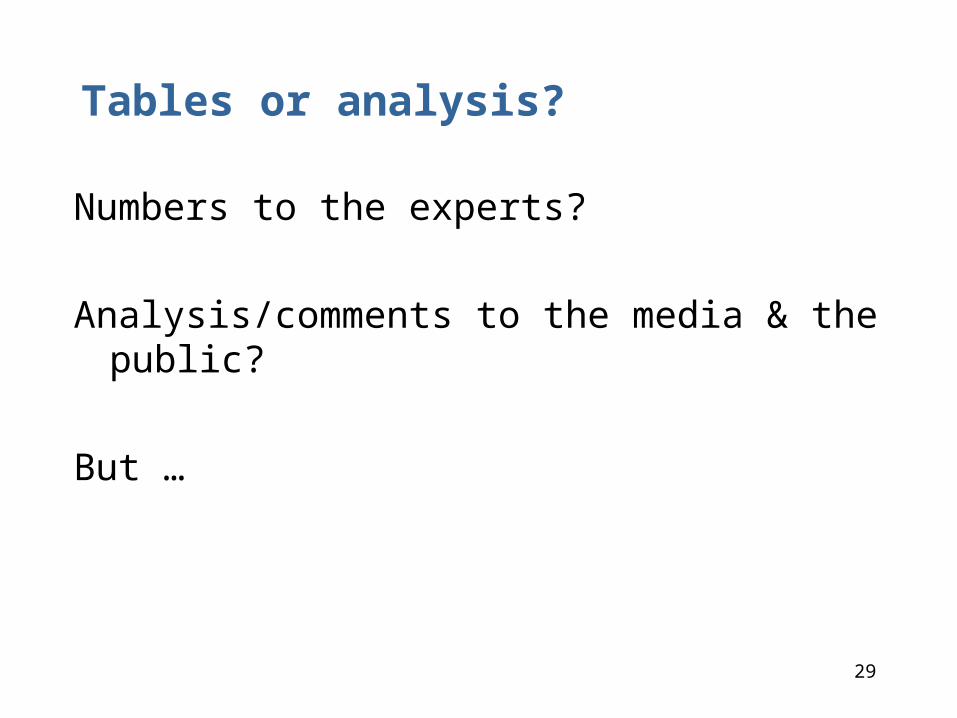
Tables or analysis?
Numbers to the experts?
Analysis/comments to the media & the public?
But …

30
More “analysis”, because…
• In a complex society, readers need to be
guided through the numerical jungel: “What
does the numbers really mean”?
• The informed users and the general public
need explanations, interpretations and
comments
31
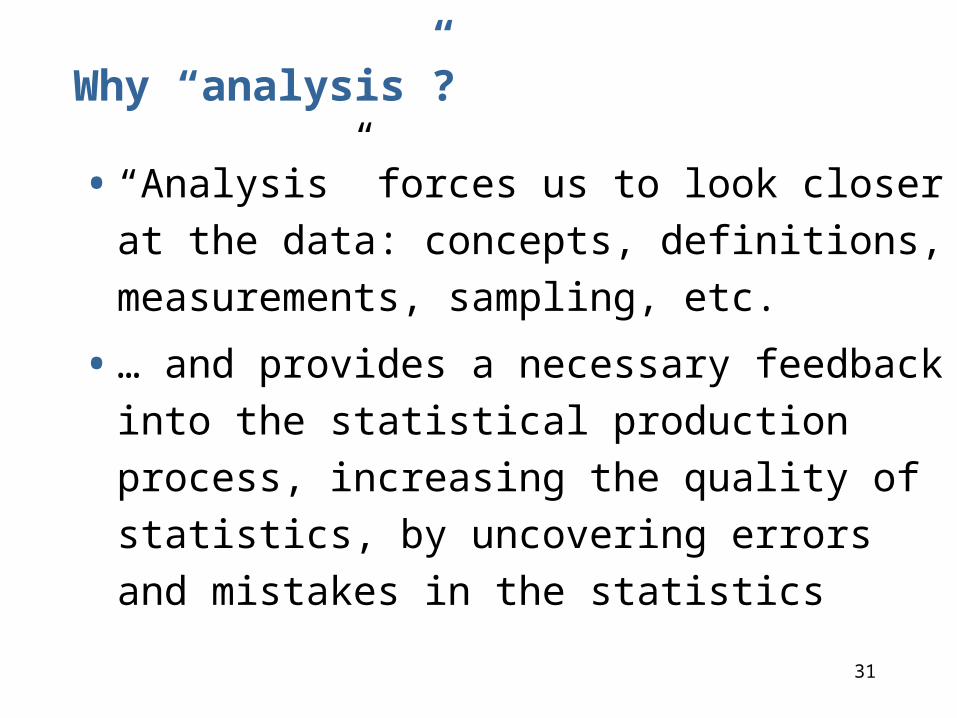
Why “analysis”?
• “Analysis” forces us to look closer at the data:
concepts, definitions, measurements,
sampling, etc.
• … and provides a necessary feedback into the
statistical production process, increasing the
quality of statistics, by uncovering errors and
mistakes in the statistics
32
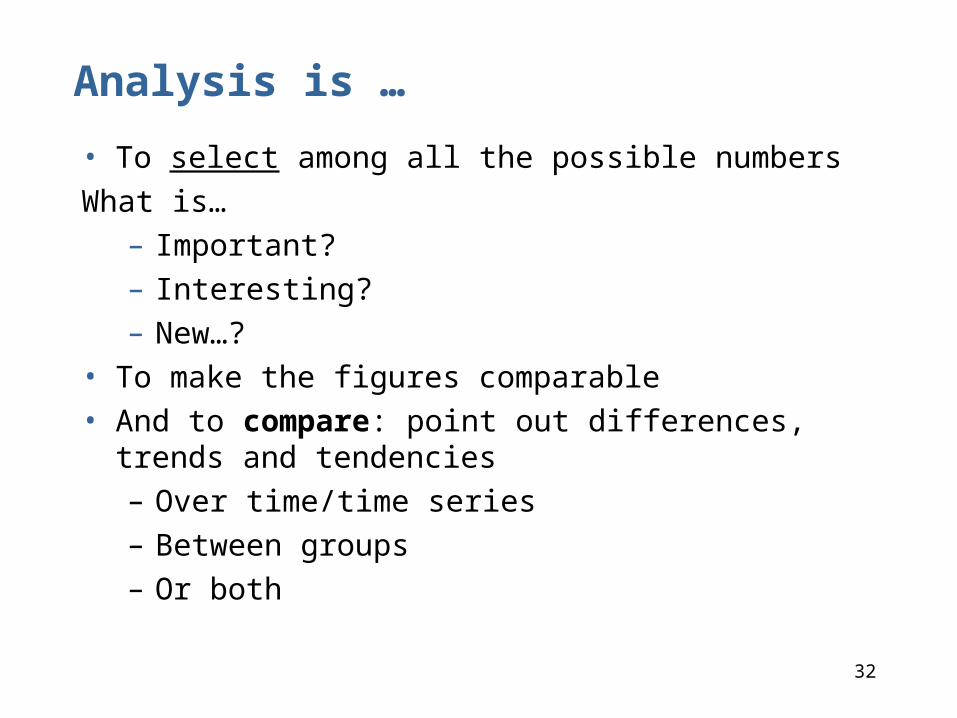
Analysis is …
• To select among all the possible numbers
What is… – Important?– Interesting?– New…?
• To make the figures comparable• And to compare: point out differences, trends and
tendencies – Over time/time series– Between groups– Or both
33
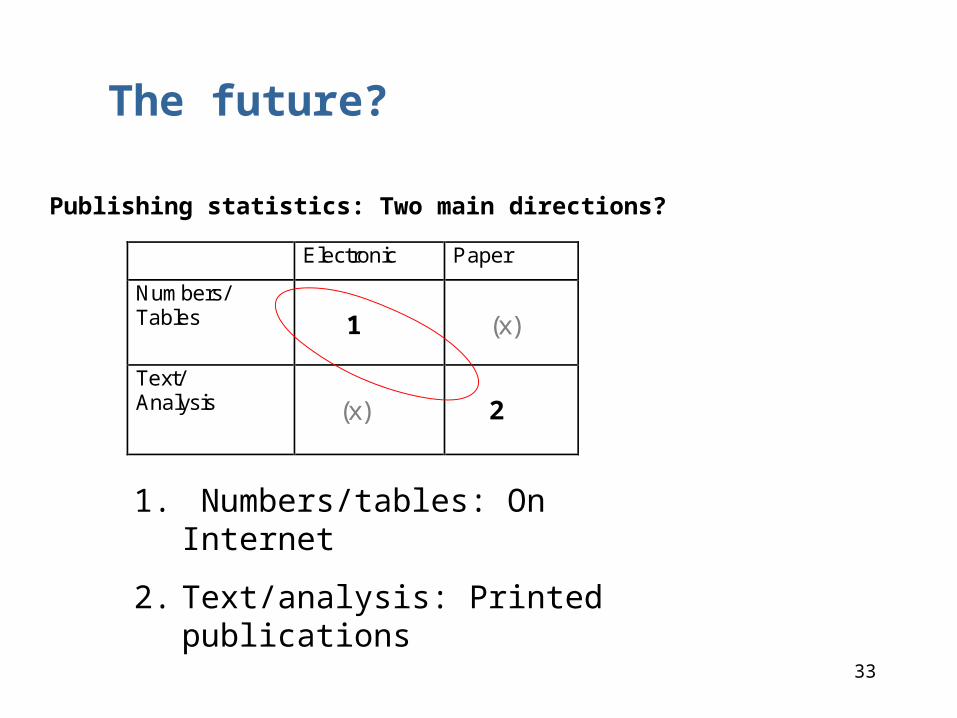
The future?
Electronic Paper
Numbers/ Tables
1
(x)
Text/ Analysis
(x)
2
Publishing statistics: Two main directions?
1. Numbers/tables: On Internet
2. Text/analysis: Printed publications
34
A few words about the Internet:
• The responsibility for the web service should not be left to the IT unit
• Something for everybody• Tables and publications should be
downloadable

35
Internet (continued):
• Give priority to statistics – instead of words of welcome, statements of missions
and visions, organizational charts or photos of the chief statistician

36
Internet (continued):
• Keep it simple!
From: Central Agency for Mobilization and Statistics. Egypt
37
Internet (continued):
• Update as often as possible
• One suggestion: “Portion out” results from large surveys and censuses
38
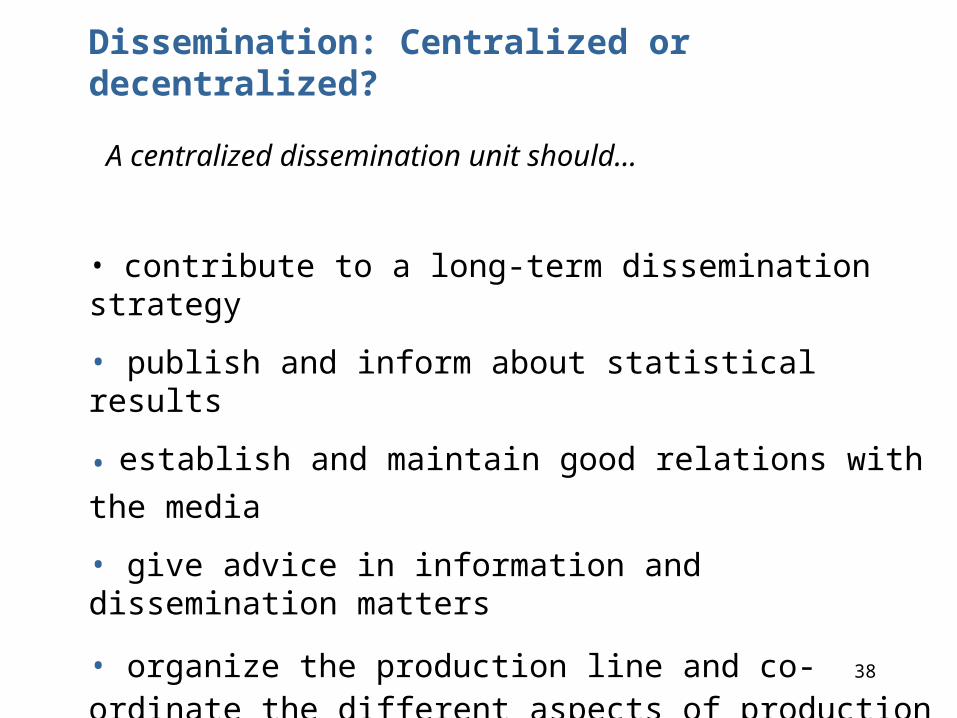
A centralized dissemination unit should…
• contribute to a long-term dissemination strategy
• publish and inform about statistical results
• establish and maintain good relations with the media
• give advice in information and dissemination matters
• organize the production line and co-ordinate the different aspects of production (tools/programs)
• make guidelines for design and layout for publications, tables and charts and see that these rules are being followed
Dissemination: Centralized or decentralized?
39
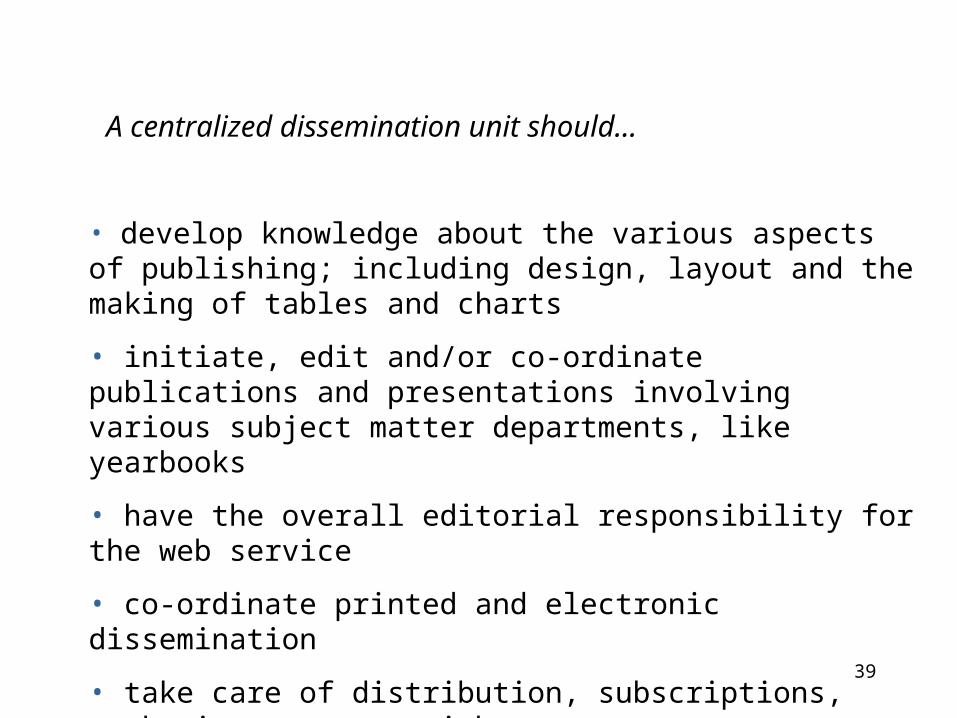
A centralized dissemination unit should…
• develop knowledge about the various aspects of publishing; including design, layout and the making of tables and charts
• initiate, edit and/or co-ordinate publications and presentations involving various subject matter departments, like yearbooks
• have the overall editorial responsibility for the web service
• co-ordinate printed and electronic dissemination
• take care of distribution, subscriptions, marketing, contact with users, etc.
40
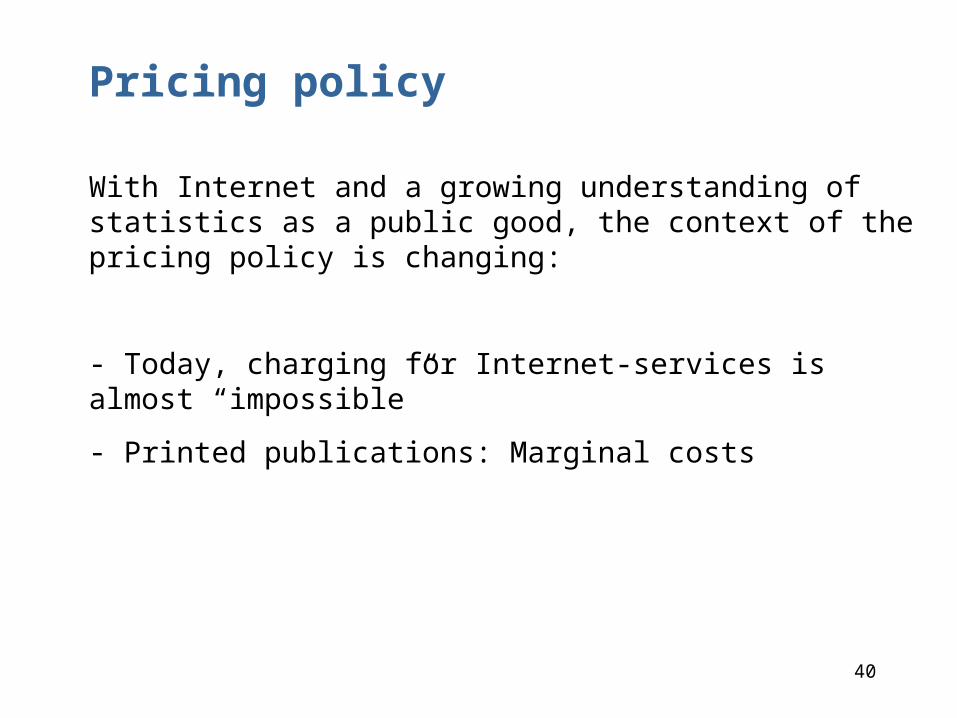
Pricing policy
With Internet and a growing understanding of statistics as a public good, the context of the pricing policy is changing:
- Today, charging for Internet-services is almost “impossible”
- Printed publications: Marginal costs

41
To increase user-friendly dissemination…
• Every NSO should develop a dissemination strategy – to make the organization concious of the importance of dissemination
• Strategy = plans for the day after tomorrow = road map
• But more important is the will (and ability) to implement and carry out the plans: Action speaks louder than words”
• Dissemination policy = dissemination guide(lines): ”This is how we do it”
42
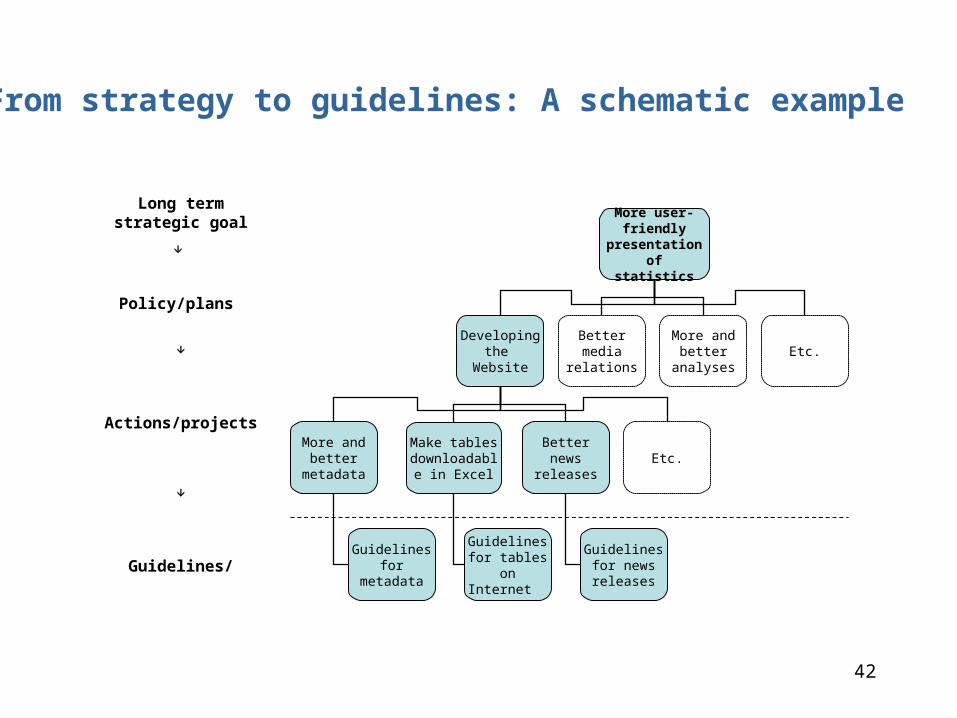
More user-friendly
presentation of statistics
Developing the
Website
Better media
relations
More and better
analyses
More and better
metadata
Make tables downloadabl
e in Excel
Guidelines for
metadata
Guidelines for tables
on Internet
Better news releases
Etc.
Guidelines for news releases
Etc.
From strategy to guidelines: A schematic example
Long term strategic goal
Policy/plans
Actions/projects
Guidelines/
43
The drafted guide does not propose any specific strategies, policies or guidelines for the various aspects of dissemination -
- these must be decided by the NSOs themselves, depending on their present situation, available resources - and ambitions
44
”This is how we do it”
Possible content of guidelines:
• News realeases and media relations
• Publication series
• The internet
• Tables
• Graphs
• Metadata
But remember: KISS