Embed Size (px)
Citation preview
1
The Utility of Clinical Information Systems: Quality Measurement, Patient Safety, and Evidence Based Guidelines
Rosemary Kennedy, PhD, RN, MBA, FAANVice President, Health Information TechnologyNational Quality Forum (NQF)
2
Curriculum Sections
• National Initiatives Related to Patient Safety and Quality
• Quality Measurement Overview
• Informatics Tools to Promote Safety and Measure Quality
• Using Clinical Information Systems to Measure and Improve Outcomes Using Evidence Based Guidelines
3
Section One
4
National Initiatives Related to Patient Safety and Quality
5
Learning Objectives
National Initiatives Related to Patient Safety and Quality
At the completion of this session, the learner will:
• Describe components of the National Quality Landscape• Describe national safety and quality organizational initiatives• Describe a framework for evaluating safety from a system
perspective• Identify three key patient safety areas important to
improving patient safety• Describe features of health information technology that
impact safety
6
Organizations Involved in HealthCare Quality
Institute of Medicine (IOM)
• The Institute of Medicine (IOM) is an independent, nonprofit organization that works outside of government to provide unbiased and authoritative advice to decision makers and the public involved in healthcare
7
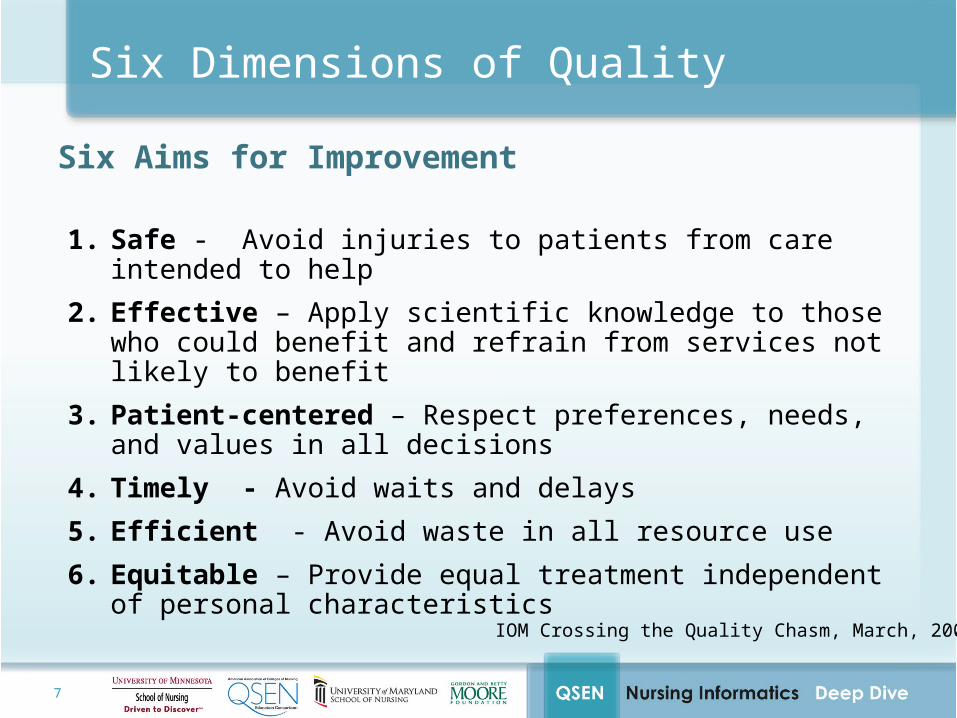
Six Dimensions of Quality
Six Aims for Improvement
1. Safe - Avoid injuries to patients from care intended to help
2. Effective – Apply scientific knowledge to those who could benefit and refrain from services not likely to benefit
3. Patient-centered – Respect preferences, needs, and values in all decisions
4. Timely - Avoid waits and delays
5. Efficient - Avoid waste in all resource use
6. Equitable – Provide equal treatment independent of personal characteristics
IOM Crossing the Quality Chasm, March, 2001
8
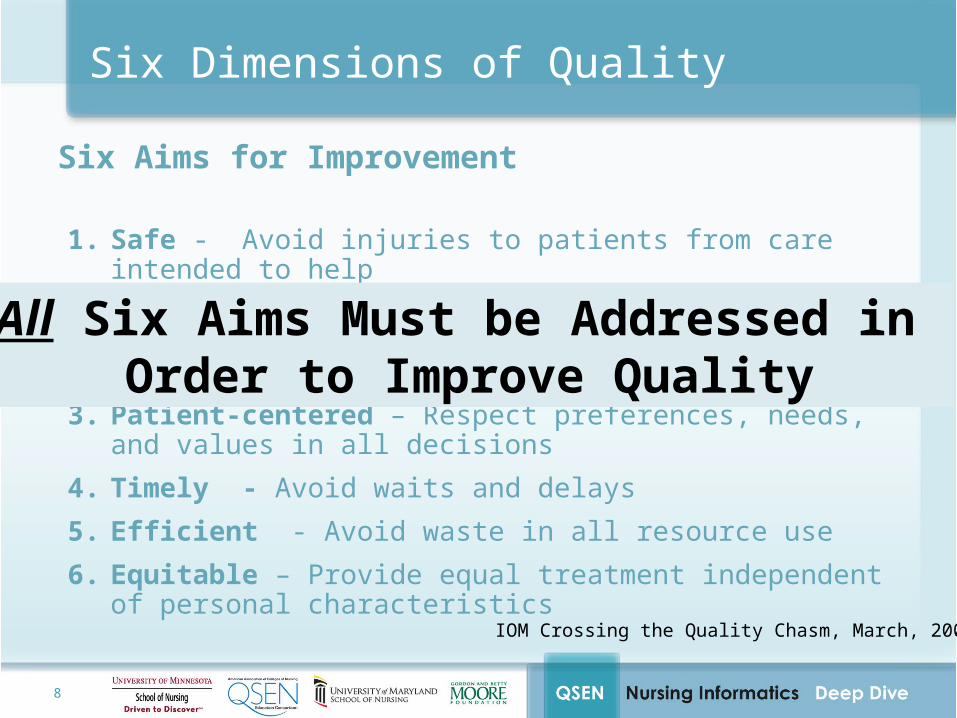
Six Dimensions of Quality
Six Aims for Improvement
1. Safe - Avoid injuries to patients from care intended to help
2. Effective – Apply scientific knowledge to those who could benefit and refrain from services not likely to benefit
3. Patient-centered – Respect preferences, needs, and values in all decisions
4. Timely - Avoid waits and delays
5. Efficient - Avoid waste in all resource use
6. Equitable – Provide equal treatment independent of personal characteristics
IOM Crossing the Quality Chasm, March, 2001
All Six Aims Must be Addressed in Order to Improve Quality
9
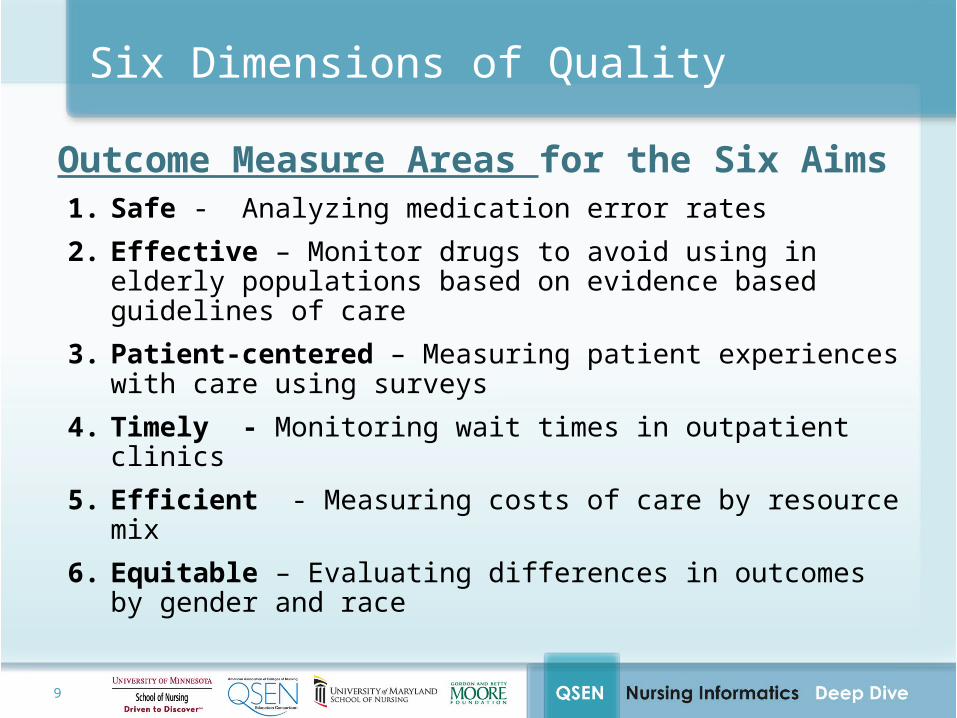
Six Dimensions of Quality
Outcome Measure Areas for the Six Aims1. Safe - Analyzing medication error rates
2. Effective – Monitor drugs to avoid using in elderly populations based on evidence based guidelines of care
3. Patient-centered – Measuring patient experiences with care using surveys
4. Timely - Monitoring wait times in outpatient clinics
5. Efficient - Measuring costs of care by resource mix
6. Equitable – Evaluating differences in outcomes by gender and race
10
Institute of Medicine
Health IT and Patient SafetyBuilding Safety Systems for Better Care
IOM, November 10, 2011
11
IOM Building Safer Systems
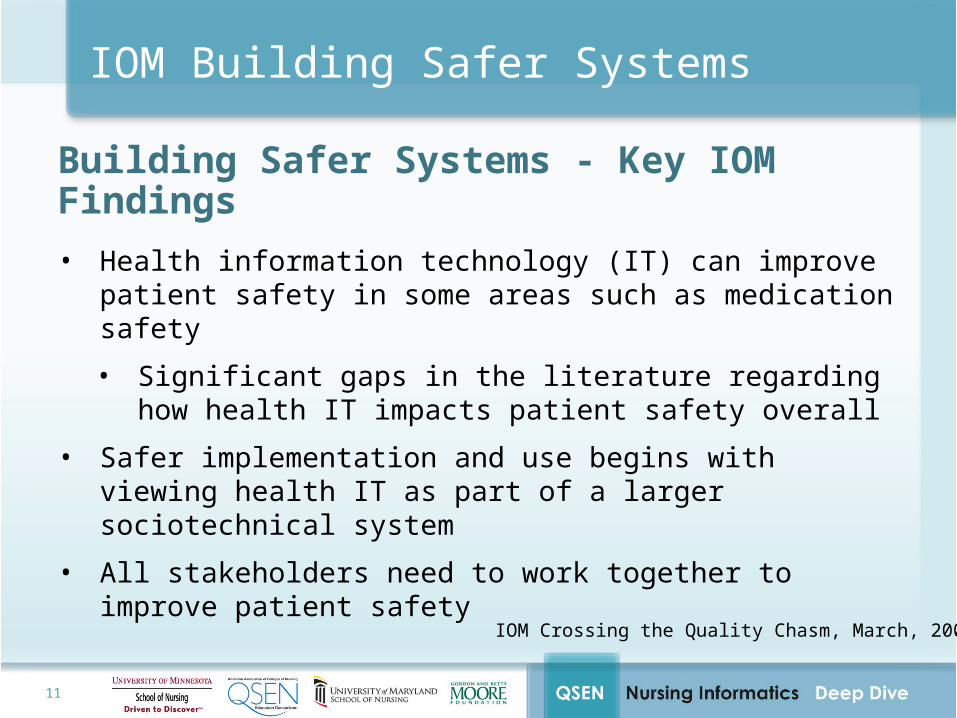
Building Safer Systems - Key IOM Findings• Health information technology (IT) can improve patient
safety in some areas such as medication safety
• Significant gaps in the literature regarding how health IT impacts patient safety overall
• Safer implementation and use begins with viewing health IT as part of a larger sociotechnical system
• All stakeholders need to work together to improve patient safety
IOM Crossing the Quality Chasm, March, 2001
12
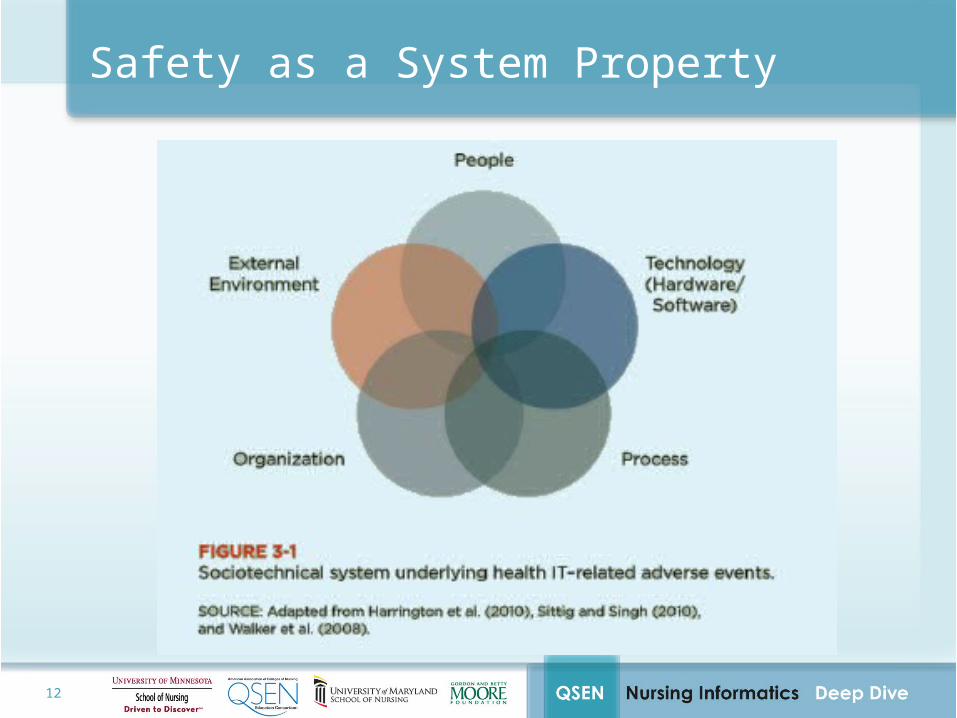
Safety as a System Property
13
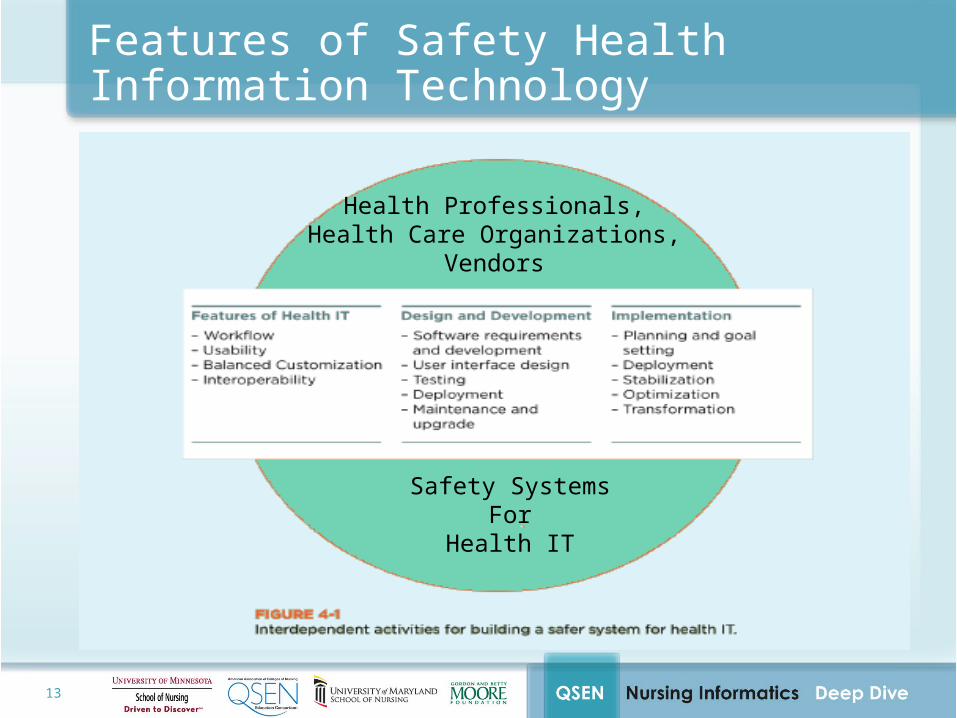
Features of Safety Health Information Technology
Health Professionals,Health Care Organizations,
Vendors
Safety SystemsFor
Health IT
14
Organizations Involved in HealthCare Quality
Agency for Healthcare Research and Quality (AHRQ)
• AHRQ’s mission is to improve the quality, safety, efficiency, and effectiveness of health care for all Americans
• As 1 of 12 agencies within the Department of Health and Human Services, AHRQ supports research that helps people make more informed decisions and improves the quality of health care services
15
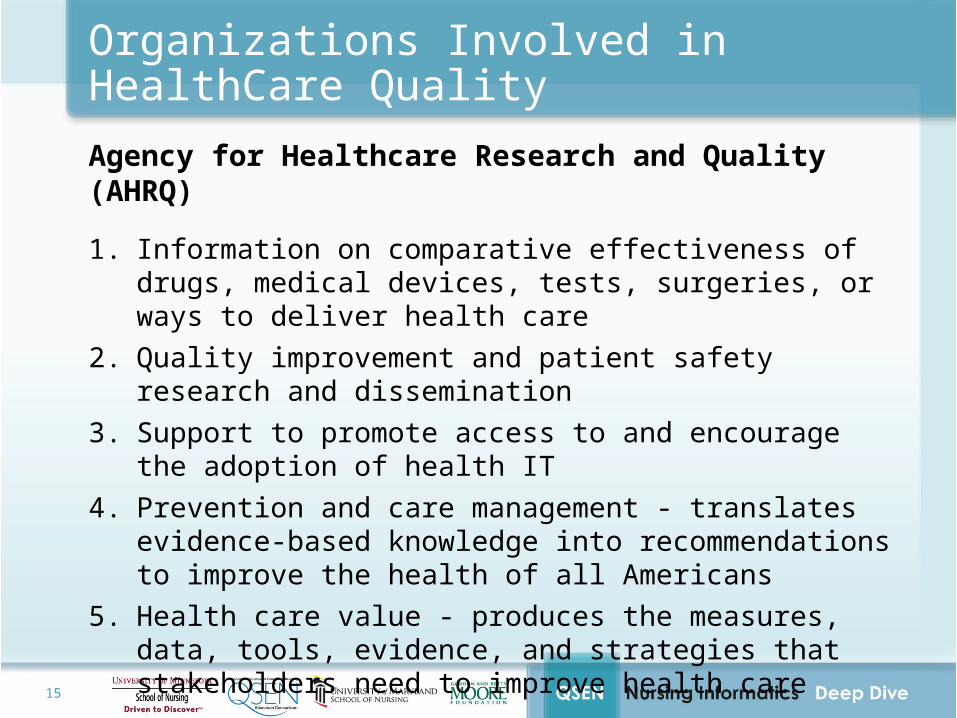
Organizations Involved in HealthCare Quality
Agency for Healthcare Research and Quality (AHRQ)
1. Information on comparative effectiveness of drugs, medical devices, tests, surgeries, or ways to deliver health care
2. Quality improvement and patient safety research and dissemination
3. Support to promote access to and encourage the adoption of health IT
4. Prevention and care management - translates evidence-based knowledge into recommendations to improve the health of all Americans
5. Health care value - produces the measures, data, tools, evidence, and strategies that stakeholders need to improve health care

16
Organizations Involved in HealthCare Quality
National Quality ForumThe National Quality Forum (NQF) is a nonprofit organization that operates under a three-part mission to improve the quality of American healthcare by: • Building consensus on national priorities and goals for
performance improvement and working in partnership to achieve them;
• Endorsing national consensus standards for measuring and publicly reporting on performance; and
• Promoting the attainment of national goals through education and outreach programs.
17
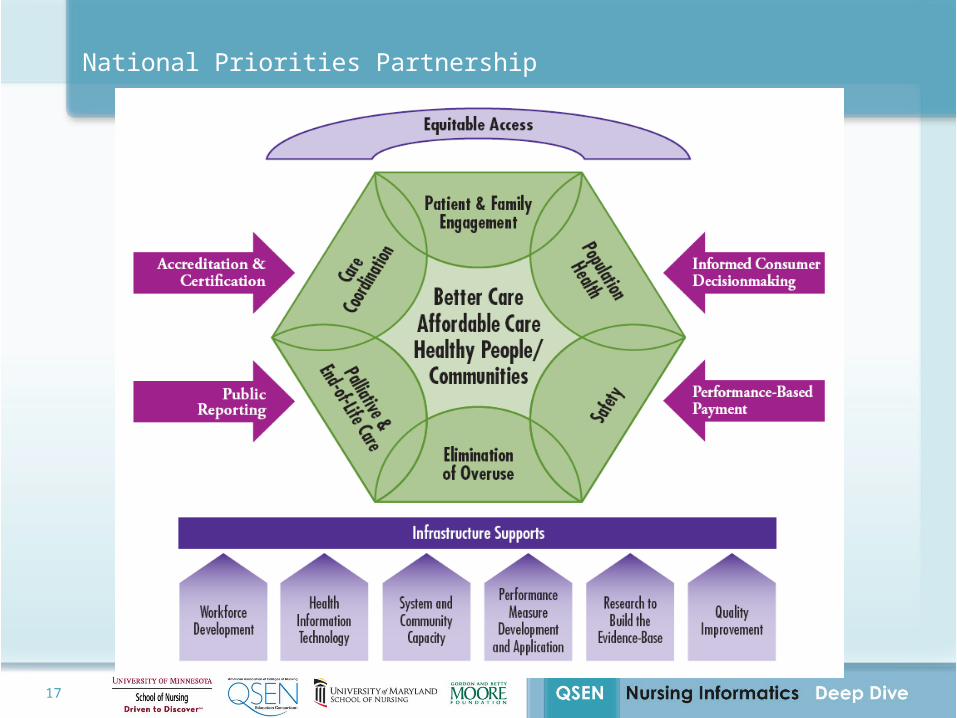
National Priorities Partnership
18
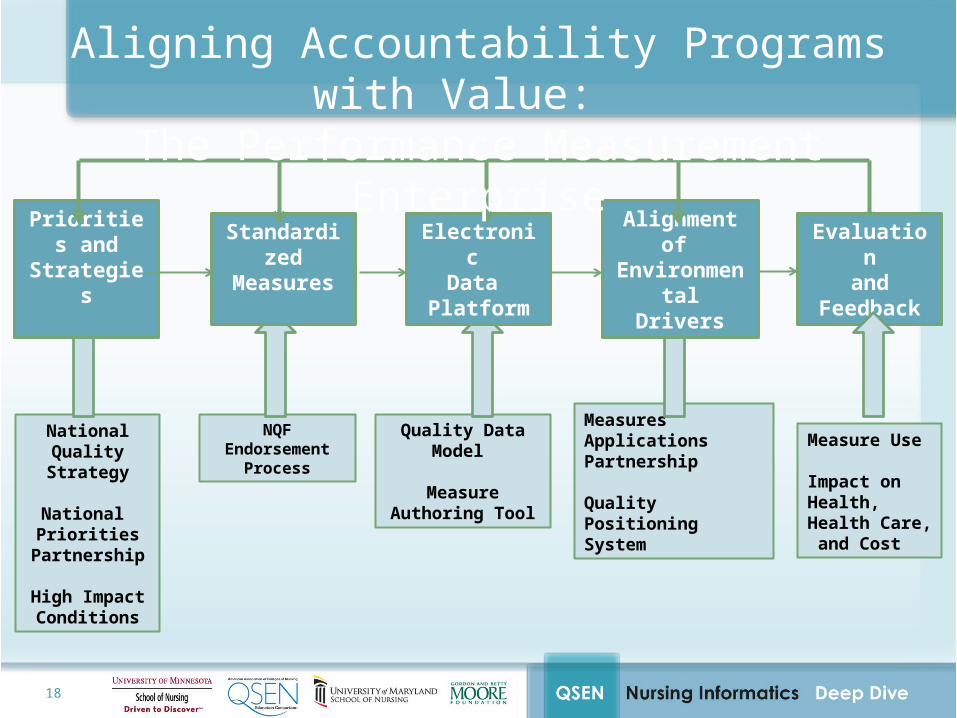
National Quality Strategy
National Priorities
Partnership
High Impact Conditions
NQF EndorsementProcess
Quality Data Model
Measure Authoring Tool
Measures Applications Partnership
Quality Positioning System
Priorities and Strategies
Standardized Measures
Electronic Data
Platform
Alignment of Environmental
Drivers
Evaluationand
Feedback
Aligning Accountability Programs with Value: The Performance Measurement Enterprise
Measure Use
Impact on Health, Health Care, and Cost
19
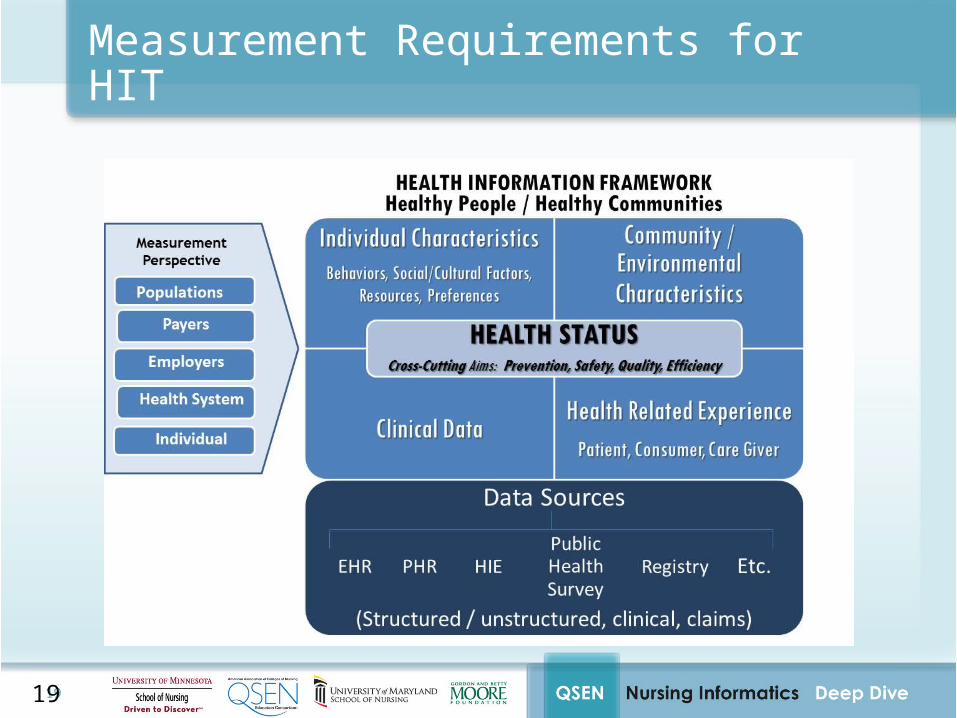
Measurement Requirements for HIT
19
20
Organizations Involved in HealthCare Quality
The Joint Commission
• Accredits and certifies more than 19,000 health care organizations and programs in the United States
• In 2002, The Joint Commission established its National Patient Safety Goals (NPSGs) program to help accredited organizations address specific areas of concern in regards to patient safety
21
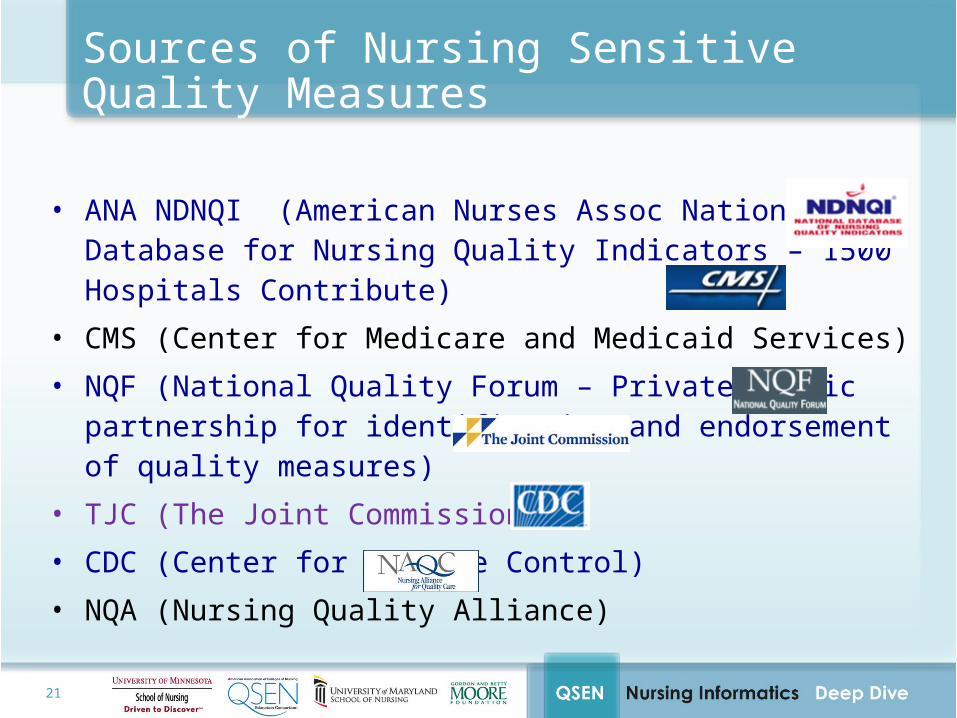
Sources of Nursing Sensitive Quality Measures
• ANA NDNQI (American Nurses Assoc National Database for Nursing Quality Indicators – 1500 Hospitals Contribute)
• CMS (Center for Medicare and Medicaid Services)
• NQF (National Quality Forum – Private public partnership for identification and endorsement of quality measures)
• TJC (The Joint Commission)
• CDC (Center for Disease Control)
• NQA (Nursing Quality Alliance)
22
Organizations Involved in HealthCare Quality
National Database of Nursing Quality Indicators® (NDNQI®) • NDNQI’s mission is to aid the registered nurse in patient safety
and quality improvement efforts by providing research-based national comparative data on nursing care and the relationship to patient outcomes
• NDNQI is a proprietary database of the American Nurses Association. The database collects and evaluates unit-specific nurse-sensitive data from over 1500 hospitals in the United States
• NDNQI’s nursing-sensitive indicators reflect the structure, process, and outcomes of nursing care
Retrieved from https://www.nursingquality.org
23
What are the benefits of NDNQI?
• National comparison data• Widely collected data• Reports within six weeks• Research opportunities• Secure, user-friendly web-based data entry• Ability to trend data• RN survey tool• Training• Continue education credits• Publishing
24
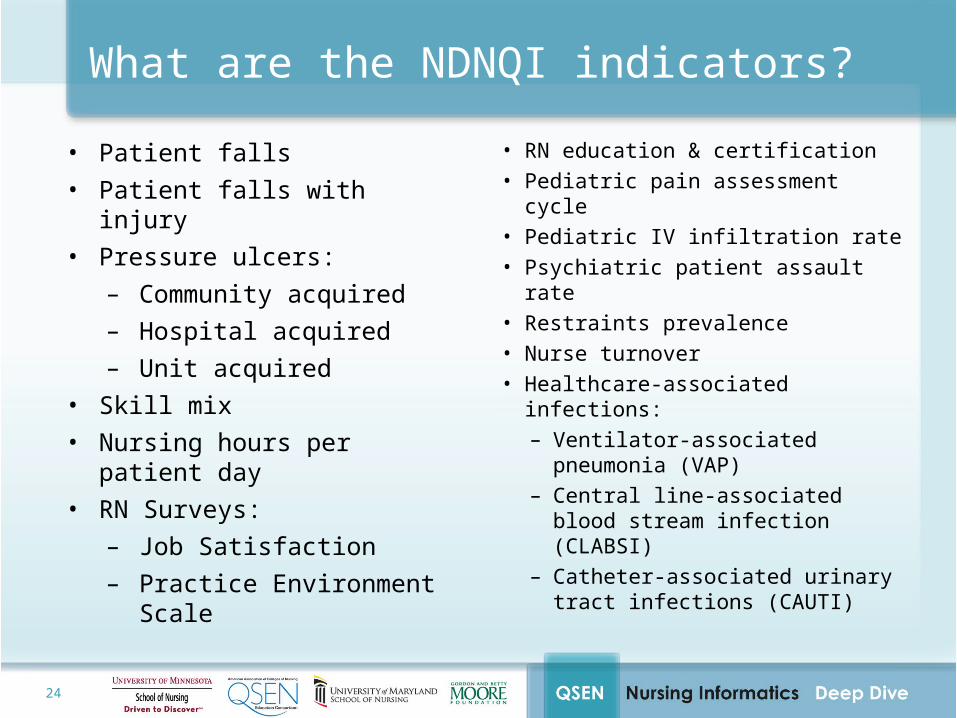
What are the NDNQI indicators?
• Patient falls• Patient falls with injury• Pressure ulcers:
– Community acquired– Hospital acquired– Unit acquired
• Skill mix• Nursing hours per patient day• RN Surveys:
– Job Satisfaction– Practice Environment Scale
• RN education & certification• Pediatric pain assessment cycle• Pediatric IV infiltration rate• Psychiatric patient assault rate• Restraints prevalence• Nurse turnover• Healthcare-associated infections:
– Ventilator-associated pneumonia (VAP)
– Central line-associated blood stream infection (CLABSI)
– Catheter-associated urinary tract infections (CAUTI)
25
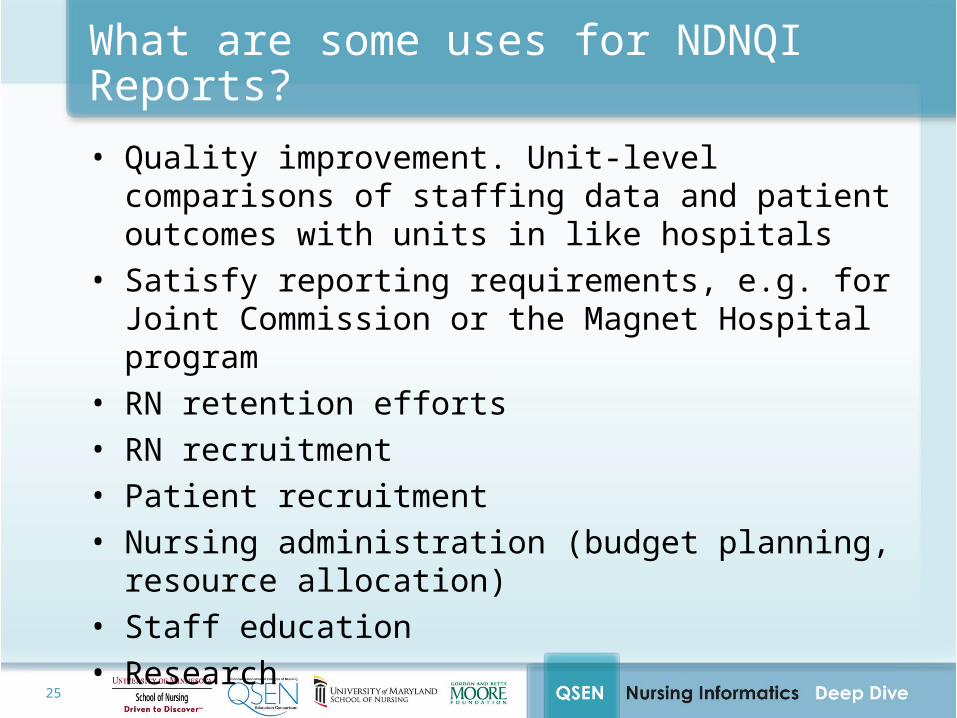
What are some uses for NDNQI Reports?
• Quality improvement. Unit-level comparisons of staffing data and patient outcomes with units in like hospitals
• Satisfy reporting requirements, e.g. for Joint Commission or the Magnet Hospital program
• RN retention efforts• RN recruitment• Patient recruitment• Nursing administration (budget planning, resource
allocation)• Staff education• Research
26
Data Standards and Organizations
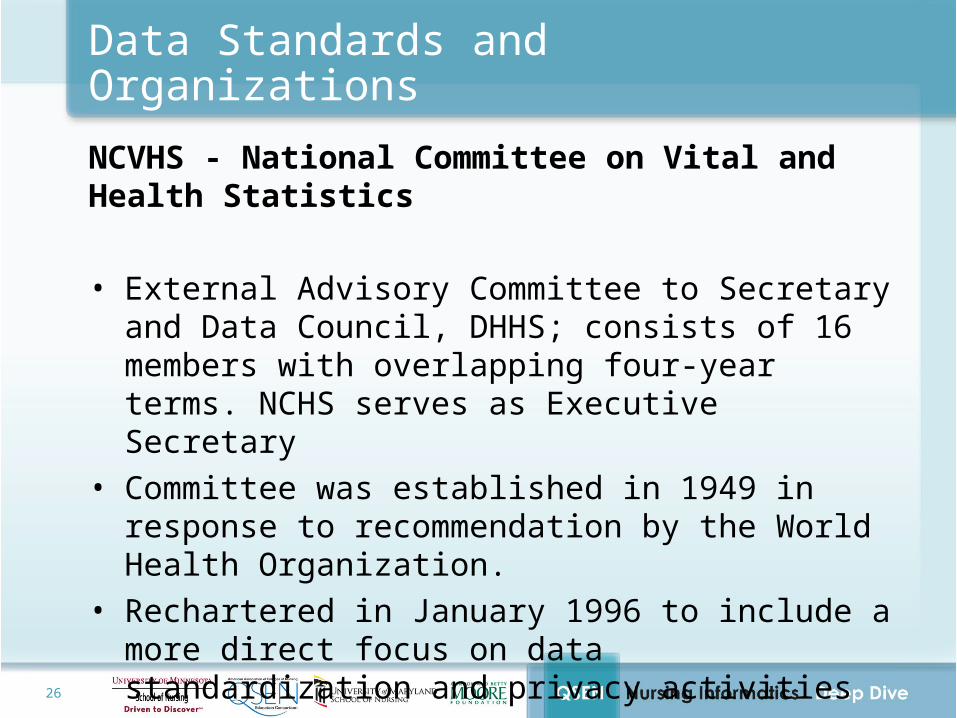
NCVHS - National Committee on Vital and Health Statistics
• External Advisory Committee to Secretary and Data Council, DHHS; consists of 16 members with overlapping four-year terms. NCHS serves as Executive Secretary
• Committee was established in 1949 in response to recommendation by the World Health Organization.
• Rechartered in January 1996 to include a more direct focus on data standardization and privacy activities
27
Data Standards and Organizations
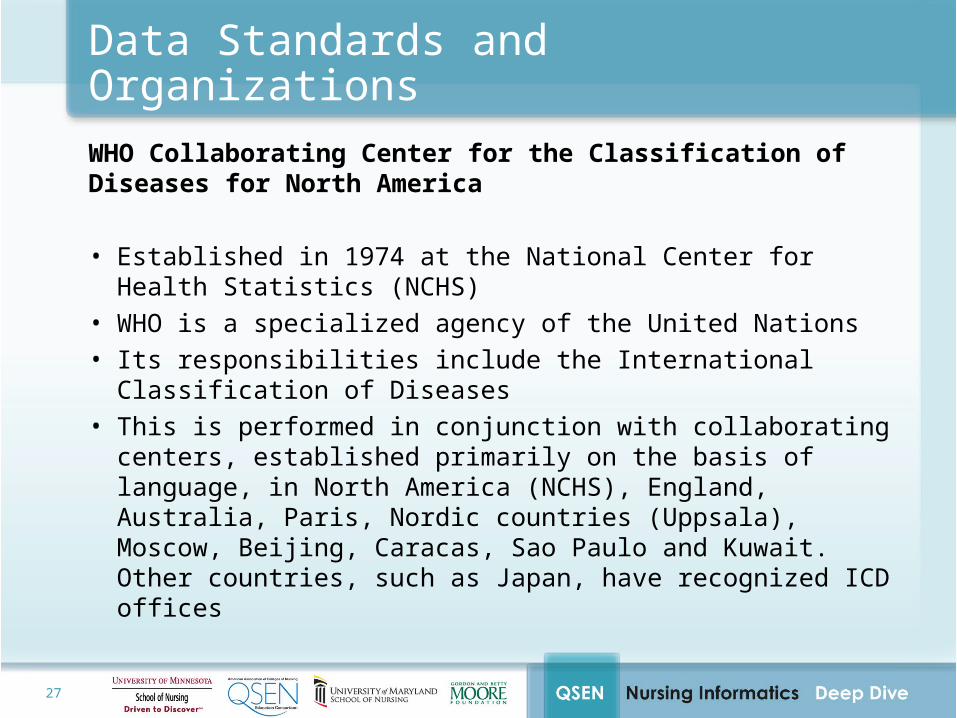
WHO Collaborating Center for the Classification of Diseases for North America
• Established in 1974 at the National Center for Health Statistics (NCHS)
• WHO is a specialized agency of the United Nations • Its responsibilities include the International Classification of
Diseases • This is performed in conjunction with collaborating centers,
established primarily on the basis of language, in North America (NCHS), England, Australia, Paris, Nordic countries (Uppsala), Moscow, Beijing, Caracas, Sao Paulo and Kuwait. Other countries, such as Japan, have recognized ICD offices
28
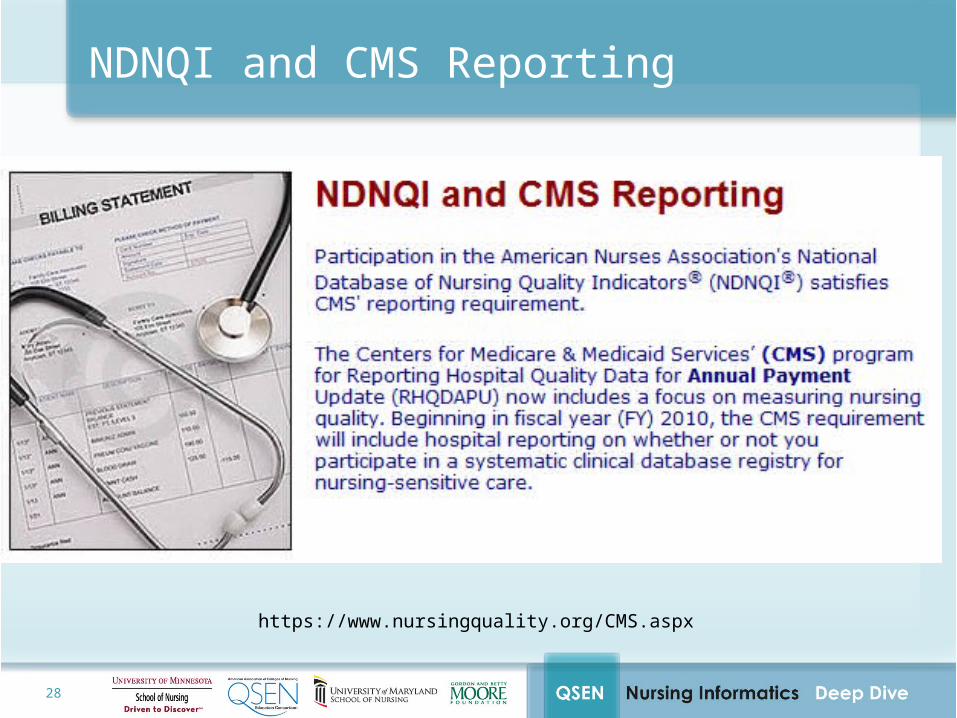
NDNQI and CMS Reporting
https://www.nursingquality.org/CMS.aspx
29
Organizations Involved in HealthCare Quality
World Health Organization (WHO)
30
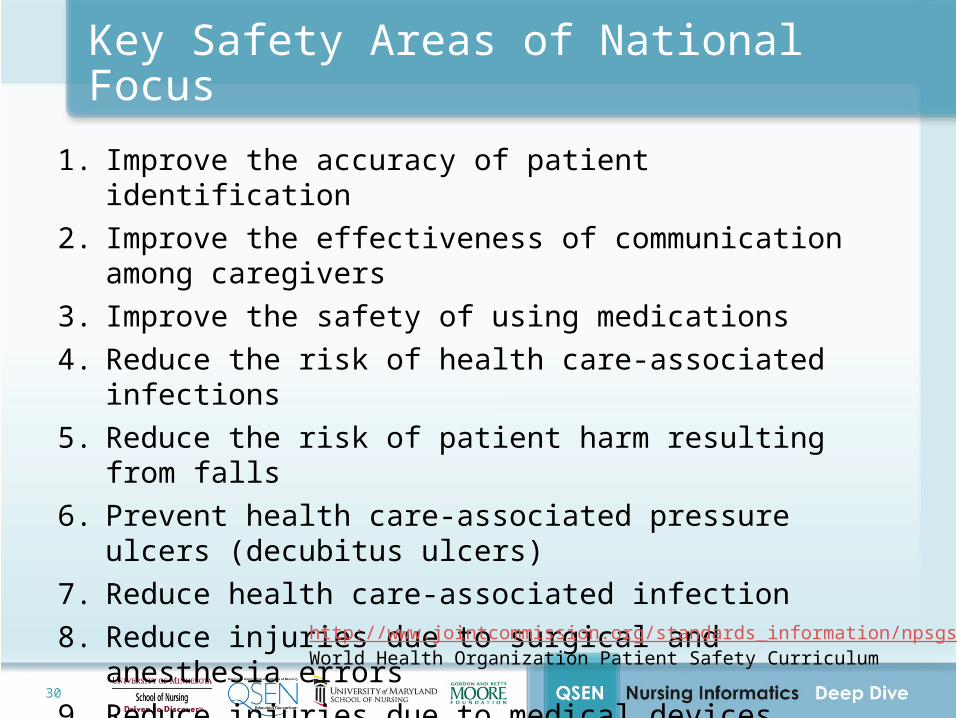
Key Safety Areas of National Focus
1. Improve the accuracy of patient identification2. Improve the effectiveness of communication among caregivers3. Improve the safety of using medications4. Reduce the risk of health care-associated infections5. Reduce the risk of patient harm resulting from falls 6. Prevent health care-associated pressure ulcers (decubitus ulcers)7. Reduce health care-associated infection8. Reduce injuries due to surgical and anesthesia errors9. Reduce injuries due to medical devices 10. Reduce unsafe injection practices and blood products, 11. Reduce unsafe practices for pregnant women and newborns
http://www.jointcommission.org/standards_information/npsgs.aspxWorld Health Organization Patient Safety Curriculum
31
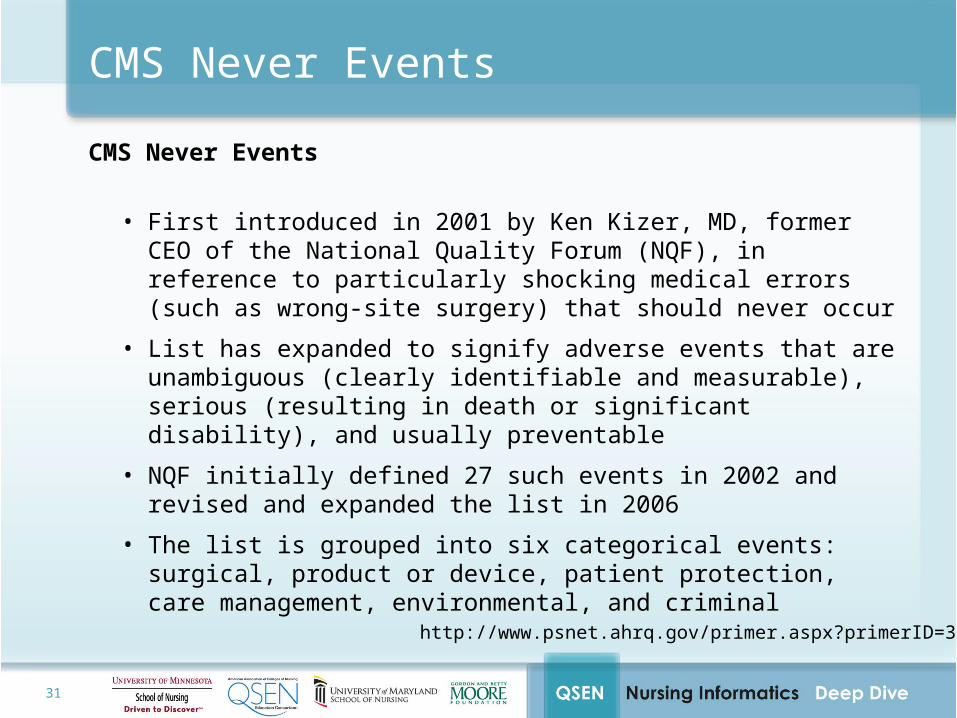
CMS Never Events
CMS Never Events
• First introduced in 2001 by Ken Kizer, MD, former CEO of the National Quality Forum (NQF), in reference to particularly shocking medical errors (such as wrong-site surgery) that should never occur
• List has expanded to signify adverse events that are unambiguous (clearly identifiable and measurable), serious (resulting in death or significant disability), and usually preventable
• NQF initially defined 27 such events in 2002 and revised and expanded the list in 2006
• The list is grouped into six categorical events: surgical, product or device, patient protection, care management, environmental, and criminal
http://www.psnet.ahrq.gov/primer.aspx?primerID=3
32
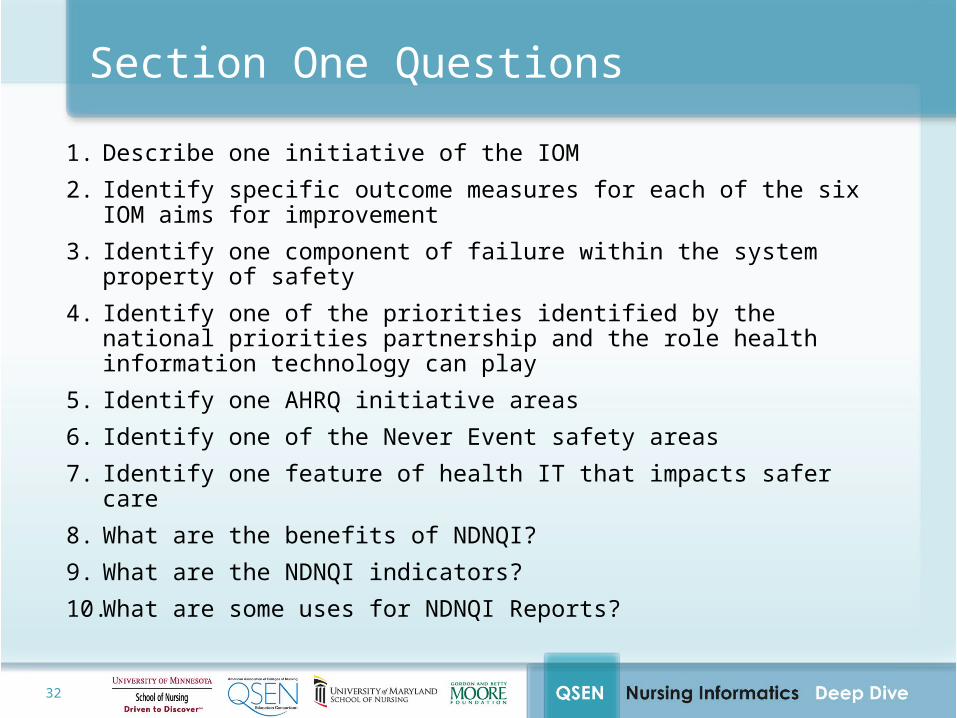
Section One Questions
1. Describe one initiative of the IOM
2. Identify specific outcome measures for each of the six IOM aims for improvement
3. Identify one component of failure within the system property of safety
4. Identify one of the priorities identified by the national priorities partnership and the role health information technology can play
5. Identify one AHRQ initiative areas
6. Identify one of the Never Event safety areas
7. Identify one feature of health IT that impacts safer care
8. What are the benefits of NDNQI?
9. What are the NDNQI indicators?
10. What are some uses for NDNQI Reports?

33
Teaching Methods and Strategies
1. Lecture
2. Discussion Board
– Present safety and quality scenarios within healthcare organizations
– Present challenges student may face as a member of an organizational safety/quality committee
3. White papers answering questions posed on the prior slide
4. Development of use cases for each of the safety areas showing how one of the organizations provides tools for improving safety
5. Review of public testimonies and calls for comments – have the students respond to the national posts for comments

34
Questions &
Discussion
35
Section Two
36
Quality Measurement Overview
37
Learning Objectives
Informatics Tools to Measure Quality and Promote Safety
At the completion of this session, the learner will:
• Describe health care quality
• Identify challenges and benefits related to using aggregated coded data for quality measurement
• Describe the types of performance management initiatives and the role for technology
• Describe the relationship between quality measurement and clinical decision support
38
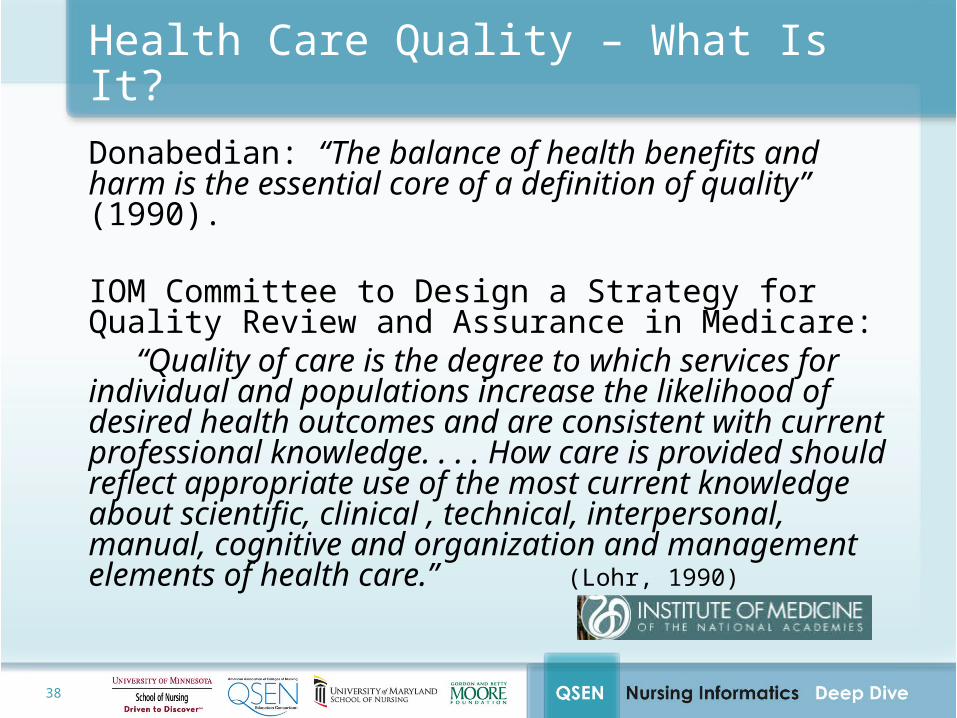
Health Care Quality – What Is It?
Donabedian: “The balance of health benefits and harm is the essential core of a definition of quality” (1990).
IOM Committee to Design a Strategy for Quality Review and Assurance in Medicare:
“Quality of care is the degree to which services for individual and populations increase the likelihood of desired health outcomes and are consistent with current professional knowledge. . . . How care is provided should reflect appropriate use of the most current knowledge about scientific, clinical , technical, interpersonal, manual, cognitive and organization and management elements of health care.”
(Lohr, 1990)
39
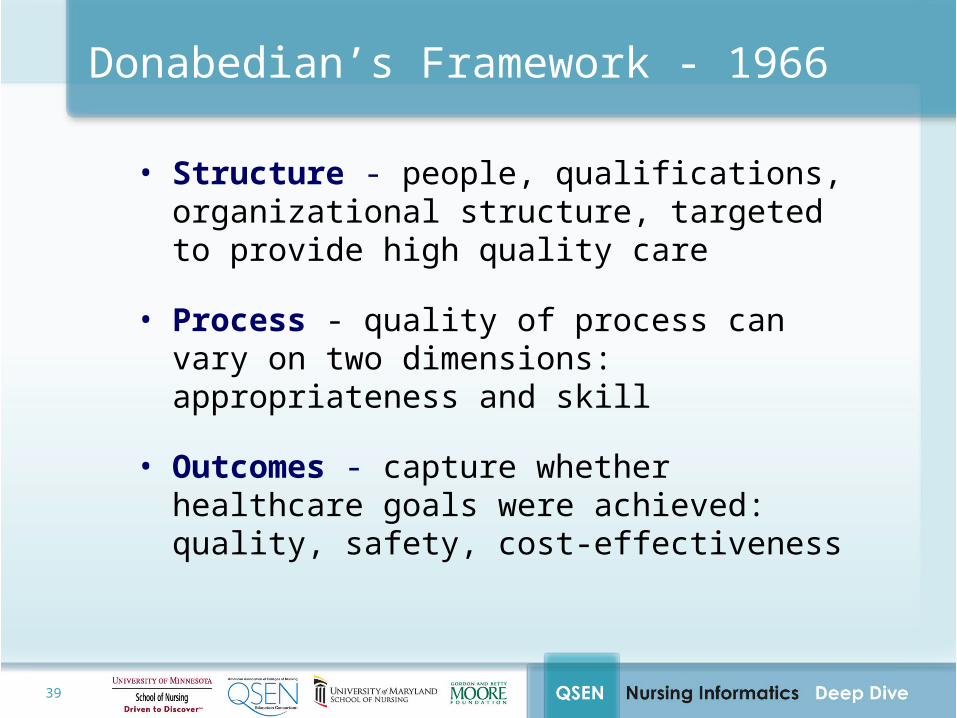
Donabedian’s Framework - 1966
• Structure - people, qualifications, organizational structure, targeted to provide high quality care
• Process - quality of process can vary on two dimensions: appropriateness and skill
• Outcomes - capture whether healthcare goals were achieved: quality, safety, cost-effectiveness
40
Quality Measurement Challenges and Opportunities
41
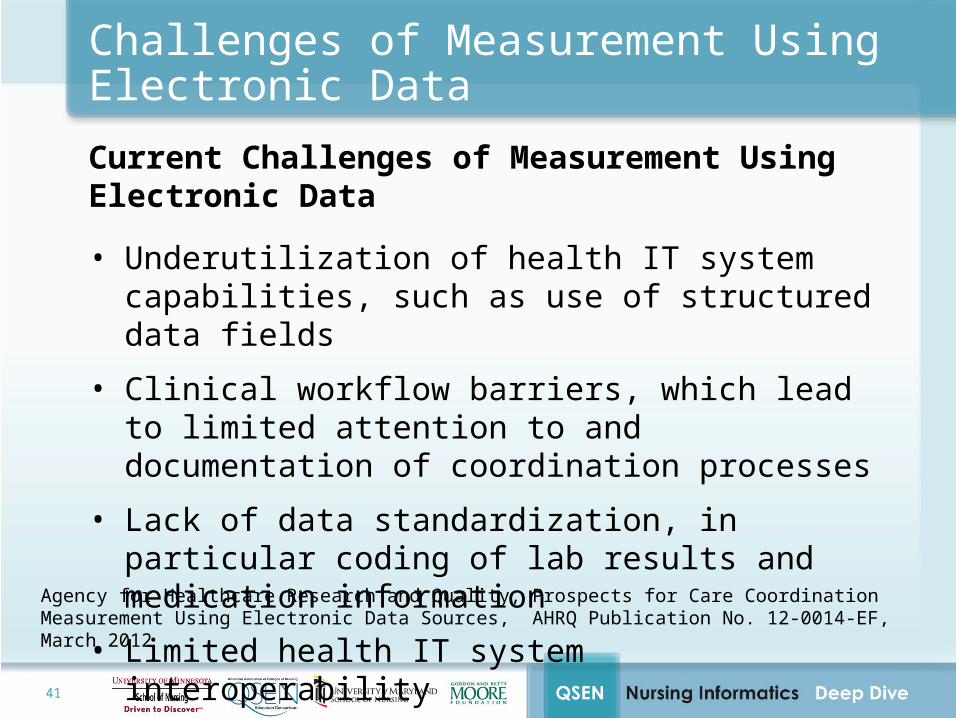
Challenges of Measurement Using Electronic Data
Current Challenges of Measurement Using Electronic Data
• Underutilization of health IT system capabilities, such as use of structured data fields
• Clinical workflow barriers, which lead to limited attention to and documentation of coordination processes
• Lack of data standardization, in particular coding of lab results and medication information
• Limited health IT system interoperability
Agency for Healthcare Research and Quality, Prospects for Care Coordination Measurement Using Electronic Data Sources, AHRQ Publication No. 12-0014-EF, March 2012
42
Challenges of Measurement Using Electronic Data
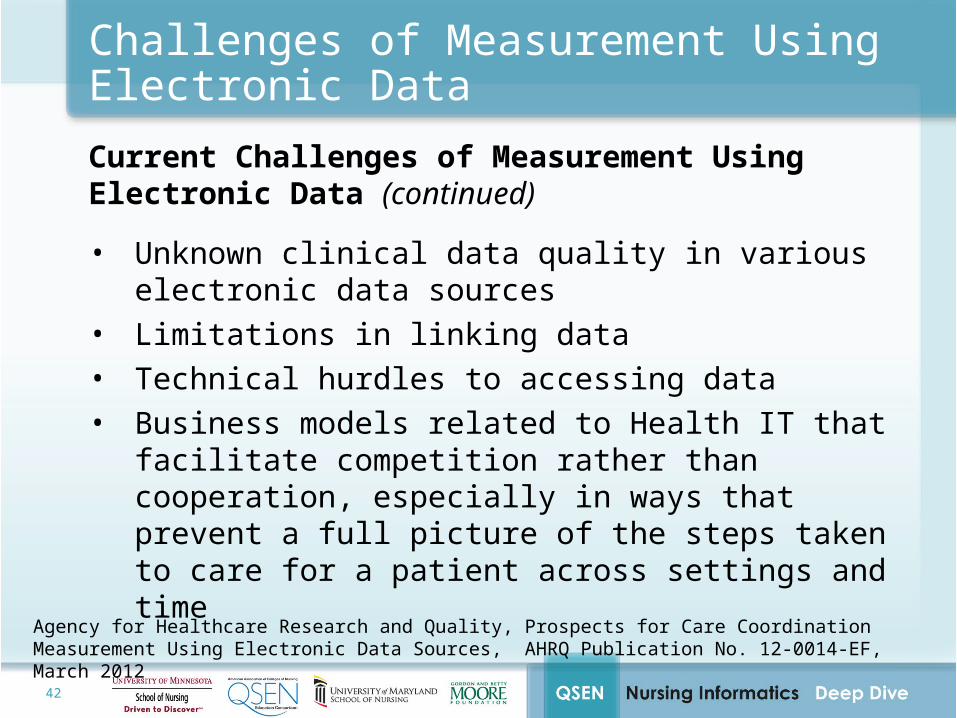
Current Challenges of Measurement Using Electronic Data (continued)
• Unknown clinical data quality in various electronic data sources
• Limitations in linking data• Technical hurdles to accessing data• Business models related to Health IT that facilitate
competition rather than cooperation, especially in ways that prevent a full picture of the steps taken to care for a patient across settings and time
Agency for Healthcare Research and Quality, Prospects for Care Coordination Measurement Using Electronic Data Sources, AHRQ Publication No. 12-0014-EF, March 2012
43 43
Percentage of heart failure patients discharged
home with written instructions or educational
material given to patient or caregiver at discharge
Case Example
44 44
It is conservatively estimated that centers spend 22.2 minutes per heart failure case to abstract the data, which in aggregate amounts to more than 400,000 person-hours spent each year by US hospitals
Fonarow, G., & Peterson, E. (2009). Heart Failure Performance Measures and Outcomes: Real or Illusory Gains. JAMA, 7, 792-794.
Retrieving Information for Quality Measurement
45 45
–Mostly retrospective
–Data are in different sources
–Different kinds of data that do not map
–Humans are “creating” the data
Fonarow, G., & Peterson, E. (2009). Heart Failure Performance Measures and Outcomes: Real or Illusory Gains.
JAMA, 7, 792-794.
Retrieving Information for Quality Measurement
46
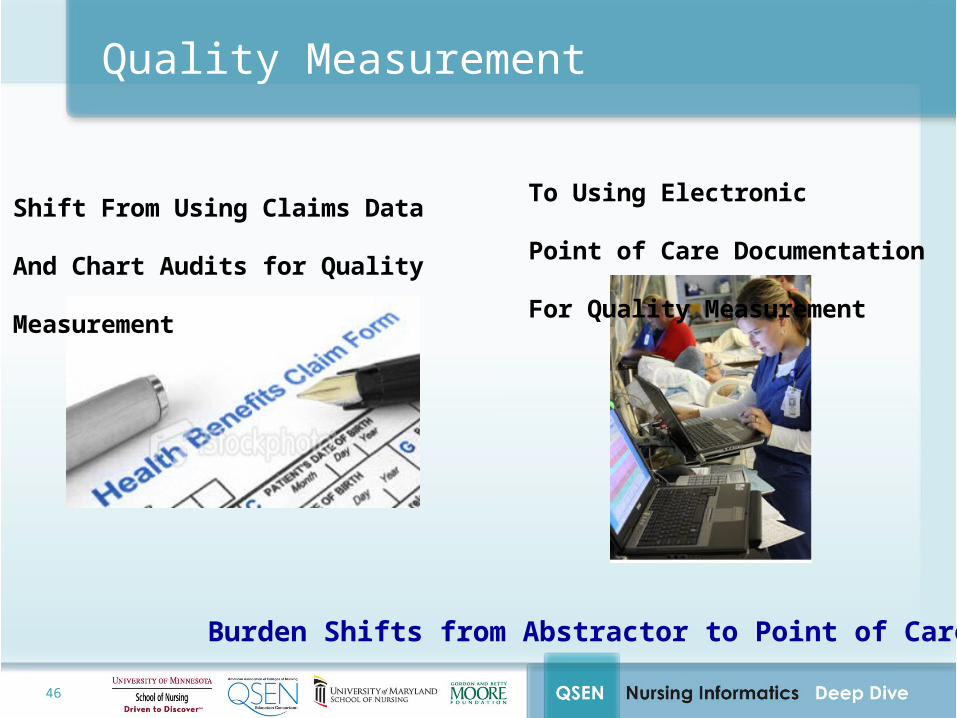
Quality Measurement
Shift From Using Claims Data
And Chart Audits for Quality
Measurement
To Using Electronic
Point of Care Documentation
For Quality Measurement
Burden Shifts from Abstractor to Point of Care
47
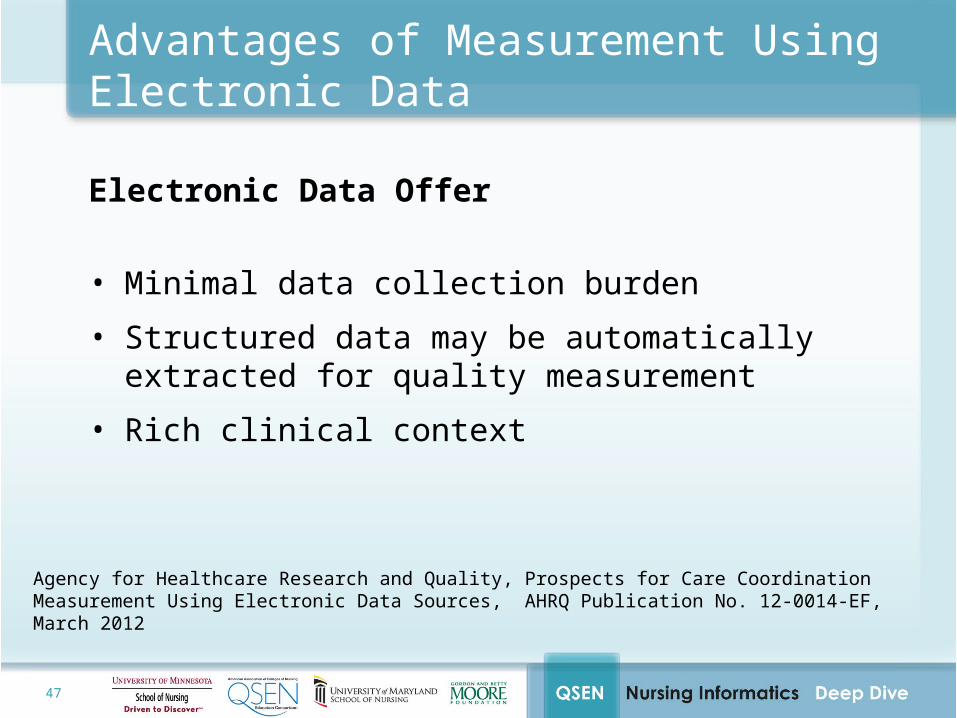
Advantages of Measurement Using Electronic Data
Electronic Data Offer
• Minimal data collection burden
• Structured data may be automatically extracted for quality measurement
• Rich clinical context
Agency for Healthcare Research and Quality, Prospects for Care Coordination Measurement Using Electronic Data Sources, AHRQ Publication No. 12-0014-EF, March 2012
48
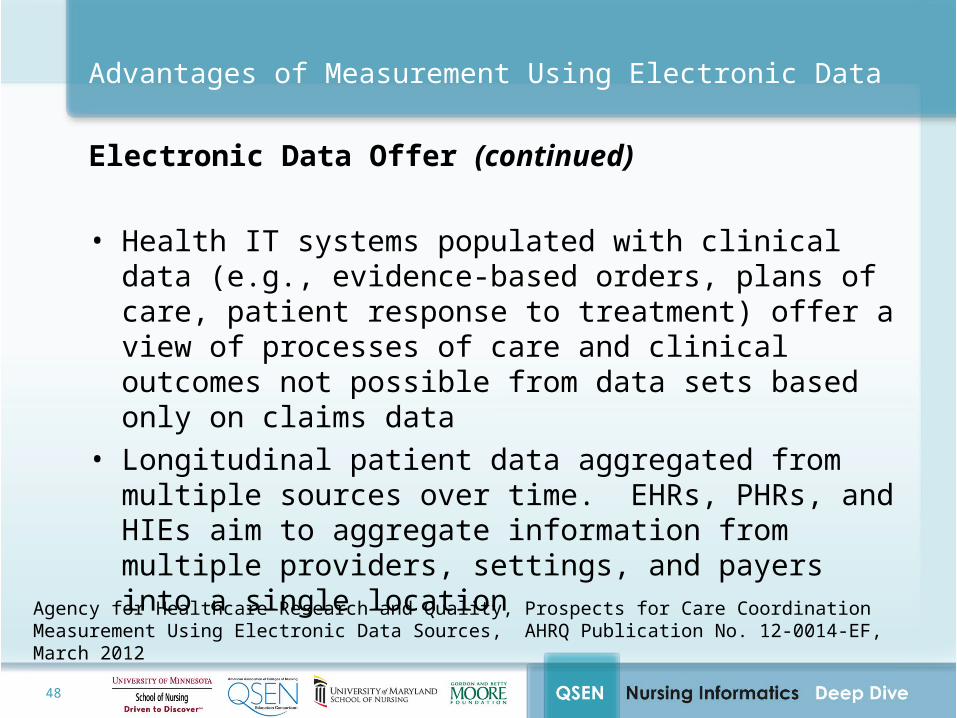
Electronic Data Offer (continued)
• Health IT systems populated with clinical data (e.g., evidence-based orders, plans of care, patient response to treatment) offer a view of processes of care and clinical outcomes not possible from data sets based only on claims data
• Longitudinal patient data aggregated from multiple sources over time. EHRs, PHRs, and HIEs aim to aggregate information from multiple providers, settings, and payers into a single location
Advantages of Measurement Using Electronic Data
Agency for Healthcare Research and Quality, Prospects for Care Coordination Measurement Using Electronic Data Sources, AHRQ Publication No. 12-0014-EF, March 2012
49
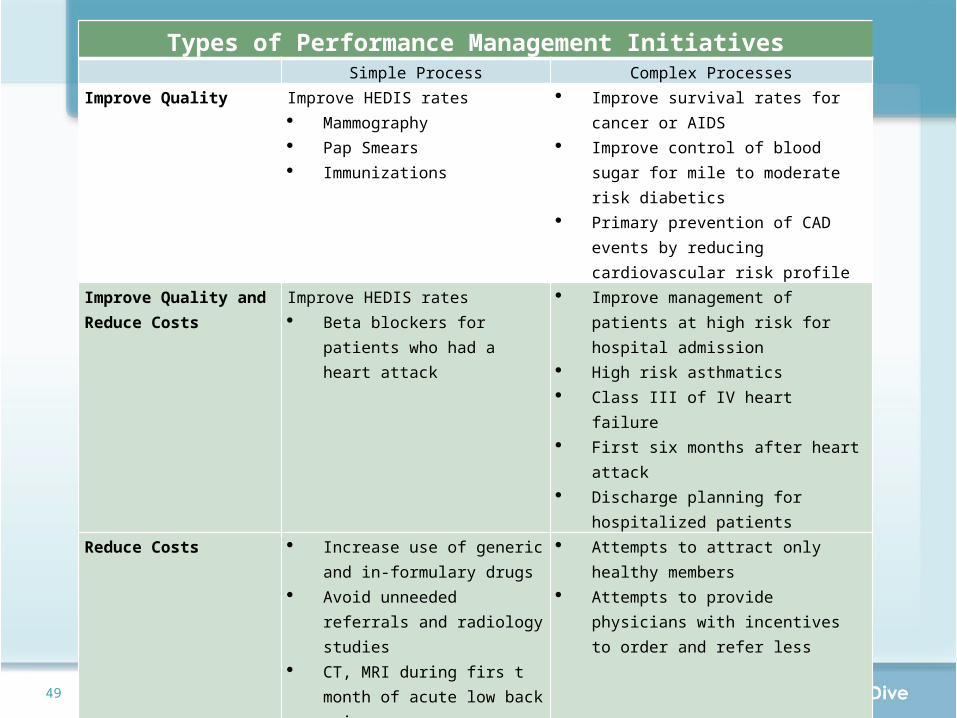
Types of Performance Management Initiatives Simple Process Complex ProcessesImprove Quality Improve HEDIS rates
Mammography Pap Smears Immunizations
Improve survival rates for cancer or AIDS Improve control of blood sugar for mile to
moderate risk diabetics Primary prevention of CAD events by
reducing cardiovascular risk profile
Improve Quality and Reduce Costs
Improve HEDIS rates Beta blockers for patients who
had a heart attack
Improve management of patients at high risk for hospital admission
High risk asthmatics Class III of IV heart failure First six months after heart attack Discharge planning for hospitalized
patientsReduce Costs Increase use of generic and in-
formulary drugs Avoid unneeded referrals and
radiology studies CT, MRI during firs t month of
acute low back pain
Attempts to attract only healthy members Attempts to provide physicians with
incentives to order and refer less
Typical Methods Evidence based guidelines Reminders, alerts, Performance measurement with
process variables
Consensus based algorithms and protocols
Patient education Care managers
Enabling Technologies Reminders integrated into electronic health records
Data warehouse with comparative quality measures
Protocol driven team based are supported by workflow automation
Outcomes data collection systems including patient satisfaction and patient reported outcomes

50
What Makes a Quality Measure Worth Measuring?
51
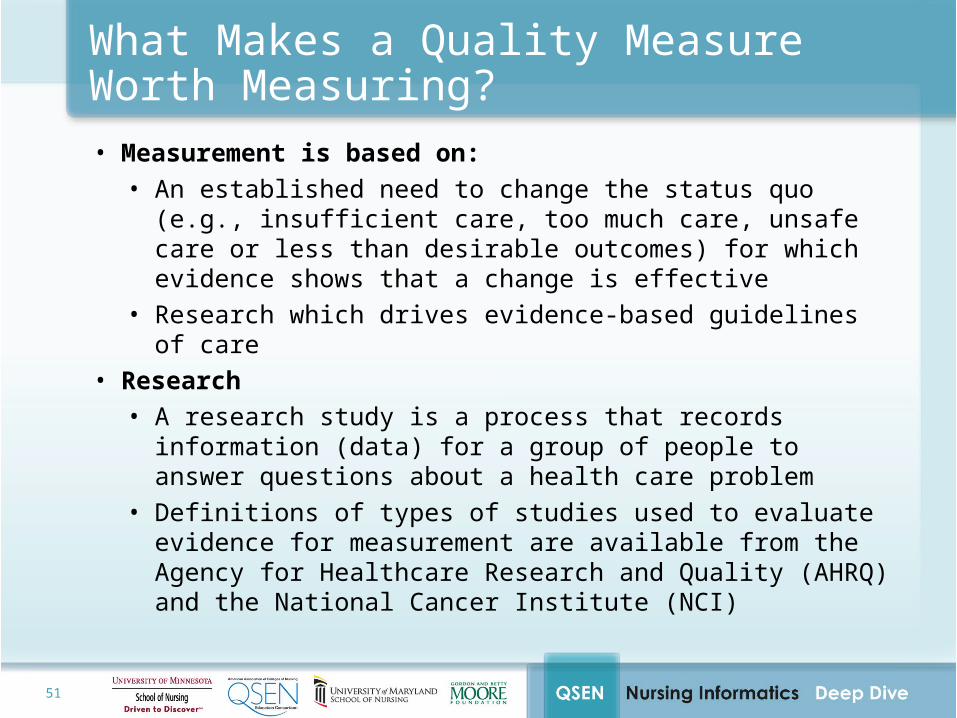
What Makes a Quality Measure Worth Measuring?• Measurement is based on:
• An established need to change the status quo (e.g., insufficient care, too much care, unsafe care or less than desirable outcomes) for which evidence shows that a change is effective
• Research which drives evidence-based guidelines of care• Research
• A research study is a process that records information (data) for a group of people to answer questions about a health care problem
• Definitions of types of studies used to evaluate evidence for measurement are available from the Agency for Healthcare Research and Quality (AHRQ) and the National Cancer Institute (NCI)
52
Evidence-Based Practice Guidelines
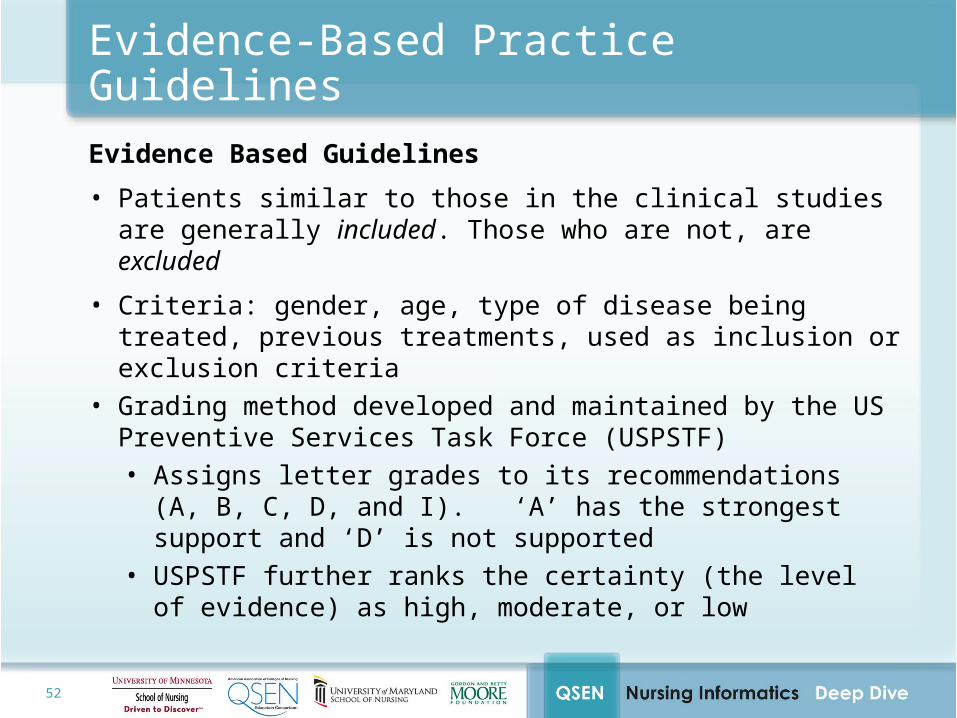
Evidence Based Guidelines
• Patients similar to those in the clinical studies are generally included. Those who are not, are excluded
• Criteria: gender, age, type of disease being treated, previous treatments, used as inclusion or exclusion criteria
• Grading method developed and maintained by the US Preventive Services Task Force (USPSTF) • Assigns letter grades to its recommendations (A, B, C, D,
and I). ‘A’ has the strongest support and ‘D’ is not supported
• USPSTF further ranks the certainty (the level of evidence) as high, moderate, or low
53
Evidence-Based Practice Guidelines
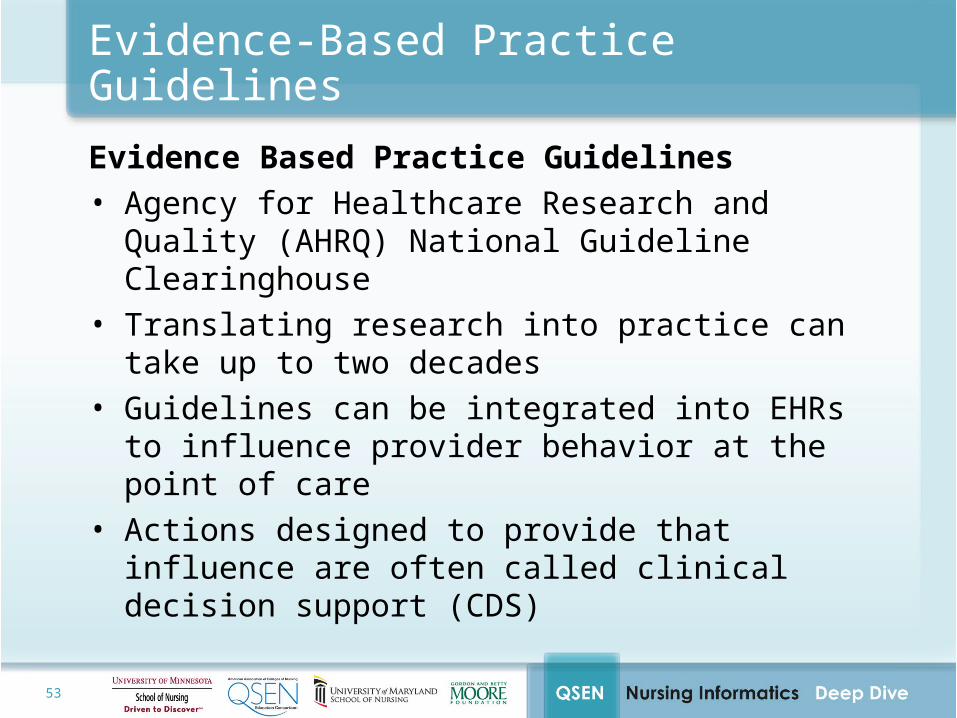
Evidence Based Practice Guidelines• Agency for Healthcare Research and Quality (AHRQ)
National Guideline Clearinghouse• Translating research into practice can take up to two
decades• Guidelines can be integrated into EHRs to influence
provider behavior at the point of care • Actions designed to provide that influence are often called
clinical decision support (CDS)
54
What is the Connection between Clinical Decision Support and
Quality Measurement?
55
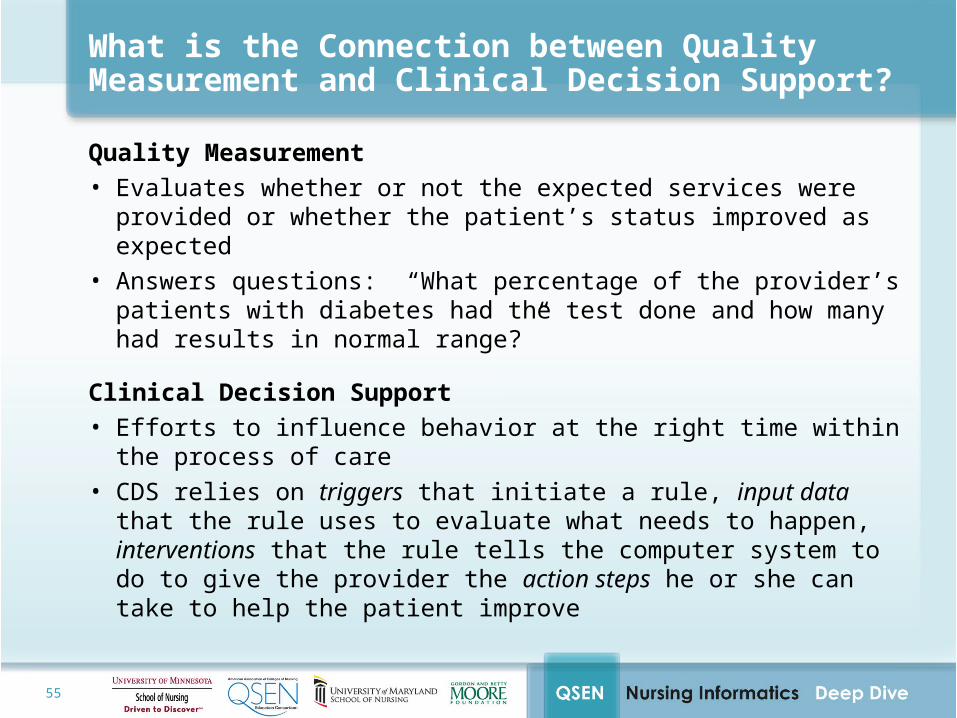
What is the Connection between Quality Measurement and Clinical Decision Support?Quality Measurement• Evaluates whether or not the expected services were provided or
whether the patient’s status improved as expected • Answers questions: “What percentage of the provider’s patients
with diabetes had the test done and how many had results in normal range?”
Clinical Decision Support• Efforts to influence behavior at the right time within the process of
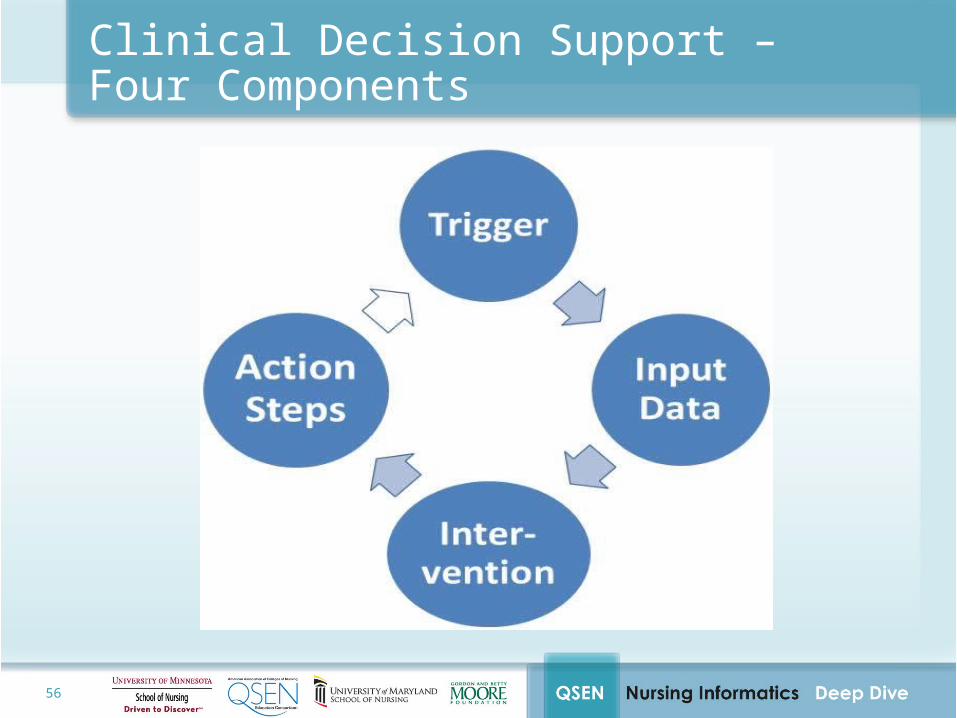
care• CDS relies on triggers that initiate a rule, input data that the rule
uses to evaluate what needs to happen, interventions that the rule tells the computer system to do to give the provider the action steps he or she can take to help the patient improve
56
Clinical Decision Support – Four Components
57
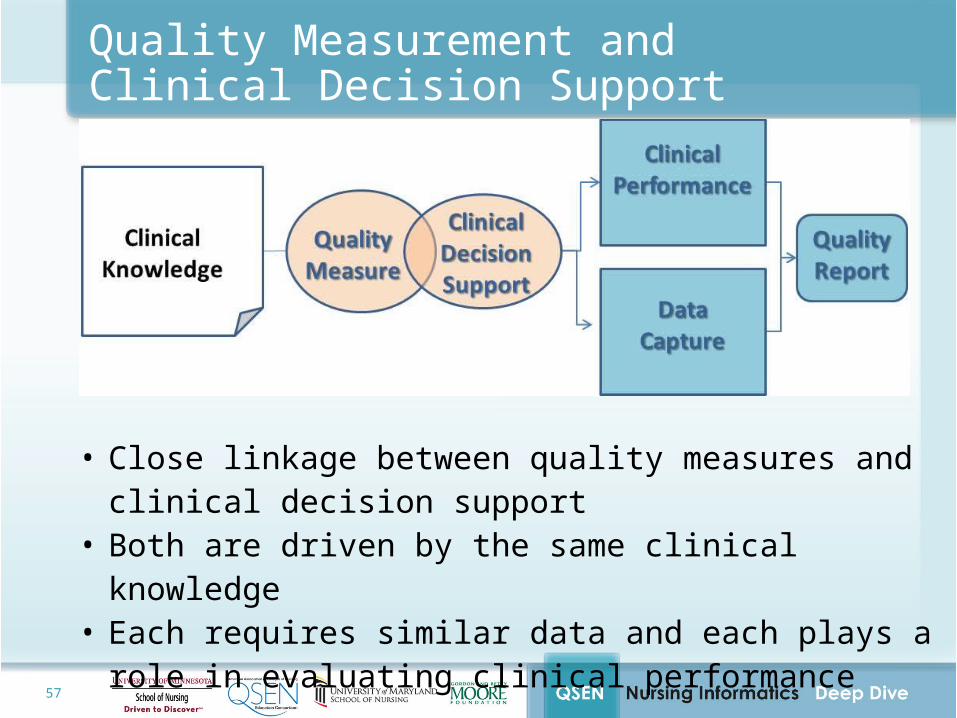
Quality Measurement and Clinical Decision Support
• Close linkage between quality measures and clinical decision support
• Both are driven by the same clinical knowledge• Each requires similar data and each plays a role in evaluating
clinical performance
58
What is the Measure of a Measure?
59
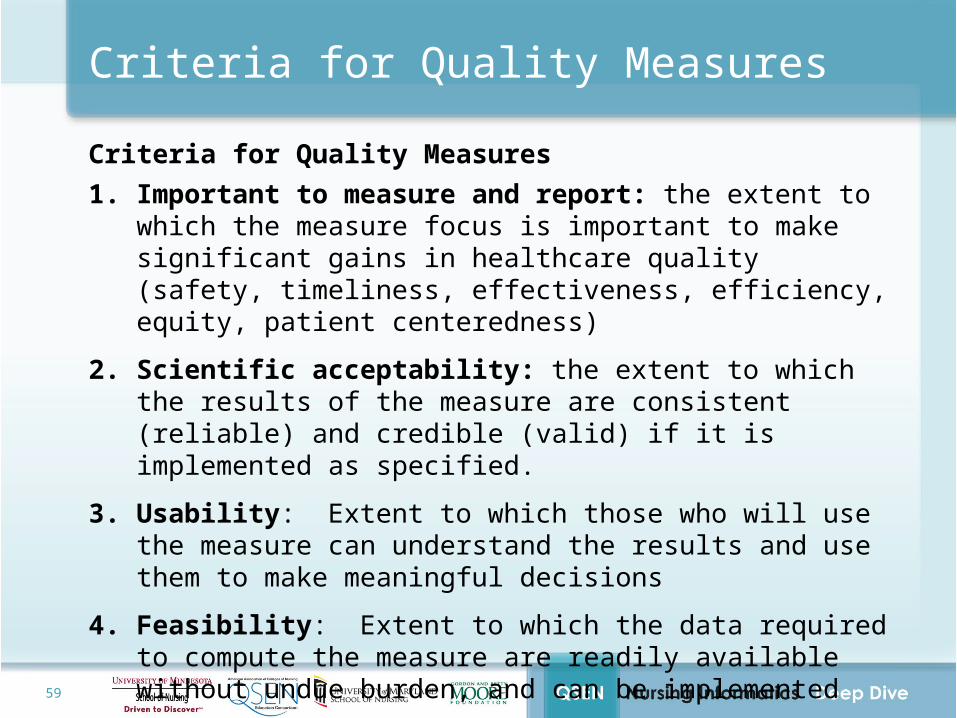
Criteria for Quality Measures
Criteria for Quality Measures1. Important to measure and report: the extent to which the measure
focus is important to make significant gains in healthcare quality (safety, timeliness, effectiveness, efficiency, equity, patient centeredness)
2. Scientific acceptability: the extent to which the results of the measure are consistent (reliable) and credible (valid) if it is implemented as specified.
3. Usability: Extent to which those who will use the measure can understand the results and use them to make meaningful decisions
4. Feasibility: Extent to which the data required to compute the measure are readily available without undue burden, and can be implemented
60
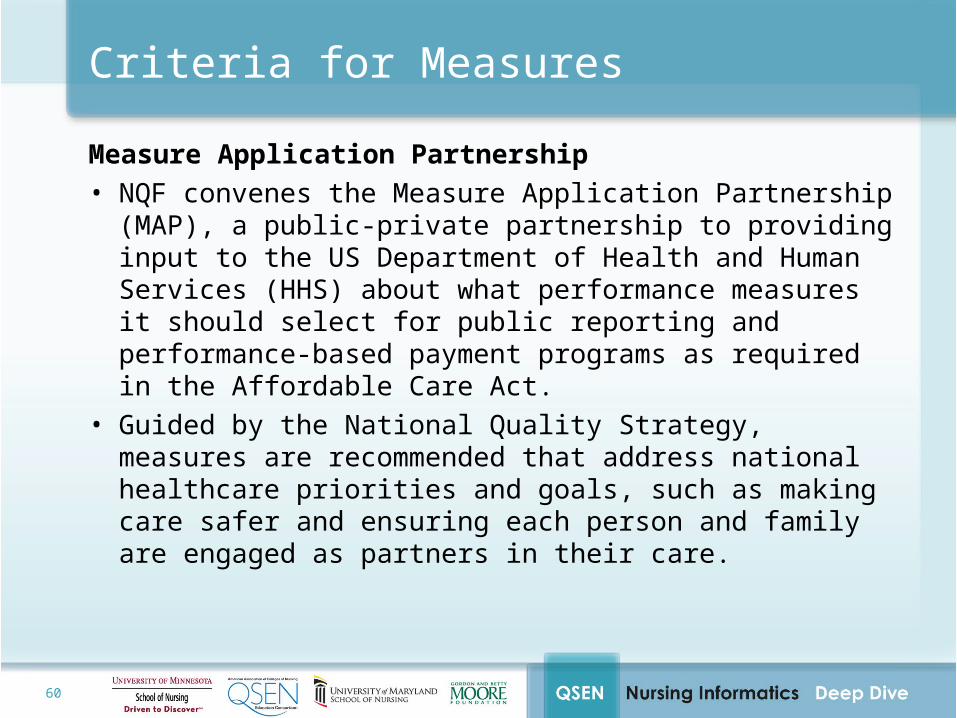
Criteria for Measures
Measure Application Partnership• NQF convenes the Measure Application Partnership (MAP),
a public-private partnership to providing input to the US Department of Health and Human Services (HHS) about what performance measures it should select for public reporting and performance-based payment programs as required in the Affordable Care Act.
• Guided by the National Quality Strategy, measures are recommended that address national healthcare priorities and goals, such as making care safer and ensuring each person and family are engaged as partners in their care.
61
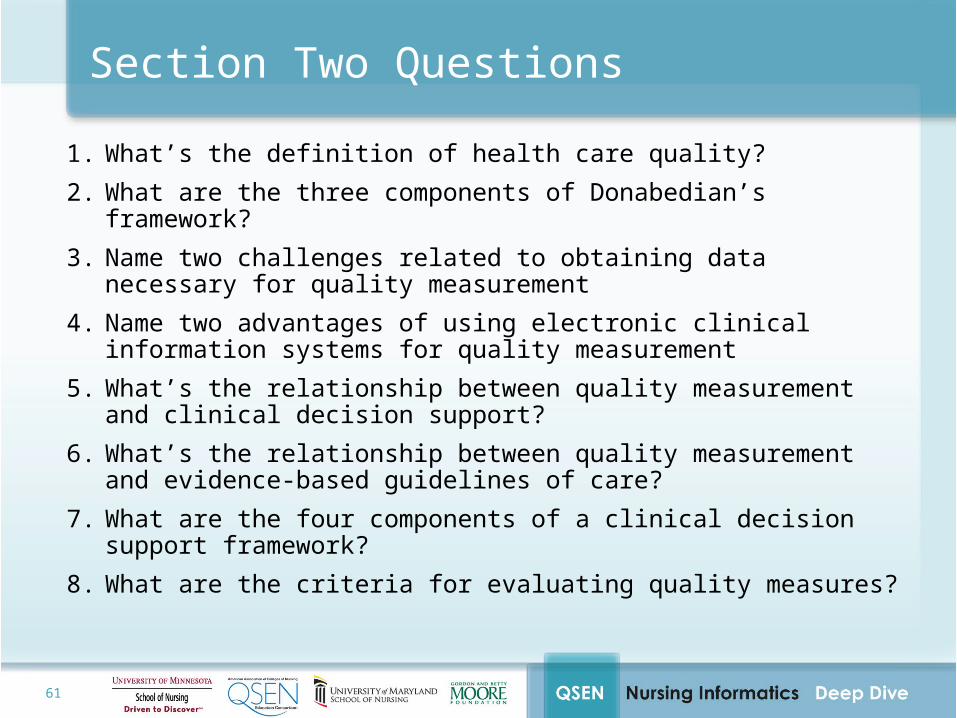
Section Two Questions
1. What’s the definition of health care quality?
2. What are the three components of Donabedian’s framework?
3. Name two challenges related to obtaining data necessary for quality measurement
4. Name two advantages of using electronic clinical information systems for quality measurement
5. What’s the relationship between quality measurement and clinical decision support?
6. What’s the relationship between quality measurement and evidence-based guidelines of care?
7. What are the four components of a clinical decision support framework?
8. What are the criteria for evaluating quality measures?

62
Teaching Methods and Strategies
1. Lecture
2. Discussion Board
– Present safety and quality scenarios within healthcare organizations
– Present challenges student may face as a member of an organizational safety/quality committee
3. White papers answering questions posed on the prior slide
4. Development of use cases for each of the safety areas showing how one of the organizations provides tools for improving safety
5. Review of public testimonies and calls for comments – have the students respond to the national posts for comments

63
Questions &
Discussion
64
Section Three
65
Informatics Tools to Measure Quality and Promote Safety
66
Learning Objectives
Informatics Tools to Measure Quality and Promote Safety
At the completion of this session, the learner will:
• Define data, information, and knowledge • Describe components of an architecture framework for
clinical information systems• Describe the value of structured data models• Describe standards necessary for the electronic health
record
67
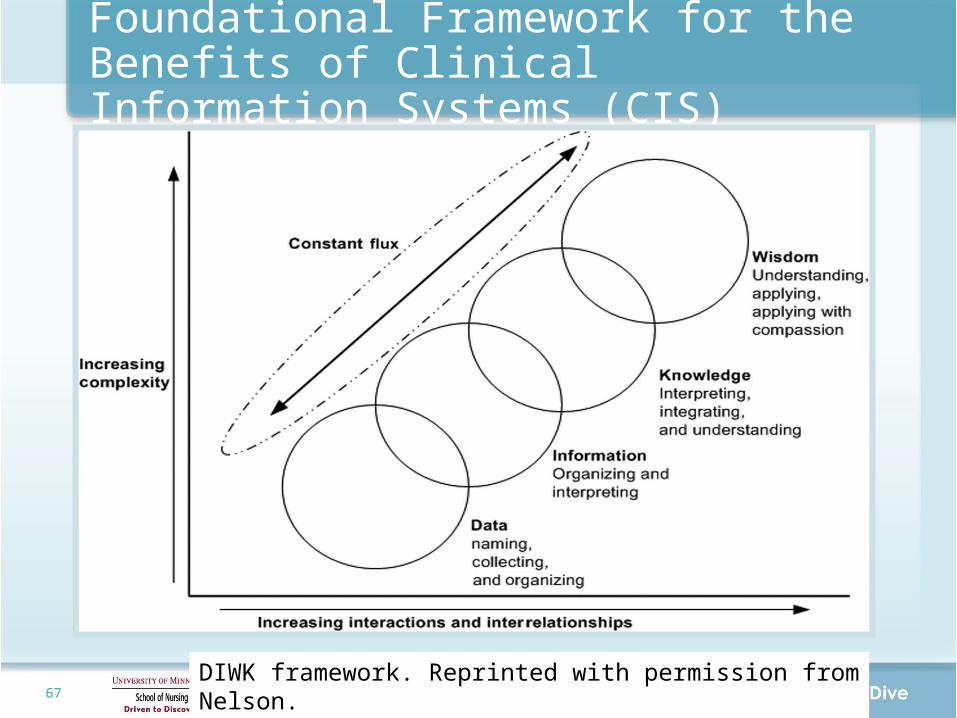
Foundational Framework for the Benefits of Clinical Information Systems (CIS)
DIWK framework. Reprinted with permission from Nelson.
68
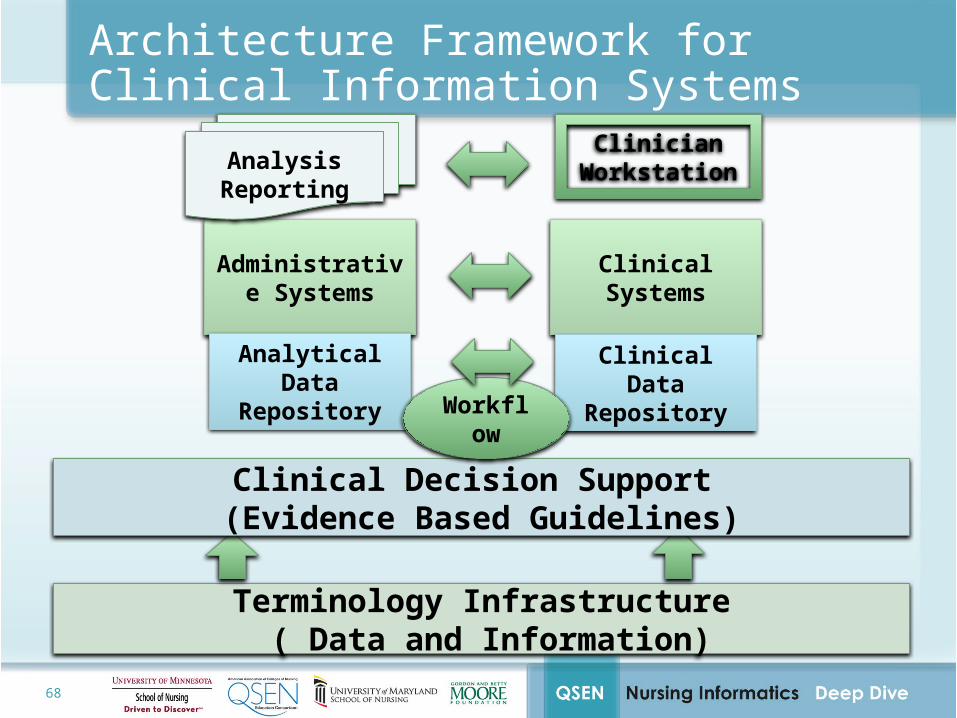
Architecture Framework for Clinical Information Systems
Administrative Systems Clinical Systems
Analytical Data Repository
Clinical Data Repository
Terminology Infrastructure ( Data and Information)
Clinical Decision Support (Evidence Based Guidelines)
Workflow
Analysis Reporting
Clinician Workstation
69
Definitions
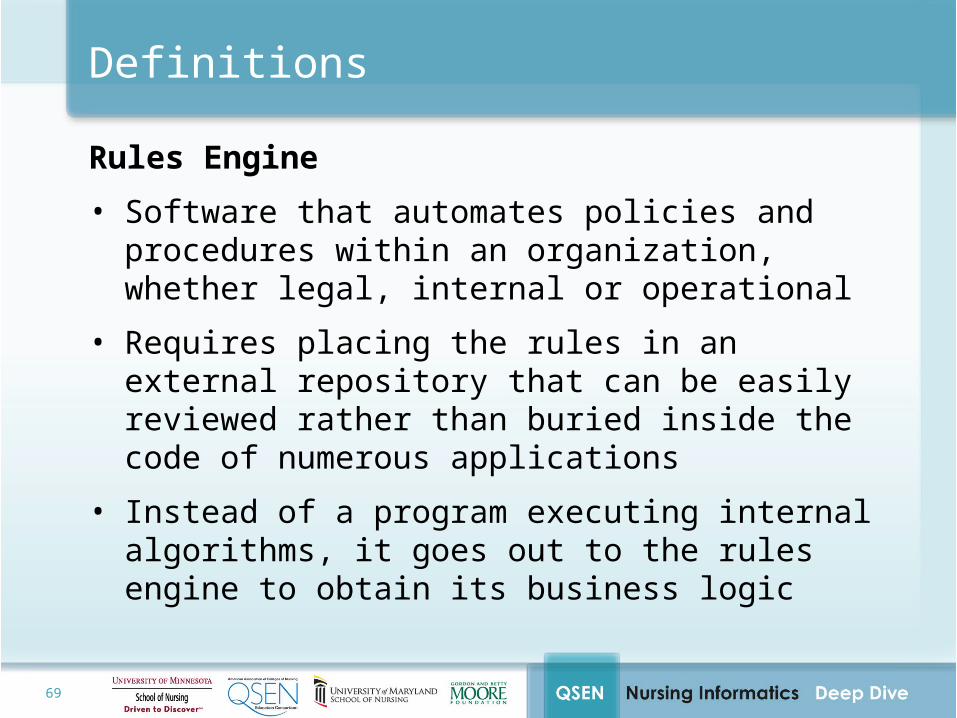
Rules Engine
• Software that automates policies and procedures within an organization, whether legal, internal or operational
• Requires placing the rules in an external repository that can be easily reviewed rather than buried inside the code of numerous applications
• Instead of a program executing internal algorithms, it goes out to the rules engine to obtain its business logic
http://java-source.net/open-source/rule-engines
70
Definitions
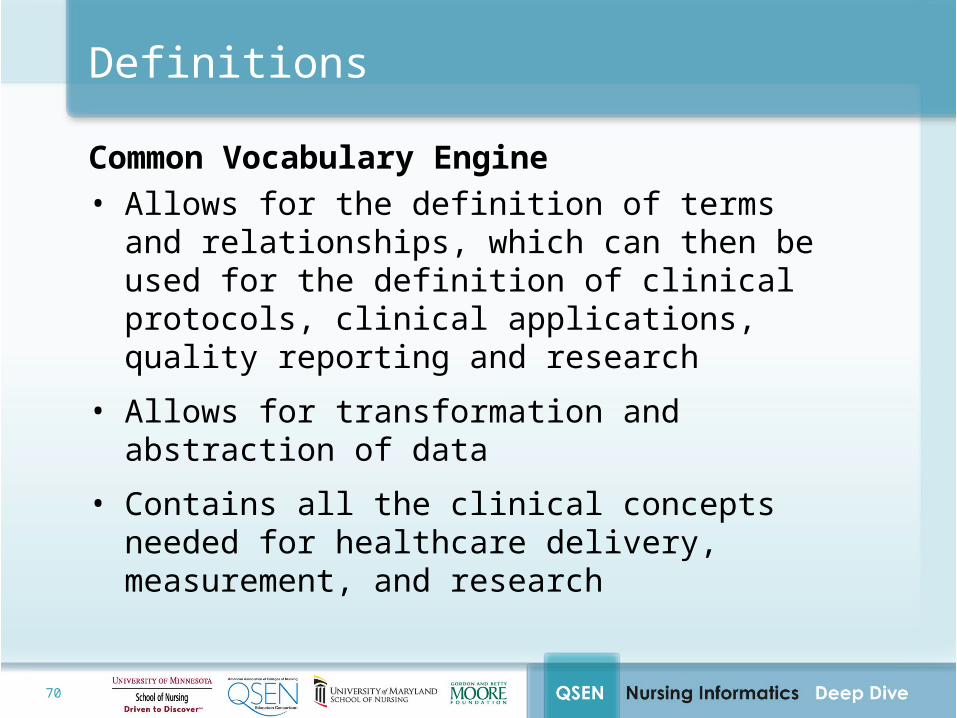
Common Vocabulary Engine • Allows for the definition of terms and relationships, which
can then be used for the definition of clinical protocols, clinical applications, quality reporting and research
• Allows for transformation and abstraction of data
• Contains all the clinical concepts needed for healthcare delivery, measurement, and research
Pedersen, T. & Jensen, C. Clinical data warehousing—A survey. Retrieved from http://www.google.com/url?sa=t&rct=j&q=&esrc=s&source=web&cd=11&ved=0CEwQFjAAOAo&url=http%3A%2F%2Flibrary.med.utah.edu%2Fcyprus%2Fproceedings%2Fmedicon98%2Fmedicon98.pedersen.torben.pdf&ei=VToTUP_2MtLxqQHNiIGoDg&usg=AFQjCNHJt_oJLTJgXsUdzeOrZQLez6FdXQ
71
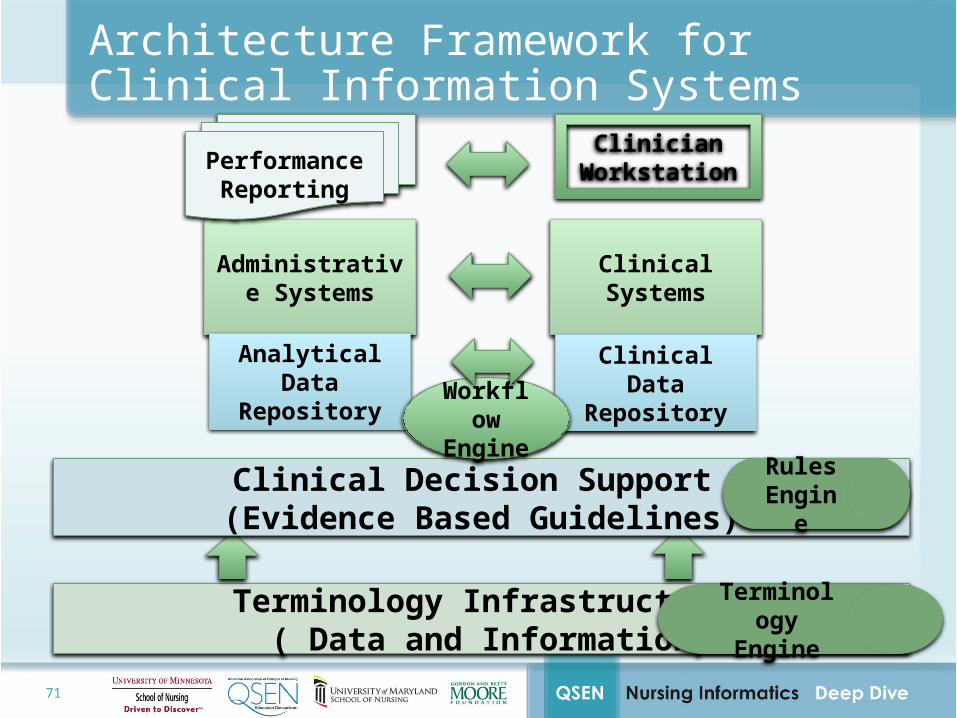
Architecture Framework for Clinical Information Systems
Administrative Systems Clinical Systems
Analytical Data Repository
Clinical Data Repository
Terminology Infrastructure ( Data and Information)
Clinical Decision Support (Evidence Based Guidelines)
WorkflowEngine
Performance Reporting
Clinician Workstation
Rules Engine
Terminology Engine
72
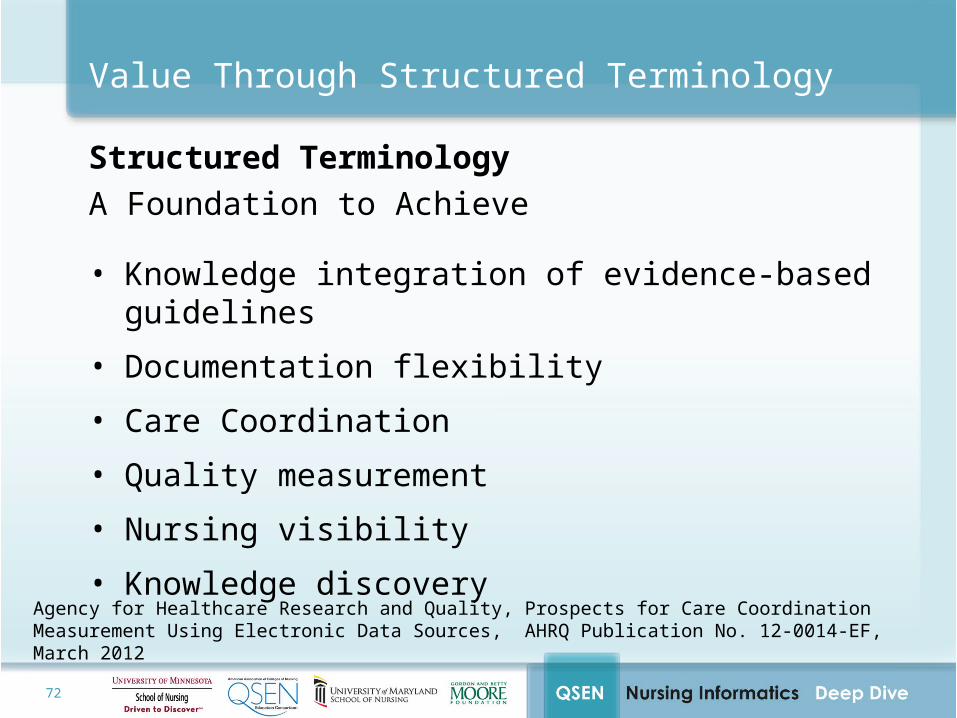
Structured TerminologyA Foundation to Achieve
• Knowledge integration of evidence-based guidelines
• Documentation flexibility
• Care Coordination
• Quality measurement
• Nursing visibility
• Knowledge discovery
Value Through Structured Terminology
Agency for Healthcare Research and Quality, Prospects for Care Coordination Measurement Using Electronic Data Sources, AHRQ Publication No. 12-0014-EF, March 2012
73
What Standards Go Into the Common Vocabulary Engine?
What Standards are Needed for the Electronic Health Record?
74
Data Standards and Organizations
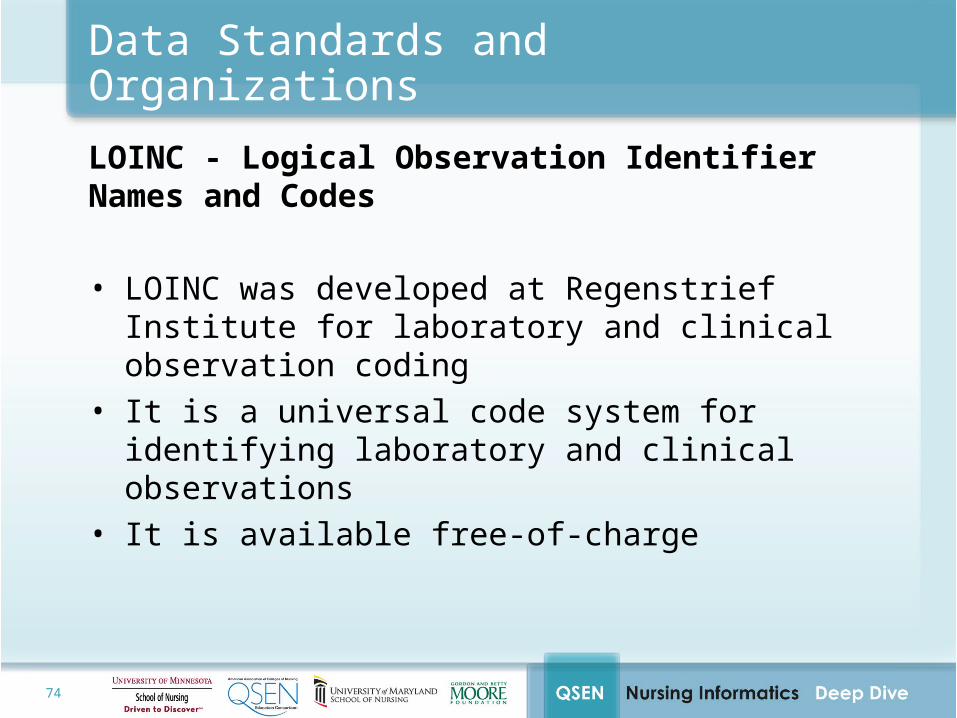
LOINC - Logical Observation Identifier Names and Codes
• LOINC was developed at Regenstrief Institute for laboratory and clinical observation coding
• It is a universal code system for identifying laboratory and clinical observations
• It is available free-of-charge
75
Data Standards and Organizations
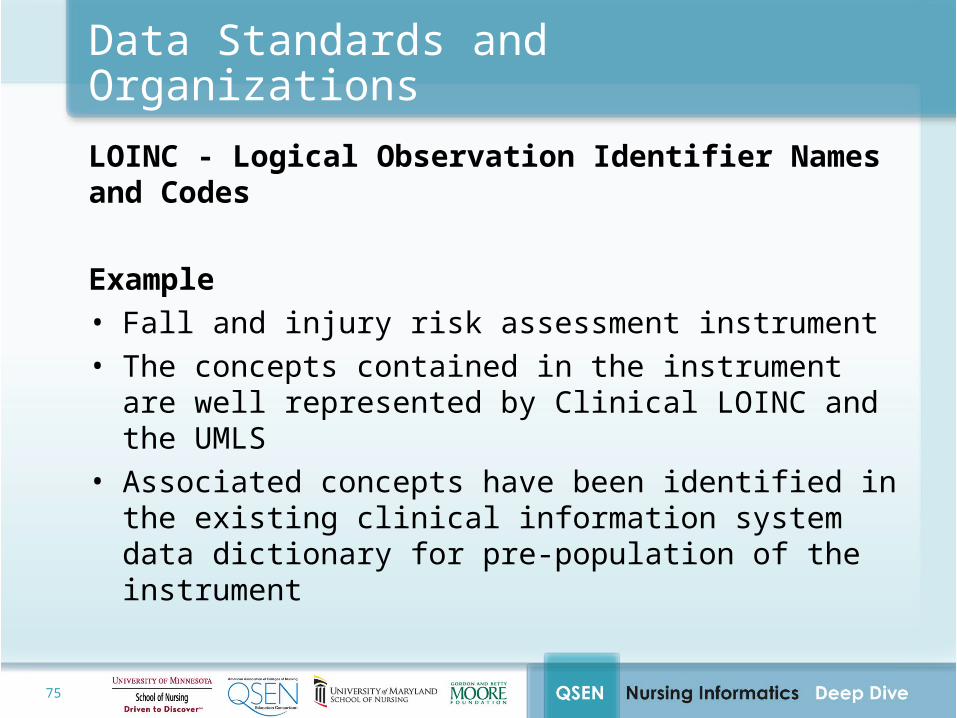
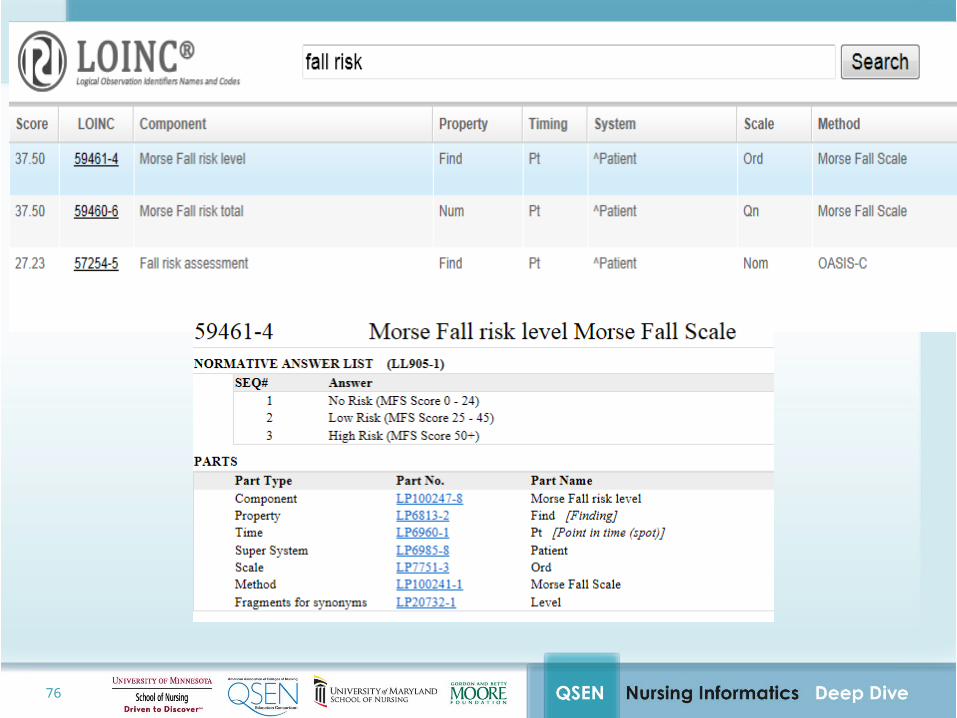
LOINC - Logical Observation Identifier Names and Codes
Example• Fall and injury risk assessment instrument • The concepts contained in the instrument are well
represented by Clinical LOINC and the UMLS• Associated concepts have been identified in the existing
clinical information system data dictionary for pre-population of the instrument
76
77
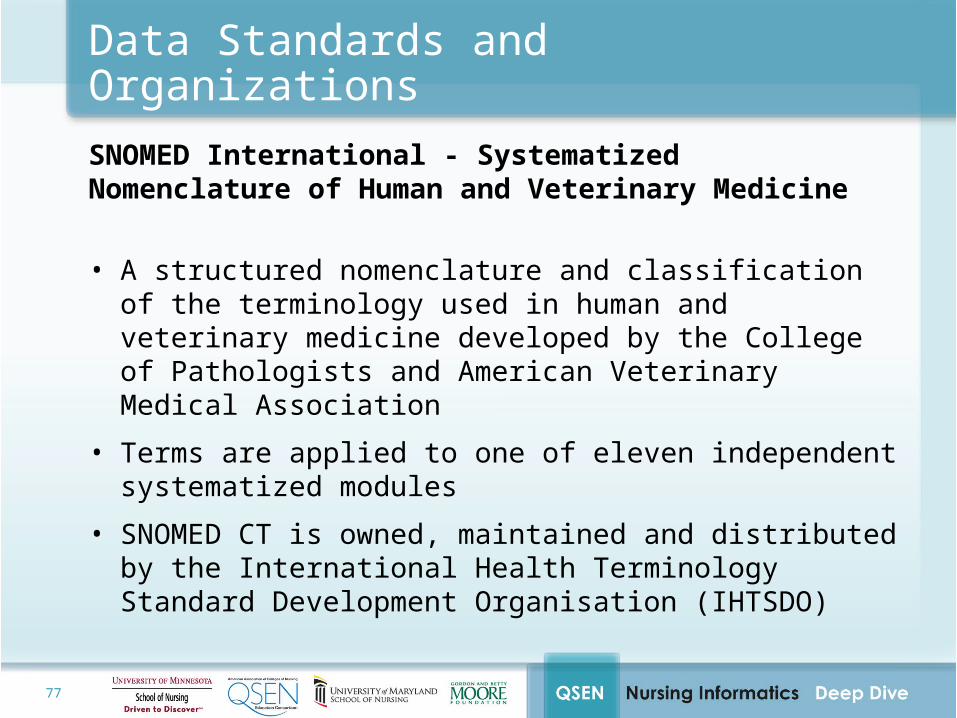
Data Standards and Organizations
SNOMED International - Systematized Nomenclature of Human and Veterinary Medicine
• A structured nomenclature and classification of the terminology used in human and veterinary medicine developed by the College of Pathologists and American Veterinary Medical Association
• Terms are applied to one of eleven independent systematized modules
• SNOMED CT is owned, maintained and distributed by the International Health Terminology Standard Development Organisation (IHTSDO)
78
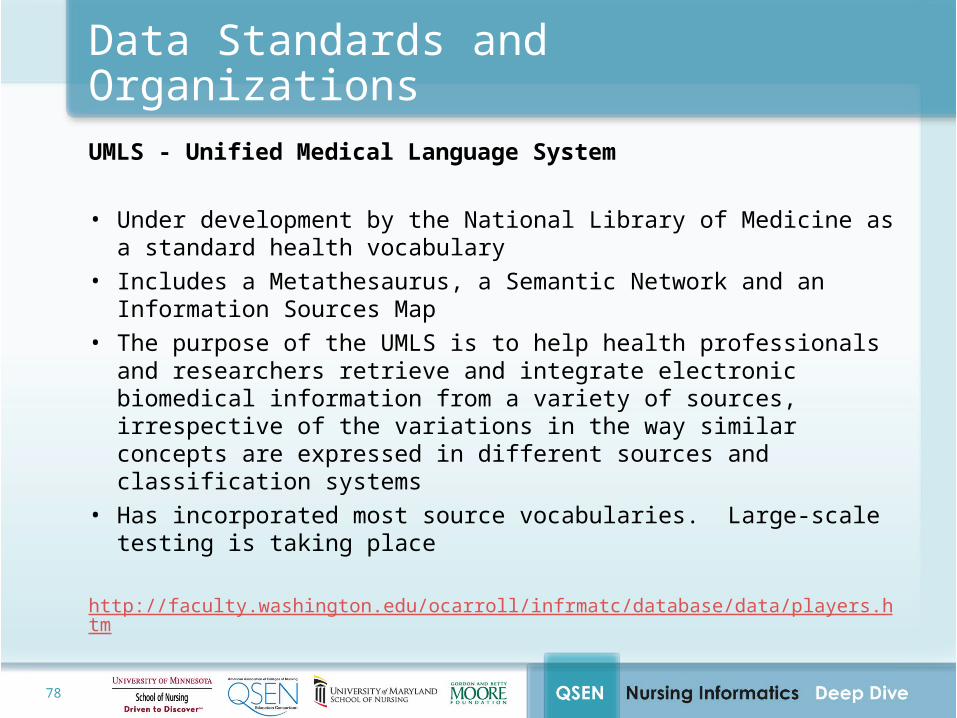
Data Standards and Organizations
UMLS - Unified Medical Language System
• Under development by the National Library of Medicine as a standard health vocabulary
• Includes a Metathesaurus, a Semantic Network and an Information Sources Map
• The purpose of the UMLS is to help health professionals and researchers retrieve and integrate electronic biomedical information from a variety of sources, irrespective of the variations in the way similar concepts are expressed in different sources and classification systems
• Has incorporated most source vocabularies. Large-scale testing is taking place
http://faculty.washington.edu/ocarroll/infrmatc/database/data/players.htm
79
Section Three Questions
1. Describe the definition of data, information, and knowledge
2. Identify one benefit of using aggregated code data for quality measurement
3. Describe one of the standards necessary to extract data for performance measurement and improvement
4. Describe the role of LOINC and SNOMED in coding data for health IT
5. Describe one challenge in extracting data for quality measurement
6. Write the definition of a rules engine and vocabulary engine
7. What is the most important component of the health IT architecture

80
Teaching Methods and Strategies
1. Lecture
2. Discussion Board
– Present safety and quality scenarios within healthcare organizations
– Present challenges student may face as a member of an organizational safety/quality committee
3. White papers answering questions posed on the prior slide
4. Development of use cases for each of the safety areas showing how one of the organizations provides tools for improving safety
5. Review of public testimonies and calls for comments – have the students respond to the national posts for comments

81
Section Four
82
Curriculum Sections
Using Clinical Information Systems to Measure and Improve Outcomes Using
Evidence Based Guidelines
83
What Standards Are Needed for Quality Reporting from the Electronic Health
Record?
84
Learning Objectives
Standards Needed for Electronic Quality Measurement
At the completion of this session, the learner will:
• Describe standards necessary to extract data for quality measurement and performance improvement
• Describe an electronic measure (eMeasure) • Describe the components of a quality measure• Describe the steps related to structuring EHR queries for
quality measurement
85
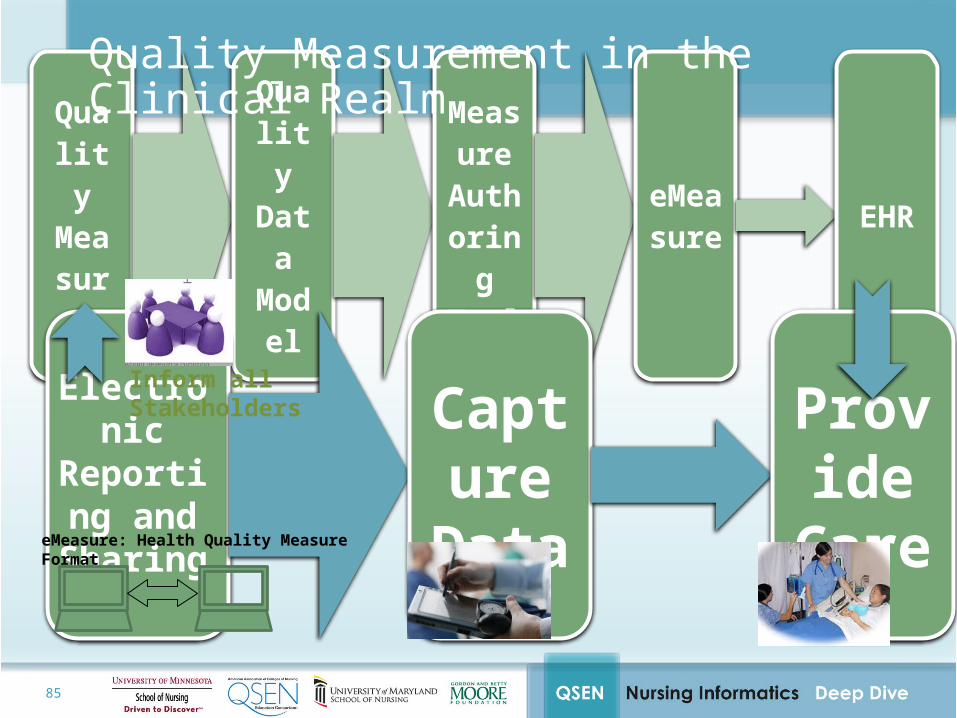
Real-Time Information to Clinician
Quality
Measure
Quality
Data Mod
el
Measure
Authoring
Tool
eMeasure EHR
Develop Performance Measures
Quality Measurement in the Clinical Realm
Electronic
Reporting and Sharing
Capture
Data
Provide
CareeMeasure: Health Quality Measure Format
Inform all Stakeholders
86
Quality Measures
What are Quality Measures?
• Quality measures are tools that help us measure or quantify healthcare processes, outcomes, patient perceptions, and organizational structure and/or systems that are associated with the ability to provide high-quality health care and/or that relate to one or more quality goals for health care
• These goals include: effective, safe, efficient, patient-centered, equitable, and timely care
https://www.cms.gov/Medicare/Quality-Initiatives-Patient-Assessment-Instruments/QualityMeasures/index.html?redirect=/QualityMeasures/03_ElectronicSpecifications.asp
87
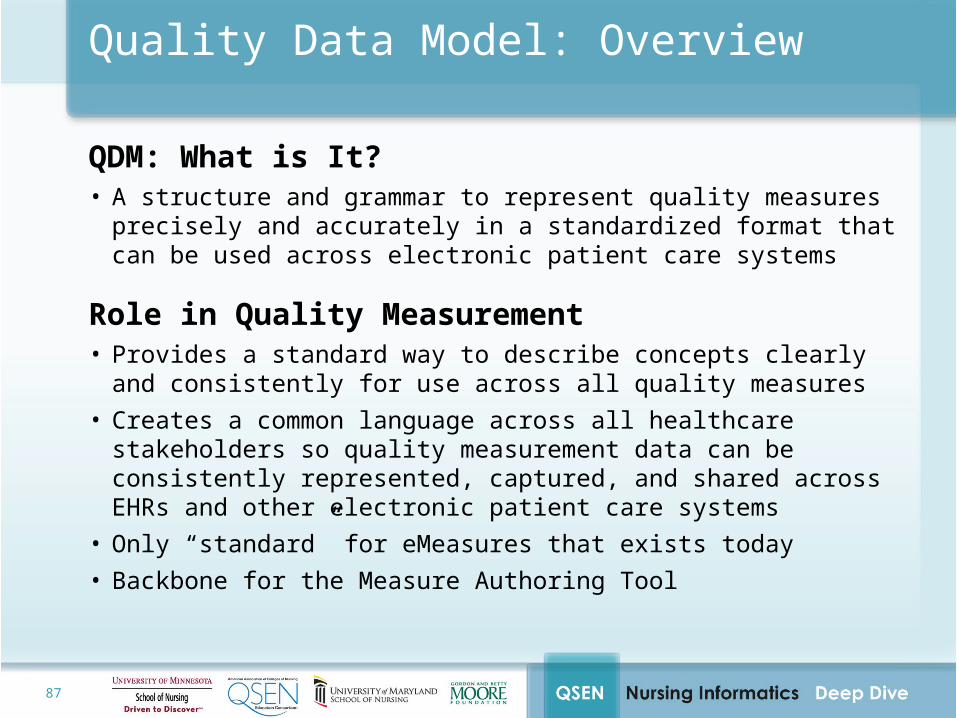
Quality Data Model: Overview
QDM: What is It? • A structure and grammar to represent quality measures precisely and
accurately in a standardized format that can be used across electronic patient care systems
Role in Quality Measurement • Provides a standard way to describe concepts clearly and consistently for use
across all quality measures• Creates a common language across all healthcare stakeholders so quality
measurement data can be consistently represented, captured, and shared across EHRs and other electronic patient care systems
• Only “standard” for eMeasures that exists today• Backbone for the Measure Authoring Tool
88
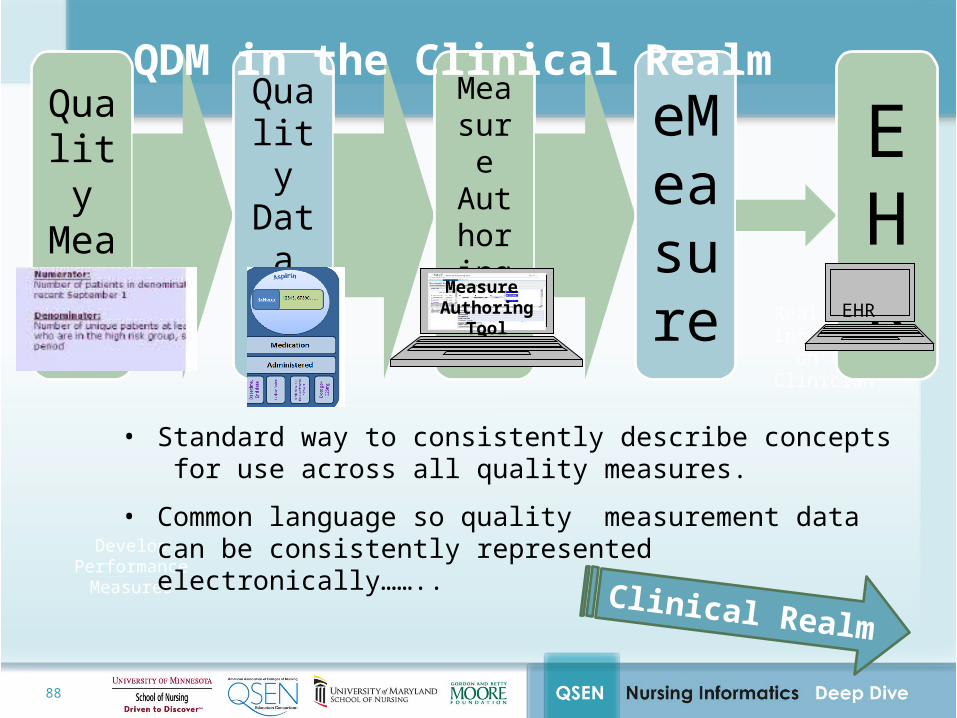
Real-Time Information to Clinician
Quality
Measure
Quality Dat
a Model
Measur
e Authoring
Tool
eMeasure
EHR
Develop Performance Measures
QDM in the Clinical Realm
Measure Authoring Tool
EHR
• Standard way to consistently describe concepts for use across all quality measures.
• Common language so quality measurement data can be consistently represented electronically……..
Clinical Realm
89
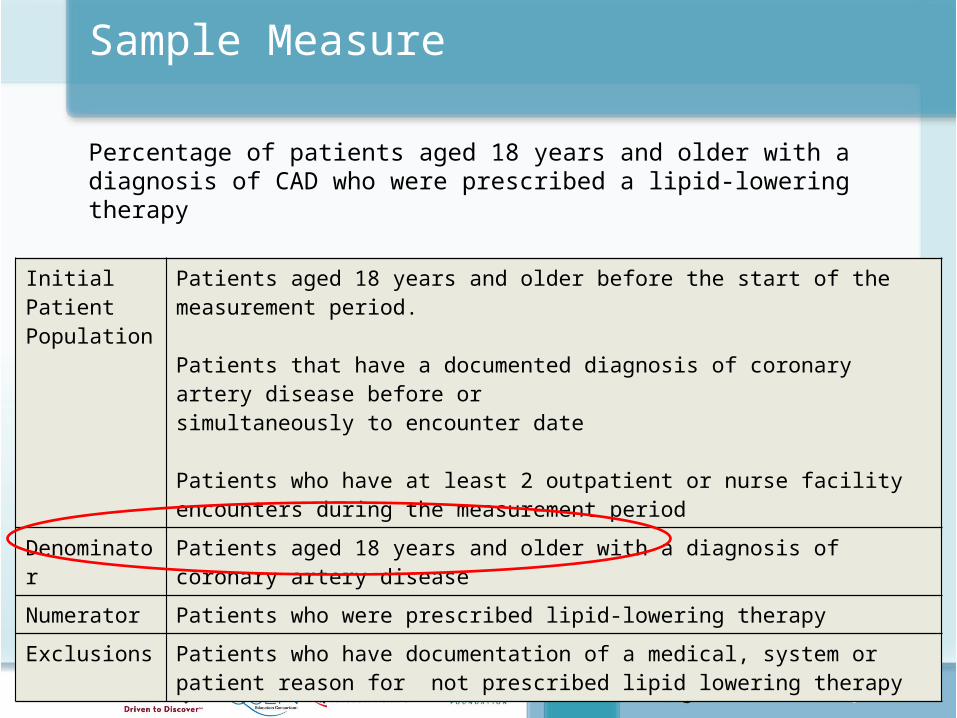
Sample Measure
Percentage of patients aged 18 years and older with a diagnosis of CAD who were prescribed a lipid-lowering therapy
Initial Patient Population
Patients aged 18 years and older before the start of the measurement period.
Patients that have a documented diagnosis of coronary artery disease before orsimultaneously to encounter date
Patients who have at least 2 outpatient or nurse facility encounters during the measurement period
Denominator Patients aged 18 years and older with a diagnosis of coronary artery diseaseNumerator Patients who were prescribed lipid-lowering therapyExclusions Patients who have documentation of a medical, system or patient reason for not
prescribed lipid lowering therapy
90
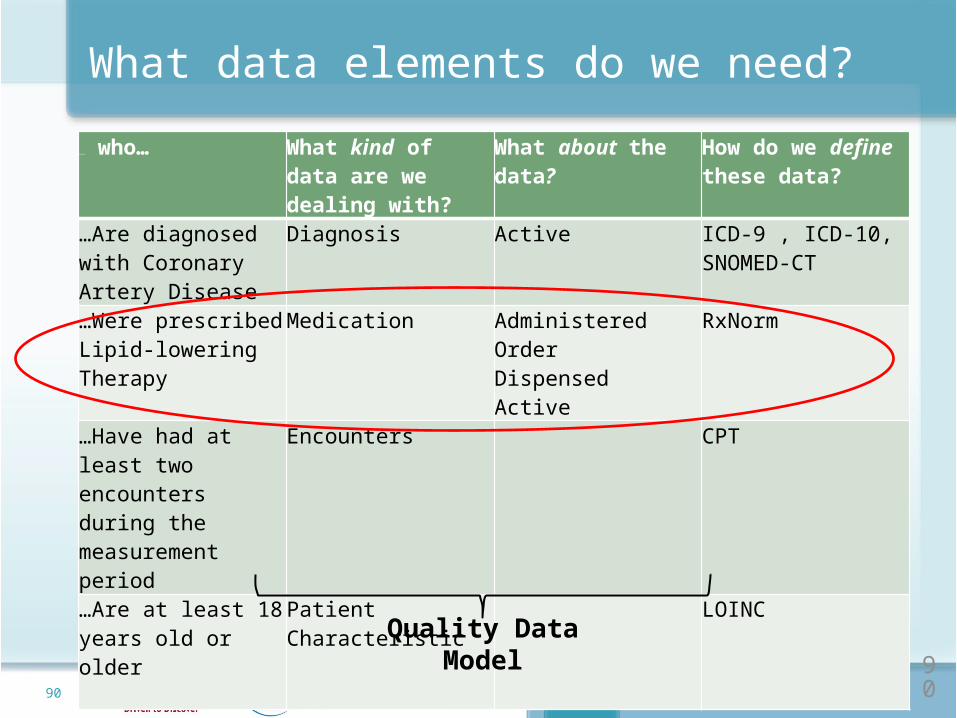
What data elements do we need?
Patients who… What kind of data are we dealing with?
What about the data? How do we define these data?
…Are diagnosed with Coronary Artery Disease
Diagnosis Active ICD-9 , ICD-10, SNOMED-CT
…Were prescribed Lipid-lowering Therapy
Medication AdministeredOrderDispensedActive
RxNorm
…Have had at least two encounters during the measurement period
Encounters CPT
…Are at least 18 years old or older
Patient Characteristic LOINC
90Quality Data
Model

91
Real-Time Information to Clinician
Quality
Measure
Quality Dat
a Model
Measur
e Authoring
Tool
eMeasure
EHR
Develop Performance Measures
91
QDM in the Clinical Realm
Measure Authoring Tool
EHR
• Standard way to consistently describe concepts for use across all quality measures.
• Common language so quality measurement data can be consistently represented electronically……..
Clinical Realm
92
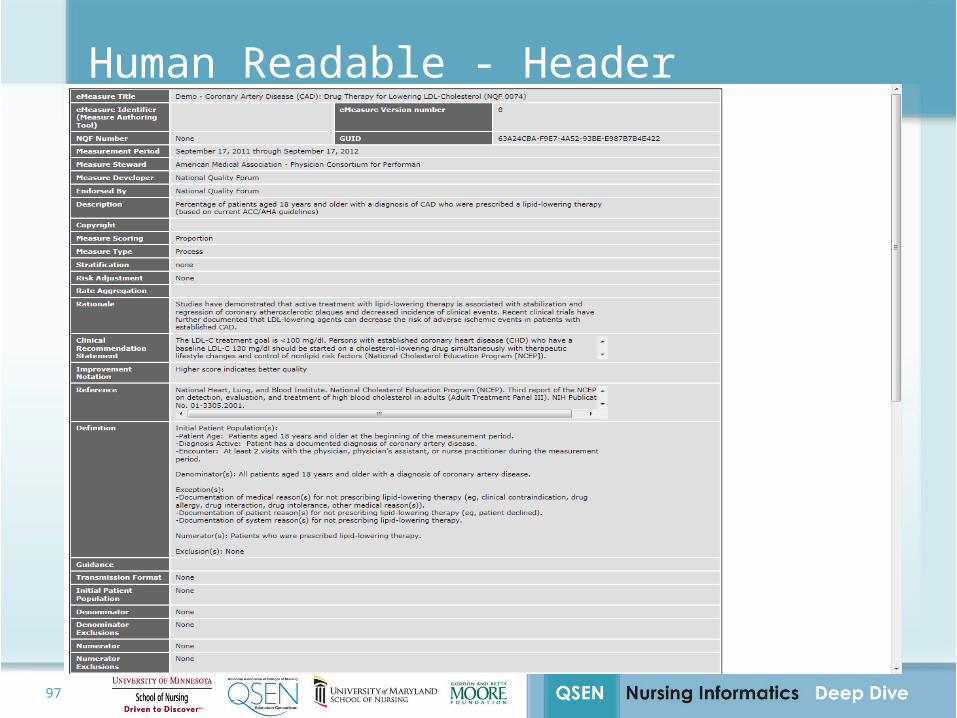
What’s an eMeasure?
An eMeasure is the electronic format for quality measures using the Quality Data Model (QDM) and the Healthcare Quality Measure Format (HQMF), an HL7standard
93
Measure Authoring Tool (MAT)
94
Measure Authoring Tool (MAT): Overview
MAT: What is It? A web-based, publicly-available tool that allows measure developers to create
and maintain quality measures in an electronic format (eMeasures)
Role in Quality Measurement Simplify the process of creating an eMeasure
Standardize how eMeasures are expressed, for greater comparability
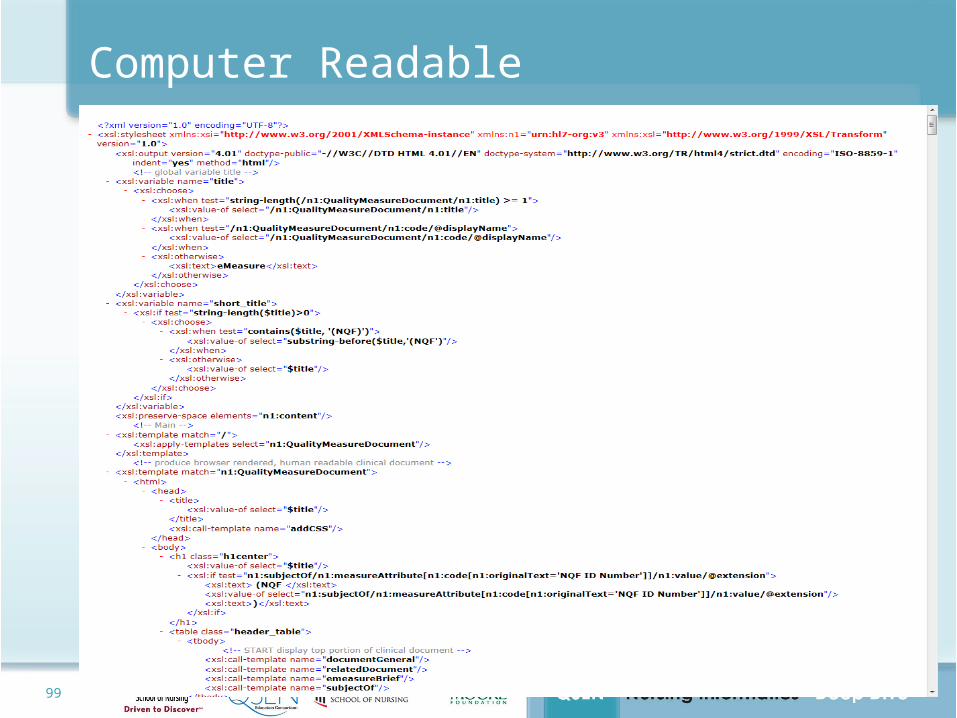
Provides a quality measure in a standardized XML file that can be read by both humans and computer systems
http://www.qualityforum.org/Topics/HIT/Measure_Authoring_Tool_(MAT)/Measure_Authoring_Tool_(MAT).aspx
95
Measure Authoring ToolKey Features and Functions
Create and share eMeasures and their corresponding code lists with other users
Create and reuse standard value sets and other measure components, limiting rework as new measures are developed
Use the Quality Data Model (QDM) as the grammar and structure to fully define and express eMeasures in a standard way, and
Export eMeasures in an EHR-readable format to enable collection of comparable healthcare quality data
96
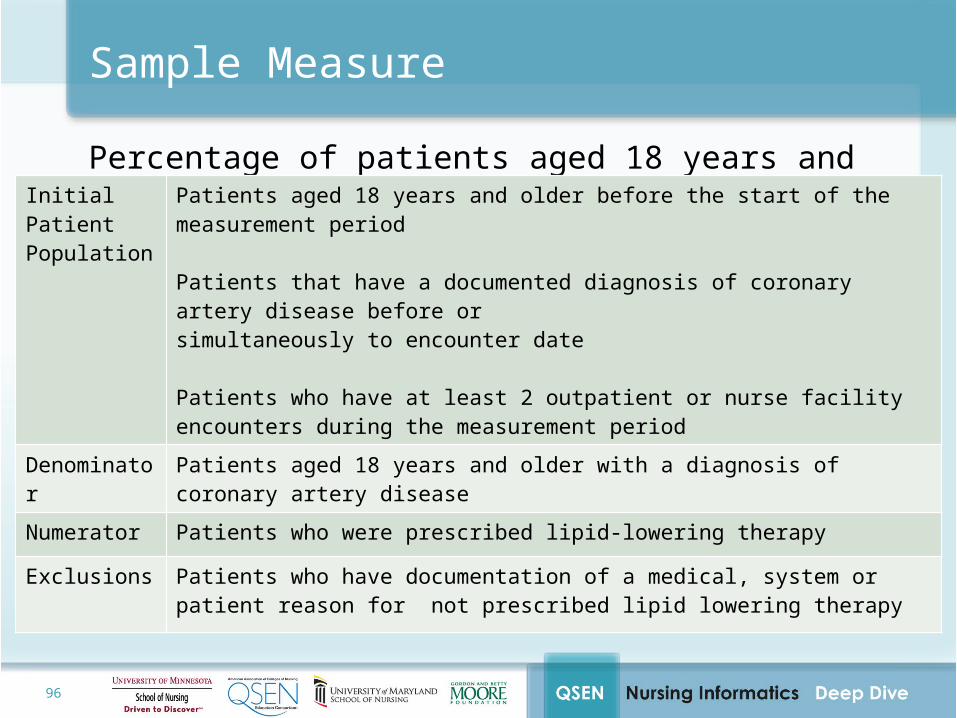
Sample Measure
Percentage of patients aged 18 years and older with a diagnosis of CAD who were prescribed a lipid-lowering therapy
Initial Patient Population
Patients aged 18 years and older before the start of the measurement period
Patients that have a documented diagnosis of coronary artery disease before orsimultaneously to encounter date
Patients who have at least 2 outpatient or nurse facility encounters during the measurement period
Denominator Patients aged 18 years and older with a diagnosis of coronary artery disease
Numerator Patients who were prescribed lipid-lowering therapy
Exclusions Patients who have documentation of a medical, system or patient reason for not prescribed lipid lowering therapy
97
Human Readable - Header
98
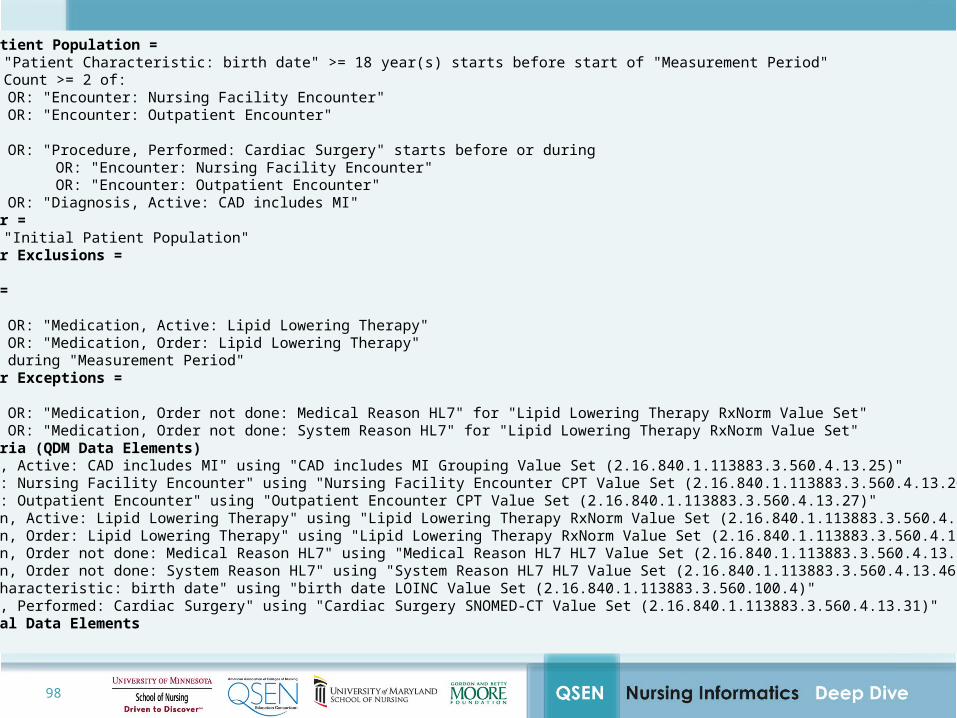
Initial Patient Population =AND: "Patient Characteristic: birth date" >= 18 year(s) starts before start of "Measurement Period"AND: Count >= 2 of:
OR: "Encounter: Nursing Facility Encounter"OR: "Encounter: Outpatient Encounter"
AND: OR: "Procedure, Performed: Cardiac Surgery" starts before or during
OR: "Encounter: Nursing Facility Encounter"OR: "Encounter: Outpatient Encounter"
OR: "Diagnosis, Active: CAD includes MI"Denominator =
AND: "Initial Patient Population"Denominator Exclusions =
NoneNumerator =
AND: OR: "Medication, Active: Lipid Lowering Therapy"OR: "Medication, Order: Lipid Lowering Therapy"during "Measurement Period"
Denominator Exceptions =AND:
OR: "Medication, Order not done: Medical Reason HL7" for "Lipid Lowering Therapy RxNorm Value Set"OR: "Medication, Order not done: System Reason HL7" for "Lipid Lowering Therapy RxNorm Value Set"
Data criteria (QDM Data Elements)"Diagnosis, Active: CAD includes MI" using "CAD includes MI Grouping Value Set (2.16.840.1.113883.3.560.4.13.25)" "Encounter: Nursing Facility Encounter" using "Nursing Facility Encounter CPT Value Set (2.16.840.1.113883.3.560.4.13.26)" "Encounter: Outpatient Encounter" using "Outpatient Encounter CPT Value Set (2.16.840.1.113883.3.560.4.13.27)" "Medication, Active: Lipid Lowering Therapy" using "Lipid Lowering Therapy RxNorm Value Set (2.16.840.1.113883.3.560.4.13.29)" "Medication, Order: Lipid Lowering Therapy" using "Lipid Lowering Therapy RxNorm Value Set (2.16.840.1.113883.3.560.4.13.29)" "Medication, Order not done: Medical Reason HL7" using "Medical Reason HL7 HL7 Value Set (2.16.840.1.113883.3.560.4.13.30)" "Medication, Order not done: System Reason HL7" using "System Reason HL7 HL7 Value Set (2.16.840.1.113883.3.560.4.13.46)" "Patient Characteristic: birth date" using "birth date LOINC Value Set (2.16.840.1.113883.3.560.100.4)" "Procedure, Performed: Cardiac Surgery" using "Cardiac Surgery SNOMED-CT Value Set (2.16.840.1.113883.3.560.4.13.31)" Supplemental Data ElementsNone
99
Computer Readable
100
Using Health IT to Measure and Improve Outcomes
Considering automated queries for measurement – how to ask
questions to an EHR
101
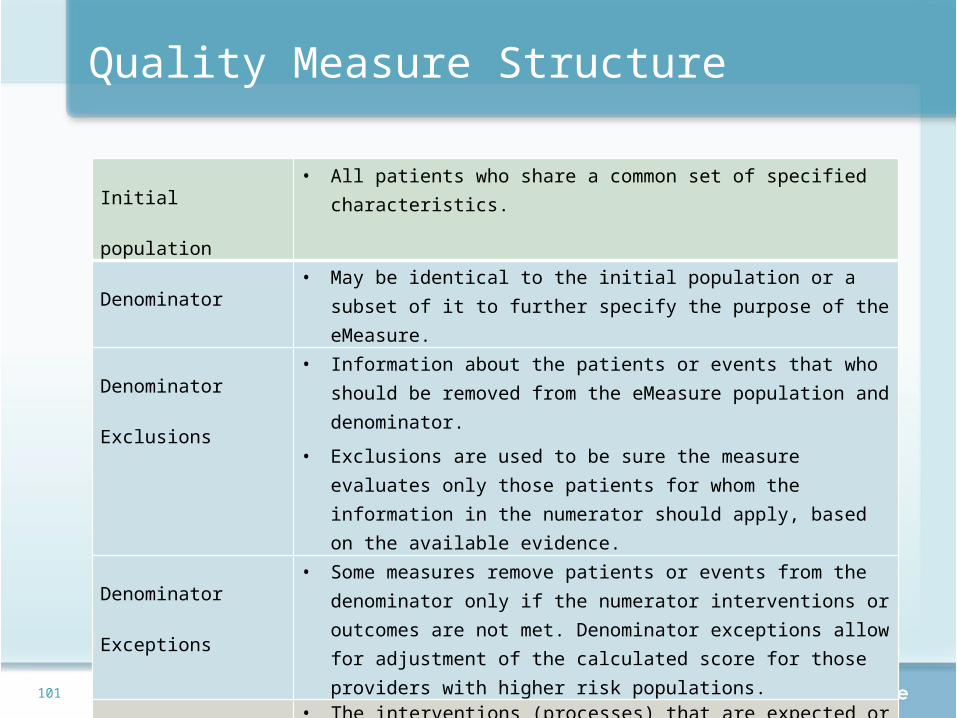
Quality Measure Structure
Initial population• All patients who share a common set of specified characteristics.
Denominator• May be identical to the initial population or a subset of it to further
specify the purpose of the eMeasure.
Denominator Exclusions• Information about the patients or events that who should be removed
from the eMeasure population and denominator.
• Exclusions are used to be sure the measure evaluates only those patients for whom the information in the numerator should apply, based on the available evidence.
Denominator Exceptions• Some measures remove patients or events from the denominator only if
the numerator interventions or outcomes are not met. Denominator exceptions allow for adjustment of the calculated score for those providers with higher risk populations.
Numerator• The interventions (processes) that are expected or the outcome that is
expected, based on the evidence, for all members of the denominator.
102
Using Health IT to Measure and Improve Outcomes
Exercise
103
Getting Quality Measure Data from the EHR
Example 1Identify all children with normal
blood pressure
First Question: What is the time period of interest?This is needed to identify the population.
104
Getting Quality Measure Data from the EHR
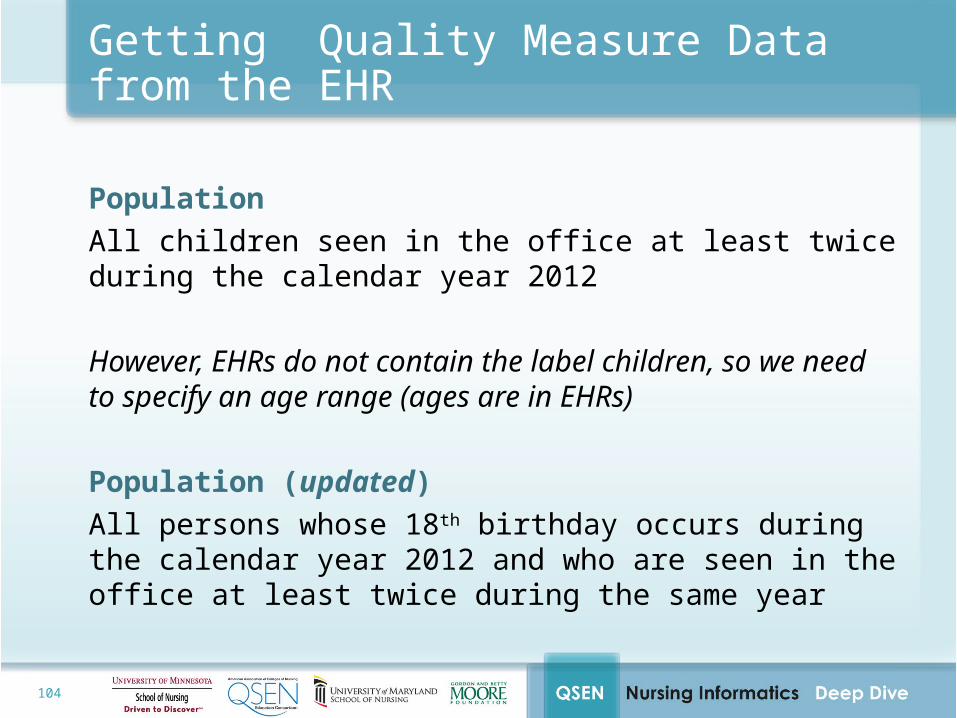
PopulationAll children seen in the office at least twice during the calendar year 2012
However, EHRs do not contain the label children, so we need to specify an age range (ages are in EHRs)
Population (updated)All persons whose 18th birthday occurs during the calendar year 2012 and who are seen in the office at least twice during the same year
105
Getting Quality Measure Data from the EHR
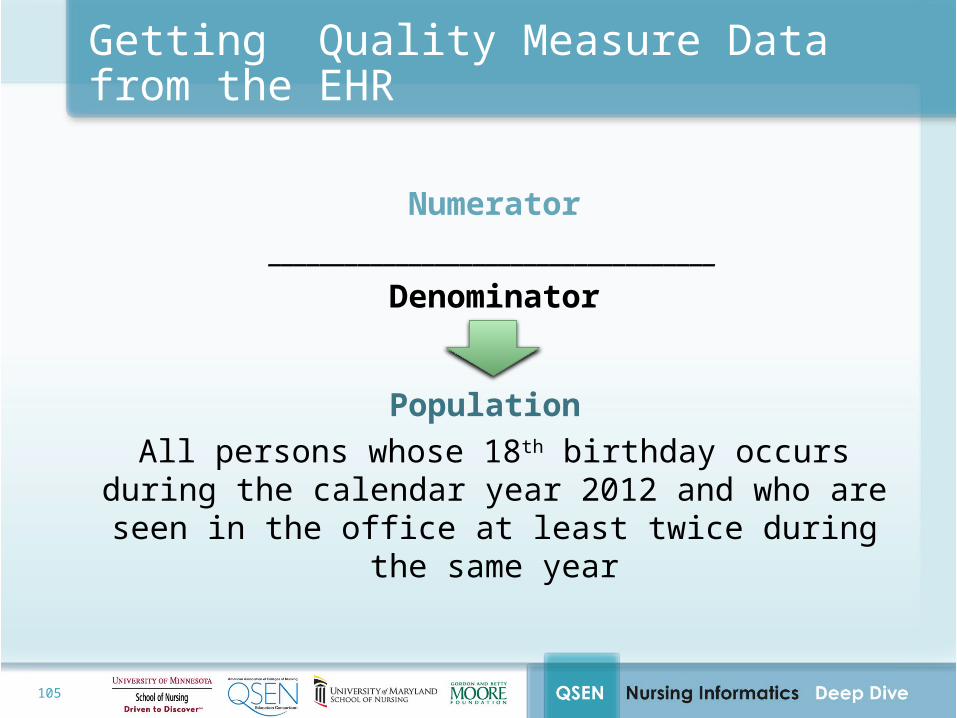
Numerator___________________________________
Denominator
Population All persons whose 18th birthday occurs during the calendar
year 2012 and who are seen in the office at least twice during the same year
106
Getting Quality Measure Data from the EHR
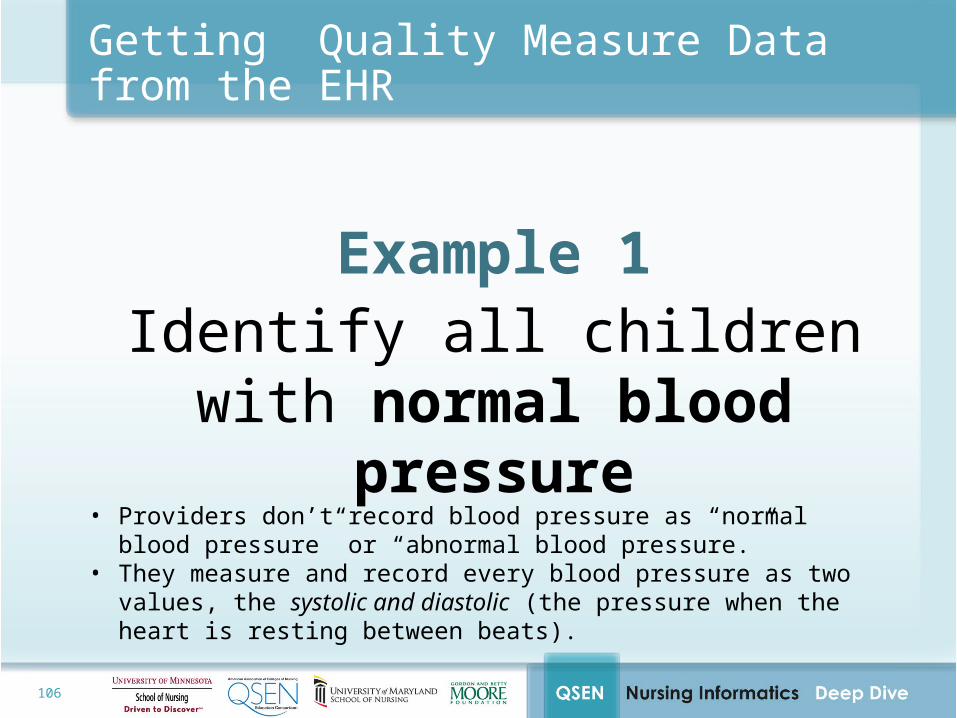
Example 1Identify all children with normal
blood pressure
• Providers don’t record blood pressure as “normal blood pressure” or “abnormal blood pressure.”
• They measure and record every blood pressure as two values, the systolic and diastolic (the pressure when the heart is resting between beats).
107
Getting Quality Measure Data from the EHR
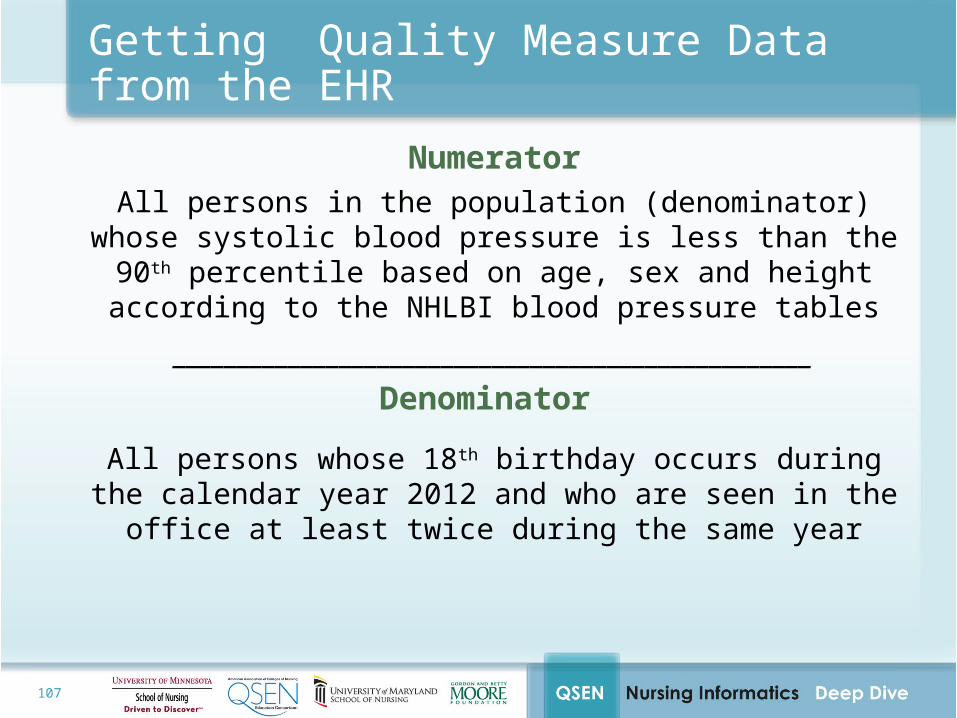
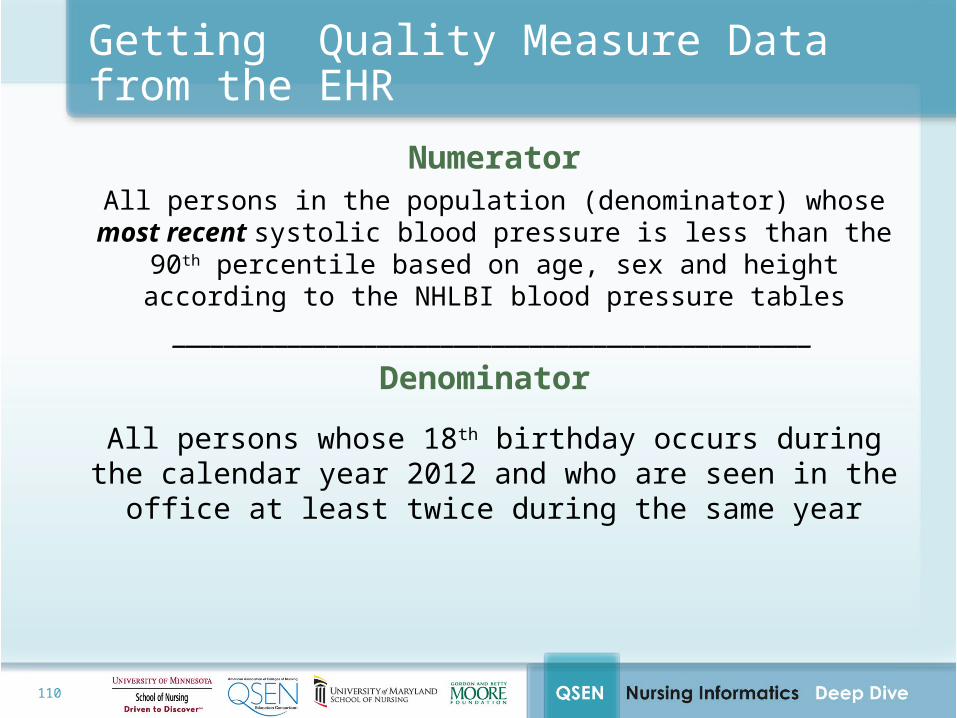
NumeratorAll persons in the population (denominator) whose systolic blood
pressure is less than the 90th percentile based on age, sex and height according to the NHLBI blood pressure tables
__________________________________________________Denominator
All persons whose 18th birthday occurs during the calendar year 2012 and who are seen in the office at least twice during the same
year
108
Getting Quality Measure Data from the EHR
There are Two Missing Facts
109
Getting Quality Measure Data from the EHR
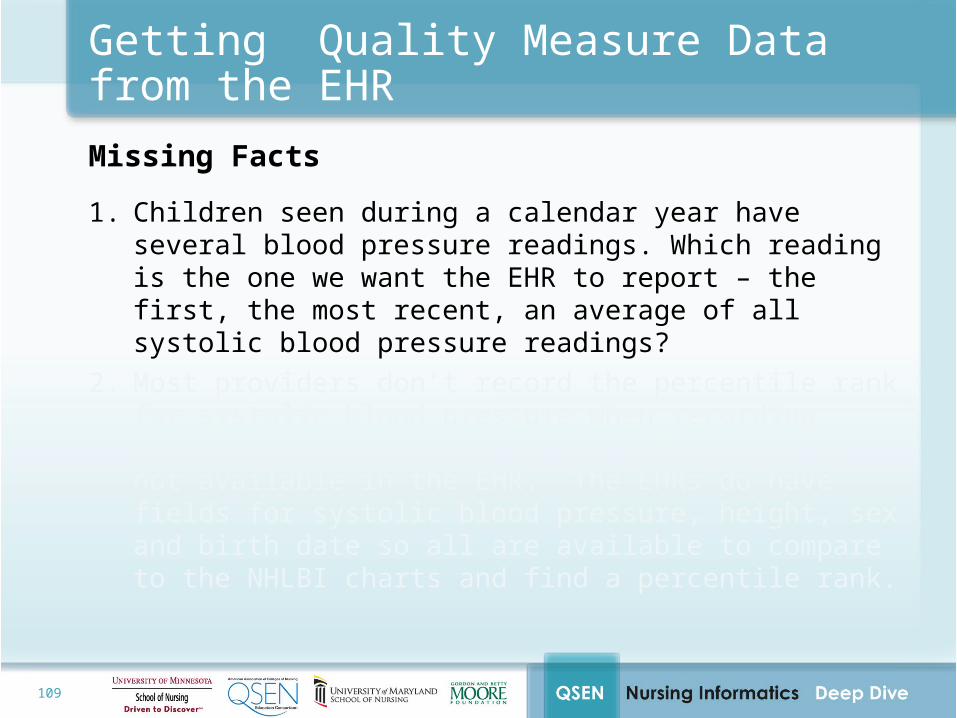
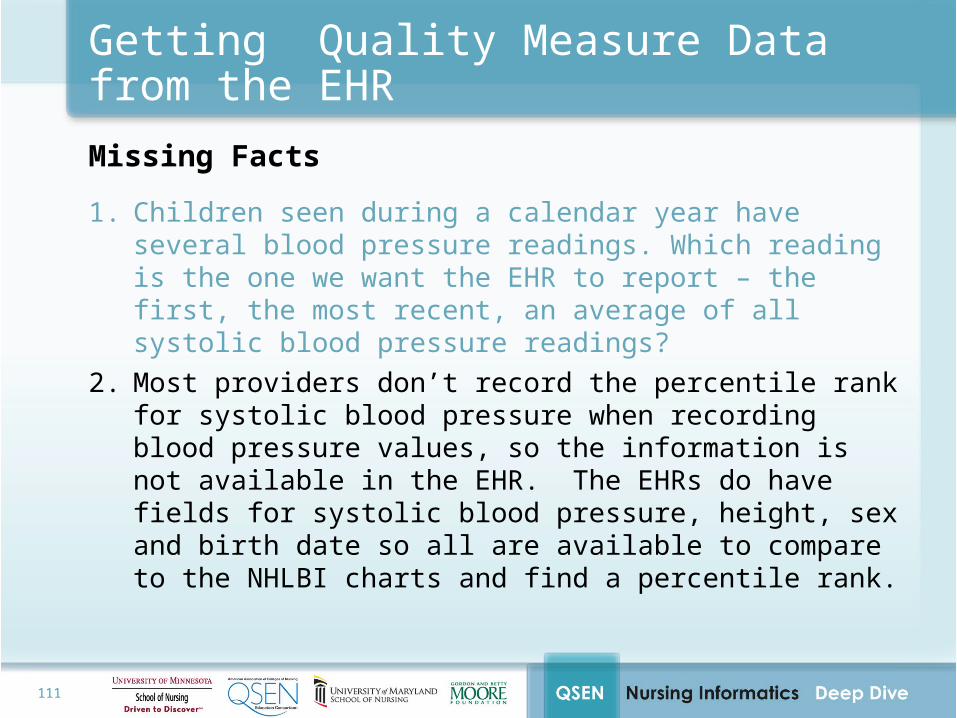
Missing Facts
1. Children seen during a calendar year have several blood pressure readings. Which reading is the one we want the EHR to report – the first, the most recent, an average of all systolic blood pressure readings?
2. Most providers don’t record the percentile rank for systolic blood pressure when recording blood pressure values, so the information is not available in the EHR. The EHRs do have fields for systolic blood pressure, height, sex and birth date so all are available to compare to the NHLBI charts and find a percentile rank.
110
Getting Quality Measure Data from the EHR
NumeratorAll persons in the population (denominator) whose most recent systolic
blood pressure is less than the 90th percentile based on age, sex and height according to the NHLBI blood pressure tables
__________________________________________________Denominator
All persons whose 18th birthday occurs during the calendar year 2012 and who are seen in the office at least twice during the same
year
111
Getting Quality Measure Data from the EHR
Missing Facts
1. Children seen during a calendar year have several blood pressure readings. Which reading is the one we want the EHR to report – the first, the most recent, an average of all systolic blood pressure readings?
2. Most providers don’t record the percentile rank for systolic blood pressure when recording blood pressure values, so the information is not available in the EHR. The EHRs do have fields for systolic blood pressure, height, sex and birth date so all are available to compare to the NHLBI charts and find a percentile rank.
112
Getting Quality Measure Data from the EHR
Solutions
• The measure would need to ask for all data required (the birth date, the sex, the most recent height and the most recent systolic blood pressure) and provide the NHLBI charts with a string of codes that any EHR can read to perform the calculation for reporting
• EHR products could provide the feature as a standard component, but since that is not a consistent EHR process we can’t rely on it for our measure
• Encourage better standard use of EHRs and work with some vendors to include pediatric blood pressure percentile ranking because it adds value to clinical care
113
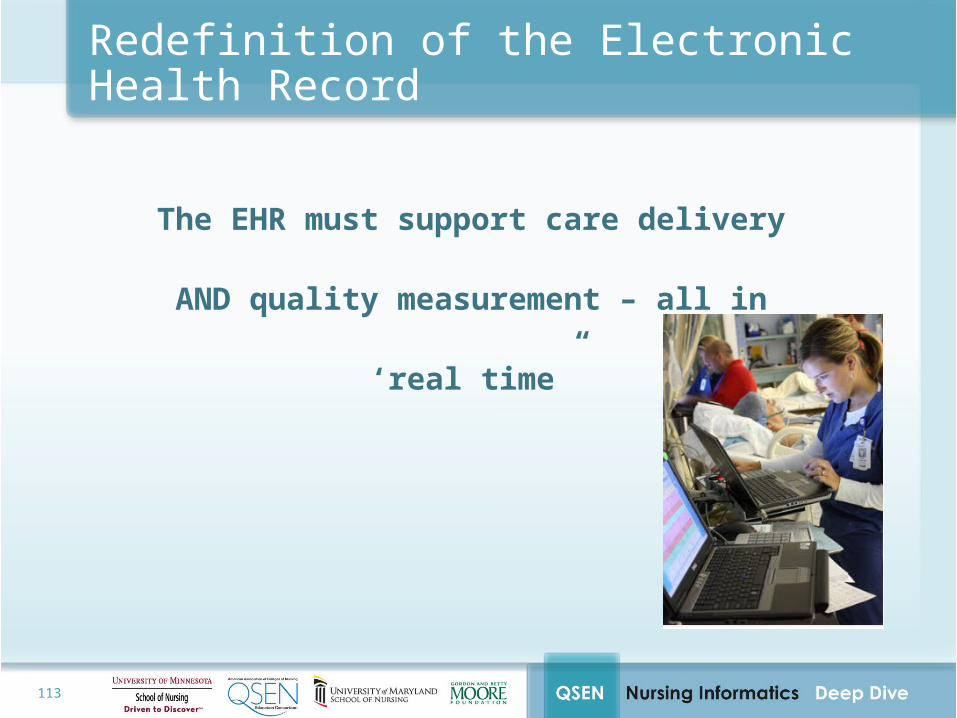
Redefinition of the Electronic Health Record
The EHR must support care delivery AND quality
measurement – all in ‘real time”
114 114
Crossing the Quality Chasm
• “This sort of change in healthcare will not be evolutionary but revolutionary, like going from water to steam”
• This vision is a chasm that cannot be crossed in two steps
115 115
• What was ‘secondary use of data’ is now ‘primary use of data’
• Creation of a Strategic Plan for “Data”
• “If You Can’t be There Yourself, Don’t Send Anyone”Deming 1985
Redefinition of the Electronic Health Record
116 116
Know what to do with the data you have
117
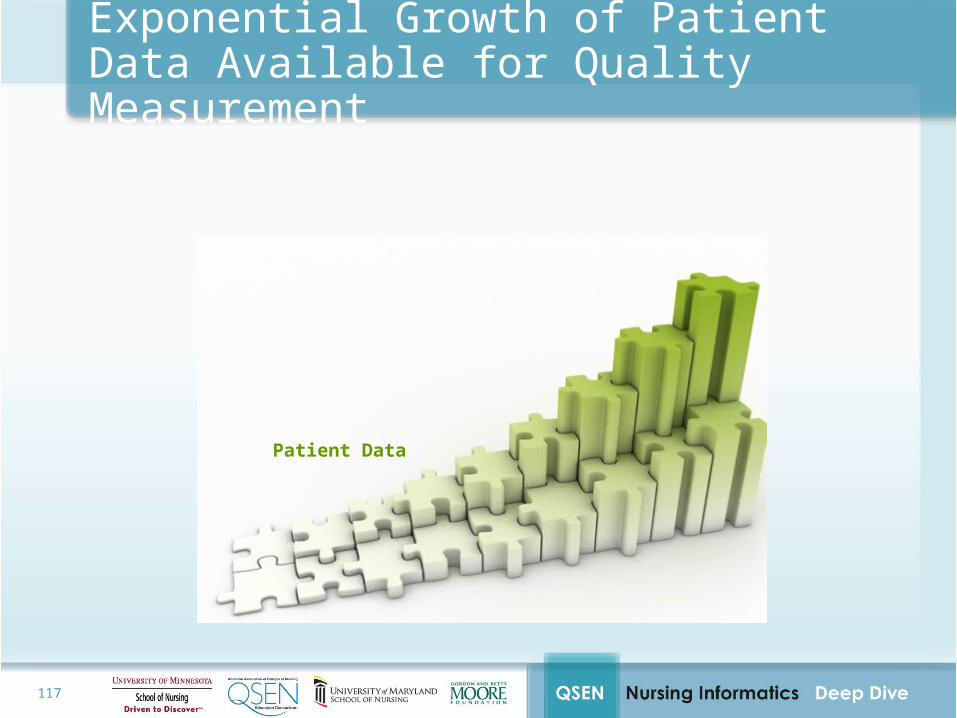
Exponential Growth of Patient Data Available for Quality Measurement
Patient Data
119
Meaningful UseStage 2
Proposed Measures
120
Meaningful Use Stage 2Quality Measures for Hospitals
Requires eligible hospitals and CAHs to report 24 clinical quality measures from a menu of 49 clinical quality measures, including at least 1 clinical quality measure from each of the 6 domains:
• Clinical Process/Effectiveness
• Patient Safety
• Care Coordination
• Efficient Use of Healthcare Resources
• Patient & Family Engagement
• Population & Public Health
121
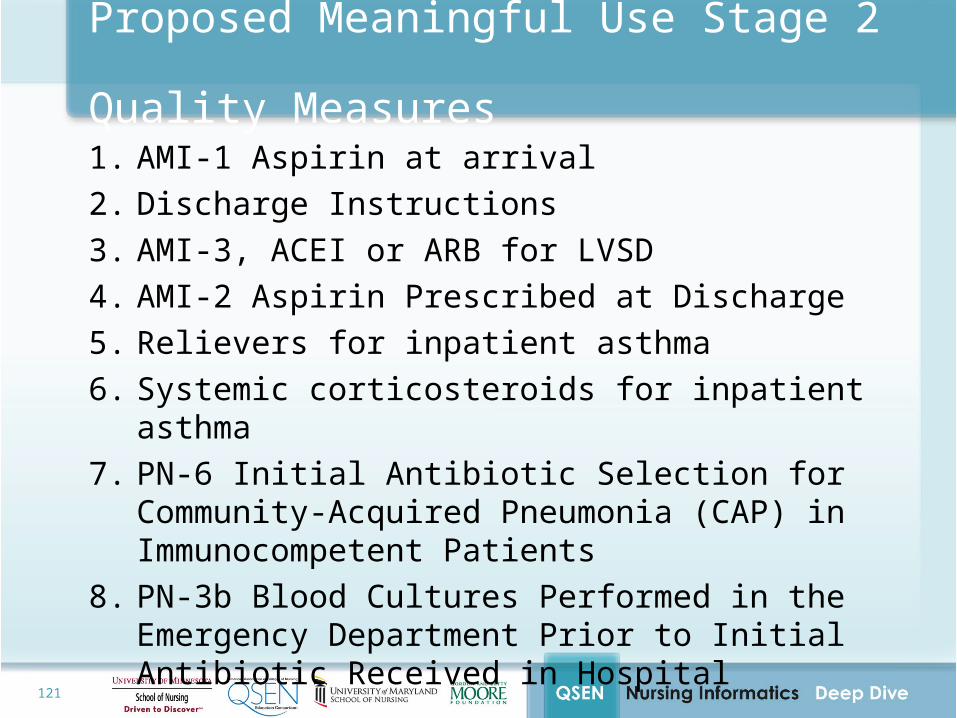
Proposed Meaningful Use Stage 2 Quality Measures
1. AMI-1 Aspirin at arrival2. Discharge Instructions3. AMI-3, ACEI or ARB for LVSD4. AMI-2 Aspirin Prescribed at Discharge5. Relievers for inpatient asthma6. Systemic corticosteroids for inpatient asthma7. PN-6 Initial Antibiotic Selection for Community-Acquired
Pneumonia (CAP) in Immunocompetent Patients8. PN-3b Blood Cultures Performed in the Emergency
Department Prior to Initial Antibiotic Received in Hospital
122
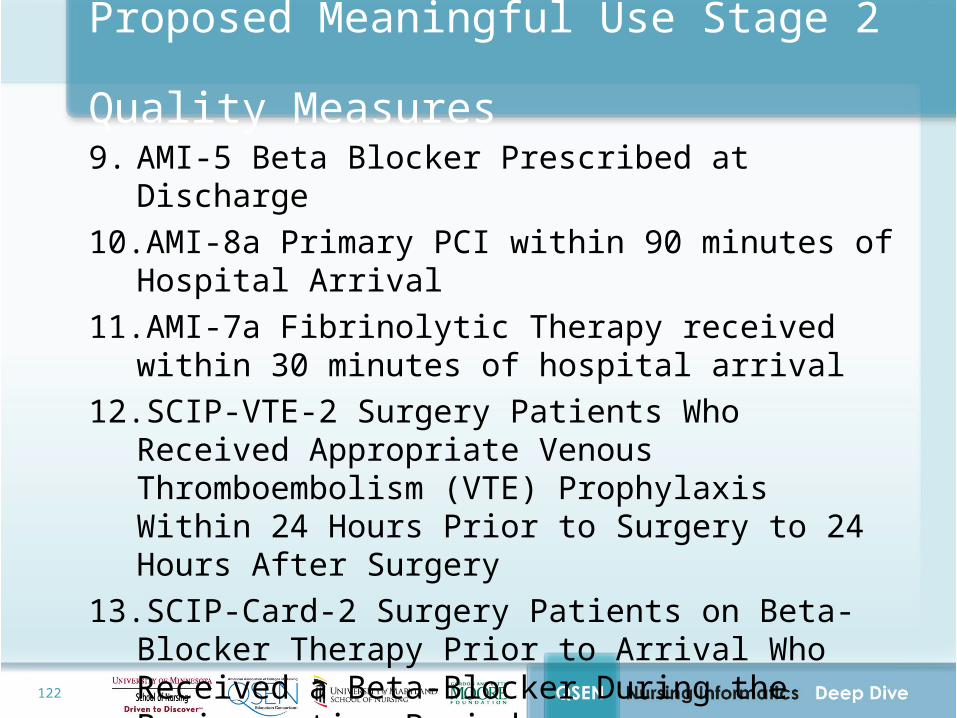
Proposed Meaningful Use Stage 2 Quality Measures
9. AMI-5 Beta Blocker Prescribed at Discharge10. AMI-8a Primary PCI within 90 minutes of Hospital Arrival11. AMI-7a Fibrinolytic Therapy received within 30 minutes of
hospital arrival12. SCIP-VTE-2 Surgery Patients Who Received Appropriate
Venous Thromboembolism (VTE) Prophylaxis Within 24 Hours Prior to Surgery to 24 Hours After Surgery
13. SCIP-Card-2 Surgery Patients on Beta-Blocker Therapy Prior to Arrival Who Received a Beta-Blocker During the Perioperative Period
14. SCIP-Inf-4 Cardiac Surgery Patients with Controlled 6 AM Postoperative Serum Glucose
123
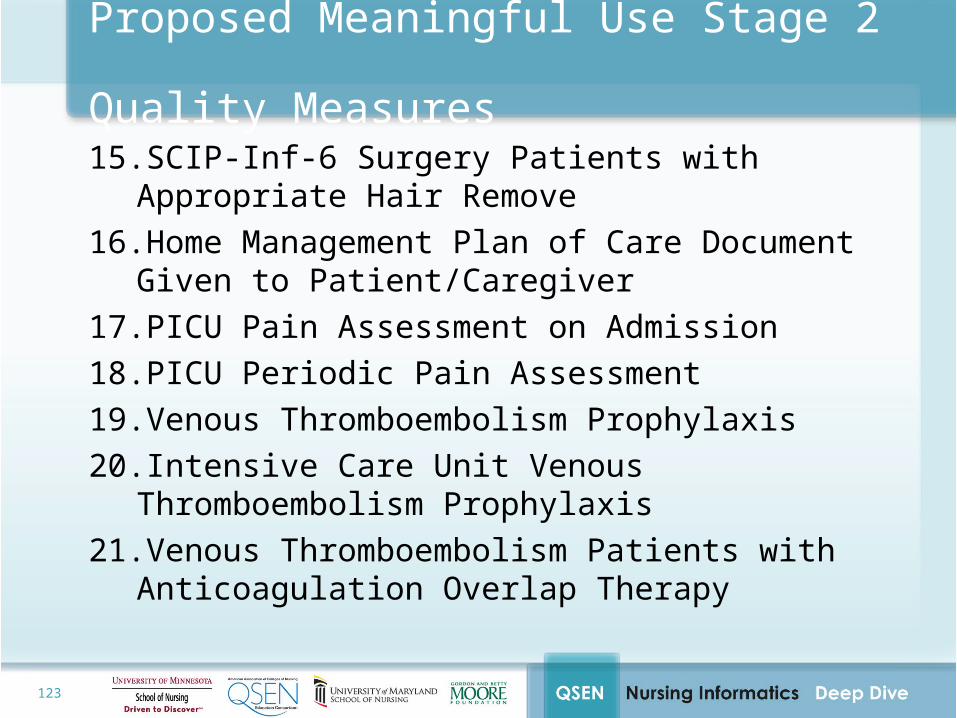
Proposed Meaningful Use Stage 2 Quality Measures
15. SCIP-Inf-6 Surgery Patients with Appropriate Hair Remove16. Home Management Plan of Care Document Given to
Patient/Caregiver17. PICU Pain Assessment on Admission18. PICU Periodic Pain Assessment19. Venous Thromboembolism Prophylaxis20. Intensive Care Unit Venous Thromboembolism Prophylaxis21. Venous Thromboembolism Patients with Anticoagulation
Overlap Therapy
124
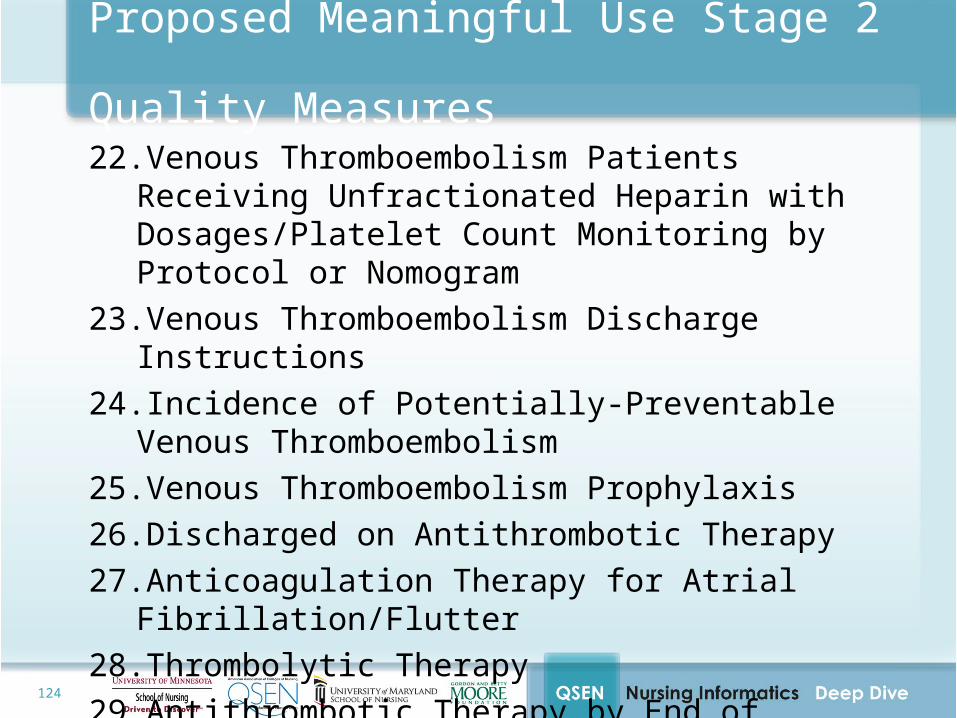
Proposed Meaningful Use Stage 2 Quality Measures
22. Venous Thromboembolism Patients Receiving Unfractionated Heparin with Dosages/Platelet Count Monitoring by Protocol or Nomogram
23. Venous Thromboembolism Discharge Instructions24. Incidence of Potentially-Preventable Venous
Thromboembolism25. Venous Thromboembolism Prophylaxis26. Discharged on Antithrombotic Therapy27. Anticoagulation Therapy for Atrial Fibrillation/Flutter28. Thrombolytic Therapy29. Antithrombotic Therapy by End of Hospital Day Two
125
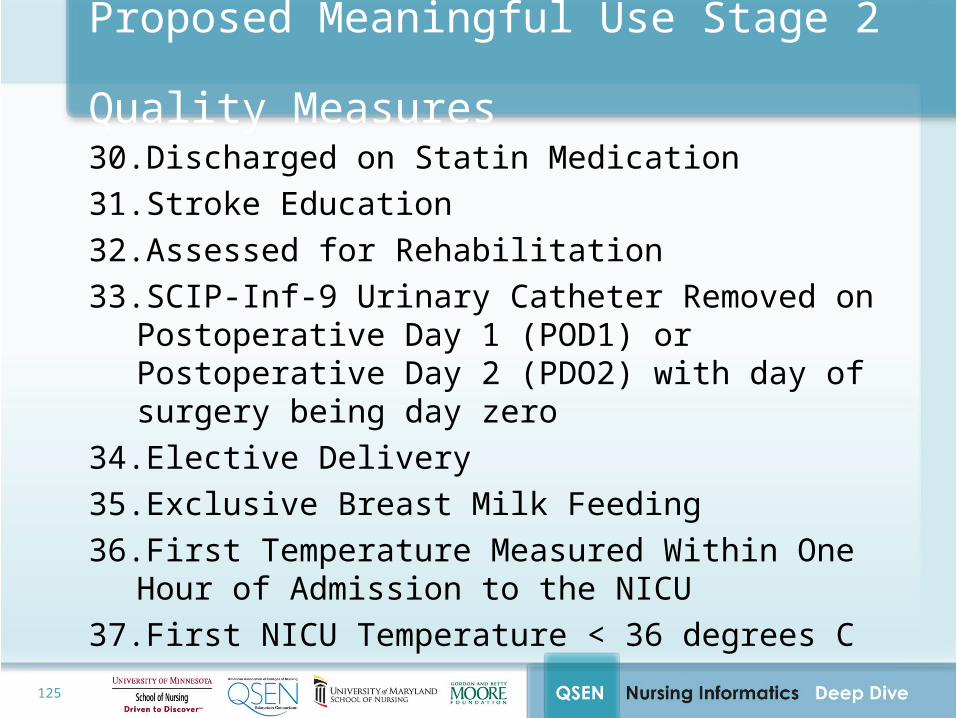
Proposed Meaningful Use Stage 2 Quality Measures
30. Discharged on Statin Medication31. Stroke Education32. Assessed for Rehabilitation33. SCIP-Inf-9 Urinary Catheter Removed on Postoperative Day
1 (POD1) or Postoperative Day 2 (PDO2) with day of surgery being day zero
34. Elective Delivery35. Exclusive Breast Milk Feeding36. First Temperature Measured Within One Hour of
Admission to the NICU37. First NICU Temperature < 36 degrees C
126
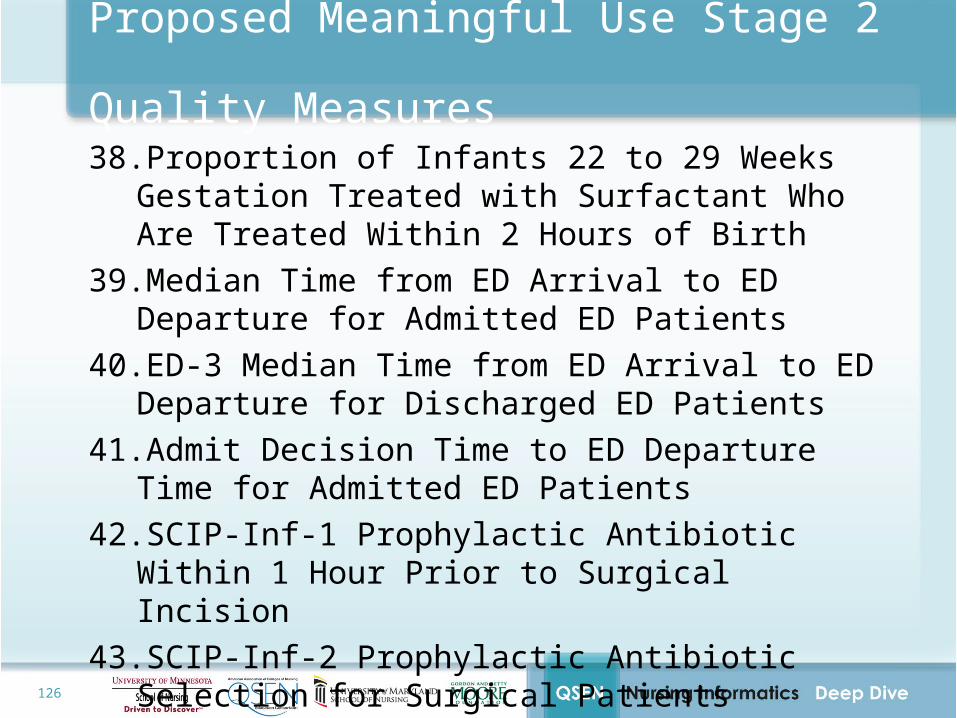
Proposed Meaningful Use Stage 2 Quality Measures
38. Proportion of Infants 22 to 29 Weeks Gestation Treated with Surfactant Who Are Treated Within 2 Hours of Birth
39. Median Time from ED Arrival to ED Departure for Admitted ED Patients
40. ED-3 Median Time from ED Arrival to ED Departure for Discharged ED Patients
41. Admit Decision Time to ED Departure Time for Admitted ED Patients
42. SCIP-Inf-1 Prophylactic Antibiotic Within 1 Hour Prior to Surgical Incision
43. SCIP-Inf-2 Prophylactic Antibiotic Selection for Surgical Patients
127
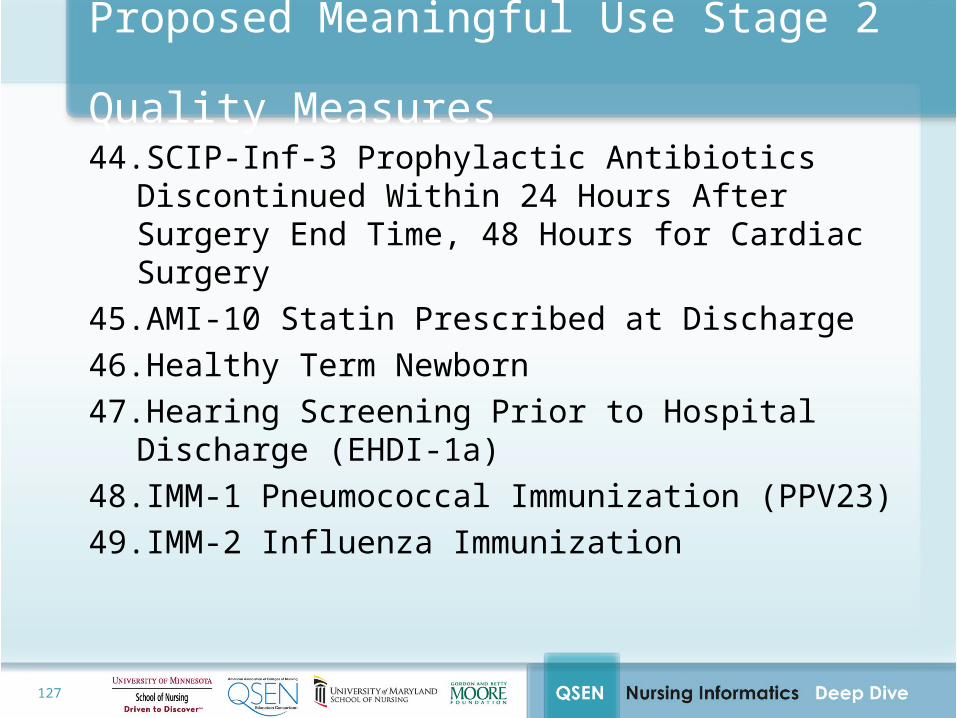
Proposed Meaningful Use Stage 2 Quality Measures
44. SCIP-Inf-3 Prophylactic Antibiotics Discontinued Within 24 Hours After Surgery End Time, 48 Hours for Cardiac Surgery
45. AMI-10 Statin Prescribed at Discharge46. Healthy Term Newborn47. Hearing Screening Prior to Hospital Discharge (EHDI-1a)48. IMM-1 Pneumococcal Immunization (PPV23)49. IMM-2 Influenza Immunization
128
Section Four Questions
1. What are quality measures?
2. What is the Quality Data Model?
3. Why is the human readable output for a measure important?
4. What is the Measure Authoring Tool?
5. What are the five parts of a quality measure?
6. Define one meaningful use quality measure

129
Teaching Methods and Strategies
1. Lecture
2. Discussion Board
– Present safety and quality scenarios within healthcare organizations
– Present challenges student may face as a member of an organizational safety/quality committee
3. White papers answering questions posed on the prior slide
4. Development of use cases for each of the safety areas showing how one of the organizations provides tools for improving safety
5. Review of public testimonies and calls for comments – have the students respond to the national posts for comments

130
Questions &
Discussion