Embed Size (px)
Citation preview
1
Review• Measures of central tendency
• Mean
• Median
• Mode
• Measures of dispersion or variation• Range
• Variance
• Standard Deviation
2
Interpreting the Standard Deviation
Chebyshev’s Theorem
The proportion (or fraction) of any data set lying within K standard deviations of the mean is always at least 1-1/K2, where K is any positive number greater than 1.
For K=2 we obtain, at least 3/4 (75 %) of all scores will fall within 2 standard deviations of the mean, i.e. 75% of the data will fall between
sxsx 2 and 2
3
Interpreting the Standard Deviation
Chebyshev’s Theorem
The proportion (or fraction) of any data set lying within K standard deviations of the mean is always at least 1-1/K2, where K is any positive number greater than 1.
For K=3 we obtain, at least 8/9 (89 %) of all scores will fall within 3 standard deviations of the mean, i.e. 89% of the data will fall between
sxsx 3 and 3
4
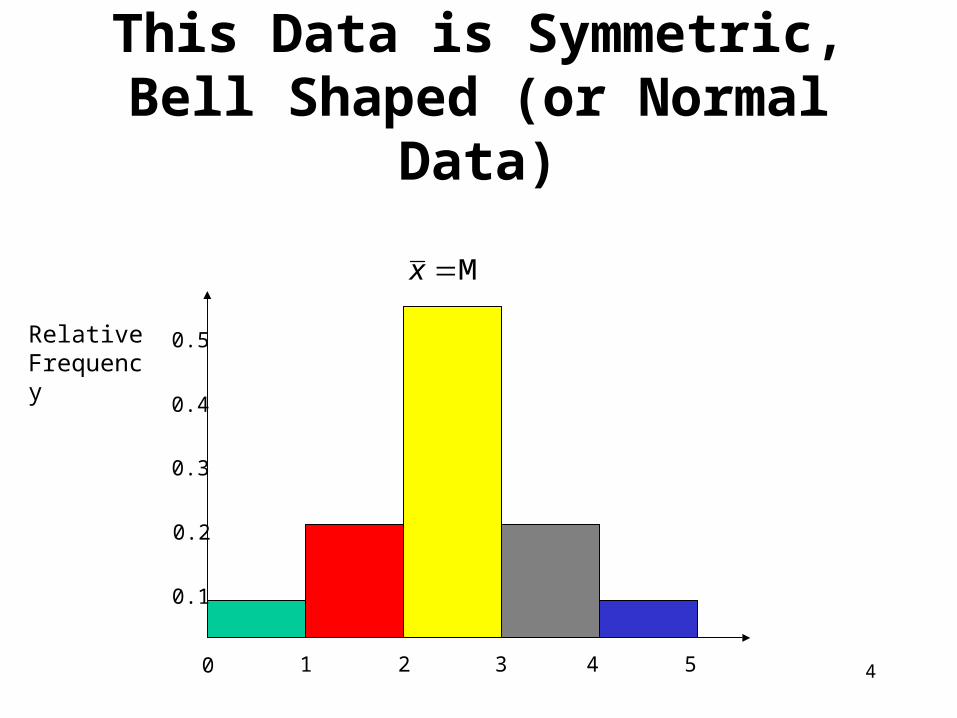
This Data is Symmetric, Bell Shaped (or Normal Data)
Relative Frequency
0 1 3 4 52
0.3
0.4
0.5
0.2
0.1
Mx
5
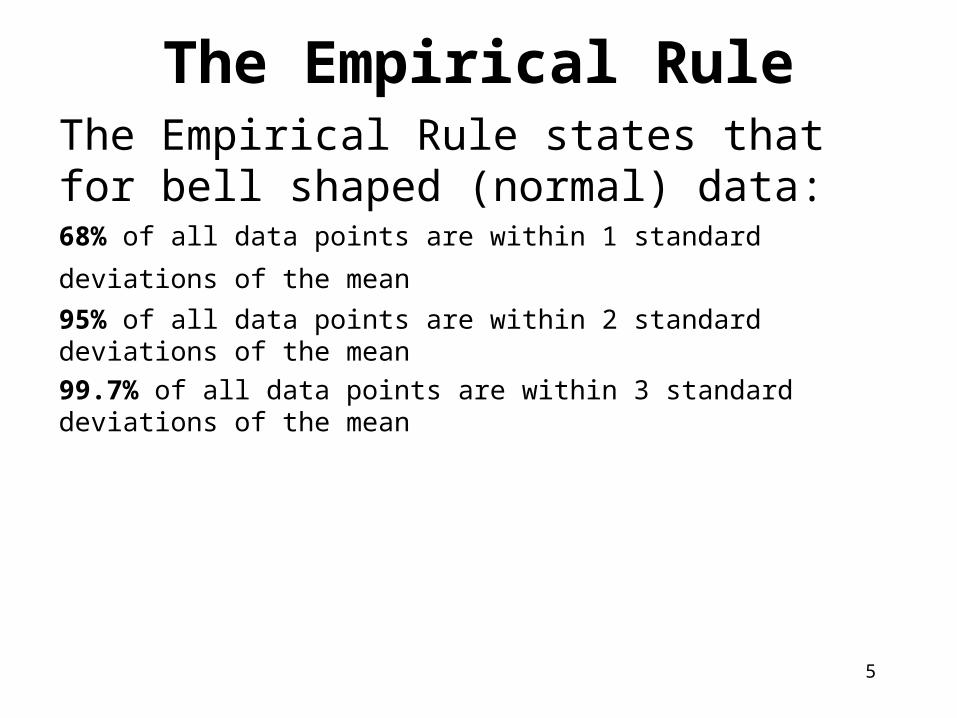
The Empirical RuleThe Empirical Rule states that for bell shaped (normal) data:68% of all data points are within 1 standard deviations of the mean 95% of all data points are within 2 standard deviations of the mean
99.7% of all data points are within 3 standard deviations of the mean
6
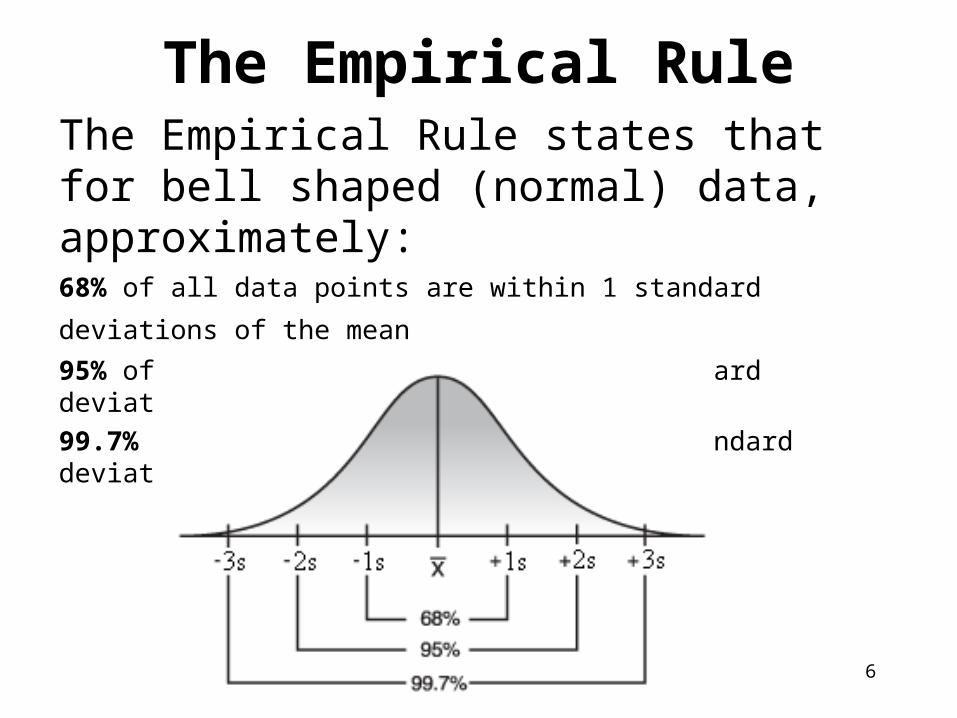
The Empirical RuleThe Empirical Rule states that for bell shaped (normal) data, approximately:68% of all data points are within 1 standard deviations of the mean 95% of all data points are within 2 standard deviations of the mean
99.7% of all data points are within 3 standard deviations of the mean
7
Z-Score
To calculate the number of standard deviations a particular point is away from the standard deviation we use the following formula.
8
Z-Score
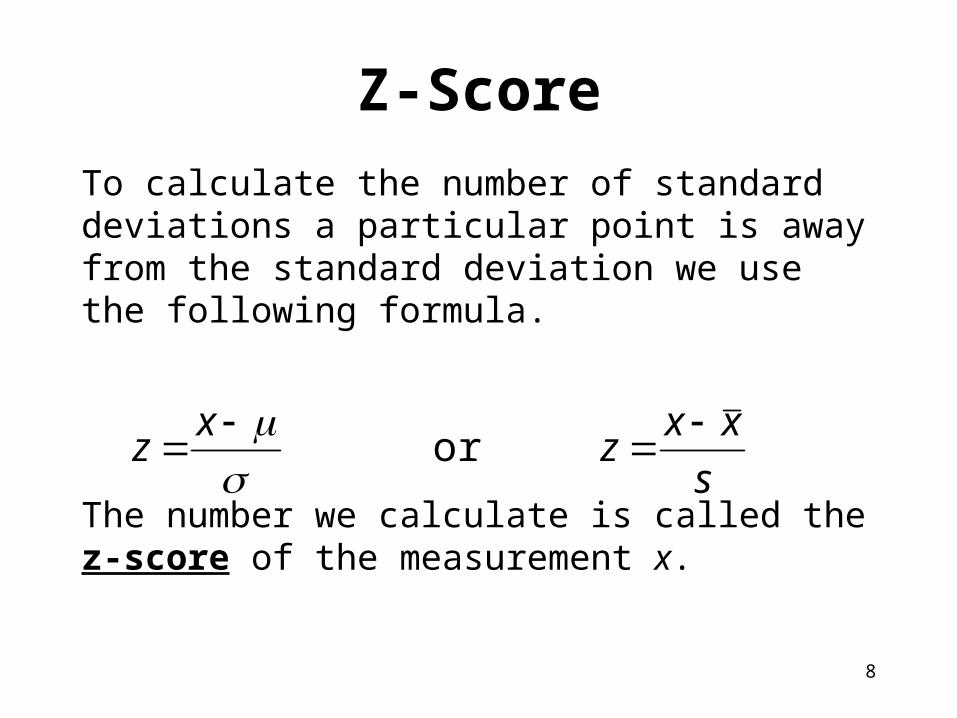
To calculate the number of standard deviations a particular point is away from the standard deviation we use the following formula.
The number we calculate is called the z-score of the measurement x.
or s
xxz
xz
9
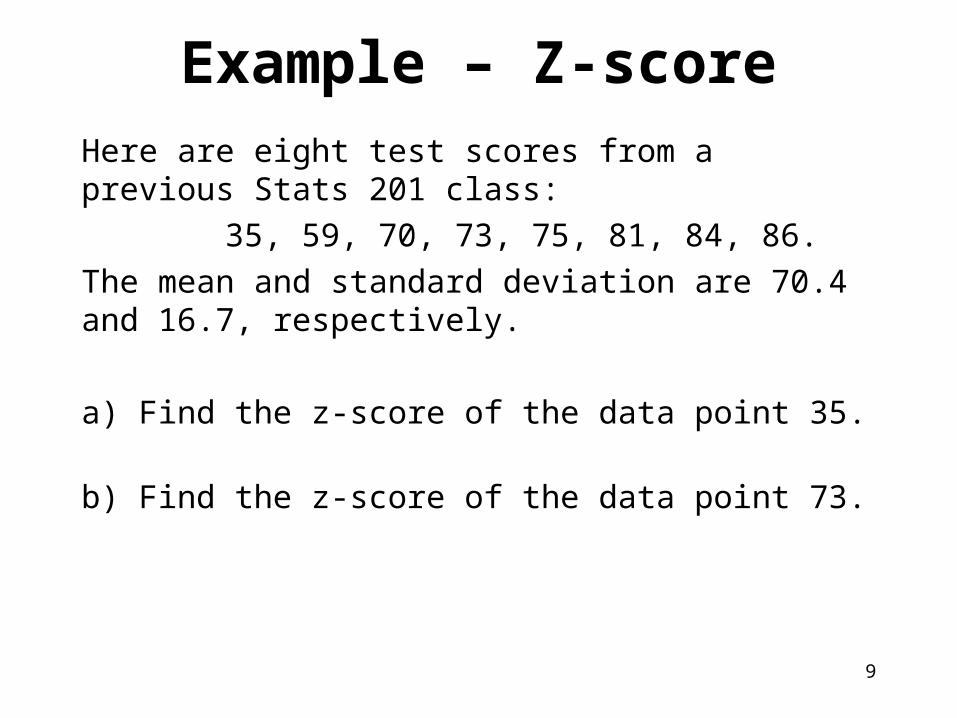
Example – Z-score
Here are eight test scores from a previous Stats 201 class:
35, 59, 70, 73, 75, 81, 84, 86.
The mean and standard deviation are 70.4 and 16.7, respectively.
a) Find the z-score of the data point 35.
b) Find the z-score of the data point 73.
10
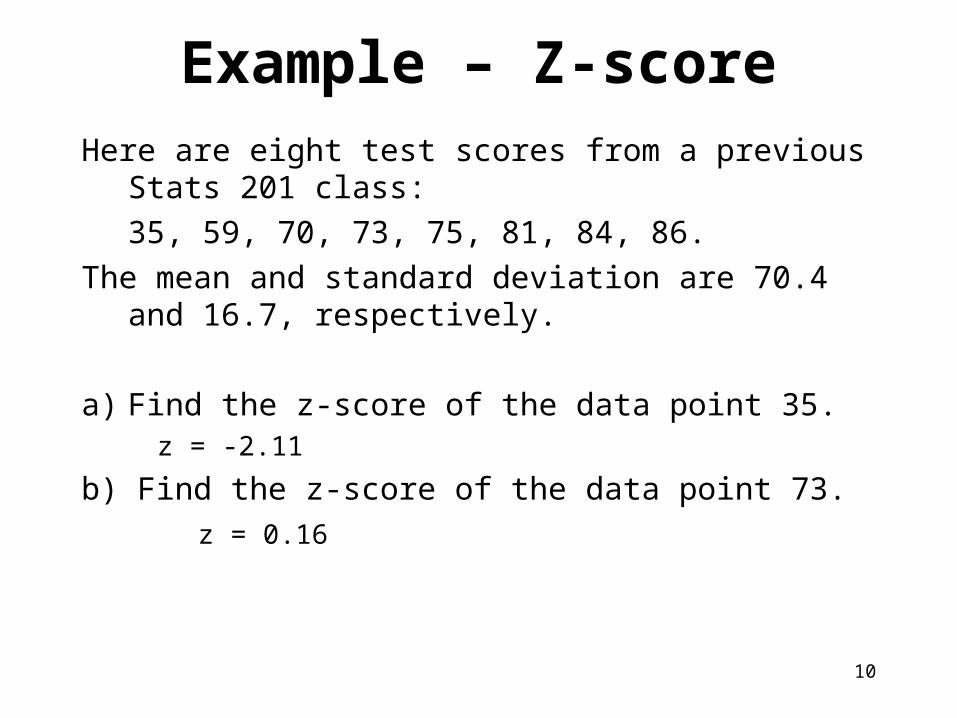
Example – Z-score
Here are eight test scores from a previous Stats 201 class:
35, 59, 70, 73, 75, 81, 84, 86.
The mean and standard deviation are 70.4 and 16.7, respectively.
a) Find the z-score of the data point 35.z = -2.11
b) Find the z-score of the data point 73.
z = 0.16
11
Interpreting Z-scoresThe further away the z-score is from zero the more exceptional the original score.
Values of z less than -2 or greater than +2 can be considered exceptional or unusual (“a suspected outlier”).
Values of z less than -3 or greater than +3 are often exceptional or unusual (“a highly suspected outlier”).
12
Percentiles
Another method for detecting outliers involves percentiles.
13
Percentiles
Another method for detecting outliers involves percentiles.
The pth percentile ranking is a number so that p% of the measurements fall below the pth percentile and 100 – p% fall above it.
Example
If your score on a class quiz of 200 students places you in the 80th
percentile, then only 40 students received a higher mark then you
14
15
Important PercentilesMemorize:
The 25th percentile is called the lower quartile (QL)
The 75th percentile is called the upper quartile (QU)
16
Important PercentilesMemorize:
The 25th percentile is called the lower quartile (QL)
The 75th percentile is called the upper quartile (QU)
The 50th percentile is called the
17
Important PercentilesMemorize:
The 25th percentile is called the lower quartile (QL)
The 75th percentile is called the upper quartile (QU)
The 50th percentile is called the median (M)
Quick way to find quartiles1. Arrange the data in increasing order
2. The middle number (or average of the two middle numbers) is the 50th percentile.
3. Find the middle number in the set of numbers greater than the median. This is the upper quartile.
4. Similarly, find the lower quartile
18
19
Important PercentilesThe interquartile range (IQR) is defined to be:
IQR = QU -QL
20
Example - Fax
21
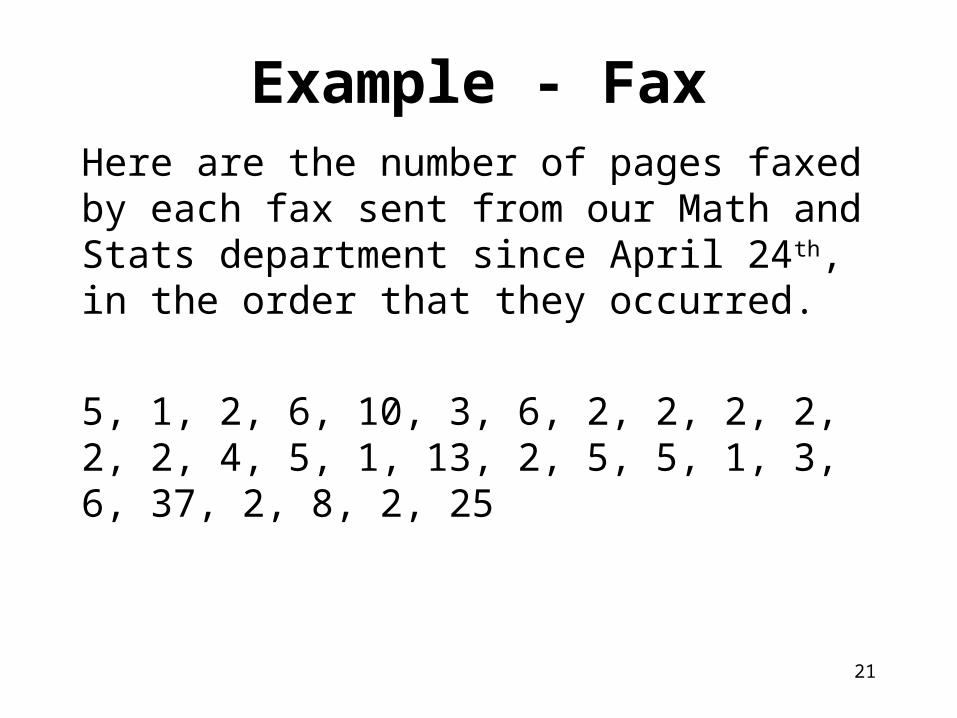
Example - FaxHere are the number of pages faxed by each fax sent from our Math and Stats department since April 24th, in the order that they occurred.
5, 1, 2, 6, 10, 3, 6, 2, 2, 2, 2, 2, 2, 4, 5, 1, 13, 2, 5, 5, 1, 3, 6, 37, 2, 8, 2, 25
22
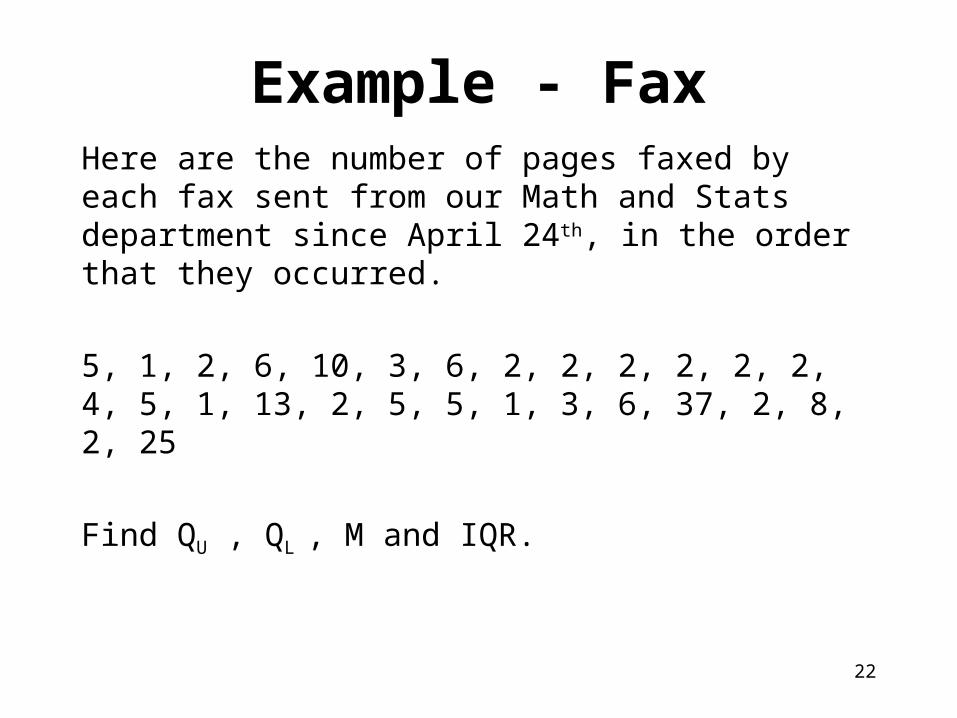
Example - FaxHere are the number of pages faxed by each fax sent from our Math and Stats department since April 24th, in the order that they occurred.
5, 1, 2, 6, 10, 3, 6, 2, 2, 2, 2, 2, 2, 4, 5, 1, 13, 2, 5, 5, 1, 3, 6, 37, 2, 8, 2, 25
Find QU , QL , M and IQR.
23
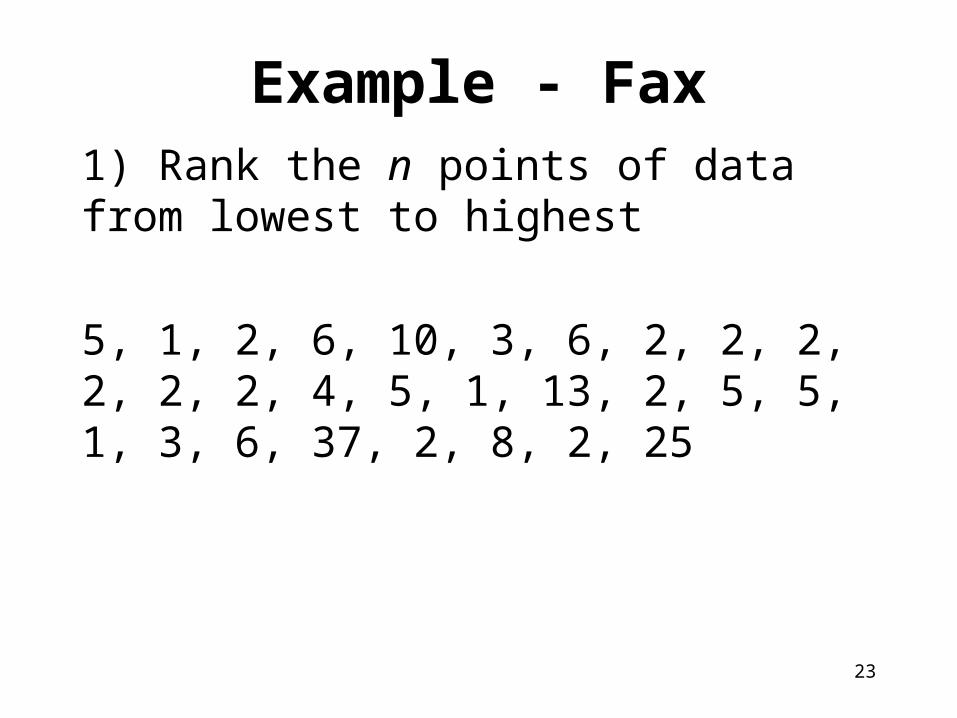
Example - Fax1) Rank the n points of data from lowest to highest
5, 1, 2, 6, 10, 3, 6, 2, 2, 2, 2, 2, 2, 4, 5, 1, 13, 2, 5, 5, 1, 3, 6, 37, 2, 8, 2, 25

24
Example - Fax1) Rank the n points of data from lowest to highest
1, 1, 1, 2, 2, 2, 2, 2, 2, 2, 2, 2, 2, 3, 3, 4, 5, 5, 5, 5, 6, 6, 6, 8, 10, 13, 25, 37
25
Example - Fax
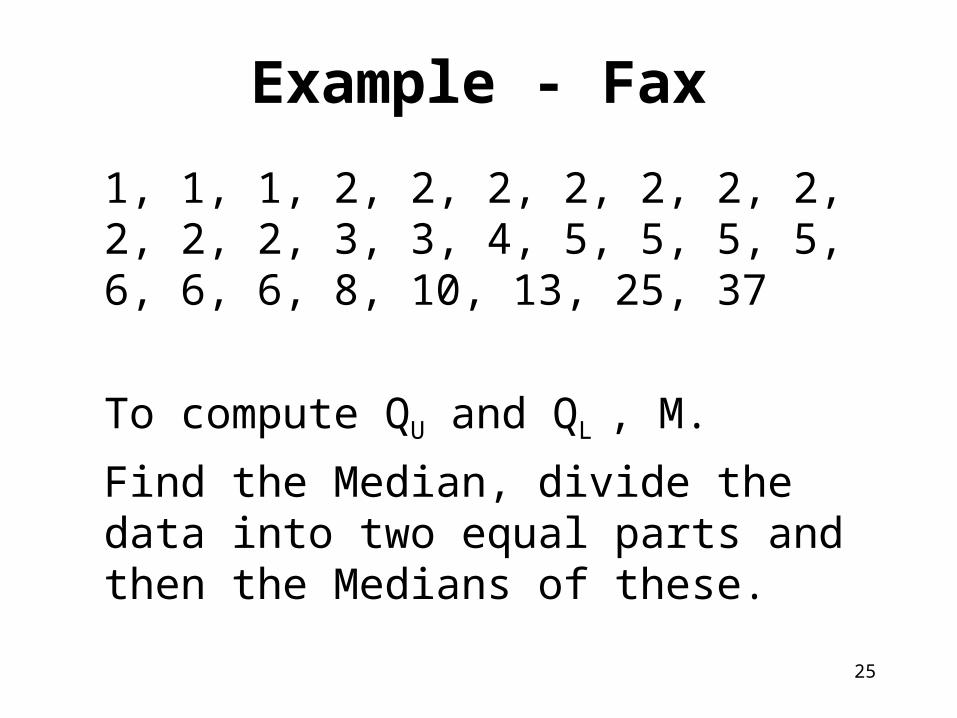
1, 1, 1, 2, 2, 2, 2, 2, 2, 2, 2, 2, 2, 3, 3, 4, 5, 5, 5, 5, 6, 6, 6, 8, 10, 13, 25, 37
To compute QU and QL , M.
Find the Median, divide the data into two equal parts and then the Medians of these.
26
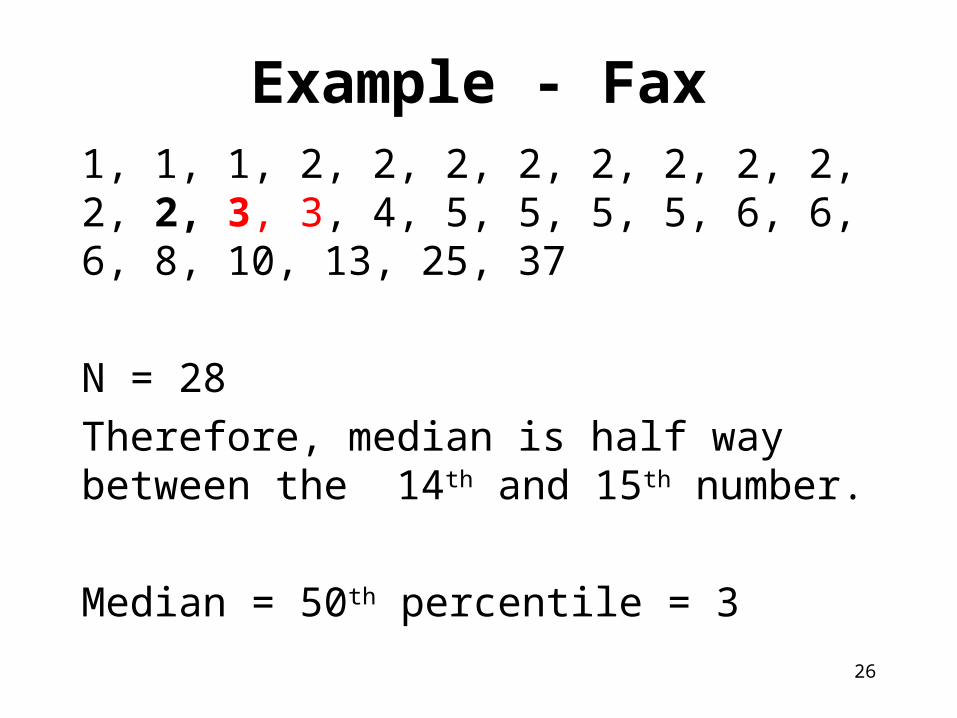
Example - Fax1, 1, 1, 2, 2, 2, 2, 2, 2, 2, 2, 2, 2, 3, 3, 4, 5, 5, 5, 5, 6, 6, 6, 8, 10, 13, 25, 37
N = 28
Therefore, median is half way between the 14th and 15th number.
Median = 50th percentile = 3
27
Example - Fax
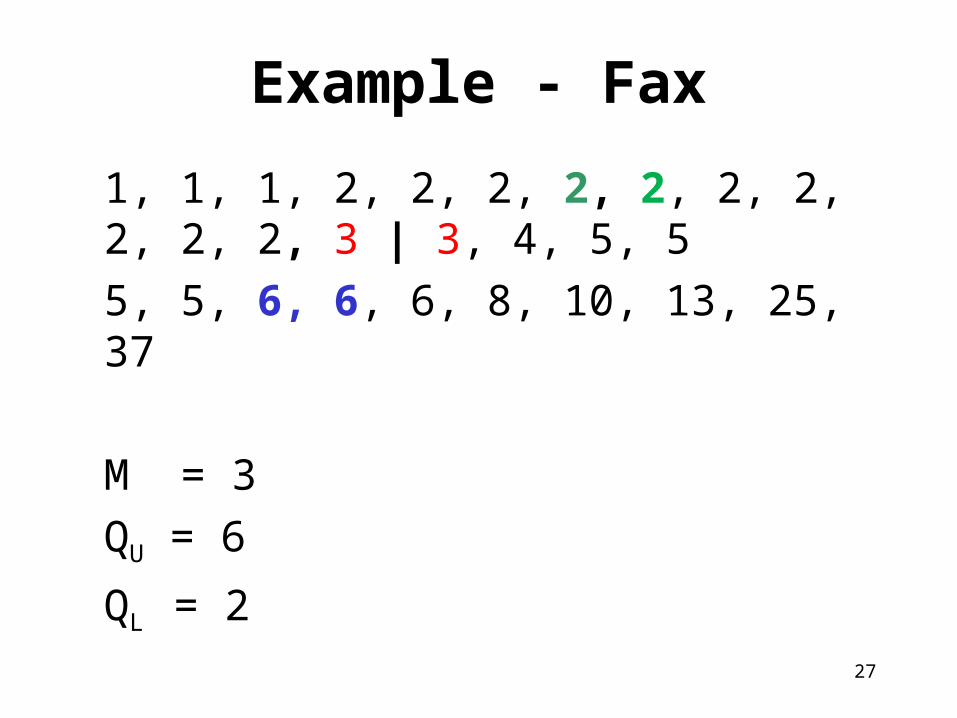
1, 1, 1, 2, 2, 2, 2, 2, 2, 2, 2, 2, 2, 3 | 3, 4, 5, 5
5, 5, 6, 6, 6, 8, 10, 13, 25, 37
M = 3
QU = 6
QL = 2
IQR=6-2=4.
28
Percentiles
Sometimes the IQR, is a better measure of variance then the standard deviation since it only depends on the center 50% of the data. That is, it is not effected at all by outliers.
29
Percentiles
Sometimes the IQR, is a better measure of variance then the standard deviation since it only depends on the center 50% of the data. That is, it is not effected at all by outliers.
To use the IQR as a measure of variance we need to find the Five Number Summary of the data and then construct a Box Plot.
30
Five Number Summary and Outliers
The Five Number Summary of a data set consists of five numbers,
– MIN, QL , M, QU , Max
31
Five Number Summary and Outliers
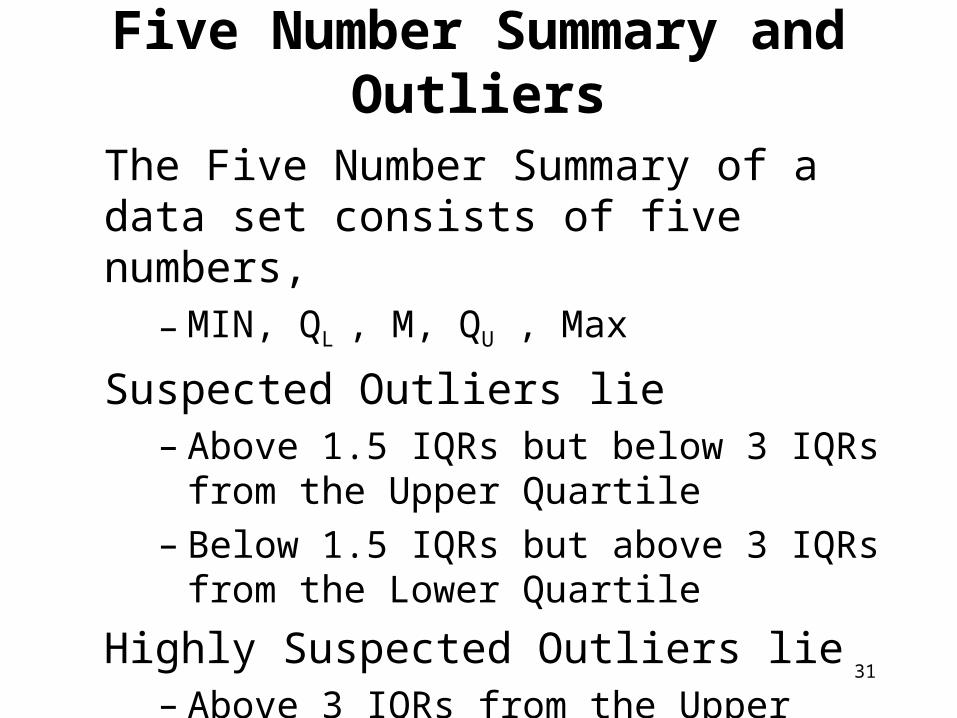
The Five Number Summary of a data set consists of five numbers,
– MIN, QL , M, QU , Max
Suspected Outliers lie – Above 1.5 IQRs but below 3 IQRs from the
Upper Quartile– Below 1.5 IQRs but above 3 IQRs from the
Lower Quartile
Highly Suspected Outliers lie – Above 3 IQRs from the Upper Quartile– Below 3 IQRs from the Lower Quartile.
32
Five Number Summary and Outliers
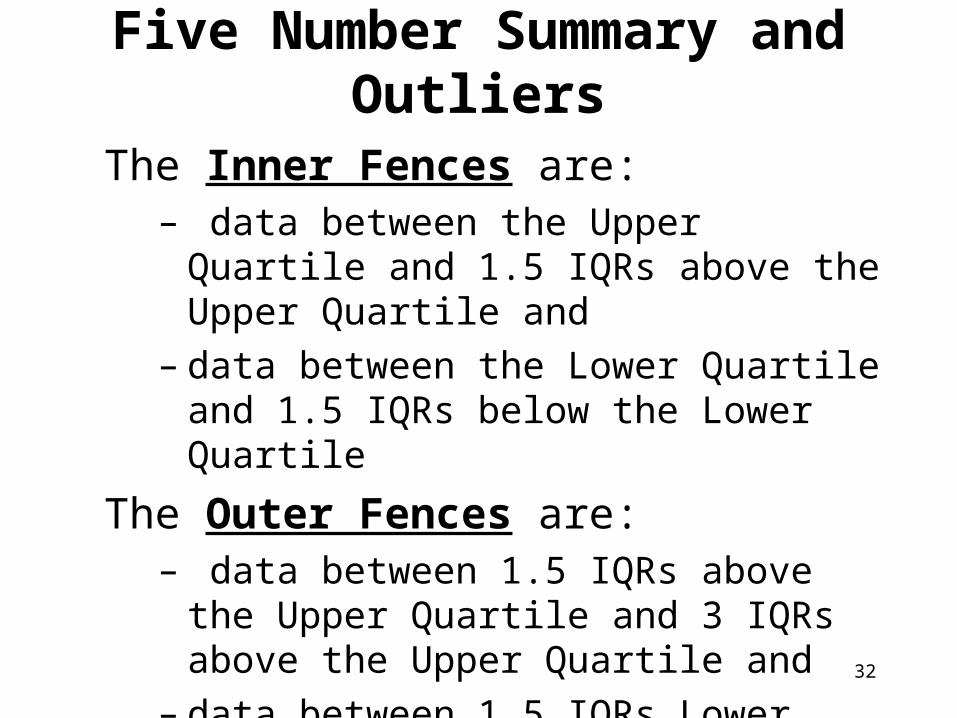
The Inner Fences are:– data between the Upper Quartile and 1.5 IQRs
above the Upper Quartile and– data between the Lower Quartile and 1.5 IQRs
below the Lower Quartile
The Outer Fences are:– data between 1.5 IQRs above the Upper
Quartile and 3 IQRs above the Upper Quartile and
– data between 1.5 IQRs Lower Quartile and 3 IQRs below the Lower Quartile
33
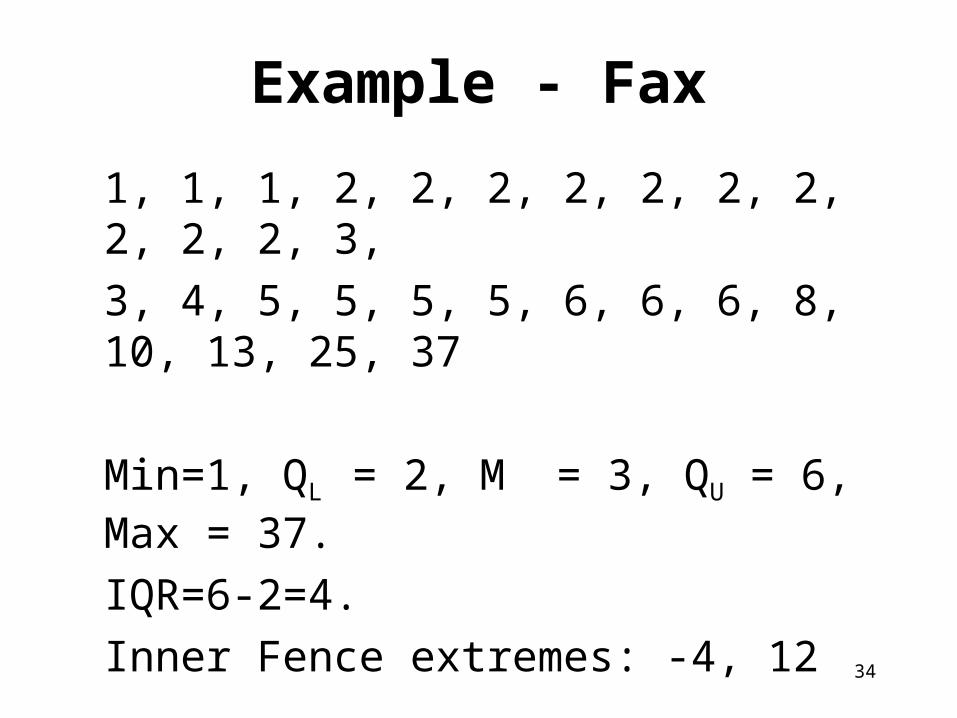
Example - Fax
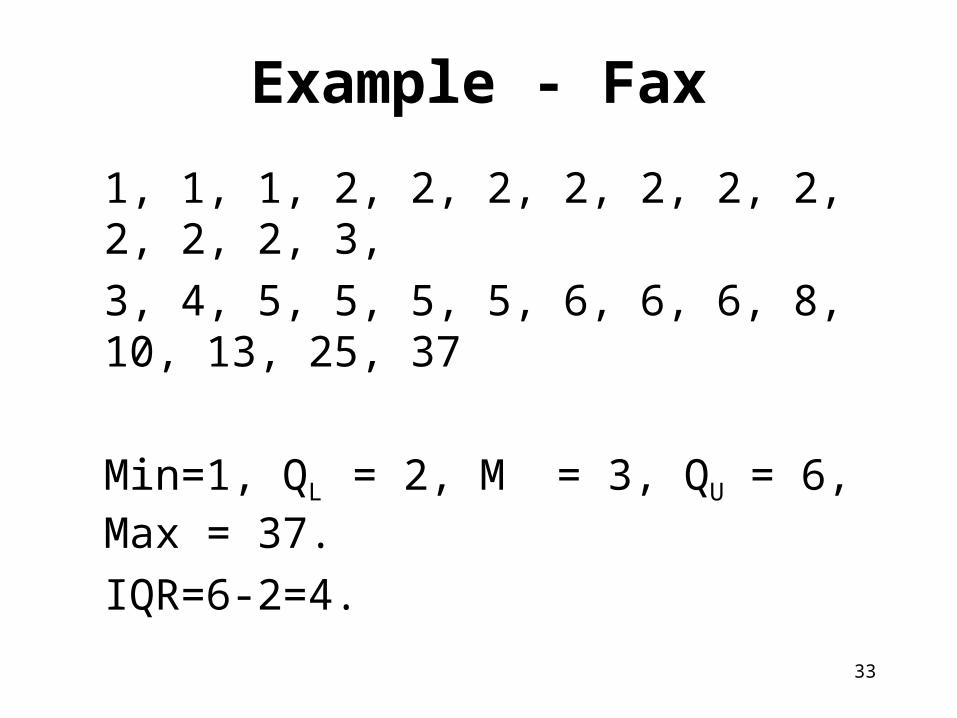
1, 1, 1, 2, 2, 2, 2, 2, 2, 2, 2, 2, 2, 3,
3, 4, 5, 5, 5, 5, 6, 6, 6, 8, 10, 13, 25, 37
Min=1, QL = 2, M = 3, QU = 6, Max = 37.
IQR=6-2=4.
34
Example - Fax
1, 1, 1, 2, 2, 2, 2, 2, 2, 2, 2, 2, 2, 3,
3, 4, 5, 5, 5, 5, 6, 6, 6, 8, 10, 13, 25, 37
Min=1, QL = 2, M = 3, QU = 6, Max = 37.
IQR=6-2=4.
Inner Fence extremes: -4, 12
35
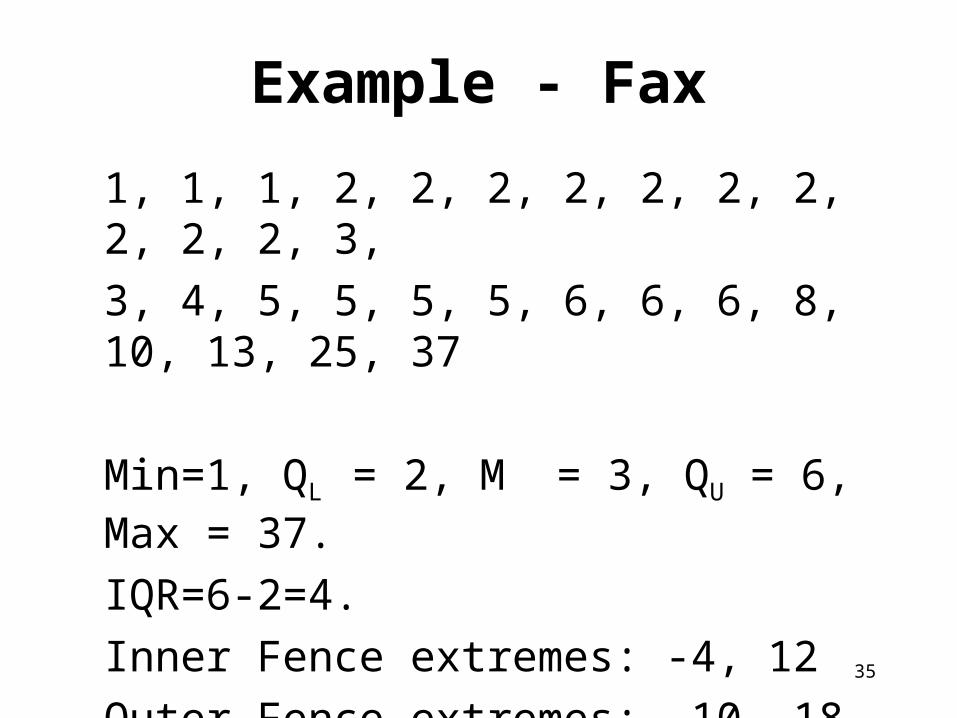
Example - Fax
1, 1, 1, 2, 2, 2, 2, 2, 2, 2, 2, 2, 2, 3,
3, 4, 5, 5, 5, 5, 6, 6, 6, 8, 10, 13, 25, 37
Min=1, QL = 2, M = 3, QU = 6, Max = 37.
IQR=6-2=4.
Inner Fence extremes: -4, 12
Outer Fence extremes: -10, 18
36
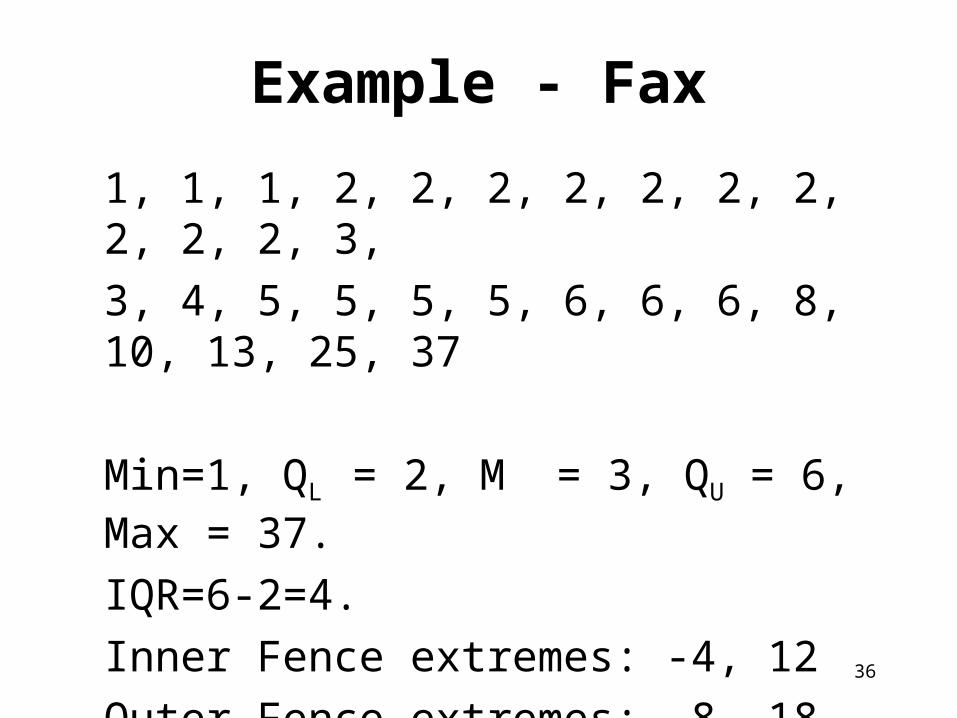
Example - Fax
1, 1, 1, 2, 2, 2, 2, 2, 2, 2, 2, 2, 2, 3,
3, 4, 5, 5, 5, 5, 6, 6, 6, 8, 10, 13, 25, 37
Min=1, QL = 2, M = 3, QU = 6, Max = 37.
IQR=6-2=4.
Inner Fence extremes: -4, 12
Outer Fence extremes: -8, 18
Suspected Outliers: 13
Highly Suspected Outliers: 25, 37
37
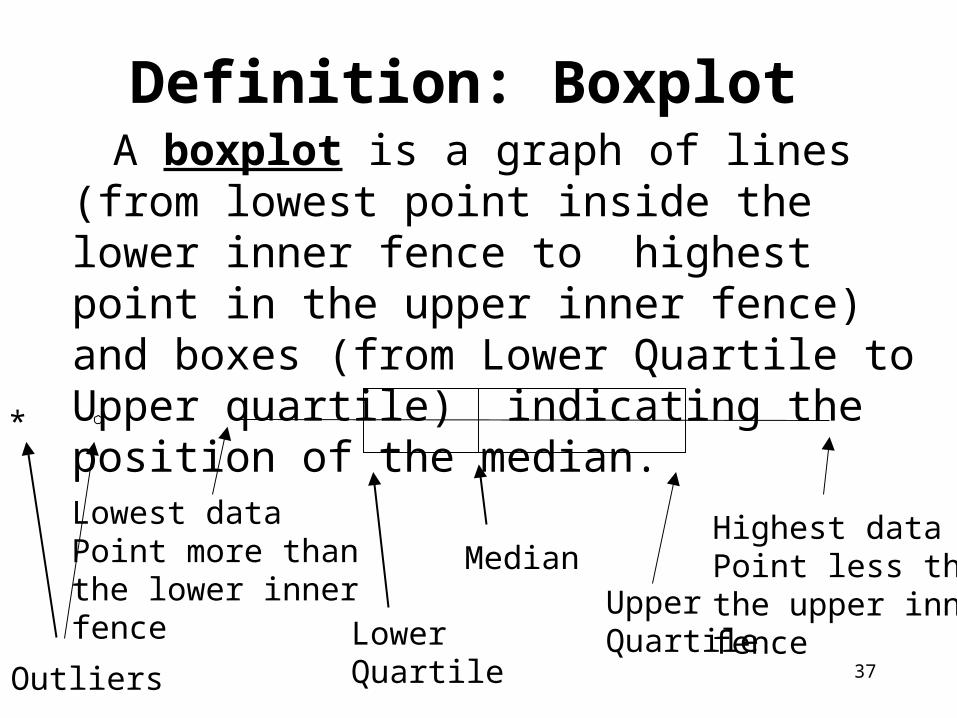
Definition: Boxplot A boxplot is a graph of lines (from lowest point
inside the lower inner fence to highest point in the upper inner fence) and boxes (from Lower Quartile to Upper quartile) indicating the position of the median.
Outliers
MedianHighest data Point less than the upper inner fenceLower
Quartile
UpperQuartile
*
Lowest data Point more than the lower inner fence