Embed Size (px)
Citation preview
1
Quantifying the Digital Divide:focus Africa
Prepared by Les Cottrell, SLAC
for the NSF IRNC meeting , March 11, 2005www.slac.stanford.edu/grp/scs/net/talk05/nsf-irnc-mar05.ppt
Source: IDRC 2005
PingER
2
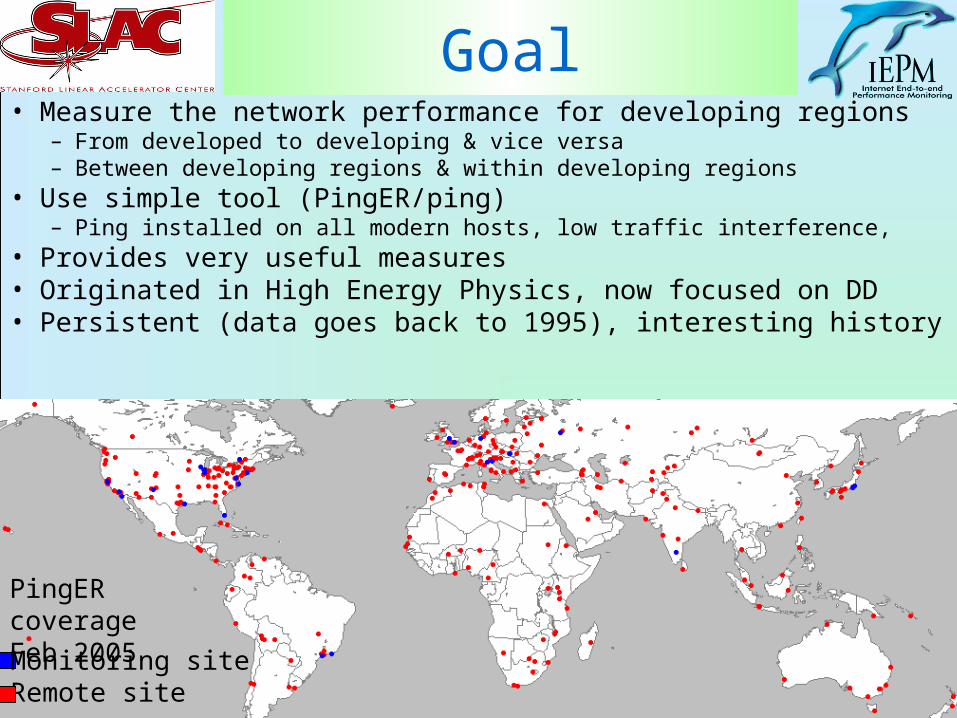
Goal• Measure the network performance for developing regions
– From developed to developing & vice versa– Between developing regions & within developing regions
• Use simple tool (PingER/ping)– Ping installed on all modern hosts, low traffic interference,
• Provides very useful measures• Originated in High Energy Physics, now focused on DD• Persistent (data goes back to 1995), interesting history
Monitoring siteRemote site
PingER coverage Feb 2005
3
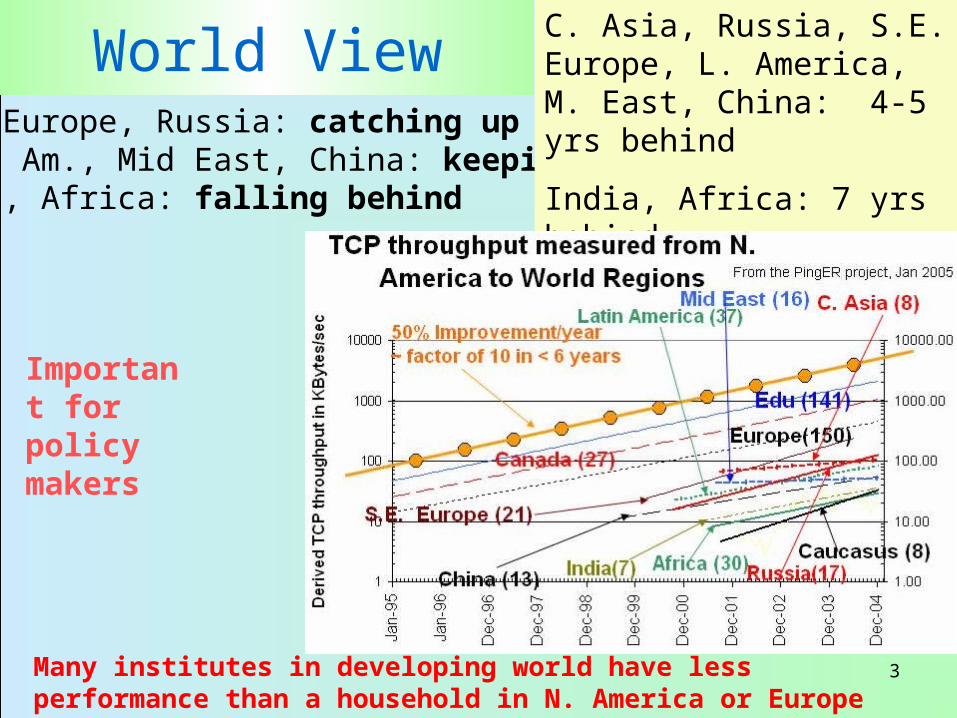
World ViewS.E. Europe, Russia: catching upLatin Am., Mid East, China: keeping upIndia, Africa: falling behind
C. Asia, Russia, S.E. Europe, L. America, M. East, China: 4-5 yrs behind
India, Africa: 7 yrs behind
Important for policy makers
Many institutes in developing world have less performance than a household in N. America or Europe
4
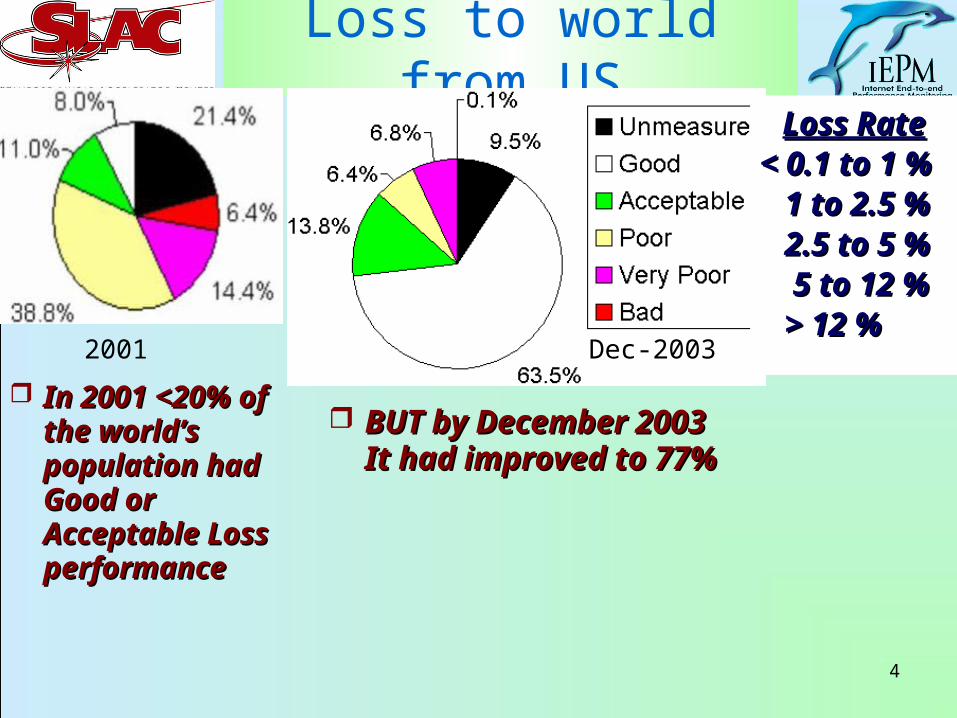
Loss to world from US
2001 Dec-2003
In 2001 <20% of In 2001 <20% of the world’s the world’s population had population had Good or Good or Acceptable Loss Acceptable Loss performanceperformance
Loss RateLoss Rate< 0.1 to 1 %< 0.1 to 1 % 1 to 2.5 %1 to 2.5 % 2.5 to 5 %2.5 to 5 % 5 to 12 %5 to 12 % > 12 %> 12 %
BUT by December 2003BUT by December 2003It had improved to 77%It had improved to 77%
5
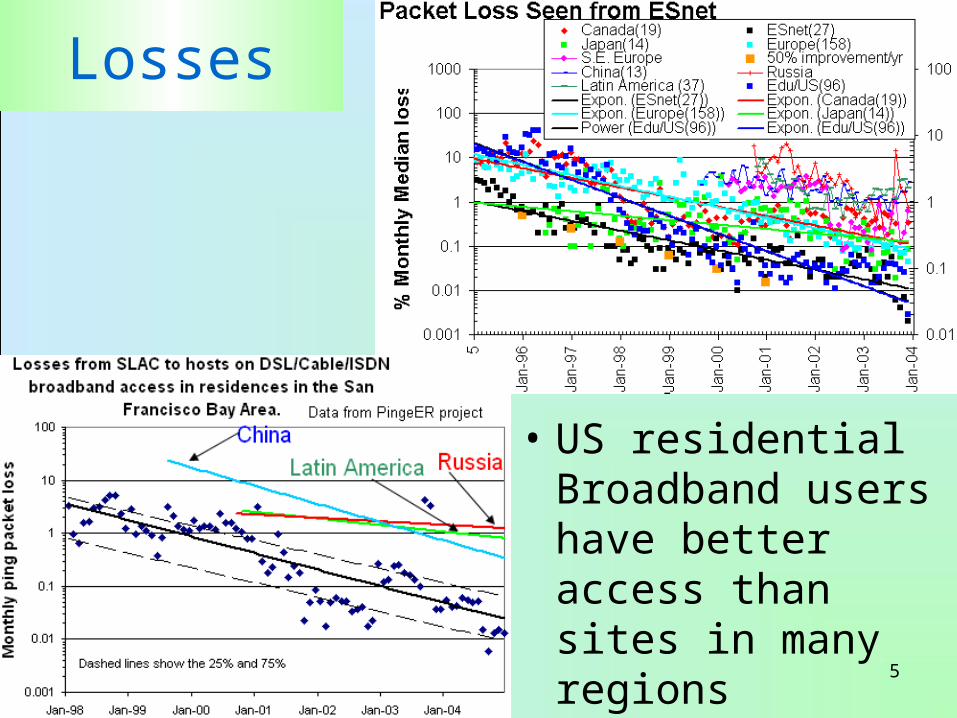
Losses
• US residential Broadband users have better access than sites in many regions
6
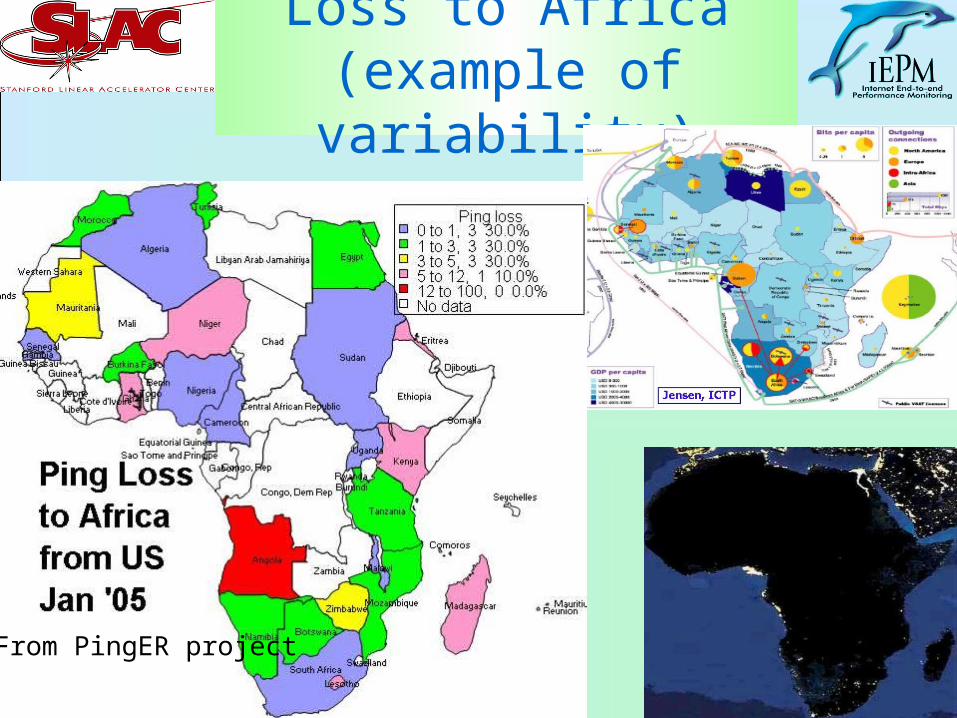
Loss to Africa (example of variability)
From PingER project
7
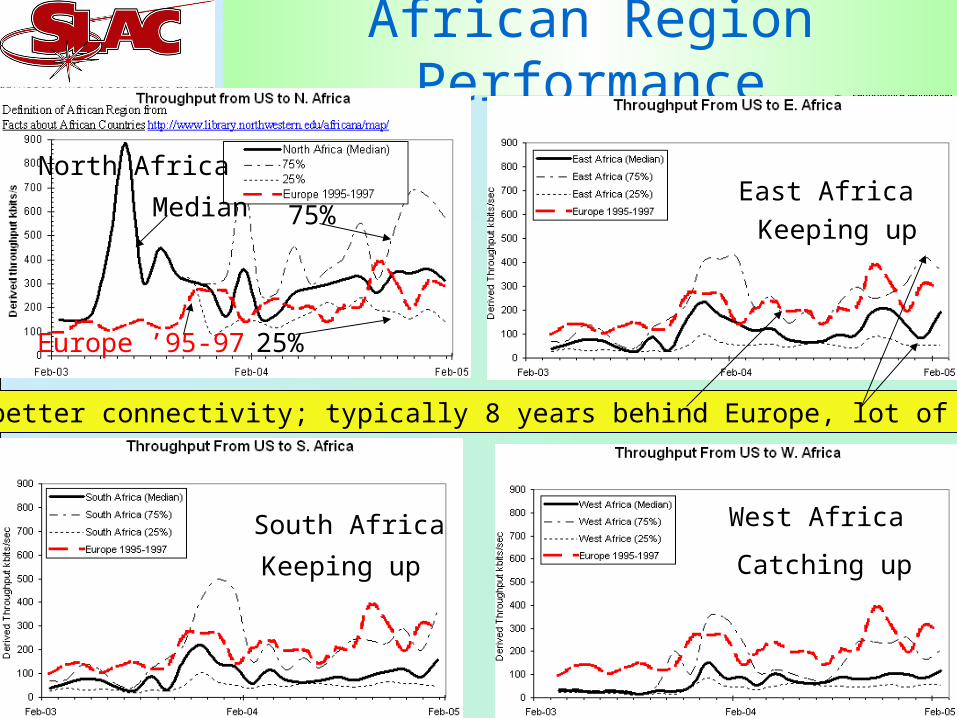
African Region Performance
N. Africa has better connectivity; typically 8 years behind Europe, lot of variability
West Africa
East Africa
South Africa
North Africa
Keeping up
Keeping up
Catching up
Median 75%
25%Europe ’95-97
8
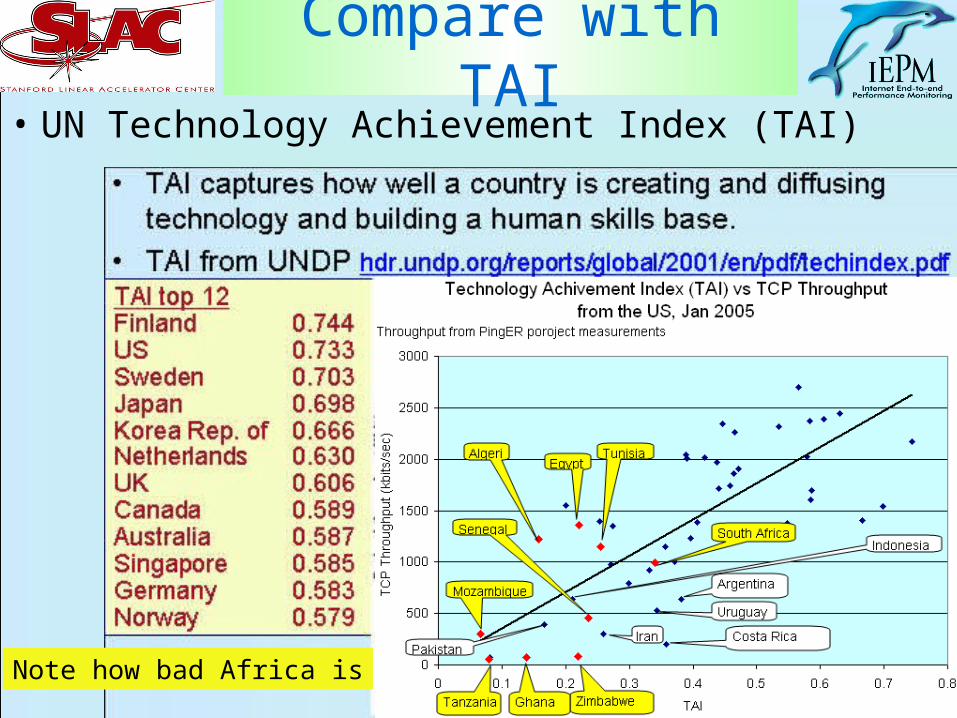
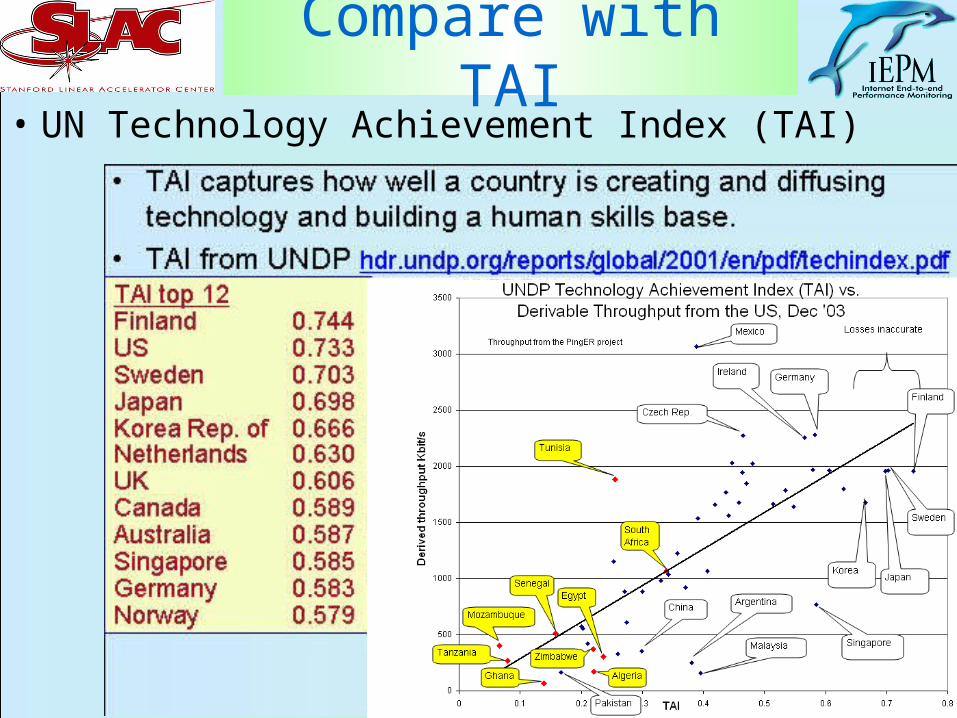
Compare with TAI• UN Technology Achievement Index (TAI)
Note how bad Africa is
9
Collaborations/funding• Good news:
– Active collaboration with NIIT Pakistan to develop network monitoring including PingER
• Travel funded by US State department for 1 year
– FNAL & SLAC continue support for PingER management and coordination
• Bad news (Operational support currently unfunded, could disappear):– DoE funding for PingER terminated
• Hard to get funding for operational needs (~0.3 FTE)– For quality data need constant vigilance (host disappear,
security blocks pings, need to update remote host lists, hosts move (e.g. proxy web servers …)
10
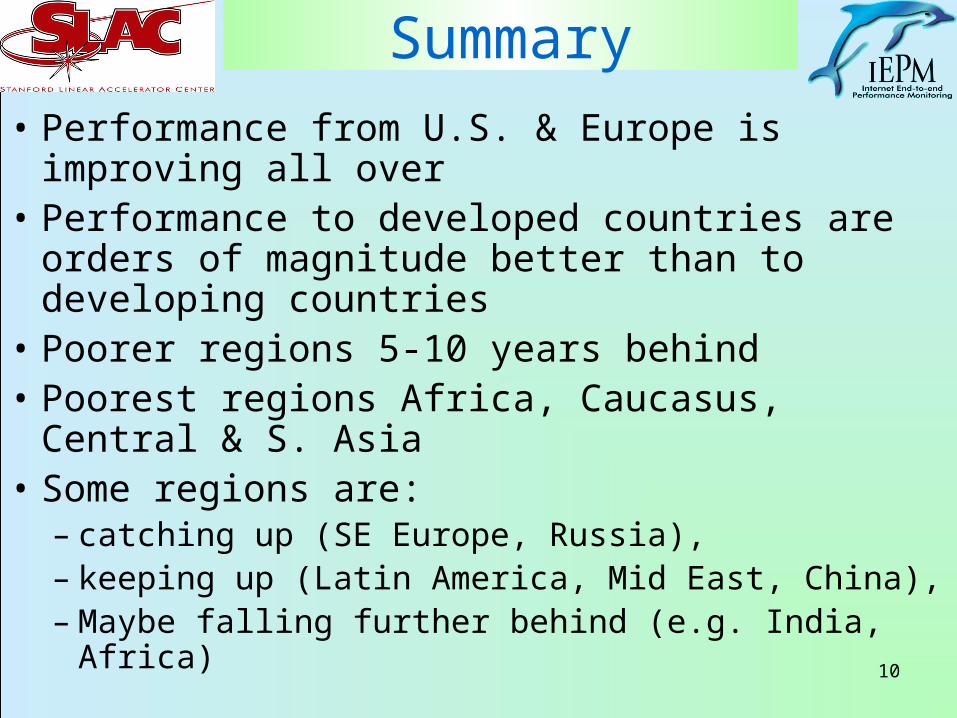
Summary
• Performance from U.S. & Europe is improving all over
• Performance to developed countries are orders of magnitude better than to developing countries
• Poorer regions 5-10 years behind• Poorest regions Africa, Caucasus, Central & S.
Asia• Some regions are:
– catching up (SE Europe, Russia), – keeping up (Latin America, Mid East, China), – Maybe falling further behind (e.g. India, Africa)
11
Further Information
• PingER project home site– http://www-iepm.slac.stanford.edu/pinger/
• PingER methodology (presented at I2 Apr 22 ’04)– http://www.slac.stanford.edu/grp/scs/net/talk03/i2-method-
apr04.ppt
• ICFA/SCIC Network Monitoring report– http://www.slac.stanford.edu/xorg/icfa/icfa-net-paper-
jan05/20050206-netmon.doc
• ICFA/SCIC home site– http://icfa-scic.web.cern.ch/ICFA-SCIC/

12
Extra slides
13
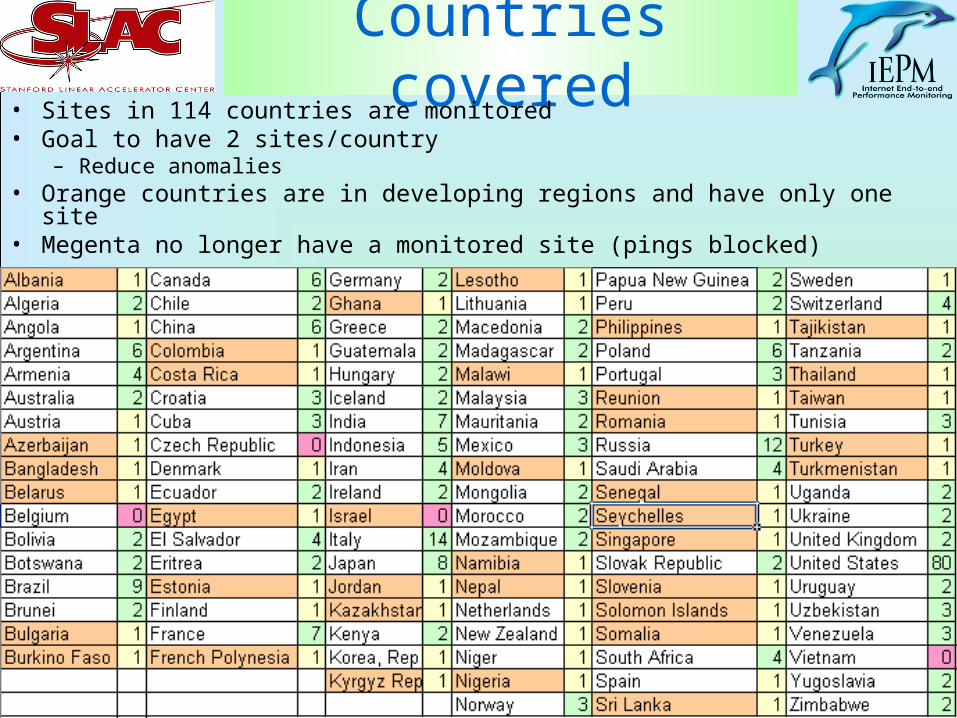
Countries covered• Sites in 114 countries are monitored• Goal to have 2 sites/country
– Reduce anomalies• Orange countries are in developing regions and have only one site• Megenta no longer have a monitored site (pings blocked)
14
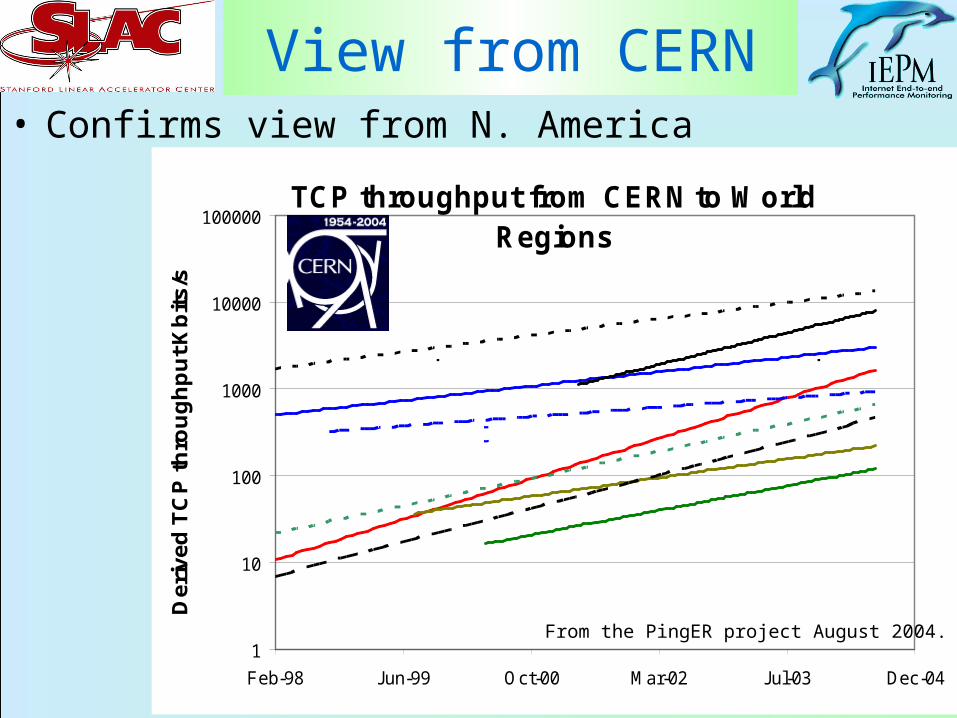
View from CERN• Confirms view from N. America
TCP throughput from CERN to World Regions
1
10
100
1000
10000
100000
Feb-98 Jun-99 Oct-00 Mar-02 Jul-03 Dec-04
De
riv
ed
TC
P t
hro
ug
hp
ut
Kb
its
/s
Europe
N America
SE Europe
M East
Russia
L America
AfricaChina
India
From the PingER project August 2004.
15
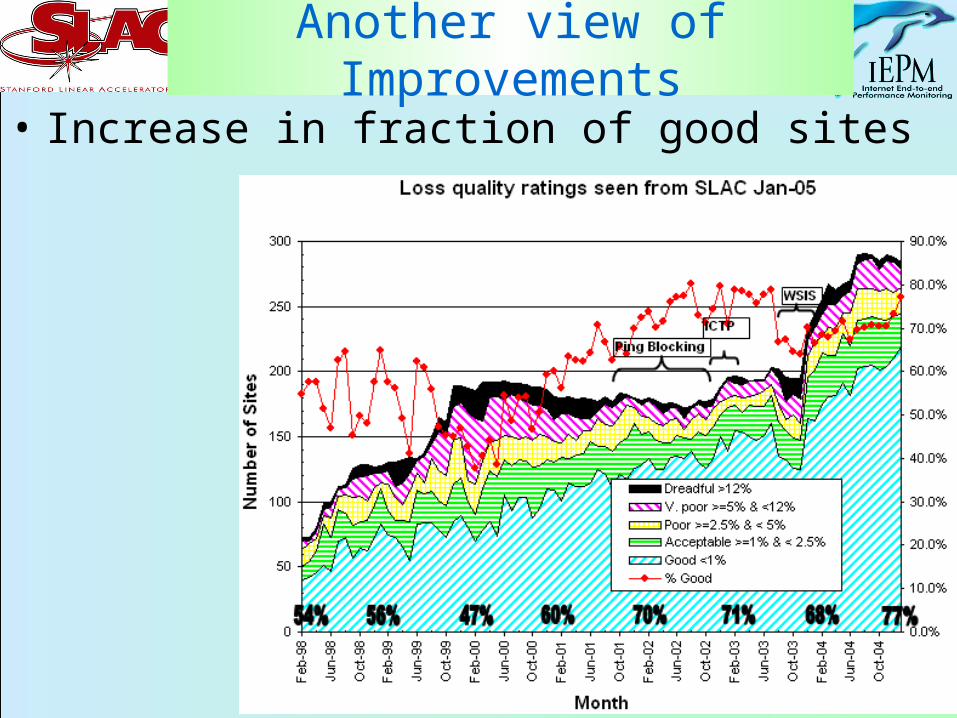
Another view of Improvements
• Increase in fraction of good sites
16
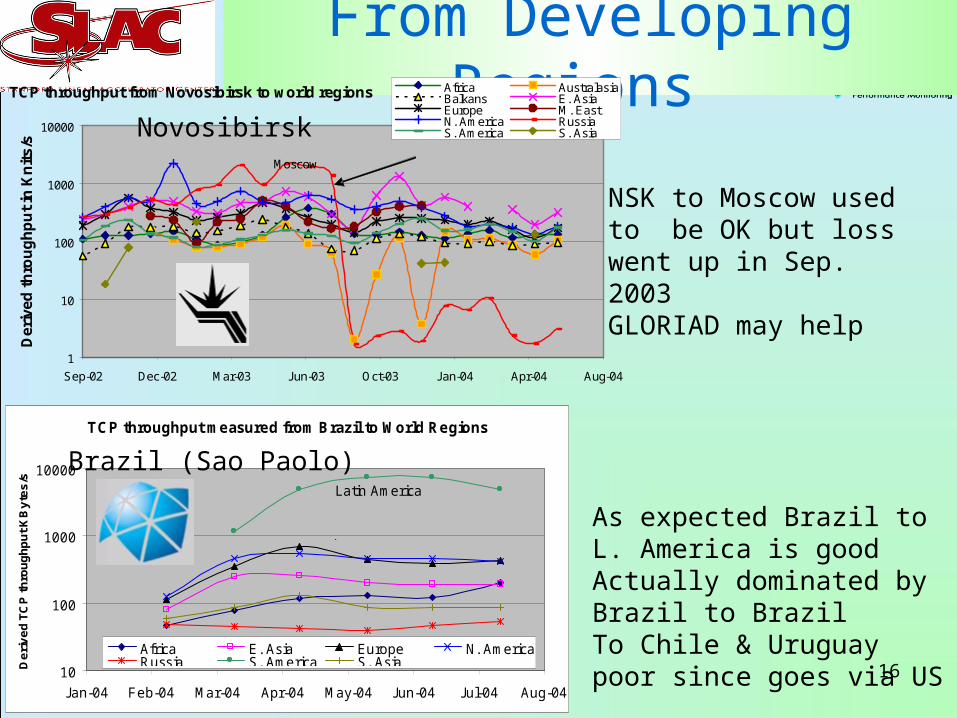
From Developing Regions
TCP throughput measured from Brazil to World Regions
10
100
1000
10000
Jan-04 Feb-04 Mar-04 Apr-04 May-04 Jun-04 Jul-04 Aug-04
De
riv
ed
TC
P t
hro
ug
hp
ut
KB
yte
s/s
Africa E. Asia Europe N. AmericaRussia S. America S. Asia
Latin America
Europe N. America
As expected Brazil to L. America is goodActually dominated by Brazil to BrazilTo Chile & Uruguay poor since goes via US
Brazil (Sao Paolo)
Novosibirsk
NSK to Moscow used to be OK but loss went up in Sep. 2003 GLORIAD may help
TCP throughput from Novosibirsk to world regions
1
10
100
1000
10000
Sep-02 Dec-02 Mar-03 Jun-03 Oct-03 Jan-04 Apr-04 Aug-04
Der
ived
th
rou
gh
pu
t in
Kn
its/
s
Africa AustralasiaBalkans E. AsiaEurope M. EastN. America RussiaS. America S. Asia
big loss increase to Moscow (from < 1% to 2-3%)Moscow
Japan/ChinaN. America
Novosibirsk
17
Within Developing Regions
• In ’80s many Eu countries connected via US• Today often communications within developing
regions to go via developed region, e.g.– Rio to Sao Paola goes directly within Brazil – But Rio to Buenos Aires goes via Florida
• And…–NIIT – NSC (Rawalpindi – Islamabad) few miles apart,
•Route goes via England!!!!•Takes longer to go few miles than to SLAC!
• Doubles international link traffic, increases delays, increases dependence on others
• Within a region can be big differences between sites/countries, due to service providers
18
Compare with TAI• UN Technology Achievement Index (TAI)