Embed Size (px)
Citation preview
1
High Performance Network Monitoring Challenges for Grids
Les Cottrell, SLAC
Presented at the International Symposium on Grid Computing 2006, Taiwan
www.slac.stanford.edu/grp/scs/net/talk05/iscg-06.ppt
Partially funded by DOE/MICS for Internet End-to-end Performance Monitoring (IEPM)
2
Why & Outline• Data intensive sciences (e.g. HEP) needs to move
large volumes of data worldwide– Requires understanding and effective use of fast networks– Requires continuous monitoring and interpretation
• For HEP LHC-OPN focus on tier 0 and tier 1 sites, i.e. just a few sites
• Outline of talk:– What does monitoring provide?– Active E2E measurements today and some challenges– Visualization, forecasting, problem ID– Passive monitoring
• Netflow,
• Some conclusions
3
Uses of Measurements• Automated problem identification & trouble shooting:
– Alerts for network administrators, e.g. • Bandwidth changes in time-series, iperf, SNMP
– Alerts for systems people• OS/Host metrics
• Forecasts for Grid Middleware, e.g. replica manager, data placement
• Engineering, planning, SLA (set & verify), expectations• Also (not addressed here):
– Security: spot anomalies, intrusion detection– Accounting
4
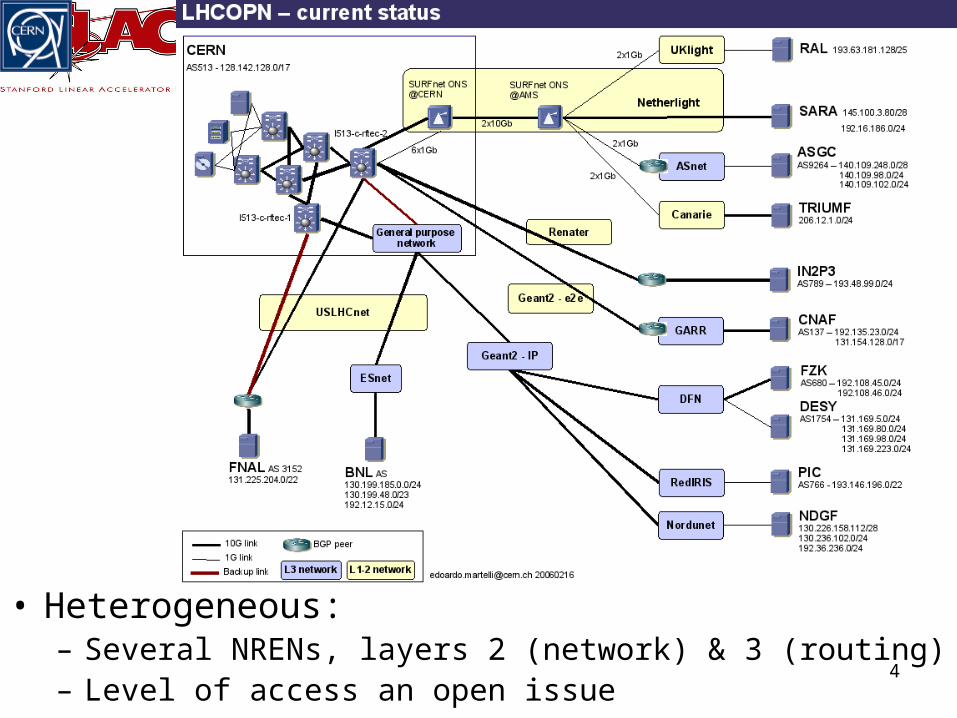
• Heterogeneous:– Several NRENs, layers 2 (network) & 3 (routing)– Level of access an open issue
5
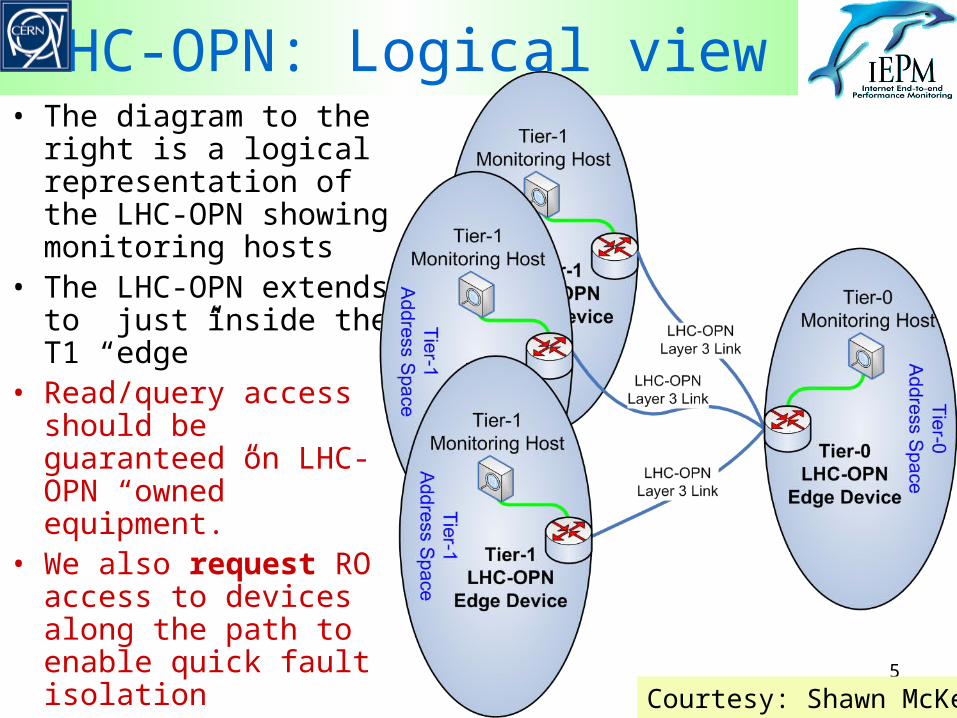
LHC-OPN: Logical view• The diagram to the right
is a logical representation of the LHC-OPN showing monitoring hosts
• The LHC-OPN extends to just inside the T1 “edge”
• Read/query access should be guaranteed on LHC-OPN “owned” equipment.
• We also request RO access to devices along the path to enable quick fault isolation
Courtesy: Shawn McKee
6
Active E2E Monitoring
7
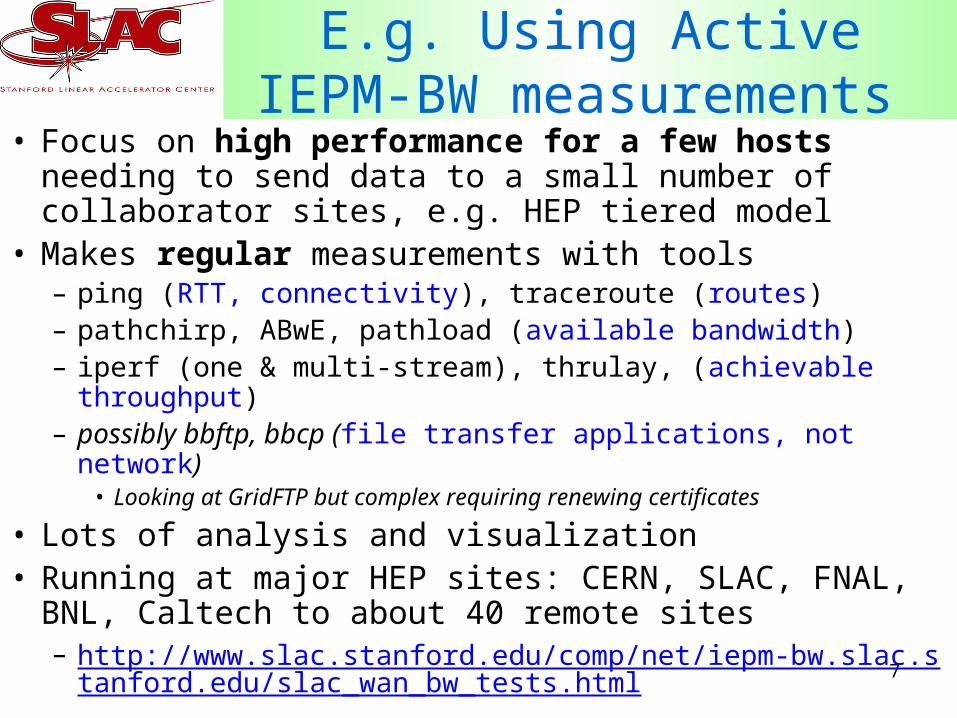
E.g. Using Active IEPM-BW measurements
• Focus on high performance for a few hosts needing to send data to a small number of collaborator sites, e.g. HEP tiered model
• Makes regular measurements with tools– ping (RTT, connectivity), traceroute (routes) – pathchirp, ABwE, pathload (available bandwidth)– iperf (one & multi-stream), thrulay, (achievable throughput)– possibly bbftp, bbcp (file transfer applications, not network)
• Looking at GridFTP but complex requiring renewing certificates
• Lots of analysis and visualization• Running at major HEP sites: CERN, SLAC, FNAL,
BNL, Caltech to about 40 remote sites– http://www.slac.stanford.edu/comp/net/iepm-bw.slac.stanford
.edu/slac_wan_bw_tests.html
8
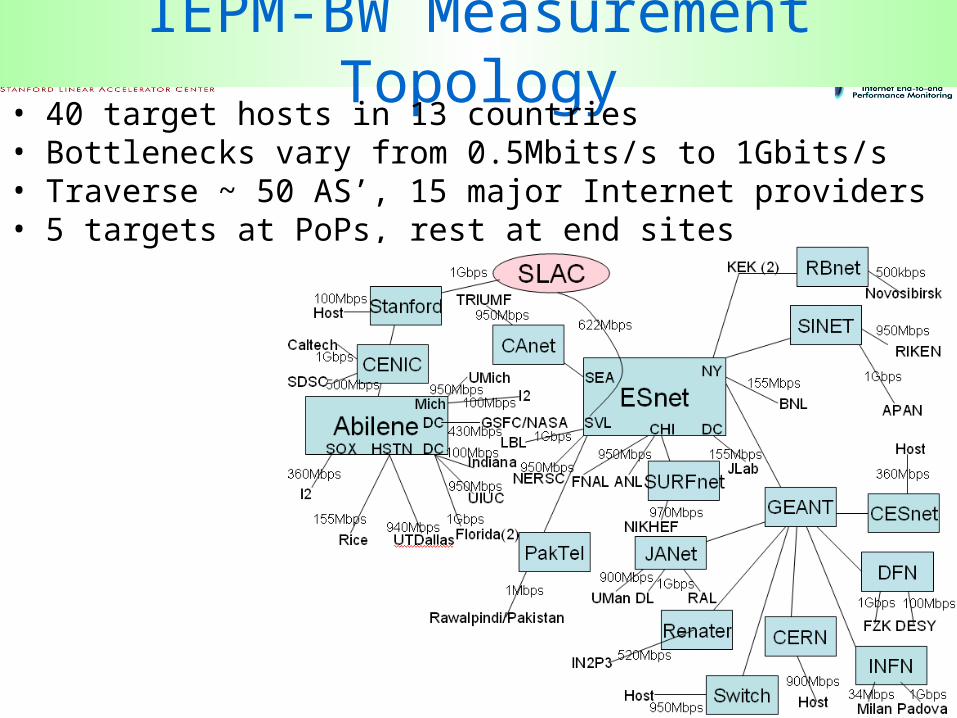
IEPM-BW Measurement Topology• 40 target hosts in 13 countries• Bottlenecks vary from 0.5Mbits/s to 1Gbits/s• Traverse ~ 50 AS’, 15 major Internet providers• 5 targets at PoPs, rest at end sites
9
Ping/traceroute• Ping still useful (plus ca reste …)
– Is path connected/node reachable?– RTT, jitter, loss– Great for low performance links (e.g. Digital Divide), e.g.
AMP (NLANR)/PingER (SLAC)– Nothing to install, but blocking
• OWAMP/I2 similar but One Way– But needs server installed at other end and good timers– Being built into IEPM-BW
• Traceroute– Needs good visualization (traceanal/SLAC) – No use for dedicated λ layer 1 or 2
• However still want to know topology of paths
10
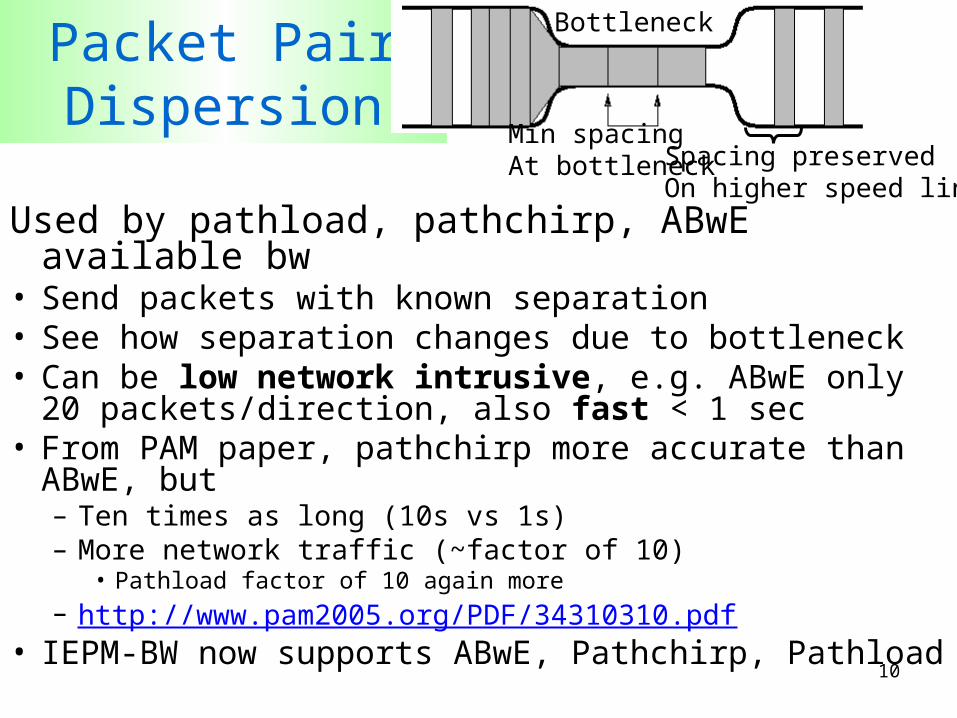
Packet Pair Dispersion
Used by pathload, pathchirp, ABwE available bw• Send packets with known separation• See how separation changes due to bottleneck• Can be low network intrusive, e.g. ABwE only 20
packets/direction, also fast < 1 sec• From PAM paper, pathchirp more accurate than
ABwE, but– Ten times as long (10s vs 1s)– More network traffic (~factor of 10)
• Pathload factor of 10 again more– http://www.pam2005.org/PDF/34310310.pdf
• IEPM-BW now supports ABwE, Pathchirp, Pathload
Bottleneck
Min spacingAt bottleneck Spacing preserved
On higher speed links
11
BUT…• Packet pair dispersion relies on accurate timing
of inter packet separation– At > 1Gbps this is getting beyond resolution of Unix
clocks– AND 10GE NICs are offloading function
• Coalescing interrupts, Large Send & Receive Offload, TOE
• Need to work with TOE vendors– Turn off offload (Neterion supports multiple channels, can
eliminate offload to get more accurate timing in host)– Do timing in NICs– No standards for interfaces
• Possibly use packet trains, e.g. pathneck
12
Achievable Throughput• Use TCP or UDP to send as much data as can
memory to memory from source to destination
• Tools: iperf (bwctl/I2), netperf, thrulay (from Stas Shalunov/I2), udpmon …
• Pseudo file copy: Bbcp and GridFTP also have memory to memory mode to avoid disk/file problems
13
BUT…• At 10Gbits/s on transatlantic path Slow start
takes over 6 seconds– To get 90% of measurement in congestion
avoidance need to measure for 1 minute (5.25 GBytes at 7Gbits/s (today’s typical performance)
• Needs scheduling to scale, even then …
• It’s not disk-to-disk or application-to application– So use bbcp, bbftp, or GridFTP

14
AND …• For testbeds such as UltraLight,
UltraScienceNet etc. have to reserve the path– So the measurement infrastructure needs to add
capability to reserve the path (so need API to reservation application)
– OSCARS from ESnet developing a web services interface (http://www.es.net/oscars/):
• For lightweight have a “persistent” capability• For more intrusive, must reserve just before make
measurement

15
Visualization & Forecasting in Real
World
16
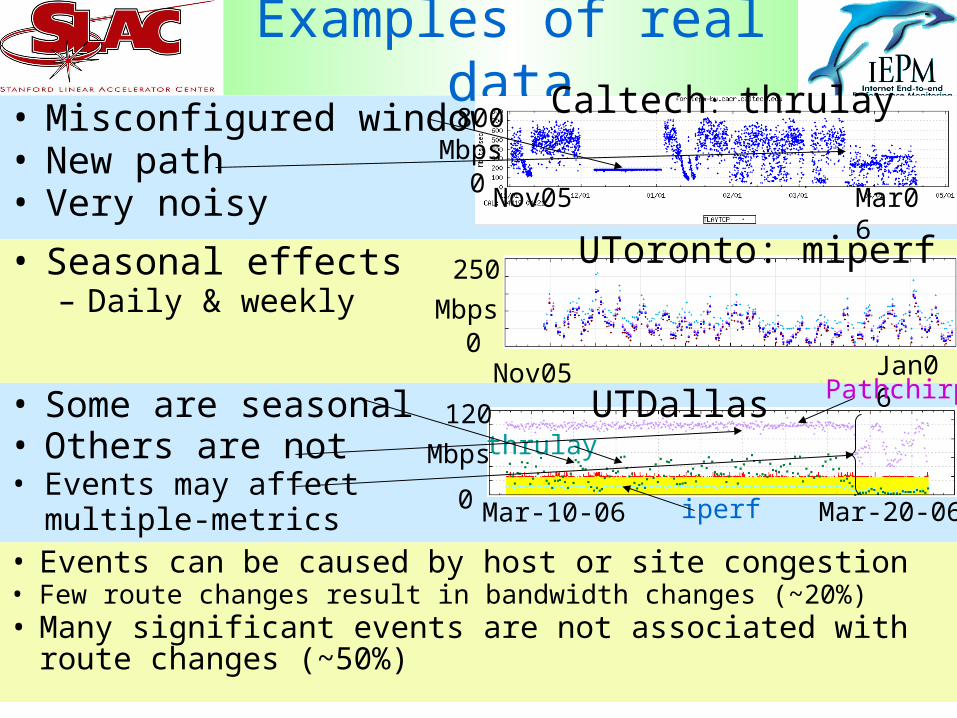
• Some are seasonal• Others are not• Events may affect
multiple-metrics
• Misconfigured windows• New path• Very noisy
Examples of real data
• Seasonal effects– Daily & weekly
Caltech: thrulay
Nov05
Mar060
800Mbps
UToronto: miperf
Nov05
Jan060
250
Mbps
UTDallas Pathchirp
thrulay
Mar-10-06 Mar-20-06iperf0
120
Mbps
• Events can be caused by host or site congestion• Few route changes result in bandwidth changes (~20%)• Many significant events are not associated with route
changes (~50%)
17
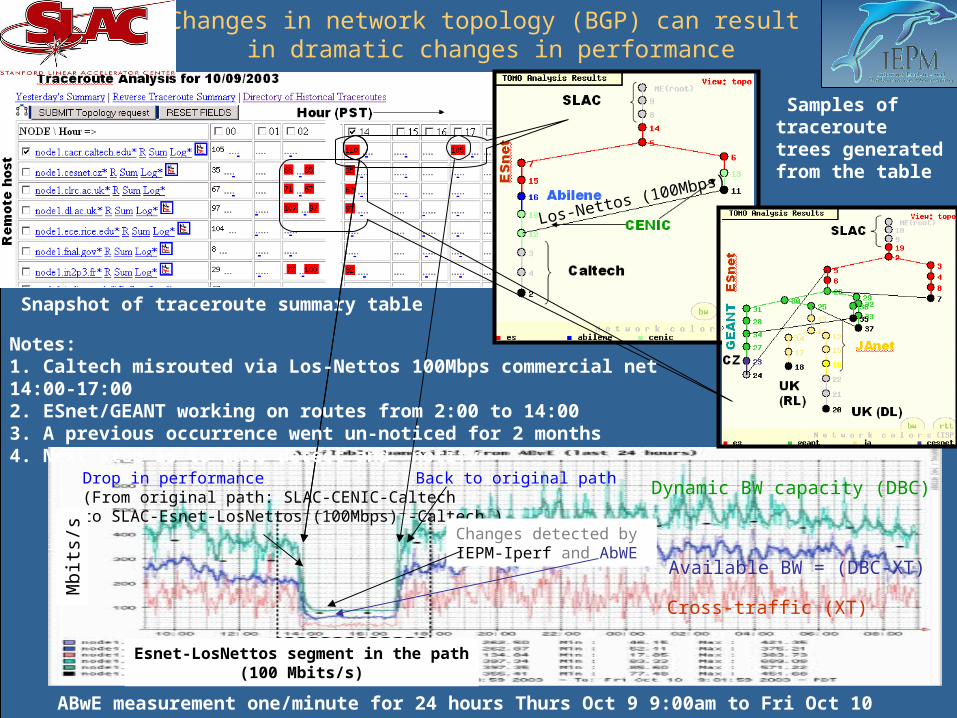
Changes in network topology (BGP) can result in dramatic changes in performance
Snapshot of traceroute summary table
Samples of traceroute trees generated from the table
ABwE measurement one/minute for 24 hours Thurs Oct 9 9:00am to Fri Oct 10 9:01am
Drop in performance(From original path: SLAC-CENIC-Caltech to SLAC-Esnet-LosNettos (100Mbps) -Caltech )
Back to original path
Changes detected by IEPM-Iperf and AbWE
Esnet-LosNettos segment in the path(100 Mbits/s)
Hour
Rem
ote
host
Dynamic BW capacity (DBC)
Cross-traffic (XT)
Available BW = (DBC-XT)
Mbit
s/s
Notes:1. Caltech misrouted via Los-Nettos 100Mbps commercial net 14:00-17:002. ESnet/GEANT working on routes from 2:00 to 14:003. A previous occurrence went un-noticed for 2 months4. Next step is to auto detect and notify
Los-Nettos (100Mbps)
18
However…• Elegant graphics are great to understand
problems BUT:– Can be thousands of graphs to look at (many site
pairs, many devices, many metrics)– Need automated problem recognition AND
diagnosis
• So developing tools to reliably detect significant, persistent changes in performance– Initially using simple plateau algorithm to detect
step changes
19
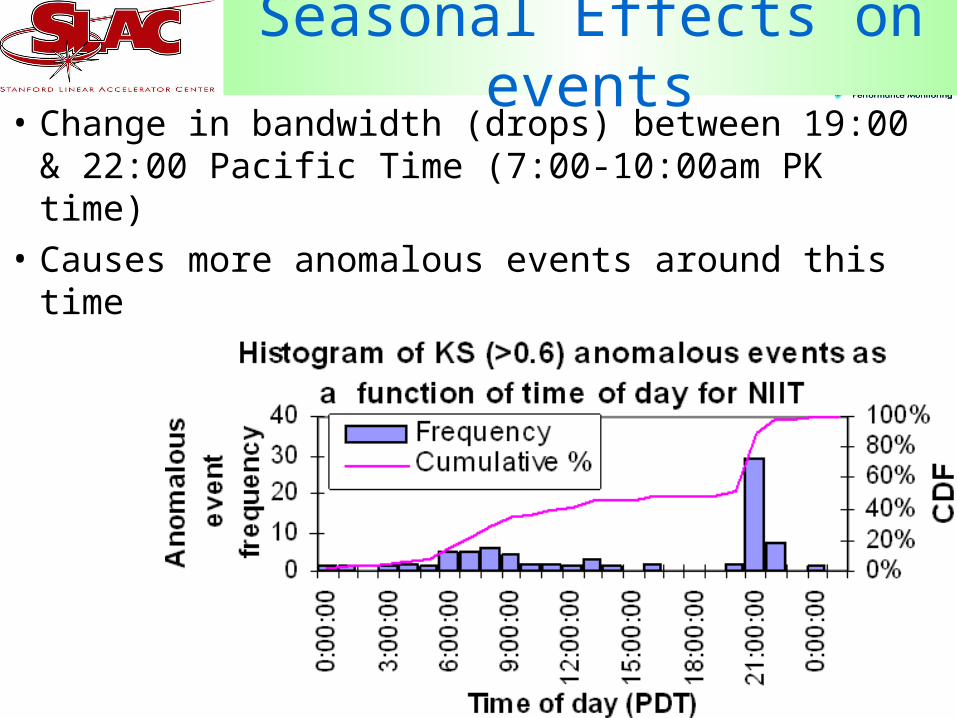
Seasonal Effects on events• Change in bandwidth (drops) between 19:00 &
22:00 Pacific Time (7:00-10:00am PK time)
• Causes more anomalous events around this time
20
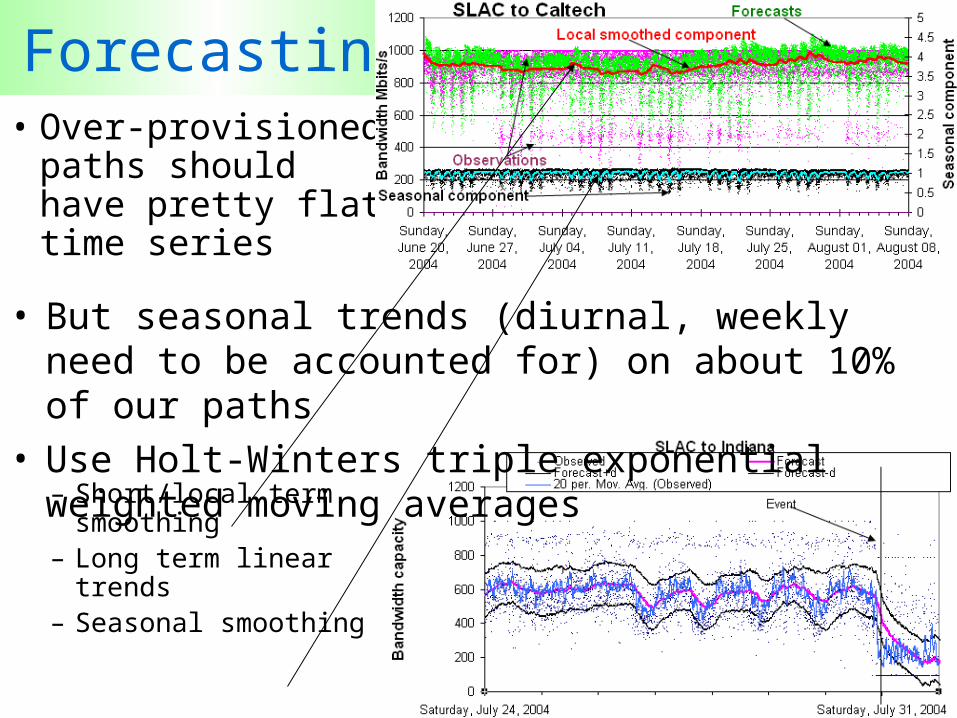
Forecasting• Over-provisioned
paths should have pretty flat time series
– Short/local term smoothing
– Long term linear trends
– Seasonal smoothing
• But seasonal trends (diurnal, weekly need to be accounted for) on about 10% of our paths
• Use Holt-Winters triple exponential weighted moving averages
21
Alerting• Have false positives down to reasonable level, so
sending alerts• Experimental• Typically few alerts per week.• Currently by email to network admins
– Adding pointers to extra information to assist admin in further diagnosing the problem, including:
• Traceroutes, monitoring host parms, time series for RTT, pathchirp, thrulay etc.
• Plan to add on-demand measurements (excited about perfSONAR)
• Working on:– Accounting for seasonal effects with Holt-Winters– Using ARMA/ARIMA for forecasting (used by economists)
– Automated diagnosing events
22
Passive• Active monitoring
– Pro: regularly spaced data on known paths, can make on-demand
– Con: adds data to network, can interfere with real data and measurements
• What about Passive?
23
Netflow et. al.• Switch identifies flow by sce/dst ports, protocol• Cuts record for each flow:
– src, dst, ports, protocol, TOS, start, end time
• Collect records and analyze• Can be a lot of data to collect each day, needs lot cpu
– Hundreds of MBytes to GBytes
• No intrusive traffic, real: traffic, collaborators, applications• No accounts/pwds/certs/keys• No reservations etc• Characterize traffic: top talkers, applications, flow lengths etc.• LHC-OPN requires edge routers to provide Netflow data• Internet 2 backbone
– http://netflow.internet2.edu/weekly/
• SLAC:– www.slac.stanford.edu/comp/net/slac-netflow/html/SLAC-netflow.html
24
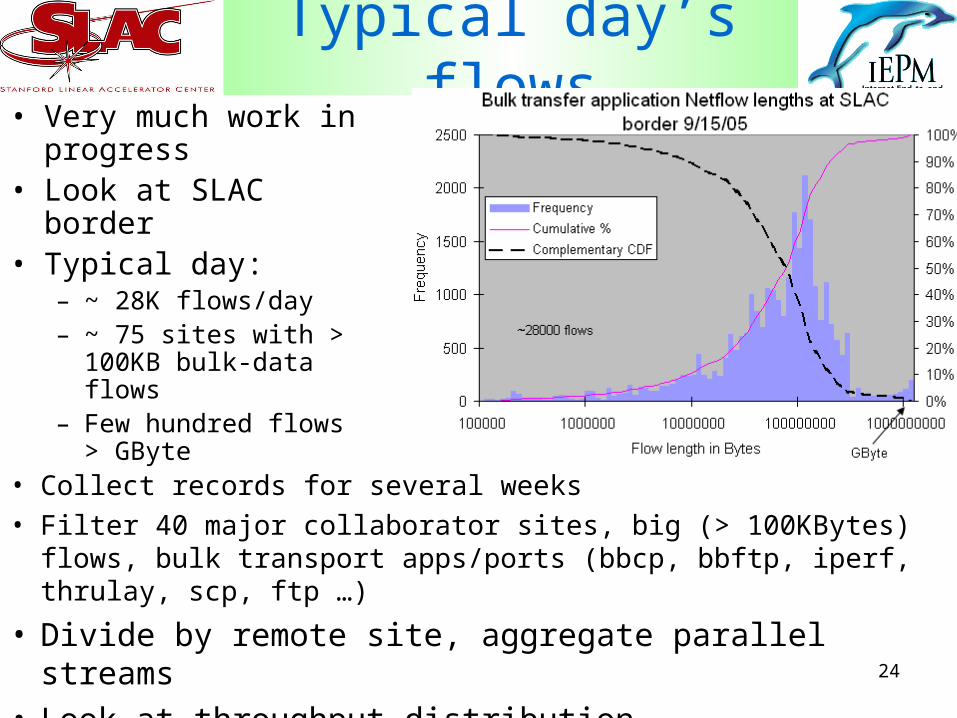
Typical day’s flows• Very much work in
progress• Look at SLAC border• Typical day:
– ~ 28K flows/day– ~ 75 sites with > 100KB
bulk-data flows– Few hundred flows >
GByte
• Collect records for several weeks• Filter 40 major collaborator sites, big (> 100KBytes) flows, bulk
transport apps/ports (bbcp, bbftp, iperf, thrulay, scp, ftp …)
• Divide by remote site, aggregate parallel streams• Look at throughput distribution
25
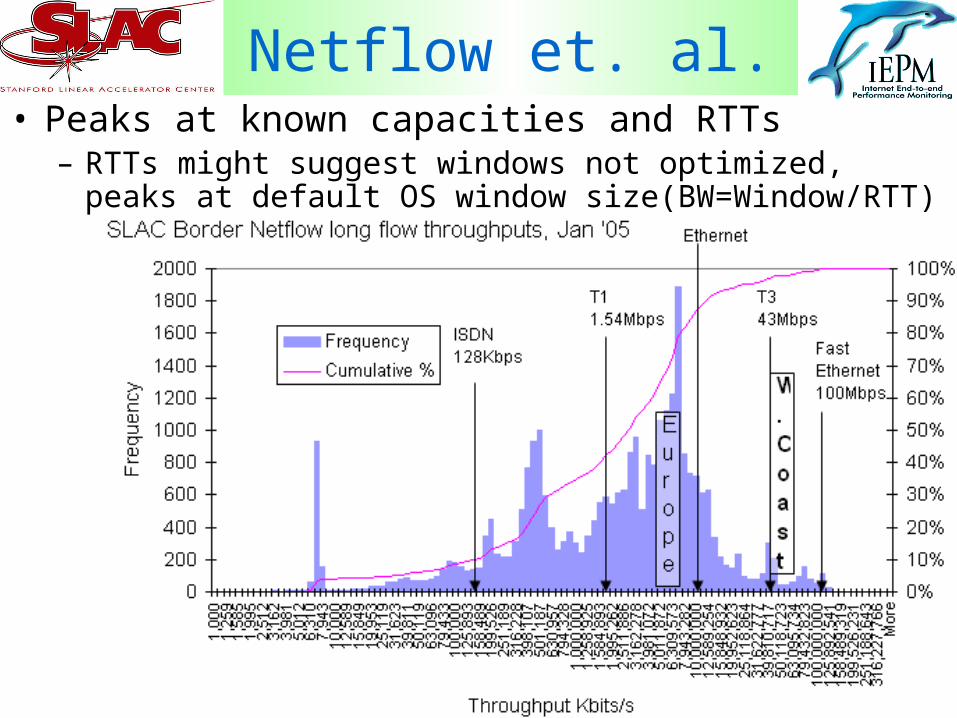
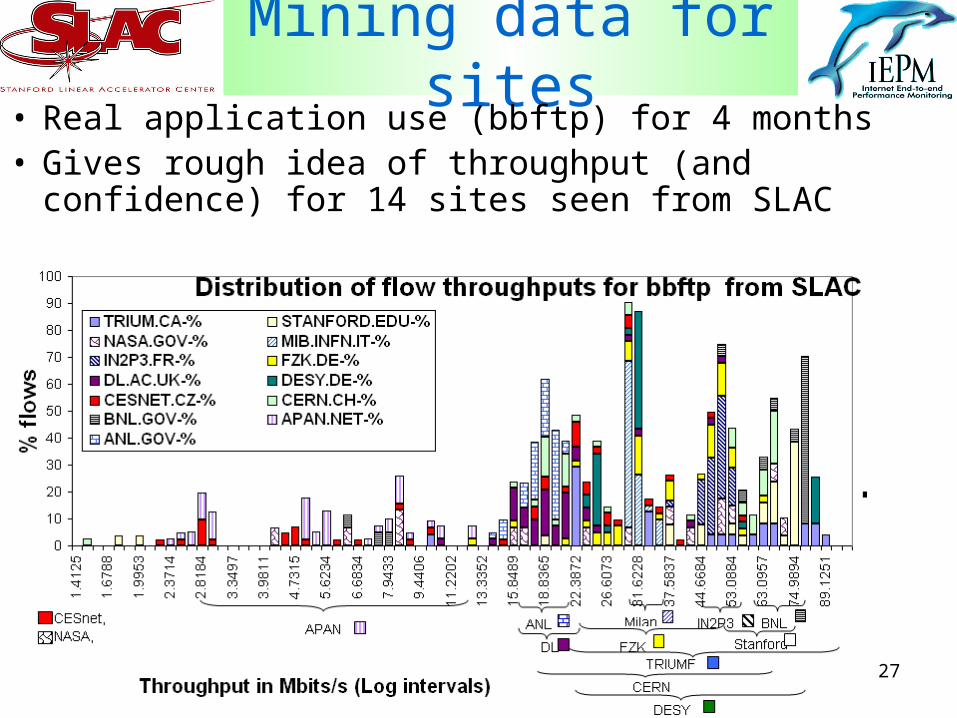
Netflow et. al. • Peaks at known capacities and RTTs
– RTTs might suggest windows not optimized, peaks at default OS window size(BW=Window/RTT)
26
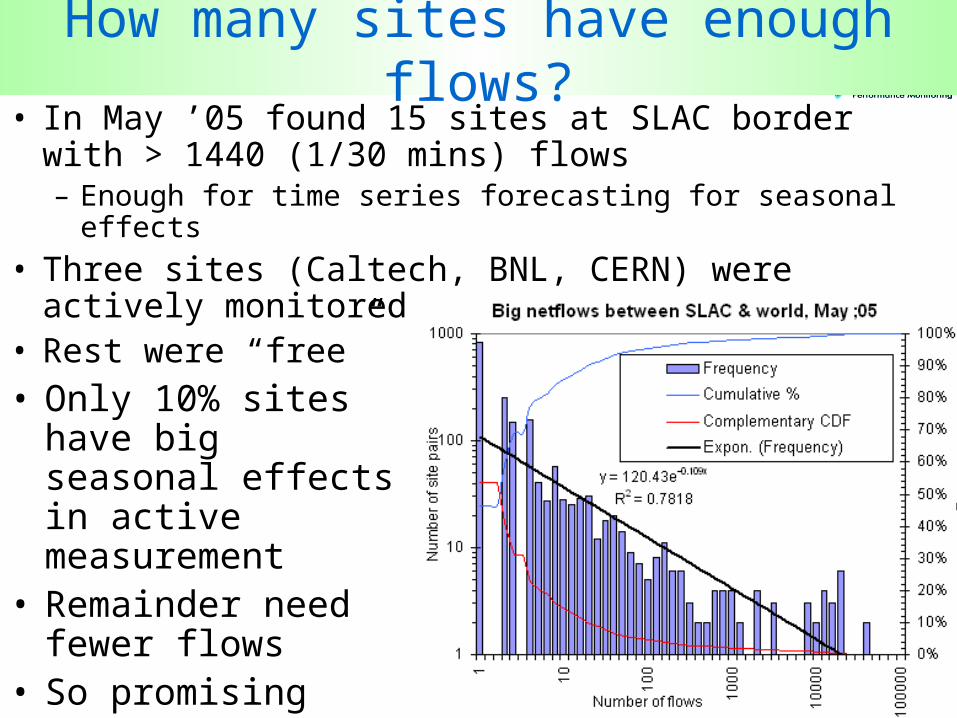
How many sites have enough flows?• In May ’05 found 15 sites at SLAC border with > 1440
(1/30 mins) flows– Enough for time series forecasting for seasonal effects
• Three sites (Caltech, BNL, CERN) were actively monitored
• Rest were “free”
• Only 10% sites have big seasonal effects in active measurement
• Remainder need fewer flows
• So promising
27
Mining data for sites• Real application use (bbftp) for 4 months• Gives rough idea of throughput (and confidence) for
14 sites seen from SLAC
28
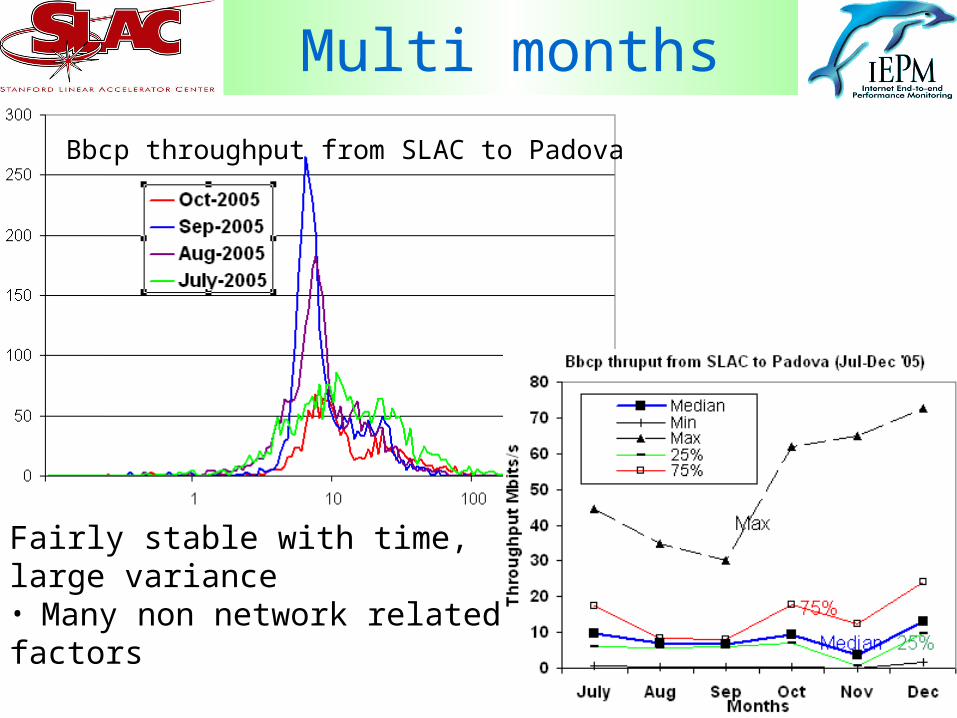
Multi months
• Bbcp SLAC to PadovaBbcp throughput from SLAC to Padova
Fairly stable with time, large variance• Many non network related factors
29
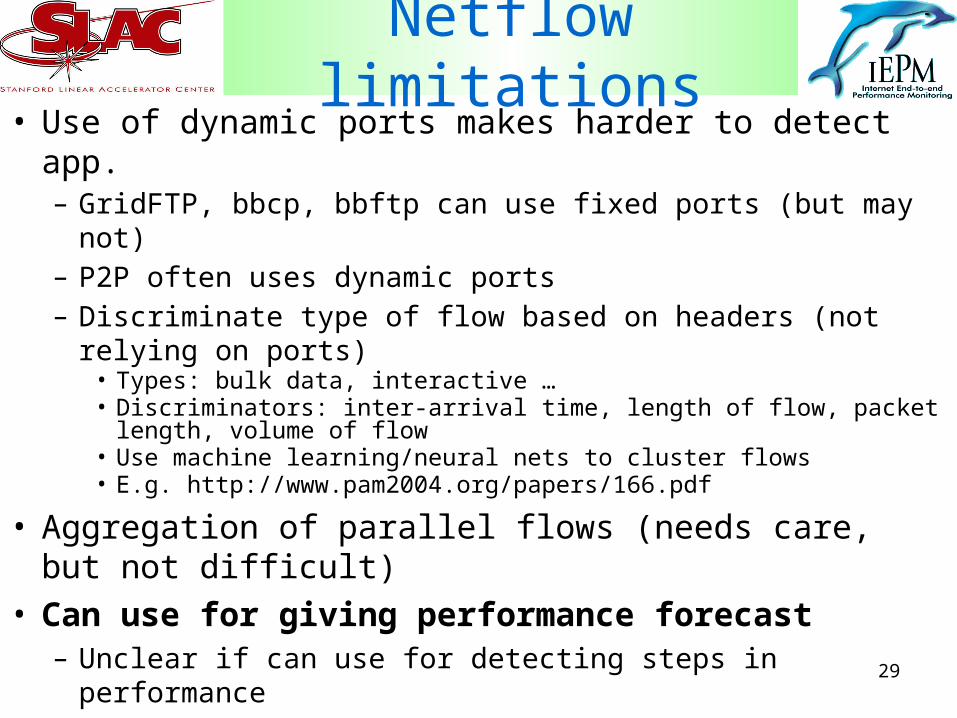
Netflow limitations• Use of dynamic ports makes harder to detect app.
– GridFTP, bbcp, bbftp can use fixed ports (but may not)– P2P often uses dynamic ports– Discriminate type of flow based on headers (not relying on
ports)• Types: bulk data, interactive …• Discriminators: inter-arrival time, length of flow, packet length,
volume of flow• Use machine learning/neural nets to cluster flows• E.g. http://www.pam2004.org/papers/166.pdf
• Aggregation of parallel flows (needs care, but not difficult)
• Can use for giving performance forecast– Unclear if can use for detecting steps in performance
30
Conclusions• Some tools fail at higher speeds• Throughputs often depend on non-network
factors:– Host: interface speeds (DSL, 10Mbps Enet,
wireless), loads, resource congestion– Configurations (window sizes, hosts, number of
parallel streams)– Applications (disk/file vs mem-to-mem)
• Looking at distributions by site, often multi-modal
• Predictions may have large standard deviations• Need automated assist to diagnose events
31
Questions, More information• Comparisons of Active Infrastructures:
– www.slac.stanford.edu/grp/scs/net/proposals/infra-mon.html • Some active public measurement infrastructures:
– www-iepm.slac.stanford.edu/– www-iepm.slac.stanford.edu/pinger/ – e2epi.internet2.edu/owamp/ – amp.nlanr.net/
• Monitoring tools– www.slac.stanford.edu/xorg/nmtf/nmtf-tools.html – www.caida.org/tools/ – Google for iperf, thrulay, bwctl, pathload, pathchirp
• Event detection– www.slac.stanford.edu/grp/scs/net/papers/noms/noms14224-122705-
d.doc