Embed Size (px)
Citation preview

The Emergence of the
Internet and Africa
Les Cottrell SLAC
SLAC Colloquium, May 6th, 2013
SLAC-WP-095
Work supported in part by US Department of Energy under contract DE-AC02-76SF00515.

2
Agenda
SLAC Colloquium
• Brief history of the Internet and its goals,
• how it has grown,
• today’s major challenges,
• and future research.
• The impact of the Internet on development,
• Africa
• How Africa has lagged the world,
• Why does it matter?
• Is the performance for Africa improving, will it catch up?

1961 Vision from the Bell Phone System
IT Operations August 2012
3
You mean two
business
machines
thousands of mile
apart actually talk
to each other by
telephone
Someday there will be
as much
communication
between business
machines as between
people
Ad from June 1961 Boys’ Life Magazine

The Start of the Internet as we know it today
• 1965: Larry Roberts and Thomas Marill create the first
wide area connection via telephone lines, turns out to
be inefficient and costly.
• Kleinrock predicts that
packet switching
(developed by Baran,
Davies, Kleinrock
et. al.) more promising
1969: the original Internet created and had 4 nodes, UCLA, Stanford Research Institute, MIT, Utah, 50kbit backbone (today scaled up a billion times)

5
Early days
IT Operations August 2012
1983 400 nodes,
Now 750M (many more hidden behind Firewalls
and home router/Network Address Translation
devices (NAT) etc.)
1972

6
Design Goals slide 1
IT Operations August 2012
• Built as a collaboration of global proportions,
independent stand on own, self managed autonomous
systems, decentralized (chaotic, no central
control/management cf. phone system),
• Best effort, no guarantees, recovery from losses,
pipelining host flow control, checksums
• non-proprietary (c.f. IBM’s System Network
Architecture, Digital Equipment’s network, Xerox
Network Services, phone system …),

7
Design Goals 2
SLAC Colloquium
• Little focus on security
• (if had: might never have happened),
• simple black boxes (routers
connect nets) do not retain information about the
individual flows,
• packets inside envelopes,
layering (independent of each other, i.e. middle layers
don’t know if lower layers are wireless,
satellite, copper, fibre, upper layer
independent of applications cf. purpose
designed TV broadcast networks, cable
networks, telephone network, only end device
knows what contents mean).

8 IT Operations August 2012
Factor of 6 in 10 years
Growth: users
– Maps from http://news.bbc.co.uk/2/hi/technology/8552410.stm
Most future user growth from developing nations
2.09B
Mar 2011

9 IT Operations August 2012
Growth: Devices August 2010: 12.5Billion devices plugged in to Internet
In 10 years factor 100 growth
• cell phones & other new classes of consumer electronics
(eBooks, tablets, Internet TV, digital picture frames …), Internet
of things, 99% of todays electronic devices are not on the
Internet
• Even bigger is machine to machine (Internet of Things)
- smart grids for energy management, smart cities, surveillance
& public safety, traffic & parking control, cars, and sensor nets
…).

10 IT Operations August 2012
Growth: bandwidth
Voice
Traffic
1997
breakpoint
1970 1980 1990 2000
1Tbps
1Mbps
1Gbps
1kbps
1Pbps
Max switch
Speed
Internet Traffic, Voice traffic,
Max Trunk speed, Max switch speed
2010
2000: data overtakes
voice
Trunk speed doubles every
22 months, 50kps 1970 =>
100Gbps today
1997: Multiplex multiple colors
over single fibre

11
International Internet Bandwidth Growth 2005-2010
Annual growth > 50% in last few years
i.e. as much capacity added in 2012 as was available in
2008
www.telegeography.com/research-services/global-bandwidth-research-service/index.html
From Telegeography

12 IT Operations August 2012
Compare today with 50 years ago
If we compare the IBM Stretch supercomputer of the early 1960’s
with today’s smartphone we can see we have come a long way:
• Smartphone is much smaller, i.e. it fits in the hand versus 2500 sq.
feet;
• Smartphone weighs 5 oz. versus 40,000lbs;
• Smartphone uses 10,000 times less power;
• Smartphone ~ 3000 times more compute power
• Stretch $8M, smartphone few hundred $
30 ft long

13 IT Operations August 2012
Growth in connectivity 1972

14
Amazing scalability Success
• The Internet has successfully scaled from a few users
to over a billion and speed increases of seven orders
of magnitude (56kbps=>100Gbps backbone)
• From a research and education
network to a commercial network
used worldwide
However there are challenges…

15
Challenge: demands for adddress space
SLAC Colloquium
• Internet users in developing world
• Devices per person (smart phones, tablets,
wearable devices…)
• Monitoring of equipment,
humans (e.g. medical), animals
• Machine to machine (typical
car today has 16 IP addresses)
• Smart homes, smart cities, traffic,
surveillance, safety, security, power grids …
• 99% of electronics in the world today still not
connected to the internet.
16
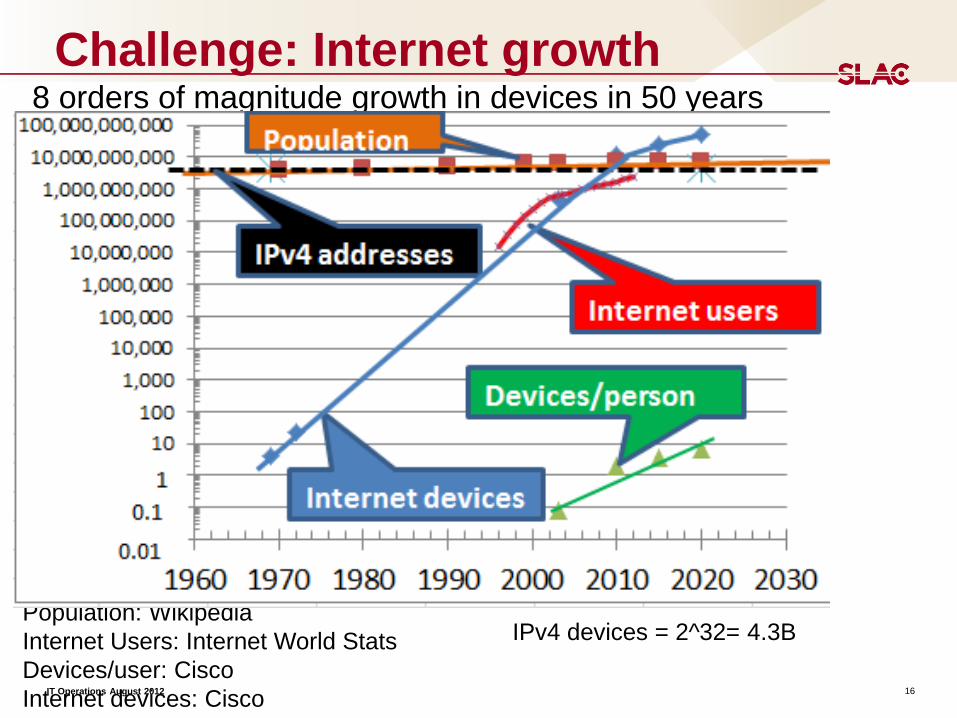
Challenge: Internet growth
IT Operations August 2012
8 orders of magnitude growth in devices in 50 years
Population: Wikipedia
Internet Users: Internet World Stats
Devices/user: Cisco
Internet devices: Cisco
IPv4 devices = 2^32= 4.3B

17 SLAC Colloquium
Challenge: Mobility
Computers used to be big and did not move
As move need to change IP addresses
• Topology can change
Need persistence across links going up &
down
• Delay & disruption tolerance (e.g. for space
flights)
Mesh, sensor nets, self-organizing networks
• Bad guy may join, e.g. military position overrun,
enemy gets device, pretends to be friend
18 SLAC Colloquium
Challenges: Trust – slide 1
Initial trust relationship badly broken
• Not everyone has everyone else’s best interest in mind
• Organized crime, state sponsored intelligence gathering,
cyber-warfare
• Akamai observed (3Q12) attack traffic originating from
180 unique countries/regions. China top ~33%, followed
by US (13%) & Russia (5% traffic)
This is compounded with:
• Naïve OS’, unpatched systems, browsers, users
• Routing mistakes (e.g. black holes)

19 SLAC Colloquium
Challenges: Trust – slide 3
Freedom of information vs privacy (e.g. wikileaks)
• Google/Yahoo … (has your emails), Facebook have a good
idea of who your friends are where you live, work, spend your
free time, your health, love life, political leaning
• Branching out into your realtime (Global Position System) to
give your location
• Nowhere to hide anymore
Lack of tools for strong authentication needed for
Grids & cloud computing
Prevalence of viruses, worms, malware, Trojan
horses, Denial of Service

20 SLAC Colloquium
Challenge: SPAM
Unsolicited pitches for things such as
drugs (> 60%), dating, stocks, malware
(few %) …
US leads as source of spam
Sent by botnets Networks of compromised computers, millions worldwide
Located mainly in Europe (esp East), Russia, US and India
88% of all email, 150B emails/day (Cisco)
Due to spam filters only 20% of mail received by users is
spam Huge Annual losses due to viruses for a typical 1,000-
user organization will amount to over $158,000 (Radicati
Group).

21 SLAC Colloquium
Challenges: Capacity and net neutrality
• Does this lead to
ISP inspecting and
limiting traffic
by customer
• Leading to loss of
net neutrality
File sharing
Internet video
What are the
drivers?
Can Capacity
keep up with
demand
principle that Internet service providers and governments should treat all data on
the Internet equally, not discriminating or charging differentially by user, content,
site, platform, application, type of attached equipment, and modes of
communication- Wikipedia

22
Challenge: How to change it
SLAC Colloquium
Despite the new Internet Protocol (version 6 or
IPv6) being > 15 years old, it carries < 2%
traffic
How to redo a functioning production network
critical to the global economy while it continues
to run
• “Creation was completed in 6 days, but no installed
user base”
• The Internet has been smoothly taking over from the
phone network
• How does it happen next time?

23
Internet NG – slide 1
SLAC Colloquium
To borrow from John Lennon: "Imagine there's no
latency, no spam or phishing, a community of trust.
Imagine all the people, able to get online from
anywhere at any time".
The goal is audacious:
• To create an Internet without so many security breaches, with better
trust and built-in identity management.
• Researchers are trying to build an Internet that's more reliable, higher
performing and better able to manage exabytes of content.
• And they're hoping to build an Internet that extends connectivity to the
most remote regions of the world, perhaps to other planets.

24
Internet NG – slide 2
SLAC Colloquium
Future InterNet Design (FIND) funded
by NSF to get and implement a vision
for 2020
•Launched 50 projects ($0.5-1M) in 2006, now
(2010) being narrowed down to 2-4 with up to
$9M
•Similar initiative from Europe

25
Internet’s Impact on development
SLAC Colloquium
• Brief history of the Internet and its goals,
• how it has grown,
• today’s major challenges,
• and future research.
• The impact of the Internet on development,
• Africa
• How Africa has lagged the world,
• Why does it matter?
• Is the performance for Africa improving, will it catch up?

26 SLAC Colloquium
How does the Internet assist development?
• Investment in information technology plays the role of
a "facilitator" that allows other innovations to take
place. http://findarticles.com/p/articles/mi_m1093/is_3_45/ai_86517828/
• World Bank / IFC report: for every 10% increase in
high-speed Internet connections there is an increase
in economic growth of 1.3 percentage
points. http://www.infodev.org/en/Article.522.html
• Example: Uganda 15% increase in price of maize
based on improved farmer bargaining power. www.itu.int/ITU-D/.../S1-01-NG-ICT_Indicators-Tim_Kelly.pptx
• A study reported by Akamai showed that 80 new jobs are
created for every 1,000 new broadband connections

Human Development Index (HDI)
SLAC Colloquium
• HDI from United Nations (UN) International Telecommunications
Union (ITU)
• composite statistic of life expectancy, education, and income
HDI
Th
rou
gh
pu
t in
kilo
bits/s
ec
10,000
1,000
10 10
100
Source: HDI UN/ITU
Throughput SLAC PingER project
Top right = Good
Note correlation
Africa (blue) behind

28
Africa
SLAC Colloquium
• Brief history of the Internet and its goals,
• how it has grown,
• today’s major challenges,
• and future research.
• The impact of the Internet on development,
• Africa
• How Africa has lagged the world,
• Why does it matter?
• What has soccer got to do with it?
• Is the performance for Africa improving,
will it catch up?

29
Why does it matter to Africa
SLAC Colloquium
Cartograms from:
www.geog.qmw.ac.uk/gbhgis/conference/cartogram.html
• African scientists isolated
• Lack critical mass
Internet Users 2002
• Need network to
collaborate but it is terrible
Tertiary Education from
http://www.worldmapper.org/
So we have: Brain drain
Instead we need:
• Brain gain, tap diaspora
• Blend in distance learning
• Provide leadership, train
trainers

30
Why is Africa important?
SLAC Colloquium
Africa is Huge
~ 1B people, over 1000 languages,multi climates
African technology
industry is growing at ~
20% annually.
Africa demonstrates
massive consumer
appetite for technology,
e.g. mobile users set
to reach 735 million by
the end of 2012
(GSMA.)
Developed world market saturated, Africa big opportunity

31 SLAC Colloquium
Science Opportunities: Square
Kilometre Array (SKA)
• Build in Sub-Saharan states with cores in South Africa
and Australia,
• €1.5 billion, construction start 2016, initial
observations 2019
“…equivalent to ten times the
global internet traffic today”
“…equivalent to ten times the
global internet traffic today”

32
Examples of Other Scientific Opportunities
SLAC Colloquium
• Aug 30, 2012: CERN donated 220 computer servers
from CERN to the Kwame Nkrumah University of
Science and Technology in Ghana.
• Strategic plan for a synchrotron light source in
southern Africa championed by SLAC’s own Herman
Winick
• Drugs from rain-forest, environment studies, geo-
physics
• Six HEP International Conferences in Madagascar

Joint Techs: I2 & ESnet,
Stanford
Measurement Mechanism: PingER
Internet
Remote Host (typically web server)
Measure Round Trip Time & Loss
Uses ubiquitous ping
Monitor Host
Repositories
NUST

34 SLAC Colloquium
Deployment of PingER hosts
Monitors > 90 in 23 countries, 4 in Africa • Beacons monitored by most monitors (~100)
• Remote sites monitored by some monitors (~750)

35 SLAC Colloquium
African Submarine Cables
1 cable, W Coast only,
No competition (340Gb/s)
Future Cables promise
more connectivity: Cable capacity increase from
0.34Tb/s in 2008 to 87.5 Tb/s
by 2014 (factor ~300)
Investment of $6T
2001-2008 http://manypossibilities.net/african-undersea-cables/
World Cup S Africa 2010 led
to many submarine cables
connecting Africa to rest of the
world
More Capacity, shorter RTT,
competition
Still worst off continent
2012 Telegeography.com

36 SLAC Colloquium
Examples of impact of terrrestrial links, 2009
SLAC to Uganda
1 direction
Both directions
Seconds
0
1
750ms 450ms SLAC to Angola 2
0 Seconds
Angola step mid-
May + more stable Aug 20
SLAC to Zambia 1 direction Both directions? S
econ
ds 1
0
Zambia one direction
720>550ms
SLAC to Tanzania
Sep 27
0
0.5
Seconds
Tanzania
700>400ms fixes
losses too
Uganda (inland via
Kenya) 2 step
process

37 SLAC Colloquium
Comparison in minimum RTT from SLAC to African
Countries in 2008 and 2012.
2008 2012 800
600
400
200
0
800
600
400
200
0 Terrestrial Terrestrial
GEOS GEOS
Minimum RTT from SLAC to African Countries 2008 vs. 2012
Min
RT
T (
ms)
Note the countries
that have gone from
GEOS to terrestrial
Source: SLAC led PingER project

38 SLAC Colloquium
Intra Africa Optical Fibre Network
Just as important as the
submarine cables serving
the coasts, are the tens if
not hundreds of millions of
dollars being invested in
new terrestrial fiber to
move this capacity inland.
http://www.ubuntunet.net/fibre-map

39
How to reach the rest of Africa
SLAC Colloquium
WiFI & Mobile to the rescue,
overlay cell network with
fibre net
• Mobile phones huge in
developing world.
6.9
Billi
on
0.7
Bil
lio
n
Also O3B • Refers to population of world without broadband
• Constellation of 8 Medium Earth Orbit satellites at altitude
8000km
• Min RTTs factor of 4 less than GEOS
• ~125ms, similar to inter-continent land lines
• Backed by SES World Skies, HSBC, Google…
• Launch 2013
40 SLAC Colloquium
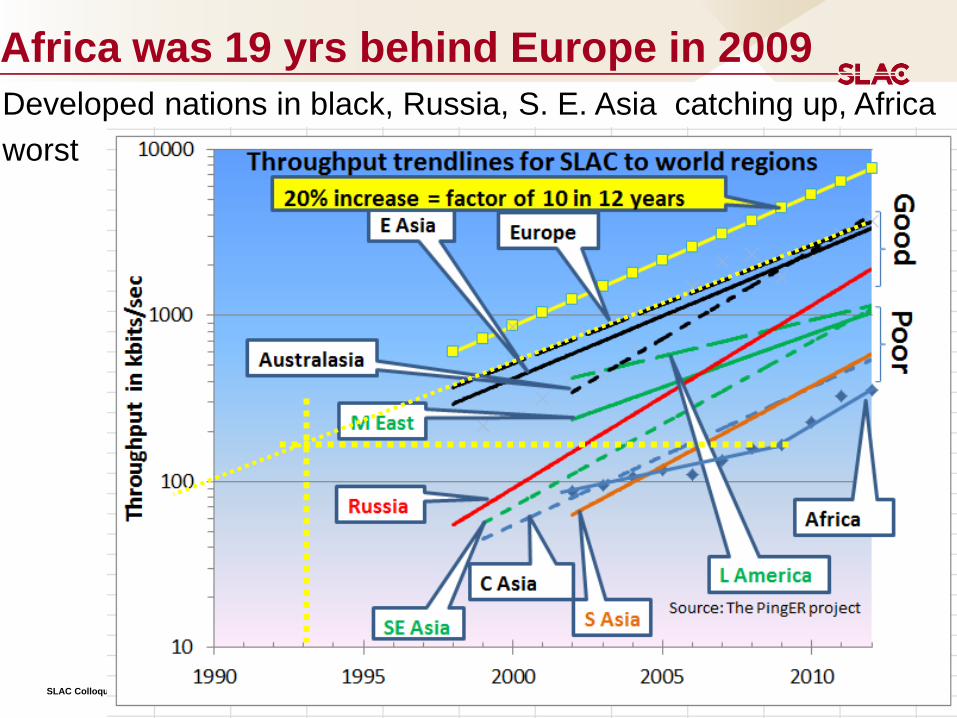
Africa was 19 yrs behind Europe in 2009
Developed nations in black, Russia, S. E. Asia catching up, Africa
worst
Source: SLAC led PingER project

• Broadband use in Africa growing quickly
• However still way behind developed nations
• In 2011 used capacity to whole of Africa less
than that of Norway
• 30 times < N. America
41 SLAC Colloquium
Africa might catch up with Europe in 20 years at
current rate of improvement
Was falling further behind
70 tim
es w
ors
e
26 y
ears
be
hin
d E
uro
pe
Source: SLAC led PingER project

42 SLAC Colloquium
Africa Broadband costs vs rest of the world

43 SLAC Colloquium
By 2011 prices had dropped only factor of 2
• Alternative fibre often owned by electricity companies,
pipelines and not allowed to sell, lease or operate –
needs deregulation and is happening
• Business model: Internet Service Providers sell to large
corporations, governments, education, NGOs
• Need to move to serving multitude of small customers to
recover costs from the move from high => low prices
Prices and Governance

44 SLAC Colloquium
National Research and Education Networks
With connection to GÉANT going
live end 2012, UbuntuNet will
provide sub-Saharan Africa with
infrastructure for global, and
regional research collaboration and
e-learning
N. Africa connected via EUMED to
Europe.
Also Arab States Research and
Education Network formed 2011
From PingER Project
National Research and Education
Networks (NRENS) provide:
leadership, training, and
leverage in contract negotiation

45 SLAC Colloquium
Despite having NRENs
& terrestrial fibres along
both East & West coasts
of Africa connecting to
most maritime countries,
still most inter-African
routes went via Europe
and N America
Not only did this add
large delays, but also
resulted in costly inter-
continental rates
Traceroutes within Africa 2009
From SLAC PingER project

46 SLAC Colloquium
Setting up International eXchange Points for better
connectivity
Connections
between
African
countries no
longer via
Europe or
USA.
Much
reduced
Round Trip
Times

47 SLAC Colloquium
Demonstration
Interactive demonstrations of the data mining capabilities of public
data sources provided by organizations such as the United Nations
and the International Telecommunications Union coupled with
monitoring data from PingER
http://www-iepm.slac.stanford.edu/pinger/explorer.html
Summer Joint Techs
Stanford, July 2012

48
That’s it folks, Questions
SLAC Colloquium

49 SLAC Colloquium

50 SLAC Colloquium