Embed Size (px)
Citation preview

1
Morgan Stanley Asia Pacific Summit
Hugh Harley
Group Executive, Retail Banking ServicesCommonwealth Bank of Australia
November 2003

2
The material that follows is a presentation of general background information about the Bank’s activities current at the date of the presentation, 5 November 2003. It is information given in summary form and does not purport to be complete. It is not intended to be relied upon as advice to investors or potential investors and does not take into account the investment objectives, financial situation or needs of any particular investor. These should be considered, with or without professional advice when deciding if an investment is appropriate.
Disclaimer
3
Speaker’s Notes
Speaker’s notes for this presentation are attached below each slide.
To access them, you may need to save the slides in PowerPoint and view/print in “notes view.”

4
Agenda
Operating Environment
Performance
Transformation

5
The Operating Environment
6
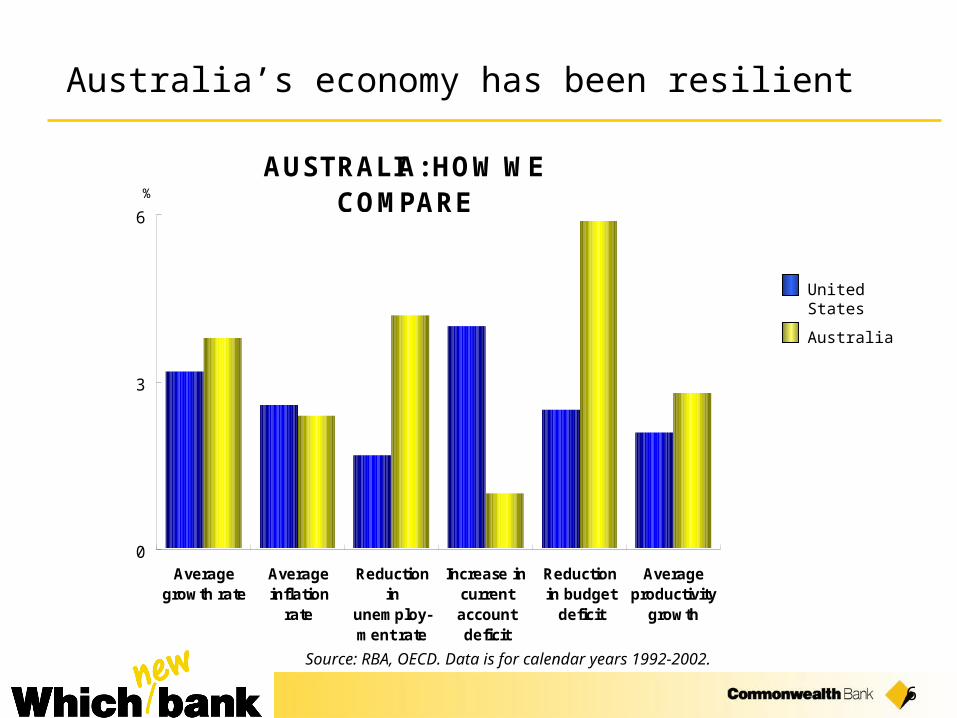
Australia’s economy has been resilient
Source: RBA, OECD. Data is for calendar years 1992-2002.
Australia
United States
0
3
6
Averagegrowth rate
Averageinflation
rate
Reductionin
unemploy-ment rate
Increase incurrentaccountdeficit
Reductionin budget
deficit
Averageproductivity
growth
%
AUSTRALIA: HOW WE COMPARE

7
19971998 200120001999 2002
3.9
2.9
3.1
3.3
3.7
3.5
-10
0
10
20
30
Jul-97
Jul-98
Jul-99
Jul-00
Jul-01
Jul-02
Jul-03
%%
Housing
Business
Other personal
Credit growth has been strong, but banking margins have been squeezed
Source: Company Financial Statements
Average Operating Margins*4 Major Banks (1997 - 2002)
*Margin calculated as Total Income/Total Controllable Assets
Credit (3 month ended annual rates)
Source: Reserve Bank

8
$ B
illio
n
Source: DEXX&R projections February 2003. Funds management data assumes 5% post fee returns.
Projected Size of Various Product Segments
$ B
illio
n
Funds Management Life Insurance
Demographic changes place emphasis on self funded retirement
0
1
2
3
4
5
6
7
Disability Group Risk Term & Trauma
Value at June 2002
Projected Value to June 2012
0
50
100
150
200
250
300
Annuities Alloc.Pensions
W'saleSavings
Corp.SuperM'trusts
UnitTrusts
Pers.Super
Value at June 2002
Projected Value to June 2012

9
Performance

10
FY03 result: 3% improvement in cash profit and 9% improvement in underlying profit
Net Profit After Tax (cash basis)*
Net Profit After Tax (underlying)**
June 2003
$2,579m
$2,687m
June 2002
$2,501m
$2,468m
Change
3%
9%
* ie excluding appraisal value uplift/reduction (2003: -$245m; 2002: $477m) and goodwill amortisation (2003: $322m; 2002: $323m). Unless otherwise stated the numbers in this presentation refer to the net profit after tax (cash basis) and all comparisons are to the prior comparative period.
**ie cash profit excluding first time expenses of restructuring initiatives and employee share plan costs

11
Banking performance drove underlying growth of 9% in FY03
2200
2300
2400
2500
2600
2700
2800
2900
J un-02 Banking Life
Insurance
Funds Underlying
Dec 02
First time Invest
Earn
J un-03Cash ProfitJun-03
2,468
Banking334
FundsManagement
(132)
LifeInsurance
17
InvestmentReturns
73 2,579
$m
UnderlyingProfit Jun-02
Underlying Growth of 9%
First TimeExpenses
(181)
UnderlyingProfit Jun-03
2,687

12
86 100
1312
5149
1213
0
50
100
150
200
Jun 2002 Jun 2003
9% growth in lending assets
** Excludes securitised housing loan balances $6.5b (Jun 03), $7.0b (Jun 02).
$ bi
llion
161175
Lending Assets** Housing Personal Business & Corporate
Bank Acceptances

13
Key shareholder ratios improved
June 2003
203 cents
154 cents
76%
13.27%
6.96%*
June 2002
197 cents
150 cents
76%
13.12%
6.78%
Change
3%
3%
-
2%
3%
Earnings per Share
Dividend per Share
Dividend Payout Ratio
Return on Equity
Tier 1 Capital Ratio
* This ratio does not include the USD550m hybrid capital issue undertaken in August 2003.
For more information, visit: www.commbank.com.au/shareholder

14
Another record dividend
20 24
36 3845 46 49
58 6168 69
22
36
4652
57 58
66
72
8285
75
0
20
40
60
80
100
120
140
160
1993 1995 1997 1999 2001 2003
Cen
ts
First Half Second Half
•Final dividend of 85 cps,up 4% on pcp
•Payout ratio of 75.9%remains highest amongmajor banks
42
60
8290
102 104115
130136
150 154
15
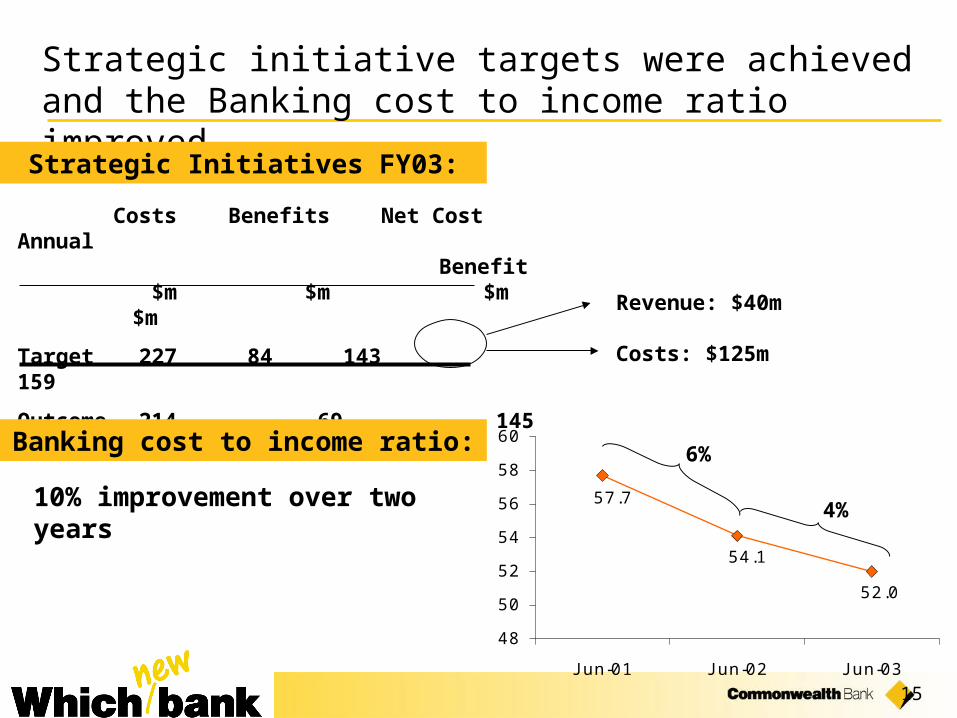
Strategic initiative targets were achieved and the Banking cost to income ratio improved
Costs Benefits Net Cost Annual Benefit
$m $m $m $m
Target 227 84 143 159
Outcome 214 69 145 165
Revenue: $40m
Strategic Initiatives FY03:
6%
4%10% improvement over two years
Costs: $125m
Banking cost to income ratio:
52.0
54.1
57.7
48
50
52
54
56
58
60
J un-01 J un-02 J un-03
16
September 2003 Quarter: Performance
Continued high levels of credit growth
Deposit growth above expectations
Strong investment returns
Increased FUM
Growth in insurance premium income
17
Transformation
18
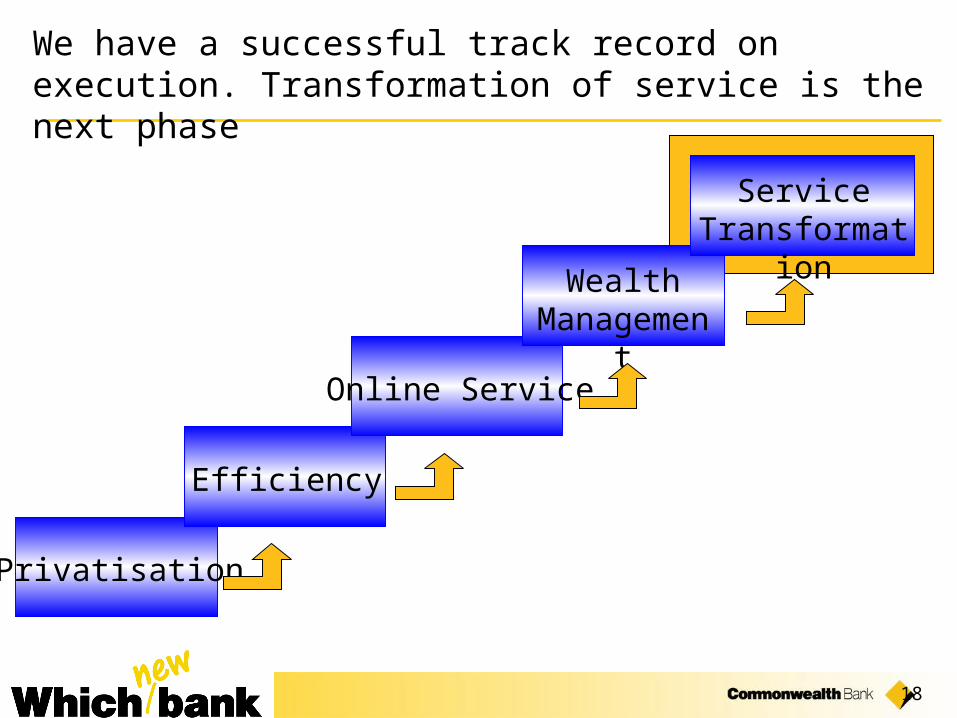
We have a successful track record on execution. Transformation of service is the next phase
Privatisation
Efficiency
Online Service
Wealth Management
ServiceTransformation

19
Why service transformation is necessary
Environment Customer need
Demographic change
Monetary cycle
High value creation
Through advice and investment
Even better value
Imperatives for the Bank
Service transformation
Competitive superiority

20
Simple processesthat are fast, accurate
and efficient
‘To excel in customer service’
Customer servicethat is responsive,
convenient and reliable
via
Engaged peoplewho are empowered,
motivated and skilled to deliver
Supported byThrough
There are three themes in our service transformation
Customers are saying: “Know me, give me what I want and do it reliably”

21
Simple processes
‘To excel in customer service’
Customer service
via
Engaged people Supported by
Through
There are over 100 initiatives … grouped into 20 key workstreams
Service/Sales 1. Segment and AdviceEffectiveness Alignment
2. Advice Implementation3. Service/Sales system4. Divisional sales and
service improvements
IT Enablers 5. IT infrastructure6. Single view
Distribution 7. Distribution optimisationEfficiency 8. Branch use for
IBS/PFS/RBS9. Branch redesign
Product 10.Product bundling andpricing
11.New product/serviceintroductions
Performance 12.Performance cultureCulture diagnostic, management
systems and actions
Support 13.Support functionredesign
Process/product 14.End to end processredesign
15.Local siteimprovement
16.Product/systemrationalisation
IT Efficiency 17. IT efficiency18. IT sourcing
Purchasing 19.Purchasingimprovements
20.Propertyrationalisation
22
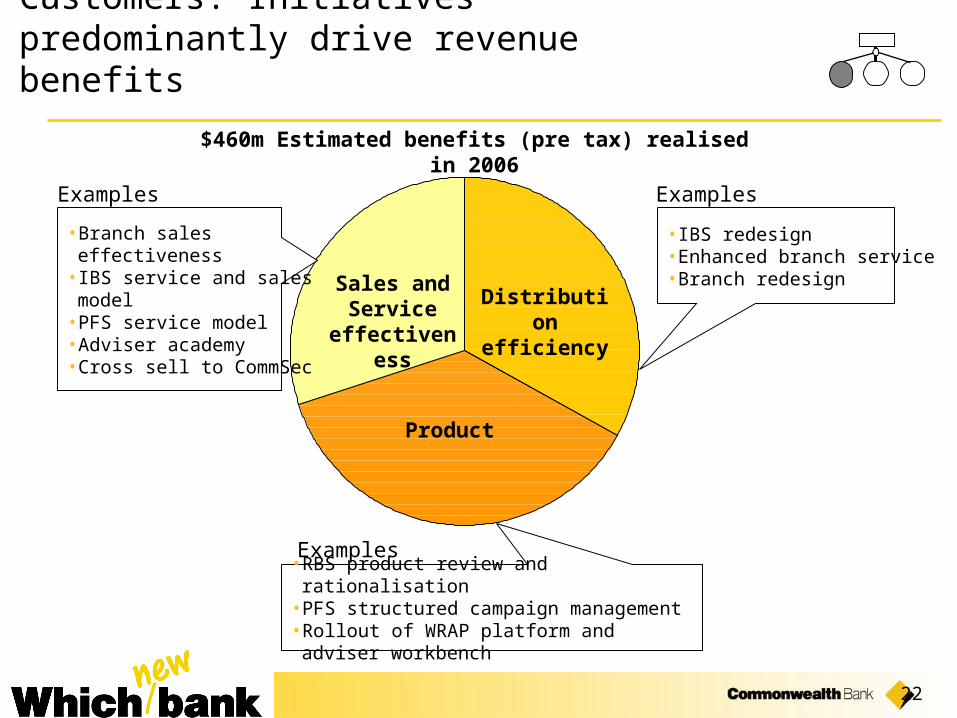
Customers: Initiatives predominantly drive revenue benefits
Distribution efficiency
Product
Sales and Service
effectiveness
$460m Estimated benefits (pre tax) realised in 2006
•IBS redesign•Enhanced branch service•Branch redesign
• Branch sales effectiveness
• IBS service and sales model
• PFS service model• Adviser academy• Cross sell to CommSec
• RBS product review and rationalisation• PFS structured campaign management• Rollout of WRAP platform and adviser
workbench
Examples
Examples
Examples

23
Customers: Transformation Outcomes
Improved customer experience, including:
More modern branches better suited to community needs
Average queue time reduction of 35%
Increased branch manager visibility
Innovative financial solutions better suited to customer needs
More informed view of the customer
Greater customer access to financial planning services and advice

24
Initiative name Initiative description Size of prizeStatus
> $100m
$50m - $100m
Estimated pre tax benefits realised in 2006$30m - $49m
$10m - $29m
• Branch sales effectiveness
• Reinvigoration of a world standard service and sales culture.
• Customer Service (CSO) roles redefined to increase customer contact time by 50%.
• Increase Branch Manager time with customers and time coaching staff.
Pilot
• IBS service and sales models
• Grow revenue by increasing cross sell in business banking, growing market share in corporate banking and increasing penetration in institutional banking.
Design
• PFS service model • Complete rollout of the relationship management team (POD) structure.
• Improvement in productivity for relationship managers of around 50%.
Rollout
• IIS Adviser Academy • Establish the Commonwealth Adviser Academy to train financial planners.
Design
• Cross sell to CommSec • Offer over one million CommSec clients, with only a trading account, an integrated core banking and brokerage offering at a competitive price.
Rollout
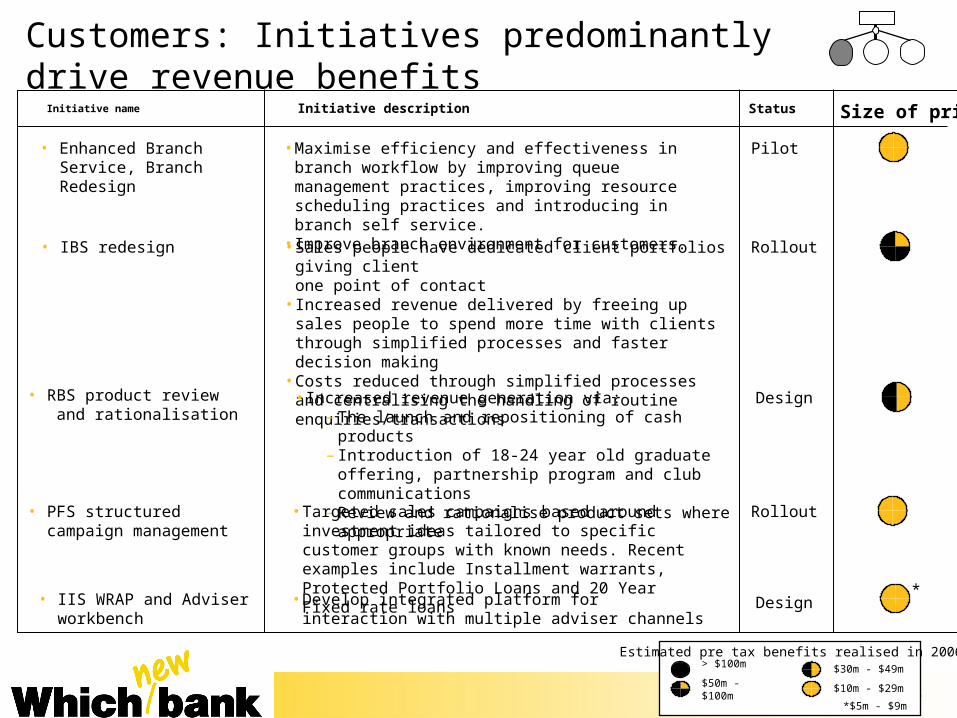
Customers: Initiatives predominantly drive revenue benefits
25
Initiative name Initiative description Size of prizeStatus
> $100m
$50m - $100m
Estimated pre tax benefits realised in 2006$30m - $49m
$10m - $29m
• Enhanced Branch Service, Branch Redesign
• Maximise efficiency and effectiveness in branch workflow by improving queue management practices, improving resource scheduling practices and introducing in branch self service.
• Improve branch environment for customers.
Pilot
• IBS redesign • Sales people have dedicated client portfolios giving client one point of contact
• Increased revenue delivered by freeing up sales people to spend more time with clients through simplified processes and faster decision making
• Costs reduced through simplified processes and centralising the handling of routine enquiries/transactions
Rollout
• Increased revenue generation via:– The launch and repositioning of cash products– Introduction of 18-24 year old graduate offering,
partnership program and club communications– Review and rationalise product sets where appropriate
Design• RBS product review and rationalisation
• PFS structured campaign management
• Targeted sales campaigns based around investment ideas tailored to specific customer groups with known needs. Recent examples include Installment warrants, Protected Portfolio Loans and 20 Year Fixed rate loans
Rollout
• IIS WRAP and Adviser workbench
• Develop integrated platform for interaction with multiple adviser channels
Design
Customers: Initiatives predominantly drive revenue benefits
*
*$5m - $9m

26
Retail branch sales effectiveness is being trialled in 12 branches
Focus on Customer Service Officers (CSOs);
- redefine role to focus on identifying and satisfying customer needs
- KPIs, targets & incentives clearly aligned to customer outcomes
- emphasis on sales skills, role plays & coaching
- Initial pilot completed - early results encouraging
Branch Manager Role;
- from back-office to front-line
- move focus from administration to front-line staff coach
- greater customer “visibility”
- positive sales results and great feedback from staff & customers
Also - Outbound Call Centre, Leads Generation & Tracking
27
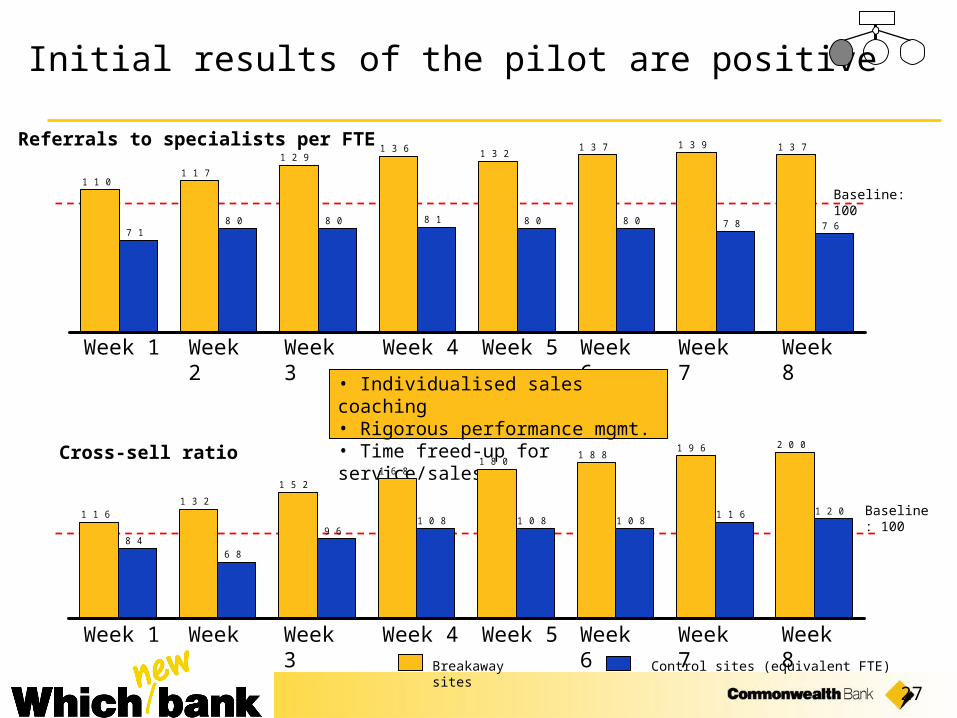
Initial results of the pilot are positive
Breakaway sites Control sites (equivalent FTE)
Week 1 Week 2 Week 3 Week 4 Week 6
Referrals to specialists per FTE
Week 5 Week 7 Week 8
Week 1 Week 2 Week 3 Week 4 Week 6
Cross-sell ratio
Week 5 Week 7 Week 8
Baseline: 100
Baseline: 100
• Individualised sales coaching• Rigorous performance mgmt.• Time freed-up for service/sales
1 1 01 1 7
1 2 91 3 6 1 3 2
1 3 7 1 3 9 1 3 7
8 0 8 0 8 1 8 0 8 0 7 8 7 67 1
1 1 61 3 2
1 5 21 6 8
1 8 01 8 8
1 9 6 2 0 0
6 8
9 61 0 8 1 0 8 1 0 8
1 1 6 1 2 0
8 4
28
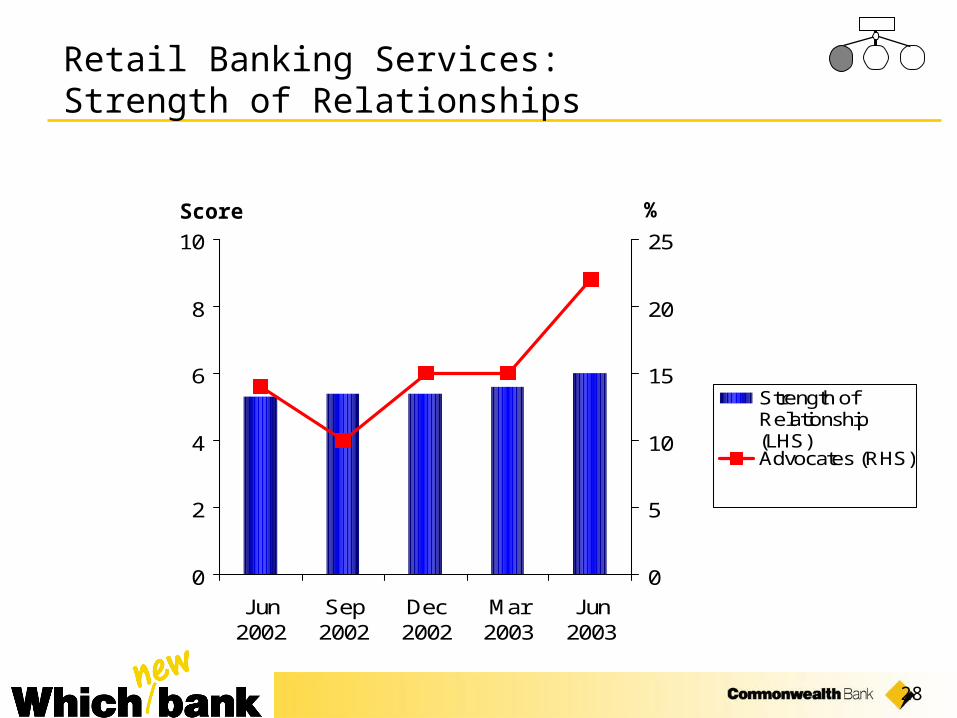
Retail Banking Services: Strength of Relationships
Score %
0
2
4
6
8
10
Jun2002
Sep2002
Dec2002
Mar2003
Jun2003
0
5
10
15
20
25
Strength ofRelationship(LHS) Advocates (RHS)
29
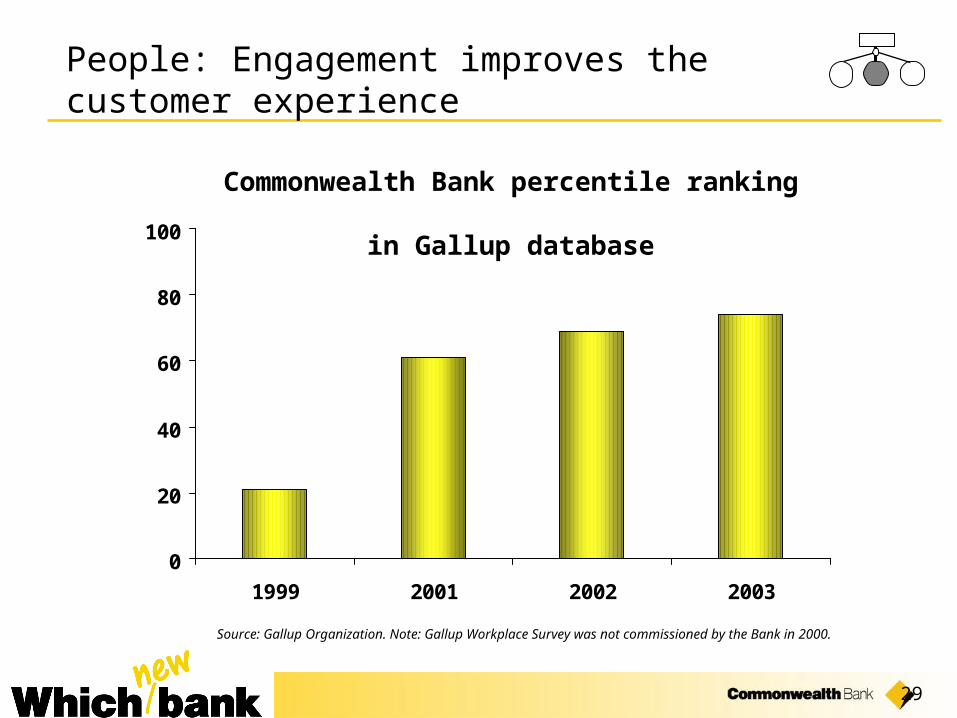
People: Engagement improves the customer experience
Source: Gallup Organization. Note: Gallup Workplace Survey was not commissioned by the Bank in 2000.
Commonwealth Bank percentile ranking in Gallup database
0
20
40
60
80
100
1999 2001 2002 2003
30
People: Transformation Outcomes
A better experience for our people, derived from:
Taking direction from people that serve our customers
Enabling frontline people to solve customer problems
Investing in the development and training
Measuring performance on customer outcomes
Recognising and rewarding people for superior service

31
Level of engagement has a tangible impact on customer service and business performance
Bottom 15%
Staff Engagement Score1
> 4.23Top 15%
< 3.72
Average Business Performance Against Plan
107%
72%
Average Service Score2
90.3%
83%
1CBA business unit results, 2002, score out of 5 2 An aggregate measure which reflects mystery shopping, application and other processing accuracy, ATM availability, product knowledge, queue time and telling accuracy
8.8 % increase
48.6%increase
In addition the top performing areas receive 50% less complaints and 40% more compliments

32
We are framing our cultural change within the context of our service aims
Customer focus driven by a sales and service culture
Operationalsimplicity and relentless execution driven by a efficiency and sustainability culture
New deal for our people through performance management and people develop-ment
Showing the way through energising
leadership
Working together with a common purpose
Unlocking our potential With our customers With our people With our operations
33
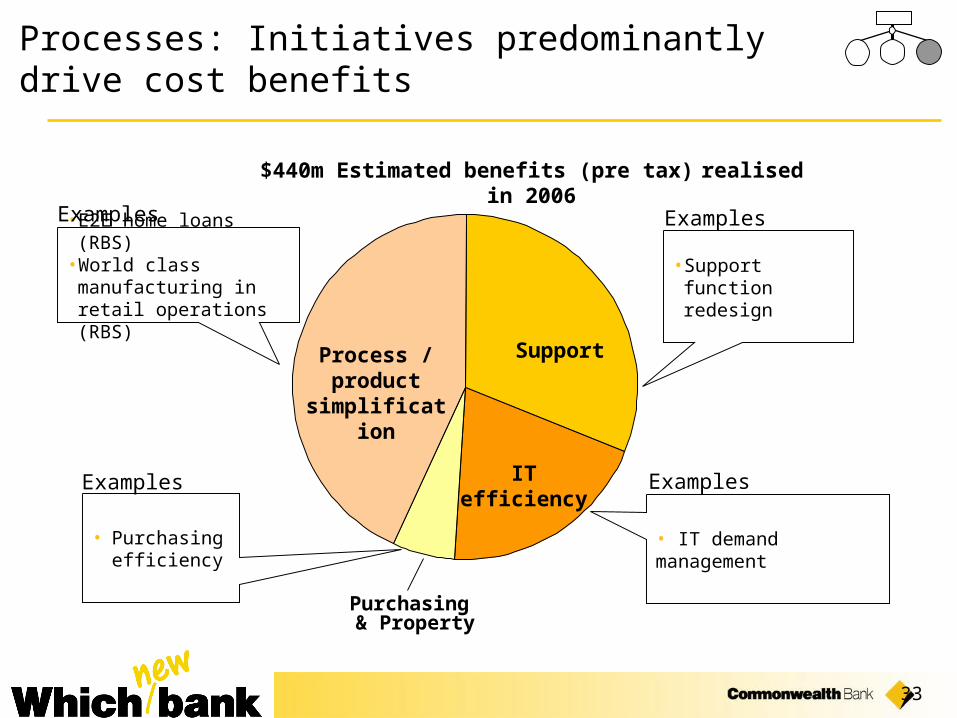
Processes: Initiatives predominantly drive cost benefits
Support
Purchasing & Property
IT efficiency
$440m Estimated benefits (pre tax) realised in 2006
Process / product
simplification
• E2E home loans (RBS)• World class
manufacturing in retail operations (RBS)
• Support function redesign
• Purchasing efficiency
• IT demand management
Examples
Examples
Examples
Examples

34
Process Improvement: Transformation Outcomes
Simpler, more effective processes resulting from:
reduced number of IT systems
reduced re-keying and paper handling
streamlined approval processes
Providing:
improved responsiveness and faster cycle times
increased accuracy and reduced information requests
more time for frontline staff to serve customers
35
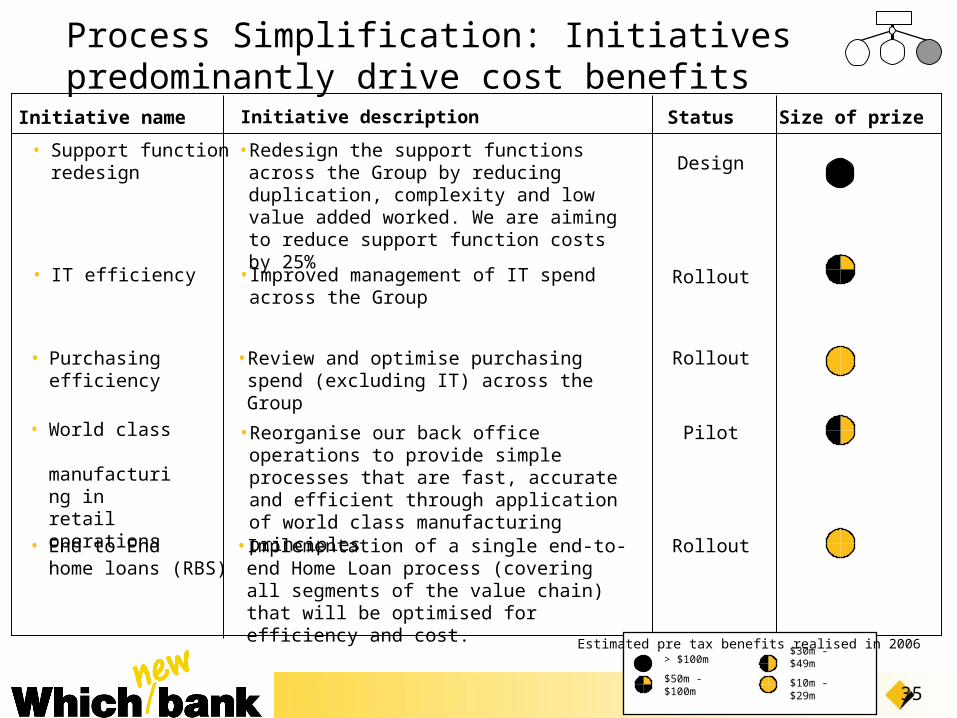
Initiative name Initiative description Size of prize
• Support function redesign
• Redesign the support functions across the Group by reducing duplication, complexity and low value added worked. We are aiming to reduce support function costs by 25%
Status
Design
• IT efficiency • Improved management of IT spend across the Group
Rollout
• End to End home loans (RBS)
• Implementation of a single end-to-end Home Loan process (covering all segments of the value chain) that will be optimised for efficiency and cost.
Rollout
• Purchasing efficiency
• Review and optimise purchasing spend (excluding IT) across the Group
Rollout
• World class manufacturing in retail operations
• Reorganise our back office operations to provide simple processes that are fast, accurate and efficient through application of world class manufacturing principles
Pilot
> $100m
$50m - $100m
Estimated pre tax benefits realised in 2006
$30m - $49m
$10m - $29m
Process Simplification: Initiatives predominantly drive cost benefits

36
End to End Home Loan supported by service initiatives are already underway and will be extended to other product lines
New Origination Platform (CMP) + Workflow Technologies
“Straight-through” processing (vanilla loans - application to documentation)
Rollout CMP to Mobile Lenders
Online Application Portal - Brokers
New Branch Servicing Model
Common Back-Office Processes
Automated Credit Decisioning
June 2003
July 2003Eliminate data re-keying+ status tracking
Nov 2003
Resolve customerenquiries on-the-spot
Nov 2003
Jun 2004
Oct 2003
Jun 200485% of loans conditionallyapproved “on-the-spot” by
Jun-06
Single, modern sales platform
completedReplicate process for personal loans and credit cards
Completion of Programme Dec 2004
Single, modern sales platform
Eliminate data re-keying + faster approval
Back-Office Efficiencies

37
Operations Processing (OPC) Example
Improved work flows
Standardised processes
Removal of obstacles and redundant activity
World Class Manufacturing pilots in retail will be expanded across the Bank
Baseline establishment
Establish the optimal ‘flow rate’ to balance processing
Define optimal process flows
Development of world class manufacturing prototype
Demonstrate potential impact via pilot
Determine sustainable model
Roll out and implement world class manufacturing principles across OPCs
completed

38
Financial impact and outcomes
Over the next three years we will:
Redirect the normal project spend of $600m
Spend an additional $620m
Invest a further $260m in our branch network
Over the next three years this will result in:
Cash EPS growth exceeding 10% CAGR
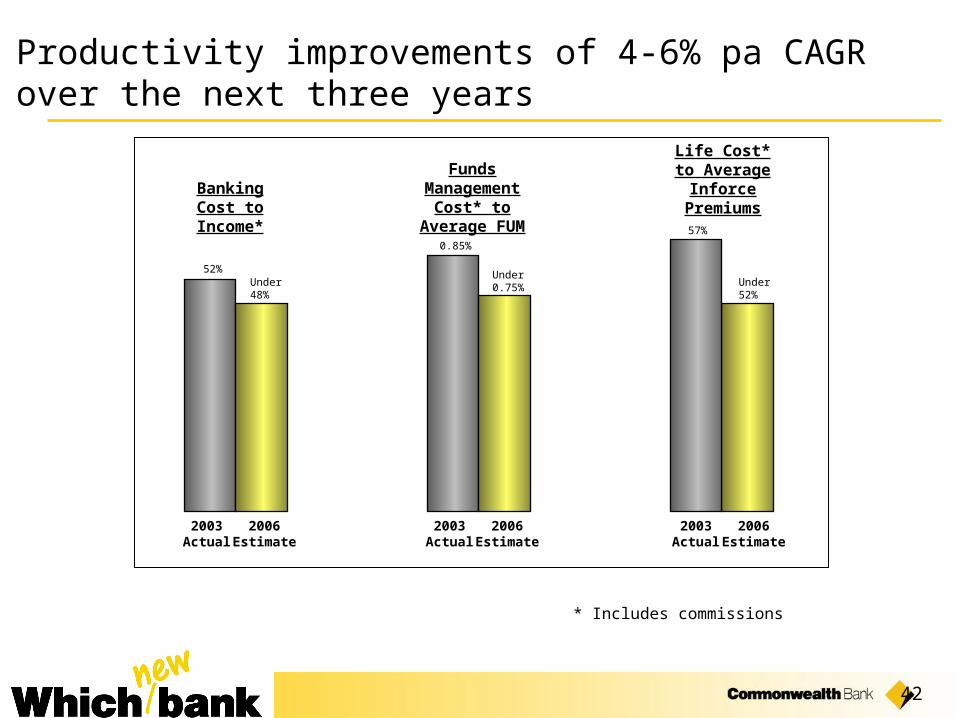
4-6% CAGR productivity improvements
Profitable market share growth across major product lines
Increases in dividends per share each year
Subject to current market conditions continuing

39
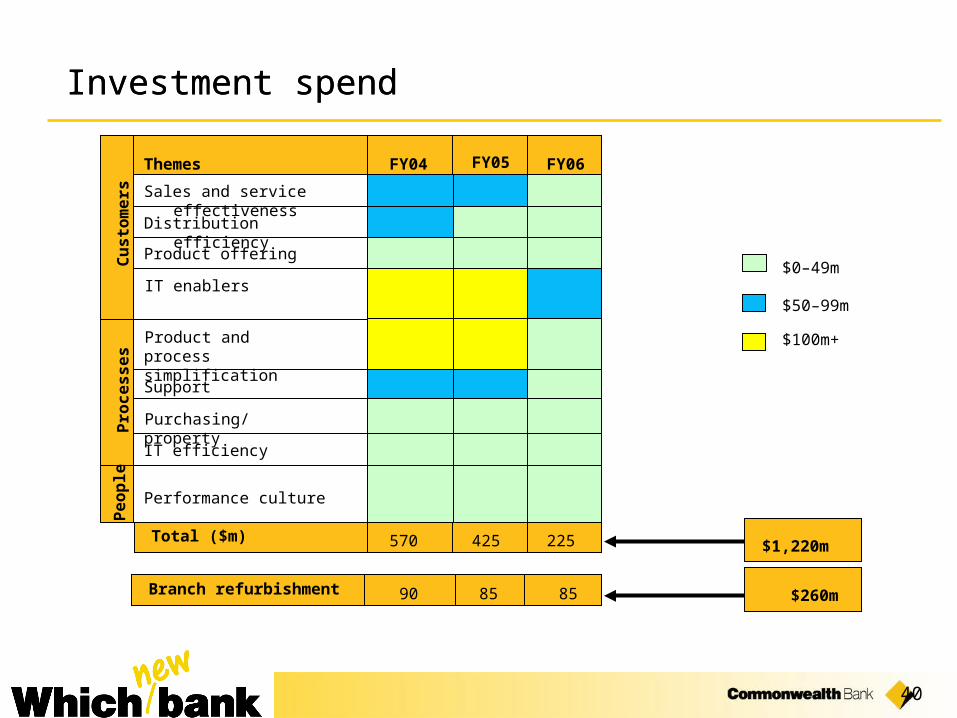
Investments & Benefits
(1) Estimated benefits are recurring and continue to grow beyond 2006. They are comprised of 50% cost savings and 50% revenue improvement.
Investment Analysis ($m) 2004 2005 2006Total
2004-06
Estimated Investment SpendInitiatives 570 425 225 1,220
Branch refresh 90 85 85 260
Total Investment Spend (pre tax) 660 510 310 1,480
Estimated Benefits (pre tax) (1)200 620 900
40
Investment spend
$100m+
$0–49m
$50–99m
Investment spend
Total ($m)
FY04 FY05 FY06Themes
Sales and service effectiveness
Product offering
Distribution efficiency
Cu
sto
me
rs
IT enablers
Product and process simplification
Support
Purchasing/propertyIT efficiency
Performance culture
Pro
ce
ss
es
Pe
op
le
425 225570
Branch refurbishment 85 8590
$1,220m
$260m

41
Total ($m)
Benefit analysis
RevenueCost saving
FY04 FY05Themes
Sales and service effectiveness
Product offering
Distribution efficiency
Cu
sto
me
rs
IT enablers
Product and processsimplification
Support redesign
Purchasing/property
IT efficiency
Performance culture
Pro
ce
ss
es
Pe
op
le
FY06
$100m+
$0-49m
$50–99m
200 620 900$900m benefit realised in FY06
42
Productivity improvements of 4-6% pa CAGR over the next three years
52%Under 48%
0.85%
Under 0.75%
57%
BankingCost to Income*
Funds Management
Cost* to Average FUM
Life Cost* to Average Inforce
Premiums
Under 52%
2003Actual
2006Estimate
* Includes commissions
2003Actual
2006Estimate
2003Actual
2006Estimate
43
Customer service culture, the next transformation
Customer Service
through
Engaged People
supported by
Simple Processes

44
Summary
Operating Environment:
Economy resilient
Home loan growth continues
Favourable outlook for Funds Management and Life Insurance
Performance:
9% underlying profit growth
Strong credit quality and capital position
Good September 2003 quarter
Which new Bank:
Launched September 2003
Significant cultural transformation
Size of the prize is large
45
Morgan Stanley Asia Pacific Summit
Hugh Harley
Group Executive, Retail Banking ServicesCommonwealth Bank of Australia
November 2003
Supplementary Slides: Transformation
47
We are serious about changing to be more customer focused
Our plans are comprehensive, well thought through and already underway
We have achieved encouraging results to date
We are confident that we will meet our financial expectations

48
Plans are in place to complete our largest transformation
Around $900 million of improvement initiatives (~50% customer, 50% simplicity ~50% cost, 50% revenue)
100+ initiatives within divisions and cross-divisional
Opportunities identified
Significant recurring value to be created through behavioural change Around one-third of value from new initiatives, one-third in planning,
one-third already in progress Around 50% of all initiatives have a payback inside 2 years
Profile of opportunities
Staging and sequencing
Group-wide initiatives concentrated early to ‘clear the way’ Immediate start for divisional initiatives Sequenced to align capacity with resourcing requirements

49
Our vision
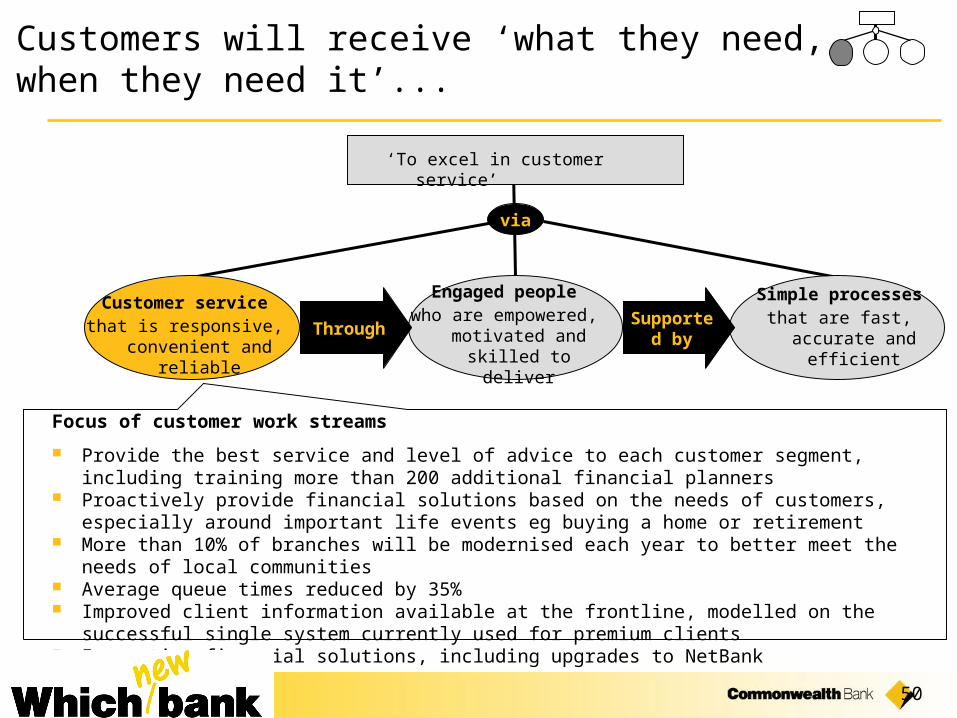
‘To excel in customer service’
50
Simple processesthat are fast, accurate
and efficient
‘To excel in customer service’
Customer servicethat is responsive,
convenient and reliable
Focus of customer work streams
Provide the best service and level of advice to each customer segment, including training more than 200 additional financial planners
Proactively provide financial solutions based on the needs of customers, especially around important life events eg buying a home or retirement
More than 10% of branches will be modernised each year to better meet the needs of local communities Average queue times reduced by 35% Improved client information available at the frontline, modelled on the successful single system currently
used for premium clients Innovative financial solutions, including upgrades to NetBank
via
Engaged peoplewho are empowered,
motivated and skilled to deliver
Supported by
Through
Customers will receive ‘what they need, when they need it’...

51
Key value drivers for customer service initiatives have been identified
Service and Sales Effectiveness
IT Enablers
Distribution Efficiency
Product
•Sales force effectiveness•Retention and run off•Cross sell / penetration•Credit approvals
•IT demand management•IT system rationalisation
• Network optimisation• Call centre efficiency• Channel mix improvements
•Product rationalisation•Pricing and bundling•New products
52
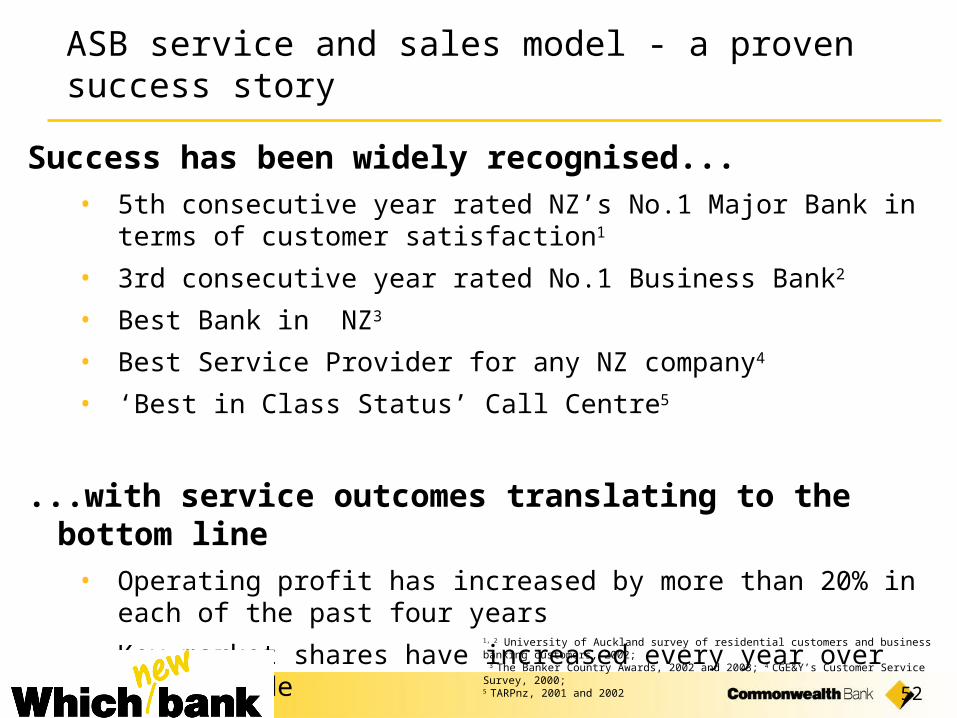
ASB service and sales model - a proven success story
Success has been widely recognised...• 5th consecutive year rated NZ’s No.1 Major Bank in terms of
customer satisfaction1
• 3rd consecutive year rated No.1 Business Bank2
• Best Bank in NZ3
• Best Service Provider for any NZ company4
• ‘Best in Class Status’ Call Centre5
...with service outcomes translating to the bottom line• Operating profit has increased by more than 20% in each of the
past four years
• Key market shares have increased every year over past decade1, 2 University of Auckland survey of residential customers and business banking customers, 2002; 3 The Banker Country Awards, 2002 and 2003; 4 CGE&Y’s Customer Service Survey, 2000; 5 TARPnz, 2001 and 2002

53
Service & Sales Process
Examples of Actions
• Weekly ExCo service & sales meetings–Structured focus on behaviour–Drives continuous improvement–Align meeting processes across the Group
Inter-divisional Referral Process
Service & Sales Reporting &
Meetings
Rewards & Recognition
Metrics & ‘formal incentives’
Application of ASB service and sales system in Commonwealth Bank
Application in Commonwealth Bank
• Recent pilot in the retail bank resulted in 82% increase in average number of referrals per employee
• Planned Group-wide roll-out
• Refresh existing relevant processes via training and continuous coaching and roll out across the Group
• Establish and roll-out common non-negotiable minimum standards of behaviour
• Introduce CEO Awards for excellent customer service• Embed a culture of day-to-day recognition behaviour within teams
• Implement metrics, targets, KPIs and incentive programs that are aligned to customer centricity and customer-oriented behaviours

54
Our customer service will be delivered through engaged people
Simple processesthat are fast, accurate
and efficient
‘To excel in customer service’
Customer servicethat is responsive,
convenient and reliable
Focus of people work stream
Implement a cultural change program - networked, performance driven Take direction from the people who serve our customers eg CEO emailbox and
frontline representation on workstream reference groups Enable frontline people to solve customer problems through increased delegations
and provision of decisioning tools Double the investment in training and development eg Adviser Academy Measure people on customer outcomes Recognise and reward people for superior service eg CEO Awards
via
Engaged peoplewho are empowered,
motivated and skilled to deliver
Supported by
Through

55
Simple processesthat are fast, accurate
and efficient
‘To excel in customer service’
Customer servicethat is responsive,
convenient and reliable
Focus of simplification work streams
Provide faster service through improved cycle times eg aim to fund approved personal loans in less than 24 hours
More frontline time spent serving customers through the removal and automation of procedures Increased accuracy and reduced information requests through pre-populated forms and single data entry Simpler processes which will improve response times eg aim to retrieve transaction information for
business clients within 2 hours Reduce the number of IT systems
via
Engaged peoplewho are empowered,
motivated and skilled to deliver
Supported by
Through
Our people will be supported by processes that are ‘simply better’

56
Key value drivers for process simplification have been identified
Support function redesign including purchasing & property
Process / product
IT Efficiency
•Activity Value Analysis•Purchasing effectiveness & demand reduction •Marketing spend effectiveness•Collections effectiveness•Property usage effectiveness
•Process improvement & consolidation with divisions
•Standardisation & rationalisation across divisions•Consolidation across divisions•Process/system rationalisation
• IT maintenance• IT simplification & standardisation• IT supple management• IT overhead effectiveness
57
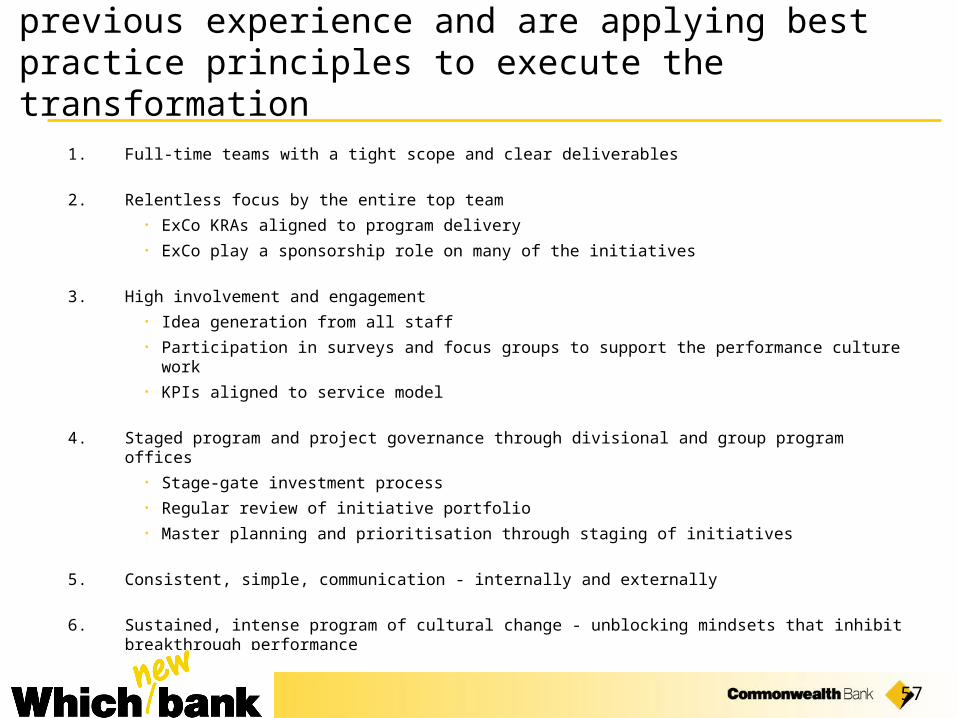
We are drawing on lessons learnt from previous experience and are applying best practice principles to execute the transformation
1. Full-time teams with a tight scope and clear deliverables
2. Relentless focus by the entire top team
• ExCo KRAs aligned to program delivery
• ExCo play a sponsorship role on many of the initiatives
3. High involvement and engagement
• Idea generation from all staff
• Participation in surveys and focus groups to support the performance culture work
• KPIs aligned to service model
4. Staged program and project governance through divisional and group program offices
• Stage-gate investment process
• Regular review of initiative portfolio
• Master planning and prioritisation through staging of initiatives
5. Consistent, simple, communication - internally and externally
6. Sustained, intense program of cultural change - unblocking mindsets that inhibit breakthrough performance
58
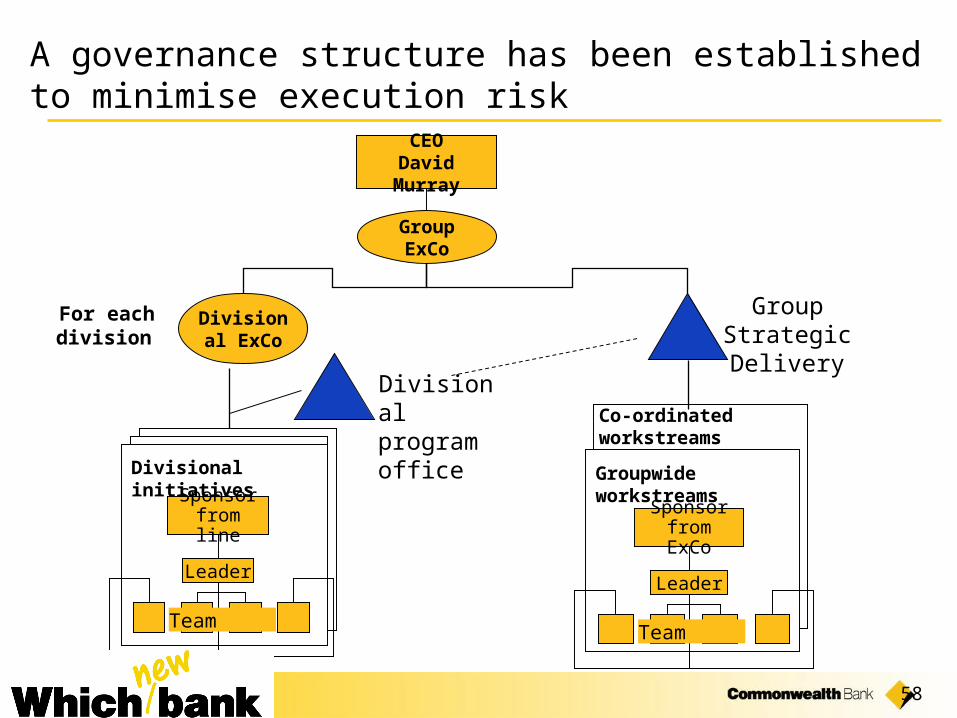
A governance structure has been established to minimise execution risk
CEODavid Murray
Group ExCo
Group Strategic Delivery
Divisional program office
For each division
Groupwide workstreams
Sponsor from ExCo
Leader
Team
Divisional initiatives
Sponsor from line
Leader
Team
Co-ordinated workstreams
Divisional ExCo
59
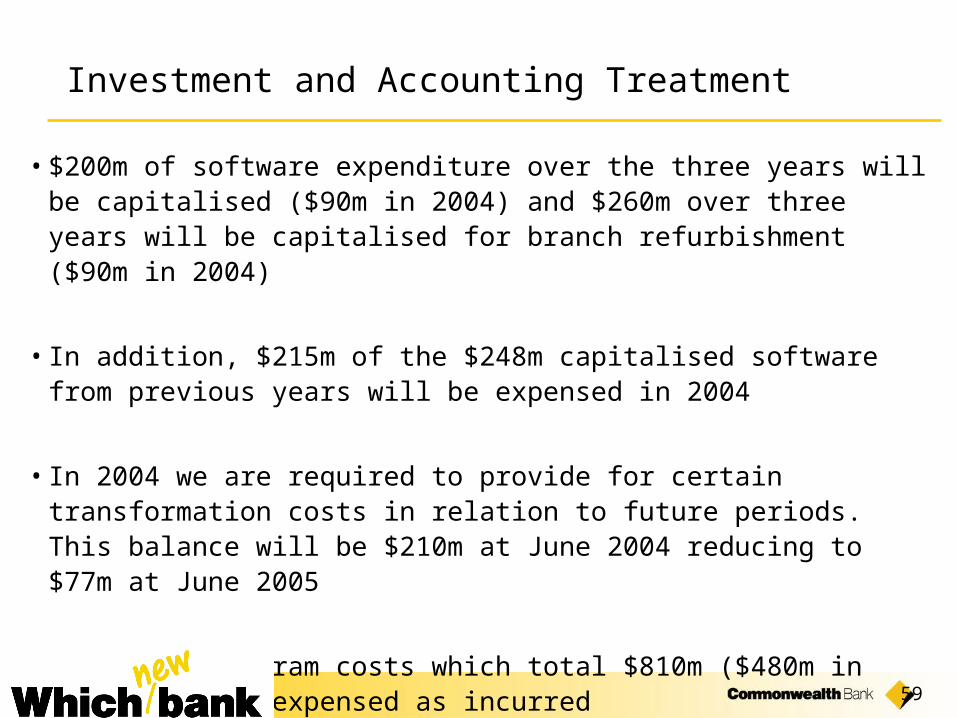
Investment and Accounting Treatment
• $200m of software expenditure over the three years will be capitalised ($90m in 2004) and $260m over three years will be capitalised for branch refurbishment ($90m in 2004)
• In addition, $215m of the $248m capitalised software from previous years will be expensed in 2004
• In 2004 we are required to provide for certain transformation costs in relation to future periods. This balance will be $210m at June 2004 reducing to $77m at June 2005
• All other program costs which total $810m ($480m in 2004) will be expensed as incurred
60
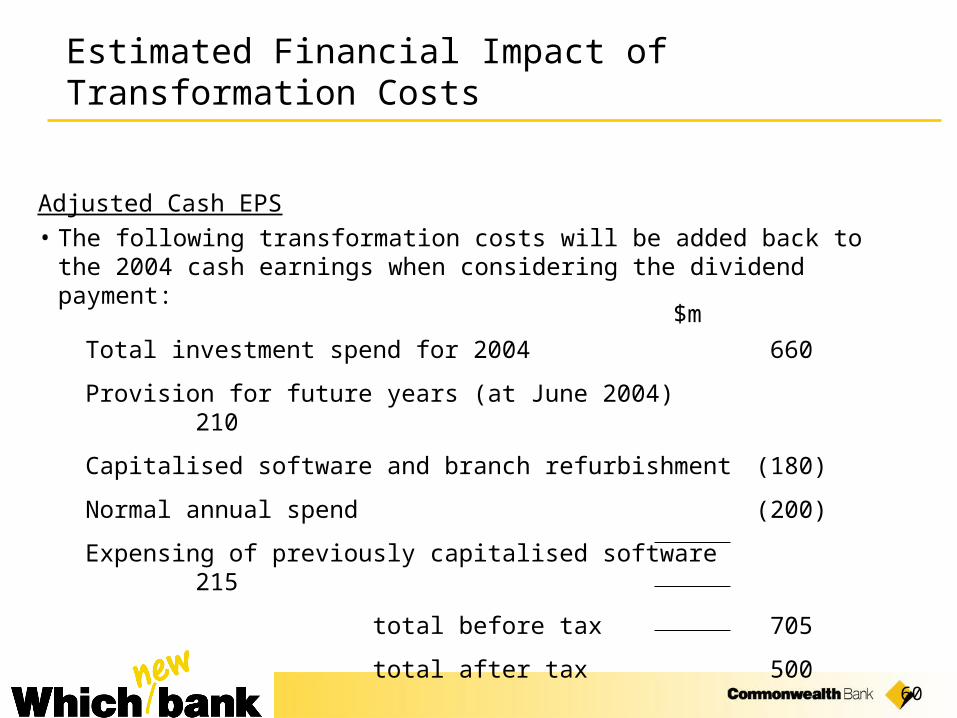
Estimated Financial Impact of Transformation Costs
Adjusted Cash EPS
• The following transformation costs will be added back to the 2004 cash earnings when considering the dividend payment:
Total investment spend for 2004 660
Provision for future years (at June 2004) 210
Capitalised software and branch refurbishment (180)
Normal annual spend (200)
Expensing of previously capitalised software 215
total before tax 705
total after tax 500
$m
61
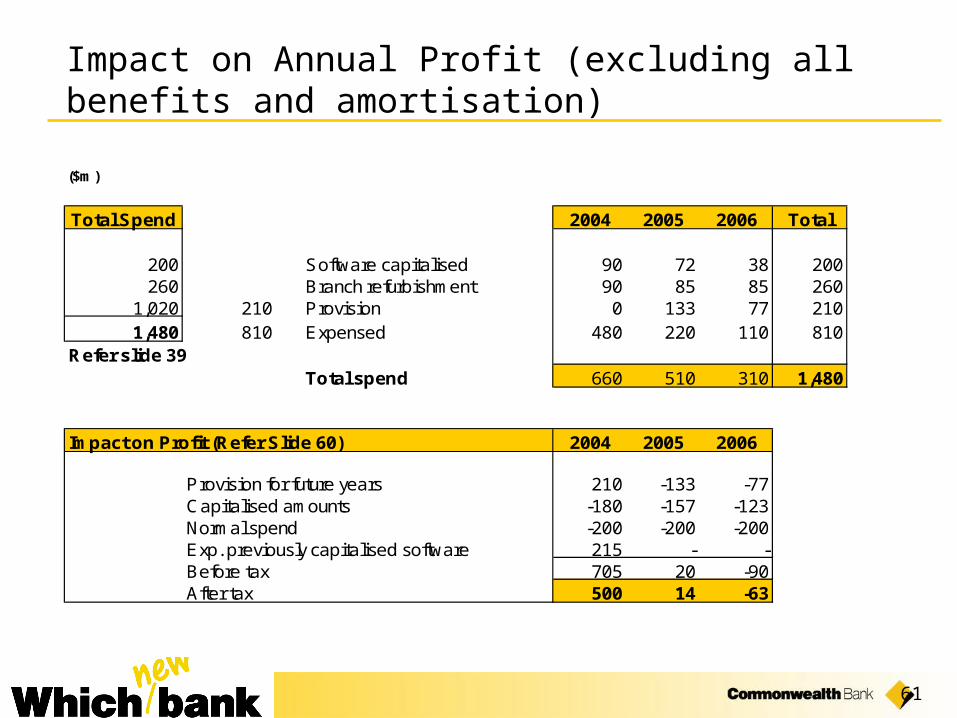
Impact on Annual Profit (excluding all benefits and amortisation)
($m)
Total Spend 2004 2005 2006 Total
200 Software capitalised 90 72 38 200260 Branch refurbishment 90 85 85 260
1,020 210 Provision 0 133 77 2101,480 810 Expensed 480 220 110 810
Refer slide 39Total spend 660 510 310 1,480
Impact on Profit (Refer Slide 60) 2004 2005 2006
Provision for future years 210 -133 -77Capitalised amounts -180 -157 -123Normal spend -200 -200 -200Exp. previously capitalised software 215 - -Before tax 705 20 -90After tax 500 14 -63
62
Dividends & Capital
• Subject to current trading conditions being maintained, we would expect the 2004 dividend per share growth to be in line with earnings per share growth, after adding back the transformation costs
• We will continue to issue shares to satisfy the DRP which, subject to approvals, should enable a structured share buyback to go ahead
• We expect to remain within our target capital ratios and maintain our current ratings
63
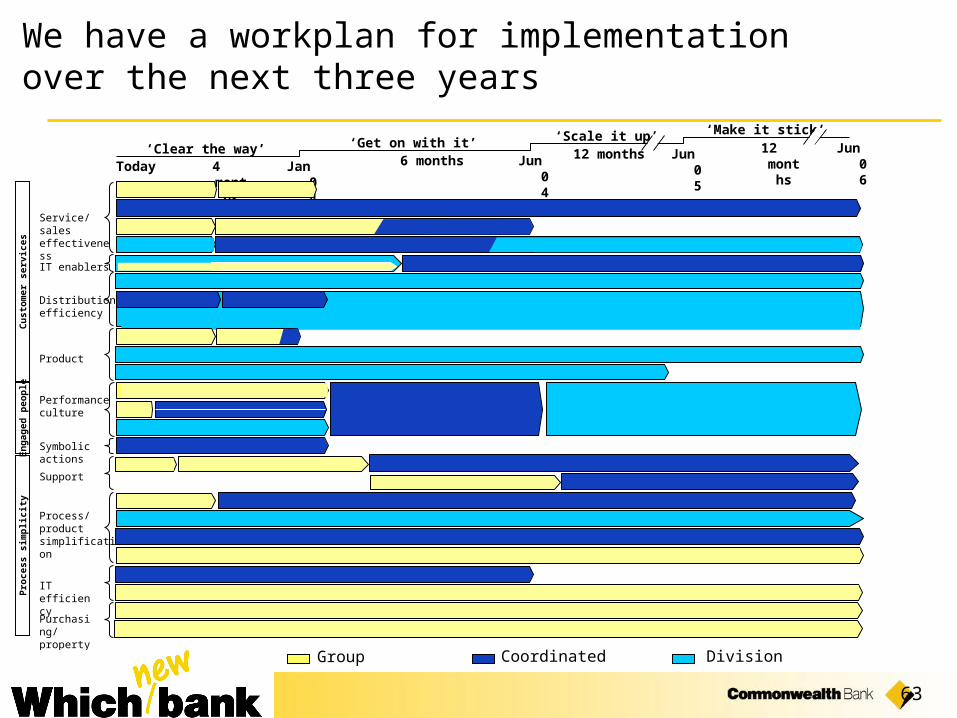
We have a workplan for implementation over the next three years
Group
‘Clear the way’ ‘Get on with it’ ‘Scale it up’ ‘Make it stick’Jun 06Jun 05Jun 04Jan 04Today 4 months 6 months 12 months 12 months
M
m
Service/sales effectiveness
IT enablers
Distribution efficiency
Product
Performance culture
Symbolic actions
En
gag
ed p
eop
le
Support
Process/ product simplification
IT efficiency
Purchasing/ property
Pro
cess
sim
plic
ity
Cu
sto
mer
ser
vice
s
Coordinated Division