Embed Size (px)
Citation preview
o UN&LASSIFILED , ,"~O -;-r- , , ,'
SECURITY CLASSIFICATION OF THIS PAGE (Wh7en Date Entered)
RPRDOUETATINPG RZAD INSTRUCTIONSREPORT DOUMEN~TTIN iAG.,BEFORE COMPLETING FORM
0 . RFPORT NUMBER 2. GOVT ACCESSION NO. 3. RECIPIENT'S CATALOG NUMBER
AFIT/CI/NR 88- I __ _
4. TtTLE (and Subtile) AJ M|ff 1. V J TIS GA TJ,,0 0 S. TYPE OF REPORT & PERIOD COVERED
(0 OF iH J Phc'T oF k~c,4o1.. A, JO P h)dUs'.~UT I'PD, THESIS0')IISI 01% rAQ1D17 JUO tGAIT ?RrLf.5- 6. PERFORMING O-AG. REPORT NUMBER
7. AUTHOR(s) 8. CONTRACT CR GRANT NUMBER(&)
AQT1-IoQy H. PrrEI-T-sT1 .0 I
9. PERFORMING ORGANIZATION NAME AND ADDRESS 10. PROGRAM ELEMENT, PROJECT, TASKAREA & WORK UNIT NUMBERS
AFIT STUDENT AT: )oJE.Ssily OF'
CIL) CL.tJAT1 ___________
If. CONTROLLING OFFICE NAME AND ADDRESS 12. REPORT DATE
198813. NUMBER OF PAGES
14. MONITORING AGENCY NAME & ADDRESS(II different from Controlling Office) IS. SECURITY CLASS. (of thls report)
AFIT/NRWright-Patterson AFB OH 45433-6583 UNCLASSIFIED
ISa. DECL ASSI FICATION/DOWNGRADINGSCHEDULE
16. DISTRIBUTION STATEMENT (of this Report)
DISTRIBUTED UNLIMITED: APPROVED FOR PUBLIC RELEASE
ELECTE
17. DISTRIBUTION STATEMENT (of the abstract entered in Block 20, If different from Report) AU .0;
SAME AS REPORT
IS. SUPPLEMENTARY NOTES Approved for Public lease: IAM A FR 190-1
LYNN E. WOLAVER [-a" ,4Dean for Research an Professional DevelopmenAir Force Institute TechnologyWright-Patterson AFB OH 45433-6583
19. KEY WORDS (Continue on reverse side If necessary and IdentIfy by block number)
20 ABSTRACT (Continue on reverse side If necessary end Identify by block number)
ATTACHED
DD IjAN 73 1473 EDITION OF I NOV 65 IS OBSOLETE lr!CLASSIFLE.SECURITY CLASSIFICATION OF THIS PAGE (1
47,en Data Entered)
. , • ,' ;
. .. , .', .S; . , ~ ",.j
-r ,-l i iii* -e*i ;r'S. . J 'S.~ Pe ~ ** . . . ' S .- ..%
- - -- - -
An Empirical Investigation of the Impactof the Anchor and Adjustment Heuristic
on the Audit Judgment Process
A dissertation submitted to the
Division of Graduate Studies and Researchof the University of Cincinnati
in partial fulfillment of the
requirements for the degree of
DOCTOR OF PHILOSOPHY
in the Department of Accounting and Business Lawof the College of Business Administration
1988
by
Anthony H. Presutti, Jr.
B.S., St. Joseph University, 1969
M.S., University of Arkansas, 1972
S.'
4 S.
ABSTRACT
This research investigated the operation of the
anchor and adjustment heuristic in the environment of the
continuing audit engagement. Specifically, the impact of
information concerning the previous year's compliance test
results was measured over several reported error rates
from the current year's compliance test results. The
experimental instrument was applied to two classes of
participants, audit practitioners from both public
accounting and a government audit service. Each
participant was required to supply a estimate of the total
population error rate using the information given and the
" risk assessment methodology. The results of this
empirical investigation determined that the addition of
prior year information appears to moderate the impact of
the anchor and adjustment heuristic by reducing the.---
participants' confidence that the, sample error rate
represents an acceptable population error rate.
COPV.6 Pu t' : ,,C . []
AV: A ; or C
iW -%
W6 -J -i -. 7) ". _J --- 1 . .-
ACKNOWLEDGEMENTS
Protracted effort such as this dissertation can never
be blamed on anyone other than its author. To the extent
that it was ever completed is a credit to several groups
and individuals. First of all my mentor and chairman,
Professor David C. Burns, deserves the lion's share of the
credit. It was with his help, persistence, and
encouragement that this project succeeded. The assistance
of the remaining members of my committee, Professors
Donald Ricketts, Tim Sale, and Dennis Ducheon will be
gratefully remembered, alwas. I need to salute the U.S.
Air Force for actually believing that I had the capacity
to accomplish this degree and providing me the
opportunity. As always there is your family to be
thanked. In this case, my wife, Eleanor and children,
Anthony and Elita, for permitting me the precious time to
get things done. My parents, Adele and Tony Presutti,
deserve credit too but especially my father. His ravenous
appetite for books gave me the interest needed to further
my education even to this degree.
~iii
oC q
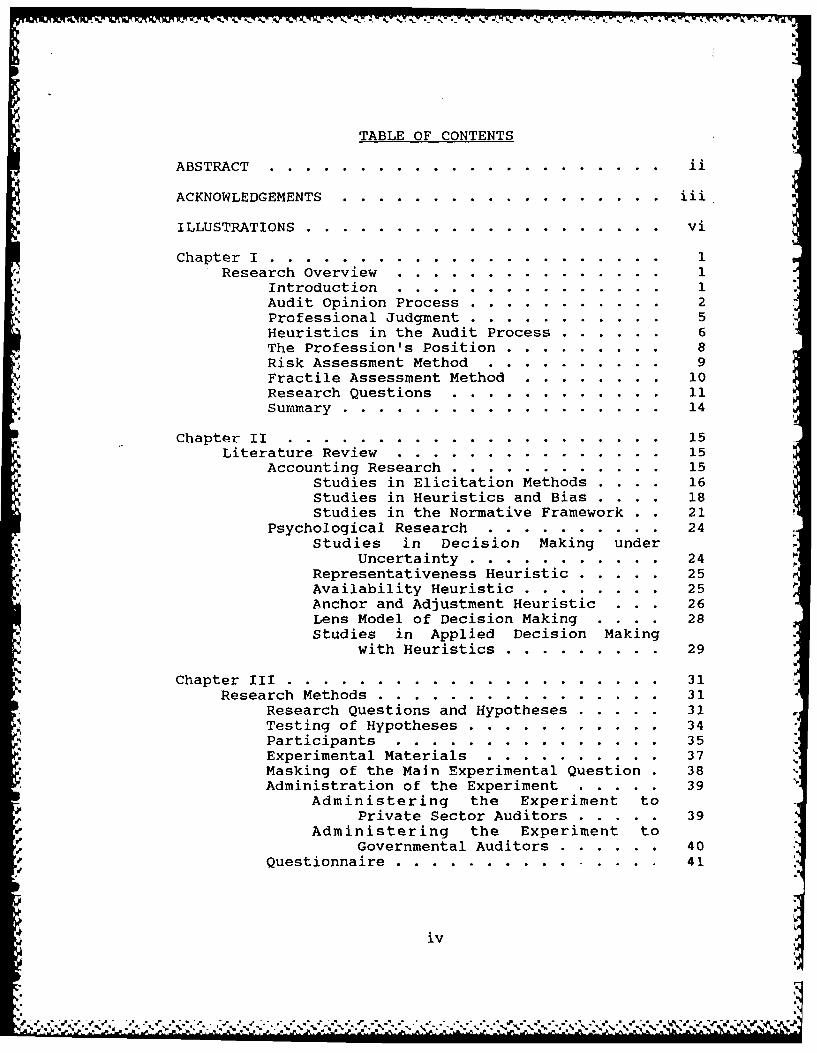
TABLE OF CONTENTS
ABSTRACT.................... .. ... . .. .. .. . . ....
ACKNOWLEDGEMENTS ........ .................. iii
ILLUSTRATIONS .......... .................... vi
Chapter I ............ ...................... 1Research Overview ........ ............... 1
Introduction ....... ............... 1Audit Opinion Process ... ............ 2Professional Judgment ..... ........... 5Heuristics in the Audit Process ... ...... 6The Profession's Position ........... 8Risk Assessment Method ..... .......... 9Fractile Assessment Method .... ........ 10Research Questions ... ............ 11Summary ...... .................. 14
Chapter II ........ ..................... 15Literature Review ..... ............... 15
Accounting Research ... ............ 15Studies in Elicitation Methods .... 16Studies in Heuristics and Bias .... 18Studies in the Normative Framework . . 21
Psychological Research .. .......... 24Studies in Decision Making under
Uncertainty ........... 24Representativeness Heuristic ..... . 25Availability Heuristic ......... . 25Anchor and Adjustment Heuristic . . 26Lens Model of Decision Making . . . 28Studies in Applied Decision Making
with Heuristics .......... . 29
Chapter III ........ .................... 31Research Methods ............................. 31
Research Questions and Hypotheses ..... . 31Testing of Hypotheses ... ........... . 34Participants ..... ............... 35Experimental Materials .. .......... 37Masking of the Main Experimental Question . 38Administration of the Experiment ..... . 39
Administering the Experiment toPrivate Sector Auditors ..... 39
Administering the Experiment toGovernmental Auditors ...... 40
Questionnaire .... ........... 41
iv I
~ **** V
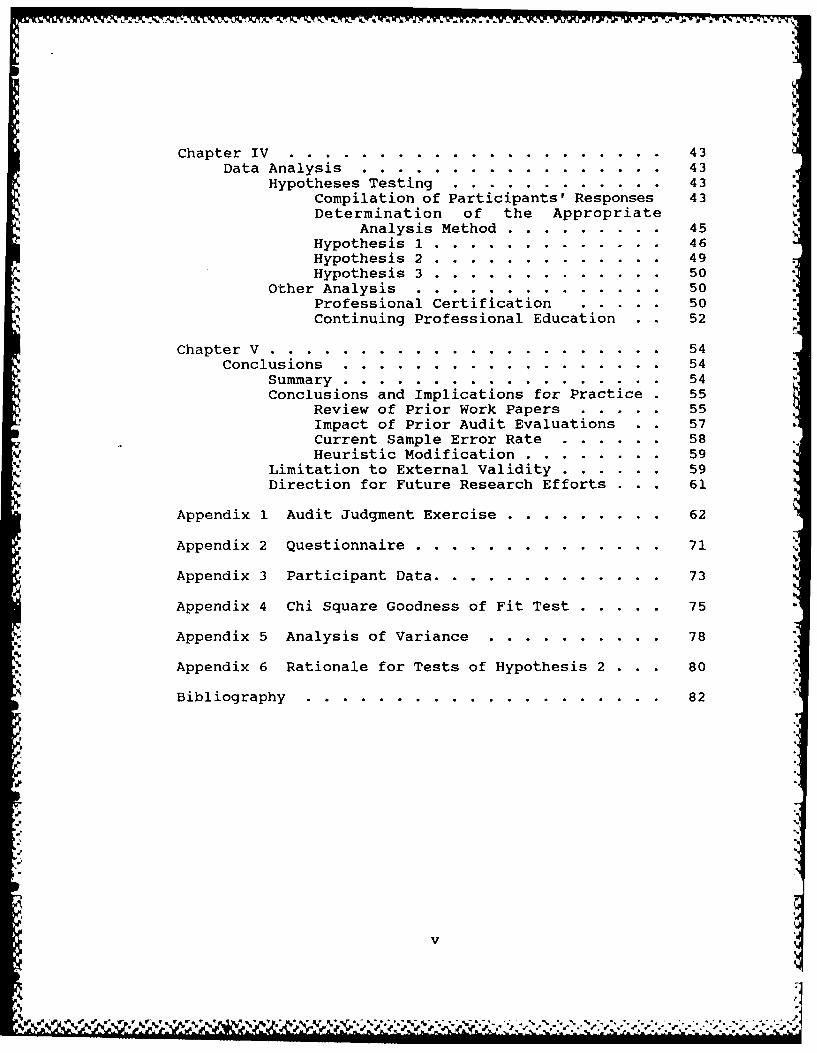
Chapter IV ......... ................... 43Data Analysis . ... ... 3.......
Hypotheses Testing . ... ... ... 43Compilation of Participants' Responses 43Determination of the Appropriate
Analysis Method .......... . 45Hypothesis 1 .... ............ . 46Hypothesis 2 ... ............. . 49Hypothesis 3 ... ............. . 50
Other Analysis ..... ............ 50Professional Certification ..... 50Continuing Professional Education . . 52
Chapter V ........ ...................... 54Conclusions ...... .................. 54
Summary ....................... 54Conclusions and Implications for Practice . 55
Review of Prior Work Papers ... .. ... 55Impact of Prior Audit Evaluations . 57Current Sample Error Rate ...... 58Heuristic Modification ......... . 59
Limitation to External Validity ...... . 59Direction for Future Research Efforts . . 61
Appendix 1 Audit Judgment Exercise .......... . 62
Appendix 2 Questionnaire .............. 71
Appendix 3 Participant Data ... ............. . 73
Appendix 4 Chi Square Goodness of Fit Test ..... . 75
Appendix 5 Analysis of Variance .. .......... 78
Appendix 6 Rationale for Tests of Hypothesis 2 . . 80
Bibliography ....... ................... 82
'*h-
OF e le V
% ~. . . . . .
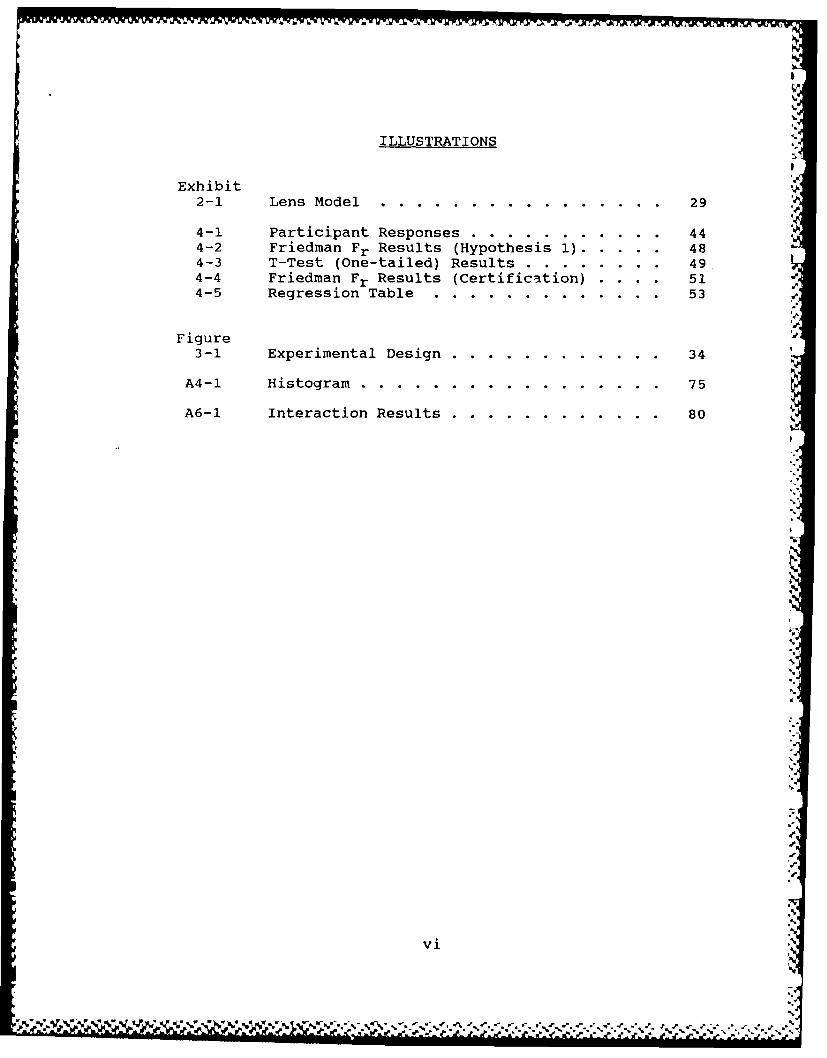
ILLUSTRATIONS
Exhibit2-1 Lens Model...................29
4-1 Participant Responses...... .. .. .. .. ... 44-2 Friedman Fr Results (Hypothesis 1). ....... 484-3 T-Test (One-tailed) Results...........494-4 Friedman Fr Results (Certification) . ... 514-5 Regression Table................53
Figure
3-1 Experimental Design...............34
A4-1 Histogram....................75
A6-1 Interaction Results...............80
vi
Nk NA,
.7'5
Chapter I
Research Overview
Introduction 0.
The use of statistical sampling procedures in the
conduct of audits is of increasing importance to the
profession. Auditing has progressed from a position of
permitting the use of statistical sampling (Grinaker and
Barr, 1965) to defending its non-use in certain
circumstances on audits (Holmes and Burns, 1979).
Statistical sampling is still considered situation
specific (Burton, Palmer, and Kay, 1981), and as such,
demands professional judgment as to when it is appropriate
or more importantly, when it is not. However, current
audit procedures concerning the evaluation of statistical
samples allow the auditor to choose the evaluation
technique (Burton, Palmer, and Kay, 1981). This position
is explained in the most recent policy in this area
[Statement on Auditing Standards (SAS) 39, American
Institute of Certified Public Accountants (AICPA), 1981].
This statement continues to permit use of a judgmental
technique for determining whether sample results from
compliance tests are indicative of problems significant
enough to alter subsequent plans for substantive audit
test procedures.
1
~~~~.~~~ %. %% U% y% - U.U
2
Audit Opinion Process
The auditor's opinion formulation process has been
the subject of much research in accounting during the last
ten to fifteen years (Felix and Kinney, 1982). Within the
process, primary emphasis has been put on the area of
internal control evaluation and testing, simply because it
-is this initial stage that forms the foundation for the
rest of the examination. In this area, some researchers
have studied auditor behavior in making probabilistic
judgments with respect to evaluating the results of
analytic reviews and internal control compliance tests
(Felix and Kinney 1982, also Libby 1981). Decomposing the
audit opinion formulation process into its components
(Waggoner, 1986) illustrated that these decisions are made
up of both sampling and nonsampling risk elements. These
two risk elements were defined in SAS 39 as follows:
"Sampling risk arises from the possibility that,when a compliance or a substantive test is restrictedto a sample, the auditor's conclusions may bedifferent from the conclusions he would reach if thetest were applied in the same way to all items in theaccount balance or class of transactions.
Nonsampling risk includes all the aspects of auditrisk that are not due to sampling. An auditor mayapply a procedure to all transactions or balances andstill fail to detect a material misstatement or amaterial internal accounting control weakness.Nonsampling risk includes the possibility ofselecting audit procedures that are not appropriateto achieve the specific objectives.... Nonsamplingrisk also arises because the auditor may fail to
r*(. ,. . . . . . .. -4 .4-. V .
3
recognize errors included in documents that heexamines which would make that procedure ineffectiveeven if he were to examine all items."
The concept of nonsampling risk would then include the
individual biases that all decision makers bring into the
process. One of these biases can be attributed to the
operation of judgment heuristics or rules of thumb which
have been the subject of much research in several
disciplines. This line of research can find its genesis
in the seminal work of Tversky and Kahneman (1974). Their
research of biases in judgments detailed some of the
heuristics of decision making under uncertainty. Out of
Tversky and Kahneman's work, researchers in other fields,
like accounting, transplanted their concepts to determine
what, if any, impact was felt in those disciplines.
Probabilistic judgment is the basis for the rendering
of any audit opinion. Since this individual audit
judgment is not scientific, there are no rules available
to judge the propriety of the auditor's opinion other than
subsequently revealed contrary information. Although the
auditor's opinion appears to represent a singular opinion
it is in fact a representation of the consensus of the
auditing firm concerning the particular client's financial
reports. Indeed, in human judgment literature, consensus
is one of the accepted methods of determining the
"correct" answer to whatever problem is presented to the
participants (Libby and Lewis, 1982). This use of a
% 5.]
• p *.
4
substitute (the consensus judgment of experts) where there
is a lack of objective criterion data making the direct
measurement of achievement impossible, is part of many
decisions required in accounting. Even with the consensus
of experts there is no guarantee that items sampled are
truly representative of the population as a whole.
However, in the application of the attestation function,
the only way to prove the auditor "wrong" (in the sense
that a clean opinion is inappropriate) is to develop
contrary financial information. The opportunity to
exercise professional judgment occurs continually
throughout the audit process. These professional
judgments extend from which information is required; to
how much; to how it is to be collected and evaluated; to
the ultimate decision of whether the information gathered
and evaluated supports the issuance of an audit opinion,
which is the culmination of the auditor's professional
judgment process.
At the heart of any audit effort lies the auditor's
evaluation of the client's system of internal control.
The second standard of field work (AICPA, 1983) states
that:
"There is to be a proper study and evaluation of theexisting internal control as a basis for reliancethereon and for the determination of the resultantextent of the tests to which auditing procedures areto be restricted."
The primary emphasis here is to ensure that sufficient
®rd. 4
%*%-,IN /
5
audit work is being accomplished to properly support the
degree of reliance placed on the client's internal
controls. The compliance tests that serve as the basis
and justification for this reliance are normally
accomplished on a sample of relevant items selected by the
auditor. If statistical sample selection procedures have
been employed then a proper evaluation scheme also needs
to be used. Current practice permits the use of the risk
assessment method for evaluation purposes (SAS 39, AICPA,
1981). This particular method is one of two judgmental
evaluation methods originally considered as appropriate
prior to the issuance of SAS 39. The other method,
fractile assessment, was abandoned because its approach to
judgment was not considered to be the most conservative
approach.
Professional Judgment
The introduction of professional judgment also
includes the introduction of bias as indicated by the
literature of psychology when discussing human judgment.
This literature describes judgment and choice as
characterized by extensive biases (Einhorn and Hogarth,
1981). The individual judge inserts his/her own biases
into the process through the use of heuristics in the
decision process. It is this area of bias, the use of
N
.,.
6
heuristics, that the current research investigated. All
three heuristics described by Tversky and Kahneman (1974)
including the anchoring and adjustment heuristic can cause
problems for the audit and auditor. The most significant
peril arising from the anchoring and adjustment heuristic
is that the auditor is more likely to place unwarrented
reliance on the client's internal control system. In
doing so, subsequent substantive testing may be
inapproriately limited, resulting in insufficient
evidential matter, which would inhibit the auditor from
issuing an opinion if the short-coming were known. The
issuance of SAS 39 was an attempt to compensate for the
inclusion of bias resulting from auditors' heuristics,
primarily, the anchoring and adjustment heuristic. The
only method that would completely eliminate this type of
bias seems to be somewhat slower in coming. Acceptance by
*' the profession of statistical evaluation of audit
compliance test results would control for the
heuristically induced bias. Increased knowledge of the
auditor's decision process can lead to improving that
process through identification of both the details of the
process and the major variables involved.
• Heuristics in the Audit Processp
The heuristics used by the auditor can be defined as
yl
w
'4
74.
educated rules-of-thumb that bring in common-sense
approaches to problem solving (Hax and Candea, 1984). The
anchoring and adjustment heuristic, the focus of this
research, is such a rule-of-thumb which establishes an
estimate of a population parameter based on limited
initial information (for example, prior year workpapers)
and adjusts that estimate as new information (sample data)
becomes available. This adjustment process is not a
strict Bayesian (statistical) revision of the prior
probabilities (Kahneman and Tversky, 1972). That is, the
process does not take the previously established
probabilities (the anchor - prior probabilities) and using p
the Bayesian formula1 , revise those priors into current
probabilities (posterior probabilities) given the sample r
results. What does occur is an internal revision of the
prior estimates of the probabilities using a modified
adjustment technique. This adjustment process has been
shown to inadequately adjust for the sample information
provided (Tversky and Kahneman, 1974). Previous
accounting research indicates that this heuristic results
in adjustments which significantly influence auditors'
judgments concerning the amount of subsequent audit tests
required (Joyce and Biddle, 1981). The direction of the
1 Bayes Rule can be expressed as:P(HIID) = P(DIH 1 I P(_Hi
P(H2 1D) P(DIH 2 ) P(H2 ) where H1 and H2 are thealternative hypotheses
(from Libby, 1981) and D is the datum.
V ~ .S ~P .4 4~ p. *~* . . . o~.. °
8
change was not that predicted by the conventional
anchoring and adjustment heuristic. It was, however, in
line with the conservative approach that one associates
with auditing; that is, when internal control improved the
experimental participants exhibited a consistent
conservative stance and did not reduce the subsequent
substantive audit tests looking toward those tests as a
confirmation of the improved internal control system.
The Profession's Position
,4
The publication of SAS 39 (AICPA, 1981) eliminated
the auditors' choice between two judgmental methods (risk
assessment and fractile assessment) for evaluating sample
results. The outcome was a recommendation that the risk
assessment method be used. These two methods for
eliciting subjective probability distributions concerning
the estimate of the population error rate, have been
described as being formally equivalent (Tversky and
Kahneman, 1974). Since the tolerable error rate is tested
against the sample error rate to determine the efficacy of
the client's system of internal controls, then
investigation of the effects of different evaluation
methods is required to further our understanding of this
important decision process. Elicitation of subjective
probability distributions for given population parameter
:-.5
S- W % 'S* *5 . o' ."
9
can be obtained through the two methods named above:
either risk assessment or fractile assessment by the
participant.
Risk Assessment Method
In risk assessment, the subject would be asked to
assess the probability that the true parameter values will,
exceed the tolerable error rate which represents the
amount of error that the auditor can accept in the
client's financial records without either correcting the
error(s) or modifying the audit report (Holmes and Burns
1979). In the risk assessment method, the auditor judges
the likelihood that sampling error can explain the
difference between the sample error rate and the maximum
allowable rate, in other words, what is the probability
that the sample error rate is truly representative of the
population error rate. If, for instance, we were auditing
payables, our interest may be whether the receiving
reports were matched to purchase orders prior to payment.
Given our example, if the auditor receives sample results
from a statistical sampling procedure (e.g. population
3000 paid accounts payable vouchers, sample = 40, sample
error rate = .5%), and estimates the probability that the
population error rate does not exceed a specified upper
error limit (e.g. I am 90% confident that there are no
4.
p.
10
more than 8% incorrectly matched purchase orders) then the
auditor tends to underestimate the 90% confidence
interval, increasing the alpha or chance of committing a
type I error, rejecting a true hypothesis (Kinney and
Uecker, 1982).
Fractile Assessment Method
The other method, known as the fractile assessment
method, permits an auditor to add a subjective assessment
of sampling error to the sample error rate and compare the
result with the maximum allowable error (AICPA, 1979).
Using the example given above, the auditor would anchor on
the sample error rate (.5%) and then estimate with a given
confidence level whether the population error rate exceeds
the auditor's estimate (there is a one in twenty chance
that the population error rate will exceed eight per
cent). This increases the opportunity for the auditor to
commit a type II error, accepting a false hypothesis. The
fractile assessment method was eliminated as an acceptable
*method of evaluating sample results with the publication
of SAS 39. The difference between the two methods does
not come from the methods themselves, since they both
should lead to the same evaluation. Problems result from
individuals using different modes of adjustment from
different initial anchors (Kinney and Uecker, 1982). The
JC
-~~ ~~ i~ .I,,- ~ ~ tC~ .. ~ f~~~ ~\*.~~
-6 -J-1, L
current research deals with the risk assessment
methodology only, since this is the method selected by the-
profession.
Research Questions
This research is designed to provide insight into the
effect of the anchor and adjustment heuristic on
compliance audit test evaluations. Specifically, if the
anchor and adjustment heuristic would be affected by4%
providing the participants additional audit information
concerning compliance sample evaluations from the previous
year's audit files. This research question was
investigated through an analysis of a laboratory
experiment which elicited subjective probabilities ,
concerning compliance test sample results. The
experiment, which consisted of a booklet containing
various audit questions, attempted to duplicate the normal
audit setting by describing a situation which is
commonplace in the audit environment. Evaluation of
compliance testing is an essential first step in
determining how much reliance the auditor will place on
the client's system of internal control according to the
second standard of field work. These evaluations are
normally accomplished by the auditor-in-charge at the
* client's place of business based on audit evidence
-- %- l -47 . . . . 4 A- = . bb is,
f.p
12
gathered by subordinates. In most continuing engagements,
the auditor-in-charge will have the prior year's
workpapers available as a reference for the current audit
team. This apparent addition of information to a risky
decision should improve the auditor ability to judge.
Since we have to make inferences concerning the internal
control process from a sample of "key" (another judgment)
control applications, we are concerned with the structure
of the general decision task. With such an emphasis, the
general task needs to be specified in its natural
environment (Einhorn and Hogarth, 1981). This research4-
adds to the environment the aspect of prior information
which will provide an additional data point for the anchor
thus including choice in the anchor process. The research
measures the relative weight that prior information can
bring to the decision process by improving the task
structure (Joyce and Biddle, 1981).
Additionally, prior research also examined whether
the state of the prior audit information had a bearing on
current audit evaluations. That is whether the
acceptability of the prior year's sample evaluation would
further modify the subjective probability generated by the
evaluation of compliance test sample results. If the
prior audit work indicated that a similar sample was
acceptable or not, what effect did that have on the
current auditor's ability to appropriately assess the
NN
13
current audit work. Similar questions were asked in other
research efforts which resulted in determinations that
directional change in internal control strength have an
impact on the current audit planning effort for
substantive testing (Joyce and Biddle, 1981).
An associated question arises when the sample error
rates approximate the previous year's error rate. Does
the similarity of those error rates affect auditor
judgment? To delve into this question, auditors'
responses were measured over two different sample error
rates, one close to this year's results and one quite
distant. Based on previous psychological and accounting
research, the participants should not be able to sever the
evaluation one from the other, thus a further impediment
on auditor's ability to assess probability through the use
of risk assessment method. Some of this recent research
centered on the information search process that takes
*place (Brown in Moriarity and Joyce, 1984) and the
confidence the searcher places in the resulting judgment.
Ashton's comments (Ashton in Moriarity and Joyce, 1984)
make a cogent point that most experimental judgment tasks
involve all the necessary information and that the
information is perfectly reliable. This current research
effort included prior sample evaluation results which of
themselves connoted a risky decision and not perfectly
reliable data for the purposes of making professional
.,
,I
14
judgments concerning the client's current year financial
statements.
Summary
This investigation addresses three research questions
involving the anchor and adjustment heuristic;
* Does the availability of prior year sample resultsaffect current year evaluations of compliance testresults?
* Does the acceptability of prior year sampleresults affect current year evaluations of compliancetest results?
* Does the comparability of sample error rates betweenprior and current year compliance tests affectevaluation of current year sample results?
An empirical experiment was conducted using employees
of both national and regional public accounting firms and
government agency auditors. These participants were members
of the audit staffs of their respective firms and as such
had had experience in evaluating sample results from
compliance tests on client's internal control systems. The
experimental instrument was an audit scenario which required
each participant to provide their probabilities concerning
the confidence (elicitation of a subjective probability)
they would have in a sample from a compliance test.
r-
I I I
Chapter II
Literature Review
The basic premise in human judgmental theory is that
man has a limited cognitive ability to deal with an
extremely complex environment. In order to cope effectively
with that environment, the judgmental process has been
reduced to heuristics or simple judgment rules of thumb.
These heuristics and their involvement in the human judgment
process, especially the area of probabilistic judgment, have
been the subject of extensive research efforts in accounting
and psychology. The next section addresses the applicable
research in accounting. It is followed by a section
discussing the relevant research in psychology.
Accounting Research
Accounting's interest in behavioral decision making is
engendered by the essences of the accounting/auditing
process the use of financial information to make decisions
concerning the business entity. Libby's assertion that '
" (d)ecision making is the basis for the demand for
accountant's services and is involved in many of their more
difficult duties" serves as an explanation of the interest
in the area of decision making. In the arena of human
15
16
information processing, the major subdivisions form an
outline for our discussion of the relevant research in
accounting concerning probabilistic judgment.
Studies in Elicitation Methods One of the early research
areas in the opinion formulation process was to relate
professional judgment and the use of statistical procedures.
Under this heading of applicable statistical procedures
there were two distinct possible evaluation procedures, that , %
I%
of the "classical" and "Bayesian" approaches. To 5-
differentiate between these two, we need only to view the
"classical" approach as a snapshot of the sample
information. The procedure does not provide for any
additional information other than that contained in the
sample data which is evaluated on its own. Sample data in
the accounting context has been described in a probability
research effort (Corless, 1972) as "sampling evidence; all
other audit evidence... (is) nonsampling evidence." Thus, .N
subsequent to gathering sampling evidence, we need only to
apply the appropriate statistical technique for evaluation.
The Bayesian procedure uses "nonsampling" evidence to
establish a prior probability concerning the area under
investigation. Then, after obtaining sample data, Bayes
Theorem or Rule is used to revise the prior probability
estimates considering the information provided by the sample
data into posterior probability estimates. During the early
1970's when statistical sampling and evaluation were
17
becoming de rigueur in the profession, Corless concluded
that statistically revised estimates (using Bayes Theorem)
may be better interpreters of audit evidence than
intuitively developed estimates. This conclusion was
reached despite the finding that prior knowledge (in
Corless' study relative to internal control strength)
tightened the probability distribution (less variability).
Corless' study presupposed that the method used to obtain
the probability estimates from the auditor participants was
appropriate. In the mid to late 1970's, several papers were
published that concentrated on the validity of elicitation
methods (Chesley, 1975, 1976, 1977). These studies
concluded that method of elicitation did appear to have an
impact on task evaluation and the resultant probabilities
depending upon the participants' familiarity with the data
presentation method. As stated previously, the audit
opinion normally represents the consensus of the audit firm
implying that it is a group judgment rather than an
individual one. However many of the underlying decisions
are those of the individual auditor-in-charge. One of the
primary decisions to be made at the auditor-in-charge level
is that of internal control evaluation. Thus an issue that
should be of concern is the comparability of group versus
individual internal control judgments. This was the focus
of a study by Trottman et al which reported that a
comparison of group versus individual evaluations were of
orU
18 -
the same magnitude but slightly lower for groups than
individuals. The basic conclusion was that no apparent need
existed to call into question the present scheme of internal
control evaluation; it appropriately remains the purview of
the auditor-in-charge (Trottman, Yetton, and Zimmer 1983).
These studies reinforced the belief that individual
decisions form the basis of auditing.
Studies in Heuristics and Bias Part of the cognitive
structure brought into this decision making process would be
the heuristics applied by the auditor-in-charge. One of the
initial research efforts in this area attempted to determine
the extent that practitioners used two heuristics,
representativeness and protectiveness (Uecker and Kinney,
1977), which were assumed to lead to systematic errors in
the judgmental evaluation of sample outcomes. The results
of that study indicated that practicing CPAs judgments were
affected significantly by bias introduced through the
subjective evaluation of sample outcomes. A full
seventy-four per cent of the participants made at least one
serious error in judgment. That is, in the evaluation of
four different cases, auditor participants "in effect said
that a sample result which is unacceptable evidence at the
a ninety percent level is better than a sample result which is
in fact acceptable evidence at the 95% level of confidence"
(emphasis in the original). The research concluded that
auditors employed a more complex model of information
r-0.
19
processing than had been indicated in the human information
processing literature but that judgmental evaluation was a
real concern for practitioners. However the participants'
better than expected results lead to the conclusion that
auditors were more sophisticated in their ability to
evaluate statistical sample data than most others. This
implied that the use of simple heuristics was not as
widespread among auditors as originally thought.
In a series of three experiments (with six
treatments), Joyce and Biddle (1981) researched the use of
heuristics by auditors, primarily focusing on the anchoring
and adjustment heuristic as the basis for their research.
The second experiment in the series required the
participants to make a decision on the extent of necessary
audit procedures (for sales that were booked but the items
had not yet been shipped), they would require given the
specific directional changes in internal control strength
from the prior year to the current year. The participants
were given an initial internal control assessment (from the
prior year) which was to be the anchor ind then the current
assessment of internal control (from weak to strong and
strong to weak). The participants then were required to
make a judgment on the Fubsequent extent of audit. In
concert with previous research in the field of psychology,
the participants tended to overaudit when the movement was
from strong to weak and underaudit as it went from weak to
,
20 ,.
strong internal control. Unfortunately, the research design
was such that the dependent variable (extent of audit) was
confounded with a decision rule or heuristic that combined
the utility of the decision (extent of audit) with
probabilities (Libby, 1981). Despite this, the experimental
results did show a significant main effect (p<.0001) for the
internal control manipulation and significant effect
(p<.0002) for the interaction (order x internal control
strength). These effects indicate that information from
prior years may have a considerable impact on subsequent-. 4
audit plans through the establishment of an anchor and
subsequent insufficient adjustment based on the sample data
made available to the auditor. 5
During the consideration of the SAS on sampling
procedures, the AICPA's Sampling Standards Task Force had
the results of another study (Kinney and Uecker, 1982) which
compared the two judgmental assessment methods (fractile and
risk assessment) available to evaluate outcomes of audit
test samples. The difference between the two methods did
not flow from the methods themselves, since they should both
lead to the same assessment but resulted from individuals
using different modes of adjustment from different initial
anchor. On the basis of Kinney and Uecker's study, the
preference for the risk assessment method was expressed.
Unfortunately there were difficulties with the study
performed, Kinney and Uecker, due to the press of time,
W.
21
could not control the selection of participants. The
participants were selected by members of their accounting
firms increasing the statistical risk to the results of
their study due to the lack of control over the selection of
the participants. If accomplished with the appropriate
control, the selection of participants should be random from
the entire pool of available participants. By permitting
the firms to select the participants, the experimenters did
not control for the "risk of bias", that is the firms could
choose only those individuals who would perform the
experimental task very well or those whose time would not
have a serious impact on doing business. Another problem
with this study is that when the participants were required
to complete the experimental instrument neither experimenter
was available to ensure proper application of the
instrument. Recently, an additional research study was
* accomplished in this area with the stated purpose to test
the possibility that auditors' anchor, when evaluating
compliance sample results under the risk assessment
methodology, is not as proposed in Kinney and Uecker's
(1982) experiment (Butler,1986). The results of this study
indicate that auditors, in fact, have an internal anchor of
5 to 10 percent as a tolerable error rate in determining4,
risk assessments.
Studies in the Normative Framework Another research effort
(Waggoner, 1986) detailed the interplay of detection risk,
.4
". - " -" ',4,2. '£2 . ,- "
" ' _ '*, _% - ' L,% . .. '.
22
inherent risk and control risk as defined in SAS 47, Audit
Risk and Materiality in Conducting an Audit (AICPA, 1983).
Within the definition of control risk is included the
concept that this risk is "initially based on a preliminary
review of the internal control system and prior year's
workpapers (in words of the current research effort - an
anchor)." Further, "this initial assessment is" presumed to
be "confirmed or refuted by performing compliance tests of
the controls to be relied upon in restricting the extent of
substantive testing (adjusting the anchor)," (parenthetic
phrases not in the original). The explanation of this later
confirmation or corroboration concept is that the process in
determining the amount of total audit risk depends to a
significant extent upon proper evaluation of the sample
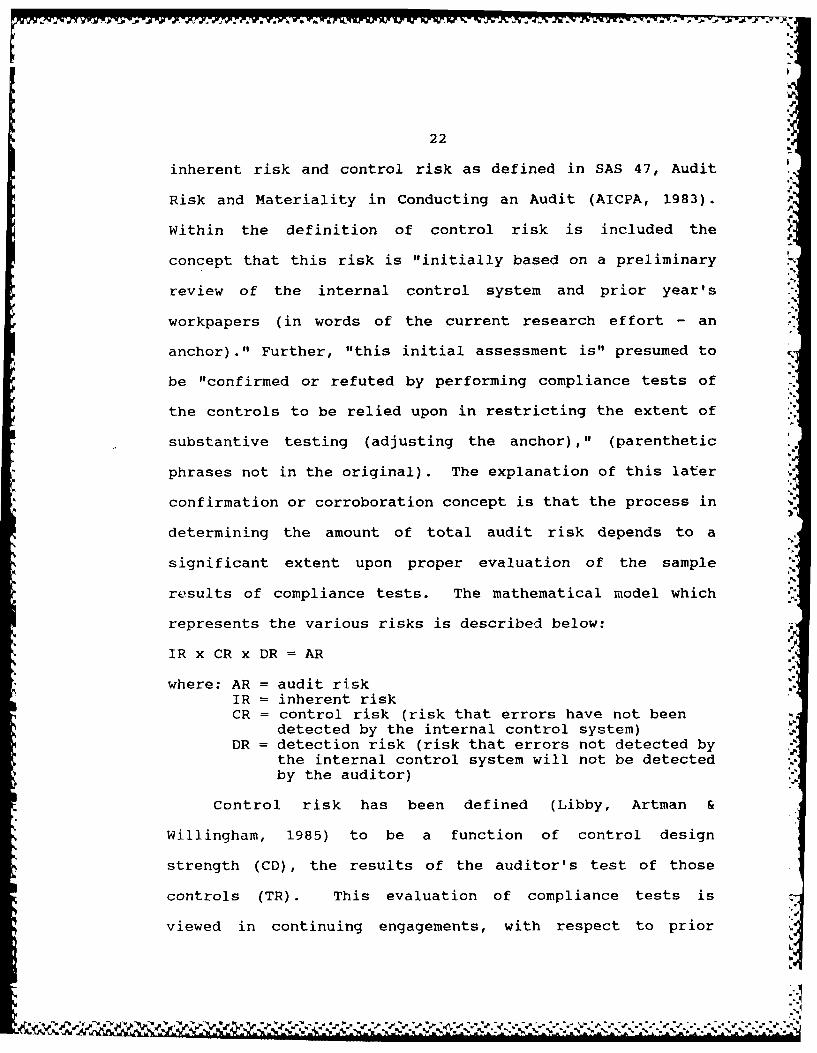
results of compliance tests. The mathematical model which
represents the various risks is described below:
IR x CR x DR = AR
where: AR = audit riskIR = inherent riskCR = control risk (risk that errors have not been
detected by the internal control system)DR = detection risk (risk that errors not detected by
the internal control system will not be detectedby the auditor)
Control risk has been defined (Libby, Artman &
Willingham, 1985) to be a function of control design
strength (CD), the results of the auditor's test of those
controls (TR). This evaluation of compliance tests is
viewed in continuing engagements, with respect to prior
IS.
I "b
23
year's test results and the evaluation of those test
results. The auditor's judgment of the audit test strength
should be affected by the availability of the prior year's
data in the form of sample test results and the evaluation
of the test result by the previous auditor-in-charge. The
model proposed must then be modified to include the
consideration of prior information as described below:
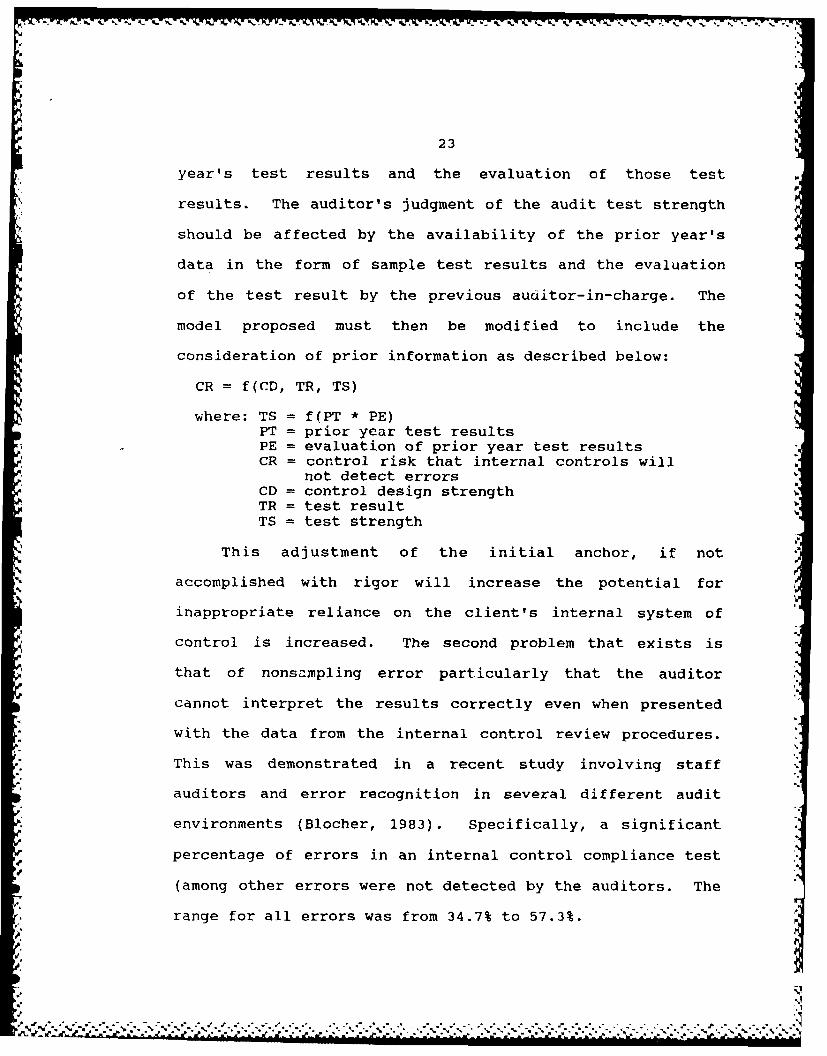
CR = f(CD, TR, TS)
where: TS = f(PT * PE)PT = prior year test resultsPE = evaluation of prior year test resultsCR = control risk that internal controls will
not detect errorsCD = control design strengthTR = test resultTS = test strength
This adjustment of the initial anchor, if not
accomplished with rigor will increase the potential for
inappropriate reliance on the client's internal system of
control is increased. The second problem that exists is
that of nonsampling error particularly that the auditor
cannot interpret the results correctly even when presented
with the data from the internal control review procedures.
This was demonstrated in a recent study involving staff
auditors and error recognition in several different audit
environments (Blocher, 1983). Specifically, a significant
percentage of errors in an internal control compliance test
(among other errors were not detected by the auditors. The
range for all errors was from 34.7% to 57.3%.
24 4.
Psychological Research
The research in psychology regarding the investigation
of a specific audit judgment and the impact of the anchor
and adjustment heuristic is addressed in this section.
Studies in Decision Making under Uncertainty Accounting
interest in the area of heuristics and biases developed out
of the research of two psychologists, Tversky & Kahneman in
the early 1970's. Their research into the process of
judgment under uncertainty lead to the identification and
elaboration of three heuristics, which decision makers use
to assess probabilities and predict values. This particular
* type of decision making was so readily identified as the
audit opinion formulation process that accounting
researchers could easily extend the experimental task to one
in an accounting framework. The application of the laws of
probability to the human decision process tended to reduce
this process to an abstract mathematical science. When the
theories were first applied to the human decision
environment, the results were not consistent with those
previously developed laws of probability. Tversky &
Kahneman and others documented through their research that
individuals operated under a different decision making
environment than that hypothesized. The precision of the
laws of probability was being modified by the internal rules
0.i I 4; li
25
of thumb that the decision makers used. The method of
modification was dependent upon the particular heuristic
used in given circumstances. Tversky & Kahneman noted the
existence of three heuristics (representativeness,
availability, and, anchor and adjustment) that appeared to
have a significant impact on the decisions being made. I.
Representativeness Heuristic The representativeness
heuristic relates an object to a group by way of
resemblance. If object A looks as though it was produced by
process B, then the more likely it is that object A actually
came from process B. One of the example used to illustrate
this heuristic is the comparison of offspring. The
participants are given pictures of two individuals one short
and one tall, the likelihood of being born tall, and data on
the parents of one of the two which indicates that the
father is also tall. The participants are then asked to.4.
judge which individual was fathered by the tall man. The
result should be based on the likelihood ratio. With the
operation of the representativeness heuristic, participant
tend to select the tall individual. This simplistic rule
which permits the human mind to easily relate objects to a
class without examining all the causal details often entails
systematic errors or bias (Libby, 1981).
Availability Heuristic This heuristic depends upon the
ability of the participant to recall similar events. This
ease of recall then affects the participant's probability
4.|
26 'p
estimate of current events. An experiment was conducted
using common causes of death in series of two and having the
participants pick which is the cause of more death in the
particular pair. Invariably, the participants picked the
least probable cause since those were the ones which
received the most coverage in the news. One of the pairs
made the participants choose between botulism and lightning.
Even though lightning kills many more people than does
botulism, the fact that botulism receives much more media
attention lead the participant to always choose it over
lightning. Although these two heuristics have some
implications for audit, they should not be a source of
systematic bias during the normal course of the audit
because the application of all the standards of field work %
are employed to prevent such biases.
Anchor and Adjustment Heuristic In the audit environment,
the rules for proceeding (i.e. Standards) do not permit the
auditor to draw conclusions without having the weight of
evidential material support the decision. It then appears -
that evaluation is the critical decision point in the audit
process. Certainly, as described above, accounting -..
researchers isolated that particular decision for
examination. However, even that procedure may cause
inferences to be made which may or may not introduce 0'I
systematic bias into the audit decision process. It is
important to recognize the anchoring and adjustment
is
27
heuristic as potentially the most relevant heuristic given
an audit environment. Because auditing tends to be a
repetitive process (i.e. the same organization continues to
employ the same audit firm year to year), the tendency may
exist to anchor on past measurements and adjust that initial
anchor when presented with additional information. This
process may not be recognized as being part of their
decision procedures by decision makers (Wright 1980).
Wright's research reiterated Tversky & Kahneman by stating
that individuals will use anchors for judgments when the
prior information is in the same metric (stated in the same
terms, $ or percentages). The study also states that
"(w)hen an obvious anchor cue is not available, people do
not seem to use the anchor and adjustment heuristic, and
judgments are not biased..." (Wright 1980). However other
psychological research into the impact of heuristics on the
decision process has supported the hypothesis that, under
restrictive conditions, heuristics can operate in a
satisfactory manner, reducing both the cognitive effort and
time between decision recognition and resolution (Hogarth,
1981). Hogarth's research revealed that prior heuristic
research was conducted on isolated, discrete events rather
than the continuous decision process in which incremental
information/feedback refined the decision outcome. This
portion of heuristic research had not been addressed
previously in an accounting context and does pose .,
%-%
AM.-
28 K
significant problems which the current research examines.
In describing the process of judgment and choice, it is
necessary to view this process as a complex statistical
formulation that goes beyond the cognitive capabilities of
the individual. Out of this apparent chaos, the individual
must elicit a structure and content upon which to base a
judgment or make a choice. Heuristics aid in this reduction
of the complex environment by inducing structure (Einhorn
and Hogarth, 1981). The Statements on Auditing Standardsemphasize the evaluation of sample data since auditing is
performed primarily on a sampling basis. This is true
whether samples are selected on a judgmental basis or
selected and evaluated through the use of statistical
theory. Within this sample evaluation process,
psychological research has explored the process whereby the
individual weighs cues or bits of information in a
multifaceted decision environment.
Lens Model of Decision Making When reviewing the decision
process, early researchers noted that decision makers viewed
the criterion event through various cues or imperfect
predictors of the event in a probabilistic manner.
Different weights were assigned to the various cues and the
cues were combined in a variety of fashions. One of the
first to reduce this process to a model (Brunswik, 1952)
called it a lens model comparing the cues to the lens of the
eye which takes light and bends and focuses the light so
K1 ' "i -K I~ % i -t ~ ... . .. -K.. ..
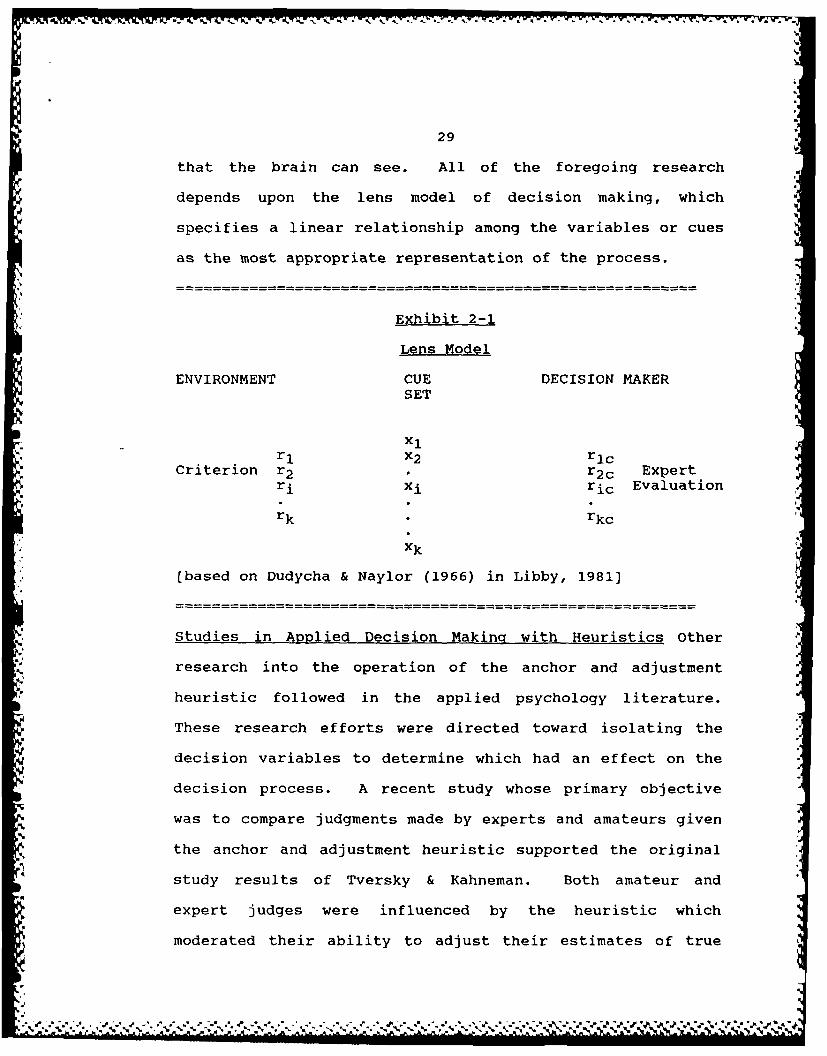
29
that the brain can see. All of the foregoing research
depends upon the lens model of decision making, which
specifies a linear relationship among the variables or cues
as the most appropriate representation of the process.
Exhibit 2-1
Lens Model
ENVIRONMENT CUE DECISION MAKERSET
XlrI X2 rlc
Criterion r2 . r2 c Expertri xi ric Evaluation
rk rkc
xk
(based on Dudycha & Naylor (1966) in Libby, 19813
Studies in Applied Decision Making with Heuristics Otherresearch into the operation of the anchor and adjustment
heuristic followed in the applied psychology literature.
These research efforts were directed toward isolating the
decision variables to determine which had an effect on the
decision process. A recent study whose primary objective
was to compare judgments made by experts and amateurs given
the anchor and adjustment heuristic supported the original
study results of Tversky & Kahneman. Both amateur and
expert judges were influenced by the heuristic which
moderated their ability to adjust their estimates of true
, , JI~~~~~~~~~~ 1 7. INV I-,. lr r:, ... ,. .. ,.. . ,
30
real estate prices from the anchor given in the experimental
instrument. Although in the study results, experts were
influenced almost as much as the amateur by the anchor, the
experts explicitly denied use of the anchor information in
the formulation of their "independent estimate" of the price7/
of real estate. This denial is associated with the experts'
inherent interest to maintain their expertise (Northcraft &
Neale, 1987).
h.
'A,
" a'., ._ [.' % . . .' " " " . . . _ .. " . " - ' " - " - ", - " - " - ', - " ./ . " " - " . . • . • . . .- .
Chapter III
I
Research Methods
Previous research reviewed in Chapter II forms the
basis and rationale for continuing the research effort in
the area of heuristics and their involvement in the
accounting and auditing process. The research questions
addressed by this study have been introduced in the three
formal hypotheses developed in Chapter I. A more detailed
discussion of the experimental hypotheses, research
questions, and research methods follow in the subsequent
sections of this chapter.
Research Questions and Hypotheses
The current research was designed to test the effect
of the anchor and adjustment heuristic on compliance audit
test evaluations. Specifically, one of the three :%
questions raised addressed the issue of whether
probabilistic judgments might be affected by providing the
participants additional audit information concerning
compliance sample evaluations from the previous year's
audit files? The following research hypothesis was
developed to address this question:
Hl: The addition of prior information to an auditcompliance evaluation will affect the subjectiveprobability relating to the total population.
31S
31 :
S-1
32
This research question was investigated through an
analysis of a laboratory experiment which elicited
subjective probabilities concerning compliance test sample
results. The experiment simulated the normal audit
setting by describing a situation which is commonplace in
the audit environment. Evaluation of compliance testing
is an essential audit step performed to justify reliance
placed on selected internal controls. These evaluations
are normally accomplished by the auditor-in-charge at the
client's place of business based on audit evidence
gathered by junior auditors. In most continuing
engagements, the auditor-in-charge will have the prior
year's workpapers available as a reference for the current
audit team. The addition of information to a risky
decision should, it is hypothesized, improve the auditor's
ability to judge. Since the auditors-in-charge have to
make inferences concerning the internal control process
from a sample of "key" (another judgment) control
applications, they are concerned with the structure of the
general decision task. The research reported in this
dissertation addresses prior information as a part of the
auditors' decision set. The addition of the prior
information cue provides an additional data point for the
auditor-in-charge to use as an anchor thus in- luding
choice in the anchor and adjustment process.
Additionally, this research also examined whether the
U% %
5 33
state of the prior audit information had a bearing on
current audit evaluations. That is whether theU%
acceptability of the prior year's sample evaluation would
further modify the subjective probability generated by the
evaluation of compliance test sample results. If the
* prior audit work indicated that a similar sample was
acceptable or not, what effect did that have on the
current auditor's assessment of the the current audit
work? This research question is the basis for the second
research hypothesis:
H2 : The acceptability of the prior year's sampleresults will affect the auditor's evalauation ofcurrent year's compliance sample results.
Similar questions were studied in other research
efforts which resulted in determinations that directional
2* change in internal ccntrol strength have an impact on the
current audit planning effort for substantive testing
(Joyce and Biddle, 1981). The current research was
interested in testing whether the acceptability of prior
data would have an effect on the elicitation of subjective
, probabilities rather than the effect on subsequent
substantive testing.
An associated question arises when the sample error
rates approximate the previous year's error rate. DoesIp
the similarity of those error rates affect auditor
judgment? This becomes the basis for the third and final
hypothesis:
34
113 : Sample error rates will have an effect on the riskevaluation of compliance testing.
To delve into this question, auditors' responses were
neasured over two different sample error rates (0% and
4%), one close to last year's results (4.2%) and one quite
distant. The extreme difference between the two values
should be sufficient to ensure that the subjective
probabilities elicited are statistically significant.
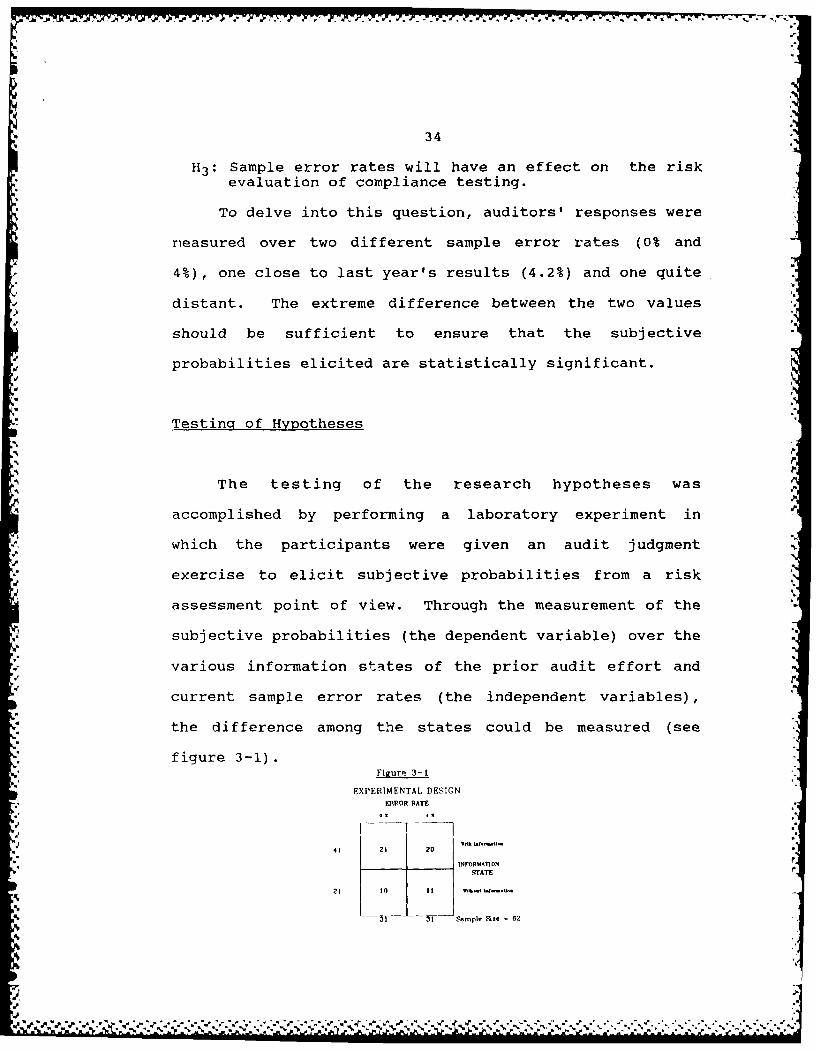
Testing of Hypotheses
The testing of the research hypotheses was
accomplished by performing a laboratory experiment in "
which the participants were given an audit judgment
exercise to elicit subjective probabilities from a risk
assessment point of view. Through the measurement of the
subjective probabilities (the dependent variable) over the
various information states of the prior audit effort and
current sample error rates (the independent variables),
the difference among the states could be measured (see
figure 3-1).Figur' 3-t
EXPERIMENTAl, DESIGN
EIKPOR RATE
41 21 20
INFORMATION
STATE
21 10 11
I I Sample 2e 62
4..
4. . ......... 'J ? i ..- i iq-~. .. .. . ... . . ...... . . . . |40* ~ ~ 0*
a
35
To insure that the confounding effects of the
participants individual differences are properly accounted
for the experimental design included random assignment of
the experimental material to the participants. Each
participant was presented with the case material which
included both the main experimental question and two other
audit probability questions (see appendices 1 and 3) used
to mask the main question. The order of presentation of
the questions to the participants was varied through a
random ordering of the material in the individual audit
judgment exercise packets. The packets themselves were
also arranged in random order.
*Participants
Sixty-two professional auditors served as
participants in the audit judgment experiment. These
participants were either members of a public accounting
firm or a governmental agency. The public accounting
participants were drawn from five local offices of four
different public accounting firms. One of the local
offices was a regional firm, the three others represented lu
"Big Eight" firms. Two of the local offices represented
one of the "Big Eight" firms.
The public accounting participants were drawn from
audit staff members who were attending continuing
-.... ... . ...
36
education programs at their offices. These individuals
were chosen based on availability and were not randomly
selected. Geographically, all of the participants were
working in the same region of the midwestern United
States.
The governmental auditors were stationed in the
midwest but had audit responsibility world wide for the
Department of the Air Force. Only those individuals who
Lad sufficient experience auditing (two years or more)
took part in this experiment.
The experiment was presented to all participants as
an audit judgment exercise which involved the evaluation
of sample data resulting from a compliance test. This is
the type of work normally associated with senior/semi-
senior auditors and represents one of the first tasks to
be accomplished during the course of an audit.
Members of the public accounting firms viewed a
videotape of the experimenter which introduced the
exercise to the participant. The participants from the
government agency were selected by their supervisors and
were asked to complete the audit judgment exercise.
Questions concerning the exercise were not permitted under
e%
...................... ation.~ .. I,
'I
37
I
Experimental Materials
The audit judgment exercise was designed to represent'
a situation that can occur in the normal course of an
audit, that is, the unavailability of the regularly
scheduled auditor-in-charge. As the replacement auditor-
in-charge, an individual can expect to make decisions
regarding the entire audit. The earlier the replacement
occurs, the more fundamental the decisions become. In the
experimental situation the participant was required to
analyze sample data in order to complete part of the
internal control evaluation process. This decision
(whether or not the sample data indicate that the
tolerable error will be exceeded in the population) is a
very important first step in determining the reliance that
will be placed on the client's internal control systems.
The participants were asked to evaluate sample data (the
results of a compliance test) through the risk assessment
method by providing their estimate of the probability
(between 0% and 100%) that the population error rate would
exceed 8%. The experiment was varied in the amount of
information available to the participants. Two
information states were used: (1) the first group had no
information other than the sample data on which to base
their evaluation, the classical statistical situation; (2)
9-
.%
38 a..
members of the second group were told that during the I
previous audit of this client, the prior auditor-in-charge
used sample data which showed a 4.2% error rate. Within
this second grouping there were two subsets: one subset
had previous information in which the previous auditor-in-
charge estimated that the population error rate would not .
exceed 8%; and the other subset had previous information
in which the auditor-in-charge determined that the
population error rate would exceed 8%.
All of the information states, including the two
information subsets mentioned above, were manipulated over
two sample error rates (0% and 4%), one close to the
previous year's result (4.2%) and one rather distant.
",.
hasking of the Main Experimental Question
To further increase the reliability of the data -
collected, the experimental instrument included two other
questions regarding audit judgments. These questions also
required the participants to make additional audit
evaluations. These two questions were included to ensure
the participants would not attempt to thwart the purposes
of the experiment. The first of the two questions related
to the collectability of an electronics retailer's account
receivables. The participants had to provide their
estimate of the probability of collection for the problem
e
I
I I I I
39
described in appendix 1. The second masking question
related to the appropriate sample size that should be
taken when internal controls are improved from the
previous audit and the firm's audit manual recommended
sample size that is larger than the previous year's
sample. The participants were to respond with one of
three answers: (1) use the sample size employed in the
previous year; (2) use the sample size recommended by the
firm's audit manual; or (3) determine a sample rate
tailored to the current year decision circumstances. The
results of these questions and the main experimental
question are further discussed in Chapter IV.
Administration of the Experiment
The experiment was conducted at the offices of all
the participants. Each participant was provided with a
copy of the experimental materials and a demographic
questionnaire. The procedure for administration of the
experiment varied due to differences in the place of
employment between those in pulic accounting and those in
a government agency.
Administering the Experiment to Private Sector Auditors
For each of the participating public accounting firms, the
researcher attended a continuing professional education
seminar being conducted by the firm for its employees.
'S.5
i &.¢ -', : -;-,' -5.
40
During the conduct of the continuing professional
education seminar, the researcher addressed the
participants and explained the reason he was in
attendance. The researcher then proceeded to show a
videotape presentation to the participants (a copy of the
transcript of that videotape is contained at enclosure 1).
The videotape presented the researcher in an office
setting that could not be identified as a public
accounting office or government installation. The tapedmessage clearly stated that the researcher had obtained
permission from the participants' firm and solicited the
participants or viewers help in determining how auditors
make judgments in practice. Subsequent to viewing the i
videotape presentation the researcher distributed the
experimental material in a normal fashion (sequence);
however, the order of presentation had been previously
randomized. The participants were then asked to complete
the experimental materials and upon completion return them
to the researcher who was still in attendance. Generally
five to fifteen participants were available at each of
these seminars depending upon the firms.
Administering the Experiment to Governmental Auditors
The researcher distributed the experimental materials to
the government participants in their offices along with
instructions on how to complete the experimental
instrument. The individuals were asked to participate,..
9.
41
after the permission of the head of the division was
obtained. Each participant was contacted individually to
provide instructions on the completion of the experimental
materials. The governmental auditors were instructed to
ask no questions but merely to complete the instrument.
Each participant was then left with a packet and told that
they were expected to complete the packet by the next
working day. The completed experimental materials and the
demographic questionnaire were collected on the following /
day..,'
Questionnaire
Included in the experimental packet given to all
public accounting and government participants was a
questionnaire designed to collect demographic data about
the participants. Completion of the questionnaire was to
be accomplished by each participant subsequent to
finishing the experimental material. The purpose of the
demographics was to gain information concerning the ,
backgrounds of each participant; their educational
exposure to the area of statistical analysis, their
employment history especially with their current employer;
their exposure to both the judgmental evaluation of sample
results and the use of statistical analysis; and other
important individual data. These data were utilized to
"%'%.'.," ', '.' " i' ' "' i'.' - . -' . .€.'" '' %%" %'%'' % ' _ %q ~q% q'.%'.L'. "-
42
add explanatory information to the results of the main
experimental question addressed by the participants. A
copy of the questionnaire can be found in Appendix 2 while
the responses to the questionnaire are in Appendix 3..4
I..
V .0'
I
Chapter IV
Data Analysis
Hypotheses TestinQ
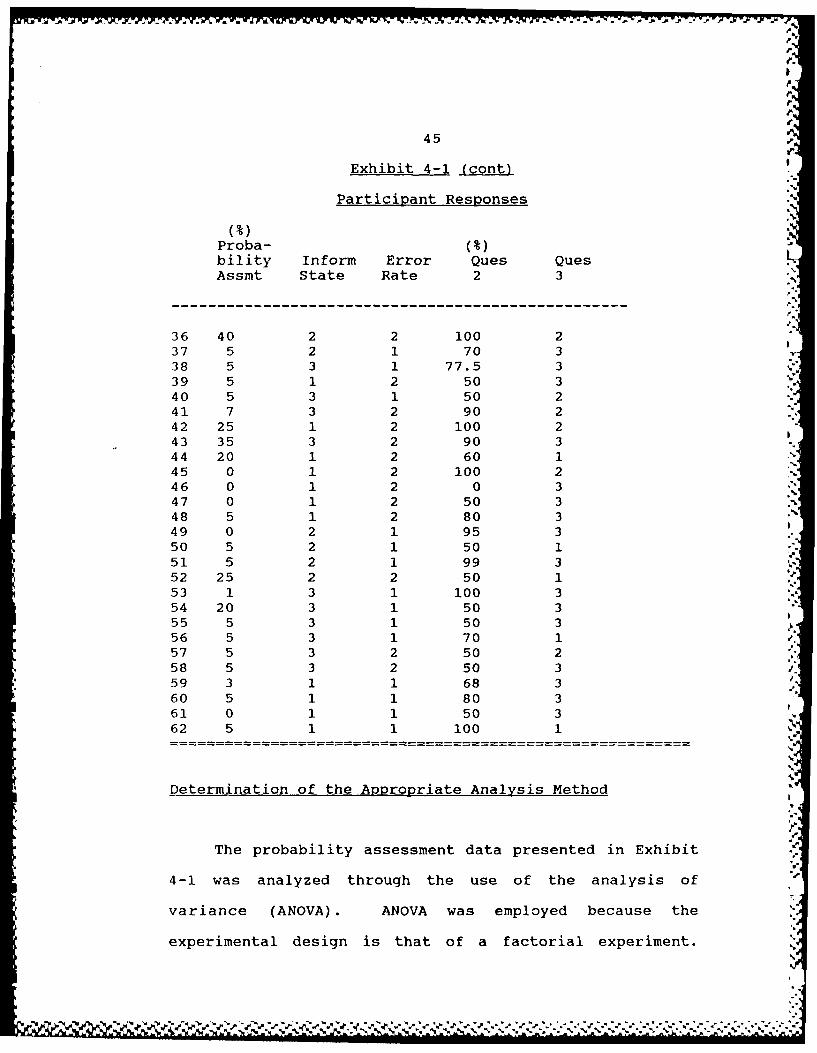
Compilation of Participants' Responses
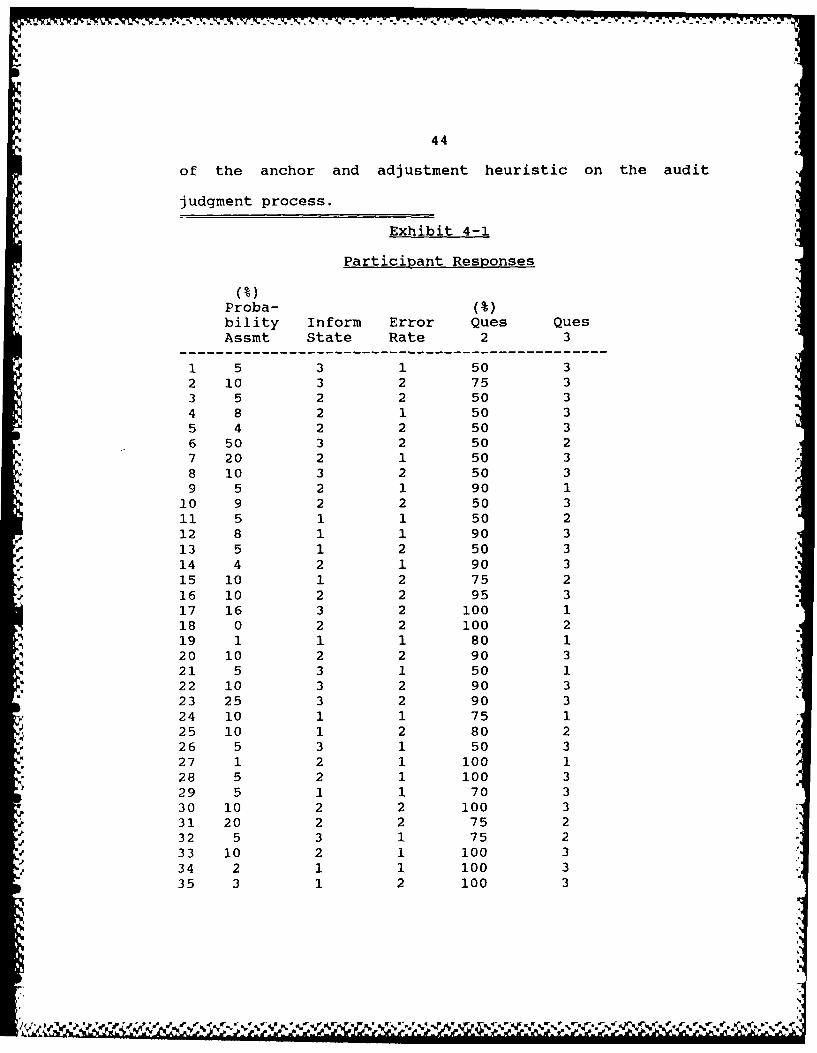
The individual responses to the experimental question
and the two masking questions are presented in Exhibit 4-
1 The sixty-two participants provided an answer to each
of the three questions in the research instrument. The
responses to the main experimental question and the first
of the masking questions are subjective estimates of
probabilities. The first response is a probability
estimate using the risk assessment methodology concerning U "
the participant's confidence in the compliance sample
results presented by a junior auditor. The second
question addresses the ability to collect an account
receivable. The remaining question relates to the use of
the previous year's sample size when internal control
improvements have been adopted. For each participant, the
data also included the manipulated independent variables
(information state and error rate) that were in the
experimental packet for each participant. The
quantitative results of the main experimental question
were used in the analysis to determine the impact, if any
43 '
.... - .. . . .. ...
44
of the anchor and adjustment heuristic on the audit
judgment process.
Exhibit 4-1
Participant Responses
Proba- (%)bility Inform Error Ques QuesAssmt State Rate 2 3
1 5 3 1 50 32 10 3 2 75 33 5 2 2 50 34 8 2 1 50 35 4 2 2 50 36 50 3 2 50 27 20 2 1 50 38 10 3 2 50 39 5 2 1 90 1
10 9 2 2 50 311 5 1 1 50 212 8 1 1 90 313 5 1 2 50 314 4 2 1 90 3
15 10 1 2 75 216 10 2 2 95 317 16 3 2 100 118 0 2 2 100 219 1 1 1 80 120 10 2 2 90 321 5 3 1 50 122 10 3 2 90 323 25 3 2 90 324 10 1 1 75 125 10 1 2 80 226 5 3 1 50 327 1 2 1 100 128 5 2 1 100 329 5 1 1 70 330 10 2 2 100 331 20 2 2 75 2
J 32 5 3 1 75 2.? 33 10 2 1 100 3- 34 2 1 1 100 3
35 3 1 2 100 3
I" L[z l
Ni -J - - - - - - -- S - -. V
.
45 a
Exhibit 4-1 (cont)
Participant Responses
Proba- (%)bility Inform Error Ques QuesAssmt State Rate 2 3 -
p -
36 40 2 2 100 237 5 2 1 70 338 5 3 1 77.5 339 5 1 2 50 3 .
40 5 3 1 50 241 7 3 2 90 242 25 1 2 100 243 35 3 2 90 344 20 1 2 60 145 0 1 2 100 246 0 1 2 0 347 0 1 2 50 348 5 1 2 80 349 0 2 1 95 350 5 2 1 50 151 5 2 1 99 352 25 2 2 50 153 1 3 1 100 354 20 3 1 50 355 5 3 1 50 356 5 3 1 70 1 1
57 5 3 2 50 258 5 3 2 50 359 3 1 1 68 3 a
60 5 1 1 80 361 0 1 1 50 362 5 1 1 100 1
Determination of the Appropriate Analysis Method
The probability assessment data presented in Exhibit
4-1 was analyzed through the use of the analysis of
variance (ANOVA). ANOVA was employed because the
experimental design is that of a factorial experiment.| * %.
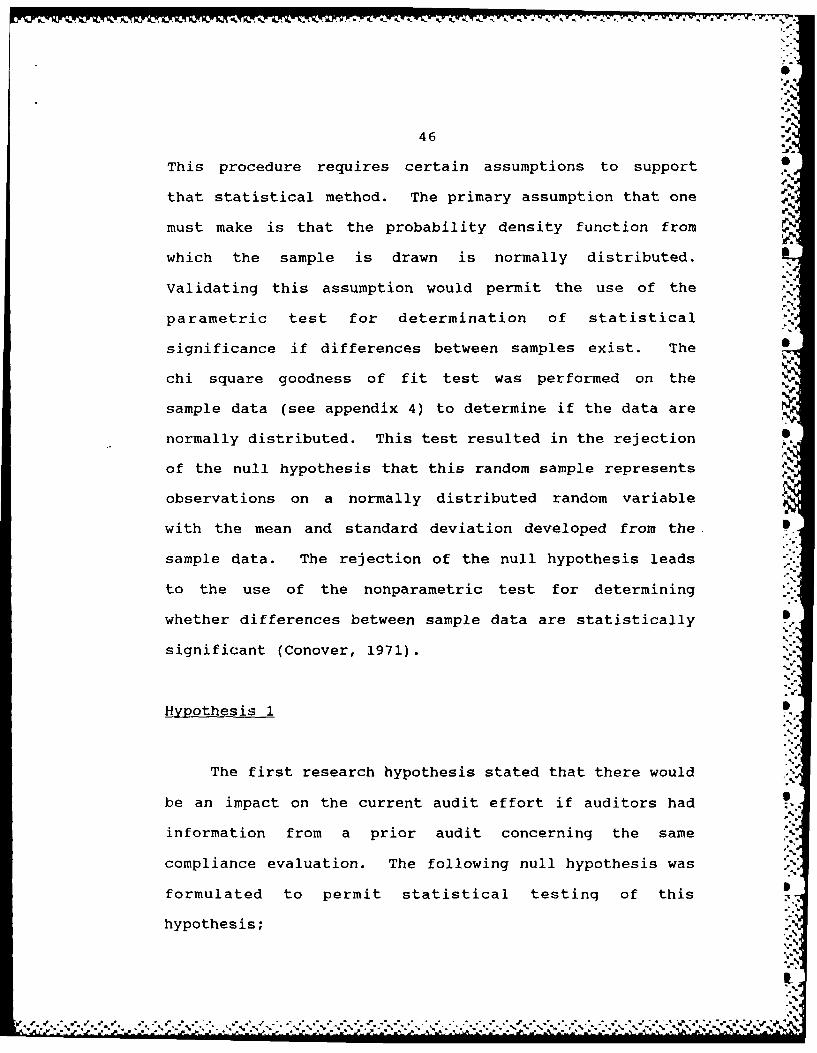
46
This procedure requires certain assumptions to support 6
that statistical method. The primary assumption that one
must make is that the probability density function from
which the sample is drawn is normally distributed.
Validating this assumption would permit the use of the
parametric test for determination of statistical
significance if differences between samples exist. The
chi square goodness of fit test was performed on the I
sample data (see appendix 4) to determine if the data are
normally distributed. This test resulted in the rejection
of the null hypothesis that this random sample represents
observations on a normally distributed random variable
with the mean and standard deviation developed from the
sample data. The rejection of the null hypothesis leads
to the use of the nonparametric test for determining
whether differences between sample data are statistically S
significant (Conover, 1971).
Hypothesis 1 !
The first research hypothesis stated that there would
be an impact on the current audit effort if auditors had
information from a prior audit concerning the same
compliance evaluation. The following null hypothesis was
formulated to permit statistical testinq of this
hypothesis;
47
H0 : there will be no difference between the means of thesubjective probability estimates derived from twogroups of experimental participants; one group havinginformation from a prior audit concerning a similarevaluation and the other group having no priorinformation.
This statement of the null hypothesis was tested by
partitioning the participants into two groups and
comparing the estimates of probability elicited using the
risk assessment methodology. In the previous paragraphs,
the need to abandon the parametric tests was demonstrated
through the lack of normally distributed data. In this
case it was necessary to select the most appropriate
nonparametric test available. A review of research
statistics (Conover, 1971) indicated that the Freidman .
ranks test was the most appropriate. The data that is
included in this experiment are related, that is, there
exists a relationship among the cells which goes beyond
that of matched pairs or just two related samples. Since
this data include several related samples, it is
inappropriate to attempt to use the matched pairs ranks 'a
test to analyze the data. Instead, a test is required
which does not depend upon "the assumption of symmetry
needed for the matched pairs Wilcoxon signed ranks
test.. ." (Conover,1971). The results of the appropriate
nonparametric Friedman Fr analysis of variance isi
presented in Exhibit 4-2.
" - %- , ,-,- , ' ',,, - " %- ,. _ . - .. . ... - .. .. ,. . . ... - • . ... .. .. .. .. ,
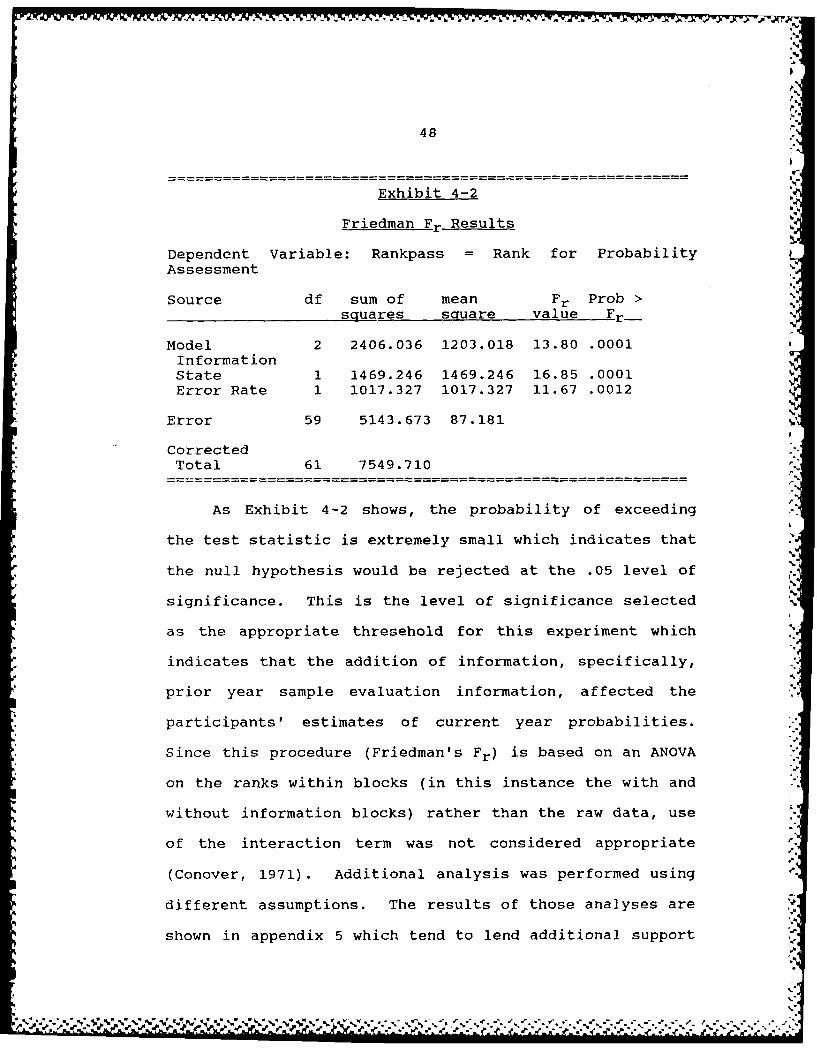
48
Exhibit 4-2
Friedman Fr Results
Dependent Variable: Rankpass = Rank for ProbabilityAssessment
Source df sum of mean Fr Prob >squares square value Fr-
Model 2 2406.036 1203.018 13.80 .0001InformationState 1 1469.246 1469.246 16.85 .0001Error Rate 1 1017.327 1017.327 11.67 .0012
Error 59 5143.673 87.181
CorrectedTotal 61 7549.710
As Exhibit 4-2 shows, the probability of exceeding
the test statistic is extremely small which indicates that
the null hypothesis would be rejected at the .05 level ofsignificance. This is the level of significance selected
as the appropriate thresehold for this experiment which
indicates that the addition of information, specifically,
prior year sample evaluation information, affected the
participants' estimates of current year probabilities.
Since this procedure (Friedman's Fr) is based on an ANOVA
on the ranks within blocks (in this instance the with and
without information blocks) rather than the raw data, use
of the interaction term was not considered appropriate
(Conover, 1971). Additional analysis was performed using
different assumptions. The results of those analyses are
shown in appendix 5 which tend to lend additional support'.5
i-
., ' .. '<.~s' "" . v ' "-sv..> - . ,, ..-. ..'.....' ='....,'...-' . ',.<'< ,.'.-.
49
to the results presented here.
Hypothesis 2
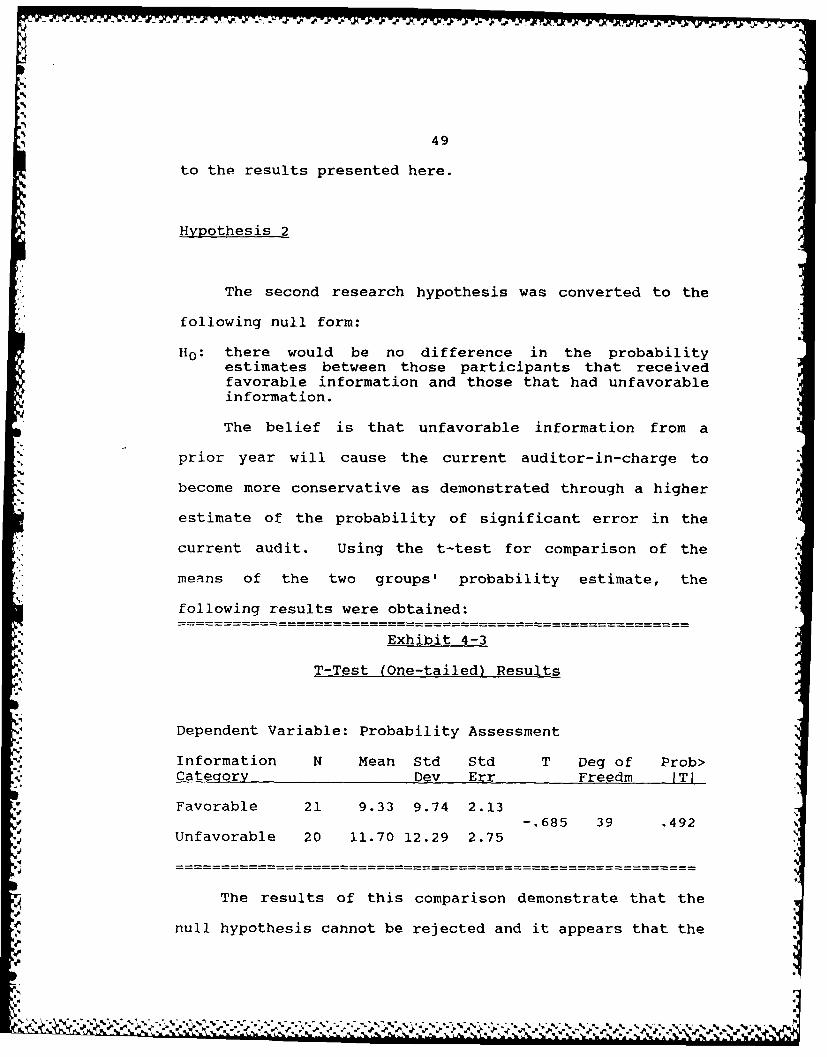
The second research hypothesis was converted to the
following null form:
H0 : there would be no difference in the probabilityestimates between those participants that receivedfavorable information and those that had unfavorableinformation.
The belief is that unfavorable information from a
prior year will cause the current auditor-in-charge to
become more conservative as demonstrated through a higher
estimate of the probability of significant error in the
current audit. Using the t-test for comparison of the
means of the two groups' probability estimate, the
following results were obtained:
Exhibit 4-3 r
T-Test (One-tailed) Results
Dependent Variable: Probability Assessment
Information N Mean Std Std T Deg of Prob>Cateaory Dev Err Freedm IT1
Favorable 21 9.33 9.74 2.13-.685 39 .492
Unfavorable 20 11.70 12.29 2.75
The results of this comparison demonstrate that the
null hypothesis cannot be rejected and it appears that the
50%
directional content of information in the audit
environment is not significant. Other statistical -
procedures were used under different assumptions and theresults of those tests are contained in appendix 6.
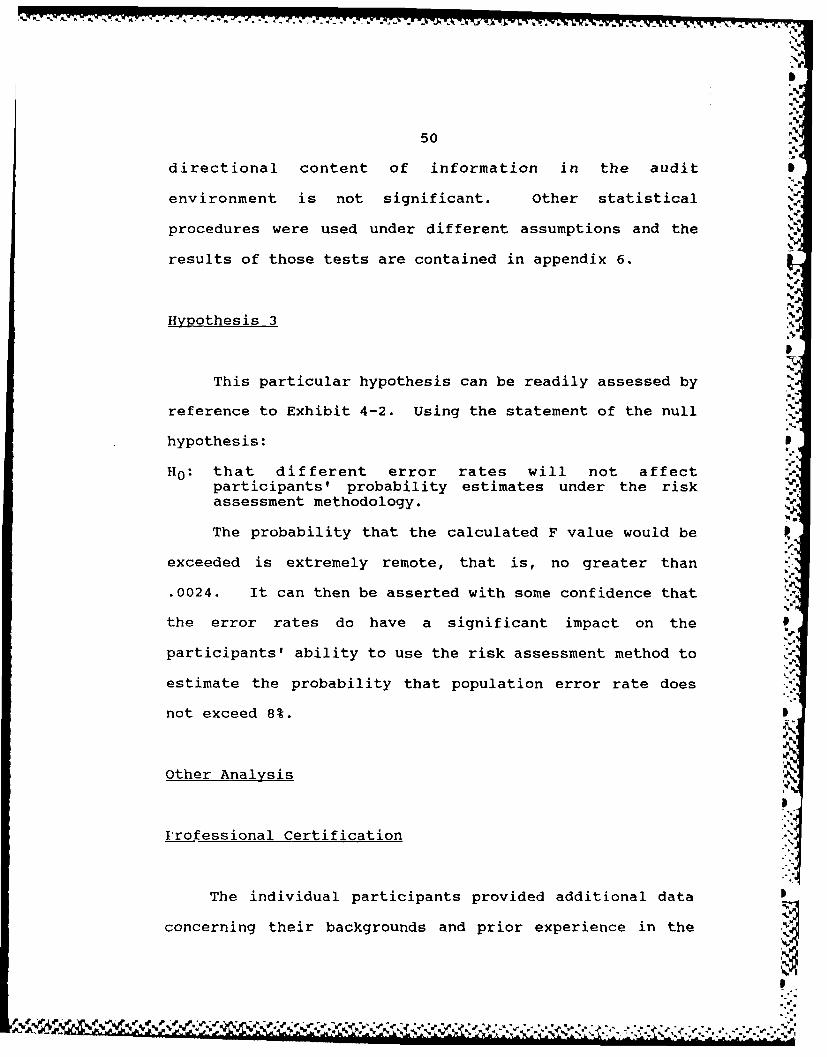
Hypothesis 3
This particular hypothesis can be readily assessed by
reference to Exhibit 4-2. Using the statement of the null ii
• .4
hypothesis:
H0: that different error rates will not affectparticipants' probability estimates under the risk I
assessment methodology.
The probability that the calculated F value would be
.4
exceeded is extremely remote, that is, no greater than :
•.0024. It can then be asserted with some confidence that "
the error rates do have a significant impact on the
parocdures' were usto use the risk assessment method to
estimate the testothat population error rate does
not exceed 8%.
Other Analysis
Professional Certification .<
The individual participants provided additional data
concerning their backgrounds and prior experience in the
U.
patiians proality. estimtes.unde the isks:""[ '
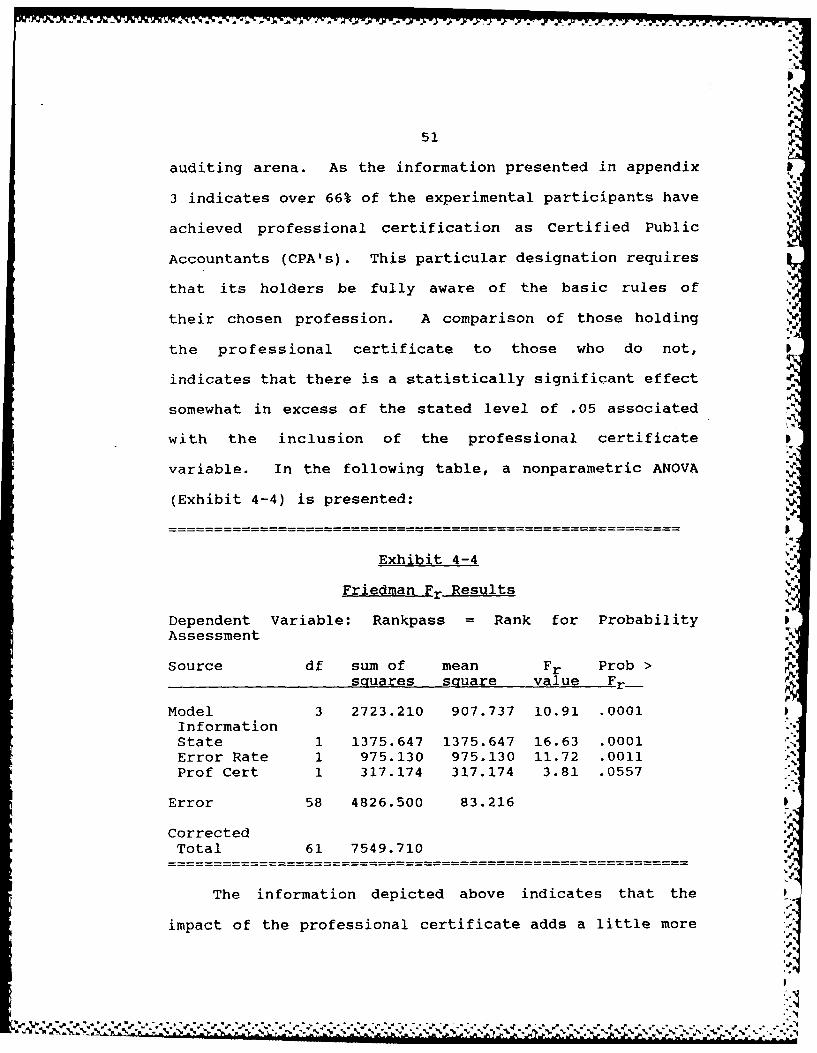
-V.
51
auditing arena. As the information presented in appendixV.
3 indicates over 66% of the experimental participants have %
achieved professional certification as Certified Public
Accountants (CPA's). This particular designation requires
that its holders be fully aware of the basic rules of
their chosen profession. A comparison of those holding
the professional certificate to those who do not,
indicates that there is a statistically significant effect
somewhat in excess of the stated level of .05 associated
with the inclusion of the professional certificate
variable. In the following table, a nonparametric ANOVA
(Exhibit 4-4) is presented:
Exhibit 4-4 V
Friedman Fr Results
Dependent Variable: Rankpass Rank for ProbabilityAssessment
Source df sum of mean Fr Prob >squares square value Fr _
Model 3 2723.210 907.737 10.91 .0001 .InformationState 1 1375.647 1375.647 16.63 .0001Error Rate 1 975.130 975.130 11.72 .0011Prof Cert 1 317.174 317.174 3.81 .0557
Error 58 4826.500 83.216
CorrectedTotal 61 7549.710
The information depicted above indicates that the
impact of the professional certificate adds a little more
52
explanatory power than the original experimental variable,
information state. Even in this analysis, the information
state maintains its priority as the variable with the most
explanatory power.
Continuing Professional Education
This variable was included in the analysis as part of
the stepwise regression performed on the transformed
dependent variable. The dependent variable, probability
assessment, to perform the nonparametric test was ranked
and subsequently analyzed in the stepwise regression
procedure. The level set for entry of a variable was .20,
the same level set for keeping the variable in the
regression equation. The resulting regression table is
presented on the following page:
"p
m. •
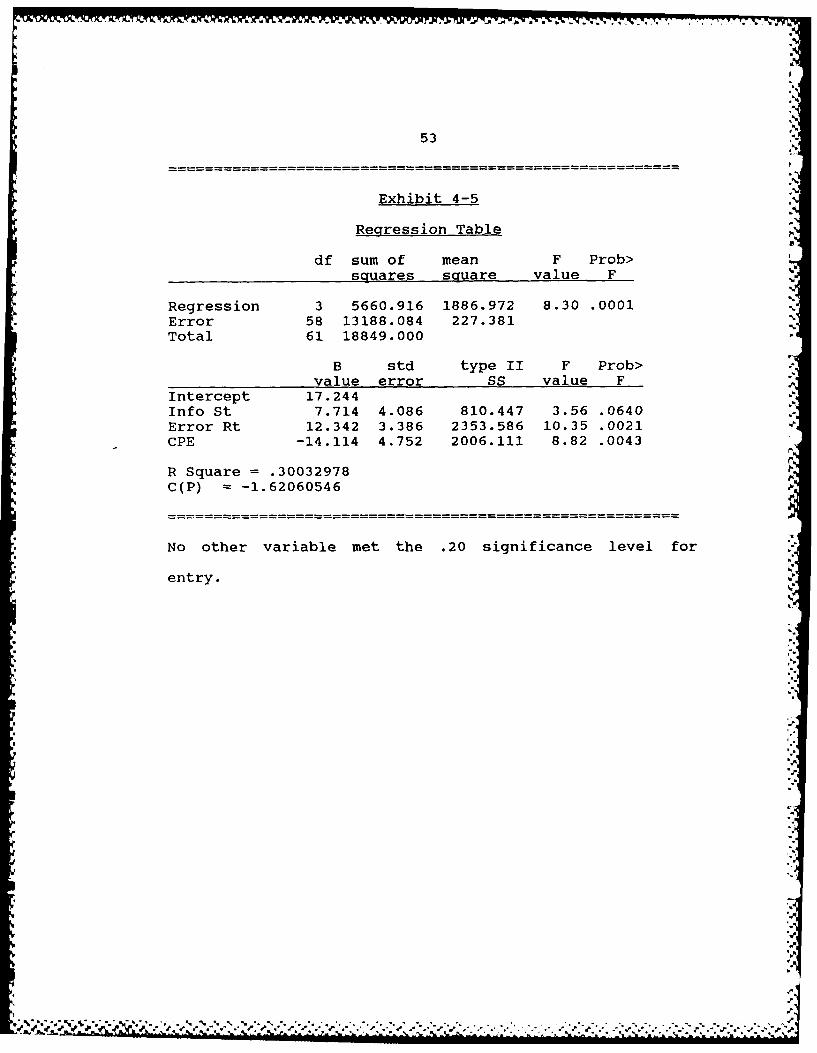
p 53
[ .'
Exhibit 4-5
Regression Table
df sum of mean F Prob>squiares square value F
Regression 3 5660.916 1886.972 8.30 .0001.Error 58 13188.084 227.381 .
Total 61 18849.000
B std type II F Prob>value error SS value F."
Intercept 17.244Info St 7.714 4.086 810.447 3.56 .0640Error Rt 12.342 3.386 2353.586 10.35 .0021CPE -14.114 4.752 2006.111 8.82 .0043
R Square = .30032978C(P) -1.62060546
"p
No other variable met the .20 significance level for
entry.
.,
.5
*"-
Chapter V
Conclusions
Summary
Our focus in this research has been to determine the
effect that current audit practice has on the ability of
auditors to form proper judgments concerning sample data.
The research questions were directed to the measurement of
the impact of prior information on the "risk assessment"
probability evaluation technique. This technique is
currently approved by the AICPA in the Codification of
Statements on Auditing Standards. The research also "
examined the impact of favorable information versus
unfavorable information from prior years' work and the
amount of significance placed on the curent year's sample
error rate in estimating the tolerable population error
rate. N
To examine these questions, the research took the
form of a laboratory experiment using as participants
practicing auditors from a variety of work environments.
Most of the participants were professional staff members
of public accounting firms located in the southwestern
Ohio area. Other participants were government auditors
stationed in the same geographic area but with worldwide
audit responsibility. The experimental instrument
54
n- - %.n
. .i
55 -
required all the participants to complete an audit task
assuming the role of substitute auditor-in-charge. The
task was structured to resemble a decision making problem
normally encountered on the job. The participants were
required to evaluate sample data to arrive at an estimate
of tolerable population error rate for a compliance test.
The independent variables that were controlled in this
experiment were related to the prior year's audit
information and the current error rate.
Conclusions and Implications for Practice
In general, the results indicate that the process
that most auditors employ during the course of continuing
audit engagements, will result in both effective and
efficient auditing. This means that increased audit
effort oan be indicated through the application of the
risk assessment methodology which is consistent with the
conservative approach that auditors should exhibit. In
the context of the current research efforts, the practice
established in the standards of field work for review of
prior year's work enhances the auditors' abilities to
accomplish the attestation function with minimum resource .A
expenditure.
Review of Prior Work Papers The result of testing the
first research hypothesis (that information state will
56
influence risk assessment probabilities) and the movement
to a more conservative opinion of population error when
additional information is available to the auditor-in-
charge should lead to more extensive substantive auditAA
testing when prior work papers are available for review
and the risk assessment methodology is utilized by the
decision maker, in this case the auditor-in-charge.
Rather than reducing uncertainty, the addition of
information apparently caused the experimental
participants to exhibit higher degrees of uncertainty and
simultaneously increases resource expenditures in both the
development and execution of more extensive audit testing.
This skepticism of the auditor-in-charge provides for
*viewing the probability of each piece of information in
isolation. Considering that compliance testing is
specific to the year and the management control system
procedures currently in effect, then prior year sample
results should not be taken to be additive to the current
year work. This addition of information was shown to
actually reduce the confidence that the participant was
willing to place in the system by increasing the
probability that the population error rate will exceed the
stated tolerable error rate. This phenomena will be
limited to the area of compliance testing and review since
this situation does not lend itself to easy
quantification. However, this particular result should
"LIA -JK- ]RU
57
give rise to a more concerted effort to emphasize
statistical evaluation of all appropriately gathered
samples. Use of this evaluation process, if the current
results are generalizable, would properly quantify risk
while keeping audit fees down.
Impact of Prior Audit Evaluations The second research
hypothesis (there is a significant difference between
favorable and unfavorable prior information) when tested
was found to be not statistically significant. This
finding of a weak relationship between the prior year's
sample data evaluation and the current year's evaluation
of compliance testing, supports the wisdom of the
standards of field work particularly the first and third,
promulgated by the AICPA. Auditors-in-charge need to know
what has occurred with regard to the client in the past.
However those evaluations are just that--past history and
need to be revalidated through the current audit testing
process. In this respect, the auditor-in-charge reviews
the prior workpapers to determine if the internal control
system has changed and whether the changes are an
improvement over past procedures. When this system
determination had been completed, the next logical step is
to test compliance with the current prescribed system.
With appropriate sampling techniques and evaluation, the
auditor-in-charge can establish a confidence level based
on the sample results relative to the total population
- .'.- - q . , .Z - - ,; -" : A A .. - -,
II'
58
tolerable error rate. This critical determination
structures the remaining audit effort in terms of
substantive testing of transactions. With appropriate
evaluation of these compliance sample results, limits on
audit testings are designed to consider the cost-benefit
relationships involving audit fees and the resultant risk
to third parties due to erroneous data.
Current Sample Error Rate The formulation of the basic
research hypothesis lead to developing an experimental
design which included a high and low level of sample
error. It was assumed that the relative importance of
error rates (high and low) would have a greater effect on
the elicitation of subjective probabilities that the
primary independent variable (information state).
However, in the analysis of the experiment, it was noted
that information state had more effect than the error rate
which indicates that a modification of the anchor used by
the auditor-in-charge had occurred. The direction of the
shift to a more conservative position was related not to
the type of information (that is, whether the current
sample error rate is close to or distant from the prior
year's sample error rate) but the fact that information
was available. The current year's sample error rate did
have significance (probability > F = .0012) and, as
hypothesized, influenced the auditor-in-charge to a
greater degree since the higher level was close to
a.. '~'"4
59
exceeding the population tolerable error rate. The closer
the sample error rate comes to exceeding the population
tolerable error rate, the risk assessment by the auditor-
in-charge will tend to require more rather than less
substantive audit testing. In this case, it would be in ,"
the best interest of the audit firm to increase the scope
rather than restrict it.
Heuristic Modification An outcome such as reported here
reinforces the profession's insistence on adherence to
standards especially the standards of field work. This
confirmation of appropriateness should be viewed as an
indication of the impact of the anchor and adjustment
heuristic modified by the conservative approach usually
associated with the accounting profession. Although the
heuristic changes the subjective probabilities elicited,
and there is is no apparent difficulty arising from the
use of the heuristic, the profession would be prudent to
consider a change from any subjective assessment proces to
those that are statistically objective.
.4.
Limitation to External Validity
The extension of the conclusions drawn from any
laboratory experiment beyond the bounds of the particular
experiment are at the least, risky endeavors. However, in
the professional world, one must take risks to develop
60
better markets and potential customers. The profession of
auditing needs to continue to develop and mature as part
of the business environment. To this end it needs the
expanding capabilities of empirical research to show it
the way. In doing so, the limits of science must be
iterated in order that no reader mistakes the capability
of any research effort including the present one. The
laboratory has one inherent defect; it is not reality. No
matter how realistic the attempt is to make the experiment
replicate real life, it cannot. In this research effort
the main problem with its realism lies in the fact that
there was no interaction between the junior auditor
requesting the determination and the pseudo auditor-in-
charge. This particular aspect should be a major concern
in any experimental situation, since auditors function in
the audit environment as a team not just as individuals.
An additional aspect of this experiment which may
limit its generalizability is the absence of any perceived'p
penalty or reward associated with completing the
experimental instrument. Although the experiment was
conducted, for the most part, at the place of the
auditors' employment, the participants were involved in a
classroom situation. This type of environment may elicit
what may be termed "textbook" answers rather than the
auditors' true estimates of the population tolerable error
rates.
|'*.~',*'*%**. -. |- , " -n h* 5 - *. *
b S , ... .,W * .4 . -. . . . .- . S. - .- a f,. t. _,t1 t.. ,P Z , Z - r-z , r,-L- T..r A
61
Direction for Future Research Efforts
This continuing line of research into the effects of
various heuristics on the audit judgment process is an
important part of the profession future. At the time when
the development of artificial intelligence is coming to
the forefront in several areas, the need to understand and
depict the decision making process becomes very
significant. It will be from these examination of the
decision processes that knowledge engineers will be able
to construct the appropriate models for the artificial
intelligence environment. The development of future
decision support systems for audit management will
parallel effort already underway in the systems management
area. The current work needs to be extended to include
additional significant variables in the audit judgment
model. The potential is to lay the ground work for audit
specific decision aids beyond those originally envisioned
merely as rules for decision makers. Translation of this
work into computer models for future research and
development is required. Better definition and
operationalization of the variables is another important
aspect of this line of research that requires more intense
research work.
* .4..- . *.%* ~'4-. - .p~ .- 4 V VV9 4~~~* ~*%.
62 Appendix 1
AUDIT JUDGMENT EXERCISE
You have been selected to participate in an
experiment designed to assist both you, as practitioners,
and researchers understand precisely what affects the
audit judgment process. In this exercise you have been
asked to assist another auditor-in-charge during the
course of an on-going audit engagement. The assistance
that you will render will require you to make several
decisions based on available information contained in the
descriptive scenario. You are to use only the information ,
given, please do not attempt to broaden the question by
making assumptions about the engagement.
I.
In addition to the experimental material, you are asked
to complete the survey which follows the audit exercise.
Please wait until you have completed the exercise, to fill
out the survey.
%N
%p
-ft
ftf
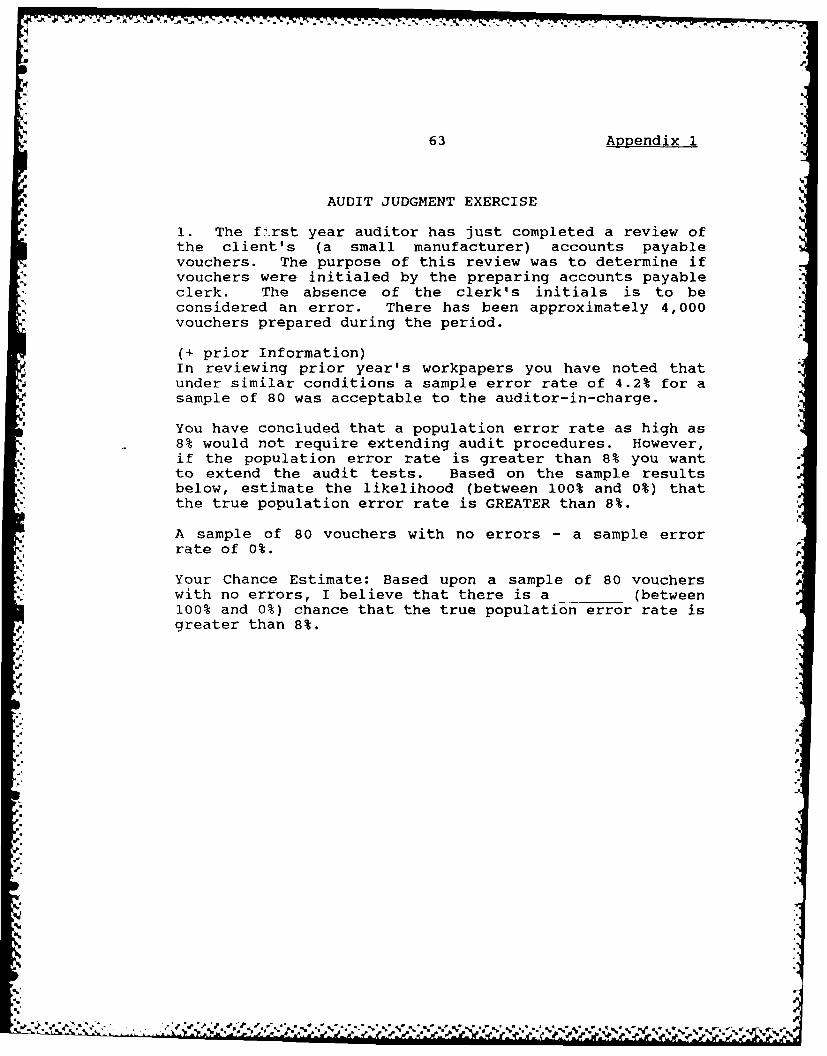
63 Appendix 1
AUDIT JUDGMENT EXERCISE
1. The fl.rst year auditor has just completed a review ofthe client's (a small manufacturer) accounts payablevouchers. The purpose of this review was to determine ifvouchers were initialed by the preparing accounts payableclerk. The absence of the clerk's initials is to beconsidered an error. There has been approximately 4,000vouchers prepared during the period.
(+ prior Information)In reviewing prior year's workpapers you have noted thatunder similar conditions a sample error rate of 4.2% for asample of 80 was acceptable to the auditor-in-charge.
You have concluded that a population error rate as high as8% would not require extending audit procedures. However,if the population error rate is greater than 8% you wantto extend the audit tests. Based on the sample resultsbelow, estimate the likelihood (between 100% and 0%) thatthe true population error rate is GREATER than 8%.
A sample of 80 vouchers with no errors - a sample errorrate of 0%.
Your Chance Estimate: Based upon a sample of 80 voucherswith no errors, I believe that there is a (between100% and 0%) chance that the true population error rate isgreater than 8%.
I,
I'"
.1
F;,
'p.
'-A4
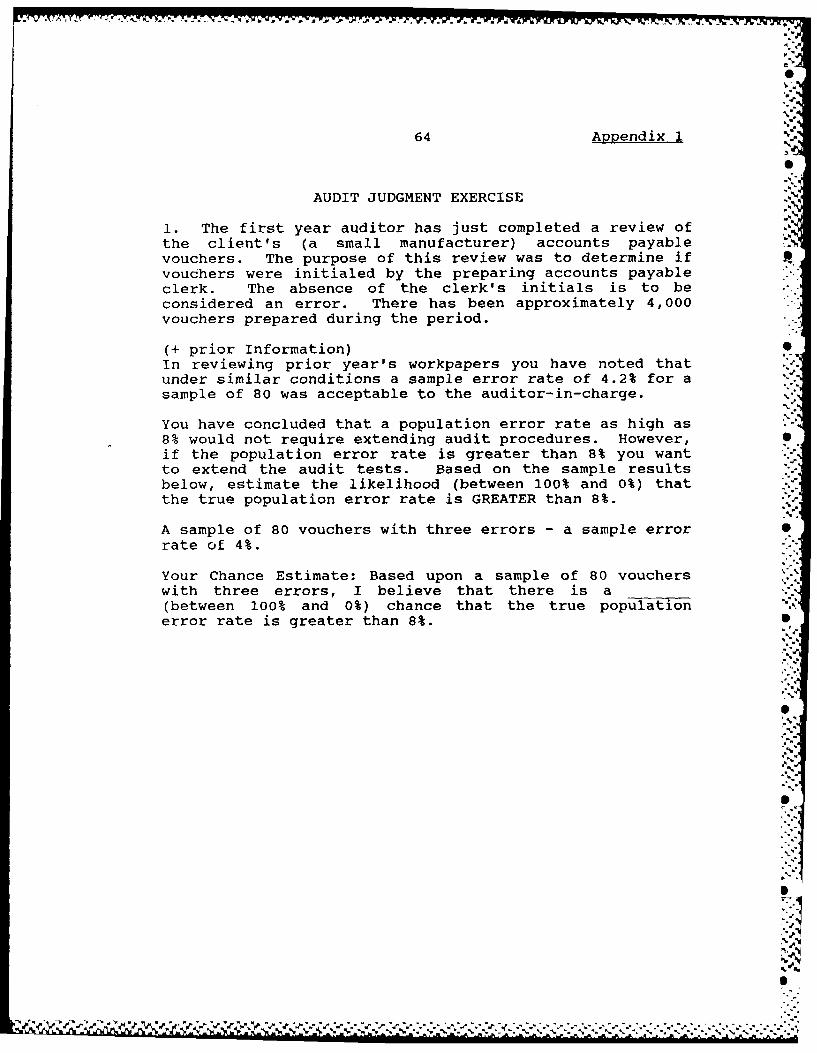
am.,
--77
64 Appendix 1 a'
AUDIT JUDGMENT EXERCISE
1. The first year auditor has just completed a review ofthe client's (a small manufacturer) accounts payablevouchers. The purpose of this review was to determine ifvouchers were initialed by the preparing accounts payableclerk. The absence of the clerk's initials is to beconsidered an error. There has been approximately 4,000vouchers prepared during the period.
(+ prior Information)In reviewing prior year's workpapers you have noted thatunder similar conditions a sample error rate of 4.2% for asample of 80 was acceptable to the auditor-in-charge.
You have concluded that a population error rate as high as -
8% would not require extending audit procedures. However, Sif the population error rate is greater than 8% you want
to extend the audit tests. Based on the sample resultsbelow, estimate the likelihood (between 100% and 0%) thatthe true population error rate is GREATER than 8%.
A sample of 80 vouchers with three errors - a sample error orate of 4%.
Your Chance Estimate: Based upon a sample of 80 voucherswith three errors, I believe that there is a ____-
(between 100% and 0%) chance that the true populationerror rate is greater than 8%. "
'.5,.,
.'.]
,%
S.-
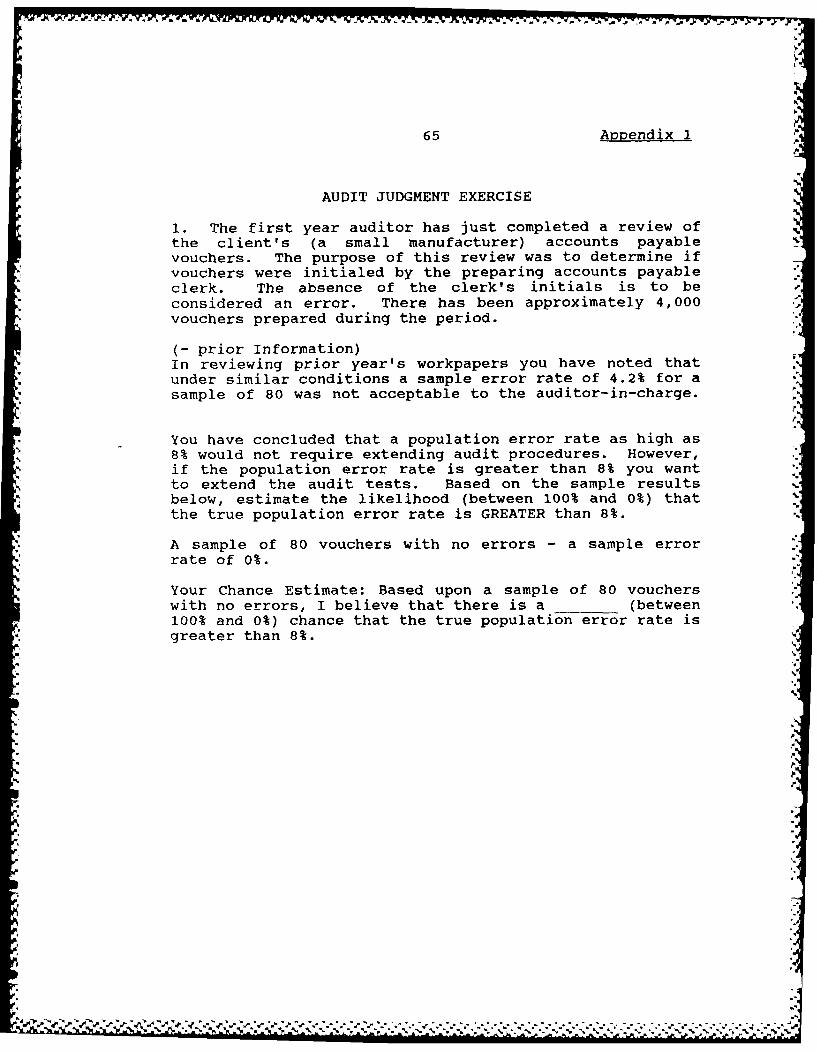
65 Apendix I -
AUDIT JUDGMENT EXERCISE
1. The first year auditor has just completed a review ofthe client's (a small manufacturer) accounts payablevouchers. The purpose of this review was to determine ifvouchers were initialed by the preparing accounts payableclerk. The absence of the clerk's initials is to beconsidered an error. There has been approximately 4,000vouchers prepared during the period.
(- prior Information)In reviewing prior year's workpapers you have noted thatunder similar conditions a sample error rate of 4.2% for asample of 80 was not acceptable to the auditor-in-charge.
1*
You have concluded that a population error rate as high as8% would not require extending audit procedures. However,if the population error rate is greater than 8% you wantto extend the audit tests. Based on the sample resultsbelow, estimate the likelihood (between 100% and 0%) thatthe true population error rate is GREATER than 8%.
A sample of 80 vouchers with no errors - a sample errorrate of 0%.
Your Chance Estimate: Based upon a sample of 80 voucherswith no errors, I believe that there is a (between100% and 0%) chance that the true population error rate isgreater than 8%.
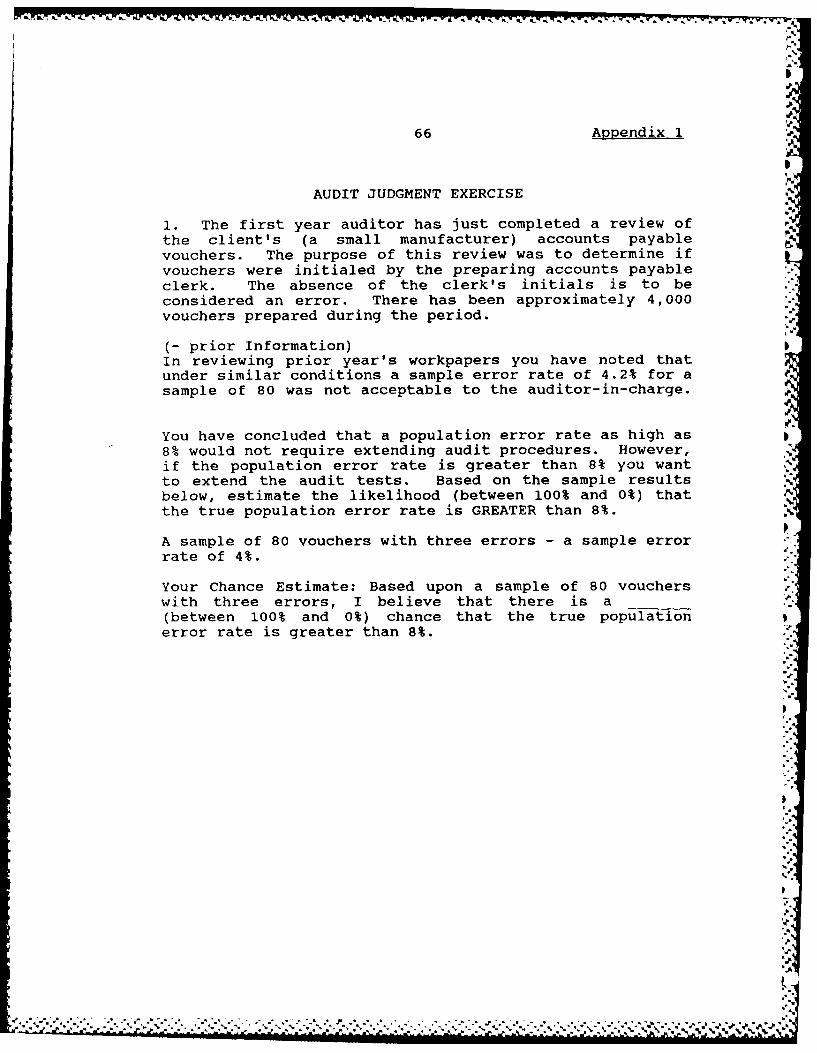
.1
66 Appendix 1
AUDIT JUDGMENT EXERCISE
1. The first year auditor has just completed a review ofthe client's (a small manufacturer) accounts payablevouchers. The purpose of this review was to determine ifvouchers were initialed by the preparing accounts payableclerk. The absence of the clerk's initials is to beconsidered an error. There has been approximately 4,000vouchers prepared during the period.
(- prior Information)In reviewing prior year's workpapers you have noted thatunder similar conditions a sample error rate of 4.2% for asample of 80 was not acceptable to the auditor-in-charge.
You have concluded that a population error rate as high as8% would not require extending audit procedures. However,if the population error rate is greater than 8% you wantto extend the audit tests. Based on the sample resultsbelow, estimate the likelihood (between 100% and 0%) thatthe true population error rate is GREATER than 8%.
A sample of 80 vouchers with three errors - a sample errorrate of 4%.
Your Chance Estimate: Based upon a sample of 80 voucherswith three errors, I believe that there is a ___
(between 100% and 0%) chance that the true populationerror rate is greater than 8%.
)
4.
• ,I.
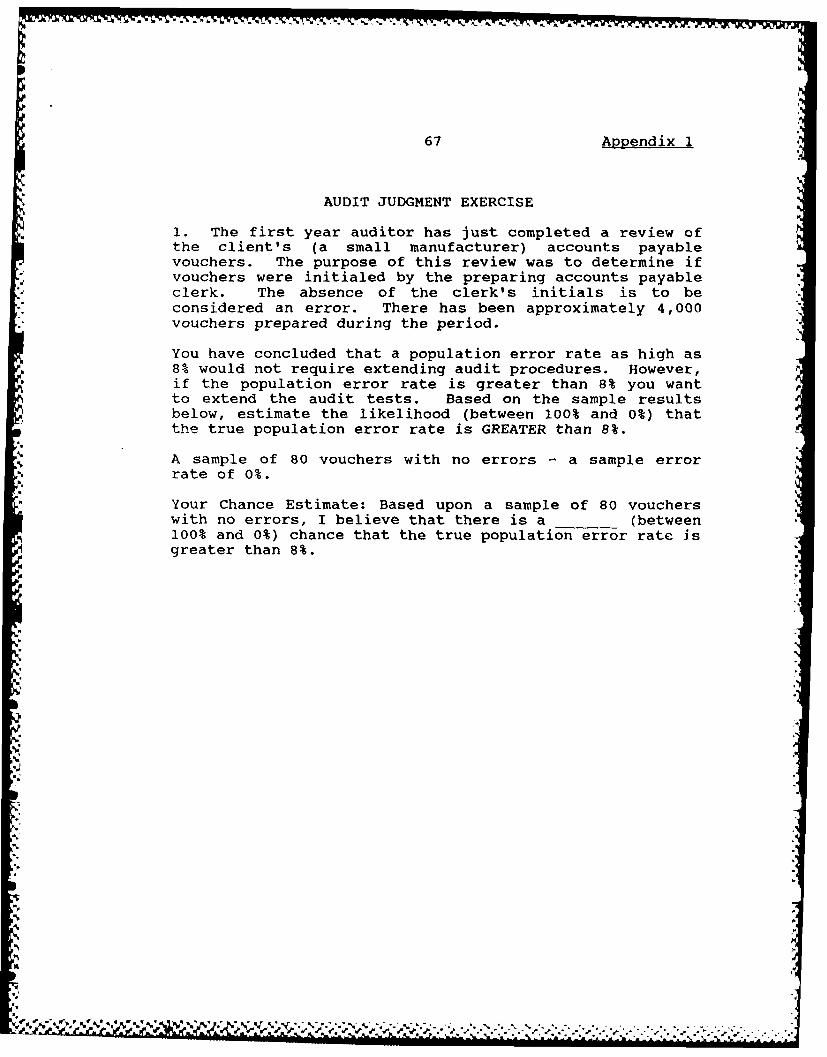
67 Appendix 1
AUDIT JUDGMENT EXERCISE
1. The first year auditor has just completed a review ofthe client's (a small manufacturer) accounts payablevouchers. The purpose of this review was to determine ifvouchers were initialed by the preparing accounts payableclerk. The absence of the clerk's initials is to beconsidered an error. There has been approximately 4,000vouchers prepared during the period.
You have concluded that a population error rate as high as8% would not require extending audit procedures. However,if the population error rate is greater than 8% you wantto extend the audit tests. Based on the sample resultsbelow, estimate the likelihood (between 100% and 0%) thatthe true population error rate is GREATER than 8%.
A sample of 80 vouchers with no errors - a sample errorrate of 0%.
Your Chance Estimate: Based upon a sample of 80 voucherswith no errors, I believe that there is a (between100% and 0%) chance that the true population error rate isgreater than 8%.
U%
p"1
7iI'
',
i
'3 ,e ~ , j . _ , ., , ,. .. ,-., .-.. z . - . "." -. j -. - .- ,m C'I- ' l h . . ' " " . .
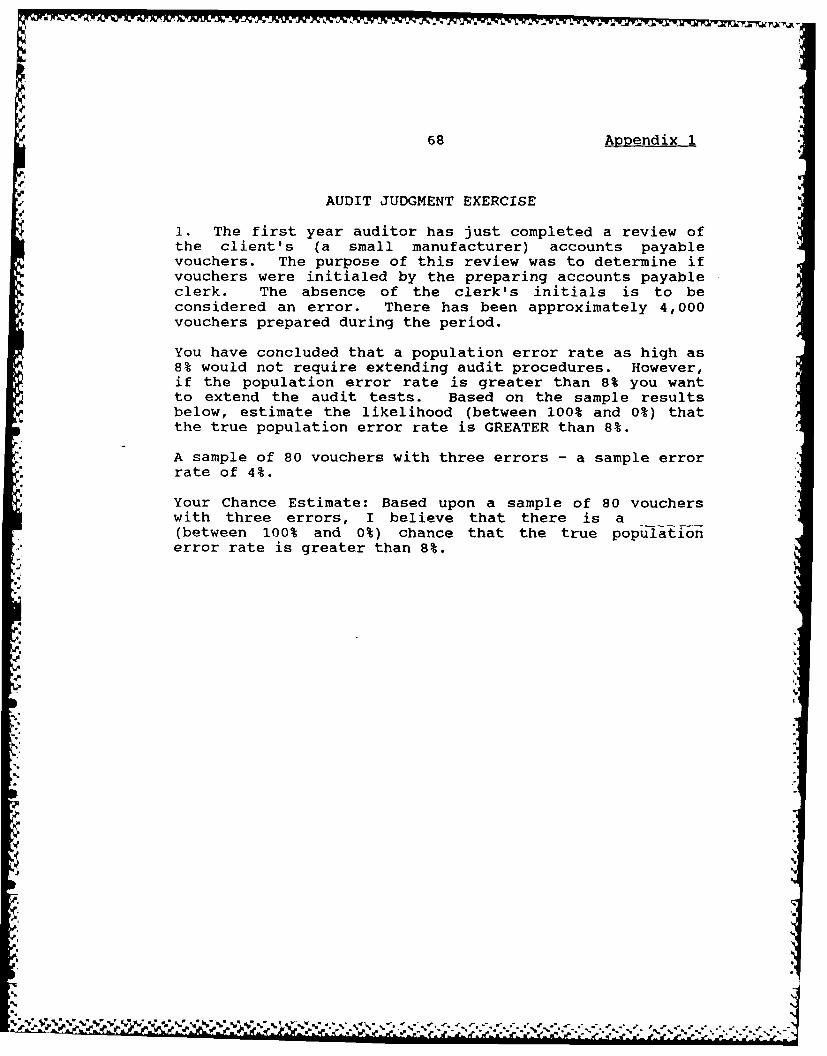
68 Appendix 1
AUDIT JUDGMENT EXERCISE
1. The first year auditor has just completed a review ofthe client's (a small manufacturer) accounts payablevouchers. The purpose of this review was to determine ifvouchers were initialed by the preparing accounts payableclerk. The absence of the clerk's initials is to beconsidered an error. There has been approximately 4,000vouchers prepared during the period.
You have concluded that a population error rate as high as8% would not require extending audit procedures. However,if the population error rate is greater than 8% you wantto extend the audit tests. Based on the sample resultsbelow, estimate the likelihood (between 100% and 0%) thatthe true population error rate is GREATER than 8%.
A sample of 80 vouchers with three errors - a sample errorrate of 4%.
Your Chance Estimate: Based upon a sample of 80 voucherswith three errors, I believe that there is a(between 100% and 0%) chance that the true populationerror rate is greater than 8%.
N-I.
' t4
.4i
.. VD%% V~~~-- - .
.4 .
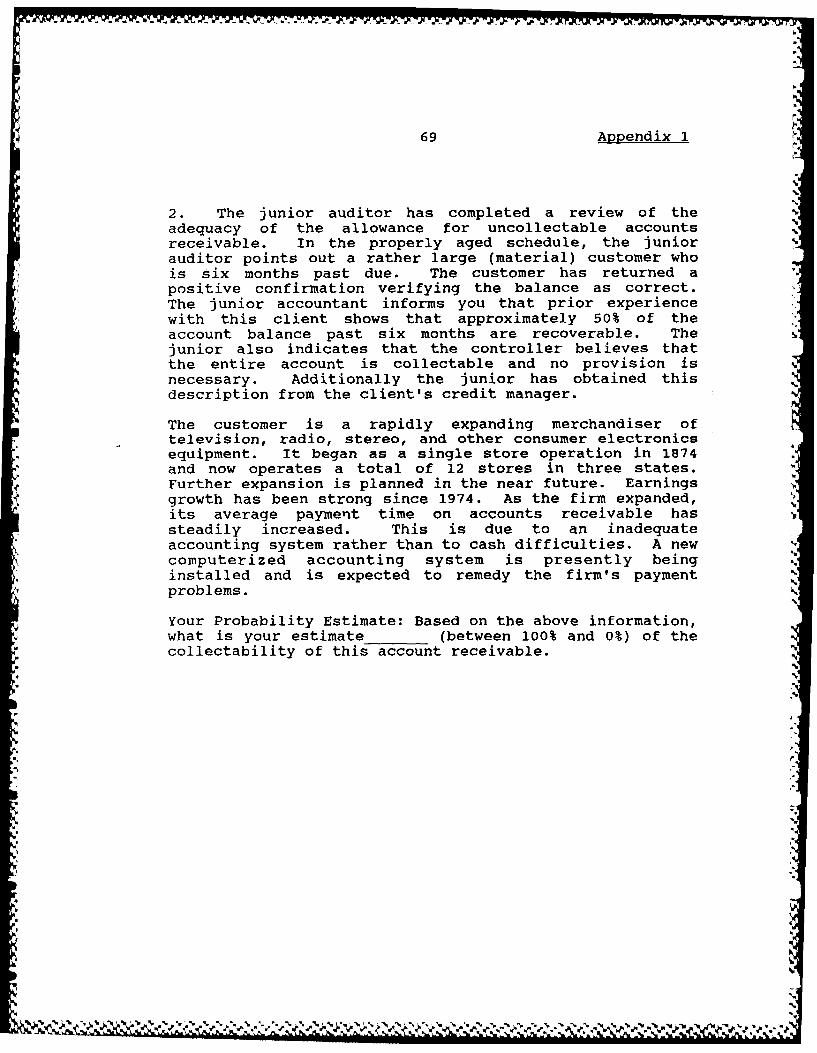
69 Appendix I
2. The junior auditor has completed a review of theadequacy of the allowance for uncollectable accountsreceivable. In the properly aged schedule, the juniorauditor points out a rather large (material) customer whois six months past due. The customer has returned apositive confirmation verifying the balance as correct.The junior accountant informs you that prior experiencewith this client shows that approximately 50% of theaccount balance past six months are recoverable. Thejunior also indicates that the controller believes thatthe entire account is collectable and no provision isnecessary. Additionally the junior has obtained thisdescription from the client's credit manager.
The customer is a rapidly expanding merchandiser oftelevision, radio, stereo, and other consumer electronicsequipment. It began as a single store operation in 1874and now operates a total of 12 stores in three states.Further expansion is planned in the near future. Earningsgrowth has been strong since 1974. As the firm expanded,its average payment time on accounts receivable hassteadily increased. This is due to an inadequateaccounting system rather than to cash difficulties. A newcomputerized accounting system is presently beinginstalled and is expected to remedy the firm's paymentproblems.
Your Probability Estimate: Based on the above information,what is your estimate (between 100% and 0%) of thecollectability of this account receivable.
%N
5I
4' q
,4.
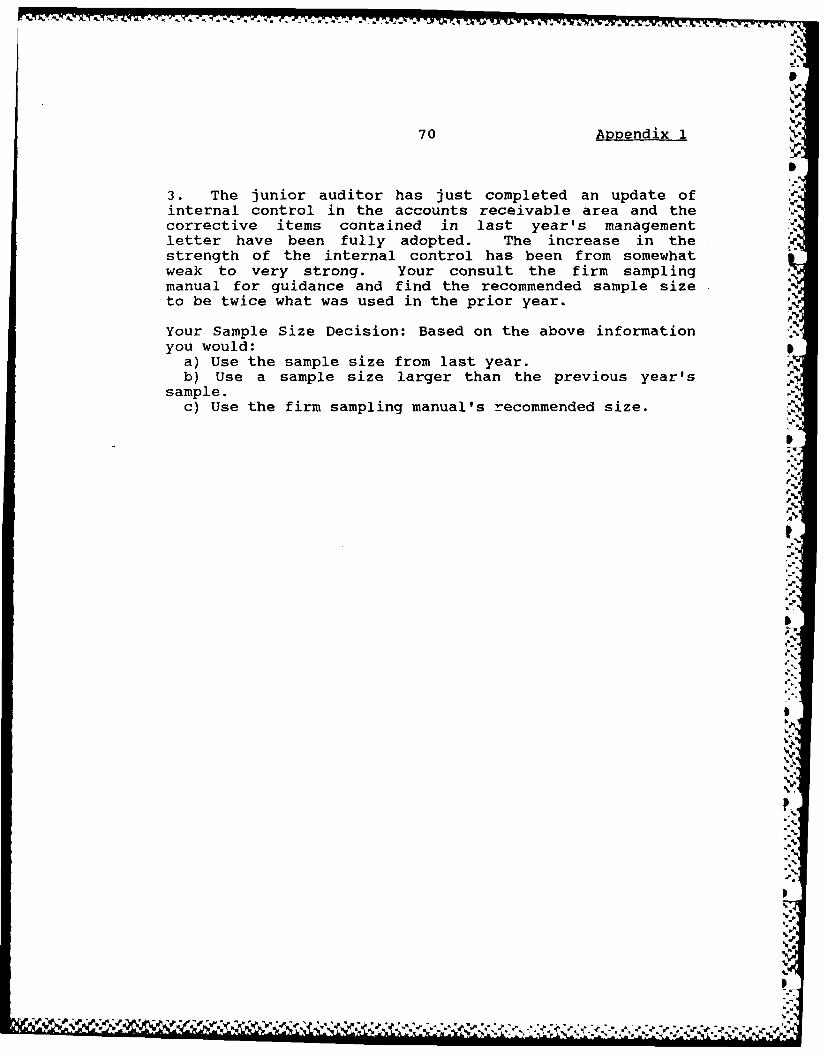
A. A . I M M .* I.C .
70 Appendix 1
3. The junior auditor has just completed an update ofinternal control in the accounts receivable area and thecorrective items contained in last year's managementletter have been fully adopted. The increase in thestrength of the internal control has been from somewhatweak to very strong. Your consult the firm samplingmanual for guidance and find the recommended sample sizeto be twice what was used in the prior year.
Your Sample Size Decision: Based on the above informationyou would:
a) Use the sample size from last year.b) Use a sample size larger than the previous year's
sample.c) Use the firm sampling manual's recommended size.
D-
4.
%".
b
- n i li - I .. . .. .
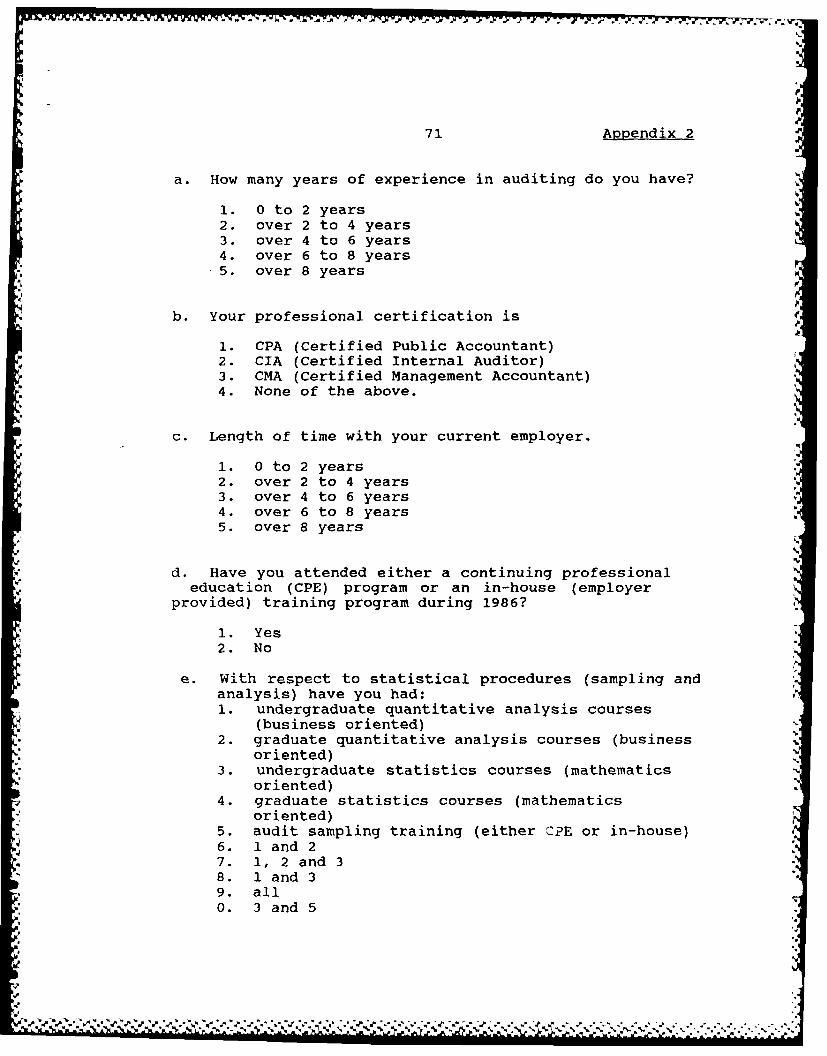
71 Appendix 2
a. How many years of experience in auditing do you have?
1. 0 to 2 years2. over 2 to 4 years3. over 4 to 6 years4. over 6 to 8 years5. over 8 years
b. Your professional certification is
1. CPA (Certified Public Accountant)2. CIA (Certified Internal Auditor)3. CMA (Certified Management Accountant)4. None of the above.
c. Length of time with your current employer.
1. 0 to 2 years2. over 2 to 4 years3. over 4 to 6 years4. over 6 to 8 years5. over 8 years
d. Have you attended either a continuing professionaleducation (CPE) program or an in-house (employer
provided) training program during 1986?
1. Yes2. No
e. With respect to statistical procedures (sampling andanalysis) have you had:1. undergraduate quantitative analysis courses
(business oriented)2. graduate quantitative analysis courses (business
* oriented)3. undergraduate statistics courses (mathematics
oriented)4. graduate statistics courses (mathematics
oriented)5. audit sampling training (either CPE or in-house)6. 1 and 27. 1, 2 and 38. 1 and 39. all0. 3 and 5
'.€
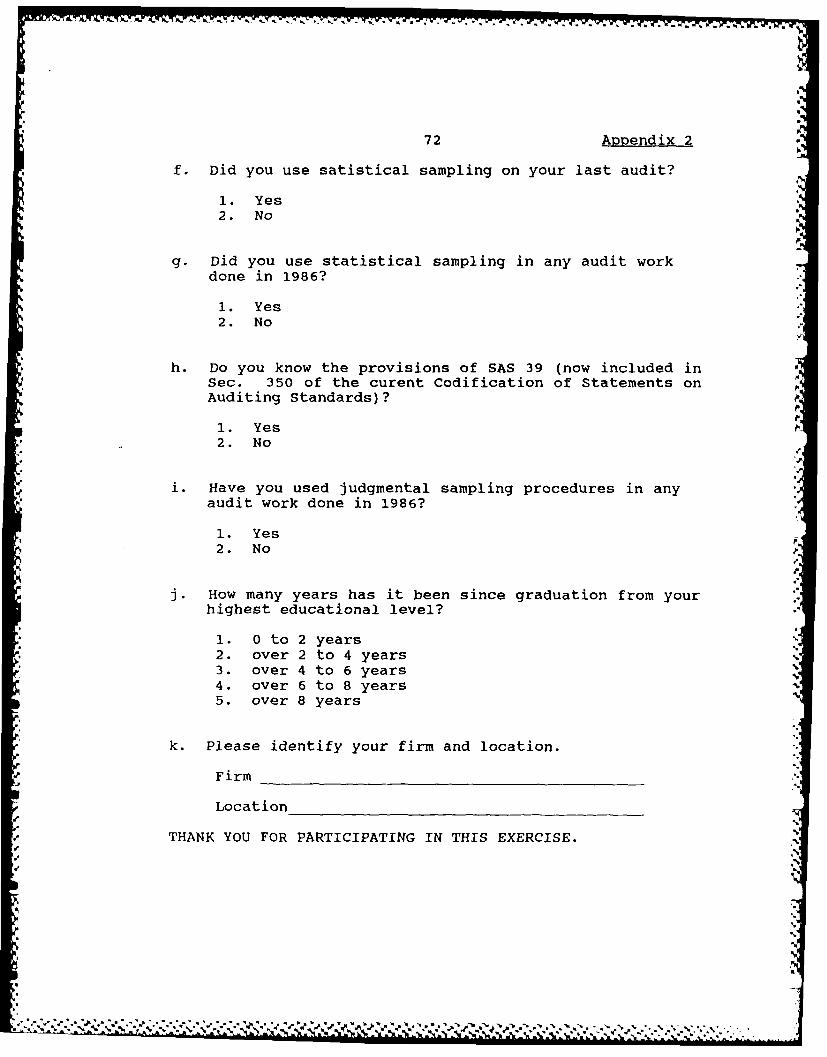
72 Appendix 2
f. Did you use satistical sampling on your last audit?
1. Yes2. No
g. Did you use statistical sampling in any audit workdone in 1986?
1. Yes2. No
h. Do you know the provisions of SAS 39 (now included inSec. 350 of the curent Codification of Statements onAuditing Standards)?
1. Yes2. No
i. Have you used judgmental sampling procedures in anyaudit work done in 1986?
1. Yes2. No,'"
j. How many years has it been since graduation from yourhighest educational level?
1. 0 to 2 years2. over 2 to 4 years3. over 4 to 6 years4. over 6 to 8 years5. over 8 years
k. Please identify your firm and location.
Firm "-_
Location
THANK YOU FOR PARTICIPATING IN THIS EXERCISE. 'S
VI
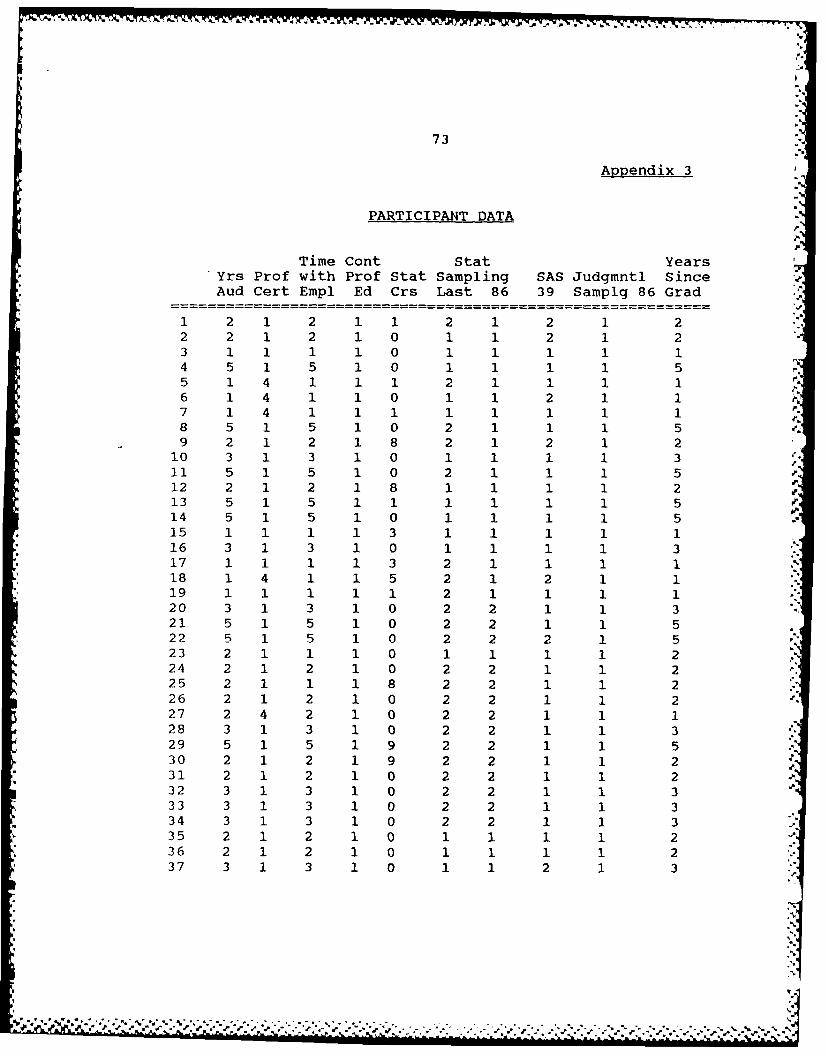
73
Appendix 3
PARTICIPANT DATAp
Time Cont Stat YearsYrs Prof with Prof Stat Sampling SAS Judgmntl SinceAud Cert Empl Ed Crs Last 86 39 Samplg 86 Grad
1 2 1 2 1 1 2 1 2 1 22 2 1 2 1 0 1 1 2 1 23 1 1 1 1 0 1 1 1 1 14 5 1 5 1 0 1 1 1 1 55 1 4 1 1 1 2 1 1 1 16 1 4 1 1 0 1 1 2 1 17 1 4 1 1 1 1 1 1 1 18 5 1 5 1 0 2 1 1 1 59 2 1 2 1 8 2 1 2 1 2
10 3 1 3 1 0 1 1 1 1 311 5 1 5 1 0 2 1 1 1 512 2 1 2 1 8 1 1 1 1 213 5 1 5 1 1 1 1 1 1 5 f14 5 1 5 1 0 1 1 1 1 515 1 1 1 1 3 1 1 1 1 116 3 1 3 1 0 1 1 1 1 317 1 1 1 1 3 2 1 1 1 118 1 4 1 1 5 2 1 2 1 119 1 1 1 1 1 2 1 1 1 120 3 1 3 1 0 2 2 1 1 321 5 1 5 1 0 2 2 1 1 522 5 1 5 1 0 2 2 2 1 523 2 1 1 1 0 1 1 1 1 224 2 1 2 1 0 2 2 1 1 225 2 1 1 1 8 2 2 1 1 226 2 1 2 1 0 2 2 1 1 227 2 4 2 1 0 2 2 1 1 128 3 1 3 1 0 2 2 1 1 329 5 1 5 1 9 2 2 1 1 530 2 1 2 1 9 2 2 1 1 231 2 1 2 1 0 2 2 1 1 232 3 1 3 1 0 2 2 1 1 333 3 1 3 1 0 2 2 1 1 334 3 1 3 1 0 2 2 1 1 335 2 1 2 1 0 1 1 1 1 236 2 1 2 1 0 1 1 1 1 237 3 1 3 1 0 1 1 2 1 3
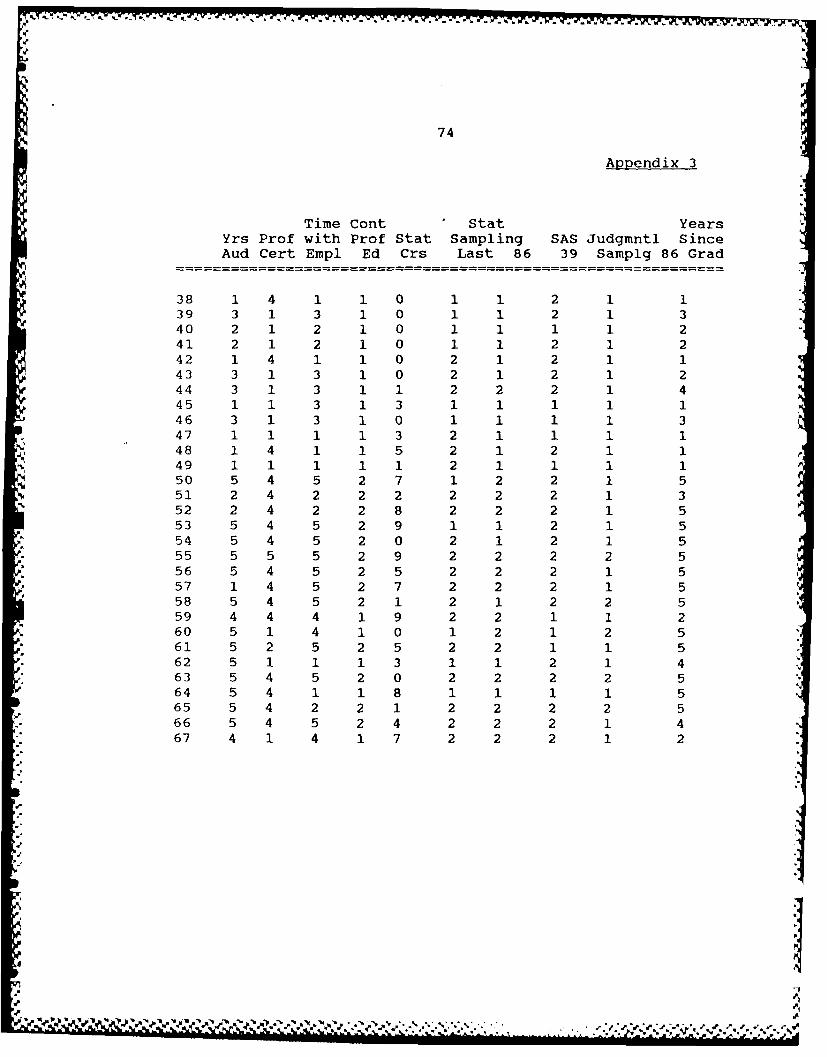
74
Appendix 3
Time Cont Stat YearsYrs Prof with Prof Stat Sampling SAS Judgmntl SinceAud Cert Empl Ed Crs Last 86 39 Samplg 86 Grad
38 1 4 1 1 0 1 1 2 1 139 3 1 3 1 0 1 1 2 1 340 2 1 2 1 0 1 1 1 1 241 2 1 2 1 0 1 1 2 1 242 1 4 1 1 0 2 1 2 1 143 3 1 3 1 0 2 1 2 1 244 3 1 3 1 1 2 2 2 1 445 1 1 3 1 3 1 1 1 1 146 3 1 3 1 0 1 1 1 1 347 1 1 1 1 3 2 1 1 1 148 1 4 1 1 5 2 1 2 1 149 1 1 1 1 1 2 1 1 1 150 5 4 5 2 7 1 2 2 1 551 2 4 2 2 2 2 2 2 1 352 2 4 2 2 8 2 2 2 1 553 5 4 5 2 9 1 1 2 1 554 5 4 5 2 0 2 1 2 1 555 5 5 5 2 9 2 2 2 2 556 5 4 5 2 5 2 2 2 1 557 1 4 5 2 7 2 2 2 1 558 5 4 5 2 1 2 1 2 2 559 4 4 4 1 9 2 2 1 1 260 5 1 4 1 0 1 2 1 2 561 5 2 5 2 5 2 2 1 1 562 5 1 1 1 3 1 1 2 1 463 5 4 5 2 0 2 2 2 2 564 5 4 1 1 8 1 1 1 1 565 5 4 2 2 1 2 2 2 2 566 5 4 5 2 4 2 2 2 1 467 4 1 4 1 7 2 2 2 1 2
A.
Jil
. 4mw 1 .' 'P* -g.
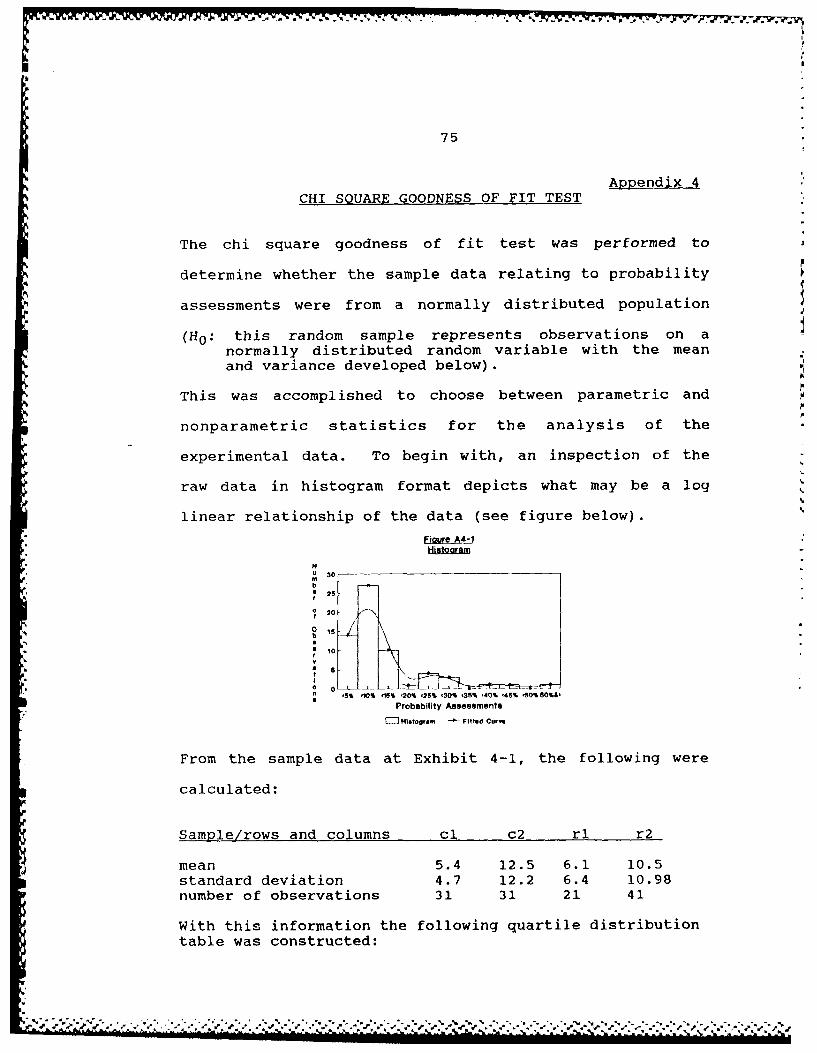
75
Appendix 4CHI SQUARE GOODNESS OF FIT TEST
The chi square goodness of fit test was performed to
determine whether the sample data relating to probability
assessments were from a normally distributed population
(H0: this random sample represents observations on anormally distributed random variable with the meanand variance developed below).
This was accomplished to choose between parametric and
nonparametric statistics for the analysis of the
experimental data. To begin with, an inspection of the
raw data in histogram format depicts what may be a log
linear relationship of the data (see figure below).
" NU 30
b 25
f 20
0 0
Probability Assessments
= leogrmm F~tted Curve
From the sample data at Exhibit 4-1, the following were
calculated:Sample/rows
and columns cl c2 rl r2
mean
5.4 12.5 6.1 10.5
standard deviation 4.7 12.2 6.4 10.98number of observations 31 31 21 41
With this information the following quartile distributiontable was constructed:
",%
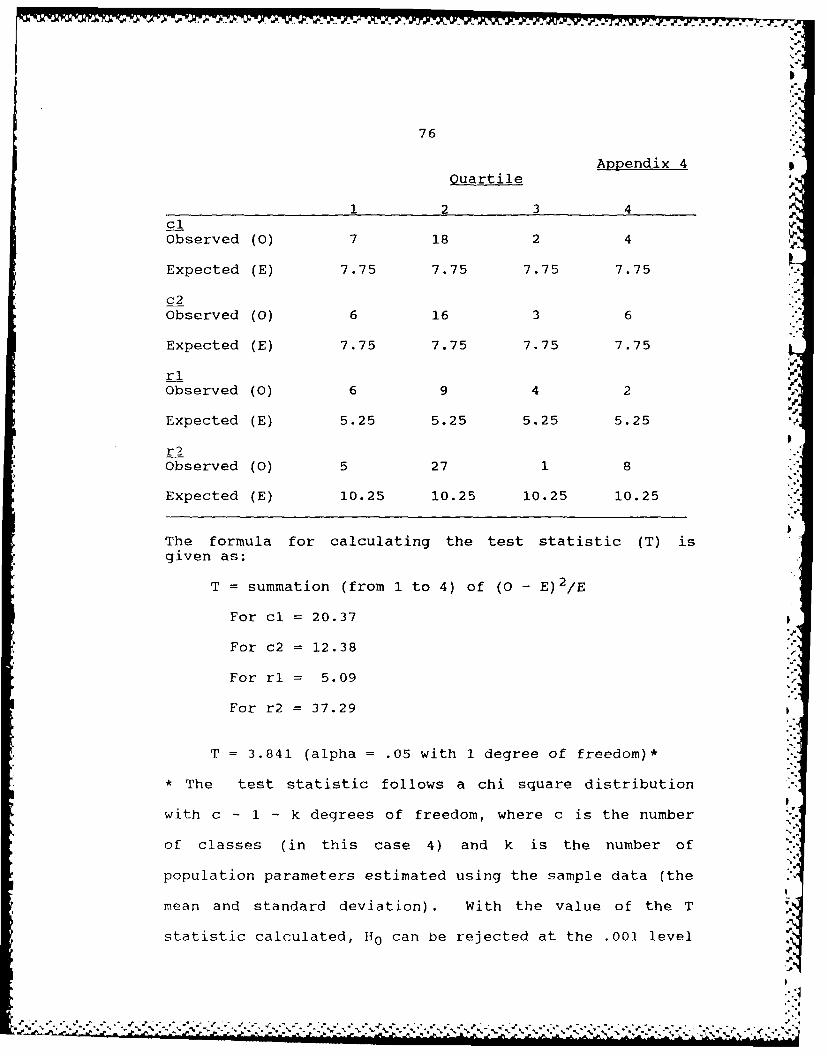
76
Appendix 4 pQuartile
1 2 3 4clObserved (0) 7 18 2 4
Expected (E) 7.75 7.75 7.75 7.75
c2Observed (0) 6 16 3 6
Expected (E) 7.75 7.75 7.75 7.75
riObserved (0) 6 9 4 2
Expected (E) 5.25 5.25 5.25 5.25
r2Observed (0) 5 27 1 8
Expected (E) 10.25 10.25 10.25 10.25
IThe formula for calculating the test statistic (T) isgiven as:
T = summation (from 1 to 4) of (0 - E) 2/E
For cl = 20.37
For c2 = 12.38
For rl 5.09
For r2 = 37.29
T = 3.841 (alpha = .05 with 1 degree of freedom)*
* The test statistic follows a chi square distribution
with c - 1 - k degrees of freedom, where c is the number
of classes (in this case 4) and k is the number of
population parameters estimated using the sample data (the
mean and standard deviation) . With the value of the T
statistic calculated, H0 can be rejected at the .001 level
_L-29 -7s' '
77
Appendix 4
with 1 degree of freedom (T > 10.83). Additionally, this
may provide for overconfidence if the estimates of the
population parameters were faulty. Even with this
constraint, H0 can be rejected at the .01 level of
significance with 3 degrees of freedom (T > 11.34) for all
experimental conditions except rl - no information
(Conover, 1971).
4V
5,,
- -p
' '5
; ' .,,,. ..',. '-.'.'.-" .-..',-.".... '"/'" "?.?-'" " - ¢'..". "",;."¢' ¢ '.:i'.",',"2"%'" :",. " /..5
7~
Appendix 5
Analysis of Variance
This experiment was designed as a 2 x 2 factorial model
with the intention of having balanced cell data. Withp.
this design, the appropriate method for analysis was the
ANOVA procedure. Two circumstance changed which made the
application of the ANOVA inappropriate. First, the number
of experimental participants fell short of having balanced
cells. Second, when the raw data were initially processed
it became apparent that the data were non-normal.
To rectify the first problem, the experimenter decide
that it was proper to continue the analysis using the
General Linear Model procedure which is in effect a
regression procedure but was capable of handling
unbalanced cells. To properly interept the results of
this procedure, the type III sum of squares must be
computed, since this unbalance experiment nullif, .s the
ability to use the additive model of the ANOVA.
The second problem (i.e. non-normal data) caused the
experimenter to change the analysis from parametric to
nonparametric methods in particular the Friedman Fr
statistic. Even though the main body of the dissertation
contains the results of the appropriate statistical
analysis procedure, it is of considerable interest to
review the parametric ANOVA results which follow:
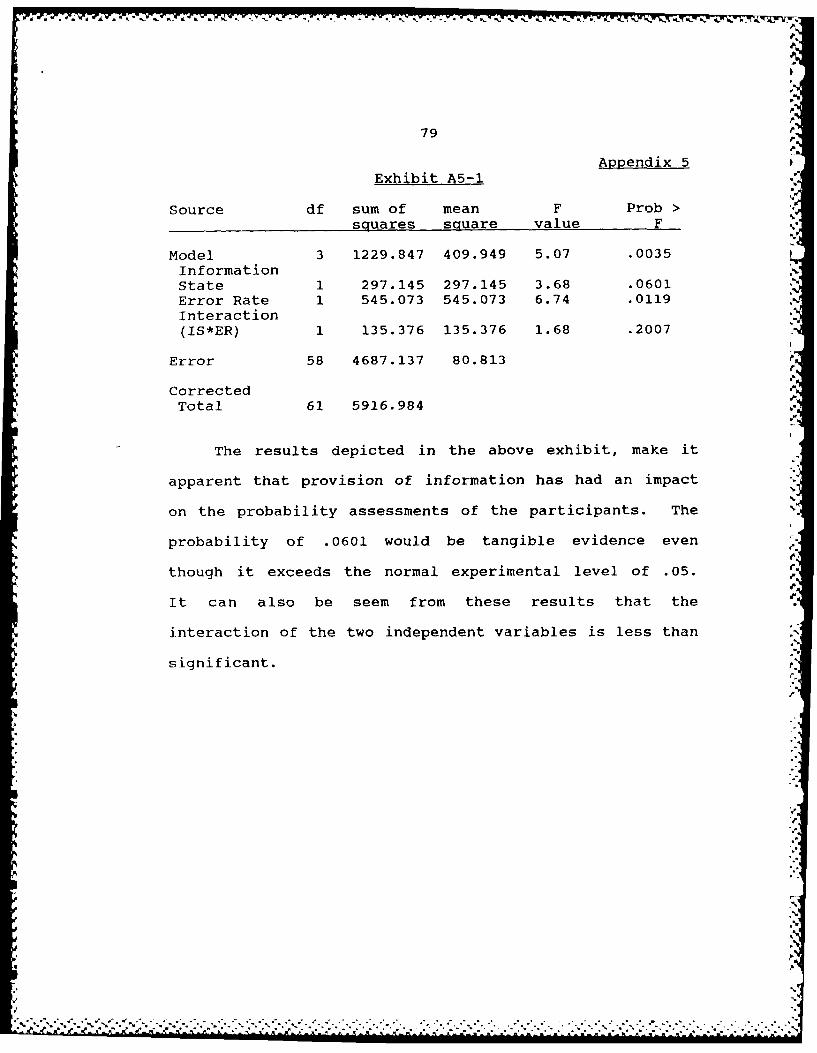
79J.
Appendix 5Exhibit A5-1
Source df sum of mean F Prob >squares square value F .
Model 3 1229.847 409.949 5.07 .0035InformationState 1 297.145 297.145 3.68 .0601Error Rate 1 545.073 545.073 6.74 .0119Interaction "(IS*ER) 1 135.376 135.376 1.68 .2007
Error 58 4687.137 80.813
CorrectedTotal 61 5916.984
The results depicted in the above exhibit, make it
apparent that provision of information has had an impact
on the probability assessments of the participants. The
probability of .0601 would be tangible evidence even
though it exceeds the normal experimental level of .05. OF
It can also be seem from these results that the
interaction of the two independent variables is less than -.
significant.
°P.
.. . .*P .~ .* . . .
I --- - -- id i"
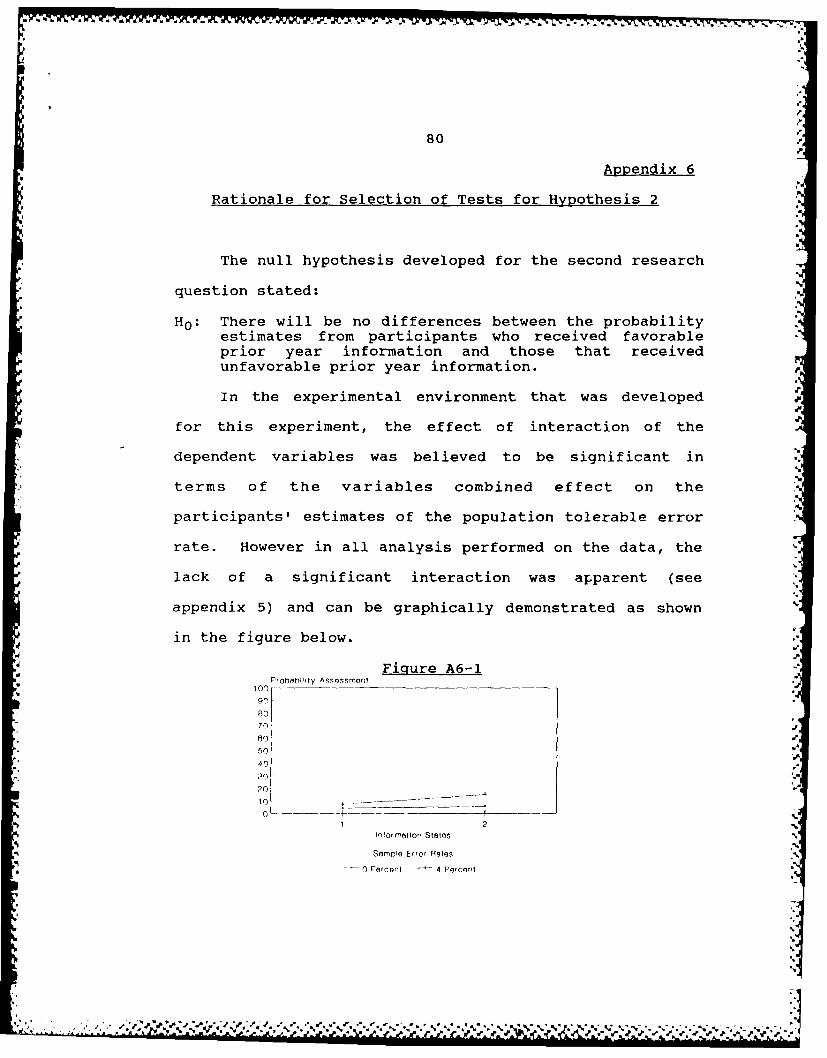
80 "
Appendix 6
Rationale for Selection of Tests for Hypothesis 2
The null hypothesis developed for the second research
question stated:
H0 : There will be no differences between the probabilityestimates from participants who received favorableprior year information and those that receivedunfavorable prior year information.
In the experimental environment that was developed
for this experiment, the effect of interaction of the
dependent variables was believed to be significant in
terms of the variables combined effect on the
participants' estimates of the population tolerable error
rate. However in all analysis performed on the data, the
lack of a significant interaction was apparent (see
appendix 5) and can be graphically demonstrated as shown
in the figure below.
Figture A6-1Probnbolty Assessment
1009r)
80
7r)
• 50 "
i'" 30 '
20
10
1 21
Informetlon States
Semple Efror R tes
0 Percent 4 Pecent
A,.
~. ASAS ~ -. ~'*~~ ~. e~. '
81
Appendix 6
In fact, the probability of exceeding the calculated
F value approached .5 if one considers there to be three
information states (no information, favorable information,
and unfavorable information) rather than just two (with
information and no information). For our purposes, this
lack of interaction lead to the consideration of tests
other than ANOVA to determine if there was a statistically
significant difference between favorable and unfavorable
information. The use of t-test is a conservative approach
to the comparison of two sample means.
- -- . . . ... : • - I N I -16' /V I . . .. . ... . •
"I82
BIBLIOGRAPHY
American Institute of Certified Public Accountants(AICPA), "Proposed Statement on AuditingStandards - Audit Sampling", AICPA AuditStandards Division, File 5000, September, 1979.
------------ "Statement on Auditing Standards, Number 39,Audit Sampling", AICPA Audit Standards Division,June, 1981.
----------- , Codification of Statements on AuditingStandards, Numbers 1 to 44, American Instituteof Certified Public Accountants, 1983.
Ashton, A., "Does Consensus Imply Accuracy in AccountingStudies of Decision Making", The AccountingReview, April, 1985, Vol LX, No. 2, pp 173-185.
Bereson, M., Levine, D., & Goldstein, M., IntermediateStatistical Methods and Applications, EnglewoodCliffs, N.J.: Prentice-Hall Inc. 1983.
Blocher, E., "Auditor Error Detection Performance", From ,Symposium on Auditing Research V, University ofIllinois, Eds. J. J. Schultz, Jr. and C. E.Brown, University of Illinois, Board ofTrustees, 1983.
Brownell, P., " A Field Study Examination of BudgetaryParticipation and Locus of Control", TheAccounting Review, October 1982, Vol LVII, No.4, pp 766-777.
Brunswik, E., The Conceptual Framework of Psychology,Chicago: University of Chicago Press, 1952
Burton, J. C. , Palmer, R. E. , and Kay, R. S., (eds)Handbook of Accounting and Auditing, Boston:Warren, Gorham & Lamont, 1981, updated 1983.
Butler, S. A., "Anchoring in the Judgmental Evaluation ofAudit Samples", The Accounting Review, January1986, Vol LXI, No 1, pp 101-111.
Campbell, D. T., and Stanley, J. C., Experimental andQuasi-Experimental Designs for Research,Chicago: Rand-McNally, 1963.
83
Chesley, G. R., "Elicitation of SubjectiveProbabilities: A Review." The Accounting Review,April 1975, Vol L, No 2, pp 325-337.
------------ "The Elicitation of Subjective Probabilities:A Laboratory Study in an Accounting Context."Journal of Accounting Research, Spring 1976, 14,pp 27-48.
----------- 3ubjective Probability Elicitation: TheEffect of Congruity of Datum and Response Modeon Performance." Journal of Accounting Research,Spring 1977, 15, pp 1-11.
Conover, W. J., Practical Nonparametric Statistics, NewYork: John Wiley & Sons Inc., 1971
Corless, J., "Assessing Prior Distributions for ApplyingBayesian Statistics in Auditing", The AccountingReview, July 1972, Vol XLVII, No 3, pp 556-566.
Einhorn, H. J., and Hogarth, R. M., "Behavioral DecisionTheory: Processes of Judgment and Choice",Journal of Accounting Research, Spring 1981, 19,pp 1-31.
Felix, W. L. Jr., and Kinney, W. R. Jr., "Research inthe Auditor's Opinion Formulation Process: Stateof the Art", The Accounting Review, April, 1982,Vol LVII, No. 2, pp 245-271.
Grinaker, R. L., and Barr, B. B., Auditing TheExamination of Financial Statements, Homewood,IL: Richard D. Irwin, Inc., 1965.
Hax, A., and Candea, D., Production and InventoryManagement, Englewood Cliffs, N.J.:Prentice-Hall, Inc., 1983.
Hogarth, R., "Beyond Discrete Biases: Functional andDysfunctional Aspects of Judgmental Heuristics",Psychological Bulletin, September 1981, Vol 90(2), pp 197-217.
Holmes, A. W., and Burns, D. C., Auditing Standards andProcedures, 9th ed., Homewood, IL: Richard D.Irwin, Inc., 1979.
* p
£m
I'5
% . . . . ---- . . . . . . . .
* 84
Joyce, E. J., and Biddle, G. C., "Anchoring andAdjustment in Probabilistic Inference inAuditing". Journal of Accounting Research,Spring 1981, Vol 19, No 1, pp 120-145.
Kinney, W. R., Jr., and Uecker, W. C., "Mitigating theConsequences of Anchoring in Auditor Judgment",The Accounting Review, January 1982, Vol LVII,No. 1, pp 55-69.
Lewis, B., Shields, M., and Young,S., "Evaluating HumanJudgments and Decision Aids", Journal ofAccounting Research, Spring 1983, Vol 21, No 1,pp 271-285.
Libby, R., Accounting and Human Information Processing:Theory and Applications, Englewood Cliffs, N.J.:Prentice-Hall, 1981.
Libby, R., Artman, J. T., and Willingham, J. J.,"Process Susceptibility, Control Risk and AuditPlanning", The Accounting Review, April 1985,Vol LX No 2, pp 212-230.
Libby, R., and Lewis, B. L., "Human InformationProcessing Research in Accounting": The State ofthe Art in 1982", Accounting, Organizations andSociety, 1982, Vol 7, No. 3, pp 231-285.
McGuigan, F. J., Experimental Psychology: Methods ofResearch, Englewood Cliffs, N.J.: Prentice-HallInc., 1983.
Moriarity, S., and Joyce, E., Decision Making andAccounting: Current Research, Norman, OK: theUniversity of Oklahoma, Center for Economic andManagement Research, 1984.
Northcraft, G. B., and Neale, M. A., "Experts, Amateurs,and Real Estate: An Anchoring-and-AdjustmentPerspective on Property Pricing Decisions",Organizational Behavior and Human DecisionProcesses, No 39, 1987, pp 84-97.
Trottman, K. T., Yetton, P. W., and Zimmer, I. R.,"Individual and Group Judgments of InternalControl Systems", Journal of AccountingResearch, Spring 198 3, Vol 21, No 1, pp 286-292.
. . . ..
85
Tversky, A., and Kahneman, D., "Judgment UnderUncertainty: Heuristics and Biases", Science,1974, Vol 185, pp 1124-1131.
Uecker, W. C., and Kinney, W. R. Jr., "JudgmentalEvaluation of Sample Results: A Study of theType and Severity of Errors Made by PracticingCPAs", Accounting, Organizations and Society1977, Vol 2 No. 3.
Waggoner, J. B., Nonsampling Risk: Auditor Detection ofCompliance Deviations, Ph.D. Dissertation,University of Cincinnati, 1986.
Wright, W., "Cognitive Information Processing Biases:Implications for Producers and Users ofFinancial Information", Decision Sciences, April1980, Vol 11, No. 2, pp 284-298.
-z
.5I
%S
V
.5,.o