Embed Size (px)
Citation preview

1
Information Briefing Regarding
CO-OPS’
Microwave Water Level (MWWL) Activities
Manoj SamantOctober 24, 2012
MWWL Activities Briefing
2
Agenda
CO-OPS MWWL Activities
- History
- Testing and Analysis
- Guidance
- Status
- Summary
3
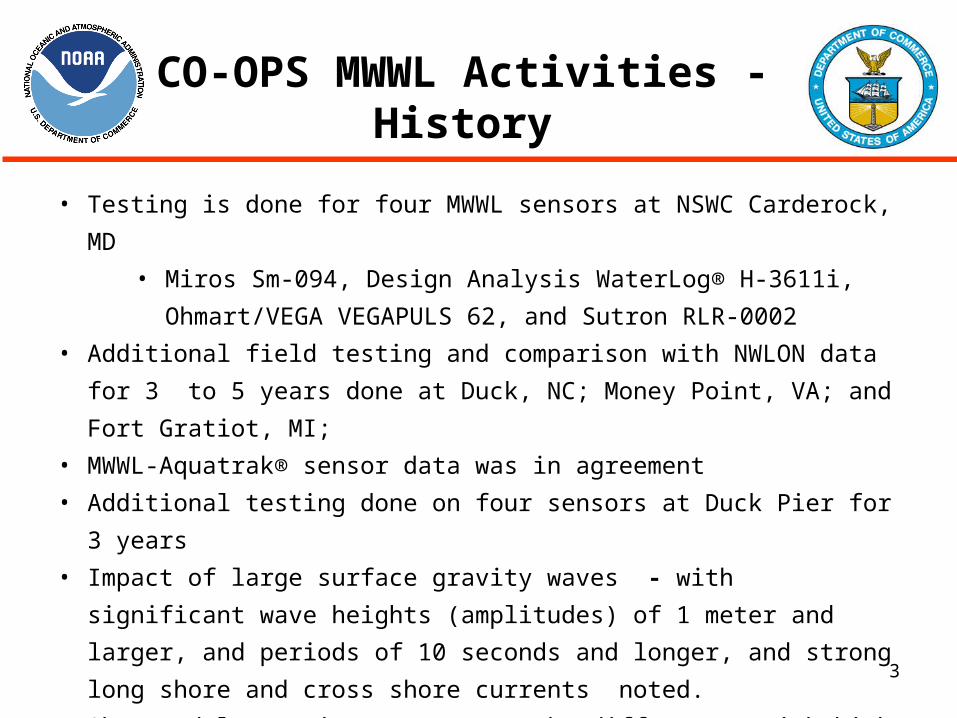
• Testing is done for four MWWL sensors at NSWC Carderock, MD
• Miros Sm-094, Design Analysis WaterLog® H-3611i, Ohmart/VEGA
VEGAPULS 62, and Sutron RLR-0002
• Additional field testing and comparison with NWLON data for 3 to 5 years
done at Duck, NC; Money Point, VA; and Fort Gratiot, MI;
• MWWL-Aquatrak® sensor data was in agreement
• Additional testing done on four sensors at Duck Pier for 3 years
• Impact of large surface gravity waves - with significant wave heights
(amplitudes) of 1 meter and larger, and periods of 10 seconds and longer,
and strong long shore and cross shore currents noted.
• Observed large microwave-Aquatrak® differences with high energy events.
• Design Analysis WaterLog ® H-3611i sensor selected based upon high
reliability, low maintenance, and cost.
CO-OPS MWWL Activities - History
4
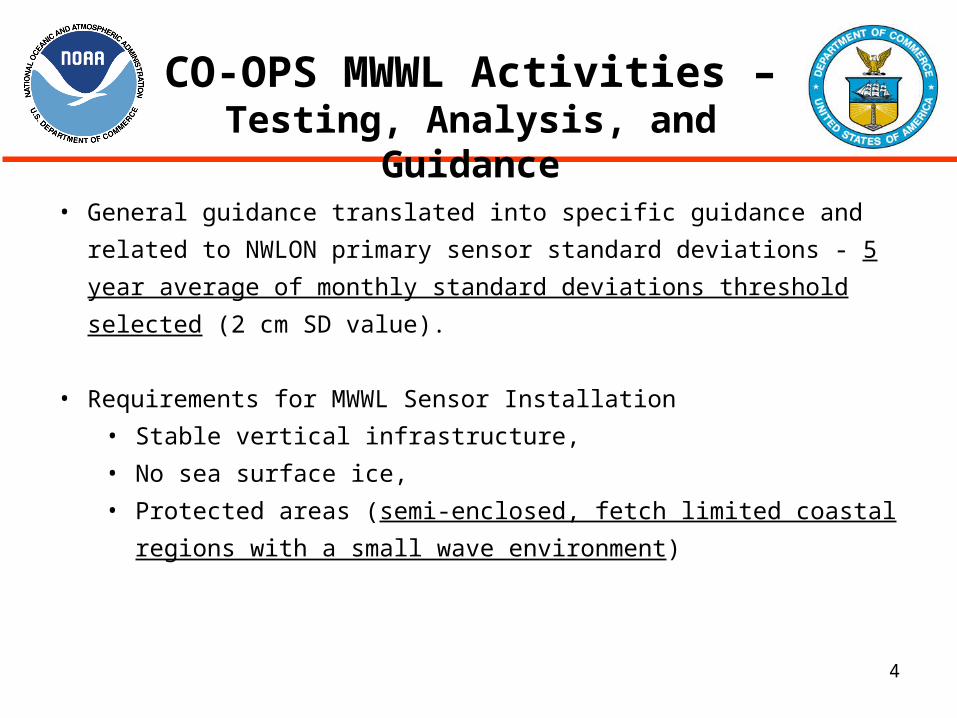
• General guidance translated into specific guidance and related to NWLON
primary sensor standard deviations - 5 year average of monthly standard
deviations threshold selected (2 cm SD value).
• Requirements for MWWL Sensor Installation
• Stable vertical infrastructure,
• No sea surface ice,
• Protected areas (semi-enclosed, fetch limited coastal regions with a
small wave environment)
CO-OPS MWWL Activities –Testing, Analysis, and Guidance
5
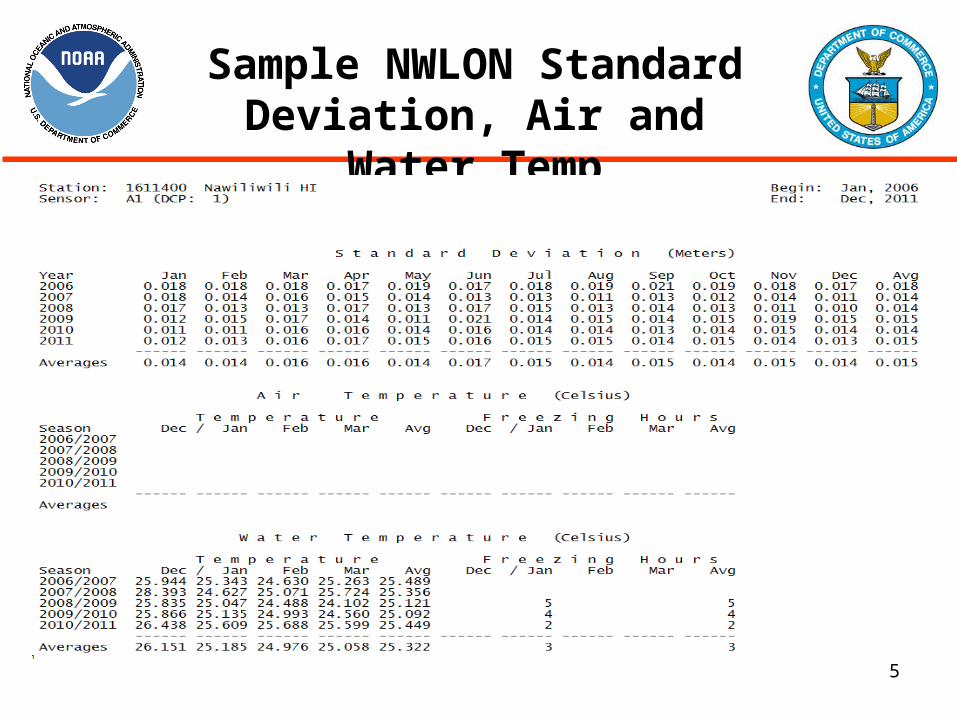
Sample NWLON Standard Deviation, Air and Water Temp
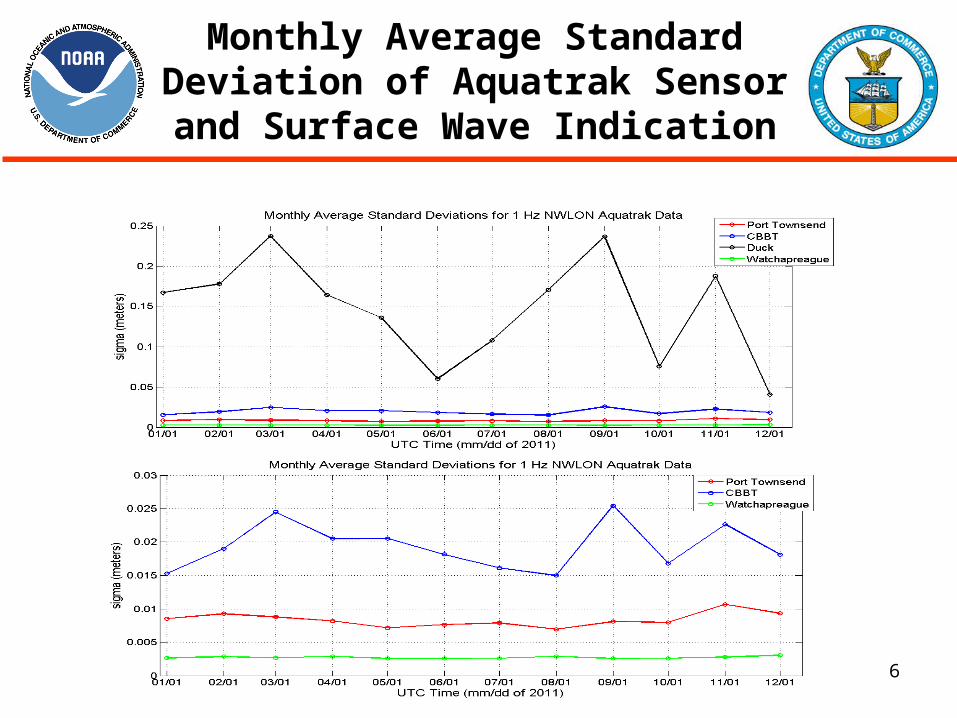
Monthly Average Standard Deviation of Aquatrak Sensor and
Surface Wave Indication
6
7
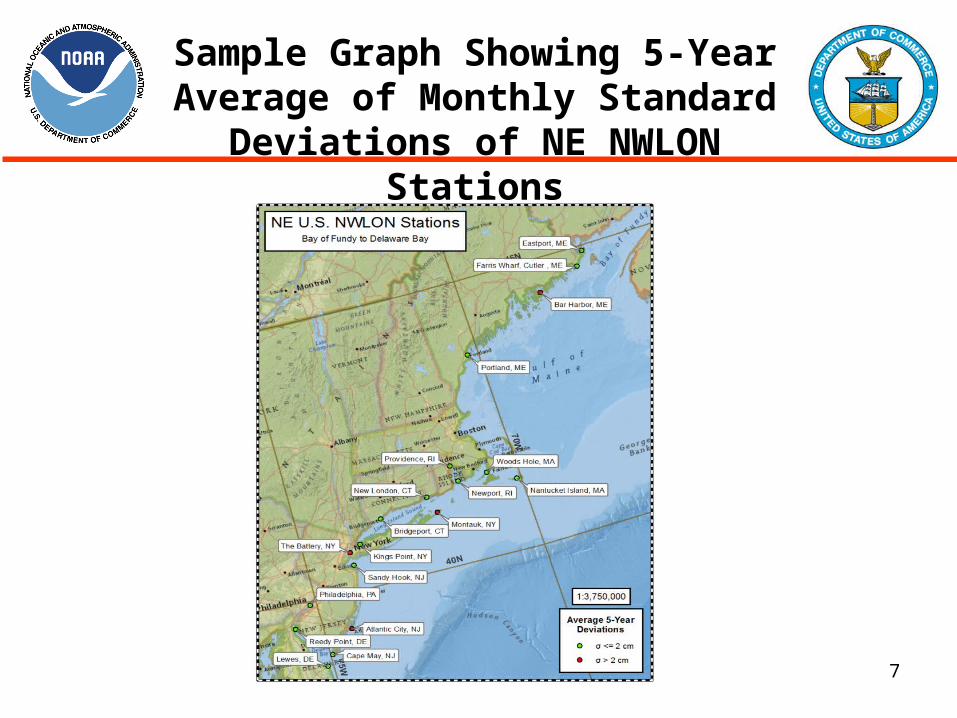
Sample Graph Showing 5-Year Average of Monthly Standard
Deviations of NE NWLON Stations
8
• Limited Acceptance of the Design Analysis WaterLog H-3611i Microwave
radar Water Level Sensor Test and Evaluation Report published by CO-OPS
in December 2010, which is available at
http://tidesandcurrents.noaa.gov/publications/Technical_Report_NOS_CO-OPS_061.pdf
• Report includes detailed comparison of MWWL vs NWLON reference
sensors at Port Townsend, WA; Money Point, VA, Fort Gratiot, MI, and Bay
Waveland, MS.
• Testing and analysis supports operational use of the WaterLog® Microwave
radar sensor in semi-enclosed, fetch limited coastal regions with a small
wave environment.
• Report also includes description of a 5 step lab verification test procedure
that is required prior to field deployment.
CO-OPS MWWL Activities – Limited Acceptance Report
9
• CO-OPS formed a MWWL Transition to Operations (MWWL TOP)
committee at the end of FY 11. Currently there are 10 members and
meetings are held monthly.
• MWWL TOP Committee - Oversight of all of transition activities – planning,
testing, documentation, SOP, budget, schedule, operations, and
implementation plan. These are multi year efforts.
• MWWL TOP Committee will make a recommendation of which sites are
suitable for MWWL transition.
• Advantages of transitioning to MWWL sensor - no-diving, reduced AI time,
no-corrosion, removal of dissimilar metal effects, no reduction in accuracy
under limited acceptance criteria.
CO-OPS MWWL Activities – Transition to Operations
10
• “Implementation of MWWL sensors into NWLON Operations – Requirements
for simultaneous comparisons between sensors”, S K Gill, 1/14/2011
published.
• “Implementation of MWWL sensors into NOAA Hydrographic Survey
Operations - Requirements for simultaneous comparisons between sensors”,
S K Gill 1/14/2011 published.
• These two documents provide the roadmap for how simultaneous
comparison will be done for control and subordinate stations.
• Guidelines for Implementation of Microwave Water Level Sensors for Short
Term Water Level Station Deployments is being drafted and reviewed.
CO-OPS MWWL Activities – Implementation Guidelines
11
• Currently MWWL sensor installed at 11 stations – Duck, NC; Port Townsend,
WA; Fort Gratiot, MI: Bay Waveland, MS; East Fowl River, AL, West Fowl
River, AL; Dog River, AL, Bayou LaBatre, AL; Chicksaw Bogue, AL; Windmill
Point, Wachapreague, VA.
• Two hydro stations installed for Elizabeth River (Lafeyette River and Western
Branch) and data collected and data comparison performed.
• The comparison analysis between MWWL and the standard sensors (one
Acoustic and one pressure) showed mean differences of less than 0.02 m in
the 6-minute data with standard deviation of less than +/- 0.01 m.(#)
• The differences in monthly mean tabulation products showed less than 0.02
m differences. (#)
• The mean differences in the tabulated times of the high and low waters were
within 0.1 hour. (# “Microwave Data Processing for 9999972 Lafeyette
River and 9999939 Western Branch, Edgar Davis, May 10, 2011” ).
CO-OPS MWWL Activities – Recent Projects
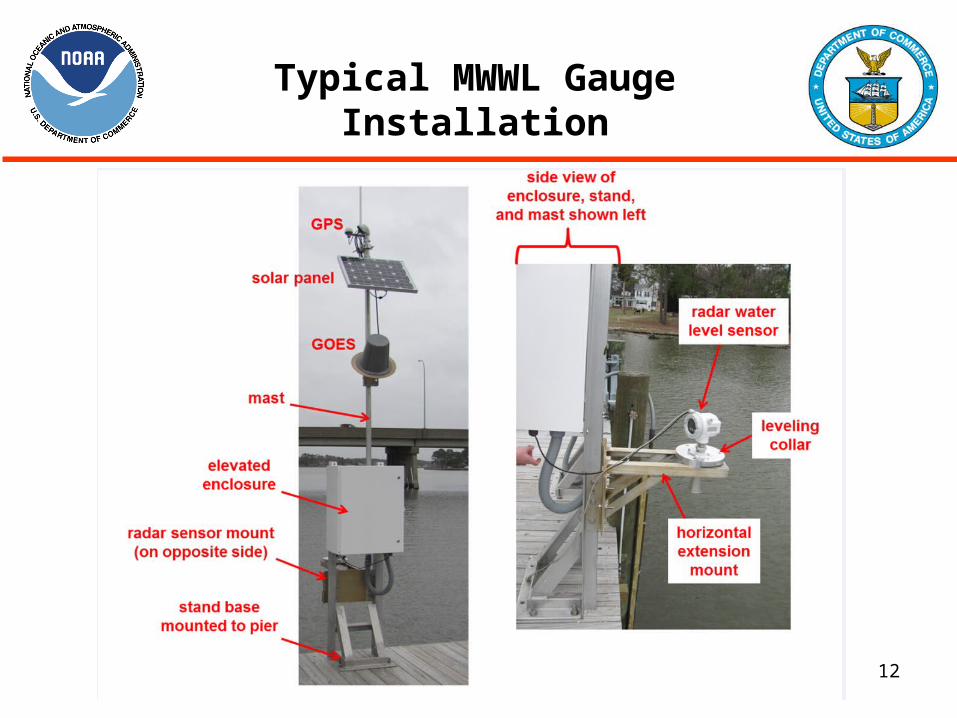
12
Typical MWWL Gauge Installation
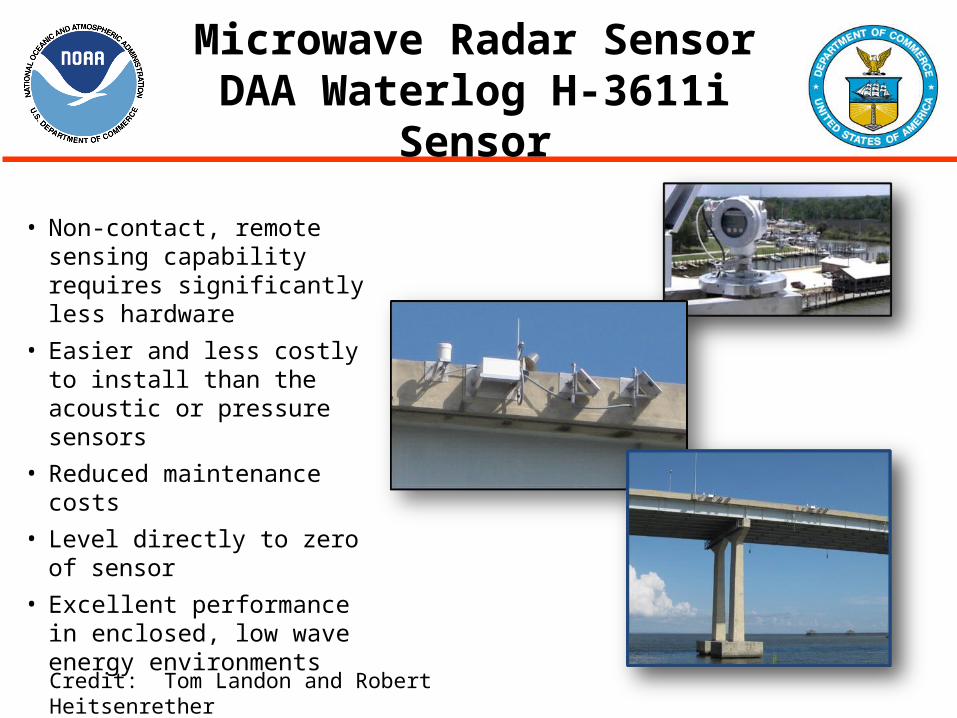
Microwave Radar SensorDAA Waterlog H-3611i Sensor
• Non-contact, remote sensing capability requires significantly less hardware
• Easier and less costly to install than the acoustic or pressure sensors
• Reduced maintenance costs
• Level directly to zero of sensor
• Excellent performance in enclosed, low wave energy environments
Sensor and mount
One complete system
Primary and Redundant systems
Credit: Tom Landon and Robert Heitsenrether
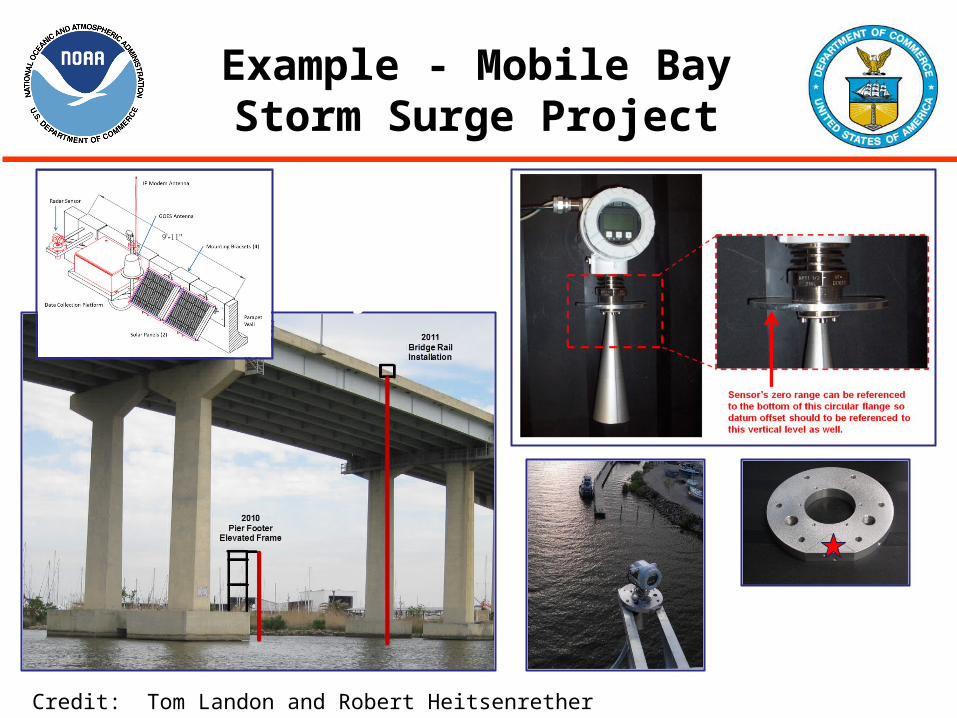
Example - Mobile Bay Storm Surge Project
MW Radar Sensor as Primary and redundant mounted on bridge walls
MW Radar Sensor mounting plate w/ leveling target
Credit: Tom Landon and Robert Heitsenrether
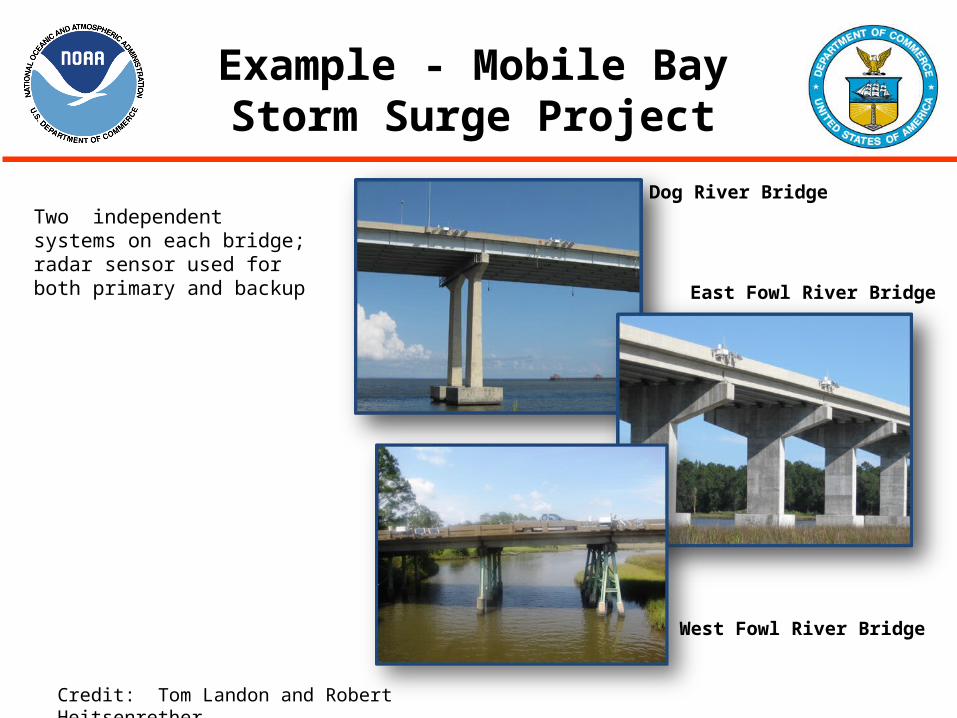
Example - Mobile Bay Storm Surge Project
Two independent systems on each bridge; radar sensor used for both primary and backup
Dog River Bridge
East Fowl River Bridge
West Fowl River Bridge
Credit: Tom Landon and Robert Heitsenrether
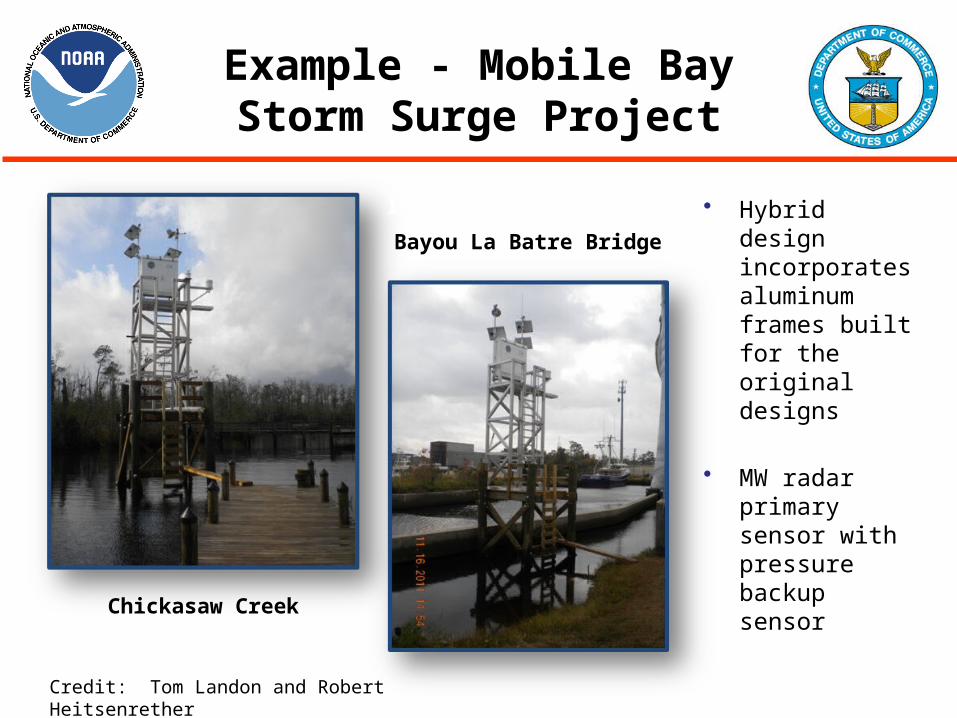
Example - Mobile Bay Storm Surge Project
• Hybrid design incorporates aluminum frames built for the original designs
• MW radar primary sensor with pressure backup sensor of 25 feet.
Chickasaw Creek
Bayou La Batre Bridge
Installed Oct/Nov 2011
Credit: Tom Landon and Robert Heitsenrether
17
• Based upon the limited acceptance report and the additional testing done,
CO-OPS has started implementation of MWWL sensors into operations for
both NWLON operations and NOS hydrographic and shoreline survey
operations.
• CO-OPS has developed a preliminary environmental assessment process
for determination where SD threshold conditions exist that would limit the
deployment of MWWL sensors for operational purposes.
• Based upon these criteria, CO-OPS will make a determination as to the
appropriateness of the use of MWWL sensor for each tide station location
required for upcoming hydrographic and shoreline surveys and CO-OPS will
provide this information to OCS and NGS during the survey planning stages.
CO-OPS MWWL Activities – Summary
18
Thanks.
Questions?
(1) MWWL Gauge Costs – Short Term Station
(2) Sample Environmental Site Assessment – Watchapreague, VA
19
Backup Slides
20
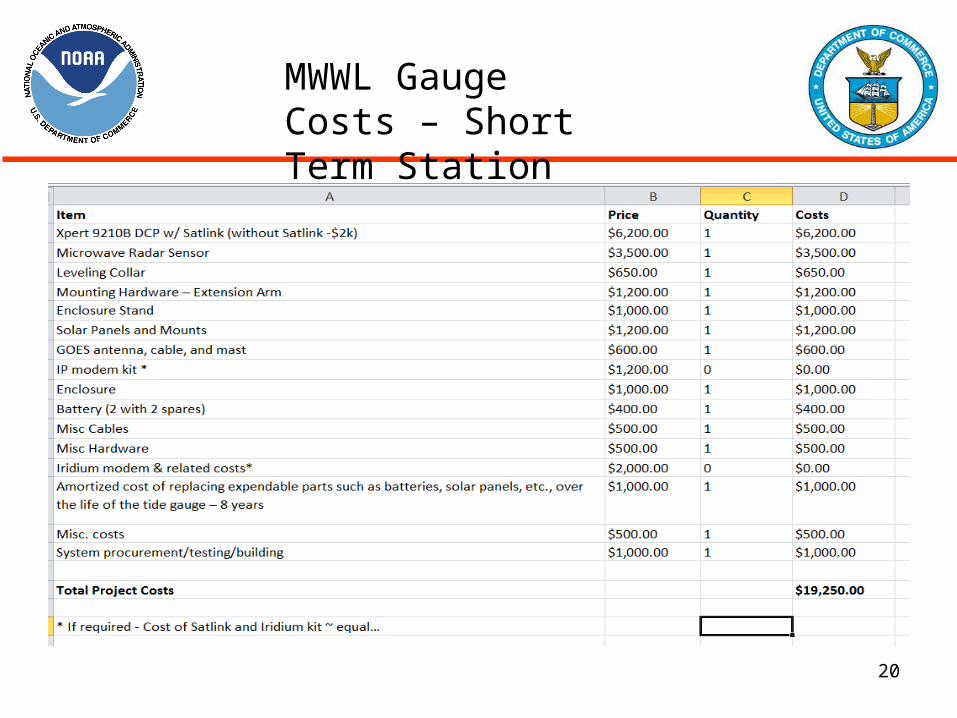
MWWL Gauge Costs – Short Term Station
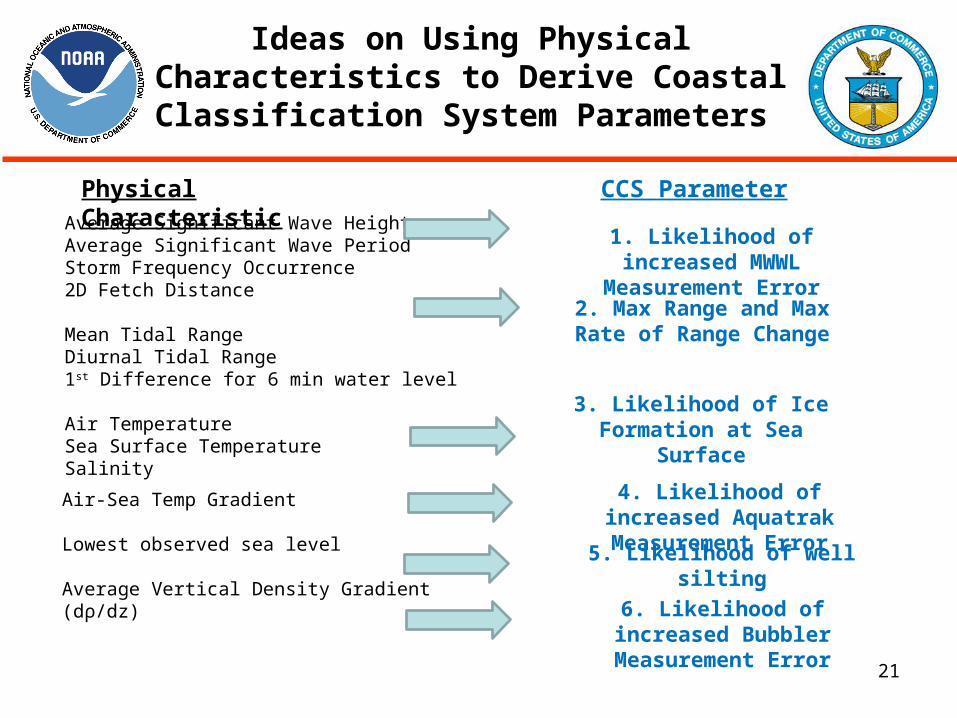
Ideas on Using Physical Characteristics to Derive Coastal Classification System
Parameters
Average Significant Wave HeightAverage Significant Wave PeriodStorm Frequency Occurrence 2D Fetch Distance
Mean Tidal RangeDiurnal Tidal Range1st Difference for 6 min water level
Air TemperatureSea Surface TemperatureSalinity
Air-Sea Temp Gradient
Lowest observed sea level
Average Vertical Density Gradient (dρ/dz)
Physical Characteristic CCS Parameter
1. Likelihood of increased MWWL Measurement Error
2. Max Range and Max Rate of Range Change
3. Likelihood of Ice Formation at Sea Surface
4. Likelihood of increased Aquatrak Measurement Error
6. Likelihood of increased Bubbler Measurement Error
5. Likelihood of well silting
21
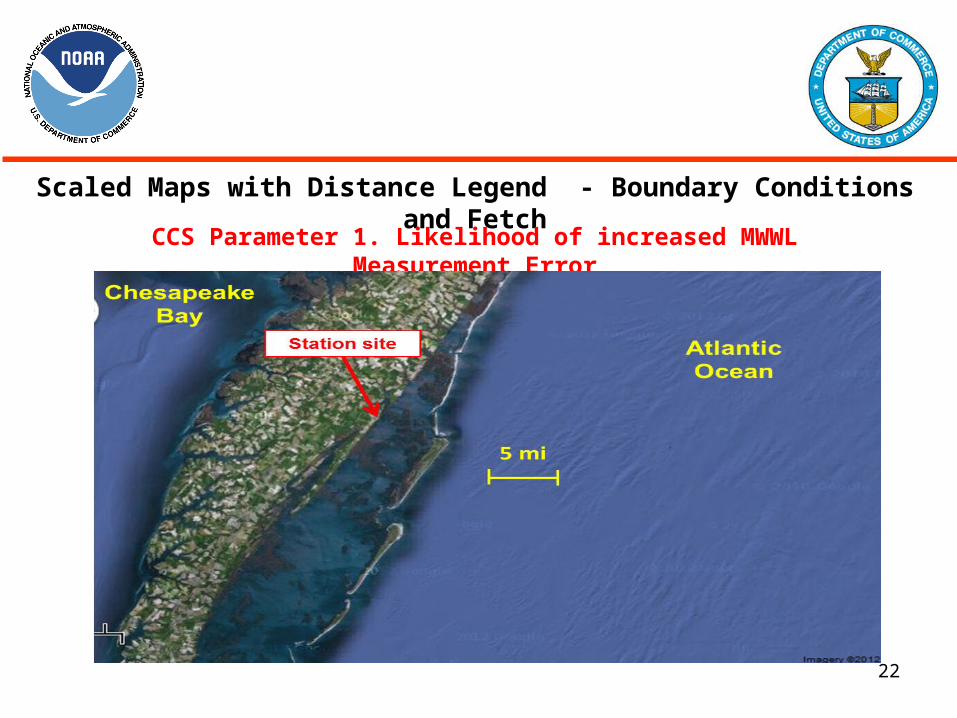
Scaled Maps with Distance Legend - Boundary Conditions and Fetch
CCS Parameter 1. Likelihood of increased MWWL Measurement Error
22
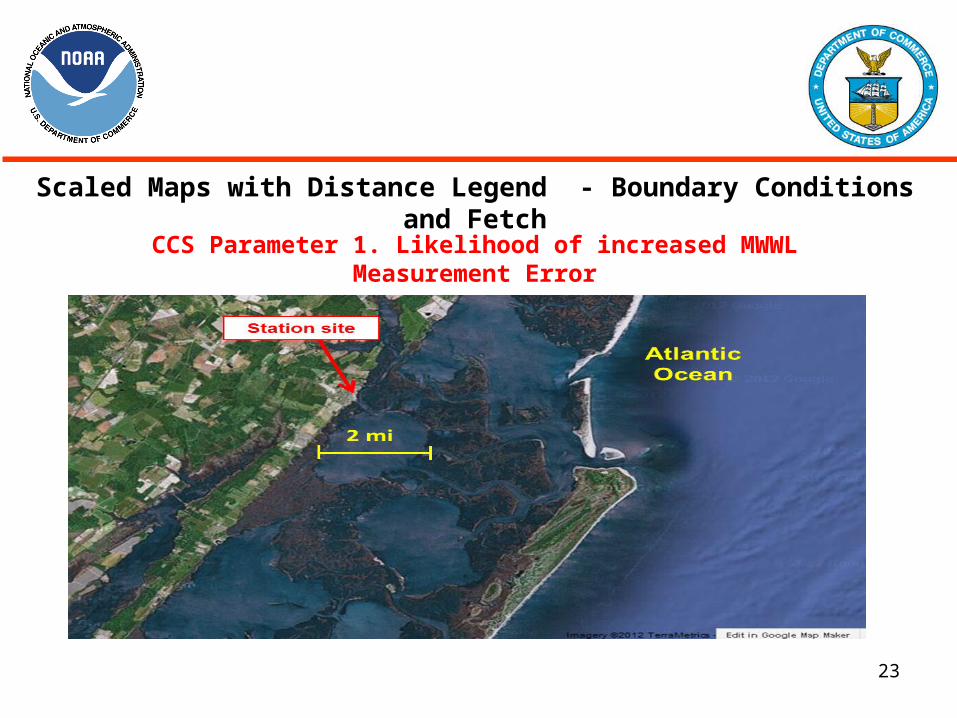
Scaled Maps with Distance Legend - Boundary Conditions and Fetch
CCS Parameter 1. Likelihood of increased MWWL Measurement Error
23
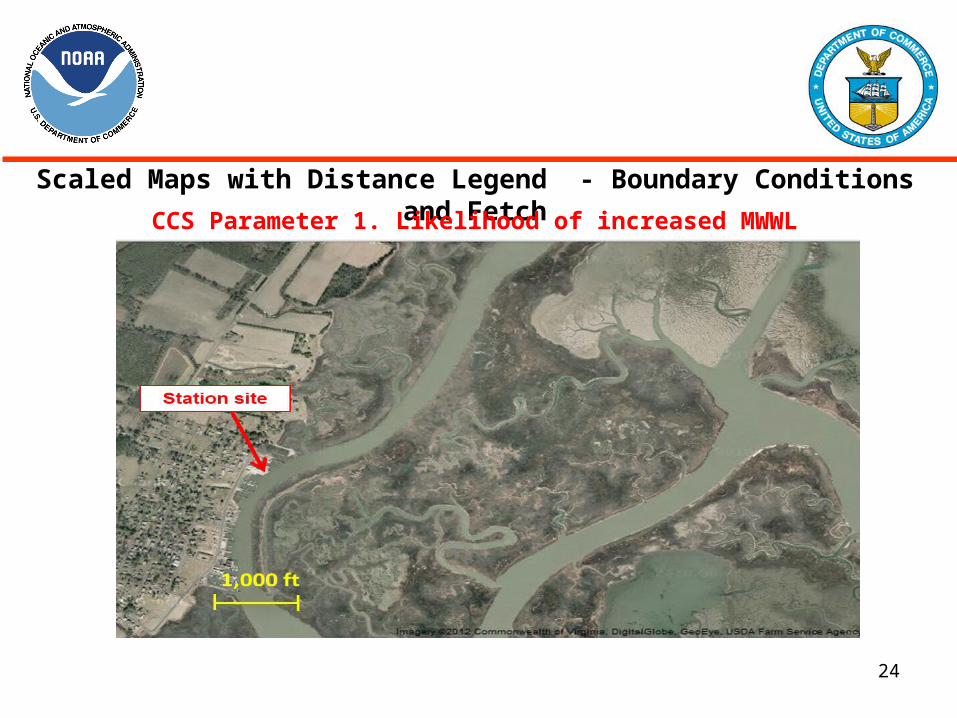
Scaled Maps with Distance Legend - Boundary Conditions and Fetch CCS Parameter 1. Likelihood of increased MWWL Measurement Error
24
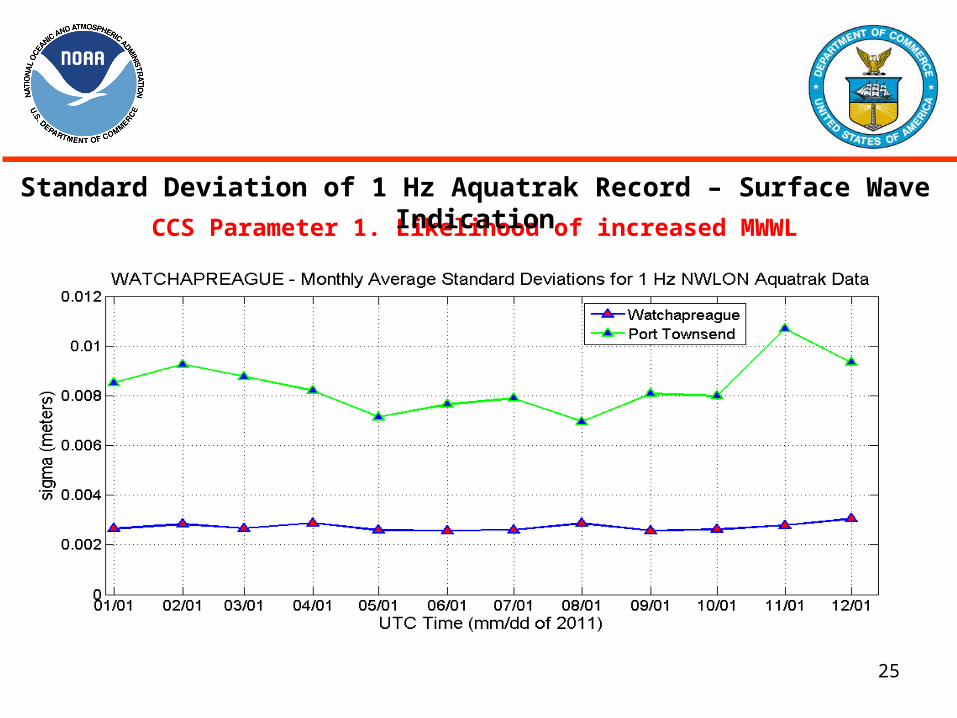
CCS Parameter 1. Likelihood of increased MWWL Measurement Error
Standard Deviation of 1 Hz Aquatrak Record – Surface Wave Indication
25
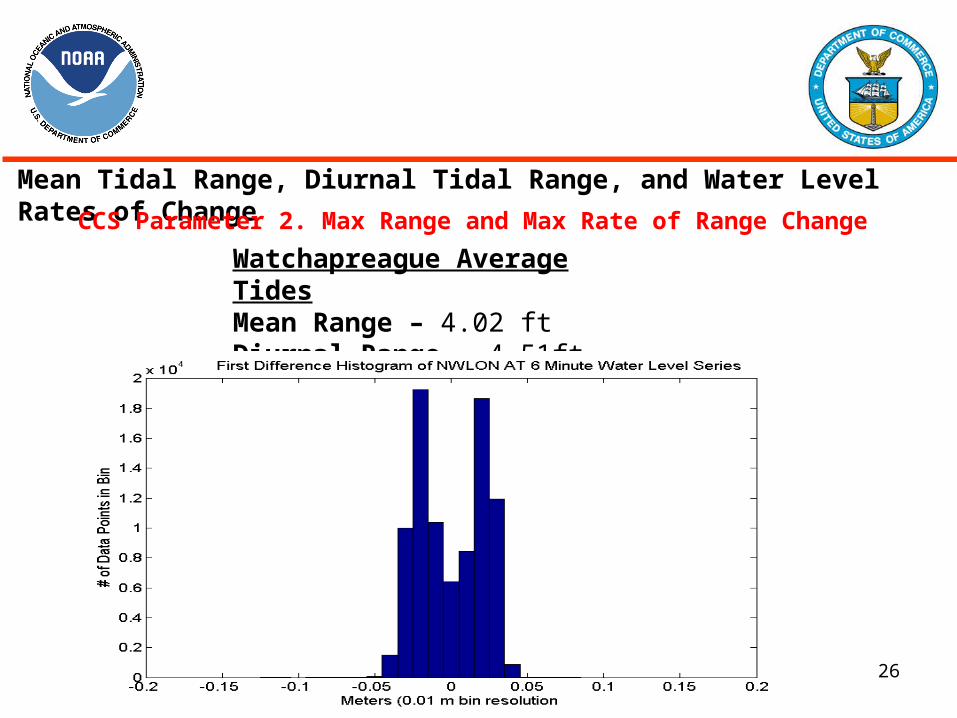
Mean Tidal Range, Diurnal Tidal Range, and Water Level Rates of Change
CCS Parameter 2. Max Range and Max Rate of Range Change
Watchapreague Average TidesMean Range – 4.02 ft Diurnal Range – 4.51ft
26
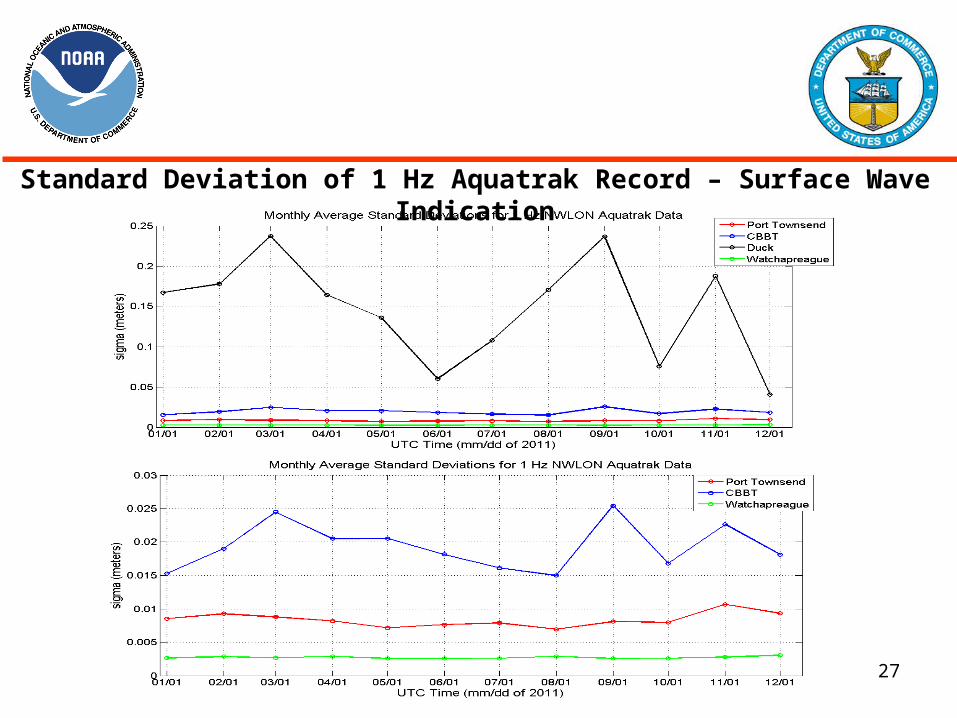
Standard Deviation of 1 Hz Aquatrak Record – Surface Wave Indication
27