Embed Size (px)
Citation preview

1IFLA Satellite 14/8/02
Putting Statistics into Practice -
Strategies for effective management
J Eric Davies & Claire Creaser

2IFLA Satellite 14/8/02
Options for measuring & managing
J Eric Davies

3IFLA Satellite 14/8/02
Outline
• Mission, vision, aims objectives• Range of data types• Applications of data• Methods of acquiring data• General principles

4IFLA Satellite 14/8/02
Measuring with meaning
• Every organisation, no matter what its mission or scope needs three kinds of performance metrics -
• to measure its success in mobilizing its resources,
• its staff’s effectiveness on the job, and • its progress in fulfilling its mission.
– McKinsey Quarterly. 2001 -2

5IFLA Satellite 14/8/02
STRATEGIC FOCUS
• WHAT -• Organisation? NOW / LATER• Service? NOW / LATER • Direction? NOW / LATER
•Mission / Vision•aims / objectives
Mission with meaning

6IFLA Satellite 14/8/02
AIMS/OBJECTIVESSpecific MeasurableAcceptable Realistic
Time-bound {SMART}
Consistent UnambiguousTesting Empowering
{CUTE}
Criteria

7IFLA Satellite 14/8/02
MISSION• Statement of purpose and functions – why
service exists, what it does, who it serves
VISION• Statement of desired future state – where
service wants to be
How (im)possible is your mission?

8IFLA Satellite 14/8/02
How (im)possible is your mission?
MISSION/VISION STATEMENTS ~
• MEANING• CREDIBILITY• ACCEPTABILITY• TESTABILITY

9IFLA Satellite 14/8/02
MISSION/VISION STATEMENTS ~MISSION/VISION STATEMENTS ~
Strathclyde University – GlasgowStrathclyde University – Glasgow
• A place of useful learningA place of useful learning [1726][1726]
• The place of useful learningThe place of useful learning [2000] [2000]
How (im)possible is your mission?

10IFLA Satellite 14/8/02

11IFLA Satellite 14/8/02
Here’s one I prepared earlier!
MISSION/VISION STATEMENTS ~• Public Library - The mission of the Library is to
serve as a cathedral of human knowledge— an accessible database of knowledge that serves as the community's memory—and as an information and knowledge safety net, while providing materials, programs, and services to the people of the community.

12IFLA Satellite 14/8/02
Digging deep for evidence
What Kind Of Evidence [Information]?
• Statistics and Performance Indicators– [Quantitative + Qualitative ]
• Social Measures– [Soft Indicators] ‘DISTANCE TRAVELLED’

13IFLA Satellite 14/8/02
Who cares {or should do}?
AUDIENCE: [stakeholders]• Funders • Managers/Staff • Users • Community• Vendors• Global

14IFLA Satellite 14/8/02
All kinds of measuring
• Inputs SERVICE DOMAIN
• Outputs
• Outcomes USER RESPONSES
• Impacts
service

15IFLA Satellite 14/8/02
Social dimensions
Examples of ‘Soft’ Indicators:-
• Attitudinal• Personal • Practical • Key Work Skills
DISTANCE TRAVELLED

16IFLA Satellite 14/8/02
Social dimensions
• Personal development - individual self-confidence, self awareness, creativity, new skills and abilities.
• Social cohesion - Impact on group/community identity
• Community involvement and empowerment -
• Health - people feeling better, happier etc.

17IFLA Satellite 14/8/02
How does the evidence add up?
APPLICATIONS ~ SERVICES & PROJECTS• Policies• Strategies• Tactics• Processes and • Operations • Advocacy

18IFLA Satellite 14/8/02
What does the evidence answer?
APPLICATIONS ~ SERVICES• How have we done? • How are we doing now?• How can we do better?• Where are we going?• How do we get there?• How are we making a difference?• How do we get the resources

19IFLA Satellite 14/8/02
What does the evidence answer?APPLICATIONS ~ PROJECTS• Did we achieve what we were seeking to
achieve?• Did we do what we said we would do?• How did we do it?• What did we use?• What did we get out?• What worked and what didn’t work?• What could we do differently?• What can we apply continuously? • What difference did it make that we did it?• Who benefited?

20IFLA Satellite 14/8/02
Managing and measuring
Framework for Performance Measurement:-• integration • user satisfaction • effectiveness (delivery) • efficiency • economy
Follett Report – academic libraries

21IFLA Satellite 14/8/02
Managing and measuring
Three E’s – Economy in acquisition of resources
– Efficiency in the use of resources
– Effectiveness in the achievement of objectives
UK Treasury [1980’s] FMI Sizer [1980’s]

22IFLA Satellite 14/8/02
Comparing and changing
• BENCHMARKING– Motorola + D.E.C. + Xerox
– To make changes that lead to quantum and continuous improvements in products, processes and services that result in total customer satisfaction and competitive advantage

23IFLA Satellite 14/8/02
Comparing and changing
BENCHMARKING –
• Evaluate the level of performance of various services within an institution
• Overall level of institution performance
• Compare against published standards• Compare performance over time• Compare with other institutions
24IFLA Satellite 14/8/02
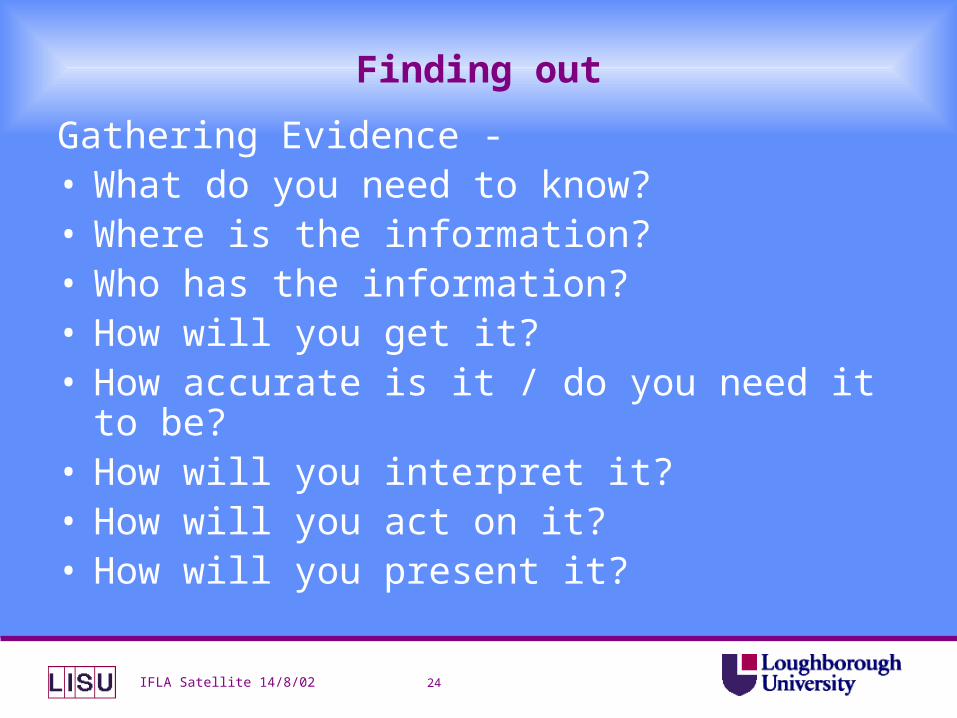
Finding out
Gathering Evidence -• What do you need to know?• Where is the information?• Who has the information?• How will you get it?• How accurate is it / do you need it to be?• How will you interpret it?• How will you act on it?• How will you present it?

25IFLA Satellite 14/8/02
Gathering evidence
Techniques/Tools/Options for Gathering Data:-
• MIS / Transaction Logs• Databases / Publications • Surveys : questionnaire,telephone,
interview• Focus Groups / Graffiti boards• Observation / Diaries / Logs • Press~Media Coverage

26IFLA Satellite 14/8/02
Gathering evidence
TOOLS:-
• What Outcomes, Dimensions, Performance to be measured?
– reliable + valid– meaningful and precise

27IFLA Satellite 14/8/02
Gathering evidence
Options for Gathering Data -• … if the only tool you have is a hammer,
everything starts looking like a nail.
F.W. Huibregston - Partner: McKinsey’s

28IFLA Satellite 14/8/02
Changing times; changing evidence
UPDATING EVIDENCE • Service Evolution
– New/Discontinued services - methods - technologies - clients
• Diminishing Variance
– Improvement - Gaming - Deception

29IFLA Satellite 14/8/02
Manager beware!!
OVERDOING IT:
If you know everything, you know nothingGeorge Johnson: Fire in the Mind. [1996]
… a world that never measures or counts is really beyond our control. The trouble is that we’re in danger of doing little else.David Boyle: RSA Lecture . [2001]

30IFLA Satellite 14/8/02
How much evidence?
... data is not information. Information is data endowed with relevance and purpose. A company must decide what information it needs to operate its affairs, otherwise it will drown in data
Peter Drucker - Managing for the Future.

31IFLA Satellite 14/8/02
Making sense of measuring
Sumsion’s Law of Statistical Dullness ~
In comparative statistics the great majority of results are inherently close to the average and consequently dull.
{Sumsion}LIRN 2001 (79) p.3.

32IFLA Satellite 14/8/02
Evidence for yesterday
Statistics, being essentially historical, can only provide information after the event.
{Sumsion}Int. Encyclopedia of Lib. and Info. Sci.
(1997)p.432

33IFLA Satellite 14/8/02
Measuring and managing
Information is a precondition for identifying choices, reducing uncertainty about their implications and facilitating their implementation.
Center for Transnational Corporations:- CTC Reporter 14 Winter 1983 p.34 -

34IFLA Satellite 14/8/02
Managing and measuring; comparing and changing
• LISU: We’ve got the measure of information!
– A skilled team of experienced Managers, Statisticians and Administrators all adding value to statistical data and providing authoritative and reliable information to support managers in culture, information and related environments.

36IFLA Satellite 14/8/02
Mission possibilities
• Does it have– Meaning?
• Does it actually mean anything?
– Credibility• Do you believe it can be achieved?
– Acceptability• Will all the stakeholders (funders, staff, users) ‘buy-in’
to this mission?
– Testability• How would you demonstrate you are achieving your
mission?

38IFLA Satellite 14/8/02
Statistics for the faint hearted
Claire Creaser CStat

39IFLA Satellite 14/8/02
Introduction to statistics
• Basics– What are statistics– Useful techniques
• Sampling– Surveys and sample sizes– Questionnaire design– Analysis
• Benchmarking• Presentation of results

40IFLA Satellite 14/8/02
What are statistics?
• Numbers with context– 1,300 items issued last month– The average price paid for a CD is £12.50– 25% of staff time is spent re-shelving books– Women borrow twice as many books on
average as men– Serials cost three times as much as books– The average spend per user has increased less
than general inflation over the last ten years
41IFLA Satellite 14/8/02
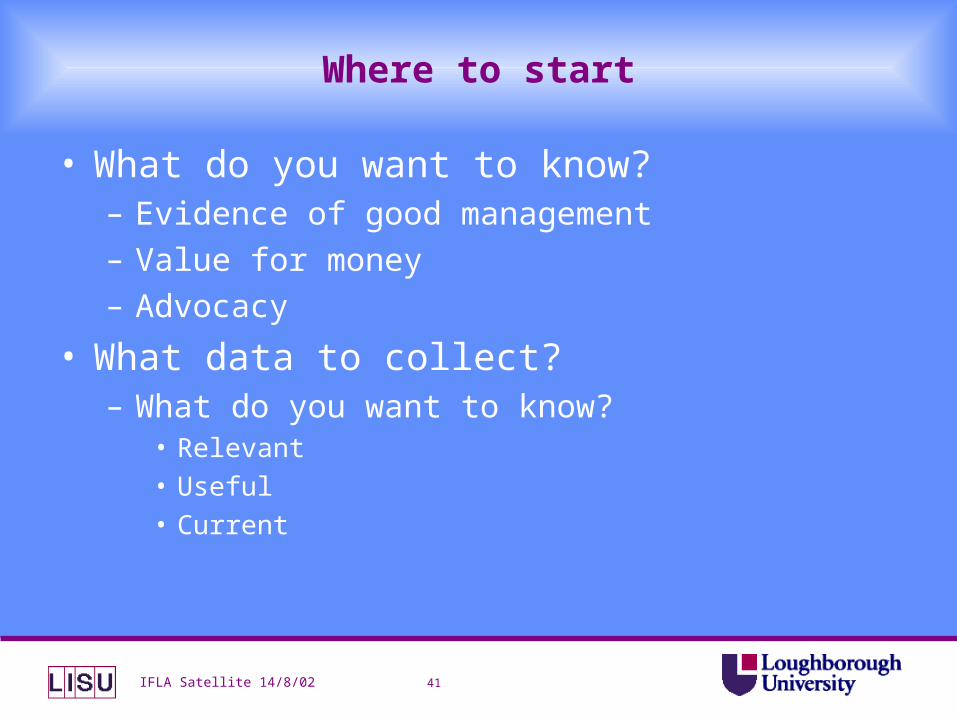
Where to start
• What do you want to know?– Evidence of good management– Value for money– Advocacy
• What data to collect?– What do you want to know?
• Relevant• Useful• Current

42IFLA Satellite 14/8/02
Where do they come from?
• Library management systems– Stock statistics, financial data, staff . . . .
• Regular surveys– User opinions, condition of stock . . . .
• Occasional surveys– Project evaluation

43IFLA Satellite 14/8/02
What do they look like?
• Categorical– Gender; classmark; membership status
• Ordinal– Stock condition; satisfaction ratings
• Ratio or interval– Acquisitions; issues; expenditure

44IFLA Satellite 14/8/02
What can you do with them?
• What do you want to know?• Descriptive statistics
– Mean, range, distributions, proportions– graphical presentations
• Inference from samples– Estimates, error levels
• Advanced techniques– Correlation, regression, analysis of variance

45IFLA Satellite 14/8/02
Choosing the right technique
• Keep it simple!• Categorical data
– Proportions in each category– Comparisons
• Ordinal data– Proportions in each category– Medians
• Ratio data– Means

46IFLA Satellite 14/8/02
Sample surveys
• Why sample?– Cost– Practicalities
• Where to start?– Sampling frame– Sample design– Sample size

47IFLA Satellite 14/8/02
Types of sample
• Simple random• Systematic• Stratification and clustering• Quota samples• Self-selected

48IFLA Satellite 14/8/02
How many?
• Less than you think!• Depends on:
– Level of detail– Desired margin of error– Expected response rate
• Does not depend on population size – Unless small population
• 400 will give accuracy of ± 5%• 1,000 for ± 3%• 2,500 for ± 2%

49IFLA Satellite 14/8/02
Questionnaire design
• Self-completion or interview?• Clear, unambiguous questions• Clear, easy to follow layout• As short as possible
– Number of questions– Number of pages
• Tick boxes or short answers• Data entry issues

50IFLA Satellite 14/8/02
Sampling times
• One period, or several?• Periodicity

51IFLA Satellite 14/8/02
Analysis
• Lots of software available– Spreadsheets
• Excel, Lotus
– Specialist packages• SPSS, Minitab
• Keep it simple!• If in doubt
– bring in a statistician!

52IFLA Satellite 14/8/02
Making comparisons - benchmarking
• Compare like with like!• Within your service
– Performance of service points– Behaviour of user groups
• Externally– National standards– Other libraries
• Over time– Trends

53IFLA Satellite 14/8/02
Presentation of results
• Appropriate to– The data type– The audience
• Tables or graphs?• Key features:
– Clarity– Integrity– Descriptive– Appropriateness

54IFLA Satellite 14/8/02
Graphical forms
• Line graphs– For presenting trends over time
• Pie charts– For presenting proportions of a whole
• Bar or column charts– For comparing categories
• Scatter graphs– For examining relationships

55IFLA Satellite 14/8/02
Issues per capita in UK public librariesAdult Adult Child-
fiction non- ren's AV fiction
89-90 333 129 105 2690-91 326 129 105 2891-92 325 138 113 3092-93 314 136 112 3193-94 303 136 112 3394-95 289 133 112 3495-96 275 129 110 3696-97 261 127 111 3797-98 246 122 111 3798-99 234 114 109 3899-00 221 107 101 38
Source: LISU Annual Library Statistics

56IFLA Satellite 14/8/02
Breakdown of UK academic library expenditure
Staff £128mInformation £92m
Of which:Books £27.0mSerials £48.6mElectronic £8.4mILL £3.5mBinding £4.9m
Equipment £20mOther £17m
Source: LISU Annual Library Statistics

57IFLA Satellite 14/8/02
Activity in public libraries
Proportion of visitors who:Borrow/return books 74.2%Borrow return cassettes 7.0%Borrow/return CDs 4.9%Borrow/return videos 8.4%Read newspapers 13.8%Seek information 22.9%Use photocopier 6.0%Browse 29.9%Study 7.7%Visit event 2.9%Other 7.8%
Source: CIPFA Public Library User Survey

58IFLA Satellite 14/8/02
Public library book acquisitions and issues
Acquisitions IssuesA1 12,242 630,788B1 10,730 472,514B2 7,184 424,045B3 8,121 413,133B4 6,075 474,982C1 2,895 297,387C2 4,155 328,578C3 3,572 225,841C4 4,940 267,913D1 1,488
98,050D2 1,435
70,349D3 2,471
113,049 … … … Source: UK public library authority data, unpublished

60IFLA Satellite 14/8/02
Managing scenarios, strategies andstatistics in practice
• What do you need to know?• Where is the information?• Who has the information?• How will you get it?• How will you interpret it?• How will you act on it?• How will you present it?

62IFLA Satellite 14/8/02
ISI Glossary
Access from
http://europa.eu.int/comm/eurostat/research/index.htm