Embed Size (px)
Citation preview
1
Health inequalities: underlying factors and different ways of
addressing them
2
• health is unequally distributed in Europe – between and within countries
• focus here on health inequalities within countries, between socioeconomic groups
• highlight 5 key points
3
1. Health inequalities exist in all European countries
4
0
5
10
15
20
death
rate
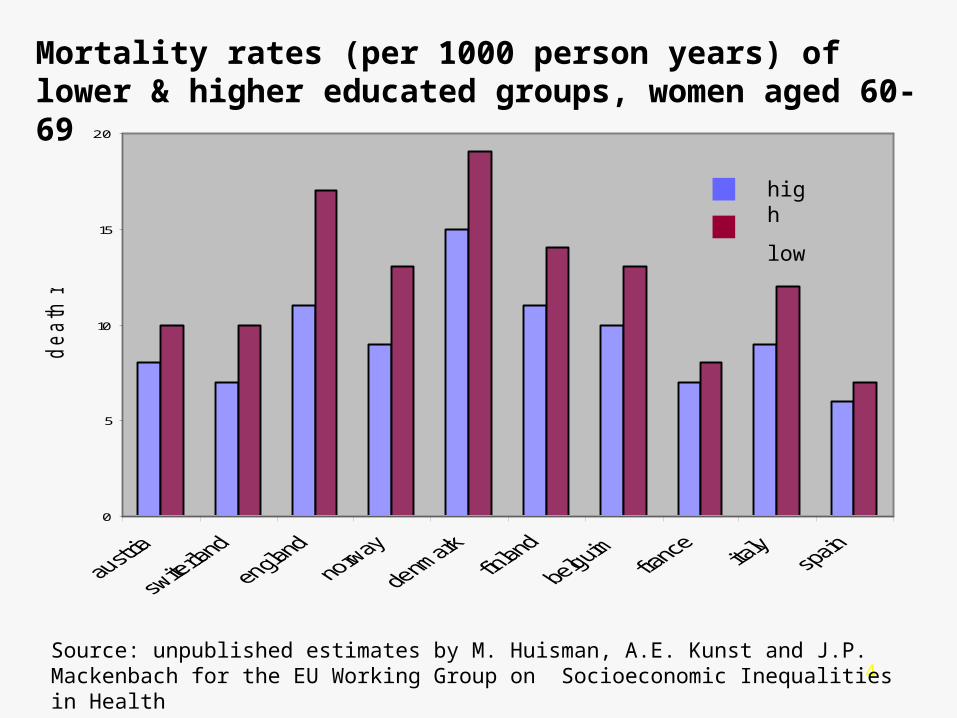
Mortality rates (per 1000 person years) of lower & higher educated groups, women aged 60-69
Source: unpublished estimates by M. Huisman, A.E. Kunst and J.P. Mackenbach for the EU Working Group on Socioeconomic Inequalities in Health
high
low
5
0
5
10
15
20
25
30
35
death
rate
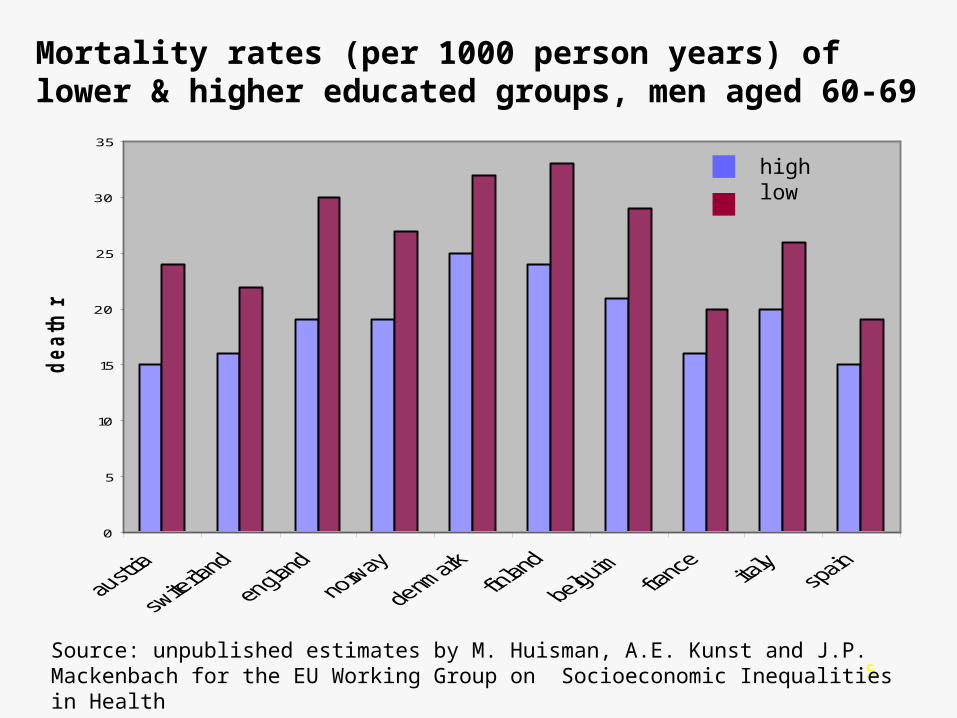
Mortality rates (per 1000 person years) of lower & higher educated groups, men aged 60-69
Source: unpublished estimates by M. Huisman, A.E. Kunst and J.P. Mackenbach for the EU Working Group on Socioeconomic Inequalities in Health
highlow
6
2. Health inequalities take the form of a social gradient
7
0
5
10
15
20
25
30
35
40
higher secondary basic
educational level
%
men women
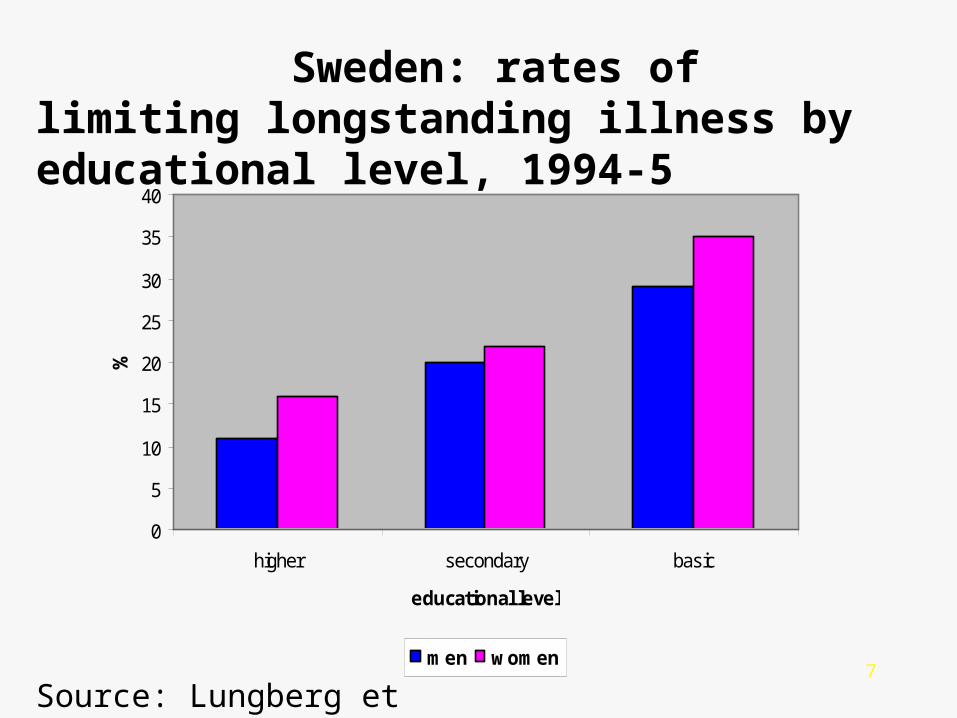
Sweden: rates of limiting longstanding illness by educational level, 1994-5
Source: Lungberg et al, 2001
8
0
5
10
15
20
25
30
35
I II IIInm IIIm IV V
socioeconomic group
%
men women
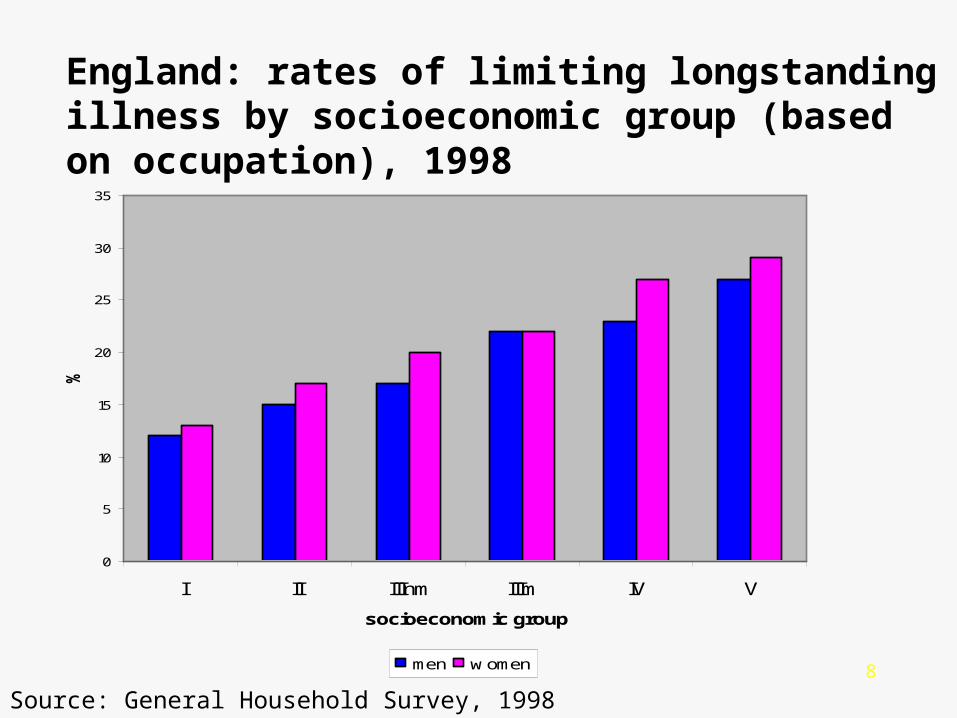
England: rates of limiting longstanding illness by socioeconomic group (based on occupation), 1998
Source: General Household Survey, 1998
9
3. Health inequalities reflect inequalities in the distribution of
health determinants
10
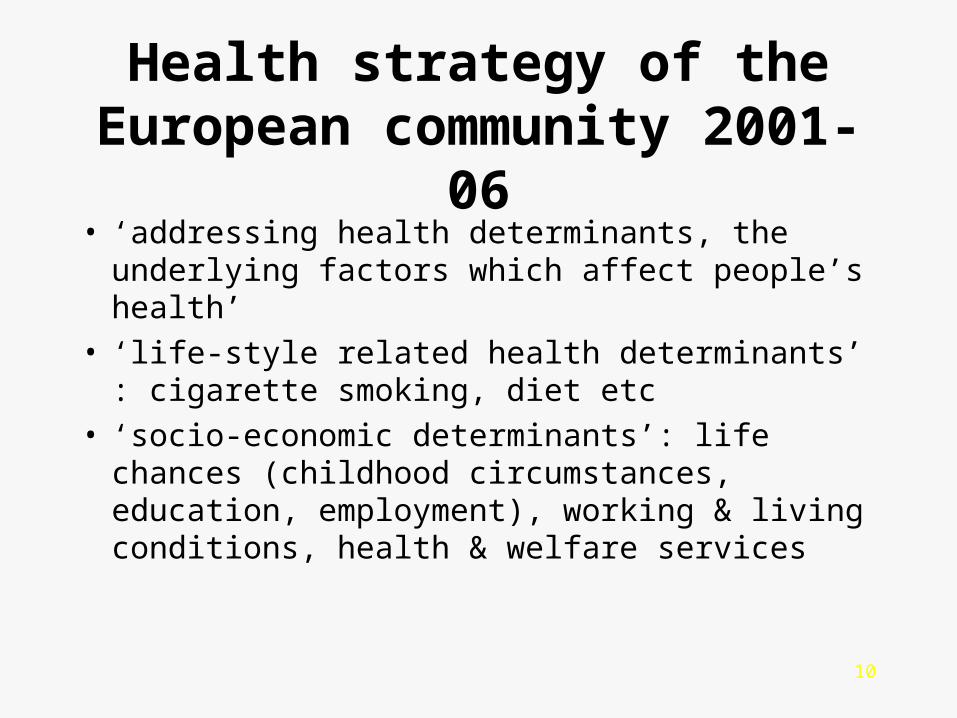
Health strategy of the European community 2001-06
• ‘addressing health determinants, the underlying factors which affect people’s health’
• ‘life-style related health determinants’ : cigarette smoking, diet etc
• ‘socio-economic determinants’: life chances (childhood circumstances, education, employment), working & living conditions, health & welfare services
11
What is important about these determinants for health inequalities is
their social distribution
• health determinants display a socioeconomic gradient
12
0
10
20
30
40
poor play space poor adult workenvironment
adult smoking
I/II IIInm IIIm IV/V
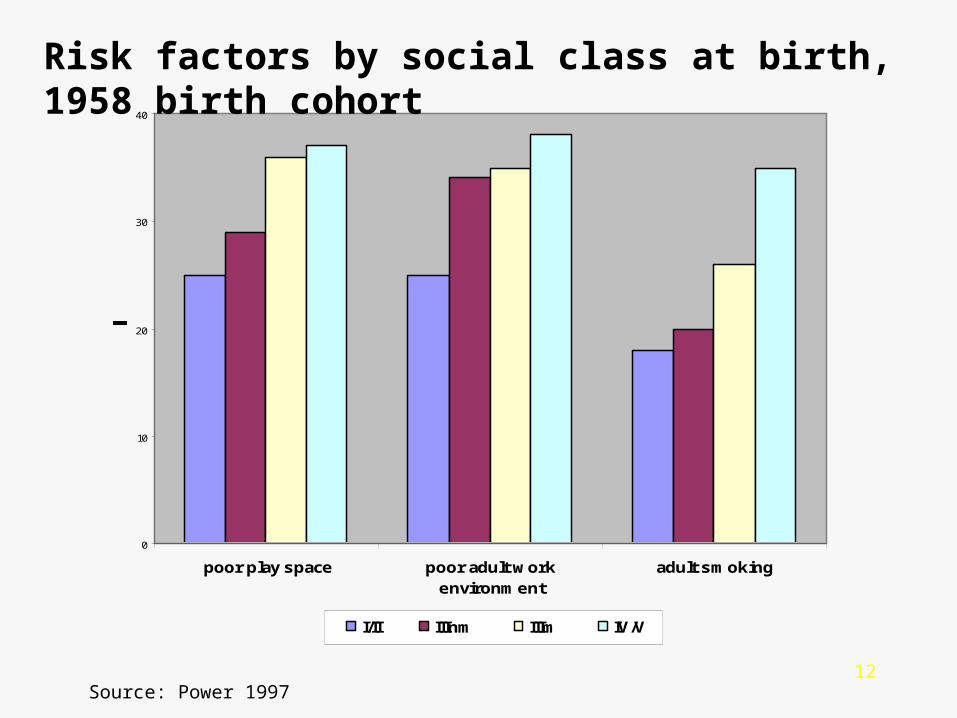
Risk factors by social class at birth, 1958 birth cohort
Source: Power 1997
13
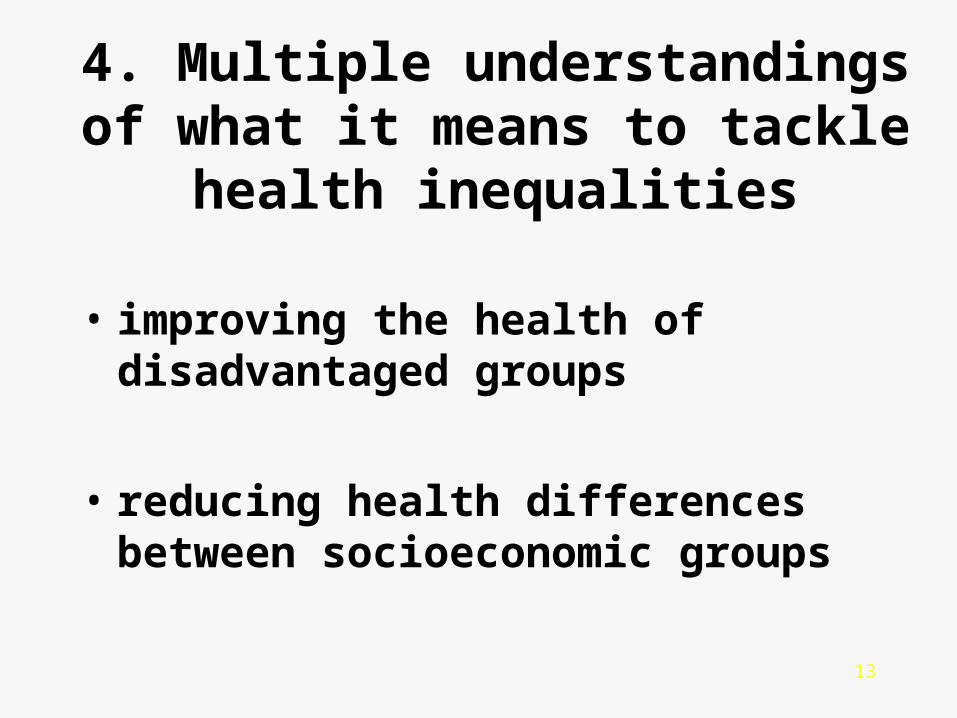
4. Multiple understandings of what it means to tackle health inequalities
• improving the health of disadvantaged groups
• reducing health differences between socioeconomic groups
14
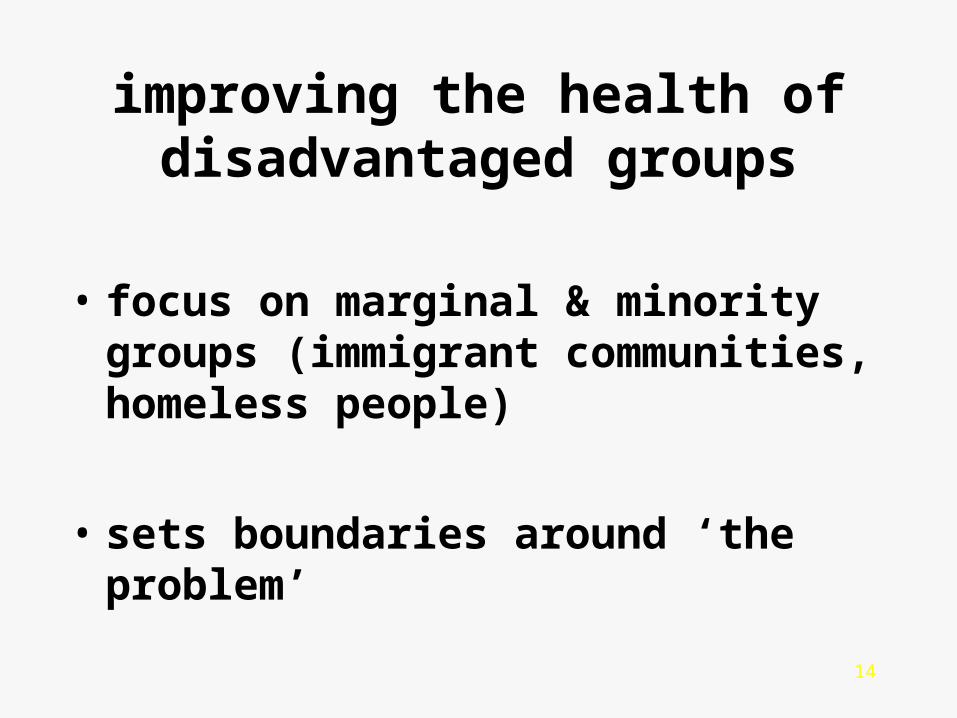
improving the health of disadvantaged groups
• focus on marginal & minority groups (immigrant communities, homeless people)
• sets boundaries around ‘the problem’
15
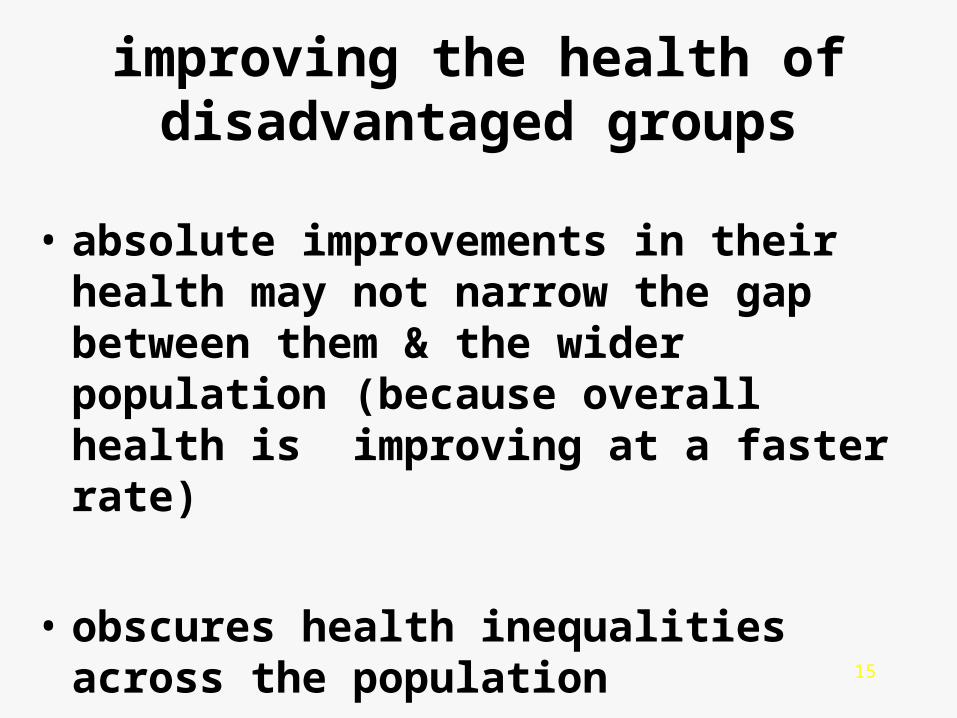
improving the health of disadvantaged groups
• absolute improvements in their health may not narrow the gap between them & the wider population (because overall health is improving at a faster rate)
• obscures health inequalities across the population
16
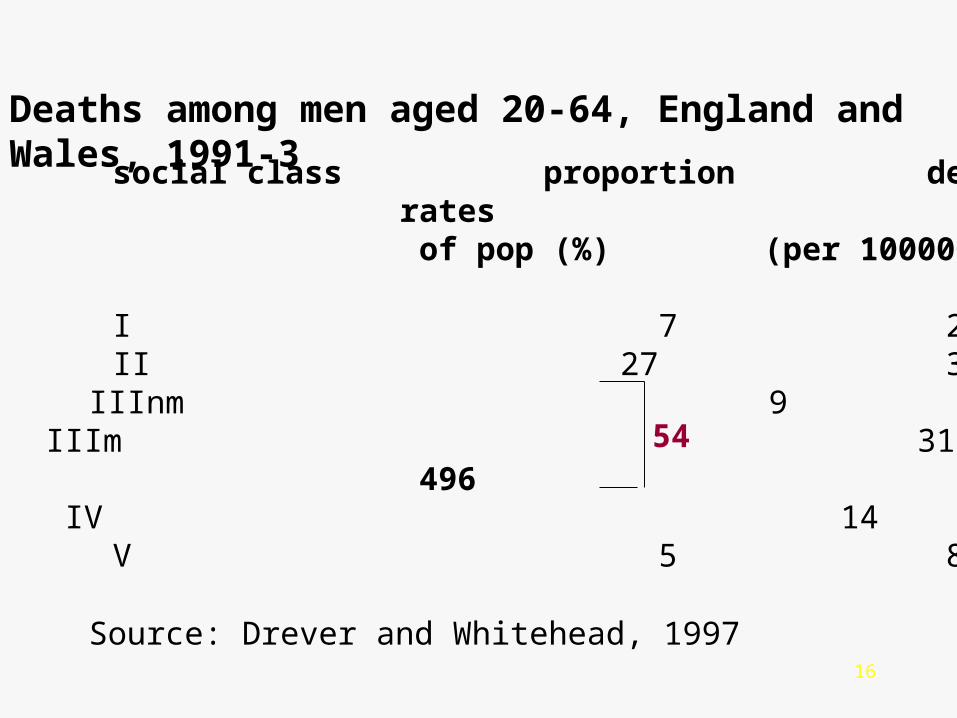
social class proportion death rates
of pop (%) (per 100000)
I 7282
II 27302
IIInm 9432
IIIm 31496
IV 14500
V 5816
54
Source: Drever and Whitehead, 1997
Deaths among men aged 20-64, England and Wales, 1991-3
17
reducing health differences between socioeconomic groups
• encompasses goals of improving poor & poorer health of most disadvantaged
• tackling health inequalities is a population-wide strategy
• policies which equalise the distribution of health determinants
• too ambitious - or in line with welfare policy?
18
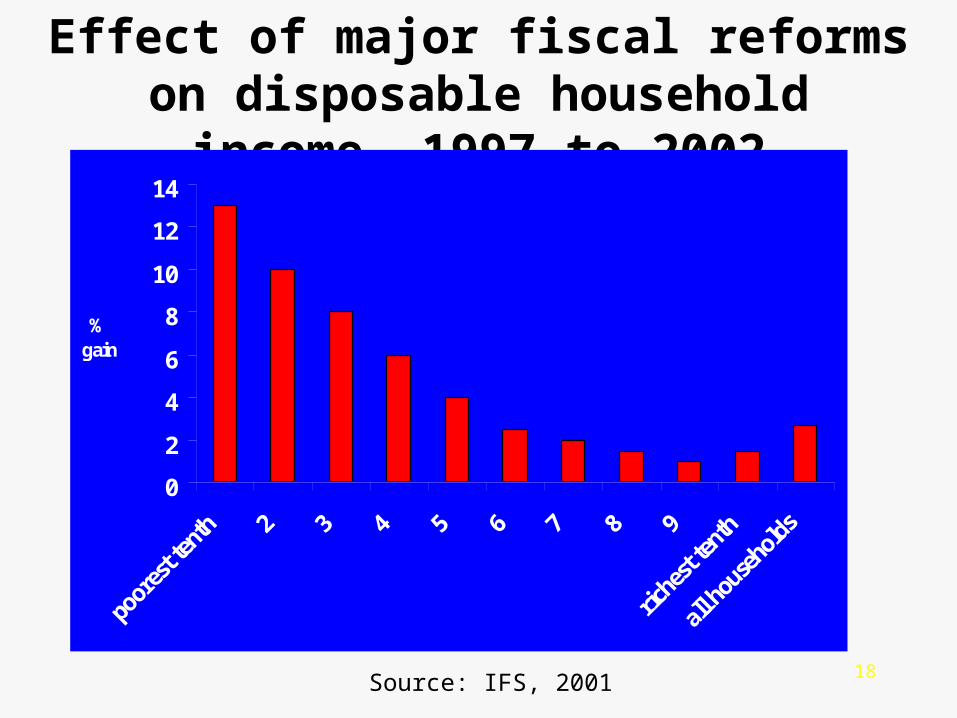
Effect of major fiscal reforms on disposable household income, 1997 to 2002
0
2
4
6
8
10
12
14
poor
est t
enth 2 3 4 5 6 7 8 9
riche
st te
nth
all h
ouse
hold
s
% gain
Source: IFS, 2001
19
5. Tackling health inequalities requires multi-sectoral commitment
• health inequalities reflect the unequal distribution of health determinants
• broader social and policy changes are often widening inequalities in key determinants
• new interventions & existing policies will have an impact on the distribution of health determinants
20
Getting and keeping health inequalities on the policy agenda is a key challenge
for an enlarged Europe

21
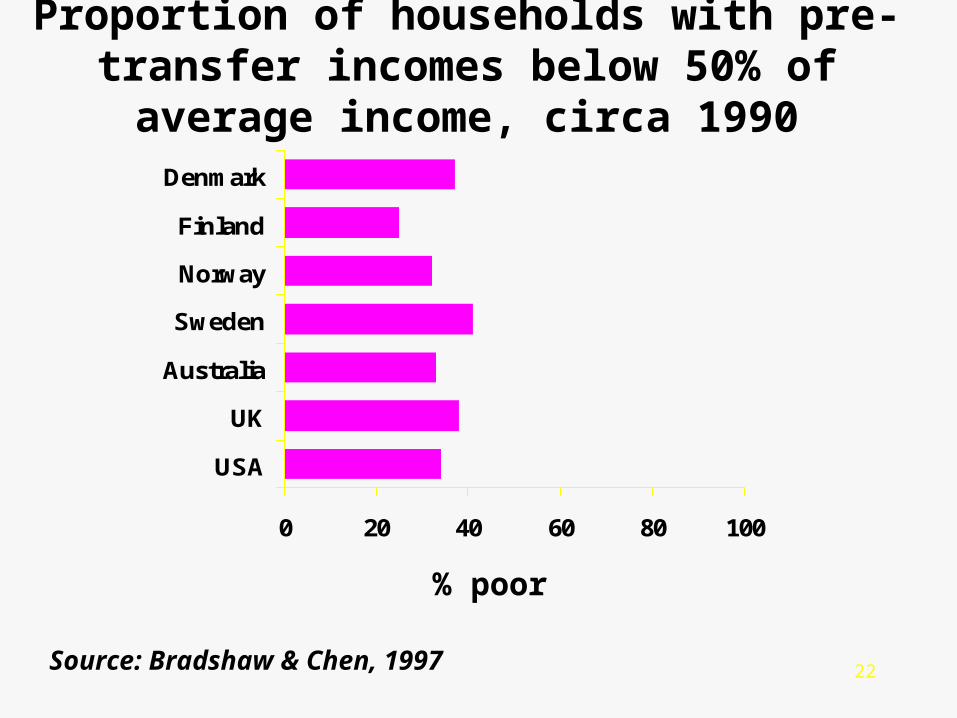
22
Proportion of households with pre-transfer incomes below 50% of average income, circa 1990
0 20 40 60 80 100
USA
UK
Australia
Sweden
Norway
Finland
Denmark
% poor
Source: Bradshaw & Chen, 1997
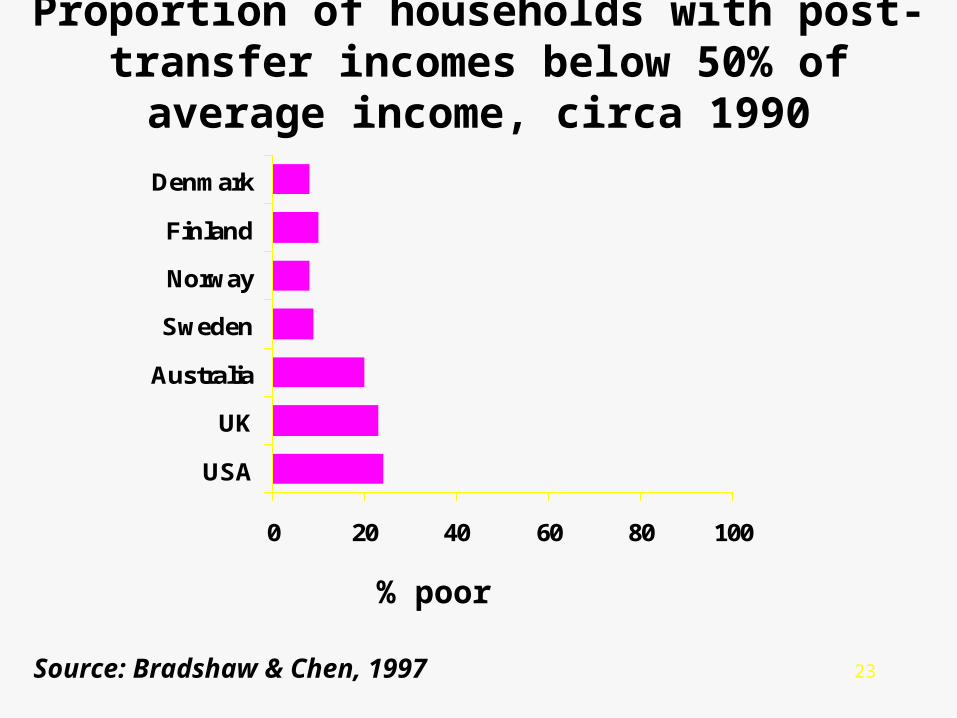
23
Proportion of households with post-transfer incomes below 50% of average income, circa 1990
0 20 40 60 80 100
USA
UK
Australia
Sweden
Norway
Finland
Denmark
% poor
Source: Bradshaw & Chen, 1997
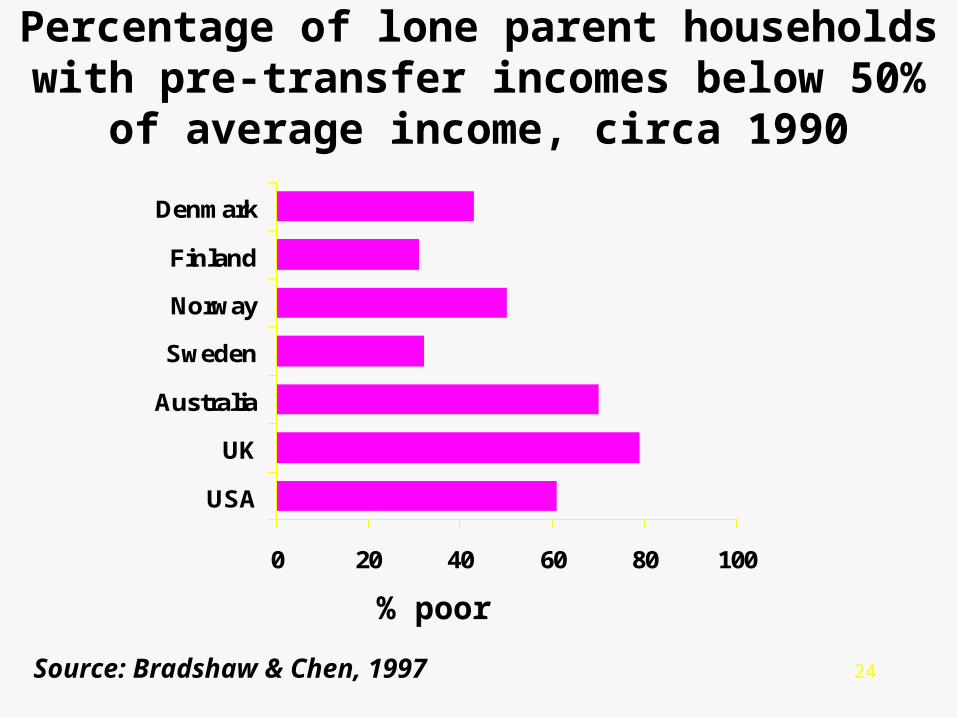
24
Percentage of lone parent households with pre-transfer incomes below 50% of average income,
circa 1990
0 20 40 60 80 100
USA
UK
Australia
Sweden
Norway
Finland
Denmark
% poor
Source: Bradshaw & Chen, 1997
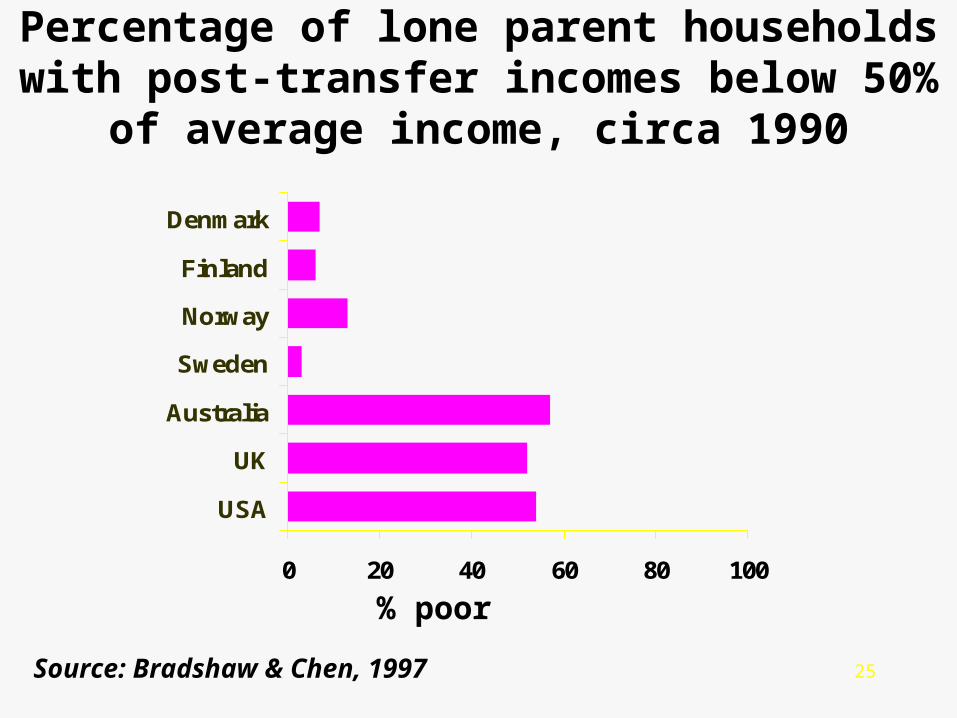
25
Percentage of lone parent households with post-transfer incomes below 50% of average income,
circa 1990
0 20 40 60 80 100
USA
UK
Australia
Sweden
Norway
Finland
Denmark
% poor
Source: Bradshaw & Chen, 1997
26
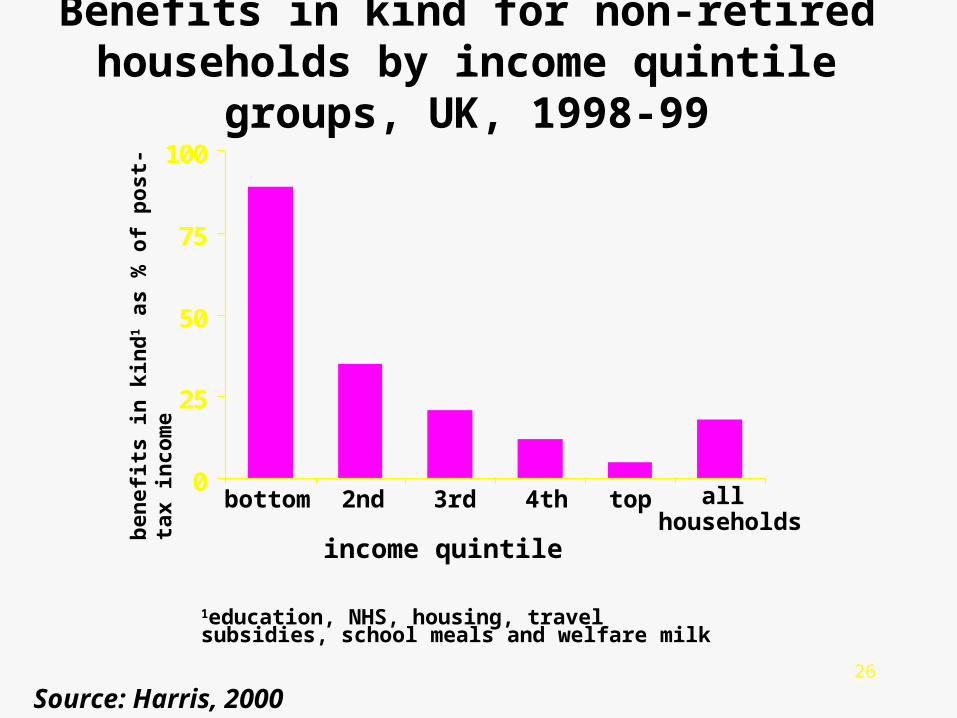
Benefits in kind for non-retired households by income quintile groups, UK, 1998-99
0
25
50
75
100
bottom 2nd 3rd 4th top all householdsb
enef
its
in k
ind
1 as
% o
f p
ost
-tax
inco
me
income quintile
Source: Harris, 2000
1education, NHS, housing, travel subsidies, school meals and welfare milk
27
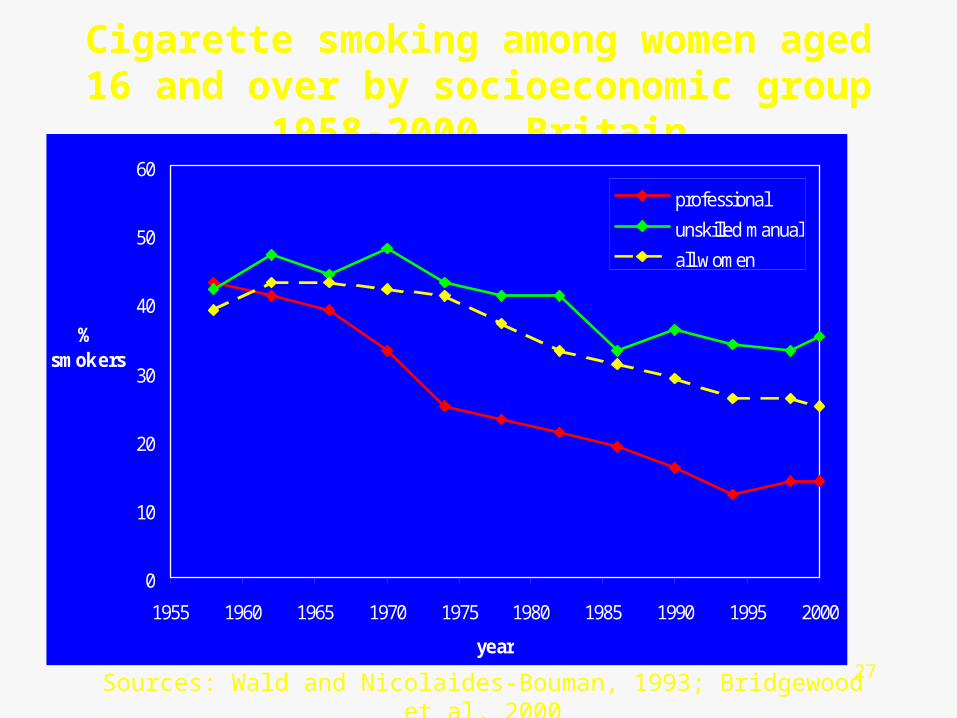
Cigarette smoking among women aged 16 and over by socioeconomic group 1958-2000, Britain
Sources: Wald and Nicolaides-Bouman, 1993; Bridgewood et al, 2000
0
10
20
30
40
50
60
1955 1960 1965 1970 1975 1980 1985 1990 1995 2000
ye ar
% smoke rs
professional
unskilled manual
all women