Embed Size (px)
Citation preview
1
FinanceFinance School of Management School of Management
Chapter 13: The Capital Asset Chapter 13: The Capital Asset Pricing ModelPricing Model
Objective• The Theory of the CAPM
• Use of CAPM in benchmarking• Using CAPM to determine
correct rate for discounting
2
FinanceFinance School of Management School of Management
Chapter 13 ContentsChapter 13 Contents
The Capital Asset Pricing Model in Brief Determining the Risk Premium on the Market Portfolio Beta and Risk Premiums on Individual Securities Using the CAPM in Portfolio Selection Valuation & Regulating Rates of Return Modifications and Alternatives to the CAPM
3
FinanceFinance School of Management School of Management
IntroductionIntroduction
CAPM is a theory about equilibrium prices in the markets for risky assets.
It is important because it provides– A justification for the widespread practice of passive
investing called indexing, and
– A way to estimate expected rates of return for use in evaluating stocks and projects.
4
FinanceFinance School of Management School of Management
The Capital Asset Pricing Model in BriefThe Capital Asset Pricing Model in Brief
CAPM is an equilibrium theory based on the theory of portfolio selection.
The basic question:
What would risk premiums on securities be in equilibrium if people had the same set of forecasts of expected returns and risks, and all chose their portfolios optimally according to the principles of efficient
diversifications?
5
FinanceFinance School of Management School of Management
Assumptions of CAPMAssumptions of CAPM
Assumption 1 (homogeneous in information processing)
Investors agree in their forecasts of expected rates of return, standard deviation, and correlations of the risky securities.
Assumption 2 (homogeneous in behavior)
Investors generally behave optimally according to the theory of portfolio selection.
6
FinanceFinance School of Management School of Management
Intuitive of CAPM Intuitive of CAPM
All the investors will allocate their investments between the riskless asset and the same tangent portfolio.
In equilibrium, the aggregate demand for each security is equal to its supply.
The only way the asset market can clear is if the relative proportions of risky assets in tangent portfolio are the proportions in which they are valued in the market place, i.e. the market portfolio.
7
FinanceFinance School of Management School of Management
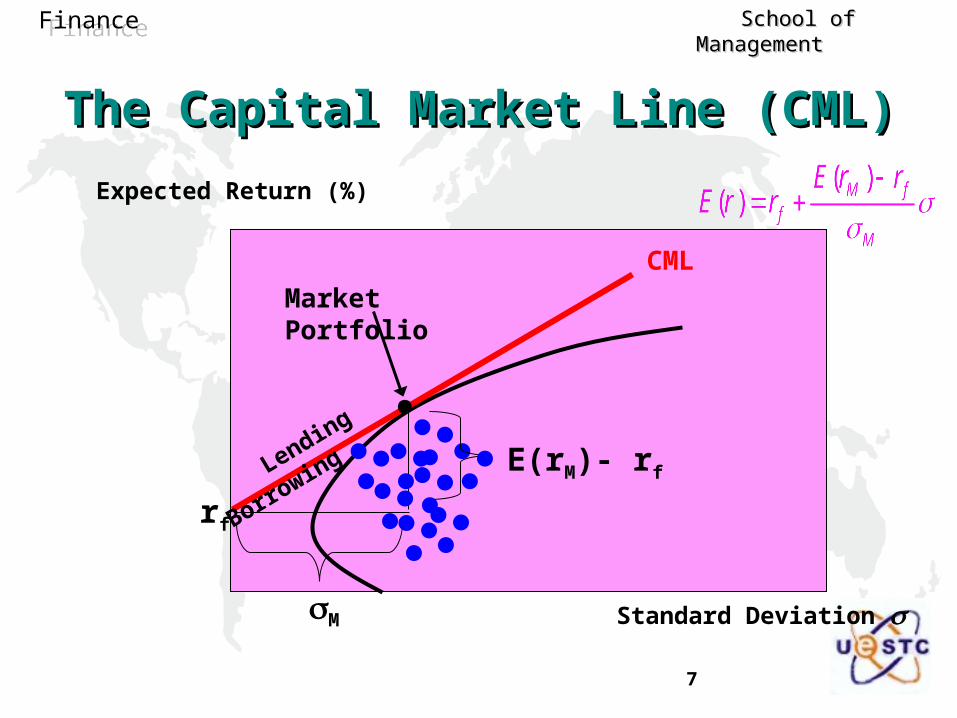
Expected Return (%)
rf
The Capital Market Line (CML)The Capital Market Line (CML)
Standard Deviation
Lending
Borrowing
M
CML
Market Portfolio
●
E(rM)- rf
8
FinanceFinance School of Management School of Management
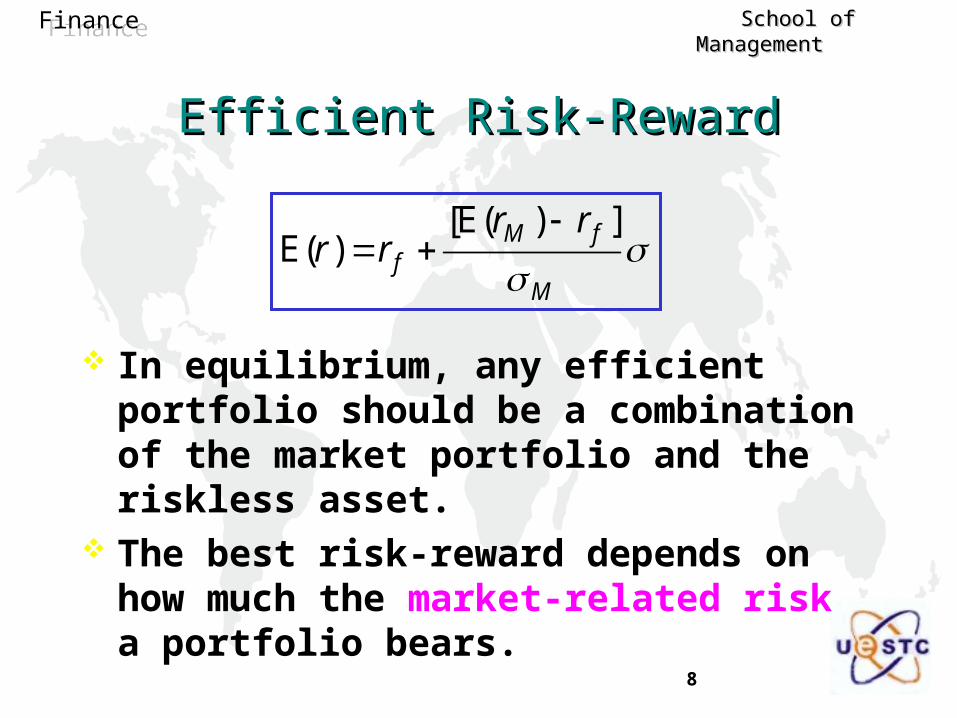
Efficient Risk-RewardEfficient Risk-Reward
M
fMf
rrrr
])(E[)(E
In equilibrium, any efficient portfolio should be a combination of the market portfolio and the riskless asset.
The best risk-reward depends on how much the market-related risk a portfolio bears.
9
FinanceFinance School of Management School of Management
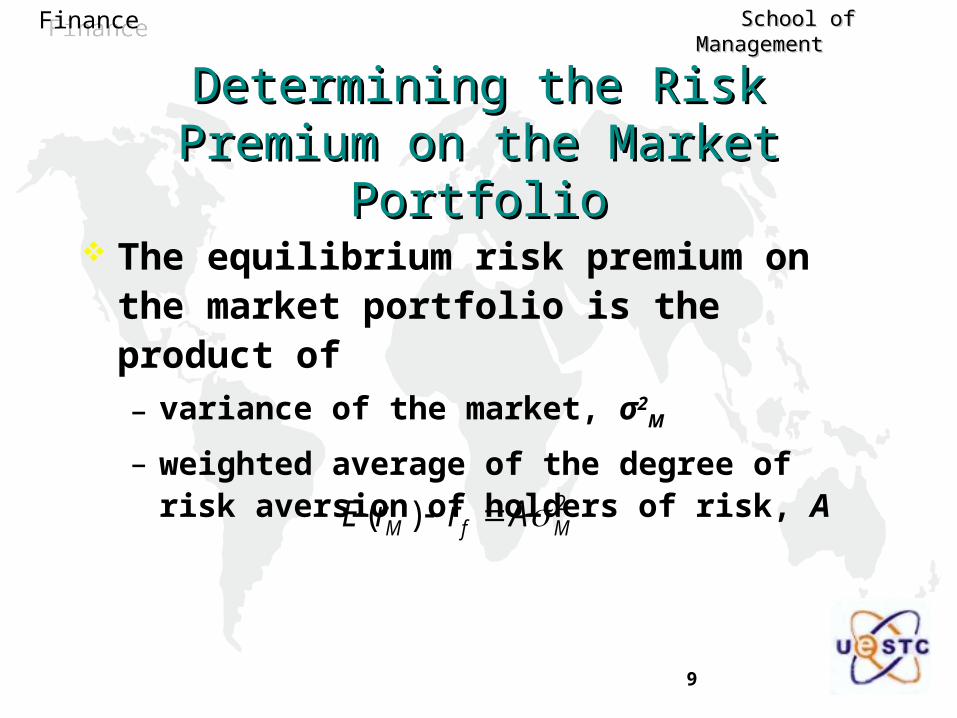
Determining the Risk Premium on the Determining the Risk Premium on the Market PortfolioMarket Portfolio
The equilibrium risk premium on the market portfolio is the product of
– variance of the market, σ2M
– weighted average of the degree of risk aversion of holders of risk, A
2)( MfM ArrE
10
FinanceFinance School of Management School of Management
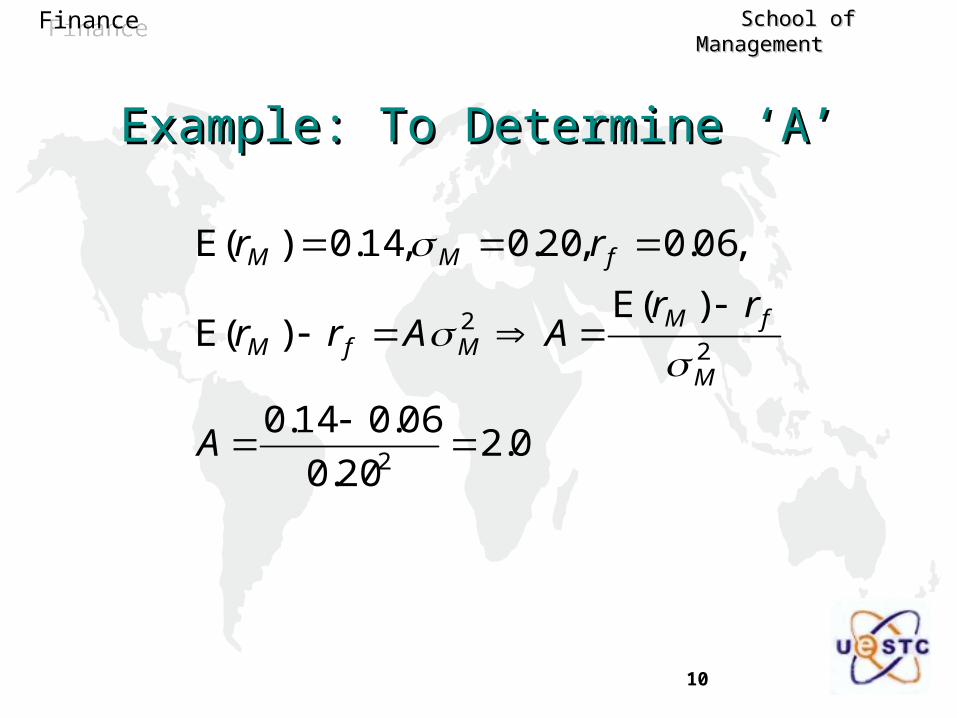
Example: To Determine ‘A’Example: To Determine ‘A’
0.220.0
06.014.0
)(E)(E
,06.0,20.0,14.0)(E
2
22
A
rrAArr
rr
M
fMMfM
fMM
11
FinanceFinance School of Management School of Management
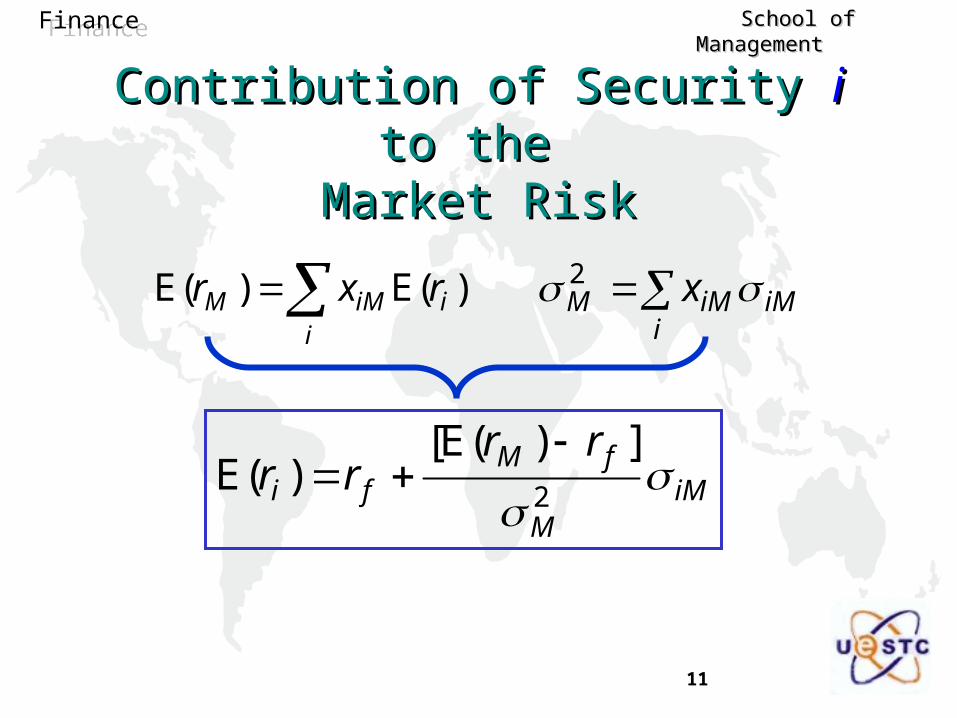
Contribution of Security Contribution of Security ii to the to the Market RiskMarket Risk
i
iiMM rxr )(E)(E i
iMiMM x 2
iMM
fMfi
rrrr
2
])(E[)(E
12
FinanceFinance School of Management School of Management
Team WorkTeam Work
To express the covariance between a risky security and the tangent portfolio, Cov(ri, rT) ,
in our example in Chapter 12, as the functions of rf , E[ri], E[rT], and σT .
13
FinanceFinance School of Management School of Management
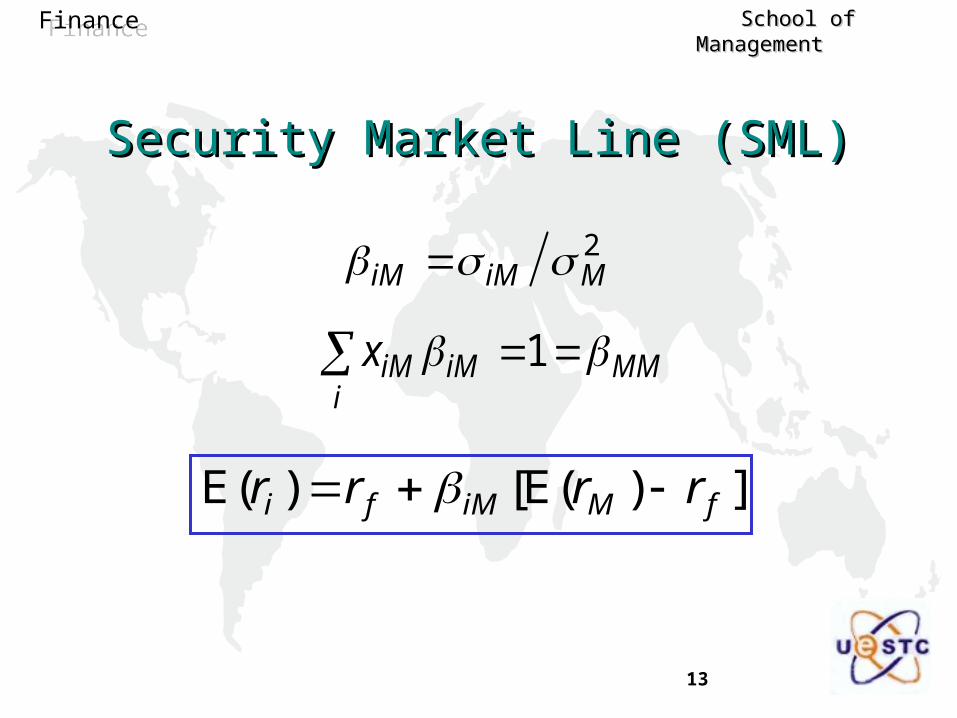
Security Market Line (SML)Security Market Line (SML)
MMi
iMiMx 1
2MiMiM
])(E[)(E fMiMfi rrrr
14
FinanceFinance School of Management School of Management
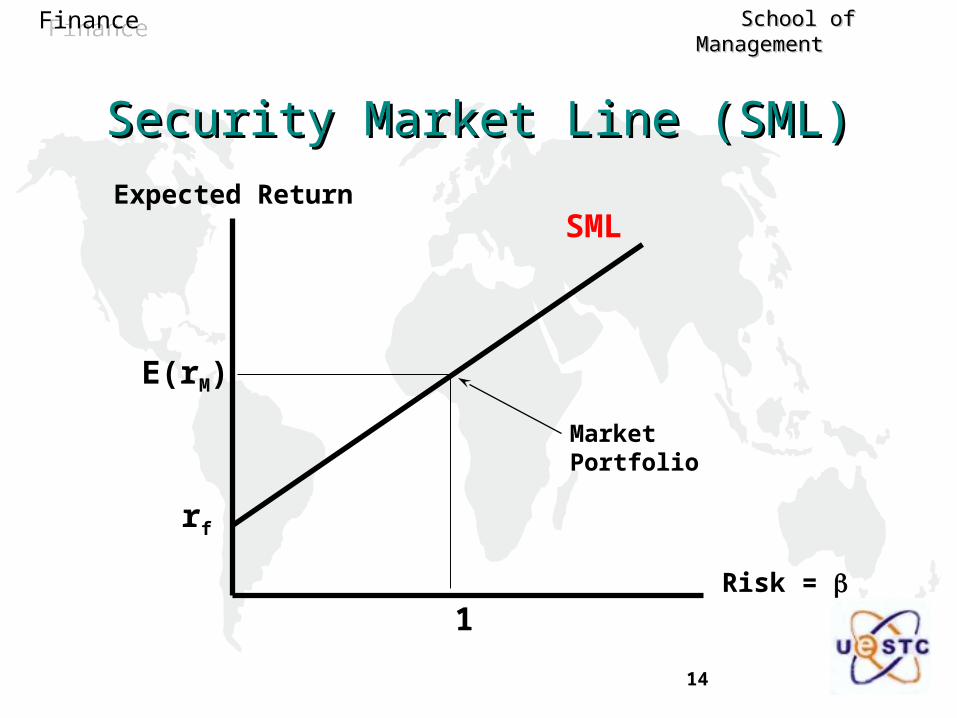
Security Market Line (SML)Security Market Line (SML)
Risk =
Expected ReturnSML
rf
Market Portfolio
E(rM)
1
15
FinanceFinance School of Management School of Management
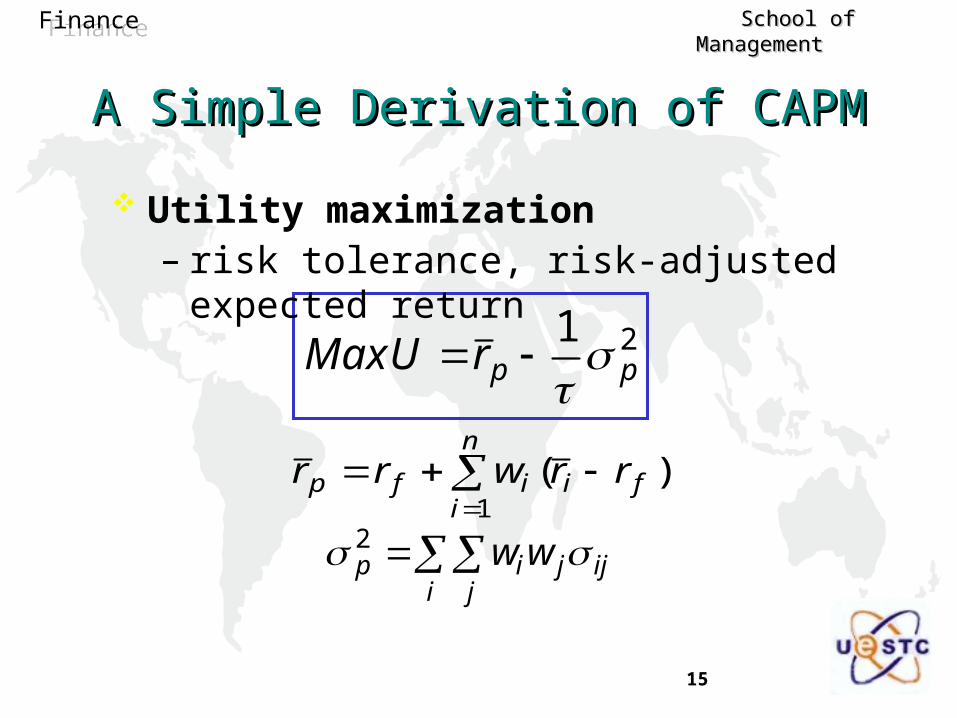
A Simple Derivation of CAPMA Simple Derivation of CAPM
21pprUMax
Utility maximization – risk tolerance, risk-adjusted expected return
n
ifiifp rrwrr
1)(
i j
ijjip ww 2
16
FinanceFinance School of Management School of Management
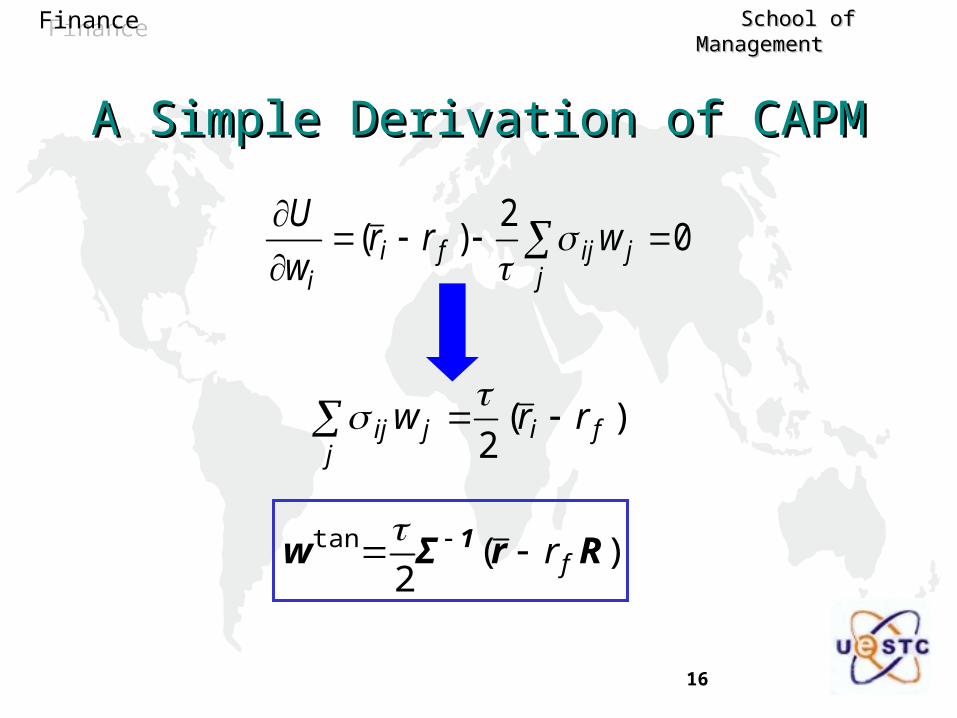
A Simple Derivation of CAPMA Simple Derivation of CAPM
jjijfi
i
wrrw
U0
2)(
j
fijij rrw )(2
)(2
tan RrΣw 1fr
17
FinanceFinance School of Management School of Management
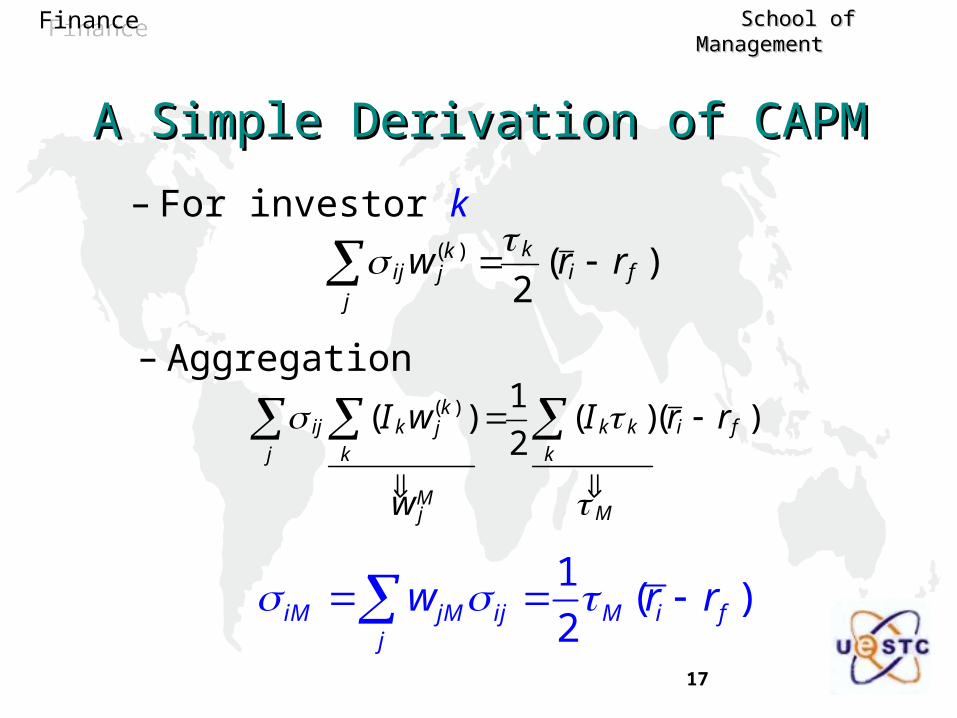
A Simple Derivation of CAPMA Simple Derivation of CAPM
)(2
)(fi
k
j
kjij rrw
MMj
fik
k
k
j
kj
k
kij
w
rrIwI
)()(2
1)( )(
– For investor k
– Aggregation
1( )
2iM jM ij M i fj
w r r
18
FinanceFinance School of Management School of Management
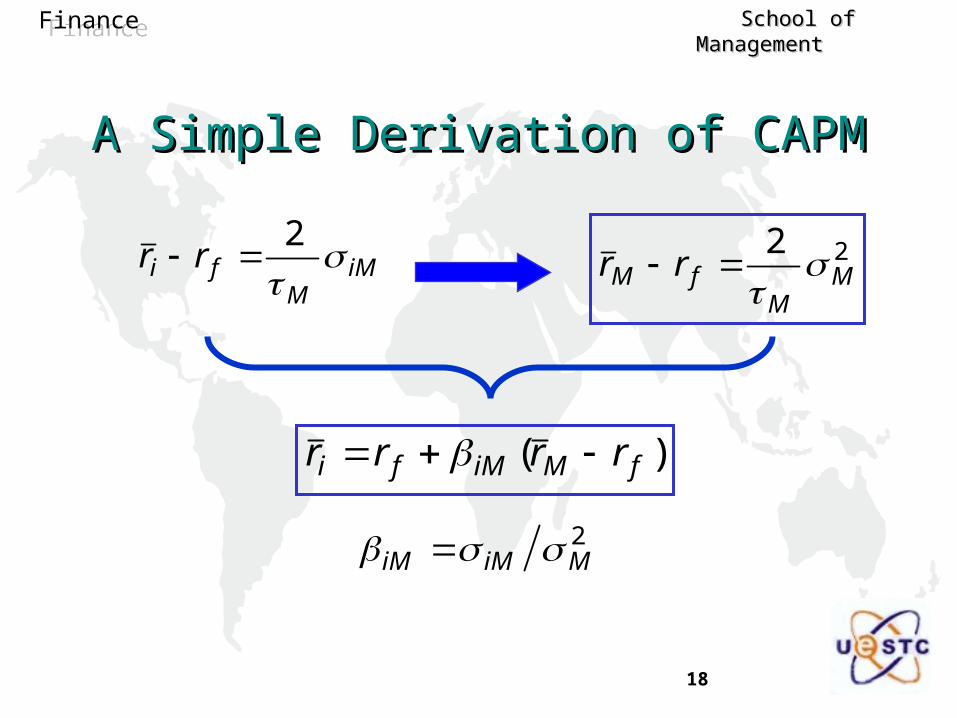
A Simple Derivation of CAPMA Simple Derivation of CAPM
iMM
fi rr 2
22M
MfM rr
)( fMiMfi rrrr
2MiMiM
19
FinanceFinance School of Management School of Management
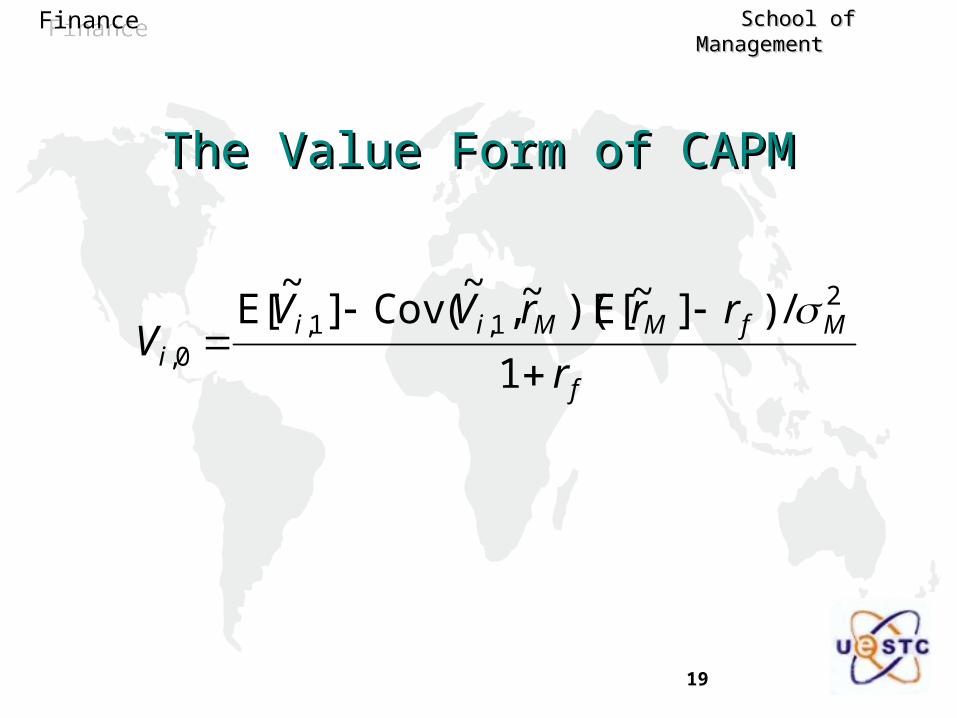
The Value Form of CAPMThe Value Form of CAPM
f
MfMMiii r
rrrVVV
1
/)]~[E)(~,~
(Cov]~
[E 21,1,
0,
20
FinanceFinance School of Management School of Management
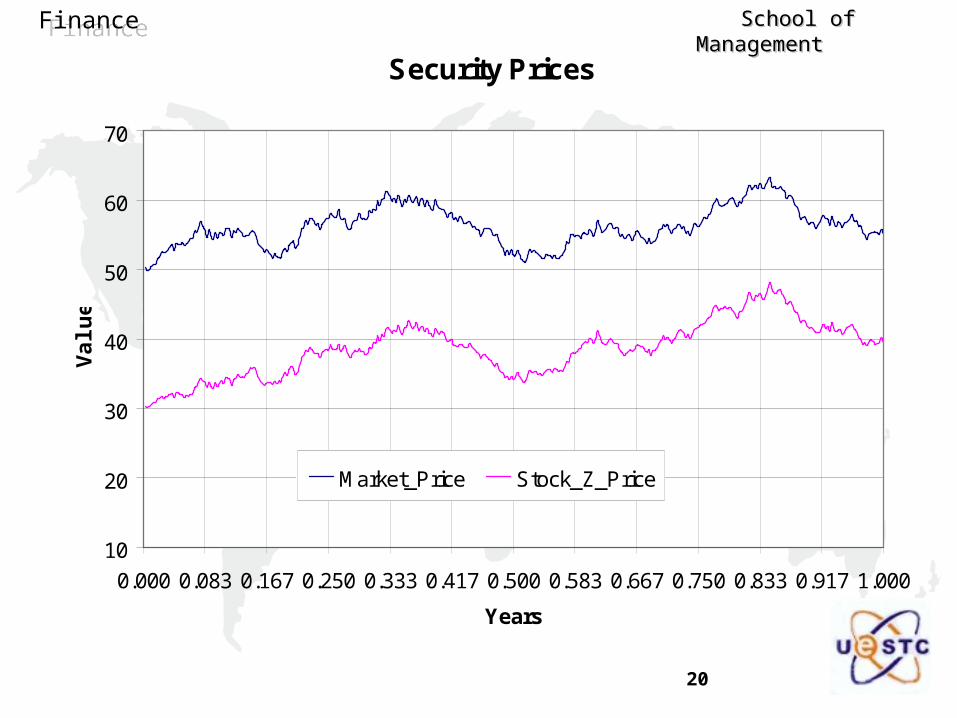
Security Prices
10
20
30
40
50
60
70
0.000 0.083 0.167 0.250 0.333 0.417 0.500 0.583 0.667 0.750 0.833 0.917 1.000
Years
Va
lue
Market_Price Stock_Z_Price
21
FinanceFinance School of Management School of Management
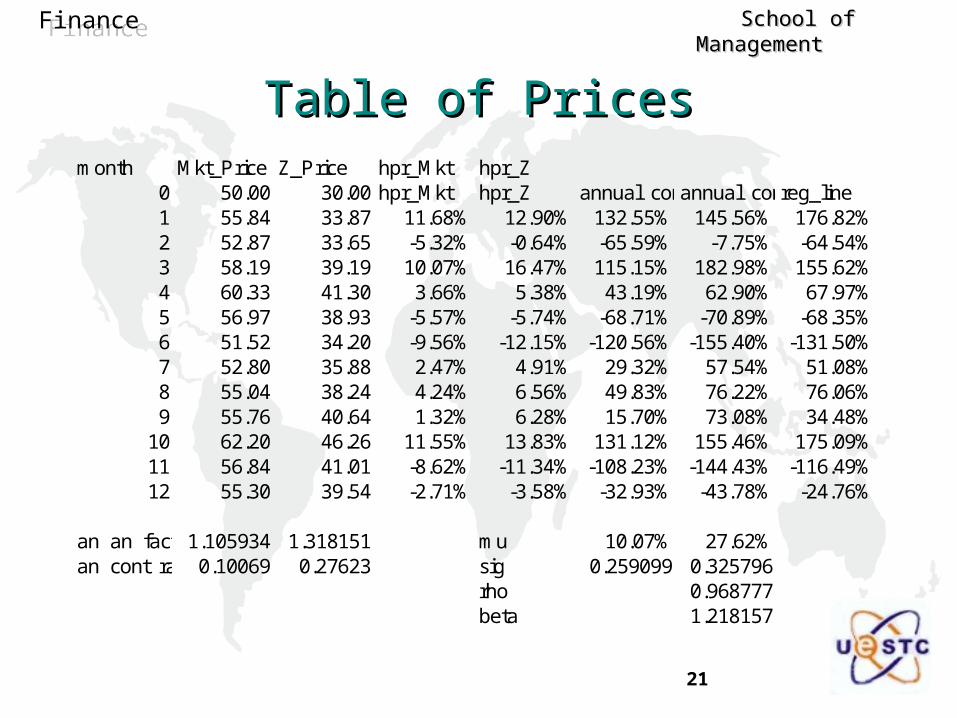
Table of PricesTable of Pricesmonth Mkt_Price Z_Price hpr_Mkt hpr_Z
0 50.00 30.00 hpr_Mkt hpr_Z annual_cont_mktannual_cont_zreg_line1 55.84 33.87 11.68% 12.90% 132.55% 145.56% 176.82%2 52.87 33.65 -5.32% -0.64% -65.59% -7.75% -64.54%3 58.19 39.19 10.07% 16.47% 115.15% 182.98% 155.62%4 60.33 41.30 3.66% 5.38% 43.19% 62.90% 67.97%5 56.97 38.93 -5.57% -5.74% -68.71% -70.89% -68.35%6 51.52 34.20 -9.56% -12.15% -120.56% -155.40% -131.50%7 52.80 35.88 2.47% 4.91% 29.32% 57.54% 51.08%8 55.04 38.24 4.24% 6.56% 49.83% 76.22% 76.06%9 55.76 40.64 1.32% 6.28% 15.70% 73.08% 34.48%
10 62.20 46.26 11.55% 13.83% 131.12% 155.46% 175.09%11 56.84 41.01 -8.62% -11.34% -108.23% -144.43% -116.49%12 55.30 39.54 -2.71% -3.58% -32.93% -43.78% -24.76%
an_an_fact 1.105934 1.318151 mu 10.07% 27.62%an_cont_rate 0.10069 0.27623 sig 0.259099 0.325796
rho 0.968777beta 1.218157
22
FinanceFinance School of Management School of Management
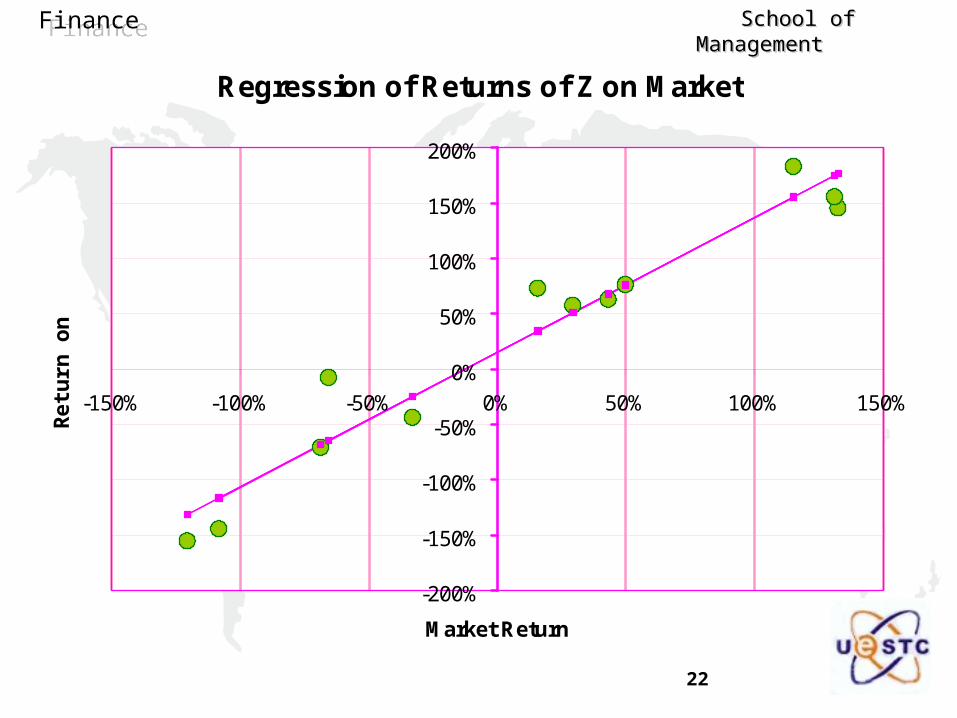
Regression of Returns of Z on Market
-200%
-150%
-100%
-50%
0%
50%
100%
150%
200%
-150% -100% -50% 0% 50% 100% 150%
Market Return
Ret
urn
on
Z
23
FinanceFinance School of Management School of Management
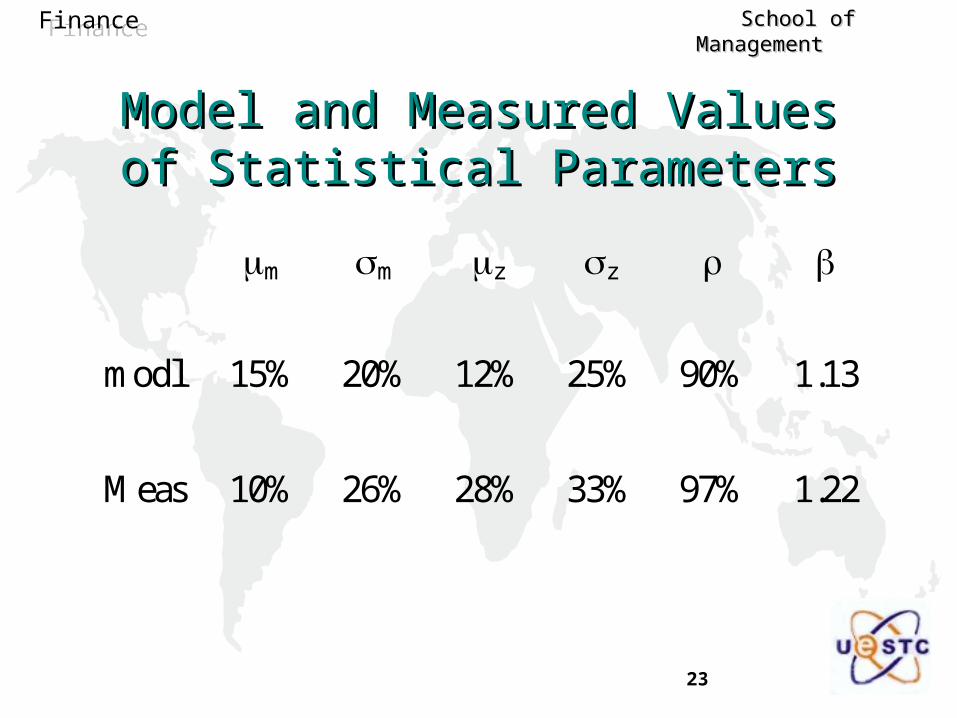
Model and Measured Values of Model and Measured Values of Statistical ParametersStatistical Parameters
m m z z
modl 15% 20% 12% 25% 90% 1.13
Meas 10% 26% 28% 33% 97% 1.22
24
FinanceFinance School of Management School of Management
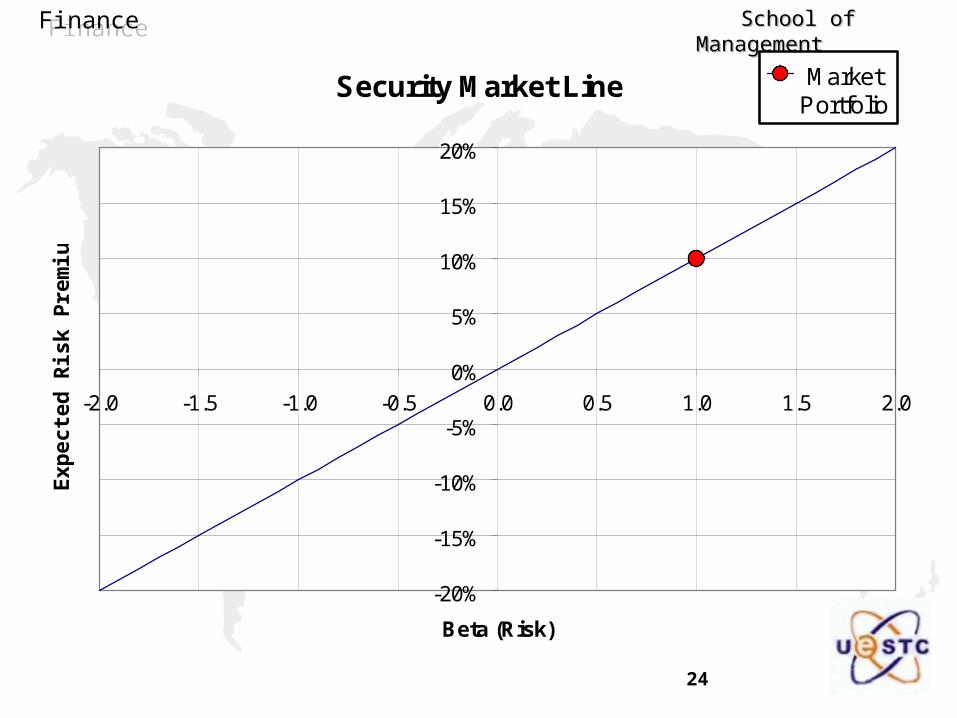
Security Market Line Market Portfolio
-20%
-15%
-10%
-5%
0%
5%
10%
15%
20%
-2.0 -1.5 -1.0 -0.5 0.0 0.5 1.0 1.5 2.0
Beta (Risk)
Exp
ecte
d R
isk
Pre
miu
m
25
FinanceFinance School of Management School of Management
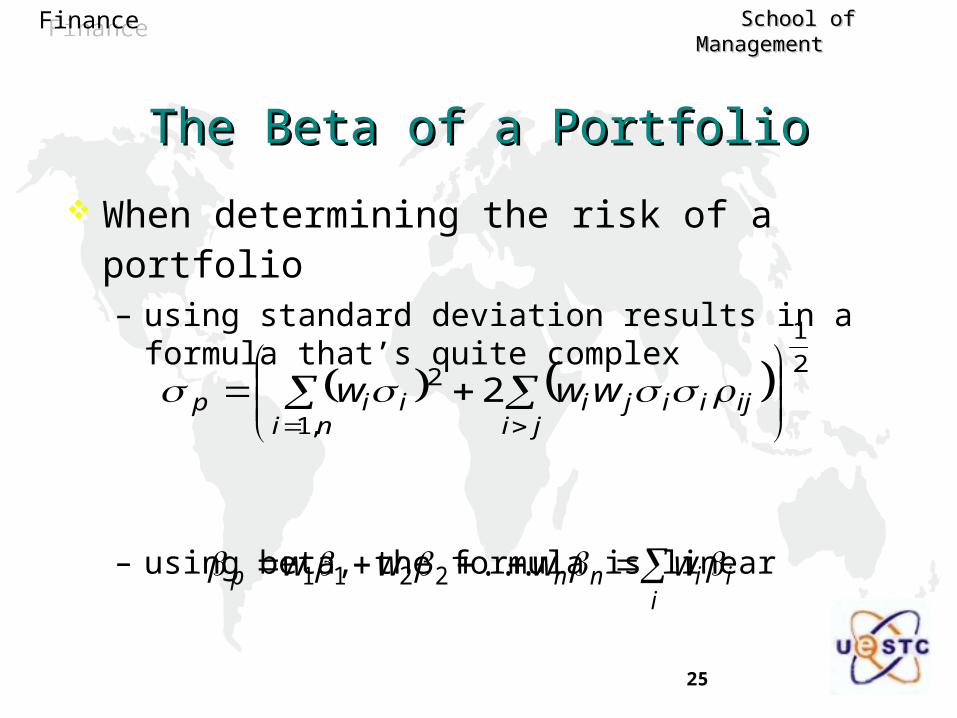
The Beta of a PortfolioThe Beta of a Portfolio
When determining the risk of a portfolio – using standard deviation results in a formula that’s quite
complex
– using beta, the formula is linear
i
iinnp wwww ...2211
2
1
,1
2 2
jiijiiji
niiip www
26
FinanceFinance School of Management School of Management
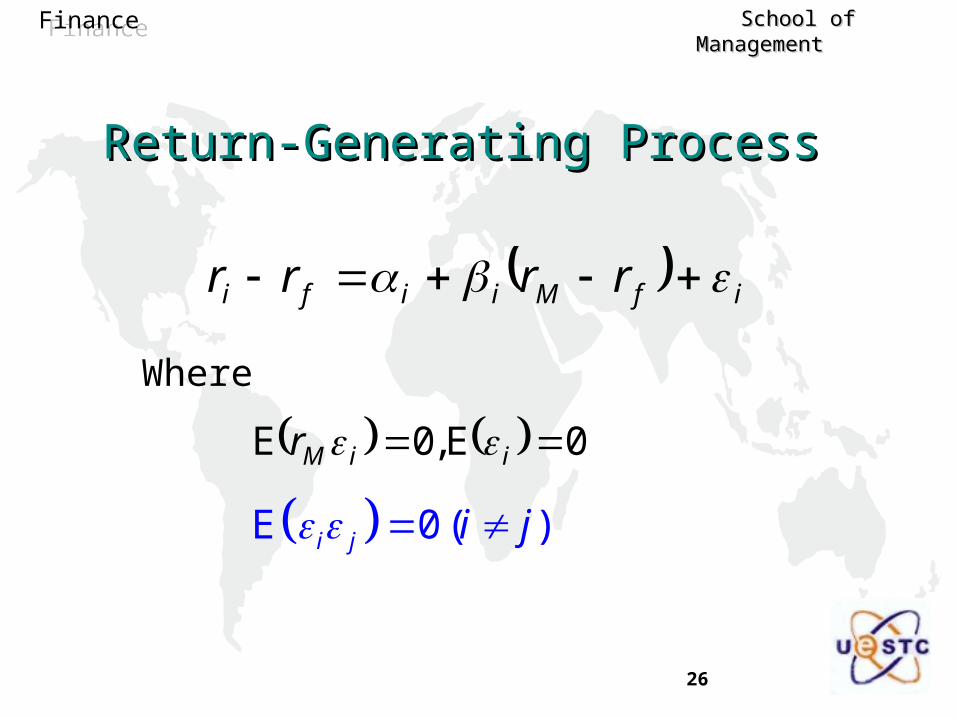
Return-Generating ProcessReturn-Generating Process
ifMiifi rrrr
Where
0E,0E iiMr
E 0 ( )i j i j
27
FinanceFinance School of Management School of Management
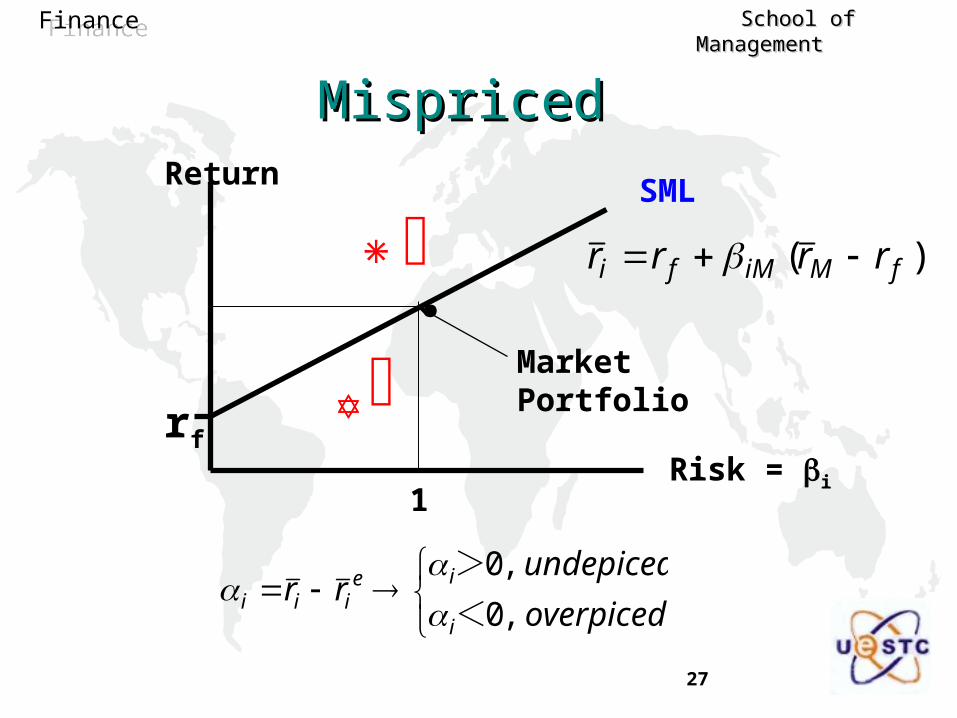
MispricedMispriced
overpiced
undepicedrr
i
ieiii ,0
,0
<>
SMLReturn
.
rf
Market Portfolio
1Risk = i
)( fMiMfi rrrr
28
FinanceFinance School of Management School of Management
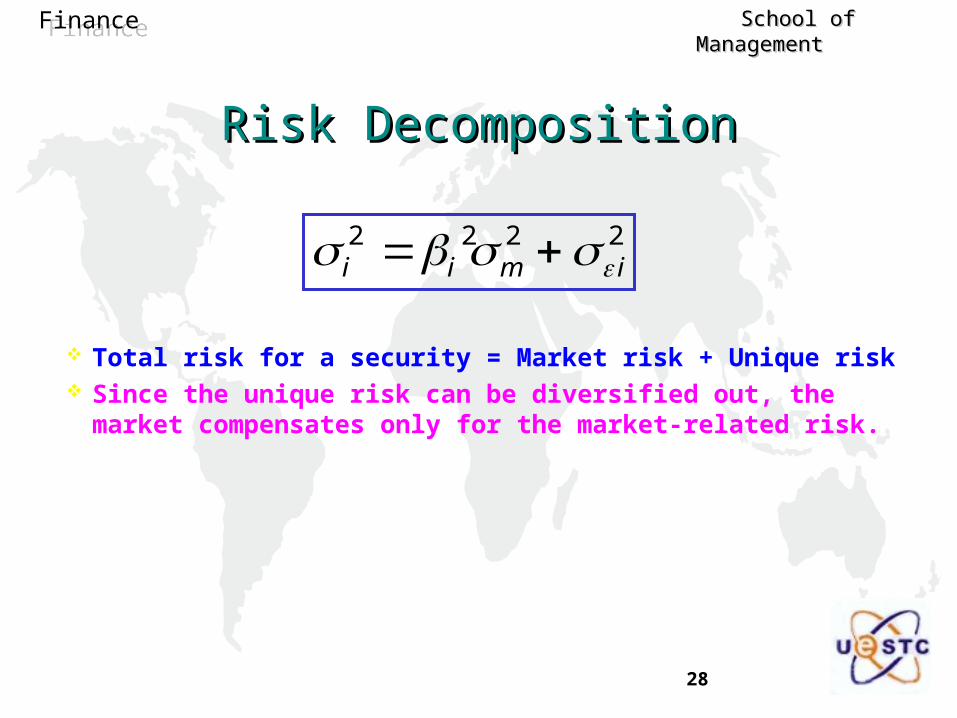
Risk DecompositionRisk Decomposition
Total risk for a security = Market risk + Unique risk Since the unique risk can be diversified out, the
market compensates only for the market-related risk.
i i m i2 2 2 2
29
FinanceFinance School of Management School of Management
Using the CAPM in Portfolio SelectionUsing the CAPM in Portfolio Selection
Passive portfolio management– Proxy for market portfolio
– indexing
Active portfolio management– Positive ALPHA
– Beat the market
30
FinanceFinance School of Management School of Management
The Market Portfolio and Index FundsThe Market Portfolio and Index Funds
The most important implication of CAPM, that the market portfolio is an efficient portfolio, forms the theoretical basis for constructing proxies of the market portfolio—the index portfolio and index funds.
However, structuring an index portfolio from the primitive securities and making adjustments are inefficient and costly.
The efficient and cheap instruments, index futures contracts were not available until 1982.
In the U.S. market, the market value of outstanding index funds was only 6 million dollars in 1971.
After ten years, the value increased to 10 billion dollars. In 1992, the value increased to 270 billion dollars with about
1/3 pension funds being in the state of indexing.
31
FinanceFinance School of Management School of Management
Valuation and Regulating Rates of ReturnValuation and Regulating Rates of Return
Discounted Cash Flow Valuation Models
– Suppose you are considering investing in a new project in the same industry of Betaful Corp.
– The market rate is 15%, and the risk-free rate is 5%.
– The beta of Betaful’s stock is 1.3.
– The capital structure of Betaful: 80% of equity, 20% of bond.
32
FinanceFinance School of Management School of Management
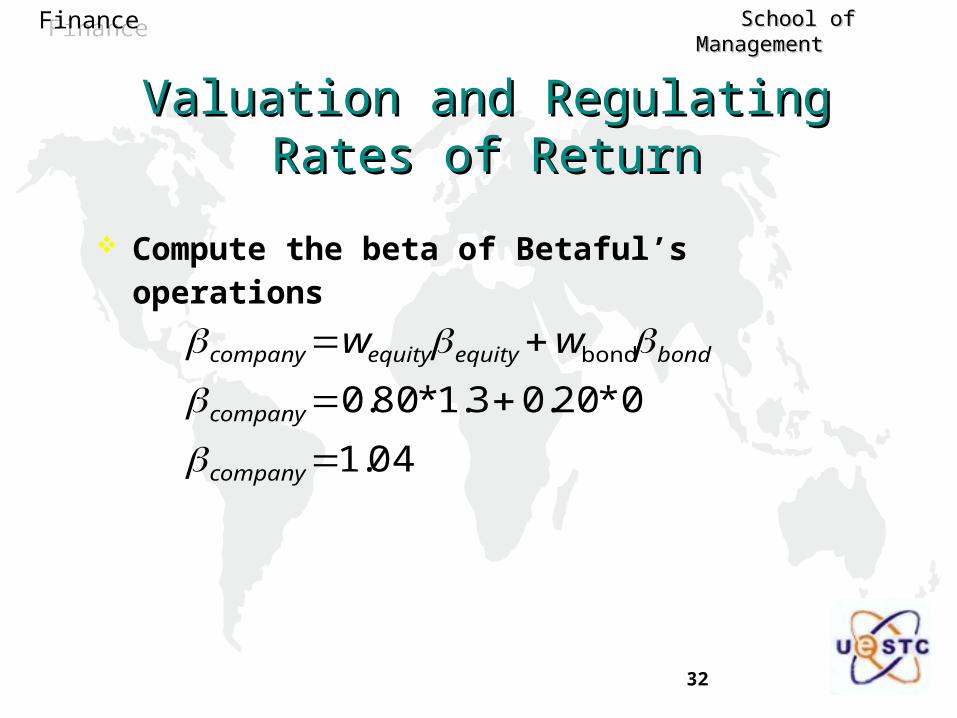
Compute the beta of Betaful’s operations
04.1
0*20.03.1*80.0
bond
company
company
bondequityequitycompany ww
Valuation and Regulating Rates of ReturnValuation and Regulating Rates of Return
33
FinanceFinance School of Management School of Management
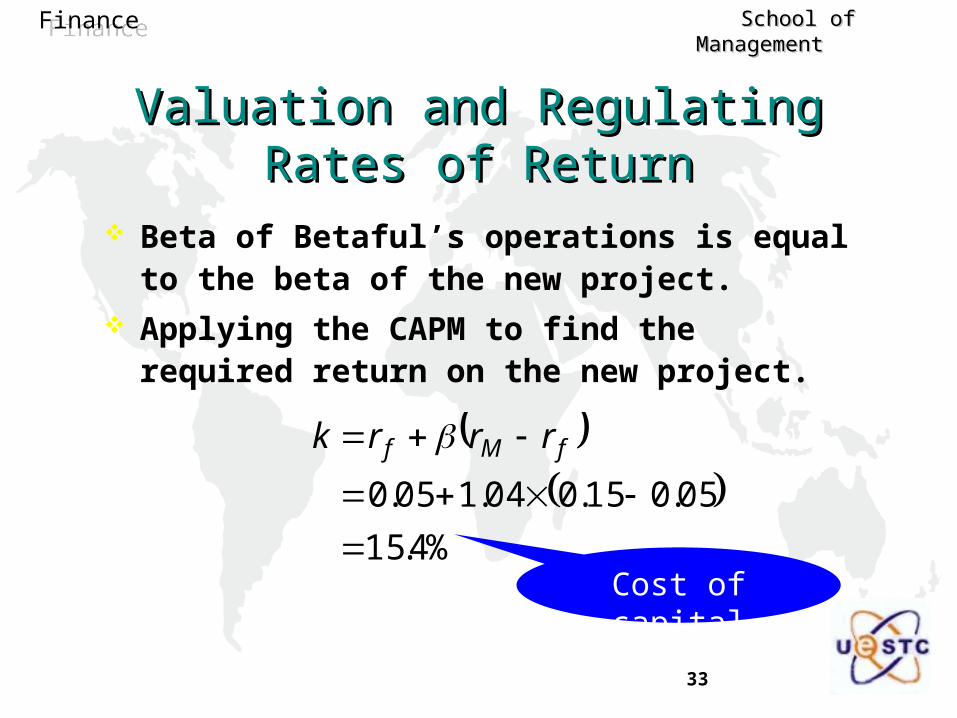
Beta of Betaful’s operations is equal to the beta of the new project.
Applying the CAPM to find the required return on the new project.
%4.15
05.015.004.105.0
fMf rrrk
Valuation and Regulating Rates of ReturnValuation and Regulating Rates of Return
Cost of capital
34
FinanceFinance School of Management School of Management
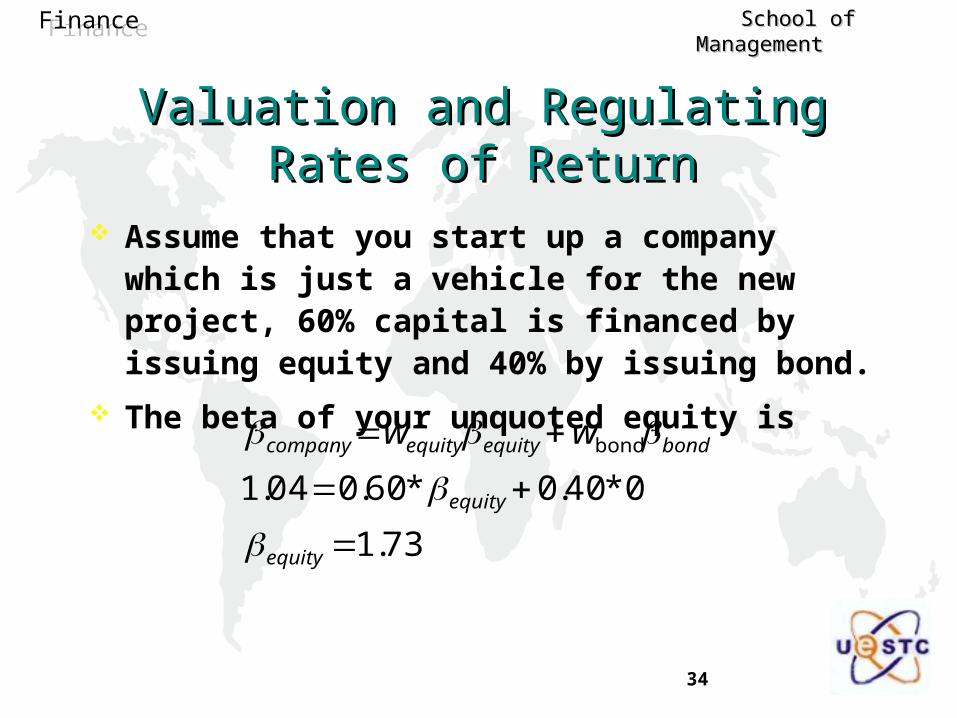
Assume that you start up a company which is just a vehicle for the new project, 60% capital is financed by issuing equity and 40% by issuing bond.
The beta of your unquoted equity is
73.1
0*40.0*60.004.1
bond
equity
equity
bondequityequitycompany ww
Valuation and Regulating Rates of ReturnValuation and Regulating Rates of Return
35
FinanceFinance School of Management School of Management
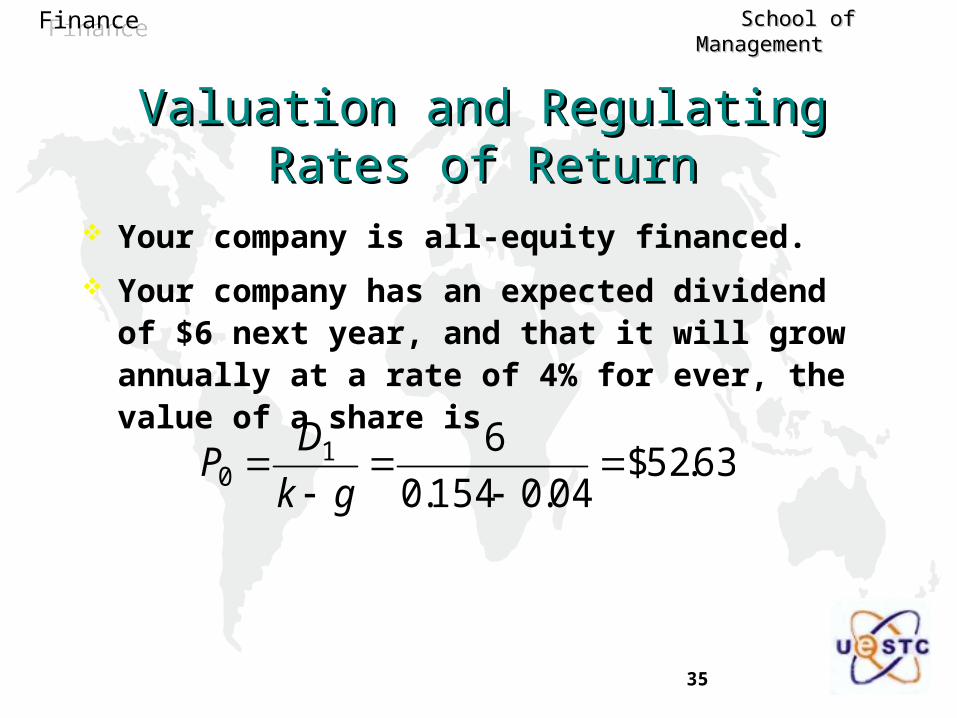
Your company is all-equity financed.
Your company has an expected dividend of $6 next year, and that it will grow annually at a rate of 4% for ever, the value of a share is
63.52$04.0154.0
610
gk
DP
Valuation and Regulating Rates of ReturnValuation and Regulating Rates of Return
36
FinanceFinance School of Management School of Management
Modifications and Alternatives to CAPMModifications and Alternatives to CAPM
Empirical testing of CAPM Modifications
– The proxy of market portfolio
– Market imperfection
– Multifactor Intertemporal CAPM (ICAPM): beta, sensitivity to changes in interest rates and in consumption good prices
Alternatives– Arbitrage Pricing Theory (APT)