Embed Size (px)
Citation preview
1
Color’s effect on Reaction Times
By: Gustavo GoretkinFLVS Science FairFebruary 18, 2008

2
Table of ContentsIntroduction 3
Introduction-Purpose 4Introduction-Purpose 5Introduction-Purpose 6Introduction-Preliminary Research 7Introduction- Two Hypotheses 8
Methods 9Methods-Definition of Terms 10Methods-Definition of Terms 11Methods-Materials 12Methods- Color Theory 13Methods- Color Theory: Additive System 14Methods-Colors Used 15Methods- Determining Color Distance 16Methods- Determining Color Distance Example 17Methods 18Methods Step 1 cont. 19Methods-Color Transitions 20Methods Step 1 The Flash App. 21Methods Step 1 The Flash App. 22Methods Step 1 The Flash App. 23Methods Step 1 The Flash App. The Trials 24Methods Step 1 The Flash App. The Trials 25Methods 26Methods 27Methods 28
Results 29Results-Graph 130Results-Graph 231Results-Graph 332Results-Graph 433Results-Explanation34
Discussion 35Discussion 36Discussion 37Discussion-cont38Discussion-Possible Errors39Discussion-Improvements40Discussion-Improvements41
Conclusion 42Conclusion 43Conclusion-cont.44Conclusion-Application45Acknowledgements46Bibliography/References47
3
Introduction

4
Introduction-Purpose The researcher sought to discover
any correlation between different color changes, and the time of reaction to those changes.
The researcher also wanted to see how colors which have a psychological and sociological impact (e.g. red-green in traffic lights) affect reaction time.

5
Introduction-Purpose The idea for this project came to the
researcher when he was attempting to find an experiment that could be conducted in the “virtual environment”. Not only did this have the added benefit of being able to experiment a large group of people in a relatively short timeframe, but it also allowed students in the researcher’s online classes to participate—something very suited to a virtual, online science fair.

6
Introduction-Purpose The researcher concluded that a reaction-
time measurer could be easily created and then deployed to a large group of people.
The advantage over a conventional psychological experiment done in the presence of a researcher is that a large amount of data was collected in a short amount of time because dozens of people can access the application at once. Because the researcher hoped to achieve accurate data, a large sample-set was favorable.

7
Introduction-Preliminary Research Human reaction time varies widely depending
on the type of stimulus (auditory, visual, touch) and degree of such stimulus (loud, bright, hot). Hypothesis one tests this.
There are several types of reaction tests. If the user were instructed, for example, to only click the button when the color change was from red to green, but never from red to white, then upon the color change, the user would have to indentify the color. This is not the case. This is a simple reaction test because the user reacts regardless of the type of color change.
8
Introduction- Two Hypotheses1. The researcher hypothesized that if reaction
times of different color distances are compared, then the farther two colors are from each other (contrasted), the lower the reaction time will be. This extends to state that reaction time should not change for conjugate transitions (red to green and green to red).
2. Also hypothesized was that if green-red is the color transition, then there will be a quicker reaction due to the psychological connotations of that color transition (traffic lights for example).

9
Methods
10
Methods-Definition of TermsPrimary (Color) – One of three components of light.RGB – Red, Green, and Blue (three primaries of additive light
) Each primary is represented by a number ranging from 0 to 255. Thus any color is defined by three numbers.
Color distance – the distance between two colors.User – a human test subjectFlash Application – The computer program sent to the users.Result – The data generated by a single user.Trial – A color transitions the Flash Application presents the
user with.Reaction Time- The time between an event’s occurrence and
a user reaction to that event.

11
Methods-Definition of TermsConjugate Transitions- two transitions with equal color
distances. e.g. red-green and green-red or yellow-red and green-yellow
Visual Basic for Applications (VBA)- A programming language available in the Microsoft office suite to perform automated tasks (Macros).
PHP: Hypertext Processor – A server-side scripting language which can handle data received from a remote computer.
Microsoft Excel- A spreadsheet program used for analyzing and presenting data.
Adobe Flash – A client-side application typically used in making web

12
Methods-Materials Computer Application to design software
which gauges reaction time (Adobe Flash CS3)
Server Application to collect from the Computer Application (PHP: Hypertext Processor)
Server Software to collect data (Xampp) Spreadsheet Application to aggregate and
perform analysis on the data. Human Test Subjects

13
Methods- Color Theory It is taught in elementary school that the three primary colors
are Magenta, Yellow, and Cyan. This holds true for the subtractive color system, where a physical element (paint) is mixed with another. The color Magenta, for example absorbs all colors except Magenta. It thus holds that if you add all colors together, the mixture would absorb all colors, and would reflect no light, thus resulting in black.
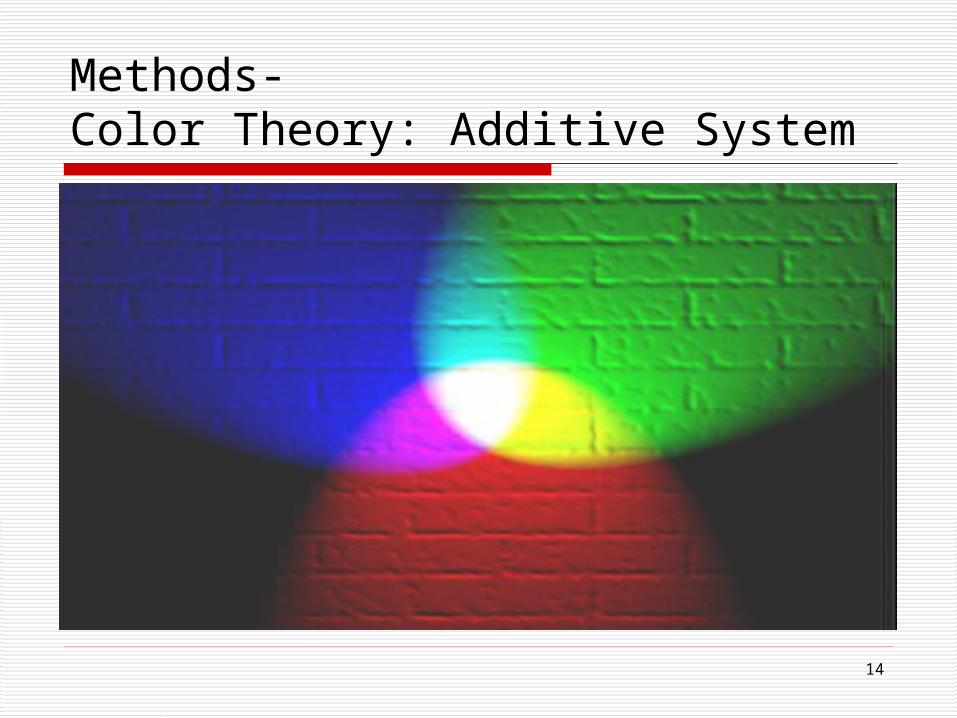
There exist two color system though. Above is described the subtractive color system, but an additive one also exists. This is what is experienced every day when you look at a TV or computer monitor. The three primary colors of this system are Red, Green, and Blue (RGB). A Red light generates only Red light, and no other light. By adding colors together, all color lights would be generated yielding white light.
The computer represents colors by using RGB numbers where each primary is a number from 0 to 255.
14
Methods-Color Theory: Additive System

15
Methods-Colors Used This block is represented by (255,0,0 in R,G,B) This block is (0,255,0) This block is (255,255,0) Equivalent to Red+Green This block is (255,255,255) This block is (0,0,0) This block is (128,128,128) ½ of each color, 50% gray This block is (51,51,51) Dark Gray This block is (187,187,187) Light Gray
These are the colors used throughout the project.

16
Methods-Determining Color Distance Color distance is determined by the 3D distance between to
coordinates, where each component of each coordinate is a component of RGB.
The Pythagorean theorem is used in deriving the distance formula :
While usually expressed for 2D coordinates, the same holds true for 3D coordinates:
Change in Red = Δx, Change in Green = Δy, Change in Blue = Δz
2 2 2 22 1distance, where a b c x y n n n
2 2 2 distancex y z

17
Methods- Determining Color Distance Example Perceiving colors as a point
inside a cube helps makesense of color distances.
Each axis of the cuberepresents a primary.
The distance betweenblack and white is thenrepresented by this line
The length of this line is thegeometric distance betweenthese two points ormathematically:
Black (0,0,0)
Green (0,255,0)Blue (0,0,255)
Red (255,0,0)
White (255,255,255)
2 2 2255 0 255 0 255 0
442RGBunits

18
Methods1. Design a computer application that performs a
randomly-timed color transition (independent variable) and measures the time between that color transition and the click of a mouse accurate to milliseconds (dependant variable). The computer application must also be able submit the raw data to the researcher. The color transitions are specifically chosen to test the hypothesis by including transitions of differing color differences, transitions of equal color differences, and transitions of colors with a psychological connotation.
19
Methods Step 1 cont.
This experiment does not truly test reaction time, though. It tests reaction time plus latency of motor control (pressing a button). Because this latency is expected to be similar throughout the test, the data simply has an offset added and can be accounted for by doing scaling.

20
Methods-Color Transitions
Color Transition Distance BetweenRed to Green 360.6
Green to Red 360.6
Yellow to Red 255
Green to Yellow 255
Light Gray to White 117.8
Black to Dark Gray 88.3
Dark Gray to Light Gray 235.6
White to Black 441.7
Black to White 441.7

21
Methods Step 1 The Flash App.
This is the initial view of the Flash application.
This is the main button
This display provides trials which have been stored
This display provides the status of the main button
This notifies the user that a transition will be occurring soon.
This black color will be changing soon.
The button’s color has abruptly changed and the computer awaits a click.
If the user clicks within 700 ms, then the application will prompt to continue the next trial
22
Methods Step 1 The Flash App.
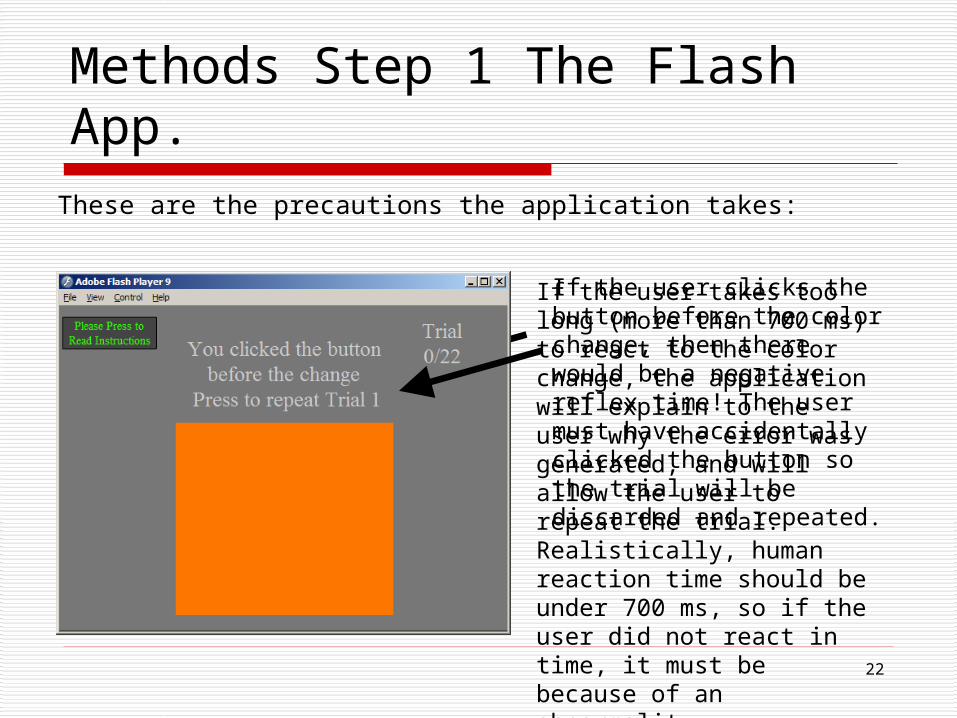
These are the precautions the application takes:
If the user takes too long (more than 700 ms) to react to the color change, the application will explain to the user why the error was generated, and will allow the user to repeat the trial. Realistically, human reaction time should be under 700 ms, so if the user did not react in time, it must be because of an abnormality.
If the user clicks the button before the color change, then there would be a negative reflex time! The user must have accidentally clicked the button so the trial will be discarded and repeated.

23
Methods Step 1 The Flash App.
This is the submission screen.When users submit their data, they are given a chance to include their contact information and any comments they’d like the researcher to see. None of these fields are required.
Users may submit up to three times in case they experience issues with their popup blockers.

24
Methods Step 1 The Flash App.The Trials
There are in total 9 color transitions to be tested. These are each tested twice and their times are then averaged. These 18 trials are not presented in any predictable manner so that the user is not able to expect any specific transition.
In addition, there are four initial trials which are not used to gauge the user, but rather to get the user comfortable with the application. This is not made obvious to the users.
This makes for a total of 22 trials.
25
Methods Step 1 The Flash App.The Trials
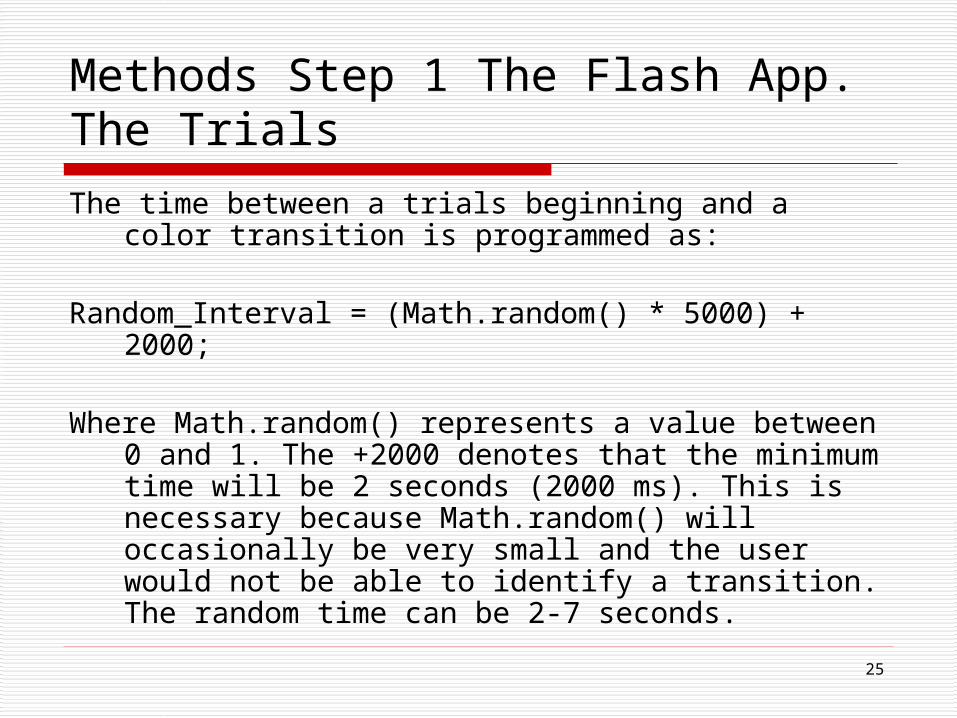
The time between a trials beginning and a color transition is programmed as:
Random_Interval = (Math.random() * 5000) + 2000;
Where Math.random() represents a value between 0 and 1. The +2000 denotes that the minimum time will be 2 seconds (2000 ms). This is necessary because Math.random() will occasionally be very small and the user would not be able to identify a transition. The random time can be 2-7 seconds.

26
Methods
2. Design a PHP application which accepts input from the application depicted in step 1. This application should store the data on the server either in a text files, or in a database. This project used the former. The PHP application takes care of averaging the two trials for each transition, and also provides the user with some basic data like lowest and highest reflex time and the according colors.
27
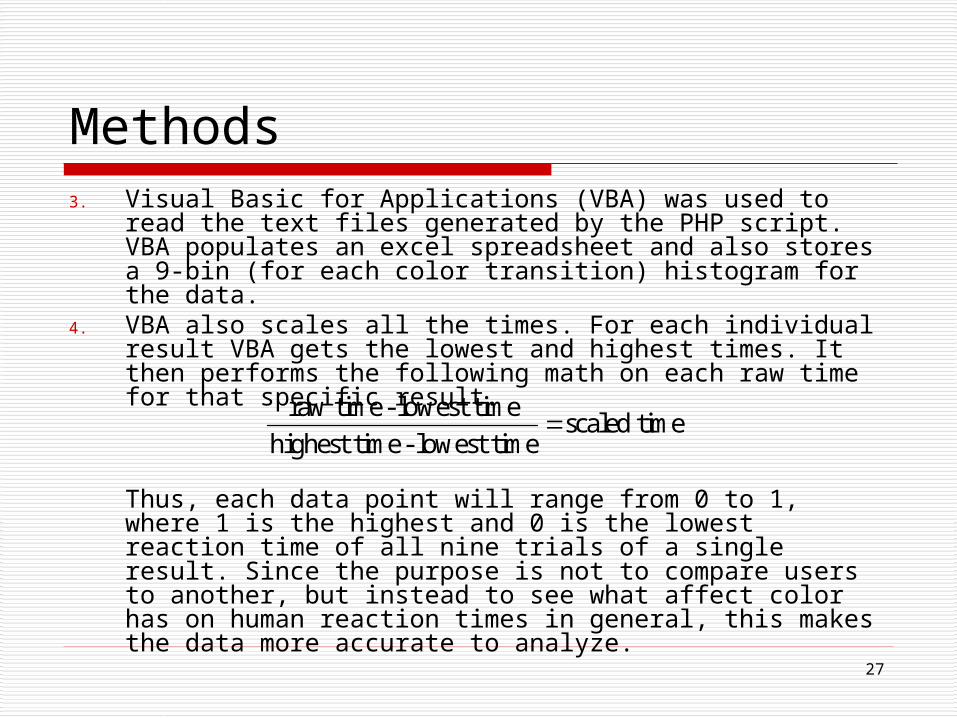
Methods3. Visual Basic for Applications (VBA) was used to read the
text files generated by the PHP script. VBA populates an excel spreadsheet and also stores a 9-bin (for each color transition) histogram for the data.
4. VBA also scales all the times. For each individual result VBA gets the lowest and highest times. It then performs the following math on each raw time for that specific result.
Thus, each data point will range from 0 to 1, where 1 is the highest and 0 is the lowest reaction time of all nine trials of a single result. Since the purpose is not to compare users to another, but instead to see what affect color has on human reaction times in general, this makes the data more accurate to analyze.
raw time - lowest timescaled time
highest time - lowest time
28
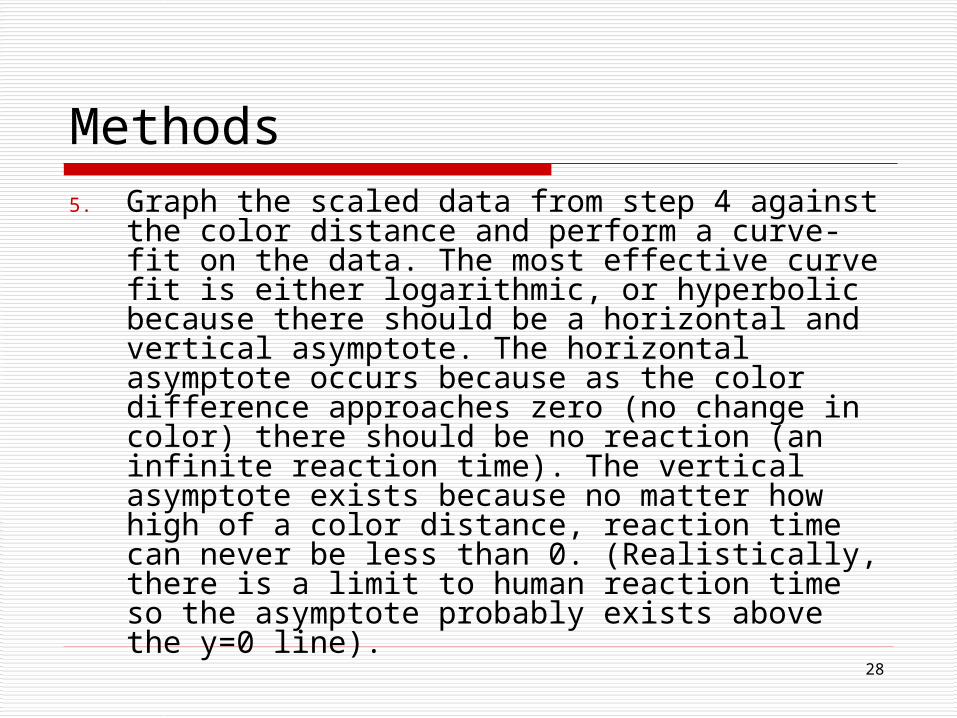
Methods5. Graph the scaled data from step 4 against the
color distance and perform a curve-fit on the data. The most effective curve fit is either logarithmic, or hyperbolic because there should be a horizontal and vertical asymptote. The horizontal asymptote occurs because as the color difference approaches zero (no change in color) there should be no reaction (an infinite reaction time). The vertical asymptote exists because no matter how high of a color distance, reaction time can never be less than 0. (Realistically, there is a limit to human reaction time so the asymptote probably exists above the y=0 line).
29
Results

30
Results-Graph 1
Color Distance vs Reaction Time
0
0.2
0.4
0.6
0.8
1
1.2
1.4
1.6
0 50 100 150 200 250 300 350 400 450
Color Distance (RGB Units)
Rel
ativ
e R
eact
ion
Tim
e

31
Results-Graph 2Percent of Results having Highest (Slowest) Reaction Time per Color
9%
9%
4%
16%
7%19%
20%
7%
9%
Red to Green
Green to Red
Yellow to Red
Green to Yellow
Light Gray to White
Black to Dark Gray
Dark Gray to Light Gray
White to Black
Black to White

32
Results-Graph 3Percent of Results having Lowest (Quickest) Reaction Time per Color
0% 11%
27%
4%
20%
2%
7%
7%
22%
Red to Green
Green to Red
Yellow to Red
Green to Yellow
Light Gray to White
Black to Dark Gray
Dark Gray to Light Gray
White to Black
Black to White

33
Results-Graph 4
Percent Difference in Reaction Time by Color Transitions
31
34
37
34
28
29
30
31
32
33
34
35
36
37
38
red-green/green-red yellow-red/green-yellow black-white/white-black average
Color Transitions
Dif
fere
nce
in
Per
cen
t

34
Results-Explanation Graph 1 is a plot of scaled (relative) reaction times
against color distance.
Graph 2 is a chart of the percent of users who reacted most slowly to each color
Graph 3 is a chart of the percent of users who reacted most quickly to each color
Graph 4 is a chart of the percent difference in conjugate transitions which have the same color distance (e.g. Black-White and White-Black)
Please refer to the appendix to see individual results

35
Discussion

36
DiscussionThe average of all the raw data (time in ms) was
found to be 319 ms. This fits the expected value of 180 ms for reaction time plus mechanical latency (Human Motor Behavior: An Introduction, pg. 70)
In Graph 1 shows the relative averages of all 400 times into 5 groups. These raw data points don’t show a very strong corelation but Excel’s best-fit function reveals that there is a correlation in the data which proves that as color distances increases, reaction time decreases.

37
DiscussionBecause the first hypothesis states color distance
as the only independent variable, it would follow that conjugate colors transitions that have equal color distances trigger similar reaction times. Graphs 3 and 4 counter-prove this. If the order the colors are presented had no affect, then there should be equal percentages of highest color transitions for black-white/white-black, red-green/green-red and green-yellow/yellow-red.

38
Discussion-contThis was not the case. Graph 4 shows that there is an average of 34% difference of time between color transitions of equal distance. Interestingly, though, Graph 2 seems to show similar percentages of quickest times for black-white, red-green and their conjugates, but not for green-yellow/yellow-red.
This leaves Hypothesis one partially proven. Color distance has a significant impact on reaction time, but it is not the only impact. The order the colors are presented also affect the reaction time.

39
Discussion-Possible Errors Users were not instructed to calibrate their
monitors, so in this experiment, there is no way to guarantee that colors were displayed correctly. This may have caused unpredictable data.
Despite the researcher’s best efforts in providing detailed instructions to users, lack of comprehension may have led to the incorrect assessment of reflex times. Users were, for example, asked not to engage in any other activity while doing the trials, but there is no guarantee this instruction was followed.
The sample set is biased since it mostly consists of students because the researcher was more easily able to use these subjects.

40
Discussion-Improvements This experiment could be improved by assuring every
user’s monitors represents colors equally. This can’t be assumed so the user would need to perform a color calibration.
If the experiment were performed in the presence of the researcher, he or she would be able to observe any inappropriate behavior and discard those results which are not accurate.
More trials could also be added to achieve higher accuracy. However, this may make the test too long and users can become uninterested, possibly skewing the data near the end of the test.

41
Discussion-Improvements If further research were warranted, the experiment
is extendable to thousands of users without any change in the design of the applications. The only limitation is divulgement of the project to larger amounts of people.
If more than 6 different color differences were used, Graph 1 could become much more defined. Again, care must be taken to not create an excessively long experiment.

42
Conclusion

43
Conclusion The First Hypothesis was proven because
reaction time does decrease as color distance increases. (Graph 1) This distance though isn’t the only determinant of reaction time because conjugate transitions had up to 37% difference for black-white transitions.
Graph 4 shows that the most effective transition is yellow to red with 27% of users having that as their quickest times. This is not the most contrasted difference as the color distance between yellow and red is only 255 (almost half of the distance between black and white).

44
Conclusion-cont.
The researcher concluded that this is attributed to the brightness of both of the colors which make users more alert. This rejects Hypothesis two which states that a transition of green-red would be most effective in prompting user reaction. In hindsight, this result appears to make sense if traffic lights are again considered. A green-to-red change does not occur, but rather a green-to-yellow and then a yellow to red change this data proves the effectiveness of the current traffic light system.

45
Conclusion-Application The least effective color transition for causing a
quick reaction time were nearly tied with 19% of users having black to dark gray and 20% dark gray to light gray as their slowest times.
Based on the data, any situation which demands a quick response will benefit by using a color change of Yellow to Red. Yellow has calming effects yet gets attention and Red is stimulating; this research can also be applied to video advertising to persuade a viewer towards an idea or product by evoking different emotions.

46
Acknowledgements
Thank you to: Adobe Systems Incorporated for the trial version of
Flash CS3
Matt Keller for his help in designing the computer applications
All participants who responded to the project and provided the researcher with data (Mrs. Flake’s US History and Mrs. Buffington’s AP Biology classes, and friends of mine.)

47
Bibliography/ReferencesHuman Motor Behavior: An Introduction
J. A. Scott Kelso, Published 1982 Lawrence Erlbaum Associates available in part at: http://books.google.com/books?id=Z0TUIDbWNhwC&dq=reaction+time+proportional+to+stimulus&source=gbs_summary_s&cad=0)
ImageMAKER Development Inc. (2000). COLORCUBE Literature Retrieved February 8, 2008 fromhttp://www.colorcube.com/articles/articles.htm
Infoplease Article, Pearson Education (2007), Color Psychology Retrieved Feb 14, 2008 from http://www.infoplease.com/spot/colors1.html
Wikipedia, The Free Encyclopedia (February 2008). Mental Chronometry Retrieved February 14, 2008 fromhttp://en.wikipedia.org/wiki/Mental_chronometry
Wikipedia, The Free Encyclopedia (February 2008). Reaction Times Retrieved February 14, 2008 fromhttp://en.wikipedia.org/wiki/Reaction_time