Embed Size (px)
Citation preview
1
A time domain transmission sensor with TDR performance characteristics 1
2
3
4
5
6
7
8
9
J.M. Blonquist Jr.*
S.B. Jones
D.A. Robinson
Dept. of Plants, Soils, and Biometerology, Utah State University, Logan, Utah, USA.
Email: ([email protected]) 10
11
12
Fax: (435) 797-2117 Attn. Mark Blonquist
*Corresponding Author
2
A time domain transmission sensor with TDR performance characteristics 1
2
3
4
5
6
7
8
9
10
11
12
13
14
15
16
17
18
19
20
Abstract
Time domain reflectometry (TDR) has become a standard method for determining water
content in soils and porous media. However, the cost of instrumentation and the level of user
ability required often limit its application, especially for agricultural and urban soil water
management. The objective of this paper is to report on a new, lower cost time domain
transmission (TDT) sensor and to demonstrate that it has the performance characteristics of
commonly used TDRs. We approximate the sampling volume of the TDT sensor and compare it
to that of TDR. We demonstrate that the sensor accurately determines permittivity from travel
time measurements by comparing the TDT sensor with two TDR instruments, and a network
analyzer providing measurements of frequency dependent permittivity. Both TDRs and the TDT
operated within ± 3 permittivity units of each other across the measured permittivity range of 9
to 80. The reported rise time of the TDT sensor is 180 picoseconds, which suggests a frequency
bandwidth and upper frequency limit similar to TDR. We determine the maximum passable
frequencies of all three instruments in non-relaxing media and demonstrate that they are in fact
quite similar with the average maximum passable frequencies of the two TDR systems being
1.64GHz and 1.45GHz, and the average maximum passable frequency of the TDT being
1.23GHz. In addition to having accuracy and frequency characteristics similar to TDR the TDT
sensor offers the advantage of having the pulse generating and sampling electronics mounted in
3
the head of the probe which reduces attenuation and overcomes the constraint that prevents TDR
being used with long coaxial cables and multiplexers connecting the instrument to TDR probes.
1
2
3
4
5
6
7
8
9
10
11
12
13
14
15
16
17
18
19
20
21
Keywords: time domain reflectometry, time domain transmissometry, permittivity measurement,
soil water content.
1. Introduction
Transmission line, electromagnetic measurement methods have proved reliable for
determining soil water content in both laboratory and field settings (Topp and Ferre, 2002;
Robinson et al., 2003). Understanding of both the measurement technique (Topp and Ferre,
2002; Robinson et al., 2003) and the dielectric properties of soils (Heimovarra et al., 1994;
Friedman, 1998) have advanced considerably since the seminal paper presented by Topp et al.
(1980). In many water management applications, water content sensor technology such as TDR
could greatly improve efficiency and conserve energy and water resources. TDR is not the
solution to all soil water content sensing problems, but has the advantage of being in situ, real-
time, and more accurate than less expensive, low frequency devices. TDR sensing utilizes
probes that are relatively easy to manufacture and insert into samples. Ease of insertion is
advantageous in situations where minimum sample disturbance is required. TDR can also
simultaneously determine water content and electrical conductivity within certain limits. In
addition, automated collection and the instrument’s ability to be connected with a multiplexer
allows for a number of locations to be sampled, almost simultaneously.
4
1
2
3
4
5
6
1.1 TDR
Despite all of it’s advantages, the cost of time domain reflectometry (TDR) and the level
of ability required by the operator often places it beyond the means of growers. Within the last
few years there have been a number of attempts to address many of these issues. Systems such as
the TDR100 (Campbell Scientific, Logan, UT; www.campbellscientific.com verified 4 May
2004), Mini Trase (Soil Moisture Equipment Corps, Santa Barbara, CA;
7
www.soilmoisture.com
verified 4 May 2004) and Trime (Mesa Systems Co., Medfield, MA;
8
www.mesasystemsco.com
verified 4 May 2004) are smaller, more portable and more rugged (Robinson et al., 2003).
However, the design concept of a stand alone sensor of low cost (<$500), small size, high
accuracy and precision in the determination of permittivity that covers a representative sampling
volume has not been forthcoming with TDR technology. The closest instrument is perhaps the
Theta Probe (Dynamax Inc., Houston, TX;
9
10
11
12
13
http//:www.dynamax.com) which uses transmission
line technology to measure impedance (Gaskin and Miller, 1996). Capacitance and impedance
probes have tended to fill the lower price market. These instruments tend to be limited to
operating frequencies < 150 MHz which is undesirable if the soil has dielectric dispersion in this
frequency range, which is mostly attributed to 2:1 clay minerals such as illite or montmorillonite.
Most of these instruments do not permit the measurement of bulk soil electrical conductivity
which can be useful for management purposes. Many of the capacitance sensors are sensitive to
interference from bulk soil electrical conductivity (Robinson et al., 1998; Kelleners et al., 2004)
14
15
16
17
18
19
20
21
5
and while many will continue to operate, the prediction of water content can be very poor
(Baumhardt et al., 2000). In addition to cost and user-ability limitations, TDR sensor systems are
limited by the length of cable that the probe can be attached to without signal attenuation
compromising accurate permittivity and subsequently, water content determinations. Sensor
systems in field site locations must have coaxial cable running from the probe to the cable tester
(i.e. signal generating and sampling electronics), which with signal attenuation in the cables
tends to limit the radial distance that probes can be placed to about 30-m. Signal attenuation in
cables filters out the higher frequency signal components in the same manner that dielectric
relaxation of the sampled medium filters the higher frequency signal components (Robinson et
al., 2003). This is disadvantageous owing to the higher frequency signal components
determining the signal travel time.
1
2
3
4
5
6
7
8
9
10
11
12
13
14
15
16
17
18
19
20
21
1.2 Recent developments using TDT
Topp et al. (2001) described the use of TDT as part of a water content sensing
penetrometer. They helically wrapped a parallel pair transmission line around the end of a
penetrometer and connected the pulse transmitting and sampling hardware via 50Ω coaxial
cables (Topp et al., 2001). They converted the TDT frequency output to voltage via a frequency
to voltage converter and related the measured signal voltages to permittivity values via empirical
calibration in organic liquids of known permittivity (Topp et al., 2001). The voltage differences
between samples result from increasing propagation velocity (i.e. decreasing travel time) along
6
the transmission line as the permittivity of the liquids decreases (Topp et al., 2001). Empirically
determined permittivity values (from the permittivity/voltage calibration) measured in laboratory
and field soil samples then allowed for soil water content prediction. Using this method they
reported an error in predicted water content of ±0.02 m
1
2
3
4
5
6
7
8
9
10
11
12
13
14
15
16
17
18
19
20
21
3m-3 (Topp et al., 2001). Water content
prediction errors were attributed to sample disturbance caused during penetrometer insertion
(Topp et al., 2001).
Harlow et al. (2003) applied two TDT techniques to measure the water content of
variably saturated sands with a wide range of pore water electrical conductivities by connecting
a network analyzer to a 2-rod parallel transmission line embedded in a column (i.e. sample
container). The first of their methods determined travel time in the sample by calculating the
time difference between transmitted pulse peaks (displayed in the time domain) in the sample
and in air (Harlow et al., 2003). This method assumes that the pulse travel time along the cable
linking the network analyzer and the sample is the same for each measurement. Their second
method involved converting time domain measurements to the frequency domain via Fast
Fourier Transformation and then calculating travel time in the sample via phase difference
between air and the sample (Harlow et al., 2003). They reported that the travel time/water
content calibrations derived using their TDT techniques compare quite well to TDR travel
time/water content calibrations made by Hook and Livingston (1995).
Hook et al. (2004) also employed the same TDT methods used by Harlow et al. (2003) to
investigate electrical conductivity effects on the accuracy and uncertainty of TDR water content
measurements in saturated sands. They applied TDT measurement methods to negate the large
7
air/soil boundary reflection often associated with TDR measurements (Hook et al., 2004). Their
results showed good correlation between pulse rise time, which increased with increasing sample
electrical conductivity, and the average error associated with water content predictions (Hook et
al., 2004).
1
2
3
4
5
6
7
8
9
10
11
Acclima® has developed a time domain transmission (TDT) soil water content sensor
referred to as a Digital TDT Sensor. Similar to TDR, which relies on a reflection travel time
measurement, the Digital TDT Sensor measures dielectric permittivity using a transmission
travel time measurement. A major advantage of the Acclima Digital TDT Sensor is a
considerably reduced cost and packaging size. The objective of this study was to test the
performance of the Digital TDT Sensor against two TDR instruments, comparing probe design,
sampling volume, permittivity determination, and maximum passable frequency. The Acclima
Digital TDT Sensor (Acclima Inc., Meridian, ID; http//:www.acclima.com verified 4 May 2004)
was compared with the Tektronix 1502B cable tester (Tektronix Inc., Beaverton, OR;
12
13
http//:www.tektronix.com verified 4 May 2004) and the Campbell Scientific TDR100 (Campbell
Scientific Inc., Logan, UT;
14
http//:www.campbellsci.com verified 4 May 2004) both connected to
a standard 0.15-m probe.
15
16
17
18
19
20
21
8
2. Theoretical Considerations 1
2
3
4
5
6
7
8
2.1 Transmission line theory
TDR and TDT transmission line techniques can be used to measure dielectric permittivity
from the travel time of an electromagnetic signal propagating along a probe buried in a dielectric
which could be any liquid or porous medium. The phase velocity (vp) of the instrument signal is
a function of the electromagnetic properties of the medium:
rr
pcvµε
= 1) 9
10
11
12
13
14
where c is the speed of light in vacuum (3×10⁸ m s-1), and εr and µr are the dielectric permittivity
and magnetic permeability of the medium, relative to vacuum. Most materials are non-magnetic,
thus µr is equal to one and εr determines the pulse propagation velocity. TDR estimates an
apparent permittivity (Ka) which is considered equivalent to εr for materials without dielectric
loss. Ka is determined by rearranging Eq. 1 for εr (=Κa) and setting vp=L/t as follows:
22
2⎟⎠⎞
⎜⎝⎛=⎟
⎟⎠
⎞⎜⎜⎝
⎛=
Lct
vcK
pa 2) 15
16
17
18
19
20
where L is the physical probe length [m], and t is the pulse travel time [s] in the sample. With
TDR the pulse is reflected at the end of the probe and the return signal is sampled. The factor 2
in the denominator of Eq. 2 accounts for the two-way (down and back) travel time of the TDR
signal. With TDT the pulse travels the length of the probe once and the transmitted signal is
sampled. Thus TDT determination of Ka is the same as with TDR, the only difference being
9
measurement of one-way travel time (i.e. the factor of 2 is omitted from Eq. 2). For most
hydrological and environmental applications the determination of K
1
2
3
4
5
6
7
8
9
10
11
12
13
14
15
16
17
18
19
20
21
a leads to a calculation of
volumetric water content (θv) made using either empirical equations (Topp et al., 1980; Malicki
et al., 1996) or dielectric mixing models (Roth et al., 1990; Dirksen and Dasberg, 1993;
Friedman, 1998).
2.2 Dielectric measurement and water content determination
It has been established that for many soils there is a strong relationship between apparent
permittivity (Ka), determined by transmission line sensors, and soil water content (Topp et al.,
1980; Malicki et al., 1996). The reason for this is the strong contrast between the permittivities
of water (εw≈80) with those of mineral soil solids (εs≈2-9) and air (εa≈1). The accuracy and
precision of dielectric permittivity determined using TDR enables accurate water content
predictions (less than ±0.03 m3m-3) in many coarse textured soils (Topp et al., 1980; Hook and
Livingston, 1995). Although measuring water content is generally the ultimate goal, it is inferred
from porous media permittivity measurements using travel time analysis, which is subject to
other secondary factors including water status (e.g., bound, free), particle shape, configuration of
constituents (e.g, water, solid, air), ion concentration and others (Jones and Or, 2003; Jones and
Or, 2002). The effect on the measured permittivity may be related to unwanted relaxations (e.g.,
Maxwell-Wagner) or other porous media-related effects that alter the apparent water-phase
dielectric leading to potential errors in water content determination. For this reason, the
10
instrument comparisons herein utilize liquids that provide homogeneous backgrounds and
uniform dielectrics rather than soils or other porous media which tend to enhance unwanted
noise and uncertainty in the measurements.
1
2
3
4
5
6
7
8
9
10
11
12
13
14
15
16
17
18
19
20
3. Materials and Methods
3.1. TDR and TDT Probe Description and Design
Transmission line sensor Ka measurement quality is largely dependent on probe design
(Heimovarra, 1993; Ferre et al., 1998; Robinson et al., 2003). Probes are designed to imitate a
coaxial transmission line while being versatile enough for both laboratory and field applications.
Optimum probe design attempts to maximize the representative sampling volume, or the sampled
porous medium volume which contributes to the measurement (Ferre et al., 1998), while at the
same time minimizing signal attenuation across the rods and allowing for easy insertion into
samples. Figure 1 shows a photograph of the Campbell Scientific TDR100 connected to a
conventional 0.15-m 3-rod probe and the Acclima Digital TDT Sensor (0.60-m 2-rod loop probe
with the electronics contained in the probe head). The cross-section of the Digital TDT Sensor
provides a much greater sampling area due to its larger probe size and spacing as well as the dual
path for the signal travel required using TDT. Table 1 lists the dimensions of the TDR and TDT
probes displayed in Fig. 1.
11
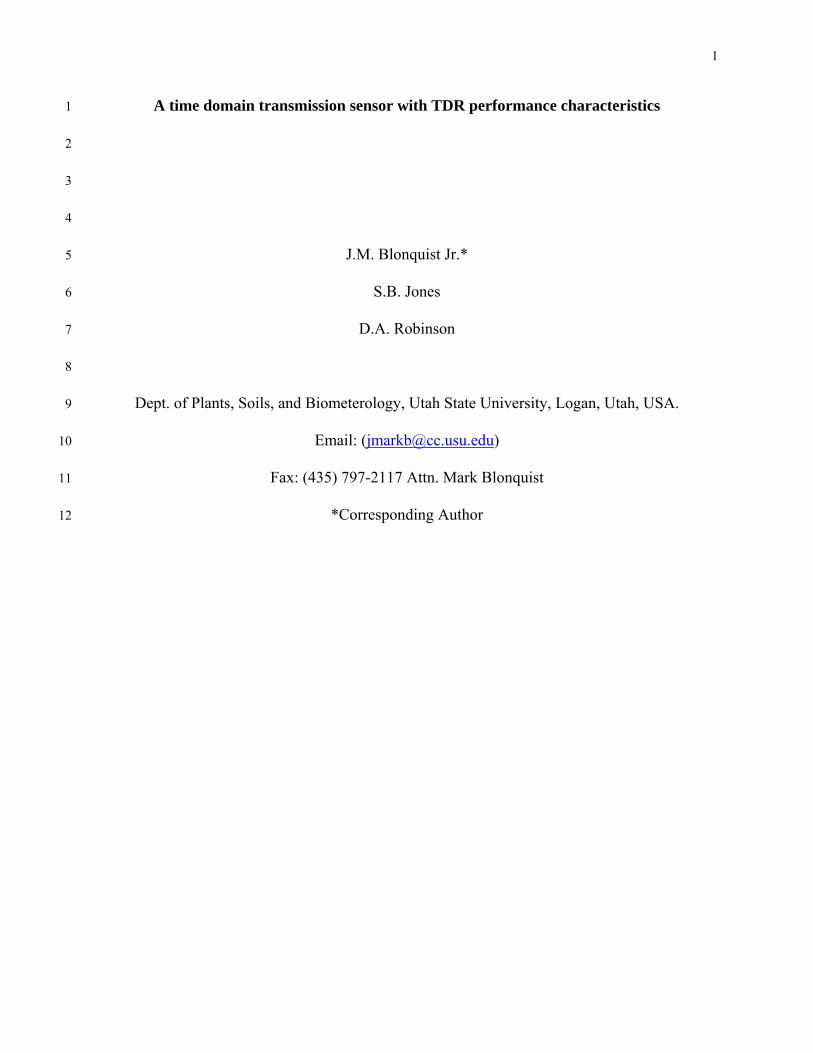
Figure 2 is a schematic drawing of the Digital TDT Sensor displaying the components
(Anderson, 2003), which are all contained within the 9.0- x 7.5- x 2.5-cm probe head. The basis
for a measurement is briefly described here. Similar to TDR the transmitting end of the Digital
TDT Sensor propagates a fast-rising step function down the transmission line comprised of
stainless steel rods. The digital acquisition system is positioned at the receiving end of the
transmission line which digitizes the waveform. The resulting digitized waveform is analyzed by
taking the first and second derivatives and extracting maximum slope points and maximum
inflection points in the waveform. Proprietary digital signal processing algorithms extract the
true propagation time of the received signal and permittivity is calculated from travel time (Eq.
2). For details on TDR system operation see Robinson et al. (2003). Table 1 compares the rise
times, output voltages, and digitized waveform points of the Digital TDT Sensor, Tektronix
1502B TDR, and Campbell Scientific TDR100.
1
2
3
4
5
6
7
8
9
10
11
12
13
14
15
16
17
18
19
20
21
3.2. Waveform interpretation
Both TDR and TDT instruments rely on computer software or firmware that capture and
analyze waveforms characteristic of the medium in which the probes are embedded. As
explained above the Acclima Digital TDT Sensor utilizes custom firmware within the probe head
to interpret waveforms for travel time. Currently a custom controller is required to power the
sensor and retrieve the measured waveforms and data. However, with a modification in the
communication protocol via the firmware, sensor control and data collection with common data
12
loggers is possible. The Tektronix 1502B TDR waveforms were captured and interpreted for
travel time measurement with WinTDR waveform analysis software (Or et al., 2003; available at
1
2
http://129.123.13.101/soilphysics/wintdr/index.htm verified 4 May 2004). The Campbell
Scientific TDR100 measurements were made with Campbell Scientific PCTDR software
(included with purchase of TDR100).
3
4
5
6
7
8
9
10
11
12
13
14
15
16
17
18
19
20
21
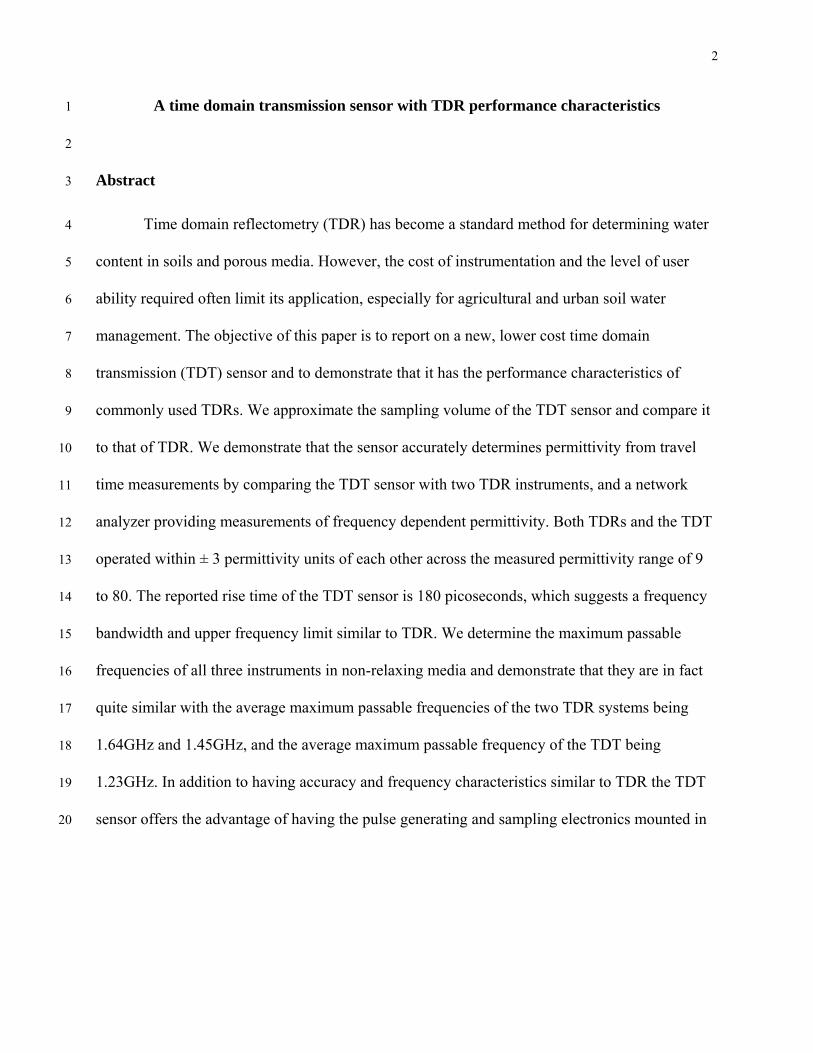
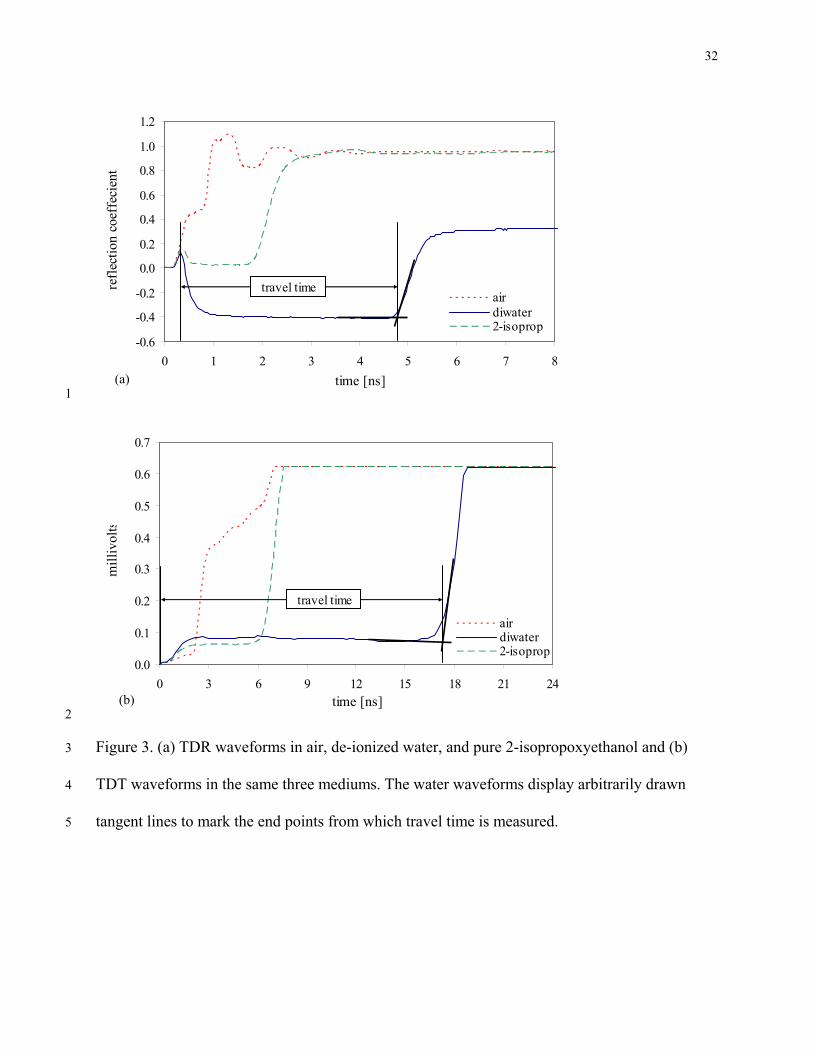
TDR and TDT waveforms measured in air, 2-isopropoxyethanol and water are shown in
Figure 3. It should be noted that currently the Acclima Digital TDT Sensor only allows for a
maximum voltage value of 0.6225 mV to be output, thus the waveforms shown are terminated
everywhere this voltage value is exceeded. Tangent line fitting to mark the probe ends was
accomplished by the described firmware for the Digital TDT Sensor, and WinTDR and PCTDR
software for the Tektronix TDR and TDR100, respectively. The Digital TDT Sensor firmware
and TDR software algorithms measure travel time via tangent line fitting to mark the beginning
and end of the respective probes. Figure 3 displays arbitrarily drawn tangent lines marking the
probe end to illustrate what the firmware and software accomplish. Calibration of both the TDR
probe and the Digital TDT Sensor was conducted using measurements in air and de-ionized
water according to the methodology described in Heimovaara (1993) and Robinson et al. (2003).
This calibration procedure determines the position of the vertical line marking the beginning of
the probe in Figure 3. Travel times measured with the described firmware and software were
adjusted based on this calibration procedure.
13
3.3. Comparison of sampling volume and permittivity measurement 1
2
3
4
5
Knight (1992) related the energy density distribution surrounding TDR probe rods to the
sampling volume in a homogeneous isotropic dielectric medium. The relative electromagnetic
energy density distribution of both the TDT and TDR probes was modeled using the Arbitrary
Transmission Line Calculator, ATLC (http://atlc.sourceforge.net/ verified 4 May 2004) (Kirkby,
1996). The ATLC software program uses a finite difference approach to calculate characteristic
impedances of prescribed geometries assumed to function as transmission lines.
6
7
8
9
10
11
12
13
14
15
16
17
18
19
20
21
An experiment was also conducted to examine the spatial sensitivity of the Digital TDT
Sensor using an air/water interface (i.e. significant dielectric discontinuity). The probe was
oriented with the long dimension positioned horizontally and then vertically immersed in de-
ionized water with permittivity measurements being made at 0.01-m vertical increments. The
initial measurement was made in air with the probe suspended 0.15-m above the de-ionized
water and the final measurement was made when the instrument was submersed to a 0.15-m
depth in the water.
A comparison of permittivity determination was conducted using air (εa=1) and twelve
solutions ranging from ε ≈ 9 to ε ≈ 80 under temperature controlled conditions. Comparisons
were made between measurements taken with the Tektronix 1502B TDR and Campbell
Scientific TDR100, both connected to the described 0.15-m long 3-rod probe and with the
Acclima Digital TDT Sensor. Frequency domain measurements of permittivity were also made
using a HP8752C network analyzer and HP85070B dielectric probe, which served as the
14
reference for dielectric measurements. The sample solutions were made using fractions of de-
ionized water mixed into 2-isopropoxyethanol with the permittivity extremes, ε ≈ 9 and ε ≈ 80,
coming from pure 2-isopropoxyethanol and undiluted de-ionized water. De-ionized water and 2-
isopropoxyethanol were selected to make the solutions because neither exhibits significant
dielectric relaxation within the TDR frequency bandwidth, which is reported as 20kHz to
1.75GHz (Heimovaara, 1994).
1
2
3
4
5
6
7
8
9
10
11
12
13
14
15
16
17
18
19
20
21
3.4. Maximum passable frequency
The frequency bandwidth associated with the electromagnetic signal generated by TDR
and TDT sensors is made up of a broad range of frequencies. The maximum passable frequency
is the frequency associated with the fastest traveling portion of the transmitted signal in a
dielectric material (Robinson et al., 2003). Essentially this frequency is the highest signal
frequency that is not filtered by the sample or cables, and indicates the upper frequency limit of
the sensor for the specific sample measured. The maximum passable frequency for each sensor
was determined in each of the described 2-isopropoxyethanol/de-ionized water solutions using
the method of Or and Rasmussen (1999), also described in Robinson et al. (2003). This method
matches the Ka value determined by the TDR or TDT to the frequency-dependent real
permittivity (ε’) value measured in the frequency domain with the network analyzer. This
method relies on the sample liquid in exhibiting slight dielectric relaxation so that there is a
small change in the permittivity as a function of frequency. An average maximum passable
15
frequency for each sensor was also calculated by averaging the maximum passable frequencies
determined for each sensor in the permittivity range between ε ≈ 9 and ε ≈ 60.
1
2
3
4
5
6
7
8
9
10
11
12
13
14
15
16
17
18
19
20
21
4. Results
4.1. Instrument sampling volume
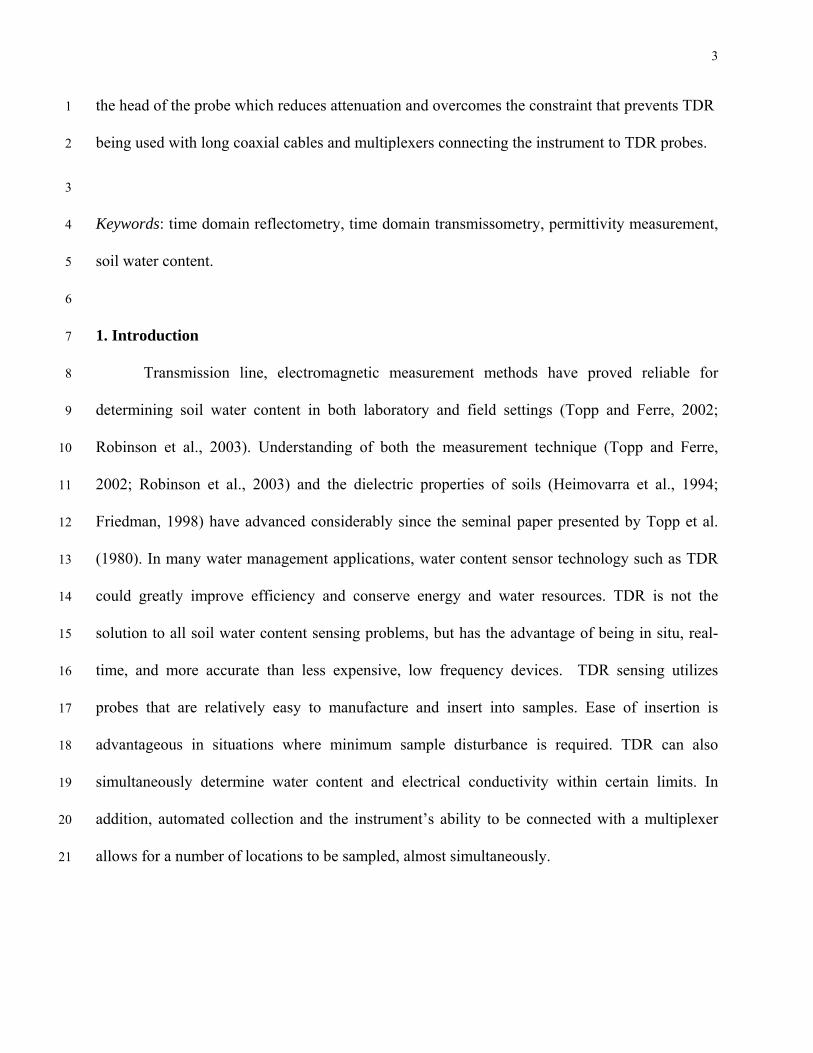
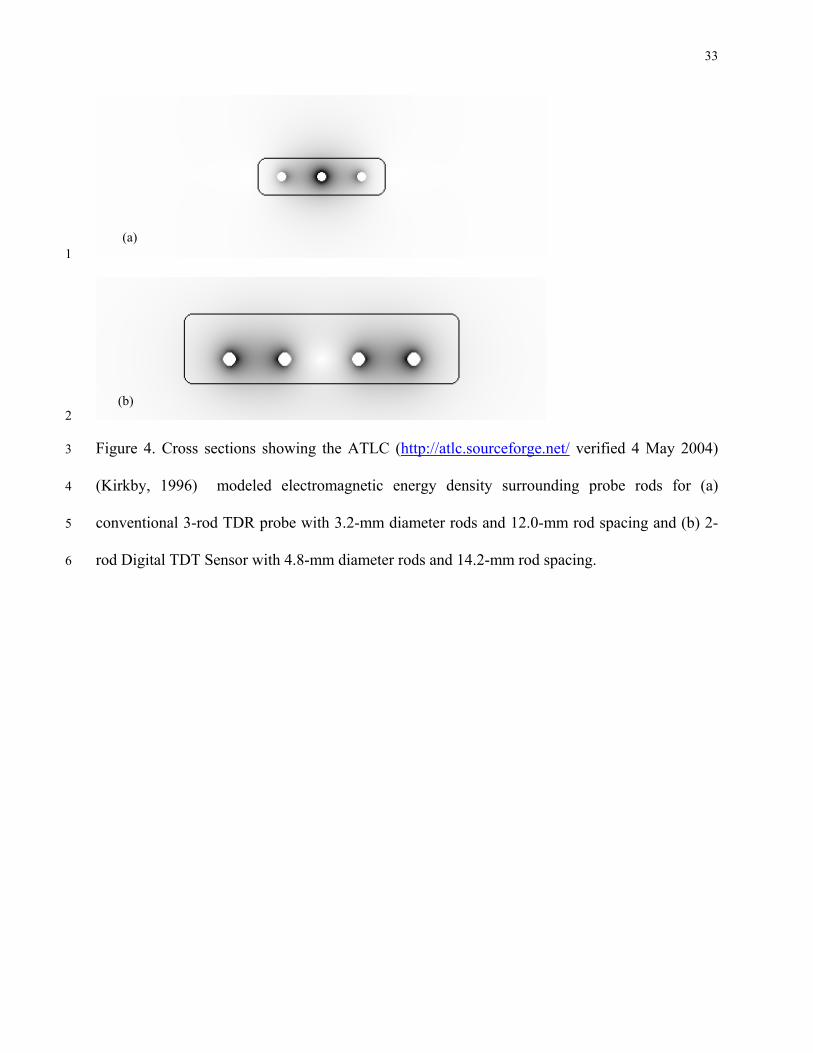
The representative sampling volume of a given probe is inferred from calculation of the
electromagnetic energy density distribution surrounding the probe rods. The results of the
electromagnetic energy density calculations (accomplished with the described ATLC software)
for the TDR and TDT probes are presented in Fig 4. The figures display a cross section view of
the two probes with the black lines outlining the probe heads to indicate scale and the shaded
area representing the calculated electromagnetic energy density surrounding the rods. The darker
the shading the denser the electromagnetic energy, with the darker areas contributing greater
weight to the measurement. The density calculations show the densest electromagnetic energy
surrounding the middle rod of the TDR probe and a more even distribution between the two TDT
rods when compared with the TDR probe.
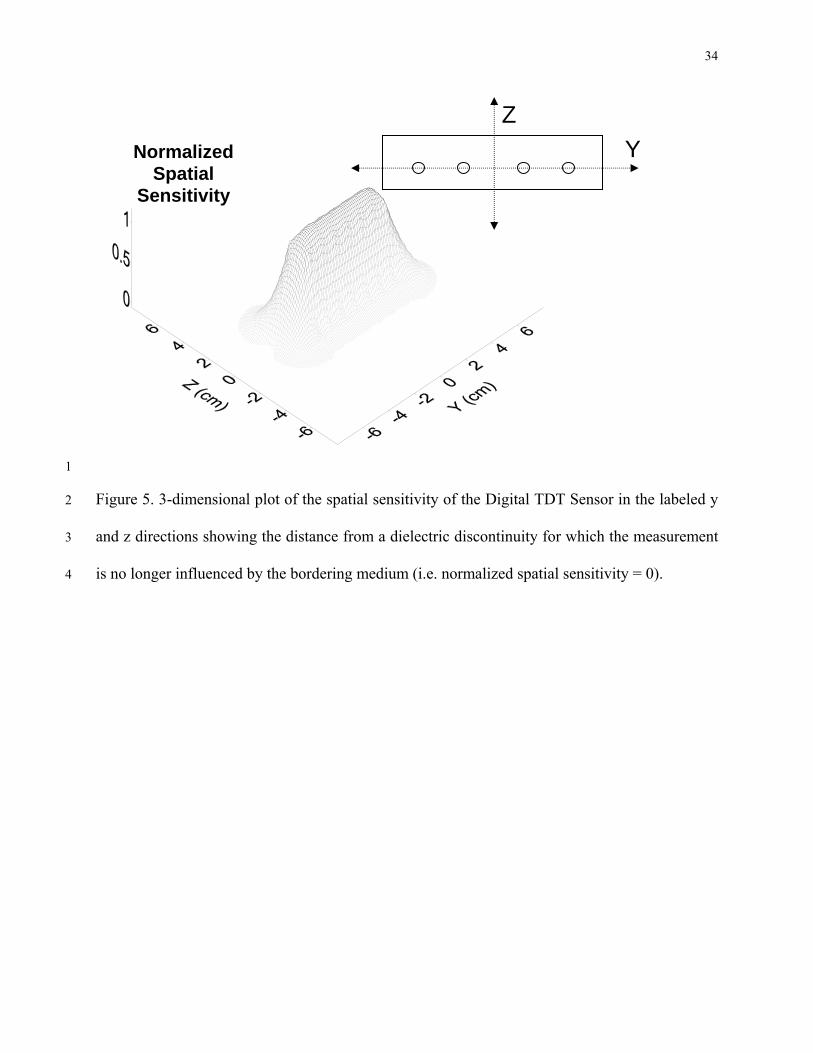
Figure 5 displays the spatial sensitivity (determined in the submersion experiment) of the
TDT sensor in the space adjacent to the y- and z-dimensions (labeled in the figure) of the probe.
The normalized spatial sensitivity is reported as a numerical factor derived by subtracting from
one the measured permittivity divided by the expected permittivity, with the expected
16
permittivity being the permittivity measured with the probe completely submersed in a
homogenous medium (i.e. water). The spatial sensitivity plot relates to the representative
sampling volume and can be interpreted qualitatively as the distance from a significant dielectric
discontinuity (i.e. air/water boundary) at which the probe is no longer influenced by the
bordering dielectric medium. Figure 5 shows that the sensor is not greatly influenced by sample
that lies beyond ~ 6 cm from the center of the probe in the y direction and ~ 3 cm from the center
of the probe in the z direction. The sampling volume will play an important role when
considering depth of placement for irrigation management or experimental setup.
1
2
3
4
5
6
7
8
9
10
11
12
13
14
15
16
17
18
19
20
21
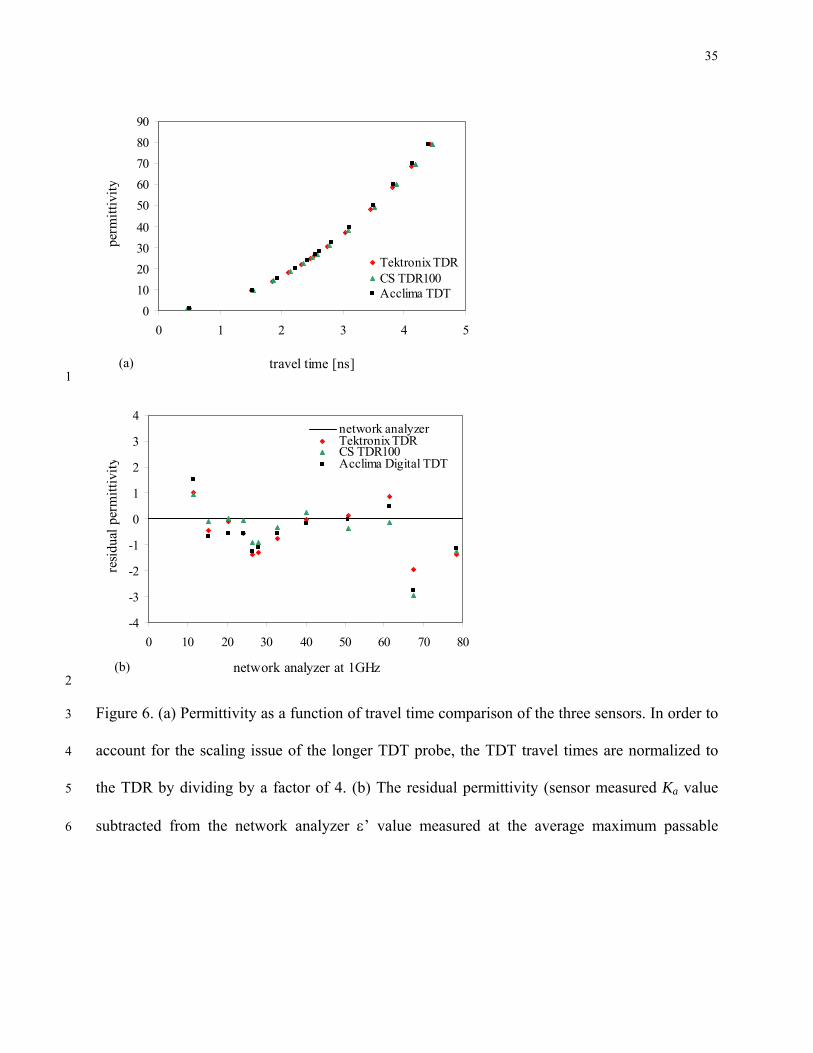
4.2. Permittivity measurements
Comparisons of sensor measured Κa values as a function of measured travel times are
shown in Figure 6a. The TDT travel time measurements are divided by a factor of 4 to account
for the 0.60-m probe length compared to the 0.15-m TDR probe length. Technically, the Digital
TDT Sensor signal travel length is only twice the TDR travel length, but both the Tektronix TDR
and TDR100 account for the reflection measurement and output waveforms displaying one way
travel time. Thus, the TDT travel time must be scaled by a factor of 4, despite the fact that the
TDR signal is traveling down and back along the probe. Figure 6a shows that the TDR and TDT
sensors follow the same Κa - travel time trend. Figure 6b displays the residual permittivities of
each sensor plotted as a function of measured network analyzer ε’ values at 1GHz. The residual
permittivity is the difference between the measured Ka values for each sensor and network
17
analyzer ε’ values measured at the average maximum passable frequency (reported below) of the
sensor. Figure 6b shows that all three sensors fall within a range of less than ±3 permittivity units
of the network analyzer. Measured travel time, and hence, K
1
2
3
4
5
6
7
8
9
10
11
12
13
14
15
16
17
18
19
20
21
a differences between the sensors are
attributed to the differing average maximum passable frequencies of the sensors and the slight
relaxation of the media. The real component of medium permittivity decreases as frequency
increases due to dielectric relaxations. Thus travel time, and hence, Ka measurements made at
higher frequencies, will be slightly lower than those measured at lower frequencies.
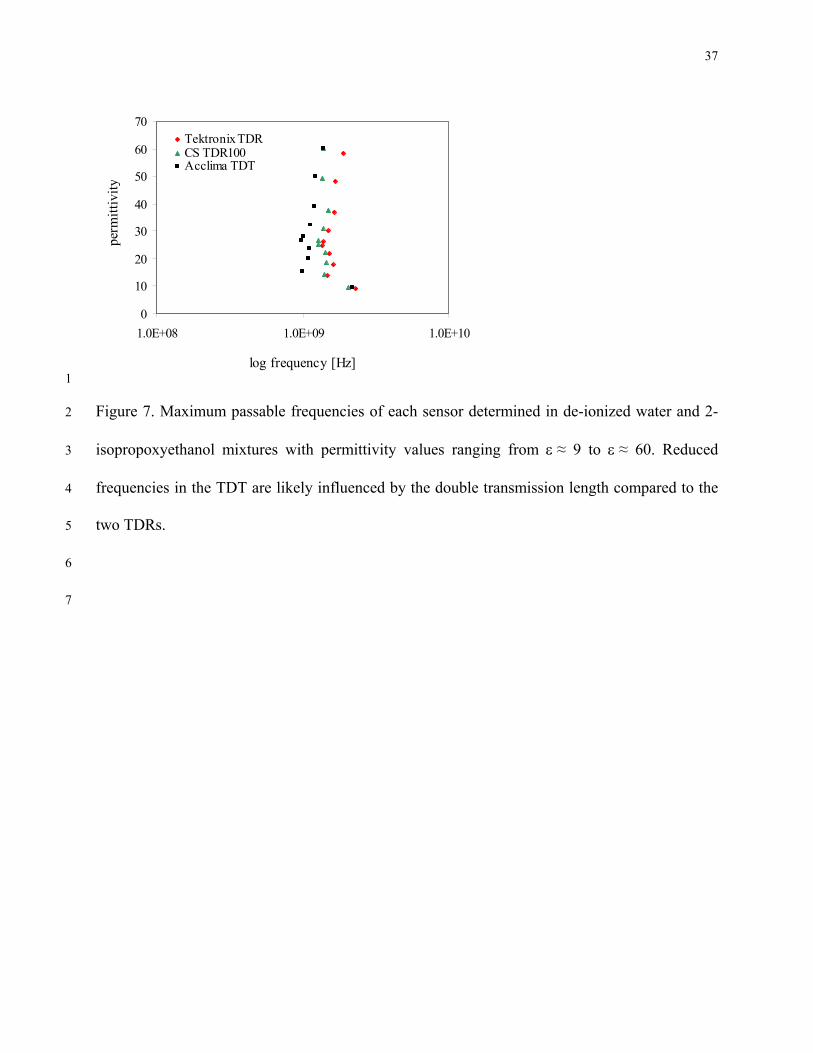
4.3. Instrument frequency characteristics
Figure 7 displays the sensor measured permittivity values plotted as a function of
maximum passable frequency. The average maximum passable frequencies for the 3-rod 0.15-m
probe connected to Tektronix TDR, 3-rod 0.15-m probe connected to the TDR100, and Digital
TDT Sensor are 1.64GHz, 1.45GHz, and 1.23GHz, respectively, and the maximum passable
frequency standard deviations are 0.282GHz, 0.222GHz, and 0.369GHz, respectively. The TDR
and TDT maximum passable frequencies compare quite well at all measured data points between
the solution permittivity range of ε ≈ 9 to ε ≈ 60. This analysis shows that the Digital TDT
Sensor frequency bandwidth is comparable to that of TDR. As the instruments all have similar
rise times they should all have similar frequency bandwidths. The TDT maximum passable
frequency values are generally a little lower than the corresponding TDR measurements. This is
considered to be due to the longer signal travel time of the Digital TDT Sensor which will allow
18
time for slightly more attenuation of the higher frequency components of the signal. As stated
above, maximum passable frequency differences explain the slight travel time, and subsequently,
K
1
2
3
4
5
6
7
8
9
10
11
12
13
14
15
16
17
18
a differences measured by each of the sensors and shown in Figures 6a and 6b. Owing to the
slight relaxation of the media within the sensor frequency bandwidths, sensors operating at lower
a maximum passable frequency will measure slightly higher travel times (dielectrics) than
sensors operating at a higher maximum passable frequency.
At permittivity values greater than ε ≈ 60 it becomes difficult to determine a maximum
passable frequency because the solutions show insufficient change in permittivity as a function
of frequency to locate a valid value of frequency, thus the two solutions of highest permittivity
are omitted from Figure 7 and not used in the average maximum passable frequency calculations.
Figure 7 also shows that the maximum passable frequencies for each sensor vary over the
measured Ka range. The maximum passable frequency differences at each Ka step are attributed
to the slight relaxation of the 2-isopropoxyethanol/de-ionized water solutions within the sensors’
frequency bands. The data points corresponding to the lowest maximum passable frequencies are
measurements from the solutions showing the most significant relaxation. Dielectric relaxation
of the liquid causes more attenuation of the higher frequency components of the signal and thus
lower maximum passable frequency values overall (Robinson et al., 2003).
19
5. Discussion 1
2
3
4
5
6
7
8
9
10
11
12
13
14
15
16
17
18
19
20
21
As stated Ka measurement quality is largely dependent on the sample from which the
measurement is taken being representative of the medium. The larger sample volume enclosed
by the Digital TDT sensor and the more uniform electromagnetic energy density distribution
surrounding the rods indicate that the Digital TDT Sensor likely averages travel time
measurements from a greater sample volume. More importantly, the uniform electromagnetic
energy density distribution of the Digital TDT sensor rods indicates that it also lends more
weight to the measurement from a greater sample volume. In contrast the density concentration
near the middle TDR rod gives possibility for increased measurement error because the sample
near the middle rod surface is subject to greater disturbance during insertion.
The Tektronix TDR has been considered a standard for soil water content prediction due
to its ability to accurately measure permittivity. The travel time and Ka measurement
comparisons in Figs. 6a and 6b indicate that the Digital TDT Sensor measures travel times and
determines Ka values comparable to the two TDR instruments across the entire permittivity
range evaluated here (~ 9 to ~ 80), which is commonly measured in soils and porous media. The
differences observed between the TDRs and the TDT are likely due to the maximum passable
frequency differences of the sensing systems. The Tektronix TDR shows the highest maximum
passable frequency and therefore the lowest travel times (i.e. fastest traveling signal), while the
Digital TDT Sensor shows the lowest maximum passable frequency and therefore the highest
travel times. As explained the maximum passable frequency differences reported are likely due
20
to the longer rod length of the Digital TDT Sensor allowing for the signal to experience greater
attenuation in the slightly relaxing media used for measurements. It should be remembered that
maximum passable frequency is a function of not only the media in which measurements are
made and the rod length, but also the cable length connecting the rods to the electronics which
generate and sample the signal. Herein lies another advantage of the Digital TDT Sensor over
TDR in that the signal generating and sampling firmware is located within the probe head of the
Digital TDT Sensor thereby negating coaxial cable losses experienced with TDR.
1
2
3
4
5
6
7
8
9
10
11
12
13
14
15
16
17
18
19
20
21
In addition to having the electronics mounted in the probe head and showing
measurement accuracy and frequency characteristics similar to TDR, the Acclima Digital TDT
Sensor technology can significantly reduce the price constraints of TDR. The costs of the sensor
systems considered herein are listed in Table 1 with the minimum system cost representing the
minimum cost requirement to make Ka measurements and θv predictions. The Digital TDT
Sensor was designed to control irrigation according to a threshold water content estimated in the
given medium, and thus currently requires a custom controller to power the sensor and retrieve
the measured data. Different controllers currently exist with the cheapest of these being the
RS500 whose price is listed in Table 1. As explained above, with a modification in the
communication protocol via the firmware the possibility of a stand-alone probe costing $349
(Table 1) and outputting water content directly to a data logger exists.
The major disadvantage with TDT technology is that it requires a sensing loop (Fig. 1),
which generally means soil excavation rather than insertion for sensor placement. This could
potentially be a source of error owing to the possibility of introducing density differences
21
between the sample surrounding the rods and the rest of the medium being characterized. In
addition, the longer rod length (0.60m) of the Digital TDT Sensor allows for greater attenuation
of the signal and therefore more filtering of the higher frequency components of the signal. The
longer probe length was selected to maintain timing accuracy and optimize the trade-off between
resolution and signal attenuation, both of which increase with increasing length. However,
assuming the rods are the same length for given TDR and TDT probes, the TDT would
experience less signal attenuation owing to it’s one way travel time. Also, the possibility exists
of manufacturing probes with shorter rods and converting the current TDT measurement to a
TDR measurement which would allow for pointed rods.
1
2
3
4
5
6
7
8
9
10
11
12
13
14
15
16
17
18
19
20
21
While the Digital TDT Sensor is currently designed to control irrigation, the high quality
measurement capability of the sensor coupled with the unique design of installing the firmware
within the probe head and low cost heralds a new generation of soil water content sensing
technology that will advance water management and sensing capabilities. Sensors of this nature
are particularly suited not only to developing water savings in turf grass management and
irrigation scheduling for gardens and municipal areas, but would provide greater accuracy in
weather station monitoring of soil moisture which is a growing need for remote sensing
measurement validation. We see the Acclima Digital TDT Sensor potentially providing a rugged
alternative to TDR in precision laboratory instrumentation applications in addition to a variety of
hydrologic and water management applications.
22
6. Conclusions 1
2
3
4
5
6
7
8
9
10
11
12
13
14
15
16
17
18
19
TDR is widely accepted as a standard real-time, in situ technique for determining soil and
porous media water content owing to its ability to make relatively accurate permittivity estimates
and to the exploitation of the significant permittivity contrast between water and other porous
medium constituents. However, TDR applications may be limited due to high costs, user ability
requirements, and problems when connecting TDR probes to long lengths of cable. The Acclima
Digital TDT sensor has the potential to offer a more affordable alternative. The Acclima Digital
TDT Sensor frequency bandwidth and permittivity estimates based on travel time measurements
compare quite well to those of the Tektronix TDR and Campbell Scientific TDR100. The
Acclima Digital TDT Sensor has the advantage over TDR in that signal transmitting and
sampling hardware is located in the sensor head negating cable losses. TDT is also advantageous
in that one-way travel time reduces signal attenuation in the sample (assuming sensor rods are
the same length). Although the Acclima Digital TDT Sensor is presently geared for closed-loop
irrigation control in turf grass where excavation is necessary for installation, refinement of the
rod geometry for insertion (and perhaps conversion to a TDR measurement) will likely rank this
TDT method alongside its TDR counterpart as an accepted laboratory and field standard for
determining soil moisture content.
23
Acknowledgements 1
2
3
4
5
6
7
The authors would like to extend special thanks Seth Humphries for assistance with the
experiment set-up and with the measurements, and to Scott Anderson for his comments and
drawing of the TDT circuitry. The authors would like to acknowledge funding provided in part
by USDA NRI grant 2002-35107-12507. This research was supported by the Utah Agricultural
Experiment Station, Utah State University, Logan, Utah, approved as journal paper number
7612.
24
References 1
2 3 4 5 6 7 8 9
10 11 12 13 14 15 16 17 18 19 20 21 22 23 24 25 26 27 28 29 30 31 32 33 34 35 36 37 38 39 40
Anderson S. K., (2003). Absolute-reading soil moisture and conductivity sensor. U. S. Patent 6 657 443. Date issued: 2 Dec. 2003.
Baumhardt, R.L., Lascano, R. J., Evett, S. R., (2000). Soil material, temperature, and salinity
effects on calibration of multisensor capacitance probes. Soil Sci. Soc. of Am. J. 64, 1940-1946.
Dirksen, C., Dasberg, S., (1993). Improved calibration of time domain reflectometry soil water
content measurements. Soil Sci. Soc. of Am. J. 57, 660-667. Ferre, P.A., Knight, J. H., Rudolph, D. L., Kachanoski, R. G., (1998). The sample areas of of
conventional and alternative time domain reflectometry probes. Water Resour. Res. 34, 2971-2979.
Friedman, S.P., (1998). A saturation degree-dependent composite spheres model for describing
the effective dielectric constant of unsaturated porous media. Water Resour. Res. 34 (11), 2949-2961.
Gaskin, G.J., Miller, J. D., (1996). Measurement of soil water content using a simplified
impedance measuring technique. J. of Agri. Eng. Res. 63, 153-159. Harlow, R.C., Burke, E. J., Ferre, P. A., (2003). Measuring water content in saline soils using
impulse time domain transmission techniques. Vadose Zone J. 2, 433-439. Heimovaara, T.J., Bouten, W., Verstraten, J. M., (1994). Frequency domain analysis of time
domain reflectometry waveforms 2. A four-component complex dielectric mixing model for soils. Water Resour. Res. 30 (2), 201-209.
Heimovaara, T.J., (1993). Design of triple-wire time domain reflectometry probes in practice and
theory. Soil Sci. Soc of Am. J. 57, 1410-1417. Heimovaara, T.J., (1994). Frequency domain analysis of time domain reflectometry waveforms
1. Measurement of the complex dielectric permittivity of soils. Water Resour. Res. 30 (2), 189-199.
Hook, W.R., Livingston, N. J., (1995). Errors in converting time domain reflectometry
measurements of propagation velocity to estimates of soil water content. Soil Sci. Soc. of Am. J. 59, 35-41.
25
Hook, W.R., Ferre, T. P. A., Livingston, N. J., (2004). The effects of salinity on the accuracy and uncertainty of water content measurement. Soil Sci. Soc. of Am. J. 68, 47-56.
1 2 3 4 5 6 7 8 9
10 11 12 13 14 15 16 17 18 19 20 21 22 23
Jones, S.B., D. Or. (2003). Modeled effects on permittivity measurements of water content in
high surface area porous media. Physica B 338:284-290. Jones, S.B., D. Or. (2002). Surface area, geometrical and configurational effects on permittivity
of porous media. J. Non-Crystalline Solids. 305:247-254. Kelleners, T.J., Soppe, R. O. W., Robinson, D. A., Schaap, M. G., Ayers, J. E., Skaggs, T. H.,
(2004). Calibration of capacitance probe sensors using electric circuit theory. Soil Sci. Soc. of Am. J. 68, 430-439.
Kirkby, D., (1996). Finding the characteristics of arbitrary transmission lines. Amateur
Radio J. QEX, 3-10. Knight, J.H., (1992). Sensitivity of time domain reflectometry measurements to lateral variations
in soil water content. Water Resour. Res. 28: 2345-2352. Malicki, M.A., Plagge, R., Roth, C. H., (1996). Improving the calibration of dielectric TDR soil
moisture determination taking into account the solid soil. Euro. J. of Soil Sci. 47, 357-366. Or, D., Jones, S. B., VanShaar, J. R., Wraith, J.M., (2003). WinTDR 6.0 Users Guide, Available
at: http://129.123.13.101/soilphysics/wintdr/documentation.htm (verified 4 May 2004). Utah Agric. Exp. Stn. Res., Logan, UT, USA.
24 25 26 27 28 29 30 31 32 33 34 35 36 37 38 39 40
Or, D., V.P. Rasmussen, (1999). Effective frequency of TDR travel time-based measurement of
soil bulk dielectric permittivity, Third Workshop on Electromagnetic Wave Interaction with Water and Moist Substances, Russell Agricultural Research Center, Athens, GA, USA, pp. 257-260.
Robinson, D.A., Jones, S. B., Wraith, J. M., Or, D., Friedman, S. P., (2003). A review of
advances in dielectric and electrical conductivity measurement in soils using time domain reflectometry. Vadose Zone J. 2. 444-475.
Robinson, D.A., Schaap, M., Jones, S. B., Friedman, S. P., Gardner, C. M. K., (2003).
Considerations for improving the accuracy of permittivity measurement using time domain reflectometry: air-water calibration, effects of cable length. Soil Sci. Soc. of Am. J. 67, 62-70.
26
Roth, K., Schulin, R., Fluhler, H., Attinger, W., (1990). Calibration of time domain reflectometry for water content measurement using composite dielectric approach. Water Resour. Res. 26 (10), 2267-2273.
1 2 3 4 5 6 7 8 9
10 11 12 13 14
Topp, G.C., Ferre, P. A., (2002). Water Content. In: Dane, J.H., Topp, G. C. (Co-Editors),
Methods of Soil Analysis Part 4 Physical Methods. Soil Sci. Soc. of Am. Inc., Madison, WI, USA, pp. 417-545.
Topp, G.C., Davis, J. L., Annan, A. P., (1980). Electromagnetic determination of soil water
content: measurements in coaxial transmission lines. Water Resour. Res. 16 (3), 574-582. Topp, G.C., Lapen, D. R., Young, G. D., Edwards, M., (2001). Evaluation of shaft-mounted TDT
readings in disturbed and undisturbed media, Second International Symposium and Workshop on Time Domain Reflectometry for Innovative Geotechnical Applications, Available at: http://www.iti.northwestern.edu/tdr/tdr2001/proceedings/ (verified 4 May 2004). Infrastructure Technology Institute-Northwestern University, Evanston, Illinois.
15 16 17
27
Figure Captions 1
2
3
4
5
6
7
8
9
10
11
12
13
14
Figure 1. Photograph comparing the Acclima Digital TDT Sensor and the Campbell Scientific
TDR100 connected to a conventional 0.15-m 3-rod probe.
Figure 2. Schematic drawing of the Acclima Digital TDT Sensor displaying the basic
components (Anderson, 2003). The numbers correspond to the following: (1) timing generator
(2) step generator (3) stainless steal transmission lines (4) latching comparator (5) digital to
analog converter (DAC) 1 (6) microprocessor (7) DAC 2.
Figure 3. (a) TDR waveforms in air, de-ionized water, and pure 2-isopropoxyethanol and (b)
TDT waveforms in the same three mediums. The water waveforms display arbitrarily drawn
tangent lines to mark the end points from which travel time is measured.
Figure 4. Cross sections showing the ATLC (http://atlc.sourceforge.net/ verified 4 May 2004)
(Kirkby, 1996) modeled electromagnetic energy density surrounding probe rods for (a)
conventional 3-rod TDR probe with 3.2-mm diameter rods and 12.0-mm rod spacing and (b) 2-
rod Digital TDT Sensor with 4.8-mm diameter rods and 14.2-mm rod spacing.
15
16
17
18
19
28
Figure 5. 3-dimensional plot of the spatial sensitivity of the Digital TDT Sensor in the labeled y
and z directions showing the distance from a dielectric discontinuity for which the measurement
is no longer influenced by the bordering medium (i.e. normalized spatial sensitivity=0).
1
2
3
4
5
6
7
8
9
10
11
12
13
Figure 6. (a) Permittivity as a function of travel time comparison of the three sensors. In order to
account for the scaling issue of the longer TDT probe, the TDT travel times are normalized to
the TDR by dividing by a factor of 4. (b) The residual permittivity (sensor measured Ka value
subtracted from the network analyzer ε’ value measured at the average maximum passable
frequency of the sensor) of each sensor plotted as a function of network analyzer ε’ values
measured at a frequency of 1GHz.
Figure 7. Maximum passable frequencies of each sensor determined in de-ionized water and 2-
isopropoxyethanol mixtures with permittivity values ranging from ε≈9 to ε≈60.
29
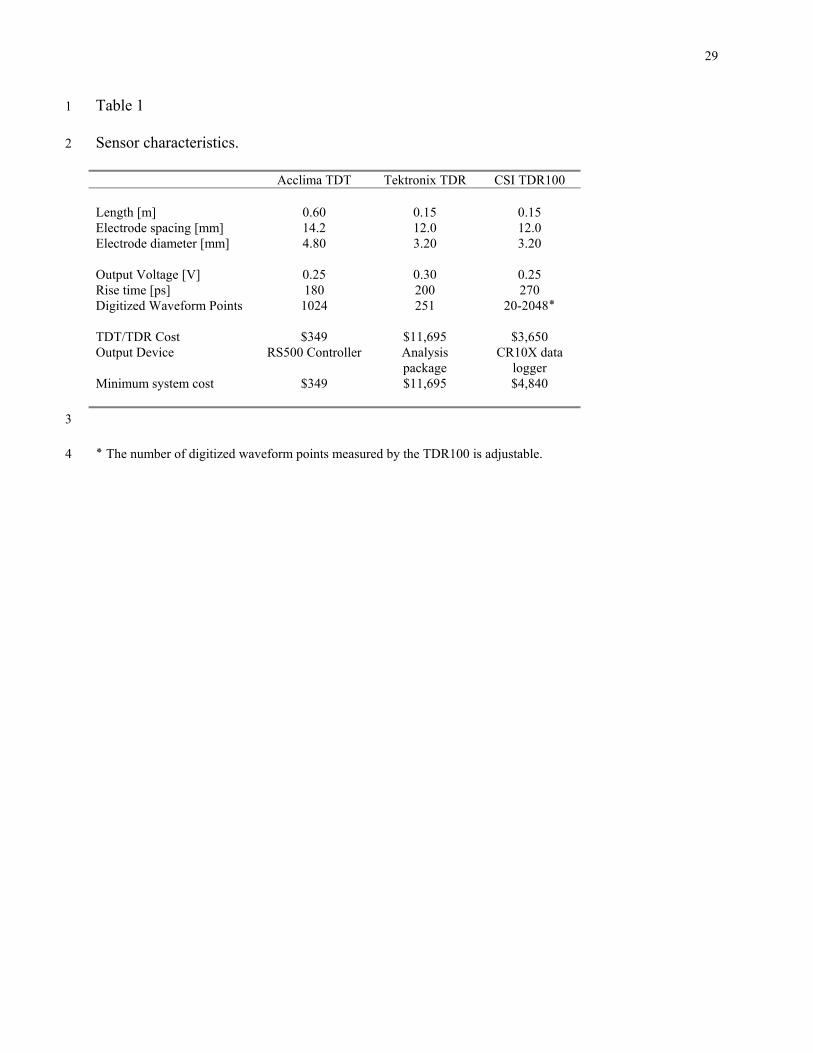
Table 1 1
2 Sensor characteristics.
Acclima TDT Tektronix TDR CSI TDR100 Length [m] 0.60 0.15 0.15 Electrode spacing [mm] 14.2 12.0 12.0 Electrode diameter [mm] 4.80 3.20 3.20 Output Voltage [V] 0.25 0.30 0.25 Rise time [ps] 180 200 270 Digitized Waveform Points 1024 251 20-2048٭ TDT/TDR Cost $349 $11,695 $3,650 Output Device RS500 Controller
Analysis package
CR10X data logger
Minimum system cost $349 $11,695 $4,840 3
.The number of digitized waveform points measured by the TDR100 is adjustable ٭ 4
30
1
2
3
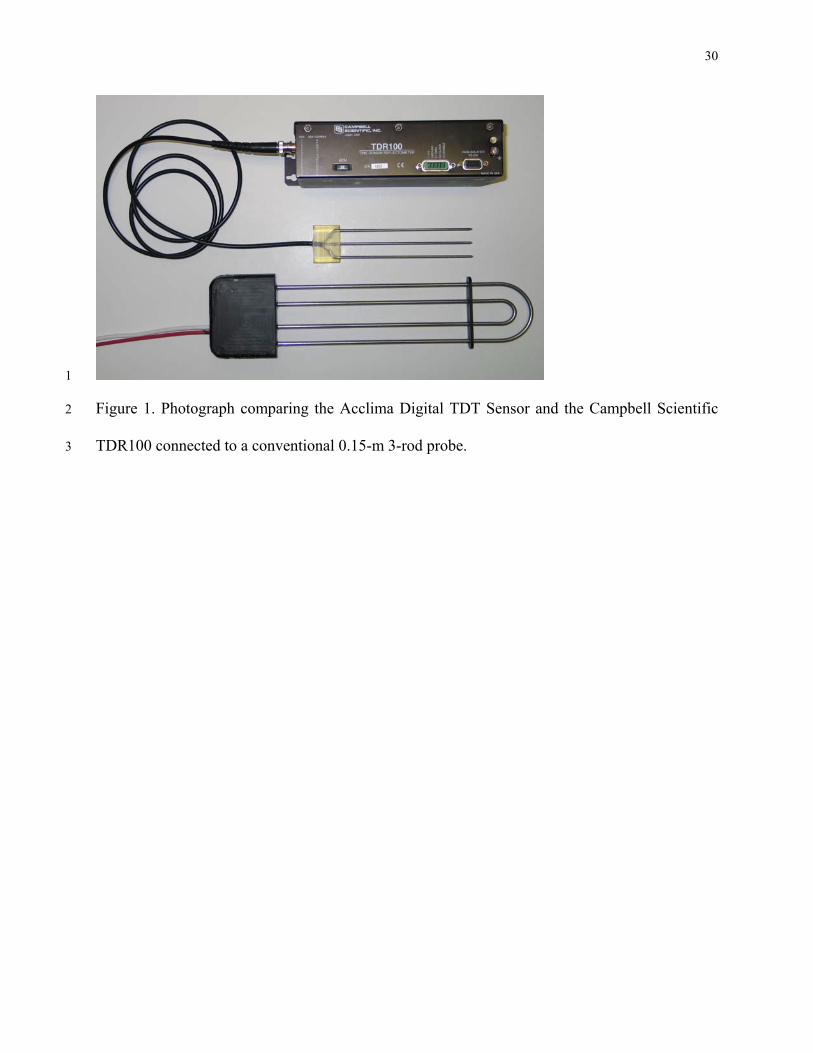
Figure 1. Photograph comparing the Acclima Digital TDT Sensor and the Campbell Scientific
TDR100 connected to a conventional 0.15-m 3-rod probe.
31
1
2
3
4
5
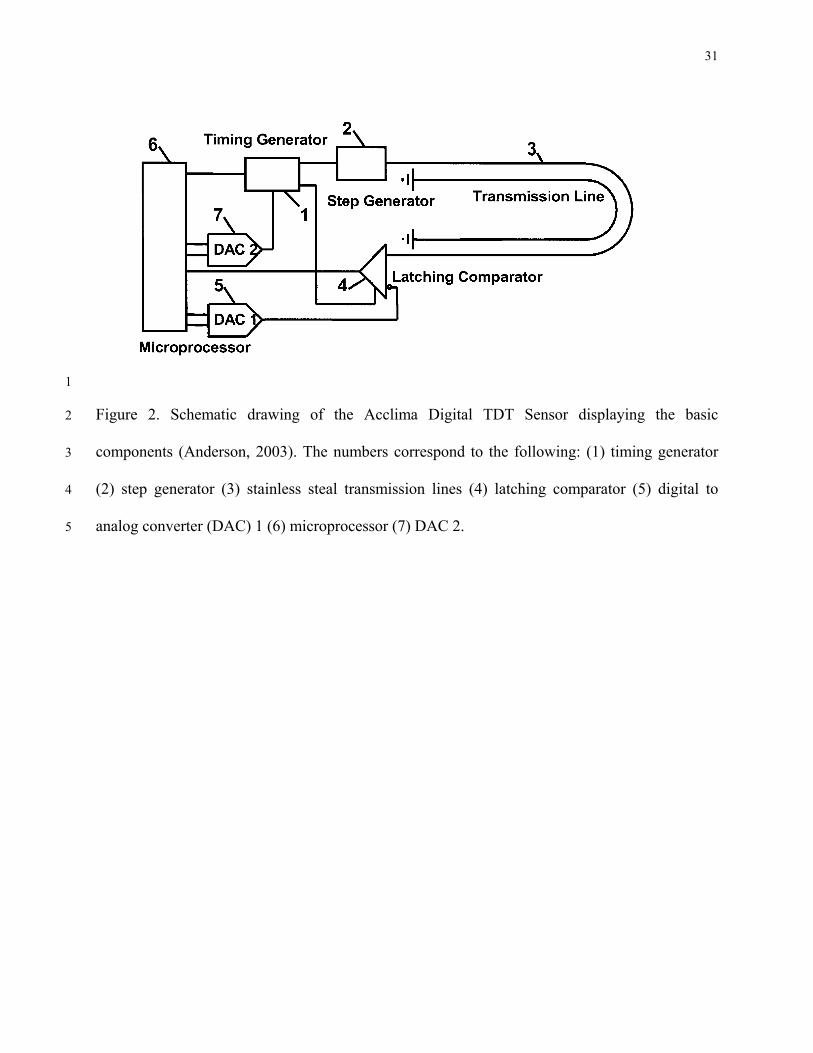
Figure 2. Schematic drawing of the Acclima Digital TDT Sensor displaying the basic
components (Anderson, 2003). The numbers correspond to the following: (1) timing generator
(2) step generator (3) stainless steal transmission lines (4) latching comparator (5) digital to
analog converter (DAC) 1 (6) microprocessor (7) DAC 2.
32
-0.6
-0.4
-0.2
0.0
0.2
0.4
0.6
0.8
1.0
1.2
0 1 2 3 4 5 6 7 8time [ns]
refle
ctio
n co
effe
cien
t
airdiwater2-isoprop
travel time
(a) 1
2
3
4
5
0.0
0.1
0.2
0.3
0.4
0.5
0.6
0.7
0 3 6 9 12 15 18 21 24time [ns]
mill
ivol
ts
airdiwater2-isoprop
travel time
(b)
Figure 3. (a) TDR waveforms in air, de-ionized water, and pure 2-isopropoxyethanol and (b)
TDT waveforms in the same three mediums. The water waveforms display arbitrarily drawn
tangent lines to mark the end points from which travel time is measured.
33
(a) 1
2 (b)
Figure 4. Cross sections showing the ATLC (http://atlc.sourceforge.net/ verified 4 May 2004)
(Kirkby, 1996) modeled electromagnetic energy density surrounding probe rods for (a)
conventional 3-rod TDR probe with 3.2-mm diameter rods and 12.0-mm rod spacing and (b) 2-
rod Digital TDT Sensor with 4.8-mm diameter rods and 14.2-mm rod spacing.
3
4
5
6
34
1
2
3
4
Figure 5. 3-dimensional plot of the spatial sensitivity of the Digital TDT Sensor in the labeled y
and z directions showing the distance from a dielectric discontinuity for which the measurement
is no longer influenced by the bordering medium (i.e. normalized spatial sensitivity = 0).
ZY Normalized
Spatial Sensitivity
35
010203040
5060708090
0 1 2 3 4 5
travel time [ns]
perm
ittiv
ity
Tektronix TDRCS TDR100Acclima TDT
(a) 1
2
3
4
5
6
-4
-3
-2
-1
0
1
2
3
4
0 10 20 30 40 50 60 70 80
network analyzer at 1GHz
resid
ual p
erm
ittiv
ity
network analyzerTektronix TDRCS TDR100Acclima Digital TDT
(b)
Figure 6. (a) Permittivity as a function of travel time comparison of the three sensors. In order to
account for the scaling issue of the longer TDT probe, the TDT travel times are normalized to
the TDR by dividing by a factor of 4. (b) The residual permittivity (sensor measured Ka value
subtracted from the network analyzer ε’ value measured at the average maximum passable
36
frequency of the sensor) of each sensor plotted as a function of network analyzer ε’ values
measured at a frequency of 1GHz.
1
2
37
0
10
20
30
40
50
60
70
1.0E+08 1.0E+09 1.0E+10
log frequency [Hz]
perm
ittiv
ity
Tektronix TDRCS TDR100Acclima TDT
1
2
3
4
5
6
7
Figure 7. Maximum passable frequencies of each sensor determined in de-ionized water and 2-
isopropoxyethanol mixtures with permittivity values ranging from ε ≈ 9 to ε ≈ 60. Reduced
frequencies in the TDT are likely influenced by the double transmission length compared to the
two TDRs.