Embed Size (px)
Citation preview
Wireless Sensor Network for Electric Transmission Line Monitoring
Bruce Alphenaar
Department of Electrical and Computer Engineering,University of Louisville
&Genscape Inc., Louisville, KY
Background
To date, little success obtaining real time grid situational awareness during emergency situations (brownouts/blackouts).Detailed information on grid status is controlled by regional grid owners/operators.Information is not shared due to public relations concerns, confidentiality agreements, competition.
Focus - Address lack of information available to Federal Agencies regarding grid status for use during actual or potential grid emergencies.
Objective
Obtain electric power line (or grid) information in real time independent of owners/operators of grid assets.Provide source of information that Government can use to obtain situational awareness of the electrical grid.
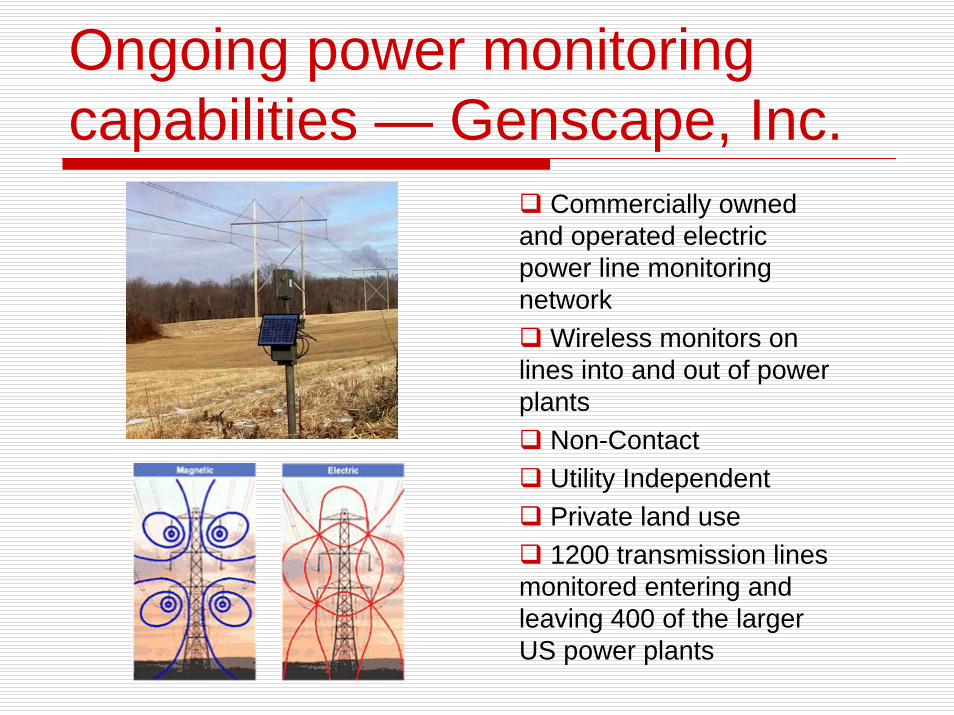
Commercially owned and operated electric power line monitoring network
Wireless monitors on lines into and out of power plants
Non-ContactUtility IndependentPrivate land use1200 transmission lines
monitored entering and leaving 400 of the larger US power plants
Ongoing power monitoring capabilities — Genscape, Inc.
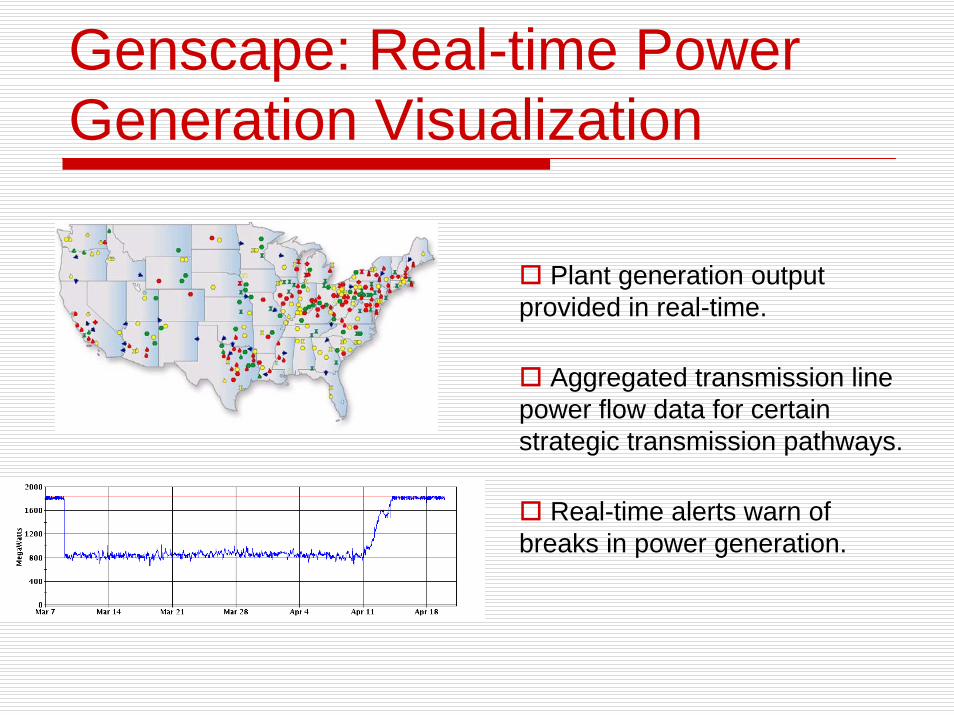
Plant generation output provided in real-time.
Aggregated transmission line power flow data for certain strategic transmission pathways.
Real-time alerts warn of breaks in power generation.
Genscape: Real-time Power Generation Visualization
Challenges to Expansion of Genscape System
Monitor placement too sparse to allow for detailed grid awareness.Existing monitors too big / expensive to greatly increase placement density.Monitors perform best in cases of simple line configurations.Use restricted to line measurements with large line separations.
Goals - Take advantage of newer technologies to optimize monitor form factor, power source and cost.Improve sensing capabilities for operation in high density, urban areas.
Project TasksDesign monitor to optimize form factor / function / costResearch alternate power sources Research and design of directional sensorsPrototype development of alternate power module and directional sensorEmbedded application development to manage power, communication, data acquisition and processingField test and deployment of prototypesServer-side processing, viewing, alerting and dissemination application developmentData viability and integration demonstration
Relevance to DOE Mission
Sensors Contributes to collection of “physical metrics across the grid”System MonitoringMeasurement data provides “real-time information on grid operating conditions”Visualization ToolsProvides data and visualization tools to enable “gridoperators and federal agencies” access to global utility independenttransmission line data “to identify disturbances before they cascadeinto serious problems”Technology TransferInvolves “field testing, technology showcases and learning demonstrations”
Project Addresses 4 of 6 Key Activities for DOE Five-Year Program for Electric Transmission and Distribution Programs for Fiscal Years 2008-2012 (August 2006)
Form Factor/Cost/Function Optimization
Utilize the Crossbow Mote processor platform – low cost, low power Reduce modem size to smallest available cellular network modemTest smaller flexible form solar panel technologiesImplement small size 3-axis magnetic field meter chips to replace large magnetic solenoids
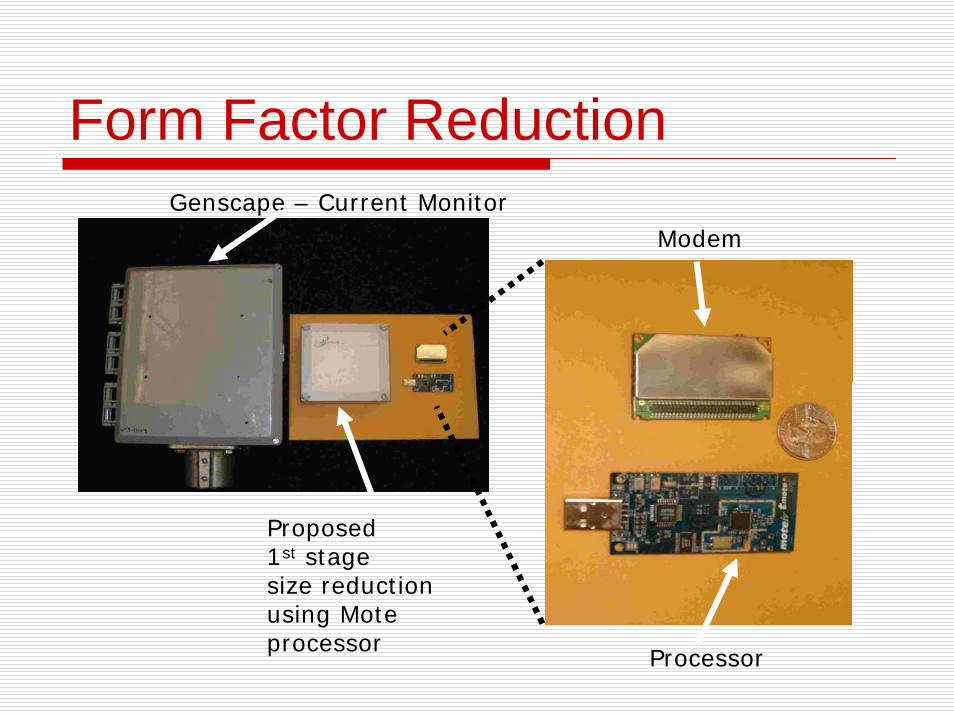
Form Factor ReductionGenscape – Current Monitor
Processor
Modem
Proposed 1st stage size reduction using Mote processor
Research on Alternative Power SourcesObjective: Reduce and/or eliminate sensor dependency on highpower (12V battery, 5W solar panel) large form factor power sources
Research magnetic and electric field scavengingResearch potential for vibration scavenging in urban areasImplement lower power communication modemImplement lower power processor
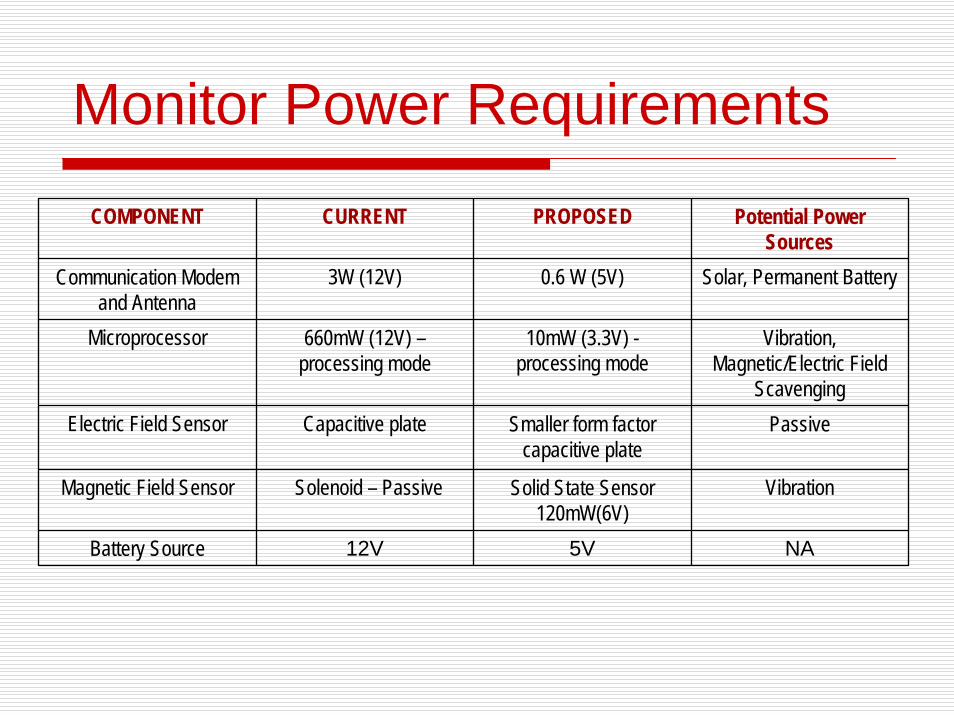
Monitor Power Requirements
COMPONENT CURRENT PROPOSED Potential Power Sources
Communication Modem and Antenna
3W (12V) 0.6 W (5V) Solar, Permanent Battery
Microprocessor 660mW (12V) –processing mode
10mW (3.3V) -processing mode
Vibration, Magnetic/Electric Field
Scavenging Electric Field Sensor Capacitive plate Smaller form factor
capacitive platePassive
Magnetic Field Sensor Solenoid – Passive Solid State Sensor 120mW(6V)
Vibration
Battery Source 12V 5V NA
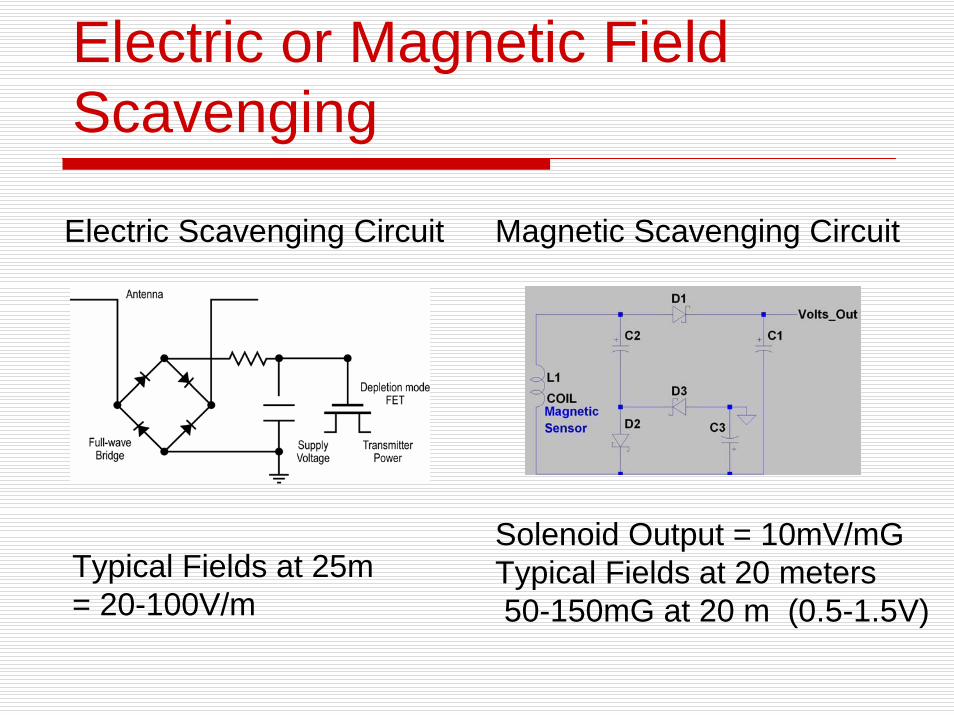
Electric or Magnetic Field Scavenging
Solenoid Output = 10mV/mGTypical Fields at 20 meters50-150mG at 20 m (0.5-1.5V)
Magnetic Scavenging CircuitElectric Scavenging Circuit
Typical Fields at 25m = 20-100V/m
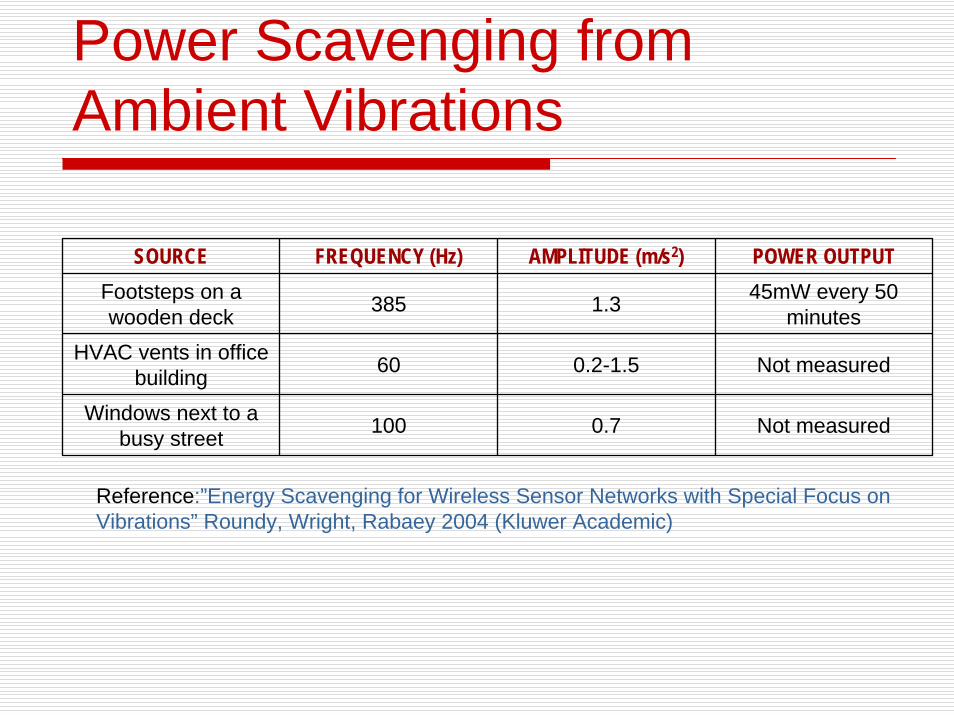
Power Scavenging from Ambient Vibrations
Reference:”Energy Scavenging for Wireless Sensor Networks with Special Focus on Vibrations” Roundy, Wright, Rabaey 2004 (Kluwer Academic)
SOURCE FREQUENCY (Hz) AMPLITUDE (m/s2) POWER OUTPUTFootsteps on a wooden deck 385 1.3 45mW every 50
minutes HVAC vents in office
building 60 0.2-1.5 Not measured
Windows next to a busy street 100 0.7 Not measured
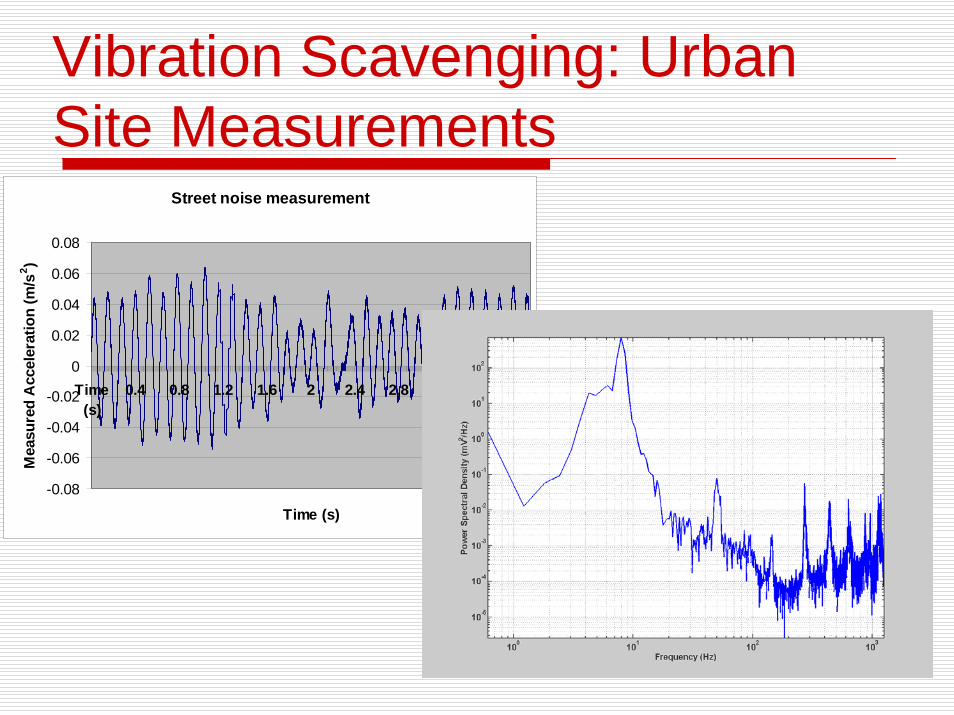
Vibration Scavenging: Urban Site Measurements
Street noise measurement
-0.08
-0.06
-0.04
-0.02
0
0.02
0.04
0.06
0.08
Time(s)
0.4 0.8 1.2 1.6 2 2.4 2.8 3.2 3.6
Time (s)
Mea
sure
d A
ccel
erat
ion
(m/s
2 )

Vibration Scavenging: Cantilever-Based Design IdeasMicrofabricated cantilever for vibration energy scavenging
Magnetically modulated cantilever
Tunable frequency response
Possibility for nonlinear responseExample of microfabricatedcantilever used for gas sensing
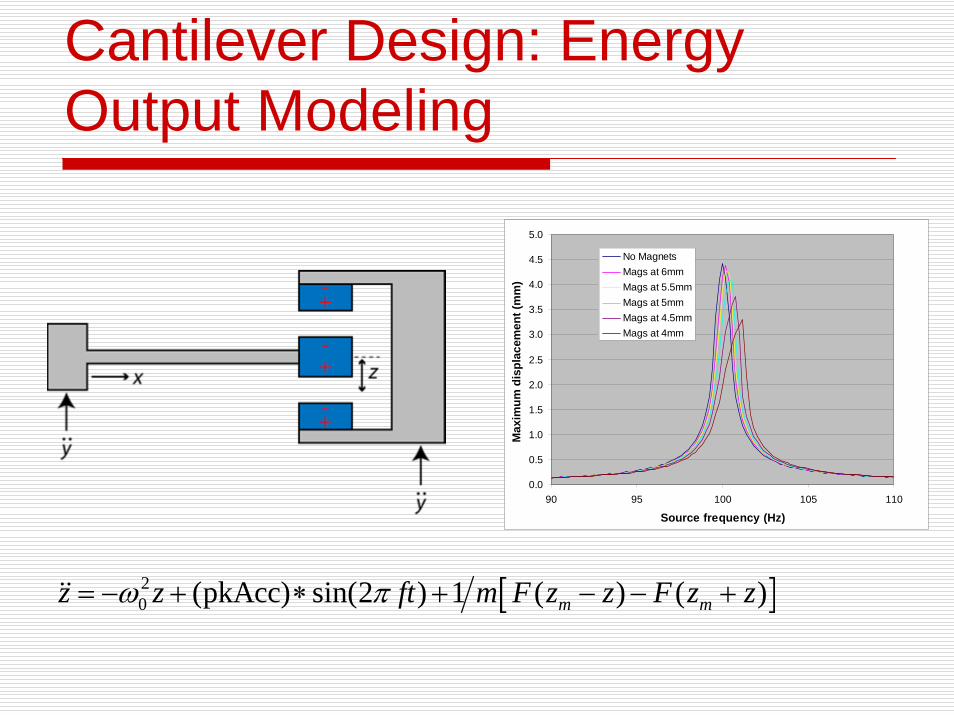
Cantilever Design: Energy Output Modeling
0.0
0.5
1.0
1.5
2.0
2.5
3.0
3.5
4.0
4.5
5.0
90 95 100 105 110
Source frequency (Hz)M
axim
um d
ispl
acem
ent (
mm
)
No MagnetsMags at 6mmMags at 5.5mmMags at 5mmMags at 4.5mmMags at 4mm
[ ]20 (pkAcc) sin(2 ) 1 ( ) ( )m mz z ft m F z z F z zω π= − + ∗ + − − +&&
Research/Design of Directional SensorsObjective: Enable the monitor to target specific transmission lines in thepresence of other lines and high 60Hz background noise
3-axis magnetic field sensor implementation
Computational decomposition of superimposed magnetic field readings — separation of signal from noise via phase, EMF vector identification
Motivation for Directional Sensor
Measured Vs. LG&E Data - Line 4531/4532 - July 15,2004 15:15
0
2
4
6
8
10
12
14
16
18
20
-20 0 20 40 60 80 100
369 MW - 172 MW
mG
Simulated HSimulated VMeasured HMeasured V
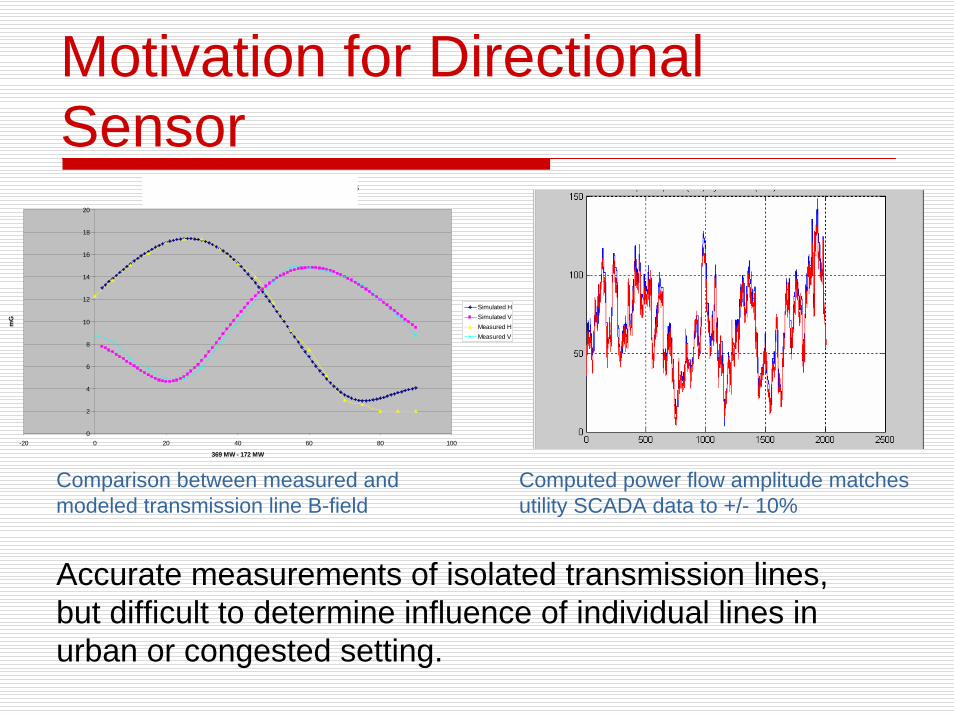
Accurate measurements of isolated transmission lines, but difficult to determine influence of individual lines in urban or congested setting.
Comparison between measured and modeled transmission line B-field
Computed power flow amplitude matches utility SCADA data to +/- 10%
3-Axis Magnetic Field Measurements
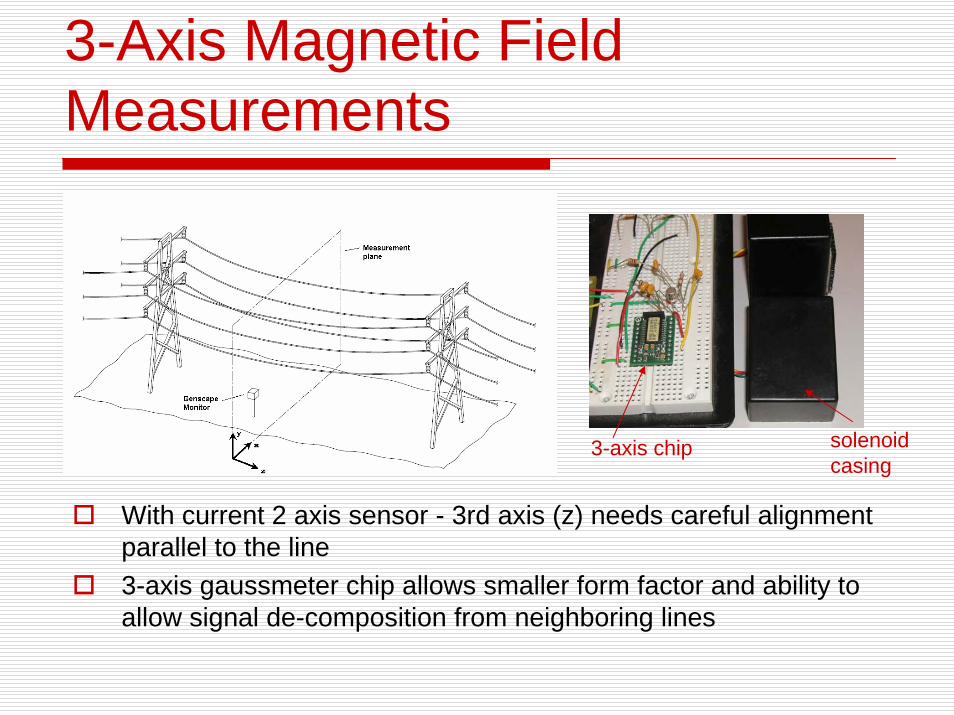
With current 2 axis sensor - 3rd axis (z) needs careful alignment parallel to the line 3-axis gaussmeter chip allows smaller form factor and ability to allow signal de-composition from neighboring lines
3-axis chip solenoid casing
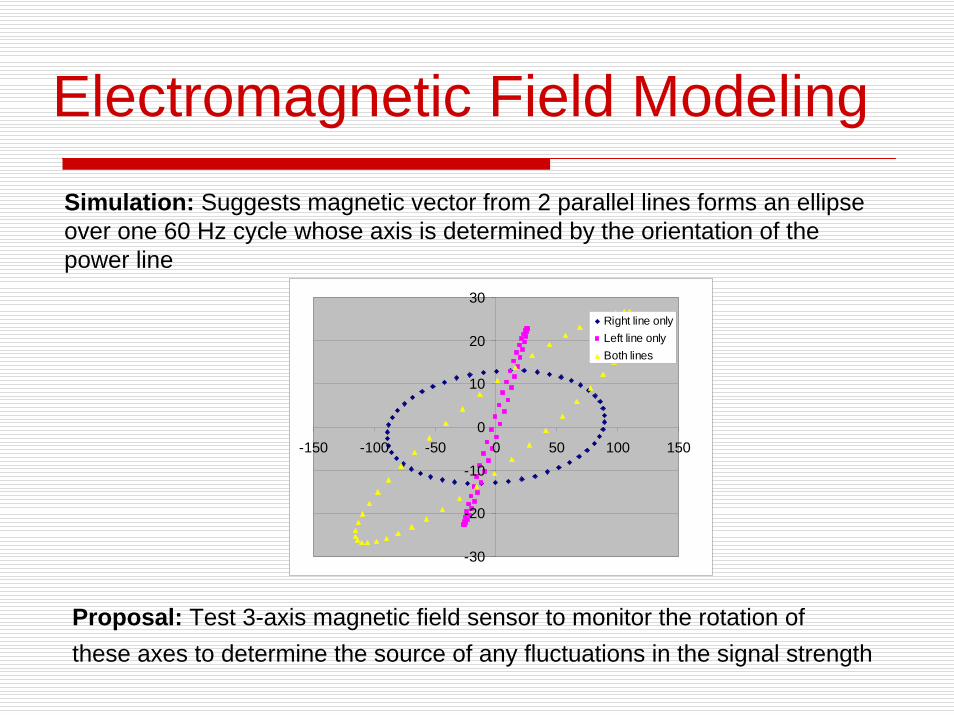
Electromagnetic Field ModelingSimulation: Suggests magnetic vector from 2 parallel lines forms an ellipseover one 60 Hz cycle whose axis is determined by the orientation of the power line
-30
-20
-10
0
10
20
30
-150 -100 -50 0 50 100 150
Right line onlyLeft line onlyBoth lines
Proposal: Test 3-axis magnetic field sensor to monitor the rotation of these axes to determine the source of any fluctuations in the signal strength
Embedded Application Development
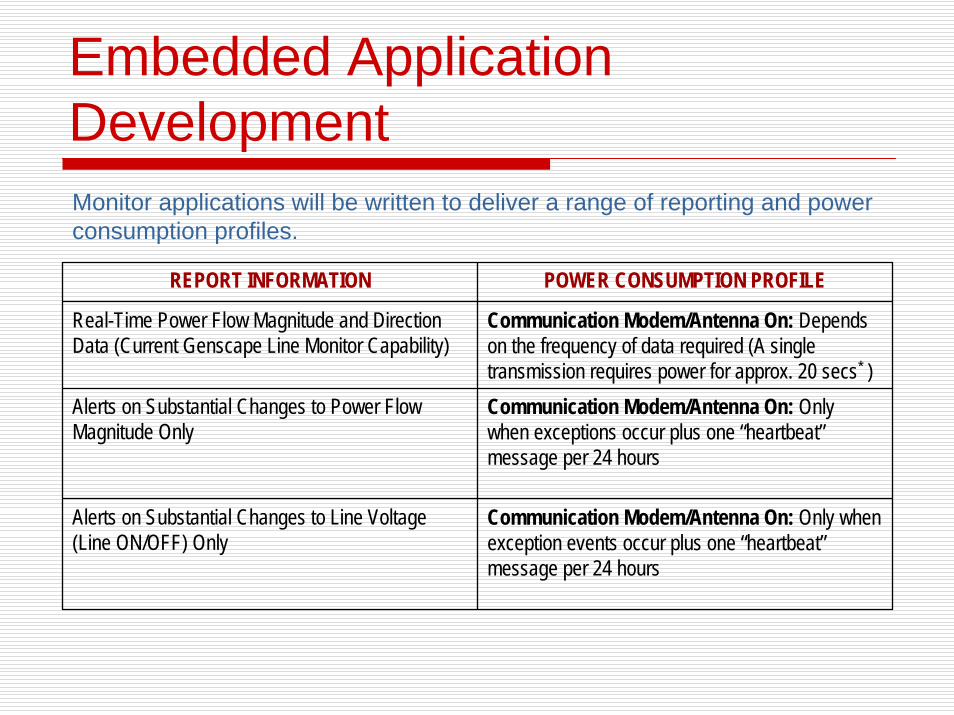
REPORT INFORMATION POWER CONSUMPTION PROFILE
Real-Time Power Flow Magnitude and Direction Data (Current Genscape Line Monitor Capability)
Communication Modem/Antenna On: Depends on the frequency of data required (A single transmission requires power for approx. 20 secs* )
Alerts on Substantial Changes to Power Flow Magnitude Only
Communication Modem/Antenna On: Only when exceptions occur plus one “heartbeat”message per 24 hours
Alerts on Substantial Changes to Line Voltage (Line ON/OFF) Only
Communication Modem/Antenna On: Only when exception events occur plus one “heartbeat”message per 24 hours
Monitor applications will be written to deliver a range of reporting and power consumption profiles.
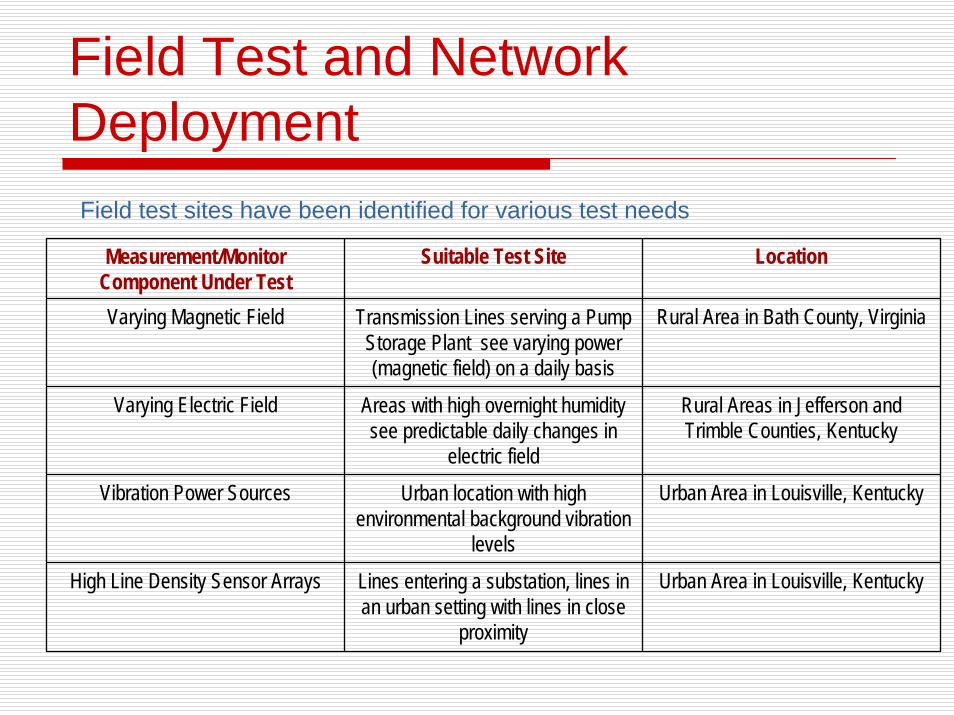
Field Test and Network DeploymentField test sites have been identified for various test needs
Measurement/Monitor Component Under Test
Suitable Test Site Location
Varying Magnetic Field Transmission Lines serving a Pump Storage Plant see varying power (magnetic field) on a daily basis
Rural Area in Bath County, Virginia
Varying Electric Field Areas with high overnight humidity see predictable daily changes in
electric field
Rural Areas in Jefferson and Trimble Counties, Kentucky
Vibration Power Sources Urban location with high environmental background vibration
levels
Urban Area in Louisville, Kentucky
High Line Density Sensor Arrays Lines entering a substation, lines in an urban setting with lines in close
proximity
Urban Area in Louisville, Kentucky
Available Line Types
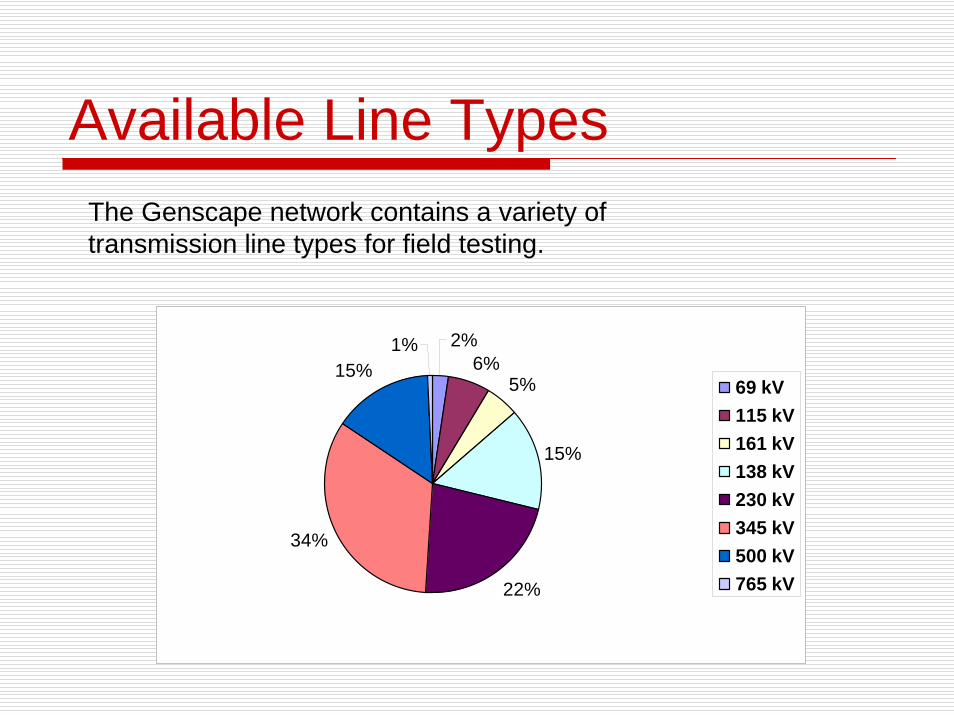
6%5%
15%
22%
34%
15%2%1%
69 kV115 kV161 kV138 kV230 kV345 kV500 kV765 kV
The Genscape network contains a variety of transmission line types for field testing.
Server-side ApplicationsDevelop data processing algorithms to process new monitor data-types relating to transmission line specific parameters Develop alerting routines for a range of transmission line fault conditions (e.g. de-energized line, low/no power conditions, line power close to capacity etc)Develop transmission line visualization interface to provide real-time transmission line data
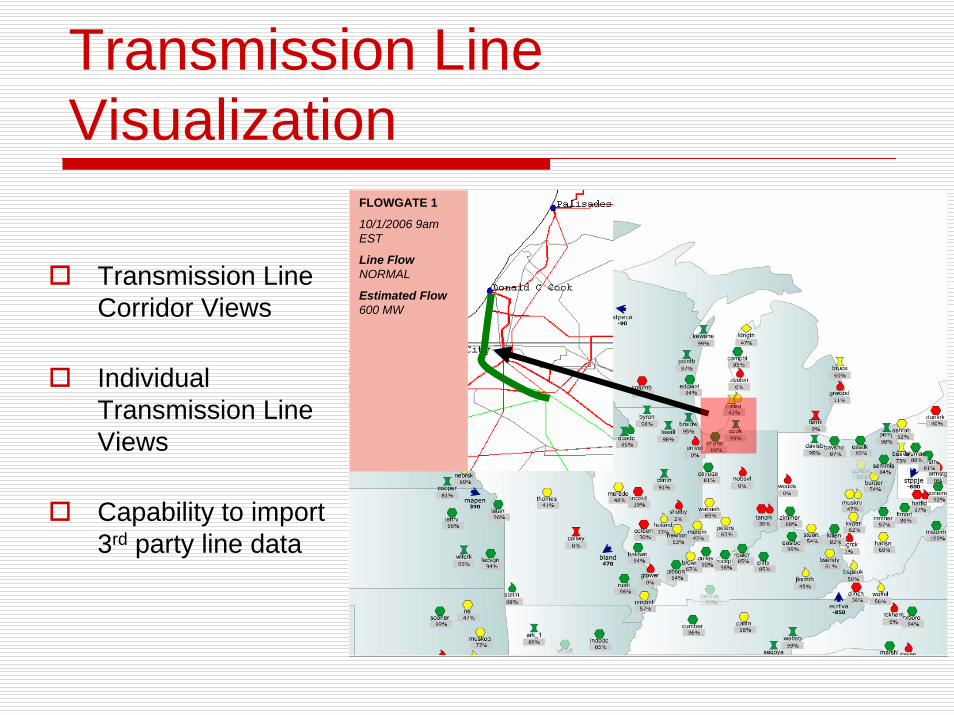
Transmission Line Visualization
FLOWGATE 1
10/1/2006 9am EST
Line FlowNORMAL
Estimated Flow600 MW
Transmission Line Corridor Views
Individual Transmission Line Views
Capability to import 3rd party line data
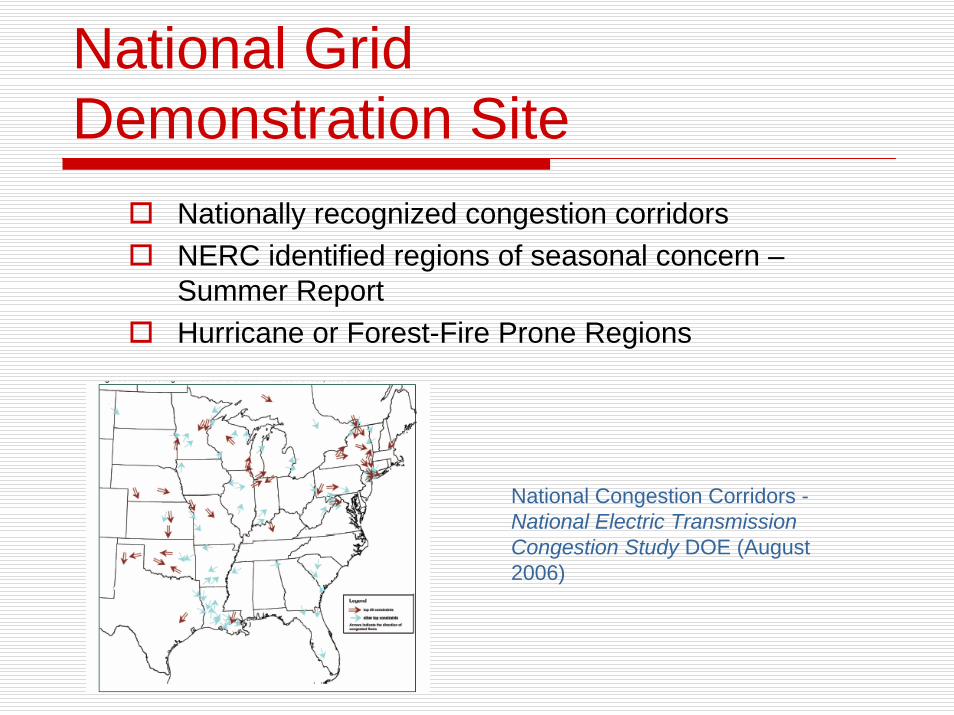
National Congestion Corridors -National Electric Transmission Congestion Study DOE (August 2006)
National Grid Demonstration Site
Nationally recognized congestion corridorsNERC identified regions of seasonal concern –Summer ReportHurricane or Forest-Fire Prone Regions
Data Viability and IntegrationDesign optimized alerting and data delivery protocols Research current practices and protocols in the electric utility industry to define Demonstrate data integration possibilities with existing SCADA and EMS systems (collaboration with Louisville Gas and Electric) Develop 3rd party data dissemination methods for data delivery to federal agencies and/or utilities
Project Management Three functional teams
Research TeamPrototype Development TeamIT Applications/Infrastructure Team
Weekly team meetingsShared access to UofL and Genscape facilities/resources Company work experience for students

UofL :Bruce Alphenaar Ph.D. – PI George Lin Ph.D. –
Research Engineer
Bill Brown – Graduate Student

Genscape :Deirdre Alphenaar Ph.D. - Co-PI
Chris Pettus M.Eng - Hardware and Embedded Application Engineering
Yang Xu Ph.D. – Research Engineer
Walter Jones Ph.D.,- Power Line Analytics/Modeling
Kevin Brown – IT Applications/Software
Mike Linahan – Logistics and Field SupportIn addition members of IT and Logistics groups at Genscape support primary project participants above
Some of the Genscape people…
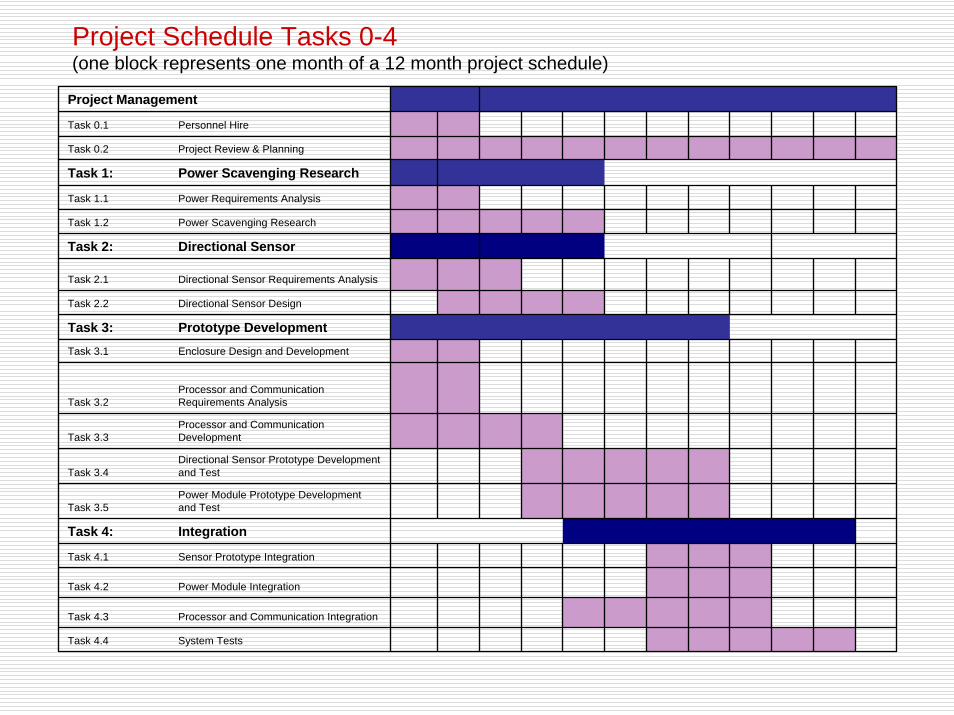
Project Management
Task 0.1 Personnel Hire
Task 0.2 Project Review & Planning
Task 1: Power Scavenging Research
Task 1.1 Power Requirements Analysis
Task 1.2 Power Scavenging Research
Task 2: Directional Sensor
Task 2.1 Directional Sensor Requirements Analysis
Task 2.2 Directional Sensor Design
Task 3: Prototype DevelopmentTask 3.1 Enclosure Design and Development
Task 3.2Processor and Communication Requirements Analysis
Task 3.3Processor and Communication Development
Task 3.4Directional Sensor Prototype Development and Test
Task 3.5Power Module Prototype Development and Test
Task 4: Integration
Task 4.1 Sensor Prototype Integration
Task 4.2 Power Module Integration
Task 4.3 Processor and Communication Integration
Task 4.4 System Tests
Project Schedule Tasks 0-4(one block represents one month of a 12 month project schedule)
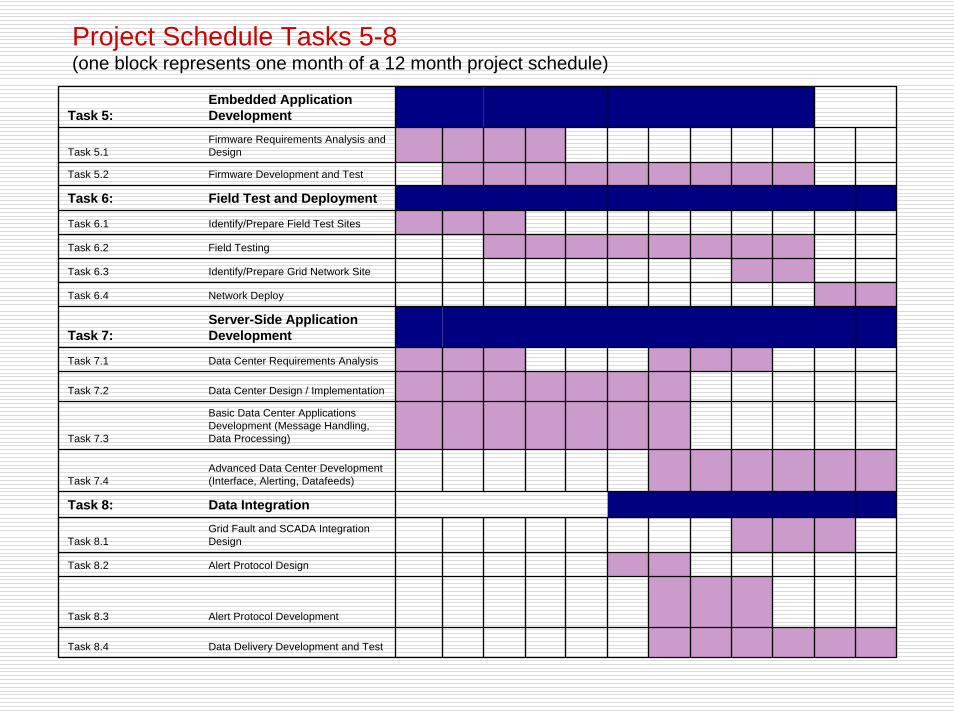
Task 5: Embedded Application Development
Task 5.1Firmware Requirements Analysis and Design
Task 5.2 Firmware Development and Test
Task 6: Field Test and Deployment
Task 6.1 Identify/Prepare Field Test Sites
Task 6.2 Field Testing
Task 6.3 Identify/Prepare Grid Network Site
Task 6.4 Network Deploy
Task 7: Server-Side Application Development
Task 7.1 Data Center Requirements Analysis
Task 7.2 Data Center Design / Implementation
Task 7.3
Basic Data Center Applications Development (Message Handling, Data Processing)
Task 7.4Advanced Data Center Development (Interface, Alerting, Datafeeds)
Task 8: Data Integration
Task 8.1Grid Fault and SCADA Integration Design
Task 8.2 Alert Protocol Design
Task 8.3 Alert Protocol Development
Task 8.4 Data Delivery Development and Test
Project Schedule Tasks 5-8(one block represents one month of a 12 month project schedule)