Embed Size (px)
Citation preview
[165]
16506
january · april 2006 · esic market
Identification of SME Clusters based on the Quality in Business Management andI n f o rmation Management. Excellence Pro f i l e ,Strategic Alignment of the Clusters,and Balanced Score c a rdDr. Miguel González Sánchez
Professor of ESIC Masters programmes
Dr. Fernando González Ladrón de Guevara
Department of Business Organisation, Financial Economy and Accounting
Polytechnic University of Valencia
AbstractThis work has been developed in the framework of a research programmethat forms part of the initiatives of the ITIO group (Integration ofI n f o rmation Technologies in Organisations) of the Department ofBusiness Organisation, Financial Economy and Accounting at thePolytechnic University of Valencia. In this paper, the identification of dif -ferent SME clusters, with regard to the variables surrounding the qualityof trade management and information management, is proposed. The research, carried out as a part of a doctoral thesis developed in thedepartment (González Sánchez, 2003), allowed the identification of thedifferent approaches and strategic alignments for each of the business clus -ters obtained, as well as the different orientations towards one of the fourperspectives of the Balanced Scorecard (BSC). The fieldwork has been carried out using a sample of 97 enterprises, 60 ofwhich belong to the furniture sector, which, in turn, facilitated the detec -tion of some differences with regard to management practices betweenthat sector and the other sample enterprises. Key words: BSC, EFQM, Strategy, SME, IT.JEL Code: M10, M31.
january · april 2006 · esic market
identification of sme clusters based on the quality in business management and information management…
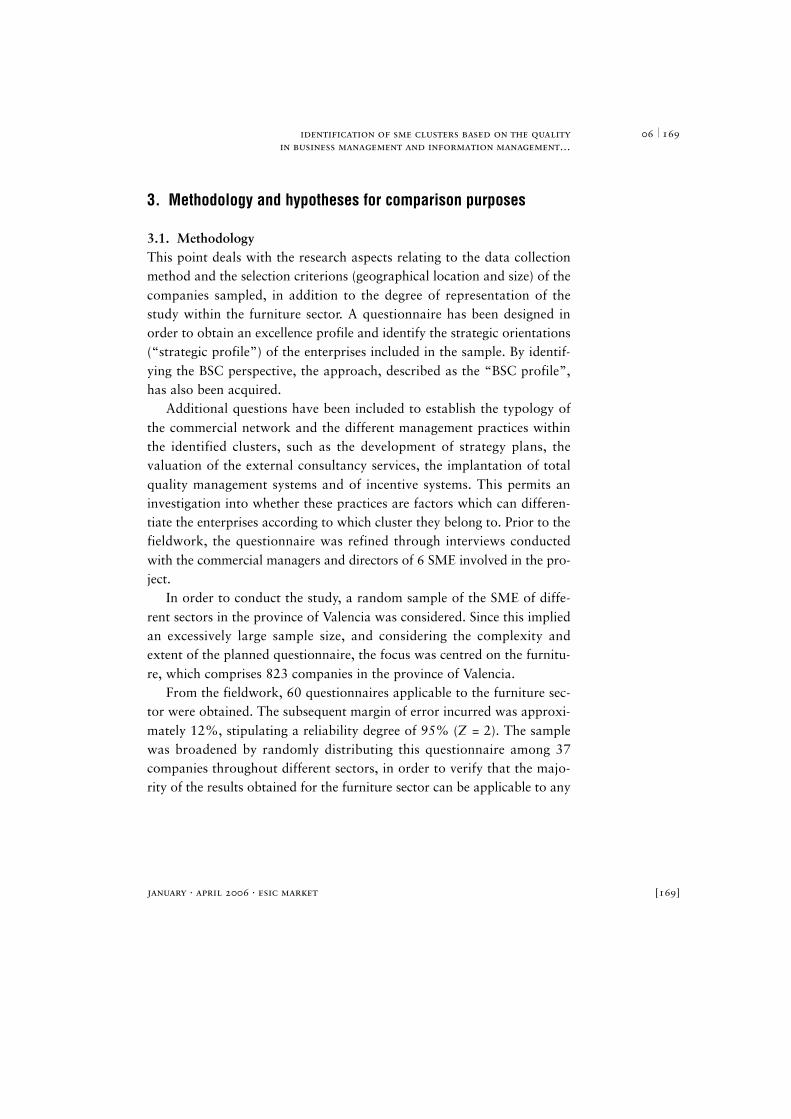
1. IntroductionIn order to obtain the “excellence profile” of the sampled SME, a modelfor business excellence has been developed, adapted from that of theEFQM1, in which, the models of “Quality of Business Management” and“Information Management” have been incorporated with the enabler cri-terions. With regard to the results criterions of the model, the criterion“Society Results” has not been taken into account, in its place an additio-nal criterion, termed “Business Management Satisfaction” has been inclu-ded. The ensuing model, which is theoretically justified in the next section,is given in Figure 1:
(1) European
Foundation For Quality
Management. This was
established in 1988 by
14 European firms, all
leaders in their
respective sectors. At
present, it comprises of
approximately 800
members representing
most of the European
countries and business
sectors. It oversees the
European Quality Award
for organisational
Excellence.
[166]
166 06
Figure 1. The proposed research model
Source: Own research.

identification of sme clusters based on the quality in business management and information management…
january · april 2006 · esic market
2. Theoretical frameworkThe theoretical features which support this research paper are: TotalQuality Models (2.1) and the Balanced ScoreCard (2.2).
2.1. Total Quality Models These are sets of criteria, grouped in sections or chapters, which analysethe concepts related to Total Quality in the key areas of an organisation,thus permitting the elaboration of a strategy. The generalisation of theterm “Total Quality Model” is quite recent, and is, to a great extent, theresult of the Total Quality Models used by the prestigious awards givenfor Quality/Excellence (Deming, Malcom-Baldrige, the Pre m i oIberoamericano de Excelencia en la Gestión and the European Award forExcellence; the proposed model for our research is based on this lastaward). The relevant institutions and authors involved in this type of rese-arch are referred to in Table 1.
(2) Union of Japanese
Scientists and Engineers:
this evaluates the
enterprises in their
operational criterions,
giving the same value to
each criterion.
(3) Fundación
Iberoamericana para la
Gestión de la Calidad.
Established in 1998, it
integrates the
experiences of other
countries in the
development and
implantation of
excellence models. Its
aim is to help its
members achieve greater
competitiveness and
consolidate their
international competitive
position.
[167]
16706
Source: Own research.
Table 1. Significant Business Excellence Models
Excellence Modeland date of Authorsappearence
Deming (1951) Deming (1989), JUSE2
Malcom-Baldrige Membrado Martínez (1999)(1987) Membrado Martínez (2001)
Iberoamericano FUNDIBQ3
(1999) Membrado Martínez (1999)
Beltrán Sanz et al. (2002)
EFQM (1991) EFQM (1999; 2003)
Membrado Martínez(97-99; 2001)

january · april 2006 · esic market
identification of sme clusters based on the quality in business management and information management…
2.2. Balanced ScoreCardKaplan and Norton (1997) describe the Balanced ScoreCard (to be refe-rred to as BSC), as an action framework for translating the vision of anorganisation into a coherent set of action indicators which, taking intoaccount the shareholders’ requirements (Financial Perspective), the needsof the customers (Customer Perspective) and the internal requirements(Business Process Perspective and Learning and Growth Perspective),jointly describes the organisational strategy and how this can be achieved.Niven (2003) accredits it with three tasks: it is a measurement system, astrategic management system and a communication tool. The theoreticalcontributions of the BSC which are relevant to the development of thisstudy are shown in Table 2.
[168]
168 06
Source: Own research.
Table 2. Significant Business Excellence Models
Balanced Scorecard Contribution Authors
Creators of the concept Kaplan and Norton (1992;1996; 1997; 2001)
Origins and concept Set of measures derived from Niven (2003)the StrategyShared Vision Senge (1990)
Mission/Vision/Values Collins and Porras (1996)Hamel and Prahalad (1994)
Strategy Mintzberg et al., (1994; 1997)
Construction and strategy maps Porter (1980)Tracy and Wierseman (1994)
Learning González Ladrón de Guevara(2001)
Cascade Application Niven (2003)
Relationship with the EFQMScope and joint use Lamotte and Carter (2000)
modelImprovement cycle, using both Udaondo (2000)modelsComplementary Olve (2001)
identification of sme clusters based on the quality in business management and information management…
january · april 2006 · esic market
3. Methodology and hypotheses for comparison purposes
3.1. MethodologyThis point deals with the research aspects relating to the data collectionmethod and the selection criterions (geographical location and size) of thecompanies sampled, in addition to the degree of representation of thestudy within the furniture sector. A questionnaire has been designed inorder to obtain an excellence profile and identify the strategic orientations(“strategic profile”) of the enterprises included in the sample. By identif-ying the BSC perspective, the approach, described as the “BSC profile”,has also been acquired.
Additional questions have been included to establish the typology ofthe commercial network and the different management practices withinthe identified clusters, such as the development of strategy plans, thevaluation of the external consultancy services, the implantation of totalquality management systems and of incentive systems. This permits aninvestigation into whether these practices are factors which can differen-tiate the enterprises according to which cluster they belong to. Prior to thefieldwork, the questionnaire was refined through interviews conductedwith the commercial managers and directors of 6 SME involved in the pro-ject.
In order to conduct the study, a random sample of the SME of diffe-rent sectors in the province of Valencia was considered. Since this impliedan excessively large sample size, and considering the complexity andextent of the planned questionnaire, the focus was centred on the furnitu-re, which comprises 823 companies in the province of Valencia.
From the fieldwork, 60 questionnaires applicable to the furniture sec-tor were obtained. The subsequent margin of error incurred was approxi-mately 12%, stipulating a reliability degree of 95% (Z = 2). The samplewas broadened by randomly distributing this questionnaire among 37companies throughout different sectors, in order to verify that the majo-rity of the results obtained for the furniture sector can be applicable to any
[169]
16906
january · april 2006 · esic market
identification of sme clusters based on the quality in business management and information management…
sector, thereby reaffirming previous studies of this type (see Bañón Rubioet al., 2002; Galán and Vecino, 1997; Santos et al., 1998; González, 2000and Camisón, 2001).
3.2. HypothesisThe hypotheses “in comparison with” the empirical study are4:
H02: There is a set of critical or discriminant variables: InformationManagement and Business Management Quality which permit the SME tobe categorized into clusters or typologies.
H2: Added to an improved Strategy and Planning, better results…H2.1 With regards to Customer Satisfaction H2.2 With regards to Business Direction Satisfaction.H2.3 With regards to Personnel Satisfaction (Sales force).H2.4 Commercial and Business results.
H3: Added to a greater Quality of the Business Direction, betterresults…
H3.1 With regards to Customer Satisfaction.H3.2 With regards to Personnel Satisfaction (Sales force). H3.3 Commercial and Business results.
H6: Added to a better Information Management, better results…H6.1 With regards to Customer Satisfaction.H6.2 With regards to Business Direction Satisfaction.H6.3 With regards to Personnel Satisfaction (Sales force).H6.45 Commercial and Business results.
H11: Added to improved Information Management, much improvedBusiness Management Quality.
In addition, the original ideas provided by our model are as follows:
• We do not take into account the criterion “Society Results”, sinceour objectives were directed towards the commercial area. Instead,
(4) According to the
formulation used by
González Sánchez
(2003: 293-295).
(5) Contributions
regarding this
hypothesis are
considered by González
Durán (1999), Miñana
Terol (2001) and O’Brien
(2001).
[170]
170 06

identification of sme clusters based on the quality in business management and information management…
january · april 2006 · esic market
a new result criterion has been introduced: “9 Satisfaction of theBusiness Direction”, and criterion 7, which takes into account thesatisfaction of executives and managers, has been reappraised.
• Subcriterion 4b “Management of information resources” receivesthe status of criterion (6. Information Management), due to theresearch hypotheses.
• Criterion 3 “Personnel Management” has been divided into twocriteria, depending on whether it refers to executives and managers(3. Quality of the Business Direction) or to other personnel withinthe commercial area (4. Management of Personnel).
4. Results
In this section, the results obtained for all the study variables with regardto the characterisation of the companies sampled, the cluster analysis, theexcellence profiles and BSC of each cluster identified, are presented.
4.1. Characteristics of the sample
4.1.1. General CharacteristicsFirst of all, in order to provide a clear characterisation of the average typeof company incorporated in the sample used for this study:
• The size of the companies (the number of employees, the assets andturnover).
• The extent of internationalisation of the companies (based on thepercentage of export against the total turnover).
• Company productivity, measured as number of sales per employee.• The development or subcontracting of market studies concerning
the sector of company activity.• The intensity of recycling training which the company offers their
commercial managers.• The degree of sales force automation of the company.
[171]
17106

january · april 2006 · esic market
identification of sme clusters based on the quality in business management and information management…
• The importance assigned to external consultancy services.• The typology of the commercial network (the percentage that con-
sists of the company’s own or shared sales personnel, exclusive ornon-exclusive agents, and distributors).
• The valuation of the IT.
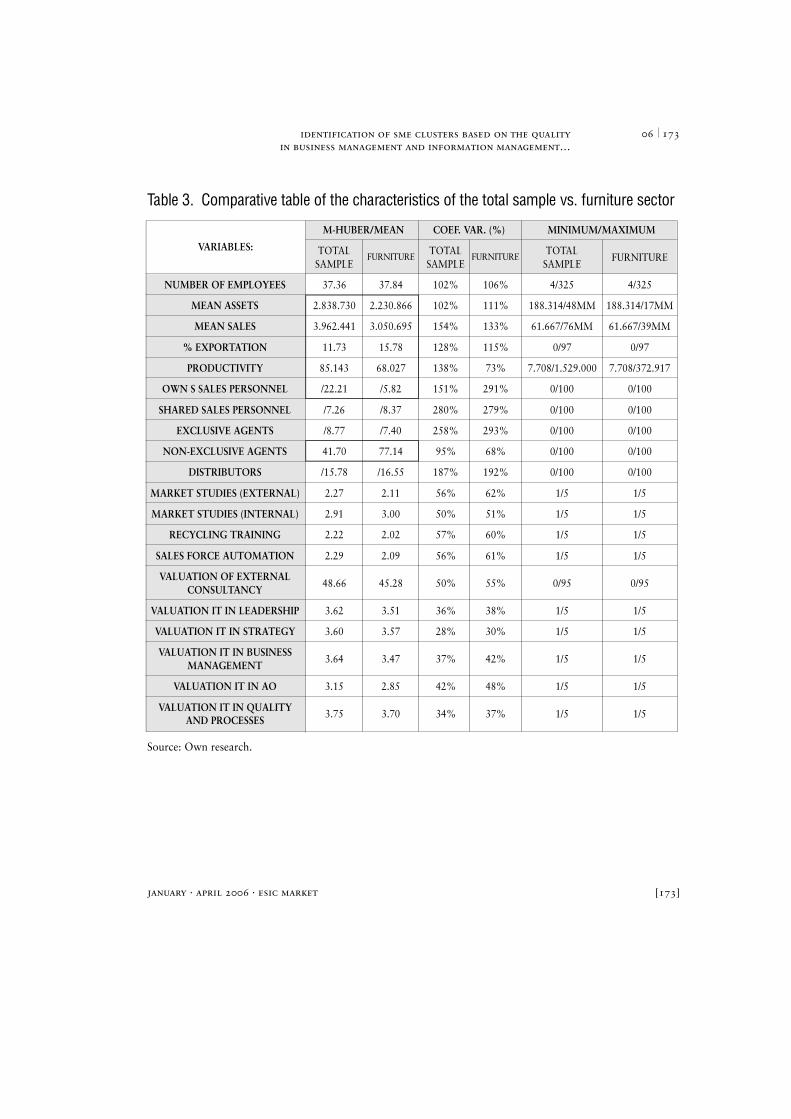
The descriptive analysis has been repeated exclusively for the furnituresector, in order to identify whether significant differences exist when onlythis activity sector is considered. The results obtained are summarised inTable 3. In the first two columns, the central tendency is evaluated usingeither the M-Huber estimator or the arithmetic direct mean (the measurecan be distinguished in the table if the datum is preceded by the character“/”), separately for the entire sample (first column) and exclusively for thefurniture sector (second column) as shown. Similarly, the third and fourthcolumns present the dispersion parameter (the coefficient of variation),obtained as the quotient between the typical deviation and the arithmeticmean, and multiplied by 100. The last two columns display the maximumand minimum values achieved.
[172]
172 06
identification of sme clusters based on the quality in business management and information management…
january · april 2006 · esic market [173]
17306
Source: Own research.
Table 3. Comparative table of the characteristics of the total sample vs. furniture sector
M-HUBER/MEAN COEF. VAR. (%) MINIMUM/MAXIMUM
TOTALF U R N I T U R E
TOTALF U R N I T U R E
TOTALFURNITURE
SAMPLE SAMPLE SAMPLE
NUMBER OF EMPLOYEES 37.36 37.84 102% 106% 4/325 4/325
MEAN ASSETS 2.838.730 2.230.866 102% 111% 188.314/48MM 188.314/17MM
MEAN SALES 3.962.441 3.050.695 154% 133% 61.667/76MM 61.667/39MM
% EXPORTATION 11.73 15.78 128% 115% 0/97 0/97
PRODUCTIVITY 85.143 68.027 138% 73% 7.708/1.529.000 7.708/372.917
OWN S SALES PERSONNEL /22.21 /5.82 151% 291% 0/100 0/100
SHARED SALES PERSONNEL /7.26 /8.37 280% 279% 0/100 0/100
EXCLUSIVE AGENTS /8.77 /7.40 258% 293% 0/100 0/100
NON-EXCLUSIVE AGENTS 41.70 77.14 95% 68% 0/100 0/100
DISTRIBUTORS /15.78 /16.55 187% 192% 0/100 0/100
MARKET STUDIES (EXTERNAL) 2.27 2.11 56% 62% 1/5 1/5
MARKET STUDIES (INTERNAL) 2.91 3.00 50% 51% 1/5 1/5
RECYCLING TRAINING 2.22 2.02 57% 60% 1/5 1/5
SALES FORCE AUTOMATION 2.29 2.09 56% 61% 1/5 1/5
VALUATION OF EXTERNAL CONSULTANCY
48.66 45.28 50% 55% 0/95 0/95
VALUATION IT IN LEADERSHIP 3.62 3.51 36% 38% 1/5 1/5
VALUATION IT IN STRATEGY 3.60 3.57 28% 30% 1/5 1/5
VALUATION IT IN BUSINESS MANAGEMENT
3.64 3.47 37% 42% 1/5 1/5
VALUATION IT IN AO 3.15 2.85 42% 48% 1/5 1/5
VALUATION IT IN QUALITY AND PROCESSES
3.75 3.70 34% 37% 1/5 1/5
VARIABLES:
january · april 2006 · esic market
identification of sme clusters based on the quality in business management and information management…
4.1.2. EFQM ProfileA summary of the central statistics (M-Huber) and dispersion statistics(Coeff. of var.: Typical deviation*100/mean) of the variables indicating theenabling criterions and the result criterions of the model (variables.: LID-Leadership, EST-Policy and Strategies, GP-People Management, GR-Resources Management, CDC- Quality of Business Management, GI-I n f o rmation Management, SCP-Quality and Processes System, SC-Customer Satisfaction, SDC-Business Management Satisfaction, SP-PeopleSatisfaction, RCE-Key Performance Results) is shown in Table 4 for theentire sample and the furniture sector. In order to highlight the differen-ces, albeit very few, found in the furniture sector after comparison with theentire sample, the cells corresponding to the central tendency are shown indifferent colours depending on whether they fail (M-Huber<50%, red),pass (50%�M-Huber<56%, yellow) or if they obtain an outstanding scor e(M-Huber?56%) in the criterion. It can be clearly seen that there are novariations between the profile of an average company in the total sampleand an average company belonging to the furniture sector, although themost significant difference is that this sector reveals a much worse globalsituation, since it fails in more criterions (Leadership, Inform a t i o nManagement and Customer Satisfaction), in which the average of the totalsample passes, albeit slightly.
[174]
174 06

identification of sme clusters based on the quality in business management and information management…
january · april 2006 · esic market
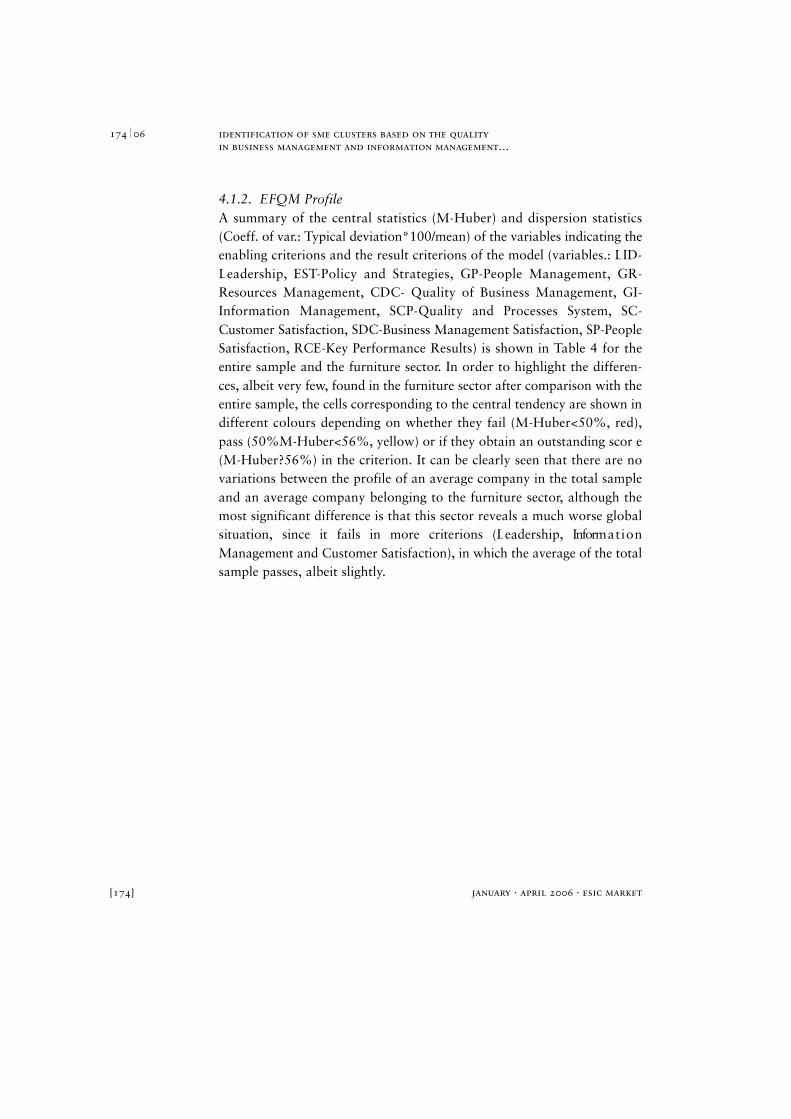
4.1.3. BSC ProfileThe comparison between the total sample and the furniture sector can beseen in Table 5 for the variables representing the four perspectives of theBalanced Scorecard (PF: Financial perspective, PC: Customer perspective,PI: Business Process Perspective, PAC: Learning and Growth perspective).The central trends obtained for the furniture sector are lower than thosecalculated for the entire sample, revealing a poorer BSC profile for thissector. The greatest (negative) deviation can be observed in the Learningand Growth perspective (approximately 7%).
[175]
17506
Source: Own research.
Table 4. Comparative table of the EFQM profile in the total sample vs.
the furniture sector
M-HUBER COEFF. VAR. (%) MINIMUM/MAXIMUM
TOTAL FURNITURE TOTAL FURNITURE TOTAL FURNITURESAMPLE SAMPLE SAMPLE
LID 50.43 42.81 60% 70% 0/100 0/100
EST 55.97 54.96 44% 48% 2/98 2/98
CDC 41.32 35.30 63% 71% 5/95 5/90
GP 44.55 40.43 46% 48% 4/87 4/87
GR 48.00 42.30 48% 56% 0/100 0/100
GI 51.29 49.48 35% 39% 9/78 9/78
SCP 59.23 56.09 37% 41% 2/97 2/97
SC 51.63 47.90 35% 36% 17/90 17/82
SDC 62.47 62.87 24% 26% 0/100 0/100
SP 41.77 38.13 44% 45% 0/86 7/79
RCE 49.56 47.43 33% 32% 12/97 12/91
january · april 2006 · esic market
identification of sme clusters based on the quality in business management and information management…
4.1.4. Strategy ProfileWith regard to the strategy option (product leadership: LIDPROD, ope-rational excellence: EXOP, and customer intimacy: RECLI), the sampledcompanies reveal there is no clear preference (see Table 6) for any of thementioned options, either in the total sample, or in the furniture sector.The maximum difference (5.5%) can be seen in the LIDPROD variable,indicating that in the furniture sector, the need to offer a leader productwith which to compete in the market is more pressing than in the rest ofthe sectors considered in the sample.
[176]
176 06
Source: Own research.
Table 5. Comparative table of the BSC profile in the total sample vs.
the furniture sector
M-HUBER COEFF. VAR. (%) MINIMUM/MAXIMUM
TOTAL FURNITURE TOTAL FURNITURE TOTAL FURNITURESAMPLE SAMPLE SAMPLE
PF 54.80 53.83 31% 31% 17/90 17/90
PC 54.18 52.58 35% 39% 14/81 14/80
PI 56.64 55.23 37% 41% 5/89 5/89
PAC 49.41 46.05 33% 37% 13/78 13/78

identification of sme clusters based on the quality in business management and information management…
january · april 2006 · esic market
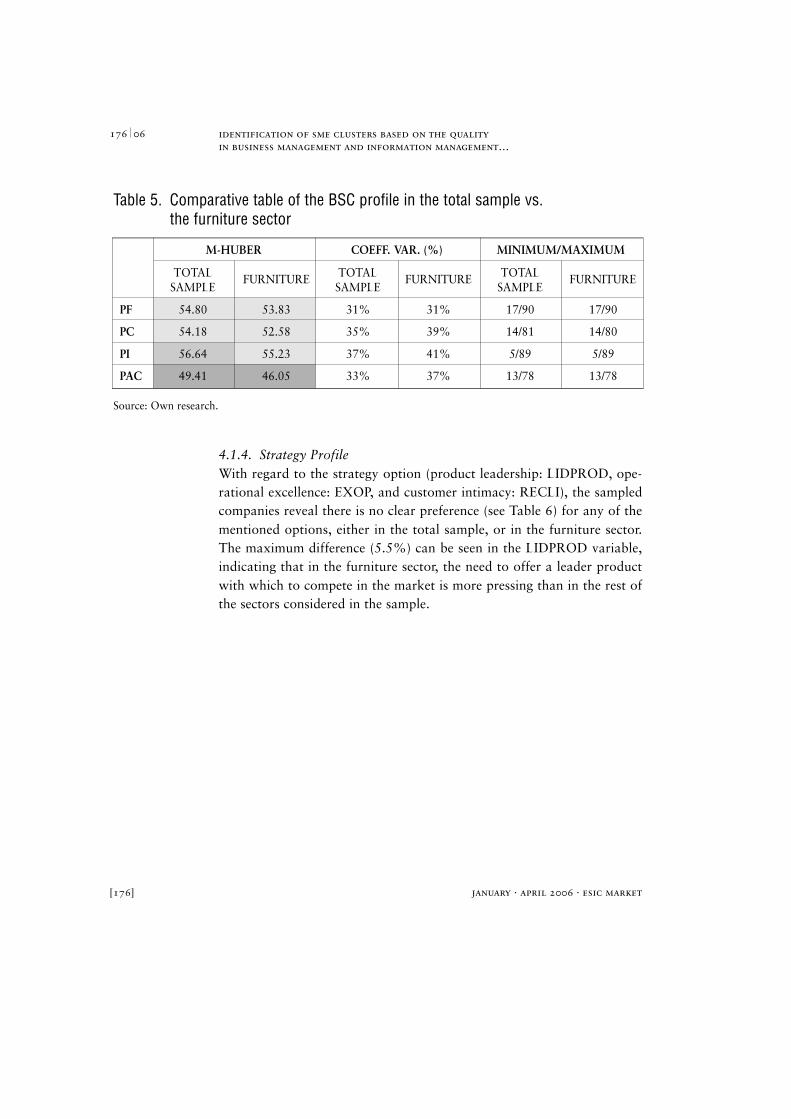
4.1.5. Strategic Alignment ProfileThe statistics obtained for the variables ALIDPROD, AEXOP and ARE-CLI, which objectively evaluate whether a company aligns its resourceswith a product leadership strategy, with an operational excellence or withcustomer intimacy, respectively, can be seen in Table 7. No significant dif-ferences are observed in the values of the M-Huber estimator, when theresults for the total sample are compared to those of the furniture sector,although it is significant that the central trend in the furniture sector, forthe three variables, is below that of the total sample. Taking the measure50% as the “hygiene level” in the three variables, it can be concluded thatthe furniture sector presents a poorer alignment profile, since it fails albeitslightly, in the ARECLI variable.
[177]
17706
Source: Own research.
Table 6. Comparative table of the strategic profile of the total sample vs.
the furniture sector
M-HUBER COEFF. VAR. (%) MINIMUM/MAXIMUM
TOTAL FURNITURE TOTAL FURNITURE TOTAL FURNITURESAMPLE SAMPLE SAMPLE
LIDPROD 72.36 76.60 27% 25% 0/100 25/100
EXOP 75.92 75.74 18% 19% 37/100 37/100
RECLI 76.71 77.77 26% 25% 25/100 25/100
january · april 2006 · esic market
identification of sme clusters based on the quality in business management and information management…
4.2. Cluster and discriminant analysisF rom the cluster analysis carried out using the 97 companies, taking theQuality of Business Management (CGC) and the Information Management(GI), as the grouping variables for these cases, a final solution of five clus-ters with a high degree of interg roup homogeneity was selected.
[178]
178 06
Source: Own research.
Table 7. Comparative table of the strategic alignment of the total sample vs.
the furniture sector
M-HUBER COEFF. VAR. (%) MINIMUM/MAXIMUM
TOTAL FURNITURE TOTAL FURNITURE TOTAL FURNITURESAMPLE SAMPLE SAMPLE
A L I D P R O D 51.57 50.49 42% 47% 7/89 7/89
AEXOP 52.30 50.96 34% 36% 15/88 15/88
ARECLI 51.79 49.59 37% 41% 13/88 13/85
Source: Own research.
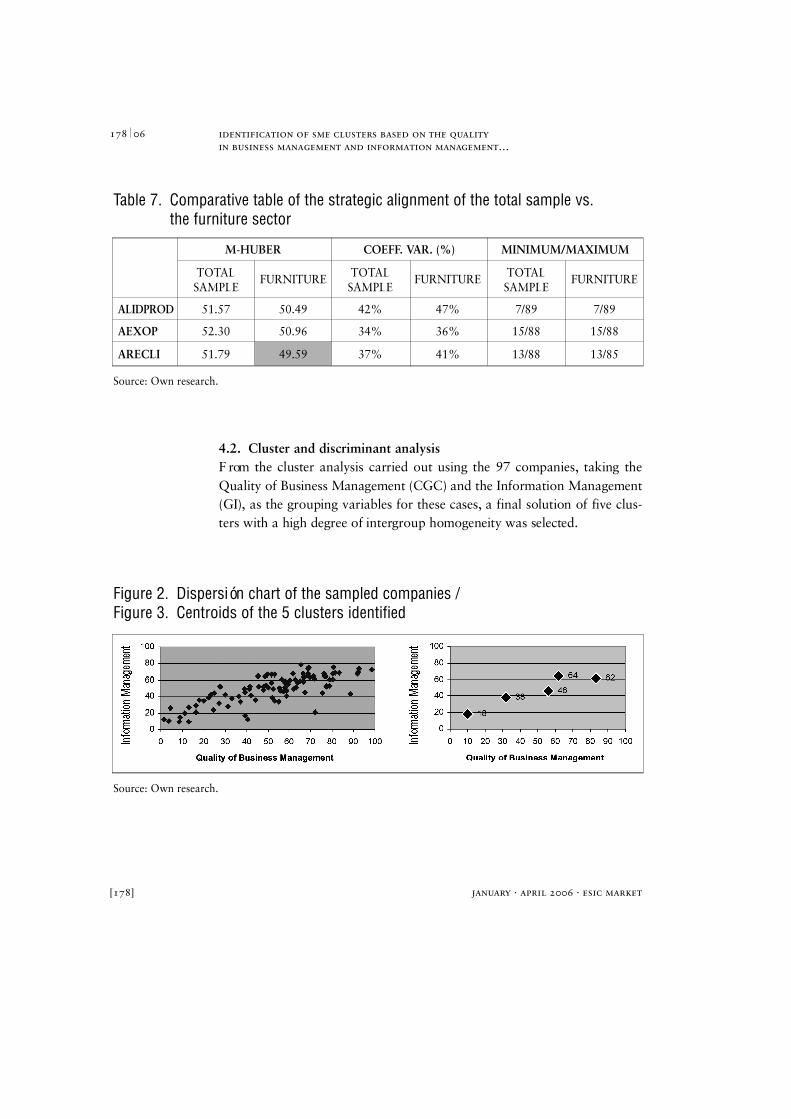
Figure 2. Dispersión chart of the sampled companies /
Figure 3. Centroids of the 5 clusters identified
identification of sme clusters based on the quality in business management and information management…
january · april 2006 · esic market
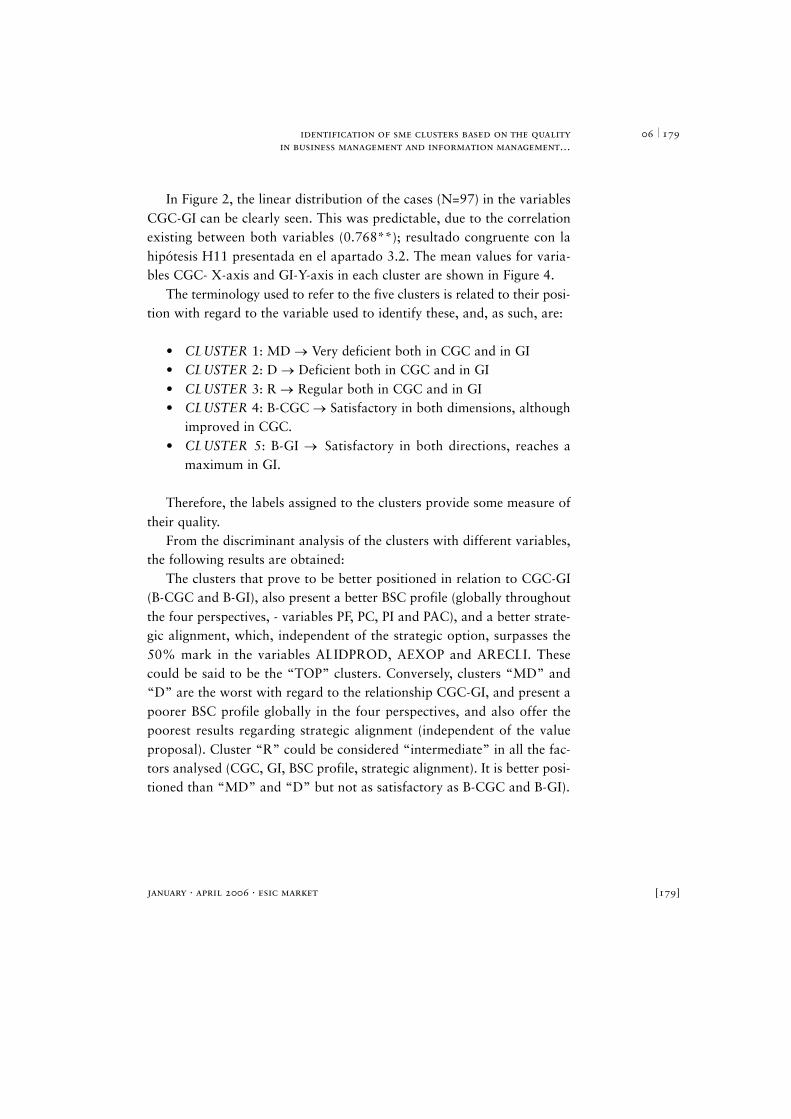
In Figure 2, the linear distribution of the cases (N=97) in the variablesCGC-GI can be clearly seen. This was predictable, due to the correlationexisting between both variables (0.768**); resultado congruente con lahipótesis H11 presentada en el apartado 3.2. The mean values for varia-bles CGC- X-axis and GI-Y-axis in each cluster are shown in Figure 4.
The terminology used to refer to the five clusters is related to their posi-tion with regard to the variable used to identify these, and, as such, are:
• CLUSTER 1: MD Very deficient both in CGC and in GI• CLUSTER 2: D Deficient both in CGC and in GI• CLUSTER 3: R Regular both in CGC and in GI• CLUSTER 4: B-CGC Satisfactory in both dimensions, although
improved in CGC.• CLUSTER 5: B-GI Satisfactory in both directions, reaches a
maximum in GI.
Therefore, the labels assigned to the clusters provide some measure oftheir quality.
From the discriminant analysis of the clusters with different variables,the following results are obtained:
The clusters that prove to be better positioned in relation to CGC-GI(B-CGC and B-GI), also present a better BSC profile (globally throughoutthe four perspectives, - variables PF, PC, PI and PAC), and a better strate-gic alignment, which, independent of the strategic option, surpasses the50% mark in the variables ALIDPROD, AEXOP and ARECLI. Thesecould be said to be the “TOP” clusters. Conversely, clusters “MD” and“D” are the worst with regard to the relationship CGC-GI, and present apoorer BSC profile globally in the four perspectives, and also offer thepoorest results regarding strategic alignment (independent of the valueproposal). Cluster “R” could be considered “intermediate” in all the fac-tors analysed (CGC, GI, BSC profile, strategic alignment). It is better posi-tioned than “MD” and “D” but not as satisfactory as B-CGC and B-GI).
[179]
17906
january · april 2006 · esic market
identification of sme clusters based on the quality in business management and information management…
The clusters with the best relation to CGC-GI or a greater “quality”(B-CGC and B-GI), also present a greater average size (with regard to thenumber of employees). Conversely, the poorer quality clusters (“MD” and“D”) are integrated by smaller companies. It could, therefore, be said thatthe cluster quality is proportional to the average size of the enterprisescomprising it, with the exception of the intermediate cluster “R”; since,although of a better quality than the one labelled “D”, is constituted bycompanies of a smaller size.
The value proposal (measured using variables LIDPROD, EXOP andRECLI) is not a discriminant factor in the clusters obtained when basedupon the relationship CGC-GI.
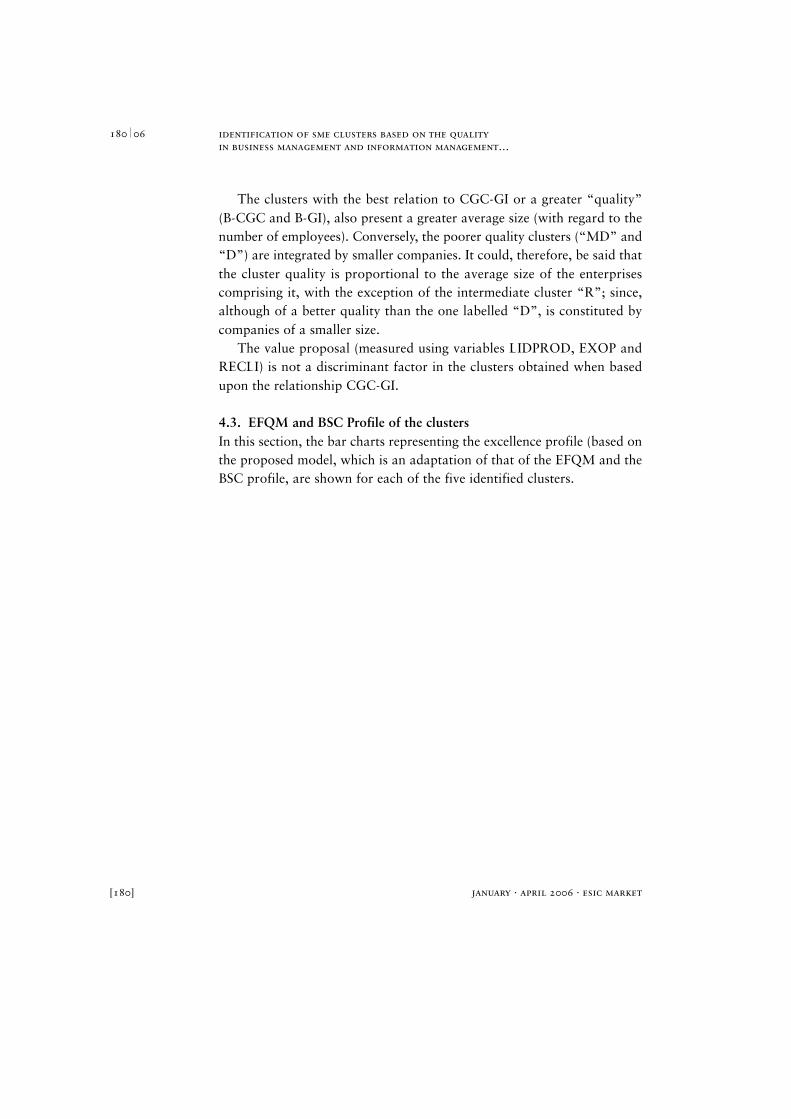
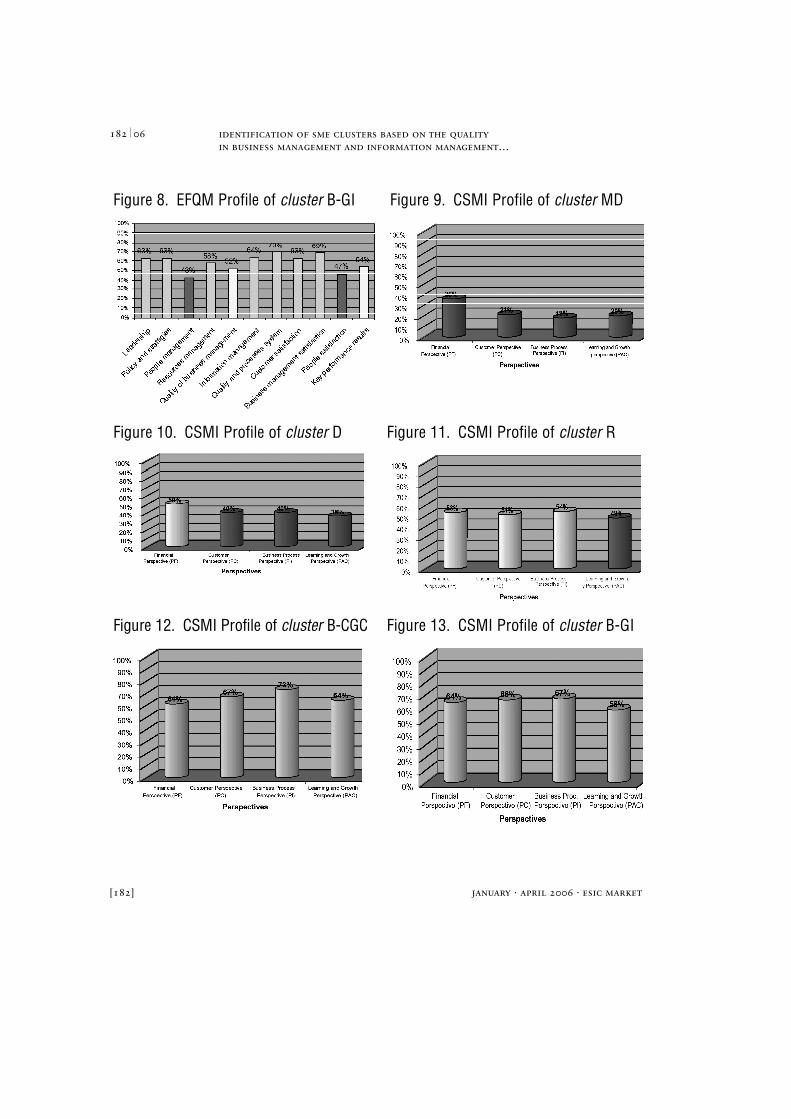
4.3. EFQM and BSC Profile of the clustersIn this section, the bar charts representing the excellence profile (based onthe proposed model, which is an adaptation of that of the EFQM and theBSC profile, are shown for each of the five identified clusters.
[180]
180 06

identification of sme clusters based on the quality in business management and information management…
january · april 2006 · esic market [181]
18106
Figure 4. EFQM Profile of cluster MD Figure 5. EFQM Profile of cluster D
Figure 6. EFQM Profile of cluster R Figure 7. EFQM Profile of cluster B-CGC
january · april 2006 · esic market
identification of sme clusters based on the quality in business management and information management…
[182]
182 06
Figure 8. EFQM Profile of cluster B-GI Figure 9. CSMI Profile of cluster MD
Figure 10. CSMI Profile of cluster D Figure 11. CSMI Profile of cluster R
Figure 12. CSMI Profile of cluster B - C G C Figure 13. CSMI Profile of cluster B-GI

identification of sme clusters based on the quality in business management and information management…
january · april 2006 · esic market
5. Conclusions
From the study carried out, it can be deduced that there are no significantdifferences between the average profiles of companies in the total sampleand an average company belonging to the furniture sector. However, themost notable differences are as follows:
• The furniture sector presents a poorer global situation, since it failsin more criterions (Leadership, Information Management andCustomer Satisfaction), in which the average of the total samplenarrowly passes.
• On average, the information system is more deficient in this sector.• With regard to the approach of the four perspectives of the
Balanced Scorecard, the central trends obtained in the furniture sec-tor are below those calculated for the total sample. The greatest(negative) deviation is registered in the Learning and Growth pers-pective (approximately 7%).
• With re g a rd to the type of strategic option chosen by the sampleenterprises, there are no clear pre f e rences for any of the strategicoptions, either in the total sample or in the furn i t u re sector. Themaximum diff e rence (5.5%) is re g i s t e red in the product leadershipoption, which seems to indicate that within the furn i t u re sector, theneed to offer a leader product with which to compete in the mar-ket is more pressing than in the rest of the sectors included in thesample.
• The valuation with regard to the support offered by IT in all thedimensions considered by the research is lower in the furniture sec-tor than in the total sample.
Five clusters have been identified with regard to the Quality of BusinessManagement and Information Management, from which the followingconclusions can be drawn:
[183]
18306

january · april 2006 · esic market
identification of sme clusters based on the quality in business management and information management…
• The best-positioned clusters with regard to the grouping variablesalso present better profiles with regard to the four perspectives ofthe Balanced Scorecard.
• The best-positioned clusters with regard to the grouping variablespresent a better strategic alignment, which, independent of the stra-tegic option, is understood to surpass 50% (on a scale from 1 to100) for the variables of product leadership, operational excellenceand customer intimacy.
• The clusters with a better relationship between the gro u p i n gvariables are those of a greater average size (with re g a rd to thenumber of employees). Conversely, smaller companies amalgama-te the poorer quality clusters. It could be said that the cluster qua-lity is pro p o rtional to the average size of the companies compri-sing it.
• The value proposal measured through the variables of product lea-dership, operational excellence and customer intimacy is not a dis-criminant factor in the obtained clusters. That is, the strategicoption is not characteristic of any cluster in particular, which is con-sistent with the conclusions provided by previous studies of thisnature. Therefore, the strategy chosen should be the individualoption of each company and, as such, the proposal of a BalancedS c o re c a rd for each of the diff e rent clusters is pointless.Consequently, each company must develop its own BalancedScorecard on the basis of the chosen strategic option.
T h rough considering the variables arising from the proposed modeland, in addition, incorporating the variables “average sales” (averaget u rnover during the period 2000-2002) and “parameterised averagesales” (average sales per employee during the period 2000-2002), and byc a rrying out a discriminant analysis to establish the behaviour of thesevariables in the diff e rent clusters, the following conclusions can beo b t a i n e d :
[184]
184 06

identification of sme clusters based on the quality in business management and information management…
january · april 2006 · esic market
• Average sales and productivity are related to cluster quality.• The commercial and business results (H2.4, H3.3 and H.6.4), cus-
tomer satisfaction (H2.1, H3.1 and H6.1), commercial directionsatisfaction (H2.2 and H.6.2) and personnel satisfaction (H2.3,H3.2 and H6.3), are related to the cluster quality. These results arecoherent with the hypotheses indicated in parentheses.
After additionally analysing some management practices within theidentified clusters, the following conclusions can be drawn:
• The percentage of companies in each cluster that develop strategicplans is greater in the clusters with better relationships between thegrouping variables.
• The percentage of companies in each cluster that, in addition to thefinancial re w a rd, contemplate other types of incentives, is greater inthe clusters with a better relationship between the grouping variables.
• The clusters with a better relationship between the grouping varia-bles also have the greatest number of companies certified toISO9000 standards.
• Companies which carry out a self-evaluation based on the EFQMmodel can be found only in the best clusters.
• The clusters with a better relationship between the grouping varia-bles also place greater value on external consultancy services.
6. BibliographyBAÑÓN RUBIO, A.; ARAGÓN SÁNCHEZ, A.; SÁNCHEZ MARÍN, G.
(2002): “Estudio empírico sobre la Competitividad de la Pyme”.Universidad de Murcia, Campus de Espinardo.
BELTRÁN SANZ, J.; CARMONA CALVO, M.A.; CARRASCO PÉREZ,R.; RIVAS ZAPATA, M.A.; TEJEDOR PANCHON, F. (2002): Guíapara una gestión basada en procesos. Coeditan AE-EUSKALIT-FvQ-IAF-idi-Q. Pp. 13-57. ISBN 84-923464-7-7.
[185]
18506

january · april 2006 · esic market
identification of sme clusters based on the quality in business management and information management…
CAMISÓN, C. (2001): “La Competitividad de la empresa industrial de laComunidad Valenciana: Análisis del efecto del atractivo del entorno,los distritos industriales y las estrategias empresariales”. EditorialTirant Lo Blanch, Valencia.
COLLINS, J.C.; PORRAS, J.I. (1996): “Building Your Company’sVision”. Harvard Business Review, September/October, pp. 65-77.
DEMING, W.E. (1989): Calidad, Productividad y Competitividad. Lasalida de la crisis. Madrid: Díaz de Santos S.A. ISBN 84-87189-22-9.
EFQM (1999): Diagnóstico de la Excelencia. Madrid: Club Gestión deCalidad. Pp. 3-37. ISBN 90-5236-102-9.
EFQM (2003): Modelo EFQM de Excelencia. Versión Pequeñas yMedianas Empresas (PYMES). Madrid: Club Gestión de Calidad. Pp.8ss, 14-27. ISBN 90-5236-341-2.
GALÁN, J.L.; VECINO, J. (1997): “Las fuentes de rentabilidad de lasempresas”. Revista Europea de Dirección y Economía de la Empresa,Vol. 6, nº 1, pp. 21-36.
GONZÁLEZ, E. (2000): “Efecto industria, efecto grupo, efecto empresa”.ACDE, Oviedo.
GONZÁLEZ DURÁN, F. (1999): Sistemas y Tecnologías de Informacióny Comunicaciones en el proceso de Dirección de Calidad Total. TesisDoctoral, Universidad Politécnica de Madrid.
GONZALEZ LADRON DE GUEVARA, F. (2001): Caracterización de losP rocesos de Aprendizaje Organizativo y su relación con lasTecnologías de la Información. Aplicación al Sector Textil Hogar de laComunidad Valenciana. Tesis Doctoral, Universidad Politécnica deValencia, Junio.
GONZÁLEZ SÁNCHEZ, M. (2003): Influencia de los Sistemas deInformación en la Gestión Comercial de las PYMES: una propuesta derevisión del modelo EFQM. Tesis doctoral, Universidad Politécnica deValencia. Octubre.
HAMEL, G.; PRAHALAD, C.K. (1994): Competing for the Future.Boston: Harvard Business School Press.
[186]
186 06

identification of sme clusters based on the quality in business management and information management…
january · april 2006 · esic market
KAPLAN, R; NORTON, D. (1992): “The Balanced Scorecard-Measuresthat Drive Perfomance”. Harvard Business Review. January-February,pp. 71-79.
KAPLAN, R; NORTON, D. (1996): “Using the Balanced Scorecard as aStrategic Management System”. H a rv a rd Business Review.January/February, pp. 75-85.
KAPLAN, R.; NORTON, D. (1997): C u a d ro de mando Integral.Barcelona: Ediciones 2000. Pp. 23-33. ISBN 84-8088-175-5.
KAPLAN, R.; NORTON, D. (2001): The Strategy Focused Organization.Boston: Harvard Business School Press.
LAMOTTE, G.; CARTER, G. (2000): “Are the Balanced Scorecard andthe EFQM Excellence Model mutually exclusive or do they work toget-her to bring added value to a company?”. Balance Score c a rdCollaborative – EFQM. Technical Note, www.efqm.org/workshops
MEMBRADO MARTÍNEZ, J. (1997): “La Calidad Total a través delModelo Europeo de Excelencia Empresarial”. Qualitas Hodie. Nº 34Abril, pp. 39-46. ISSN 1133-2417.
MEMBRADO MARTÍNEZ, J. (1998): “Los resultados en el ModeloEuropeo de Excelencia Empresarial”. Qualitas Hodie. Nº 41 Febrero,pp. 39-47. ISSN 1133-2417.
MEMBRADO MARTÍNEZ, J. (1999): La gestión empresarial a través delmodelo europeo de excelencia de la EFQM. Madrid: Ediciones Díaz deSantos. ISBN 84-7978-403-2.
MEMBRADO MARTÍNEZ, J. (2001): “Las bases del Modelo EFQM deExcelencia”. Qualitas Hodie. Nº 68 Marzo, pp. 39-46. ISSN 1133-2417.
MINTZBERG, H. (1994): “The Fall and Rise of Strategic Planning”.Harvard Business Review. January-February, pp. 107-114.
MINTZBERG, H.; QUINN, J.B.; VOYER, J. (1997): El Pro c e s oEstratégico conceptos, contextos y casos. Mexico: Prentice HallHispanoamericana.
MIÑANA TEROL, J.L. (2001): Desarrollo de un modelo que permita eldiagnóstico en la aportación de valor de la Infraestructura de
[187]
18706

january · april 2006 · esic market
identification of sme clusters based on the quality in business management and information management…
Tecnologías de la Información. Tesis Doctoral, Universidad Politécnicade Valencia, septiembre.
NIVEN, P.R. (2003): El Cuadro de Mando Integral paso a paso.Barcelona: Ediciones Gestión 2000. ISBN 84-8088-872-5.
O’BRIEN, J.A. (2001): Sistemas de Información Gerencial. 4ª edición.Bogotá-Colombia: McGraw-Hill Latino América, pp. 268-273, 307-311, 376-390, 638-641. ISBN 958-410-177-3.
OLVE, N.G.; ROY, J.; WETTER, M. (2001): Implantando y gestionandoel Cuadro de Mando Integral (Performance Drivers). Barcelona:Gestión 2000.
PORTER, M.E. (1980): Competitive Strategy. New York: The Free Press. SANTOS, M.V.; GARCÍA, M.T.; PÉREZ, M.P. (1998): “Adaptación e
Imitación en la Estrategia Empresarial. El caso de la estructura de mer-cado de las cajas de ahorro españolas”. Cuadernos de Economía yDirección de Empresas, Vol. 2, pp. 203-230.
SENGE, P. (1990): The Fifth Discipline: The Art and Practice of theLearning Organization. New York: Currency Doubleday.
TREACY, M.; WIERSEMAN, F. (1994): The Disciplines of MarketingLeaders. Reading, M.A. Addison-Wesley.
UDAONDO DURAN, M. (2000): El Cuadro de Mando Integral y elModelo de Excelencia Empresarial de la EFQM. Ponencia. 1ª Cumbrede Excelencia en la Gestión. Madrid.
[188]
188 06