Embed Size (px)
Citation preview
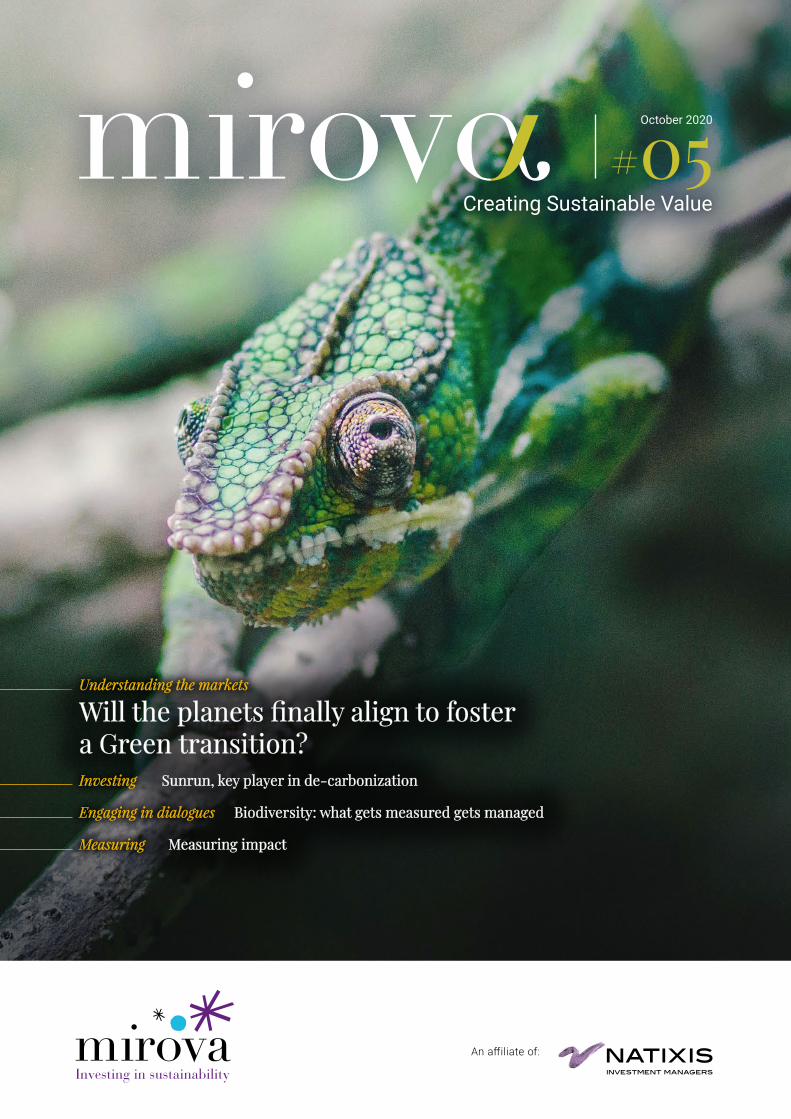
October 2020
Will the planets finally align to foster Will the planets finally align to foster a Green transition? a Green transition?
Sunrun, key player in de‑carbonizationSunrun, key player in de‑carbonization
Biodiversity: what gets measured gets managed Biodiversity: what gets measured gets managed
Measuring impact Measuring impact
Creating Sustainable Value#05
InvestingInvesting
Engaging in dialoguesEngaging in dialogues
MeasuringMeasuring
Understanding the marketsUnderstanding the markets
Will the planets finally align to foster a Green transition? Today, the fight against COVID-19 and its impact on the economy is capturing the attention of poli-cymakers, regulators, and the media worldwide. The scale of the impending social crisis now rivals that of the ongoing pandemic. However, these unprecedented times, which consequences will take years to measure and absorb , overshadow some exceptional evolutions more favorable to a green
transition that are fueling hope for a brighter future. While ever-more alarming reports on climate change and biodiver-sity pile up, urging us to react in an effort to reverse the trend, at the same time, a set of ambitious international, regional and national public decisions on climate and the environment are beginning to emerge, forming a constella-
tion of positive signs, capable of pushing the boundaries. Apart from declarations that put certain topics on the agenda, such as the pledge by the 64 heads of state/government and the European Union (EU) to reverse nature’s decline by 2030, concrete commitments of funding and investment to drive forward the ecological transition are also emerging simultaneously throughout the world.
Understanding the markets
The EU is well aheadThe Green New Deal presented for the first time in December 2019 by the President of the European Commission (EC), Ursula Van der Leyen, consists of a set of political initiatives aimed at developing the continent's biodiversity strategy by 2030. It also sets out to achieve carbon neutrality for the EU by 2050. The Deal’s ambitious targets
will require substantial investment in each impacted sector. The Commission plans to unblock €20 billion per year. This initiative is now part of the EU's recovery plan to tackle the COVID-19 crisis, Next Generation EU, a one-off temporary financial instrument with €750 billion in additional funding raised on the markets for
2021-2024. The instrument serves to further extend and shore up the European budget. Next Generation EU and the EU's Multi-annual Financial Framework (MFF) will free up a total of €1,850 billion in funds to kick-start the economy and ensure that Europe recovers. The European Council meeting of July 21 approved an overall target
The mentioned perspectives reflect the opinion of MIROVA at the date of this document and are likely to change without notice. The securities mentioned above are shown for illustrative purpose only, and should not be considered as a recommendation or a solicitation to buy or sell.
2#05 –October 2020

Understanding the markets
of 30% climate-focused expenditure for MFF and Next Generation EU. The scope of these initiatives was further strengthened in September by Ursula Von de Leyen's announ-cement of a targeted 55% reduction
in EU emissions between 1990 and 2030 in her EU speech. The European Parliament is in favor of a 60% emissions reduction by 2030 in the framework of the European climate law. European
finance is not to be outdone; as the European Commission's initial sustainable finance plan is still in full deployment, a revised sustainable finance strategy is expected to be announced by the end of this year.
This Green shift is not limited to Europe, however: China is adopting similar ambitious measures. In the wake of the EU’s announcements, China, the world’s biggest CO2 emitter made a bold and unexpected pledge to achieve carbon-neutrality in a speech made by President Xi Jinping at the United Nations. For the first time, the commitments were decorrelated from the country’s growth rate. The country targets CO2 emissions peaking by 2030 before achieving carbon-neutrality before 2060. In
September, Tsinghua University published a roadmap for China to achieves its targets. Meanwhile, in South Korea, the Democratic Party’s victory in the April 15 legislative elections creates a platform to roll out its green new deal. This follows commitments that were previously considered soft, especially by young people. The country sets the objective to go fully carbon neutral by 2050. To this end, it should adopt several measures: investing
in renewable energy; implementing a carbon pricing system by phasing out public investment in coal and creating regional energy transition centers to support the transition of workers to green jobs.
Around the world, stimulus plans seem to be factoring in climate change initiatives. Will the same be true in the U.S.? As the U.S. presidential election approaches, the results will reflect a choice between two radically opposed ideologies on a number of issues, and the outcome will most certainly have a major impact on climate and environmental policy. Should Joe Biden win the election, the United States could rejoin the Paris Agreement. As it stands, the country will officially withdraw from the agreement on November 4, to mark the end of a process started by President Trump in 2017. If the Democrats win, a recommitment could be back on the cards. Joe Biden has also put forward a climate plan centered on four years of green energy and infrastructure investment, totaling $2,000 billion. In particular, Mr. Biden has laid out
plans to decarbonize the electricity sector (zero carbon emissions by 2035). During the primaries, he set out an objective to end subsidies for the fossil fuel industry. Biden has alsoemphasized the need for climate justice and to accelerate an ecological transition that will generate jobs in America. The alternative is another four years of President Trump. This would make for a starkly different picture. Though true to his doctrine of unpre-dictability, it is highly unlikely that Mr. Trump will involve the federal government in a far-reaching policy on climate change. Regardless of the election result, the ecological transition will extend far beyond the federal scope and remain vivid thanks to the efforts
of a wide number of States and major cities. The current climatic backdrop adds leverage to the ecological transition argument In a context where the frequency of extreme weather events is on the rise, with the huge fires in California, extreme temperature variations or increasingly frequent high-intensity storms, more than ever, climate change has become a primary concern for citizens and communi-ties alike.
3#05 –October 2020
Cities take action to save the climate
1 National Association of Securities Dealers Automated Quotations
On October 9, 2019, the C40 world mayors met. The network of climate action cities is the largest in the world. During the summit, the C40 city mayors pledged their support to a global “green new deal.” They favor measures to counter the climate emergency and “crucially, fundamentally and irreversibly” reorientate global resources that are currently supporting the use of ffossil fuels. Against the background of the pandemic, the network elected members’ proposals for economic recovery published in mid-July combine
various measures to foster a sustainable and equitable recovery in cities. The strategy focuses on adapting health provisions and infrastructure to the risks of a pandemic as well as to climate change. It is also geared towards offering resilient public services, ranging from the renovation of buildings to investment in transport and soft mobility. COVID-19 is a wake-up call for each and every one of us on a local, regional, and global level. It has increased awareness of our vulnerabilities coupled with the urgency and interconnected-
ness of environmental, social, and economic concerns. Let’s hope that the signs of this increased awareness, which are appearing worldwide, will be confirmed over time: let’s not risk missing this opportunity.
Macroenomic trendsSummer on a gentle slope After a relatively calm summer on stock markets in Europe compared with almost euphoric trends seen for certain U.S. market segments, the back-to-school season in September was more turbulent. In particular, the NASDAQ1 corrected by around 10% in just three days (its most rapid decline in stock market history), leaving some investors wondering what positions to adopt through to year-end.
The shift, which is primarily technical, corresponds to the unwinding of speculative options positions on American technology. It still revealed the vulnerability of financial markets, in a context where newsflow on health, economic and political issues is picking up. Indeed, i) the surge in COVID-19 cases in Europe has led to new health restrictions with negative consequences on the economy, ii)
positive macro newsflow on both sides of the Atlantic is drying up, heralding a weaker-than-expected recovery, and ii) Democrats and Republicans are unable to reach agreement on a fiscal stimulus package in the United States just weeks before the presidential elections. All three factors could damage investor confidence.
What’s really going on with the global health crisis? Europe has become a new pandemic hot spot, due to the rapid increase in cases in recent weeks. The situation varies for each country. Some countries, such as France and Spain, are experiencing difficulty whereas others like Italy and Germany are less impacted. However, the transmission rate (R0) remains close to 1 in most countries, well below the level in
early March. This suggests that a small change in mobility (resulting from current partial further lockdown measures) should be sufficient to stem the pandemic’s spread in the short term (as in many countries in East Asia). In the United States, the scenario seems to be improving, especially in the southern states, which expe-rienced a strong wave until July.
The same applies to China and large emerging countries with the notable exceptions being India (still improving) and Indonesia. The key challenge is to reduce the transmission rate over the long-term. Only treatments and vaccines will prove effective. For this reason, many vaccines are being developed in parallel. At least 35 laboratories are conducting
Understanding the markets
4#05 –October 2020
Understanding the markets
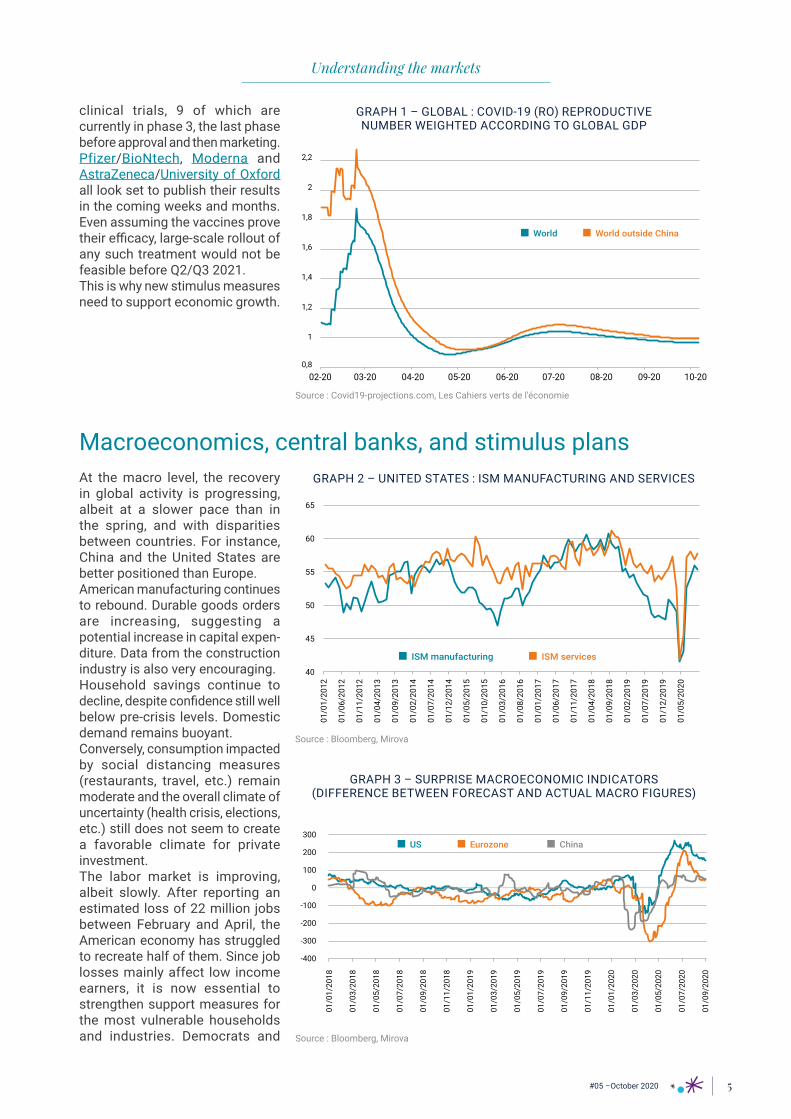
clinical trials, 9 of which are currently in phase 3, the last phase before approval and then marketing. Pfizer/BioNtech, Moderna and AstraZeneca/University of Oxford all look set to publish their results in the coming weeks and months. Even assuming the vaccines prove their efficacy, large-scale rollout of any such treatment would not be feasible before Q2/Q3 2021. This is why new stimulus measures need to support economic growth.
Macroeconomics, central banks, and stimulus plansAt the macro level, the recovery in global activity is progressing, albeit at a slower pace than in the spring, and with disparities between countries. For instance, China and the United States are better positioned than Europe. American manufacturing continues to rebound. Durable goods orders are increasing, suggesting a potential increase in capital expen-diture. Data from the construction industry is also very encouraging. Household savings continue to decline, despite confidence still well below pre-crisis levels. Domestic demand remains buoyant. Conversely, consumption impacted by social distancing measures (restaurants, travel, etc.) remain moderate and the overall climate of uncertainty (health crisis, elections, etc.) still does not seem to create a favorable climate for private investment. The labor market is improving, albeit slowly. After reporting an estimated loss of 22 million jobs between February and April, the American economy has struggled to recreate half of them. Since job losses mainly affect low income earners, it is now essential to strengthen support measures for the most vulnerable households and industries. Democrats and
0,8
1
1,2
1,4
1,6
1,8
2
2,2
02-20 03-20 04-20 05-20 06-20 07-20 08-20 09-20 10-20
World World outside China
GRAPH 1 – GLOBAL : COVID-19 (RO) REPRODUCTIVE NUMBER WEIGHTED ACCORDING TO GLOBAL GDP
Source : Covid19-projections.com, Les Cahiers verts de l'économie
ISM manufacturing ISM services
40
45
50
55
60
65
01/0
1/20
12
01/0
6/20
12
01/1
1/20
12
01/0
4/20
13
01/0
9/20
13
01/0
2/20
14
01/0
7/20
14
01/1
2/20
14
01/0
5/20
15
01/1
0/20
15
01/0
3/20
16
01/0
8/20
16
01/0
1/20
17
01/0
6/20
17
01/1
1/20
17
01/0
4/20
18
01/0
9/20
18
01/0
2/20
19
01/0
7/20
19
01/1
2/20
19
01/0
5/20
20
GRAPH 2 – UNITED STATES : ISM MANUFACTURING AND SERVICES
Source : Bloomberg, Mirova
-400
-300
-200
-100
0
100
200
300US Eurozone China
01/0
1/20
18
01/0
3/20
18
01/0
5/20
18
01/0
7/20
18
01/0
9/20
18
01/1
1/20
18
01/0
1/20
19
01/0
3/20
19
01/0
5/20
19
01/0
7/20
19
01/0
9/20
19
01/1
1/20
19
01/0
1/20
20
01/0
3/20
20
01/0
5/20
20
01/0
7/20
20
01/0
9/20
20
GRAPH 3 – SURPRISE MACROECONOMIC INDICATORS (DIFFERENCE BETWEEN FORECAST AND ACTUAL MACRO FIGURES)
Source : Bloomberg, Mirova
5#05 –October 2020
Republicans agree on the principle of a new stimulus plan but disagree on its size and content. For the Democrats, the initial $3.4 trillion project has been reduced to $2.2 trillion. The Republicans’ baseline proposal of $500 billion was revised to $1.1 and then $1.5 trillion. Even factoring in the latest Republican proposal, the plan would account for 6.8% of GDP, significantly improving growth prospects in the United States. In Europe, the recent deterioration in the health crisis is starting to weigh on activity, as seen in recent
2 Purchasing Managers’ Index
survey data (PMI2). The health crisis seems to have affected the labor market for the foreseeable future, which in turn impacts household disposable income. The latest inflation figures reflect this negative spiral, confirming the need for fresh eurozone monetary and fiscal stimulus. In this context, the European Green Deal approved this summer should have a positive impact on growth as of 2021. The EU has earmarked a minimum of €550 billion to finance green projects out to 2027. Funds will also be
allocated to EU plans with a focus on the digital transition and healthcare. Banking, housing, and transport industries are expected to benefit from more robust domestic demand. Renovation, recycling, and renewable energies are central to the EU’s energy policy. Furthermore, IT equipment and services as well as medical technologies are well positioned. In the short run, we believe that the European Central Bank (ECB) will be forced to act by strengthening its Quantitative Easing.
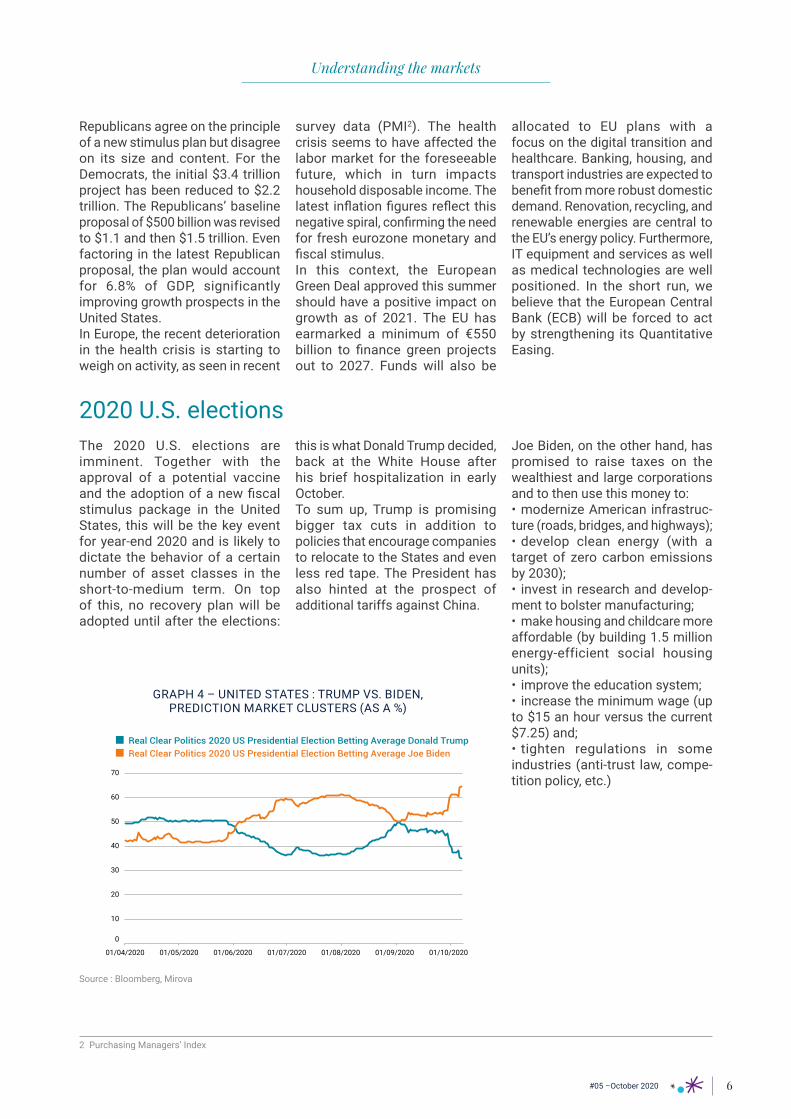
2020 U.S. elections The 2020 U.S. elections are imminent. Together with the approval of a potential vaccine and the adoption of a new fiscal stimulus package in the United States, this will be the key event for year-end 2020 and is likely to dictate the behavior of a certain number of asset classes in the short-to-medium term. On top of this, no recovery plan will be adopted until after the elections:
this is what Donald Trump decided, back at the White House after his brief hospitalization in early October. To sum up, Trump is promising bigger tax cuts in addition to policies that encourage companies to relocate to the States and even less red tape. The President has also hinted at the prospect of additional tariffs against China.
Joe Biden, on the other hand, has promised to raise taxes on the wealthiest and large corporations and to then use this money to:• modernize American infrastruc-ture (roads, bridges, and highways); • develop clean energy (with a target of zero carbon emissions by 2030); • invest in research and develop-ment to bolster manufacturing; • make housing and childcare more affordable (by building 1.5 million energy-efficient social housing units); • improve the education system; • increase the minimum wage (up to $15 an hour versus the current $7.25) and; • tighten regulations in some industries (anti-trust law, compe-tition policy, etc.)
Understanding the markets
0
10
20
30
40
50
60
70
01/04/2020 01/05/2020 01/06/2020 01/07/2020 01/08/2020 01/09/2020 01/10/2020
Real Clear Politics 2020 US Presidential Election Betting Average Donald TrumpReal Clear Politics 2020 US Presidential Election Betting Average Joe Biden
GRAPH 4 – UNITED STATES : TRUMP VS. BIDEN, PREDICTION MARKET CLUSTERS (AS A %)
Source : Bloomberg, Mirova
6#05 –October 2020

Understanding the markets
We remain confident about medium to long-term prospects. The recovery is well underway and is expected to continue. Central banks are expected to remain accommodating and interest rates should remain at attractive levels. Fiscal stimulus packages should prove successful. Regarding the equity risk premium, it is at an all-time high relative to bonds. In the shorter term, we see two main positive drivers for continued growth in risky assets: the approval of a vaccine and the adoption of a new fiscal stimulus package in the United States. In fact, the chances of delivering on results for at least one of these growth drivers have considerably increased. Admittedly, the U.S. presiden-tial election logically generates volatility. Nevertheless, we believe that strong risk aversion would only result from a scenario where election results were challenged, followed by possible violence against the backdrop of a recount of the ballots. This is what happened in 2000, for example. At the time, it took more than a month after election day to find out whether
George W. Bush or Al Gore was the new president. Ultimately, a decision was made by the Supreme Court. According to the polls, a wide-scale victory by the Democrats remains the most likely scenario. (That said, we must not forget that polling institutes were undermined in 2016 following the defeat of Hillary Clinton.) If this scenario does indeed materialize, markets are likely to welcome the announced fiscal stimulus package ($2,500 billion), even if it means postponing corporate tax increases (from 21% to 28%), at least initially. The proposed corporate tax increases could be revised downwards and are unlikely to be implemented before 2022. In contrast, some sectors, particularly American technology, which accounts for a large share of the indices, could suffer from certain future reforms. Conversely, ecological transition stocks, cyclical/value stocks benefiting from the stimulus plan, as well as stocks exposed to China, which are less dependent on Trump's mood swings, look set to outperform.
If the Republicans remain in control of the White House and the Senate, American technology companies should hold up well, as should the sectors most sensitive to the environmental regulations that Biden wants to implement (oil, gas, etc.). In contrast, stocks that would benefit from the potential green deal could suffer in the short term. On the interest rate front, an increase in nominal rates is quite likely as investors could move into equities if a vaccine is approved and/or a large-scale stimulus plan is confirmed. Nonetheless, we do not expect a short to medium-term rebound in inflation. The economy has a long way to go before reaching its full growth potential. This is due to high jobless rates coupled with the time needed for the sectors that were most impacted by the pandemic to return to normal, which could be at least twelve months.
Choosing the right positioning
7#05 –October 2020
FOCUS How green was my value
Understanding the markets
Nothing ressembles the formation of an asset bubble more than a rise, supported by solid fundamentals. Among them, the global dotcom bubble of the 2000s, the Japanese real estate price bubble of the 1980s and the U.S. railroad bubble at the end of the 19th century. Each of these phenomena was based, if only partially, on reasoning and data, which, if not irrefutable, at least appeared to be rational, even just a few weeks before they burst.
Economic bubbles are always difficult to identify: since they always have a logical component. All Mirova’s equity portfolio managers experienced the bursting of the dot com bubble. They all remember what the boom was based on at the time; a confidence in valuations based on the rules of the so-called “new economy.” According to their proponents, new economy fundamentals did away with some or even all of the basic economic principles that were
virtually considered sacrosanct up to then. So, how can we describe the current outperformance of so-called “green” stocks? Are we talking about a bubble, inflated by a herd mentality as can sometimes occur on financial markets, or does it reflect growing awareness of the potential growth that economic players committed to the ecological and social transitions could enjoy?
An ecological transition is an economic transition? After all, once again, a major transition is presented as the reason for the surge in valuations. We are talking about the emergence of a new economy, which we refer to as “sustainable” to keep things simple. In any case, this new economy is different from the one that the markets thought they had recognized in the early 2000s. Its occurrence does not in any way overturn established economic principles. Rather, it is merely part
of the long series of economic tran-sitions that humanity has hitherto experienced. This series ranges from the discovery of the wheel to the use of iron and its alloys (the Iron Age) through to automation made possible by steam (the Industrial Revolution). And, of course, we must not forget the discovery of cost-effective energy including coal and oil, as well as fertilizers and pesticides, which successfully enabled a shift from agricultural
work to other business areas. In our view, this can be seen as an initial indication of the sustainable nature of the surge in valuations of Green stocks. Others exist, including government support, which is fueling the trend but did not create it. Lastly, unlike some start-ups in the early 2000s, most of the green players identified have already illustrated their ability to generate cash flow from activities related to the environment.
8#05 –October 2020
Green stocks in 2020: multiple expansion and high valuations
3 Past performance and simulations of past and future performances are not a reliable indicator and therefore do not anticipate future results.4 Price-Earnings Ratio 5 Enterprise value/cash flow6 Enterprise value/sales
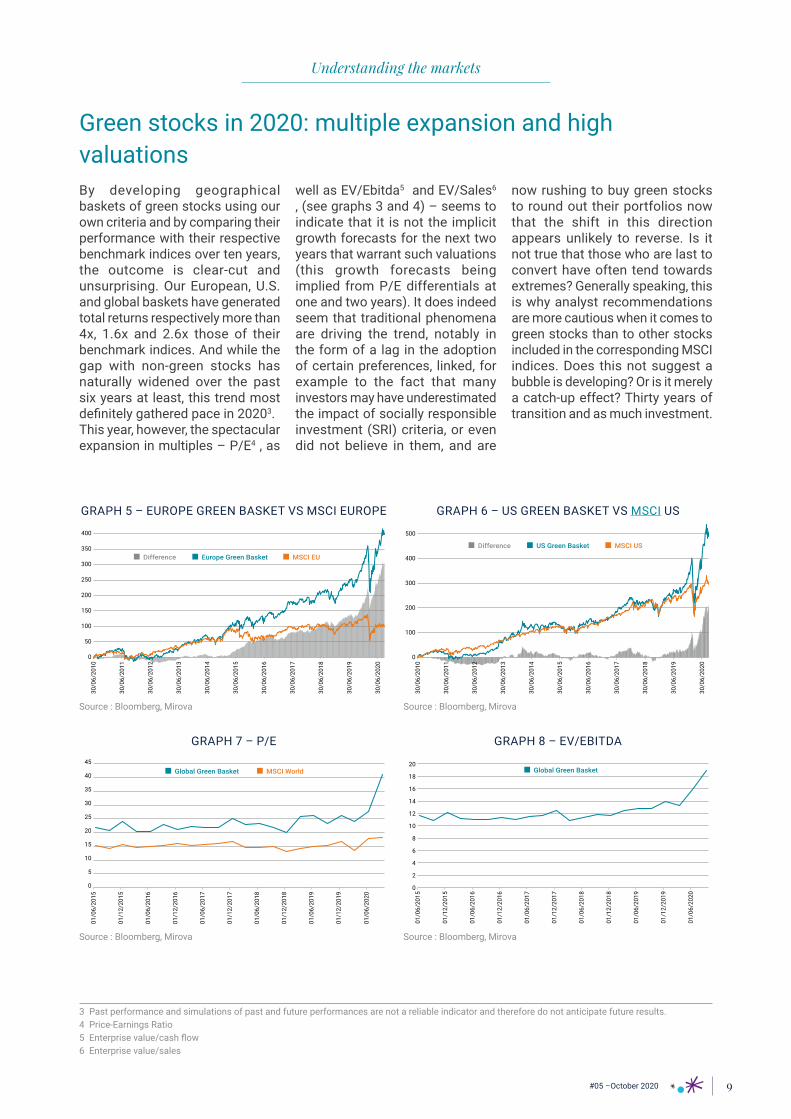
By developing geographical baskets of green stocks using our own criteria and by comparing their performance with their respective benchmark indices over ten years, the outcome is clear-cut and unsurprising. Our European, U.S. and global baskets have generated total returns respectively more than 4x, 1.6x and 2.6x those of their benchmark indices. And while the gap with non-green stocks has naturally widened over the past six years at least, this trend most definitely gathered pace in 20203. This year, however, the spectacular expansion in multiples – P/E4 , as
well as EV/Ebitda5 and EV/Sales6 , (see graphs 3 and 4) – seems to indicate that it is not the implicit growth forecasts for the next two years that warrant such valuations (this growth forecasts being implied from P/E differentials at one and two years). It does indeed seem that traditional phenomena are driving the trend, notably in the form of a lag in the adoption of certain preferences, linked, for example to the fact that many investors may have underestimated the impact of socially responsible investment (SRI) criteria, or even did not believe in them, and are
now rushing to buy green stocks to round out their portfolios now that the shift in this direction appears unlikely to reverse. Is it not true that those who are last to convert have often tend towards extremes? Generally speaking, this is why analyst recommendations are more cautious when it comes to green stocks than to other stocks included in the corresponding MSCI indices. Does this not suggest a bubble is developing? Or is it merely a catch-up effect? Thirty years of transition and as much investment.
Understanding the markets
0
100
200
300
400
500
US Green BasketDifference MSCI US
30/0
6/20
10
30/0
6/20
11
30/0
6/20
12
30/0
6/20
13
30/0
6/20
14
30/0
6/20
15
30/0
6/20
16
30/0
6/20
17
30/0
6/20
18
30/0
6/20
19
30/0
6/20
20Source : Bloomberg, Mirova
GRAPH 6 – US GREEN BASKET VS MSCI US
0
2
4
6
8
10
12
14
16
18
20
01/0
6/20
15
01/1
2/20
15
01/0
6/20
16
01/1
2/20
16
01/0
6/20
17
01/1
2/20
17
01/0
6/20
18
01/1
2/20
18
01/0
6/20
19
01/1
2/20
19
01/0
6/20
20
Global Green Basket
Source : Bloomberg, Mirova
GRAPH 8 – EV/EBITDA
0
50
100
150
200
250
300
350
400
Europe Green BasketDifference MSCI EU
30/0
6/20
10
30/0
6/20
11
30/0
6/20
12
30/0
6/20
13
30/0
6/20
14
30/0
6/20
15
30/0
6/20
16
30/0
6/20
17
30/0
6/20
18
30/0
6/20
19
30/0
6/20
20
Source : Bloomberg, Mirova
GRAPH 5 – EUROPE GREEN BASKET VS MSCI EUROPE
0
5
10
15
20
25
30
35
40
45
01/0
6/20
15
01/1
2/20
15
01/0
6/20
16
01/1
2/20
16
01/0
6/20
17
01/1
2/20
17
01/0
6/20
18
01/1
2/20
18
01/0
6/20
19
01/1
2/20
19
01/0
6/20
20
Global Green Basket MSCI World
Source : Bloomberg, Mirova
GRAPH 7 – P/E
9#05 –October 2020

Thirty years of transition and as much investment
7 Power Purchase Agreement
The over-representation of renewable energy themes (wind, solar, smart grids) and clean transportation, i.e. battery or fuel cell electric vehicles, which feature among the highest growing valuations in recent months is an indication that a long-term approach is gradually gaining traction. This phenomenon is also reflected in the uptrend seen for cyclical stocks, which theoretically have the highest break-even points: they are the stocks likely to benefit most from marginal increases in business. Such a long-term approach could become even more widespread if Mr. Biden takes Mr. Trump's place in the Oval Office. Indeed, Joe Biden’s spending plans, which focus on transforming the U.S. energy sector, would redirect capital flows in favor of green players. This is largely owing to the former Vice President’s ambition to achieve carbon neutral electricity in the U.S. by 2035, whereas at present, nearly two-thirds of electri-city is generated from fossil fuels. Renewable energy only accounts for 10% of capacity and nuclear, 27%, in the current energy mix in the U.S. In short, public, and private sector spending (see editorial) allocated to these challenges will end up automatically spilling over into a number of listed companies,
and, in turn, will be reflected in their market capitalization. Here, we present a few figures to illustrate the extent of the ongoing transition, particularly with regard to renewable energies and green hydrogen. The U.S. economy’s carbon-neutral objectives represent an investment growth driver in renewables and especially green hydrogen. The latter is the definitive solution to achieving carbon neutrality in transporta-tion, industry, and energy storage. Based on announcements made by several governments, the International Energy Agency (IEA) predicts that installed renewable energy generation capacity will triple by 2030, from 700 GW to 1,970 GW, excluding China. In the offshore wind market alone, installed capacity is expected to skyrocket, this time including China, to 1,000 GW by 2050 versus the current installed base of 30 GW, according to the International Renewable Energy Agency (IRENA). These numbers do not factor in the possibility of Mr. Biden entering the White House and implementing his program (see above). Biden’s plan would increase renewable energy six-fold, on a very conservative scenario based on no change in demand. The EU’s much talked about Green New Deal would play its part since it would triple onshore
wind power while increasing offshore wind power capacity fivefold by 2050. The EU initiative is also targeting no less than 80 GW of hydrogen electrolysis production capacity by 2030. At the same time, South Korea and Japan have already made progress in building their hydrogen infrastructure. The list is far from complete, though. Countries such as Australia and Saudi Arabia are also preparing large-scale investments in renewable energies. Others will undoubtedly follow suit, especially since lower installation costs have made these renewable energies much more attractive compared with fossil fuels. This explains the surge in demand for new contracts signed directly with companies (Corporate PPAs7). This type of agreement generally has a 10-year term and is concluded on a fixed-price basis. Based on these fundamentals, involving substantial investments over several decades, the current level of valuations immediately seems more logical. That said, there is still one major pitfall to be avoided: blindly investing in the upcoming transition’s free riders, as, inevitably, they will also be present.
Understanding the markets
Weeding out the free riders by applying asset management fundamentalsEconomic history has shown us that the current exuberance for the energy transition will attract players who will rush into business without offering sufficiently high-quality products or services, and do not belong in this market segment. The challenge for asset managers lies
in actively and rigorously reviewing a fund’s underlying investment. This involves distinguishing players whose business models are not viable from those who will harness the full potential of a more sustai-nable economy. For many years, Mirova's equity managers have
successfully analyzed each of the companies in which they invest client funds. Below is a summary of the scenarios followed for some shares added to the portfolio on two key themes: hydrogen and wind power.
10#05 –October 2020

Understanding the markets
Green hydrogen: Ceres Power and ITM
• Ceres Power boasts unrivalled technological expertise in fuel cells. Its steel cell can generate electricity either from natural gas or green hydrogen. Even when using natural gas, emissions are significantly lower than with an internal combustion engine. We believe Ceres’ technology will be important during the transition period to green hydrogen. Ceres Power has already established several partnerships in Asia, notably with Weichai, the world's third-largest truck manufacturer. The Chinese group has selected the British company to supply fuel cells as range extenders for its electric buses. It also has a collaboration and manufacturing partnership with the Korean company Doosan, the world's leading manufacturer of fuel cells. In Europe, Ceres Power has partnered with Bosch, targeting the stationary power generation market as an additional power source for data centers. Over the next decade, Ceres potential target market is expected to grow by 32% per year on average, from $4 billion to $60 billion in 2030. The current Ceres share price factors in 28% growth in sales over the period, representing 2% market share. Our best-case scenario predicts that the company will outperform market growth. Thanks to its unique technological capabilities and partner network, Ceres could achieve 45% growth for the decade. This would result in a target price of £18, i.e. upside potential of 250%. • ITM produces Proton Exchange Membrane (PEM) electrolysers producing green hydrogen from renewable energy and water. Hydrogen can be used for example to store surplus renewable energy or to de-carbonize industrial processes and mobility. As the penetration rate of renewables increases and the market for green hydrogen expands, it is reasonable to expect rapid growth in demand
8 Danish Krone
for electrolysers. As mentioned earlier, EU and several member states have issued ambitious targets for electrolyser capacity. ITM’s technology produces full capacity within a second. This makes it especially suitable for volatile renewable energies, such as offshore wind. The company is in the process of building the world's largest electrolyser plant with capacity of 1 GW. The plant starts ramping up at the end of the year and is expected to be operating at full capacity in two years. In 2022, the company will potentially start building up a second plant with higher capacity. ITM has partnerships with some of the leading players in the sector, industrial gas company Linde and gas pipeline company Snam. ITM's current share price of £2.6 is based on assumed installed electrolyser capacity of 80 GW in 2030 worldwide, bringing the group’s market share to 20%. This implicitly factors in annual sales growth of 94%. While the growth rates appear to be high, it is important to remember that PEM electrolysers are a new technology and ITMs current sales are very low. Bloomberg consensus estimate for year 2020 expects only £3.3 million of sales. To illustrate the potential upside, if green hydrogen becomes an important part of de-carbonizing strategy globally leading to a signi-ficant demand for electrolysers, we could easily see compound annual growth rate at 115% until 2030 and 10% thereafter to 2050. These assumptions would yield a target price of £10.6, i.e. an upside potential of 400%.
Wind power: Vestas and Siemens Gamesa• The share prices of Vestas and Siemens Gamesa are actually based on a scenario assuming additions of wind power generation capacity of 70 GW onshore and 17 GW offshore per year. This represents an annual growth rate
of 5.6% for Vestas and 6.8% for Siemens Gamesa out to 2030. In a “global green deal” scenario incorporating stable hydropower and nuclear power with fossil fuels being phased out in favor of renewable energies, annual additional wind capacity would increase to 100 GW and 32 GW by 2030 for onshore and offshore wind power respectively. Assuming stable market share and margins, this would drive Vestas' annual growth rate up to 9% and Siemens Gamesa's to 12%. This automa-tically reflects additional upside potential for these shares of 6% and 16% respectively. Factoring in increased electric transport and heating, the consumption scenario’s figures could more than double by the middle of the century. Moreover, by the end of the decade, the use of renewable energies is expected to increase fifteen-fold. Based on an assumed breakdown of electricity generation as follows: solar 40%, onshore wind 45%, and offshore wind 15%, target prices for Vestas and Siemens Gamesa could theoretically reach DKK 1,3008 (+34% on the current price) and €34 (+57% on the current price) respectively. It goes without saying that such basic calculations are theoretical. They do, however, offer real insight into the upside potential on these stocks if our scenario, which is far from utopian, does indeed materialize. Most publicly traded renewable energy developer-manager companies tend to communicate three-year, sometimes five-year, develop-ment plans that roughly run at expected pace despite the ongoing pandemic. This allows us to create scenarios focused on lengthier periods until 2030 or even 2040. We acknowledge our perception of competition, which the companies will have to overcome coupled with project complexity. As a result, only a few players will be in a position to bid for contracts, particularly in offshore wind energy. The contracts will run over twenty-year
The securities mentioned above are shown for illustrative purpose only, and should not be considered as a recommendation or a solicitation to buy or sell. 11#05 –October 2020
periods.Large-scale economic transitions require effort, which comes in the form of time and money. Paradoxically, in our opinion, the danger will not come from a disappointing outlook in building a sustainable economy. Rather, the danger will be caused by a classic phenomenon: the late arrival of unsustainable actors grappling for their share. There is no green bubble, nor is there a green miracle.
Quite simply, not all the economic actors who claim to participate in this transition will succeed. Even those who do meet success will not always be immune to exogenous geopolitical risks, for instance. In any event, at Mirova, we have taken the time to identify green stocks that outperform the markets. We are not the ones who will be surprised by the increased stock valuation that has set in these past six years.
Understanding the markets
The securities mentioned above are shown for illustrative purpose only, and should not be considered as a recommendation or a solicitation to buy or sell. 12#05 –October 2020

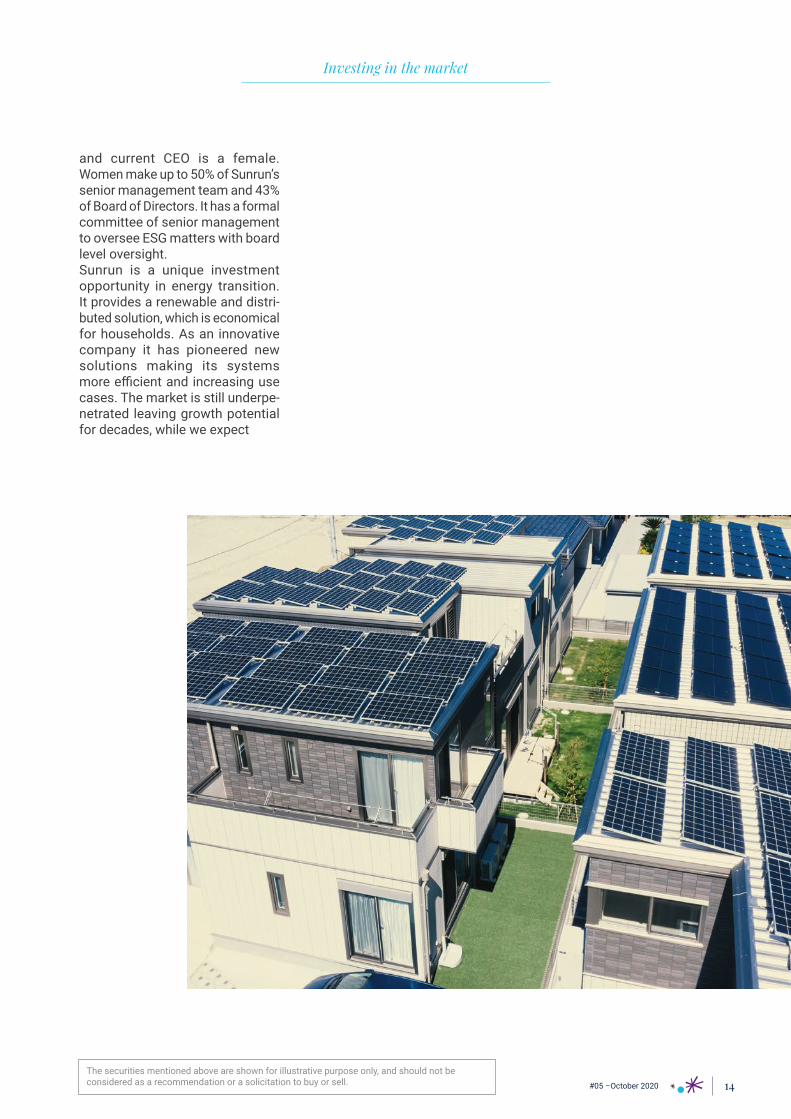
Sunrun, key player in de‑carbonization
Sunrun is the leading US residential rooftop solar and storage provider. While providing households a renewable energy alternative it can offer customers a 10-40% saving to average utility bills. Furthermore, its battery solution offers customers back-up power during power outages. Residential solar is also a cost-effective way to modernize infrastructure making it more envi-ronmental, resilient and affordable. The US market for rooftop solar is still very underpenetrated at only 3% penetration. California has introduced mandatory rooftop solar on all new homes from 2020 onwards and leads the nation with 13% penetration. Apart from regulation, growth in California has bees supported by optimal, sunny weather conditions and high utility power prices, which made rooftop solar competitive early on. Declining cost of solar modules and inverters have made the solutions economical in an increasing number of states, with rapidly increasing penetration in Texas, Arizona and New York. As temperatures have risen wildfires and storms have become more common in costal states. This has resulted in a significant increase in power outages further underpin-ning the case for combining solar with battery in storm hit areas such as Florida and Puerto Rico. During its 13-years history Sunrun has shown consistent growth and it expects to continue growing its customer base by over 10% annually. Value per customer is
expected to grow significantly faster as the adoption rate for batteries increases rapidly as elec-trification of households increases. Furthermore, as the customer base has increased Sunrun has introduced grid services, where residential areas are networked and excess renewable power is sold to the local utility. Sunrun is already deeply carbon negative. Its solar systems have prevented greenhouse gas emissions (GHG) totaling 5.2 metric tons of carbon dioxide equivalent. After operating for 10 months Sunrun’s solar energy system will have prevented as much GHG emissions as were emitted when producing and installing the system. The systems are expected to produce clean energy for 30 years or longer therefore preventing the release of harmful GHG for 97% of their lifetime. In July Sunrun announced the acquisition of the second largest residential solar provider Vivint Solar. The transaction will increase the customer base to 500 000 homes or 3 GW, creating a leading owner and operator of residential solar assets globally. The growing fleet will be networked to provide greater benefits to the grid and end energy consumers which will lead to the closure of an increasing number of inefficient carbon-produ-cing power plants. The company ranks well with other Environmental, Social and Governance (ESG) criteria as well. One of the two founding partners
Sunrun is a key player in de-carbonizing
electricity generation and enabling electrification
of the economy with the combination of solar,
storage and grid services provided to electricity
consumers.
Investing in the market
The securities mentioned above are shown for illustrative purpose only, and should not be considered as a recommendation or a solicitation to buy or sell. 13#05 –October 2020
Investing in the market
and current CEO is a female. Women make up to 50% of Sunrun’s senior management team and 43% of Board of Directors. It has a formal committee of senior management to oversee ESG matters with board level oversight. Sunrun is a unique investment opportunity in energy transition. It provides a renewable and distri-buted solution, which is economical for households. As an innovative company it has pioneered new solutions making its systems more efficient and increasing use cases. The market is still underpe-netrated leaving growth potential for decades, while we expect
The securities mentioned above are shown for illustrative purpose only, and should not be considered as a recommendation or a solicitation to buy or sell. 14#05 –October 2020
Investing in the market
The main opportunities for green hydrogen are: 1. De-carbonizing industrial processes such as refining, cement, steel and chemicals manufacturing, by subs-tituting the use of grey (coal based) or blue (natural gas based) hydrogen or by been used as a feedstock, for example replacing coke in steel production. 2. Reducing emissions in residential and commercial heating systems by mixing green hydrogen with natural gas. Up to 20% of natural gas is likely to be feasible in current gas networks. 3. Renewable energy storage. Hydrogen can be produced with electrolysis from surplus renewable energy. If can then be used directly if there is a need for energy or it can be stored. Hydrogen can play a signifi-cant role in making renewable energy grid ready. 4. Powering fuel-cell vehicles, namely heavy duty transport, trucks and buses. Green hydrogen is widely seen as the best way to de-carbonize heavy duty transportation due to fast fueling and ability to carry heavy loads. Vehicles with a certain route will be most suitable as they require a simple tanking station structure. In the last six months green hydrogen has become a major part of European de-carbonizing plans. European commission’s objective is to install at least 6 GW of renewable hydrogen electrolysers by 2024. Germany and France have announced plans to invest €9 billion and €7 billion to ramp-up hydrogen technologies and to produce carbon free hydrogen. UK plans to use £12 billion to on
producing hydrogen from offshore wind. Outside of Europe California, Japan, Korea and China already have advanced programs for using green hydrogen in various applications. In January ITM Power announced a joint venture with the industrial gases company Linde in order to deliver green hydrogen to large scale industrial projects with an elec-trolyser capacity of 10 MW or more. Therefore, ITM power is currently building world’s largest electrolyser plant in Sheffield, to be able to offer low cost, high volume manufacturing, assembly and testing. The facility is expected to start ramp-up at the end of 2020. Mirova has been invested in ITM power since the launch of the Global Environmental strategy. Green hydrogen will be an important part of de-carbonization and Mirova Environmental strategies are invested in different parts of the value chain, from producers of cheap renewable energy, to technology companies producing electrolysers and fuel cells and finally industrial gases companies.
ITM Power, Leading position in the fuel cells
for hydrogen generation
ITM power is one of the leading companies
designing and manufacturing fuel cells
which generate hydrogen gas based on Proton Exchange Membrane
(PEM) technology. The technology uses
renewable electricity and water to generate carbon
free green hydrogen, hence burning it generates
no carbon emissions.
The securities mentioned above are shown for illustrative purpose only, and should not be considered as a recommendation or a solicitation to buy or sell. 15#05 –October 2020
First, they illustrate that green bonds have convinced some German decision-makers (at times, seemingly reluctant) of their usefulness. Second and in doing so, green bonds have continued their careful development, now creating their very own market. This is a stark contrast from the exotic niche that they still represented in the eyes of some observers a short while ago.
Grünen Bund über alles9
The German government has finally issued a green bond. The bond amounts to €6.5 billion and has a ten-year maturity. Investors expected and welcomed it. They queued up for €33 billion. Unsurprisingly, the bond’s returns were negative, as are those offered by the bund and the conventional issue announced that very same day. Admittedly, this is not the first green bond issued by an EU member state. Nevertheless, in light of the conventional bund’s benchmark
risk-free rate status, this first green bond issue marks a further step to an acceptance of green bonds as a preferred, standardized instrument to finance the ecological transition, available to all players who want to take part, countries included. It is basically official, then: green bonds no longer represent a sub-segment of the financial markets. They are a credible alternative with their own modus operandi. But Germany won’t stop there. The country has already made its ambition to issue additional green bonds clear. What’s in it for the German government? Germany’s 2050 carbon-neutral strategy relies heavily on reducing greenhouse gas emissions by 80-95%. This will also involve phasing out coal from the national energy mix by 2038 or perhaps even slightly earlier. The country’s “Climate Action Plan 2050” is extensive in scope. It includes the following: • transport: promoting more eco-friendly mobility practices, particularly by developing the
Germany launches Green Bonds!
In September, three of the best renowned bond
market players — the German government,
Daimler and Volkswagen — issued their first
green bonds, together amounting to nearly €10
billion. Amounts aside, this marks a new milestone in the development of green
bonds.
Issuer German government Daimler AG Volkswagen International Finance NV
Size €6 500 000 000 €1 000 000 000 €1 250 000 000 €750 000 000
Coupon 0 % 0,75 % 0,875 % 1,25 %
Maturity August 15, 2030 Sept 10, 2030 Sept 22, 2028 Sept 23, 2032
Rating (Moody’s/ S&P) Aaa st/ AAA st A3 neg/ BBB+ neg A3 neg/ BBB+ neg
FIG.9 GREEN BONDS FROM GERMAN ISSUERS: MAIN CHARACTERISTICS
Source : Bloomberg, Volkswagen, Daimler, Volvo Cars and Mirova
Investing in the market
9 Green bonds above all
The securities mentioned above are shown for illustrative purpose only, and should not be considered as a recommendation or a solicitation to buy or sell. 16#05 –October 2020
infrastructure needed to expand rail freight as well as bicycle paths; • agriculture, forests, biodiversity: adapting forests to climate change and developing organic farming, among other initiatives; • industry and energy: extending the use of renewable energies and connecting them to their users, whether in industry or services; • international cooperation: helping emerging countries to adopt an energy transition through technical cooperation and financing; • research and innovation: creating the regulatory framework to design renewable energy storage solutions. The fact that the Plan covers such a range of issues and goals clearly illustrates that the German green bond is not designed as a mere communications tool. If this were the case, the use of funds limited to one or two objectives would have been more than sufficient. The Plan focuses on a broad spectrum of financing needs. Further exami-nation of Berlin’s intended use of green bonds will lead those who still thought that green bonds were a gimmick to revise their judgment. Germany's conversion to green bonds seems all the more relevant given that in addition to being in the interest of authorities, this move is also in the interest of the powerful German automotive industry, which in a way could be considered a deep state.
The deep state follows the stateDaimler paved the way for liquid unsecured green bonds in the automotive industry. In early September, the automotive giant issued a €1 billion bond maturing in 2030. Volkswagen then joined the
party, issuing two green bonds that amounted to a combined €2 billion, with respective maturities in 2028 and 2032. It's important to realize that not so long-ago vehicle car manufac-turers faced a far more daunting prospect as regards developing a solid and coherent green bond framework. The fact that both automotive giants from Stuttgart and Wolfsburg successfully met the challenge is far from anecdotal. This is especially the case when you consider their respective ongoing issues. Their decision to use green bonds is driven by their compelling need to electrify their vehicles’ power trains. This is all the more important considering their positions in the Chinese market where electric power has become an absolute necessity. The move also comes at a time when both manufacturers need to reduce the average emissions of their respective ranges in order to meet the European Commission's requirements. As their product mix includes a number of premium, high-vo-lume vehicles, the decision is a logical one. Green bonds will drive forward the transition of two automotive powerhouses whose reputation is built on powerful combustion engines. Against this backdrop, Daimler and Volkswagen must develop electric engine platforms and batteries. They must also conduct a comprehensive review of their production and supply systems, adapting them to an assembly of vehicles with far fewer parts than cars with internal combustion engines. Last but not least, they will need to develop solutions and networks for recharging and
even recycling batteries. Daimler has confirmed it is preparing for this recharging/recycling phase. Overall, the green bonds for both manufacturers more or less include the above objectives. Daimler goes a step further with a focus on its plants’ energy efficiency via the use of more wind or solar power combined with better industrial waste management processes. In any case, as with the present and future green bonds of the German government, Daimler and Volkswagen's green bonds demons-trate the extent to which the use of these instruments can make it possible to achieve clearly defined fundraising objectives dedicated to reducing or influencing the impact that economic players have on our environment. Though not one of the first to jump on the public and private green bonds bandwagon unlike a lot of players form the Netherlands, France, Italy and Spain, Germany has shown resolute commitment. Subsequently, the country is effectively setting an example for all players for follow, including investors and issuers, who remained cautious.
The securities mentioned above are shown for illustrative purpose only, and should not be considered as a recommendation or a solicitation to buy or sell.
Investing in the market
17#05 –October 2020

Looking forward: a reinvented sustainable finance strategy for Europe
Engagement
In the context of the coronavirus crisis, the European Commission continues its commitment to support the European economy in its green and low-carbon transition. Sustainable finance firmly remains one of the Commission’s top priorities. Ursula Von Der Leyen’s Commission is to announce a new sustainable finance strategy at year-end. This follows an initial action plan rolled out in May 2018, which included a number of initia-tives, three of which were regulatory. It is of paramount importance since it will provide vital links between the financial sector and European investment plans, whether through the Green New Deal announced in December 2019 or the sweeping Next Generation EU recovery plan
announced in May 2020, with its confirmed green focus. This draft strategy was the subject of a public consultation over the summer. The questions posed to stakeholders hinted at the Commission’s planned possible developments. In particular, the following ideas have been identified: a European corporate ESG and climate database, a “brown” or “significant negative impact” taxonomy (i.e. a potential list of environmentally harmful activities or practices that would supplement the green taxonomy currently being developed), a best-in-class label for ESG funds and a review of “green supporting factors” to authorize lighter capital provisions for green loans. The sustainable finance
strategy should also incorporate strengthened focus on society, social issues, and biodiversity. As part of its commitment as a responsible investor, Mirova regularly responds to requests and consultations from regulators to improve the regulatory framework for more sustainable finance. This positive contribution, within and with Natixis and BPCE, was recently observed by the NGO, InfluenceMap in a report analyzing the engagement strategies of financial actors in Brussels. Mirova's contribution to the consul-tation is fully and readily available on the European Commission's website along with all public responses.
18#05 – October 2020

BIODIVERSITY: WHAT GETS MEASURED GETS MANAGED
Faced with the ongoing loss of biodiversity, the international community is pulling together more and more to promote regu-lations with a view to reversing the trend. The private sector is also gradually becoming aware of its responsibility and is seeking to take action on this issue. With this in mind, in January 2020, Mirova joined forces with AXA Investment Managers, BNP Paribas Asset Management and Sycomore Asset Management to launch a call for expressions of interest (CEI) to more effectively measure the impact of listed
companies on biodiversity. The call helped to mobilize support for these issues. The call also resulted in the drafting of an Investor Statement signed by thirty investors representing €6 trillion in assets under management. Fourteen bids were submitted to the Call for Expression of Interest, from a range of industries including sustainable development rating agencies, consulting firms, and academia. The process, which was completed in September, selected Iceberg Data Lab and I Care & Consult. The selection decision marks a
further milestone in the creation of a tool to measure biodi-versity impact. By end-2021, the partnership should deliver on the initial positive and negative impact metrics of our investment on biodiversity, covering the entire life cycle. Much like the work undertaken for the past several years on carbon emissions, the rollout of a biodiversity impact tool will help to finetune our management decisions while also mobilizing our clients. Above all, it will be instrumental in changing practices used by our client companies and projects.
Engagement
Mirova’s CEO, Philippe Zaouati, also spoke about the Group’s stance on the future European strategy. According to him, Delving deeper than the initial announcements, the new EU strategy for sustainable finance should go further, involving all financial players, with banks at the top of the list. The strategy should also tackle the way tradi-tional financial markets operate. On top of this, the repurposed plan should ensure that investment flows properly reflect investors' sustainability preferences. Click here for an in-depth analysis. Crucial as they are, though, these future developments should not make us forget the importance of the work still underway as part of the European Commission's current action plan. A key challenge for the distribution of responsible investment products will center around the interpretation of the delegated acts related to MiFID10. The overall goal will be to take into account individual investor sustai-nability preferences. In this respect, the definition of standards and labels remains an indispensable tool that should be developed at
the EU level. This is because it enables savers, and ideally insti-tutional investors, to quickly and confidently select the best-value financial products most likely to help finance and encourage the transition. In this regard, our experience as an investor and our commitment to sustainable development lead us to be doubly vigilant about the proposed European eco-label for green investment funds. Defining the part of a fund that must be green (and EU taxonomy compliant) to qualify for a label is both a technical and philosophical issue. A high level of “green share” has a crucial dual purpose. It sends a real signal to companies and adds to the ecolabel’s investor credibility. In addition, the label must be supported by a well-es-tablished exclusion policy and complete transparency. This is to ensure that no investor feels “misled about the merchandise.” Further, to ensure a real green fund sustainability impact, these requi-rements come with the additional need to ecolabel a significant level of assets under management at
the European level, particularly for equity funds. To guarantee its development, the ecolabel must therefore have strong yet balanced and realistic ambitions. The label’s specifications should also include a proposal for monitoring continuous improvement of its green compo-sitionin the years to come. Our conviction is that these criteria are indispensable for the ecolabel to become a useful tool for investors and the transition alike, pushing the market to transition at both the investor and issuer levels.
10 Markets in Financial Instruments Directive
19#05 – October 2020

Measuring impact
Impact mapping to the SDGsShare of positive/commited contributors*
Corresponding SDGs
ENV
IRO
NM
ENT
CLIMATE STABILITYLimit GHG levels to stabilize global temperature rise under 2°C
55% 33%
HEALTHY ECO-SYSTEMSMaintain ecologically sound landscapes and seas for nature and people
49% 25%
RESOURCE SECURITYPreserve stocks of natural resources through efficient and circular use
37% 16%
SOC
IAL
BASIC NEEDSBasic services (Food, water, energy, shelter,health, etc.) for all
18% 18%
WELL BEINGEnhanced health, education, justice and equality of opportunity for all
47% 30%
DECENT WORKSecure, socially inclusive jobs and working conditions for all
26% 20%
Key impact indicators
5% 18% +1.5°C +3.5°C 2%15%
Coverage rate for strategy: 97% Coverage rate for the index: 98%
Coverage rate for strategy: 98% Coverage rate for the index: 99%
Coverage rate for strategy: 100% Coverage rate for the index: 100%
Strategy Strategy Strategy
IndexIndexIndex
vs.vs. vs.
gender portraitEmploi
Impact on the achievement of the (SDGs)
Coverage rate for strategy: 96% Coverage rate for the index: 100% Source: Mirova
Source: Mirova, from company reportsSource: MirovaSource: Carbone4/Mirova
Source: Mirova
Strategy
Index
89%52%
EXPOSURE TO POSITIVE/COMMITTED IMPACT ON SDGS
% OF ASSETS*
vs.
0% 20% 40% 60% 80% 100%
*Sum of strategy/index holdings with Positive or Committed opinion
Mirova Consolidated Equity30/09/2020 – Index: MSCI Europe
Commited Positive Neutral Risk NegativeImpact:
GENDER EQUALITY EMPLOYMENTCLIMATE CHANGE
Average yearly change in workforce (2016-2019)
Women in executive committeesClimate change trajectory
*Cash and cash equivalent excluded
#05 –October 2020 20

Impact mapping to the SDGs
Share of positive contributors* Corresponding SDGs
ENV
IRO
NM
ENT
CLIMATE STABILITYLimit GHG levels to stabilize global temperature rise under 2°C
74%
HEALTHY ECO-SYSTEMSMaintain ecologically sound landscapes and seas for nature and people
48%
RESOURCE SECURITYPreserve stocks of natural resources through efficient and circular use
40%
SOC
IAL
BASIC NEEDSBasic services (Food, water, energy, shelter, health, etc.) for all
11%
WELL BEINGEnhanced health, education, justice and equality of opportunity for all
17%
DECENT WORKSecure, socially inclusive jobs and working conditions for all
10%
Mirova Consolidated Fixed Income
81%39%
vs.
0% 20% 40% 60% 80% 100%
30/09/2020 – Index: Barclays Euro Aggregate Corporate
Key impact indicators
Climate change trajectory
+1.5°C +4°C
Coverage rate for strategy: 76% Coverage rate for the index: 88%
Strategy
Index
SUSTAINABILITY BONDSCLIMATE CHANGE
vs. Corporates – non financials –
22%
Corporates – financials –
9%
Sovereigns 6%
Sustainability bonds 63%
12% Energy efficiency2% Sustainable waste &
water management
0% Affordable housing2% Other social14% Diversified
20% Renewable energy
11% Clean transportation
Source: Mirova
Source: MirovaSource: Carbone4/Mirova
Source: Mirova
This information relates to all the fixed income funds managed by Mirova
Impact on the achievement of the (SDGs) EXPOSURE TO POSITIVE/COMMITED
IMPACT TO SDGS% OF ASSETS*
Coverage rate for strategy 96% Coverage rate for the index: 100%
Strategy
Index
* Cash and cash equivalent excluded
Commited Positive Neutral Risk NegativeImpact:
2% Other environmental
Measuring impact
*Sum of strategy/index holdings with Positive or Committed opinion
#05 –October 2020 21
MIROVAFrench Public Limited liability company with board of Directors
Regulated by AMF under n°GP 02-014 RCS Paris n°394 648 216
Registered Office: 59, Avenue Pierre Mendes France – 75013 – Paris Mirova is an affiliate of Natixis Investment Managers.
NATIXIS INVESTMENT MANAGERSFrench Public Limited liability company
RCS Paris n°453 952 681 Registered Office: 43, Avenue Pierre Mendes France – 75013 – Paris
Natixis Investment Managers is a subsidiary of Natixis.
MIROVA U.S., LLC888 Boylston Street, Boston, MA 02199; Tel: 212-632-2803
Mirova U.S, LLC (Mirova US) is a U.S. - based investment advisor that is wholly owned by Mirova. Mirova is operated in the U.S. through Mirova US. Mirova US and Mirova entered into an agreement whereby Mirova provides Mirova US investment and research expertise, which Mirova US then combines with its
own expertise, and services when providing advice to clients.
LEGAL INFORMATIONThis document does not constitute or form part of any offer for sale or solicitation of any offer to buy or subscribe for any securities nor shall it or any part of it form the basis or be relied on in connection with, or act as any inducement to enter into, any contract or commitment whatsoever. The products or services do not take into account the investment objectives, financial situation or specific needs of the recipient. Mirova cannot be held liable for financial losses or any decision taken on the basis of the information contained in this document and does not provide any advice, in particular with regard to investment services. In any event, it is up to you to consult the fund’s regulations and to obtain internal and external opinions that you consider necessary or desirable, including from lawyers, tax experts, accountants, financial advisors, or any other specialists, to verify, in particular, the adequacy of the investment presented to you for your objectives and constraints and to carry out an independent evaluation of this investment in order to assess its merits and risk factors. This document is non-contractual and for information purposes only. It is strictly confidential and the information it contains is the property of Mirova. It cannot be transmitted to anyone without Mirova’s prior written consent. Similarly, any reproduction, even partial, is prohibited without Mirova’s prior written consent. Distribution, possession or delivery of this document in or from certain jurisdictions may be restricted or prohibited by law. Anyone receiving this document is asked to check for and comply with any such limitations or prohibitions. The information contained in this document is based on current circumstances, intentions and directions and may be subject to change. Mirova bears no responsibility for the descriptions and summaries contained in this document. Mirova does not undertake in any way to guarantee the validity, accuracy, permanence or completeness of the information mentioned or induced in this document or any other information provided in connection with the Fund. Mirova therefore assumes no responsibility for any information, in whatever form, contained, mentioned or induced, in this document or in the event of any omissions. All financial information, particularly on prices, margins or profitability, is indicative and may change at any time, particularly in the light of market conditions. Mirova may change or remove this information at any time without notice. More generally, Mirova, its parent companies, subsidiaries, reference shareholders, the funds it manages and their respective directors, officers, partners, agents, representatives, employees or advisors disclaim any liability towards the readers of this document or their advisors regarding the characteristics of this information. Moreover, this document shall in no way imply any implicit obligation on any party to update the information contained therein.
R.C
.S 4
22 2
33 6
50 -
PH
OTO
CRE
DIT
S: M
IRO
VA, A
DO
BEST
OC
K –
DRA
WIN
GS:
FX
CH
ENEV
AT
October 2020 Finalized October 14, 2020
Contributors:
David Belloc ................................................................................................................................................................................. Cross Asset Portfolio Manager Hélène Champollion-Morel .................................................................................................................................................................... Head of Communication Laurène Chenevat ................................................................................................................................................................... SRI Analyst and Advocacy Officer Mathilde Dufour ............................................................................................................................................................................. Deputy Head of Sustainability Emmanuel Gautier ............................................................................................................................................................ Portfolio Manager - Impact Investing Thomas Giroux ................................................................................................................................................................................................. Financial Engineer Hervé Guez .......................................................................................................................................................................................... CIO Equity & Fixed Income Bertrand Rocher ............................................................................................................................................ Fixed Income Portfolio and Senior Credit Analyst Ladislas Smia ............................................................................................................................................................................................. Head of Sustainability Christine Tricaud .............................................................................................................................................................................................. Portfolio Manager Anna Vaananen ..................................................................................................................................................................................... Senior Portfolio Manager
ADDITIONAL NOTESThis material has been provided for information purposes only to investment service providers or other Professional or non-professional Clients, Qualified or Institutional Investors and, when required by local regulation, only at their written request.
In the E.U. (outside of the UK and France): Provided by Natixis Investment Managers S.A. or one of its branch offices listed below. Natixis Investment Managers S.A. is a Luxembourg management company that is authorized by the Commission de Surveillance du Secteur Financier and is incorporated under Luxembourg laws and registered under n. B 115843. Registered office of Natixis Investment Managers S.A.: 2, rue Jean Monnet, L-2180 Luxembourg, Grand Duchy of Luxembourg. Italy: Natixis Investment Managers S.A., Succursale Italiana (Bank of Italy Register of Italian Asset Management Companies no 23458.3). Registered office: Via San Clemente 1, 20122 Milan, Italy. Germany: Natixis Investment Managers S.A., Zweigniederlassung Deutschland (Registration number: HRB 88541). Registered office: Im Trutz Frankfurt 55, Westend Carrée, 7. Floor, Frankfurt am Main 60322, Germany. Netherlands: Natixis Investment Managers, Nederlands (Registration number 50774670). Registered office: Stadsplateau 7, 3521AZ Utrecht, the Netherlands. Sweden: Natixis Investment Managers, Nordics Filial (Registration number 516405-9601 - Swedish Companies Registration Office). Registered office: Kungsgatan 48 5tr, Stockholm 111 35, Sweden. Spain: Natixis Investment Managers, Sucursal en España. Serrano n°90, 6th Floor, 28006, Madrid, Spain. Belgium: Natixis Investment Managers S.A., Belgian Branch, Louizalaan 120 Avenue Louise, 1000 Brussel/Bruxelles, Belgium.
In France: Provided by Natixis Investment Managers International – a portfolio management company authorized by the Autorité des Marchés Financiers (French Financial Markets Authority - AMF) under no. GP 90-009, and a public limited company (société anonyme) registered in the Paris Trade and Companies Register under no. 329 450 738. Registered office: 43 avenue Pierre Mendès France, 75013 Paris.
In Switzerland: Provided for information purposes only by Natixis Investment Managers, Switzerland Sàrl, Rue du Vieux Collège 10, 1204 Geneva, Switzerland or its representative office in Zurich, Schweizergasse 6, 8001 Zürich.
In the British Isles: Provided by Natixis Investment Managers UK Limited which is authorised and regulated by the UK Financial Conduct Authority (register no. 190258) - registered office: Natixis Investment Managers UK Limited, One Carter Lane, London, EC4V 5ER. When permitted, the distribution of this material is intended to be made to persons as described as follows: in the United Kingdom: this material is intended to be communicated to and/or directed at investment professionals and professional investors only; in Ireland: this material is intended to be communicated to and/or directed at professional investors only; in Guernsey: this material is intended to be communicated to and/or directed at only financial services providers which hold a license from the Guernsey Financial Services Commission; in Jersey: this material is intended to be communicated to and/or directed at professional investors only; in the Isle of Man: this material is intended to be communicated to and/or directed at only financial services providers which hold a license from the Isle of Man Financial Services Authority or insurers authorised under section 8 of the Insurance Act 2008.
In the DIFC: Provided in and from the DIFC financial district by Natixis Investment Managers Middle East (DIFC Branch) which is regulated by the DFSA. Related financial products or services are only available to persons who have sufficient financial experience and understanding to participate in financial markets within the DIFC, and qualify as Professional Clients or Market Counterparties as defined by the DFSA. No other Person should act upon this material. Registered office: Office 23, Level 15, The Gate Building, East Wing, DIFC, PO Box 506752, Dubai, United Arab Emirates.
In Japan: Provided by Natixis Investment Managers Japan Co., Ltd., Registration No.: Director-General of the Kanto Local Financial Bureau (kinsho) No. 425. Content of Business: The Company conducts discretionary asset management business and investment advisory and agency business as a Financial Instruments Business Operator. Registered address: 1-4-5, Roppongi, Minato-ku, Tokyo.
In Taiwan: Provided by Natixis Investment Managers Securities Investment Consulting (Taipei) Co., Ltd., a Securities Investment Consulting Enterprise regulated by the Financial Supervisory Commission of the R.O.C. Registered address: 34F., No. 68, Sec. 5, Zhongxiao East Road, Xinyi Dist., Taipei City 11065, Taiwan (R.O.C.), license number 2018 FSC SICE No. 024, Tel. +886 2 8789 2788.
In Singapore: Provided by Natixis Investment Managers Singapore (name registration no. 53102724D) to distributors and institutional investors for informational purposes only. Natixis Investment Managers Singapore is a division of Ostrum Asset Management Asia Limited (company registration no. 199801044D). Registered address of Natixis Investment Managers Singapore: 5 Shenton Way, #22-05 UIC Building, Singapore 068808. In Hong Kong: Provided by Natixis Investment Managers Hong Kong Limited to institutional/ corporate professional investors only. In Australia: Provided by Natixis Investment Managers Australia Pty Limited (ABN 60 088 786 289) (AFSL No. 246830) and is intended for the general information of financial advisers and wholesale clients only .
In New Zealand: This document is intended for the general information of New Zealand wholesale investors only and does not constitute financial advice. This is not a regulated offer for the purposes of the Financial Markets Conduct Act 2013 (FMCA) and is only available to New Zealand investors who have certified that they meet the requirements in the FMCA for wholesale investors. Natixis Investment Managers Australia Pty Limited is not a registered financial service provider in New Zealand.
In Latin America: Provided by Natixis Investment Managers S.A.
In Uruguay: Provided by Natixis Investment Managers Uruguay S.A., a duly registered investment advisor, authorised and supervised by the Central Bank of Uruguay. Office: San Lucar 1491, Montevideo, Uruguay, CP 11500. The sale or offer of any units of a fund qualifies as a private placement pursuant to section 2 of Uruguayan law 18,627.
In Colombia: Provided by Natixis Investment Managers S.A. Oficina de Representación (Colombia) to professional clients for informational purposes only as permitted under Decree 2555 of 2010. Any products, services or investments referred to herein are rendered exclusively outside of Colombia. This material does not constitute a public offering in Colombia and is addressed to less than 100 specifically identified investors.
In Mexico: Provided by Natixis IM Mexico, S. de R.L. de C.V., which is not a regulated financial entity, securities intermediary, or an investment manager in terms of the Mexican Securities Market Law (Ley del Mercado de Valores) and is not registered with the Comisión Nacional Bancaria y de Valores (CNBV) or any other Mexican authority. Any products, services or investments referred to herein that require authorization or license are rendered exclusively outside of Mexico. While shares of certain ETFs may be listed in the Sistema Internacional de Cotizaciones (SIC), such listing does not represent a public offering of securities in Mexico, and therefore the accuracy of this information has not been confirmed by the CNBV. Natixis Investment Managers is an entity organized under the laws of France and is not authorized by or registered with the CNBV or any other Mexican authority. Any reference contained herein to “Investment Managers” is made to Natixis Investment Managers and/or any of its investment management subsidiaries, which are also not authorized by or registered with the CNBV or any other Mexican authority.
The above referenced entities are business development units of Natixis Investment Managers, the holding company of a diverse line-up of specialised investment management and distribution entities worldwide. The investment management subsidiaries of Natixis Investment Managers conduct any regulated activities only in and from the jurisdictions in which they are licensed or authorized. Their services and the products they manage are not available to all investors in all jurisdictions. It is the responsibility of each investment service provider to ensure that the offering or sale of fund shares or third party investment services to its clients complies with the relevant national law.
The provision of this material and/or reference to specific securities, sectors, or markets within this material does not constitute investment advice, or a recommendation or an offer to buy or to sell any security, or an offer of any regulated financial activity. Investors should consider the investment objectives, risks and expenses of any investment carefully before investing. The analyses, opinions, and certain of the investment themes and processes referenced herein represent the views of the portfolio manager(s) as of the date indicated. These, as well as the portfolio holdings and characteristics shown, are subject to change. There can be no assurance that developments will transpire as may be forecasted in this material. Past performance information presented is not indicative of future performance.
Although Natixis Investment Managers believes the information provided in this material to be reliable, including that from third party sources, it does not guarantee the accuracy, adequacy, or completeness of such information. This material may not be distributed, published, or reproduced, in whole or in part.
All amounts shown are expressed in USD unless otherwise indicated.
23#05 –October 2020