Embed Size (px)
Citation preview
Quality Management – Prof. Schmitt Exercise 04
Quality and Economics E 04 page 0
© WZL/IPT
© WZL/Fraunhofer IPT
Exercise Quality Management
04 Quality and Economics
Dipl.-Ök. Anne Willach
Dipl.-Ök. Anne WillachGroup Perceived Quality & Product Value ManagementDepartment Quality Management
Chair of Metrology and Quality Management
Werkzeugmaschinenlabor WZL der RWTH Aachen UniversitySteinbachstraße 19, D-52074 Aachen, URL: http://www.wzl.rwth-aachen.deTel.: +49 (241) 80-27474, Fax: +49 (241) 80-22193
Quality Management – Prof. Schmitt Exercise 04
Quality and Economics E 04 page 1
© WZL/IPT
Page 1© WZL/Fraunhofer IPT
Contents
� Task 1: Quality-based costs
Task 2: Analysis and provision of quality and cost information
Task 3: Target Costing
Quality Management – Prof. Schmitt Exercise 04
Quality and Economics E 04 page 2
© WZL/IPT
Page 2© WZL/Fraunhofer IPT
Task 1Problem
� Quality and economic efficiency
The objective of this exercise is to point out different aspects of lecture four on the basis of case studies.
� Quality-based costs
As an employee in the department of Quality Management you are responsible for monitoring quality. Beside purely technical issues, it is your responsibility to consider economic issues. To be specific, it is your task to provide information for management on the basis of the data and indicators made available to you by various departments, to set appropriate quality cost targets, to document any deviation from these targets and to initiate appropriate measures.
Quality Management – Prof. Schmitt Exercise 04
Quality and Economics E 04 page 3
© WZL/IPT
Page 3© WZL/Fraunhofer IPT
Task 1 Data and Information
The data and information which has been made available to you by the sales, manufacturing, assembly and quality assurance departments are presented below.
General Information:
– The average value of scrap is 1,200.00 €.
� Sales:
– In the month of May all products delivered in February were re-called and a component had to be replaced. The cost incurred by this action was 120.00 € per product.
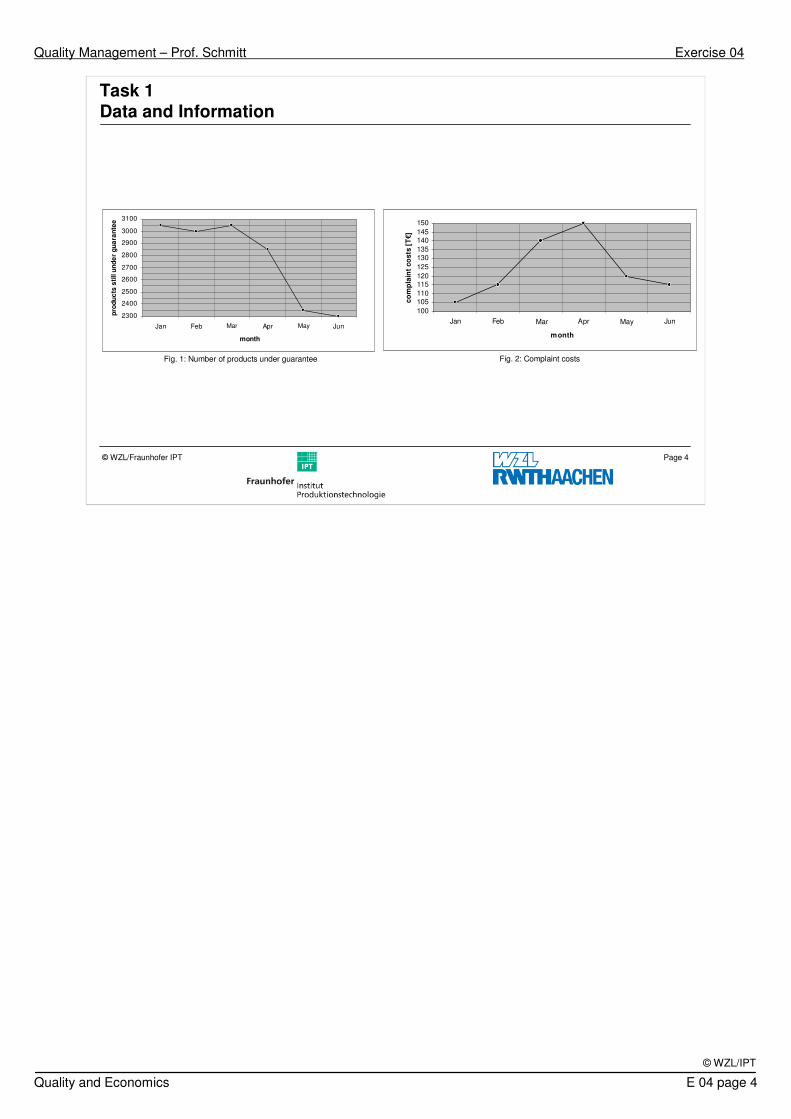
– You have also been given a copy of the following diagrams:
Quality Management – Prof. Schmitt Exercise 04
Quality and Economics E 04 page 4
© WZL/IPT
Page 4© WZL/Fraunhofer IPT
2300
2400
2500
2600
2700
2800
2900
3000
3100
Jan Feb Mrz Apr Mai Jun
month
pro
du
cts
sti
ll u
nd
er
gu
ara
nte
e
100105110115120125130135140145150
Jan Feb Mrz Apr Mai Jun
month
co
mp
lain
t co
sts
[T
€]
Fig. 1: Number of products under guarantee Fig. 2: Complaint costs
Task 1 Data and Information
Mar MayMar May
Quality Management – Prof. Schmitt Exercise 04
Quality and Economics E 04 page 5
© WZL/IPT
Page 5© WZL/Fraunhofer IPT
Task 1 Data and Information
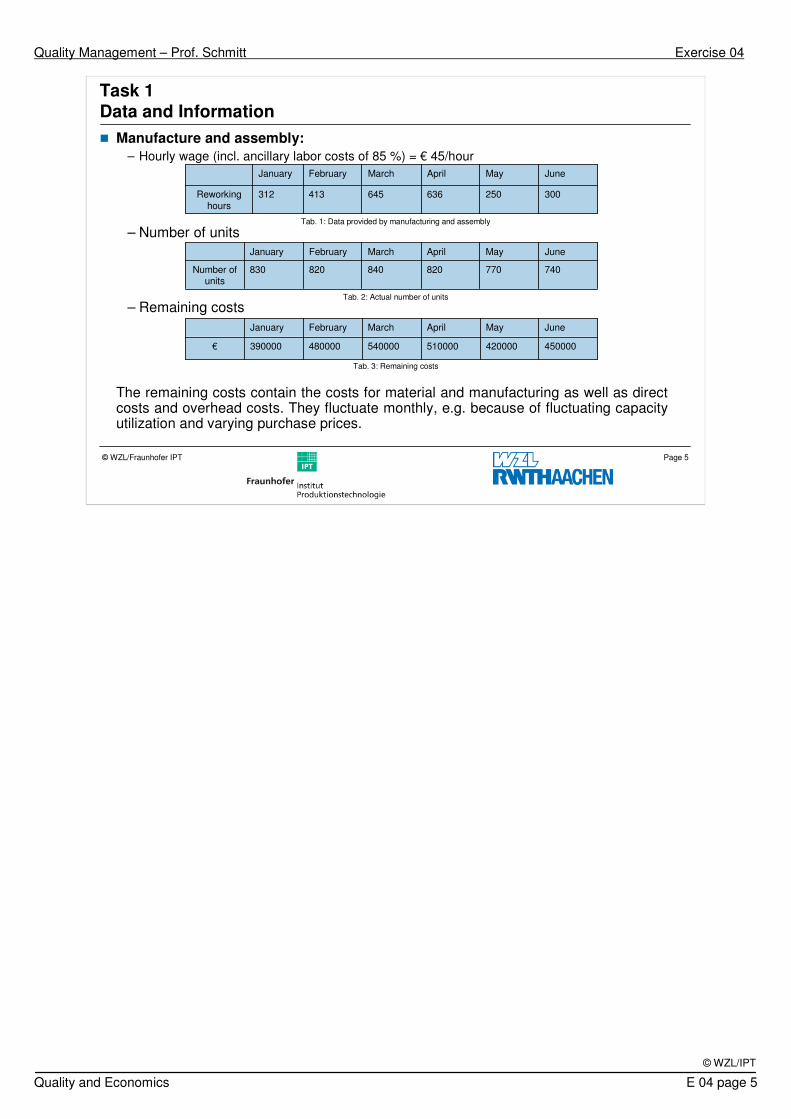
� Manufacture and assembly:
– Hourly wage (incl. ancillary labor costs of 85 %) = € 45/hour
– Number of units
– Remaining costs
The remaining costs contain the costs for material and manufacturing as well as direct costs and overhead costs. They fluctuate monthly, e.g. because of fluctuating capacity utilization and varying purchase prices.
300250636645413312Reworkinghours
JuneMayAprilMarchFebruaryJanuary
740770820840820830Number ofunits
JuneMayAprilMarchFebruaryJanuary
450000420000510000540000480000390000€
JuneMayAprilMarchFebruaryJanuary
Tab. 1: Data provided by manufacturing and assembly
Tab. 2: Actual number of units
Tab. 3: Remaining costs
Quality Management – Prof. Schmitt Exercise 04
Quality and Economics E 04 page 6
© WZL/IPT
Page 6© WZL/Fraunhofer IPT
Task 1 Data and Information
� Quality assurance:
– In March and April, 100 %-tests due to considerable shortcomings in quality were carried out. The test costs incurred amount to 40.00 € per product. Every month, random-tests took place. The costs incurred by this measure amount to 25.00 € per product.
– A quality audit is performed 2 times per year. It is anchored in the Quality Policy and its objective is to ensure continuous improvement of products and processes. The Quality Audit is scheduled to take place in January and May. The estimated costs are 80,000.00 € for each audit.
Quality Management – Prof. Schmitt Exercise 04
Quality and Economics E 04 page 7
© WZL/IPT
Page 7© WZL/Fraunhofer IPT
Task 1 Data and Information
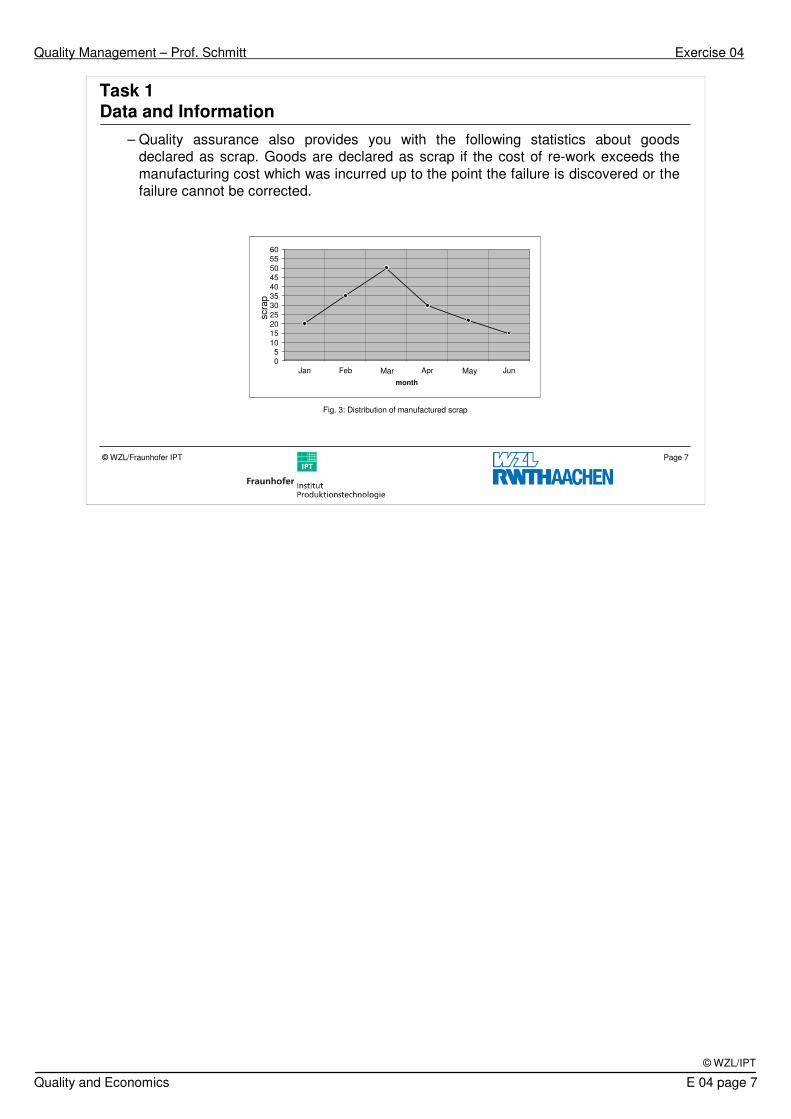
– Quality assurance also provides you with the following statistics about goods declared as scrap. Goods are declared as scrap if the cost of re-work exceeds the manufacturing cost which was incurred up to the point the failure is discovered or the failure cannot be corrected.
Fig. 3: Distribution of manufactured scrap
05
1015202530354045505560
Jan Feb Mrz Apr Mai Jun
month
reje
cts
scra
p
Mar May
Quality Management – Prof. Schmitt Exercise 04
Quality and Economics E 04 page 8
© WZL/IPT
Page 8© WZL/Fraunhofer IPT
Task 1 Question
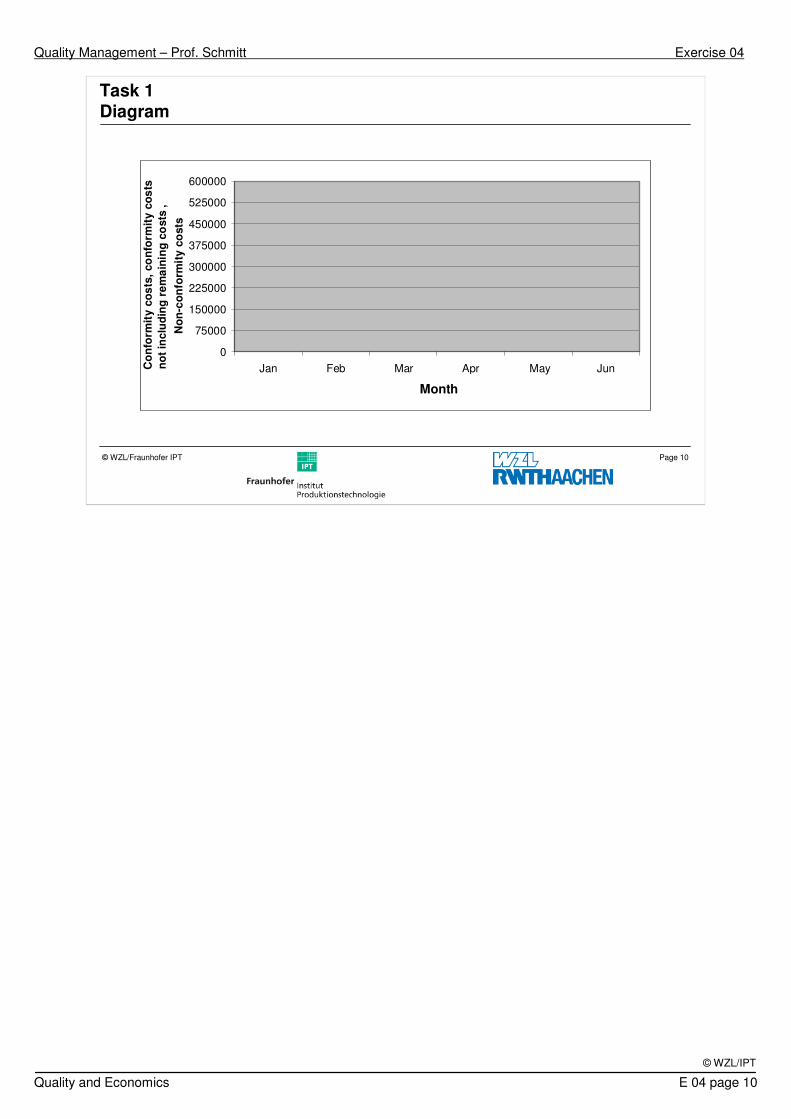
a) Classify the quality costs in the cost groups conformity and non-conformity costs and show their distributions for the months January through June in a diagram. Consider conformity costs including and not including “remaining costs”. Interpret the result!
Quality Management – Prof. Schmitt Exercise 04
Quality and Economics E 04 page 9
© WZL/IPT
Page 9© WZL/Fraunhofer IPT
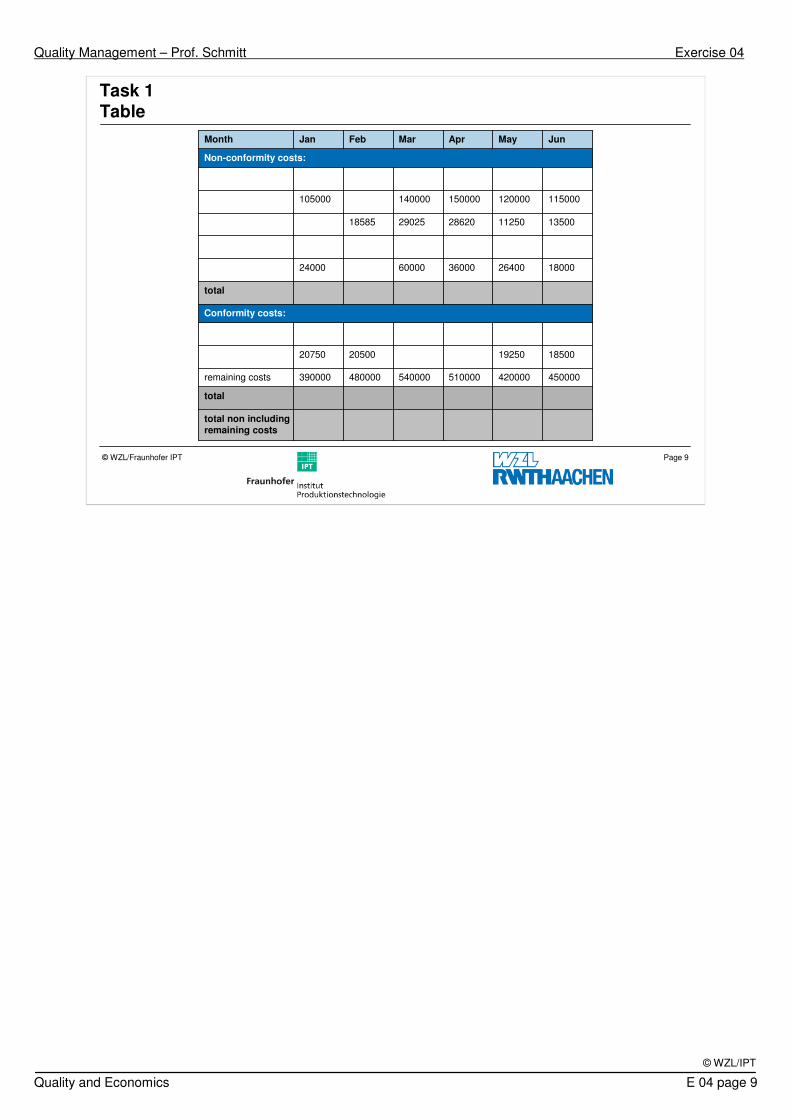
Task 1 Table
total non includingremaining costs
total
450000420000510000540000480000390000remaining costs
18500192502050020750
Conformity costs:
total
1800026400360006000024000
1350011250286202902518585
115000120000150000140000105000
Non-conformity costs:
JunMayAprMarFebJanMonth
Quality Management – Prof. Schmitt Exercise 04
Quality and Economics E 04 page 10
© WZL/IPT
Page 10© WZL/Fraunhofer IPT
Task 1 Diagram
0
75000
150000
225000
300000
375000
450000
525000
600000
Jan Feb Mar Apr May Jun
Month
Co
nfo
rmit
y c
os
ts,
co
nfo
rmit
y c
os
ts
wit
ho
ut
rem
ain
ing
co
sts
N
on
-co
nfo
rmit
y c
osts
no
tin
clu
din
g,
Quality Management – Prof. Schmitt Exercise 04
Quality and Economics E 04 page 11
© WZL/IPT
Page 11© WZL/Fraunhofer IPT
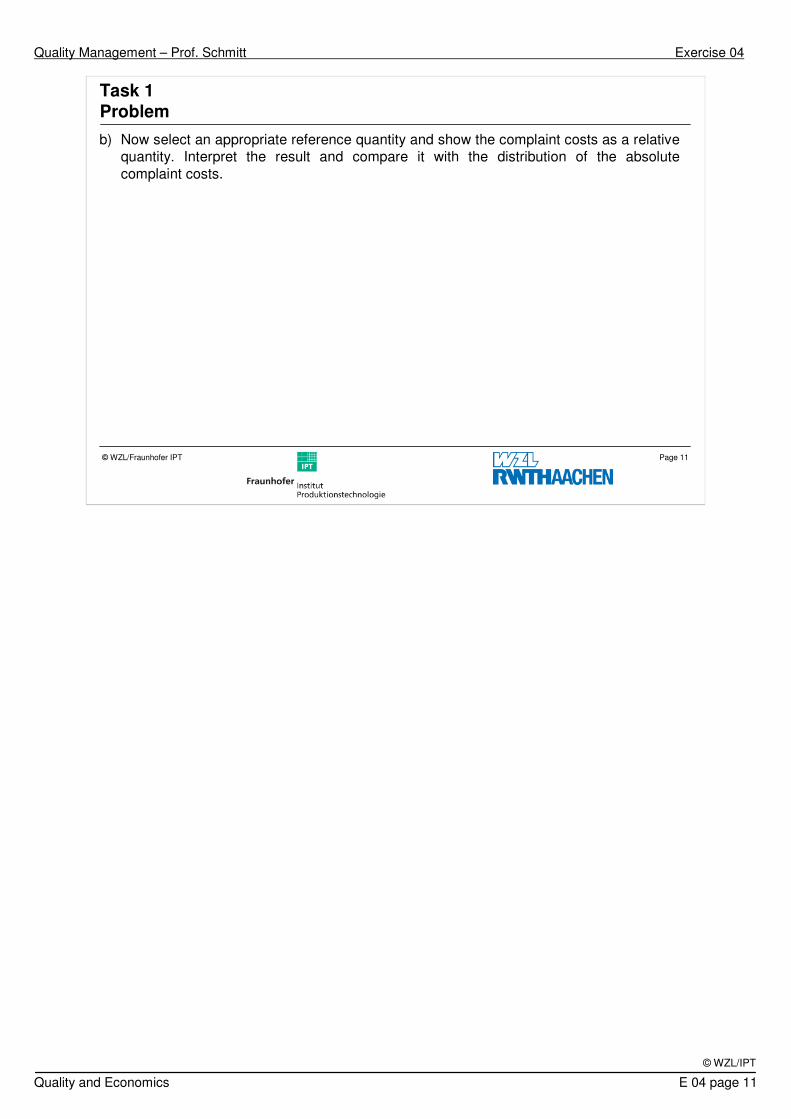
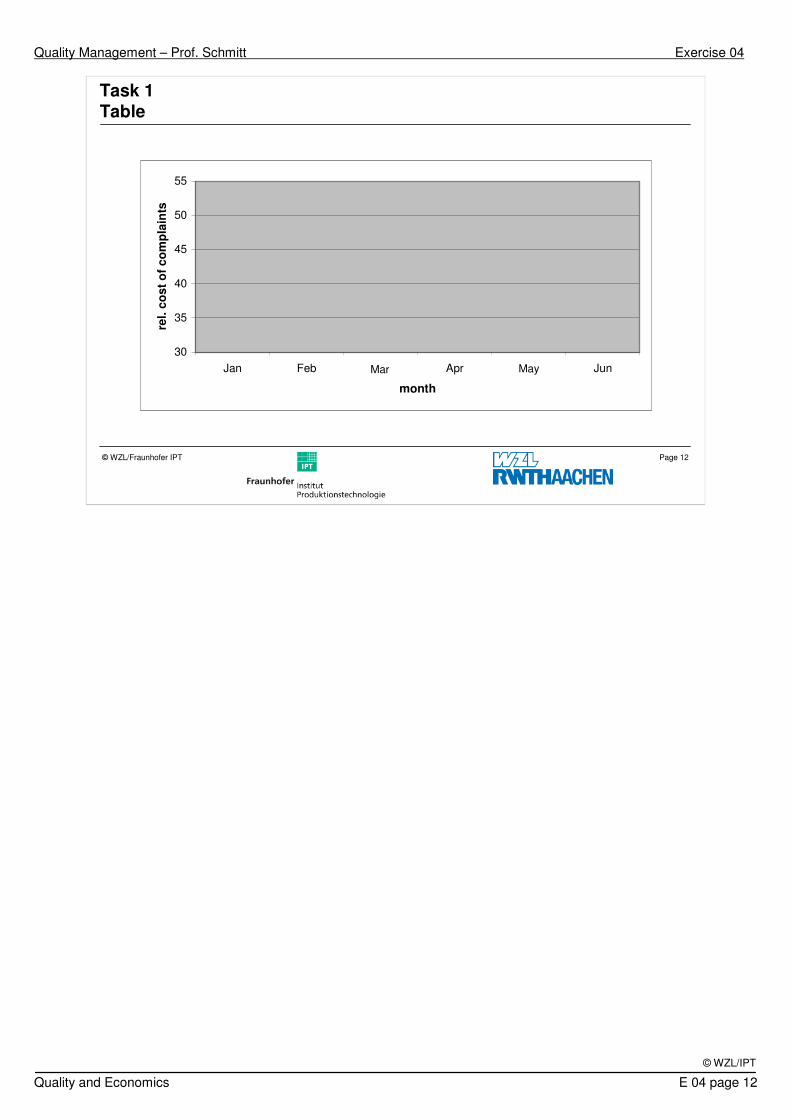
Task 1 Problem
b) Now select an appropriate reference quantity and show the complaint costs as a relative quantity. Interpret the result and compare it with the distribution of the absolute complaint costs.
Quality Management – Prof. Schmitt Exercise 04
Quality and Economics E 04 page 12
© WZL/IPT
Page 12© WZL/Fraunhofer IPT
30
35
40
45
50
55
Jan Feb Mrz Apr Mai Jun
month
rel.
co
st
of
co
mp
lain
ts
Task 1 Table
Mar May
Quality Management – Prof. Schmitt Exercise 04
Quality and Economics E 04 page 13
© WZL/IPT
Page 13© WZL/Fraunhofer IPT
Contents
Task 1: Quality-based costs
� Task 2: Analysis and provision of quality and cost information
Task 3: Target Costing
Quality Management – Prof. Schmitt Exercise 04
Quality and Economics E 04 page 14
© WZL/IPT
Page 14© WZL/Fraunhofer IPT
Task 2Problem
� Analysis and provision of quality and cost information
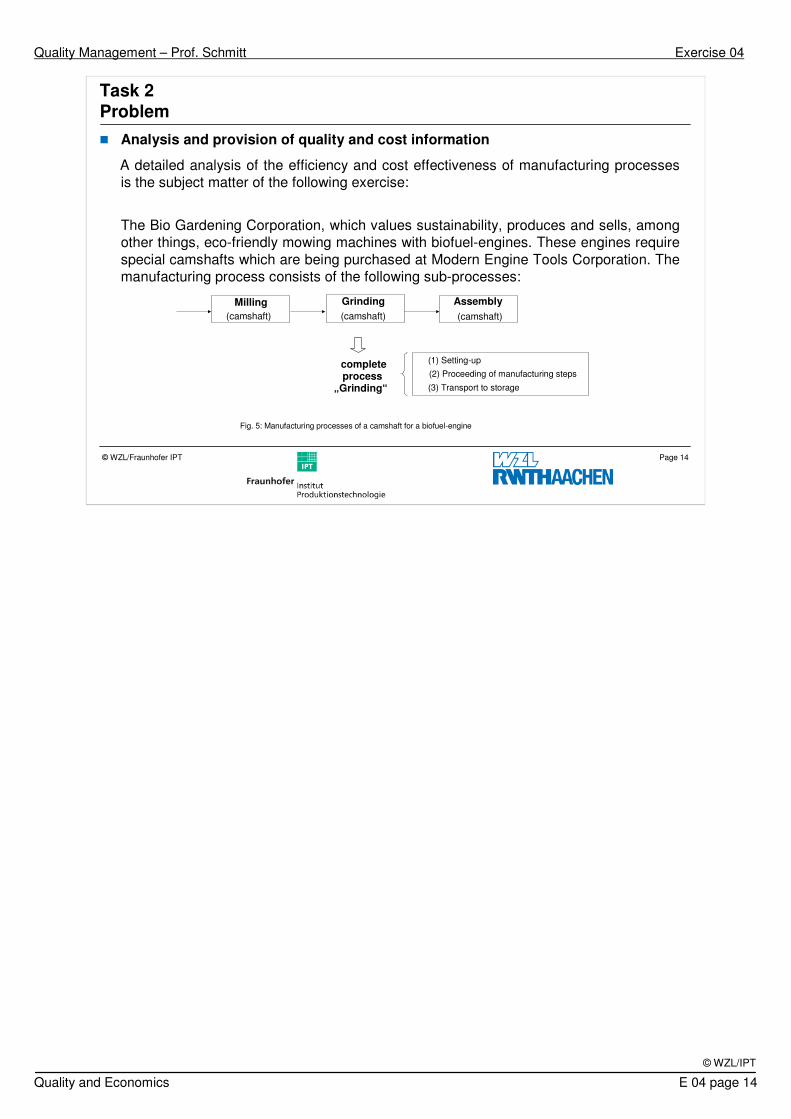
A detailed analysis of the efficiency and cost effectiveness of manufacturing processes is the subject matter of the following exercise:
The Bio Gardening Corporation, which values sustainability, produces and sells, among other things, eco-friendly mowing machines with biofuel-engines. These engines require special camshafts which are being purchased at Modern Engine Tools Corporation. The manufacturing process consists of the following sub-processes:
Fig. 5: Manufacturing processes of a camshaft for a biofuel-engine
(3) Transport to storage
(1) Setting-up
(2) Proceeding of manufacturing stepscomplete process
„Grinding“
(camshaft)
Milling Grinding
(camshaft)
Assembly
(camshaft)
Quality Management – Prof. Schmitt Exercise 04
Quality and Economics E 04 page 15
© WZL/IPT
Page 15© WZL/Fraunhofer IPT
Task 2 Data and Information
In this exercise the sub-process “Grinding” should be regarded more closely.
� General information:
– The plant operating time is 16 h per day (2 shifts). The average of planned production time is 14 h because of a slack periods. During these periods the employees work reduced hours.
– One employee of the Bio Gardening Corporation earns 9.50 € per hour.
– The material costs are 10.00 € per unit.
Quality Management – Prof. Schmitt Exercise 04
Quality and Economics E 04 page 16
© WZL/IPT
Page 16© WZL/Fraunhofer IPT
� Processing of the work pieces:
– Once every hour, adjustments to the tool magazine have to be carried out. One adjustment takes 30 seconds. Set-up time in the mornings is 30 minutes.
– The processing of the work pieces is calculated with overhead costs of 6.00 € per hour, this includes e.g. the costs for electricity, tools, depreciation.
– The cycle time for each unit is 45 seconds.
– The work pieces are produced in 3 autonomous production steps with interim repositioning. Failures can occur in each production step. The facility produces an average of 925 units per day. Of those, an average of 15 units are scrap.
Task 2 Data and Information
Quality Management – Prof. Schmitt Exercise 04
Quality and Economics E 04 page 17
© WZL/IPT
Page 17© WZL/Fraunhofer IPT
Task 2 Data and Information
� Transport:
– The work pieces are delivered on pallets.
– While production is in process, the employee removes the finished work piece and places it on a pallet.
– The small storage 1 is situated near the production facility and the assembly (transportation costs can be disregarded). Storage 2 is situated farther away but the employees prefer this storage. They always take the finished pieces there because Heike, a nice and attractive trainee, works there. At the end of each day, one worker brings the loaded pallets to storage 2. This unnecessary transit takes 4 minutes.

Quality Management – Prof. Schmitt Exercise 04
Quality and Economics E 04 page 18
© WZL/IPT
Page 18© WZL/Fraunhofer IPT
Task 2 Question
a) Calculate the overall equipment effectiveness!
Quality Management – Prof. Schmitt Exercise 04
Quality and Economics E 04 page 19
© WZL/IPT
Page 19© WZL/Fraunhofer IPT
Task 2 Question
b) During how many hours per day is value-adding work being carried out on the machine?
Quality Management – Prof. Schmitt Exercise 04
Quality and Economics E 04 page 20
© WZL/IPT
Page 20© WZL/Fraunhofer IPT
Task 2 Question
c) Calculate the process efficiency factor!
Quality Management – Prof. Schmitt Exercise 04
Quality and Economics E 04 page 21
© WZL/IPT
Page 21© WZL/Fraunhofer IPT
Task 2 Question
d) Interpret the differences between the indices!

Quality Management – Prof. Schmitt Exercise 04
Quality and Economics E 04 page 22
© WZL/IPT
Page 22© WZL/Fraunhofer IPT
Contents
Task 1: Quality-based costs
Task 2: Analysis and provision ofquality and cost information
� Task 3: Target Costing
Quality Management – Prof. Schmitt Exercise 04
Quality and Economics E 04 page 23
© WZL/IPT
Page 23© WZL/Fraunhofer IPT
Task 3Problem
� Target Costing
The company Cyclo Gras GmbH manufactures lawn mowers that are part of the upper end of the price range. The lawn mower market is well-researched and clearly structured. The required forecasts can therefore be regarded as reliable. Use the data provided to carry out a target cost analysis for a new model, scheduled to displace the current model in 2 years.
Quality Management – Prof. Schmitt Exercise 04
Quality and Economics E 04 page 24
© WZL/IPT
Page 24© WZL/Fraunhofer IPT
Task 3 Data and Information
– The current product generation and comparable products manufactured by competitors are available on the market for approx. 1,850.00 €. The most up-to-date forecasts provided by market research institutes indicate, however, that the emergence of new competitors from Southern Asia will decrease the price accepted by the market to 1,700.00 € during the next 2 years.
– In accordance with the targets set by company management, the aim is to reach a profit margin of 12 %.
– One of the project teams has conducted a QFD study on the product, the results are available to you (Tab. 5).
– You also have the cost data concerning individual components/parts of the current product (Tab. 6).
Quality Management – Prof. Schmitt Exercise 04
Quality and Economics E 04 page 25
© WZL/IPT
Page 25© WZL/Fraunhofer IPT
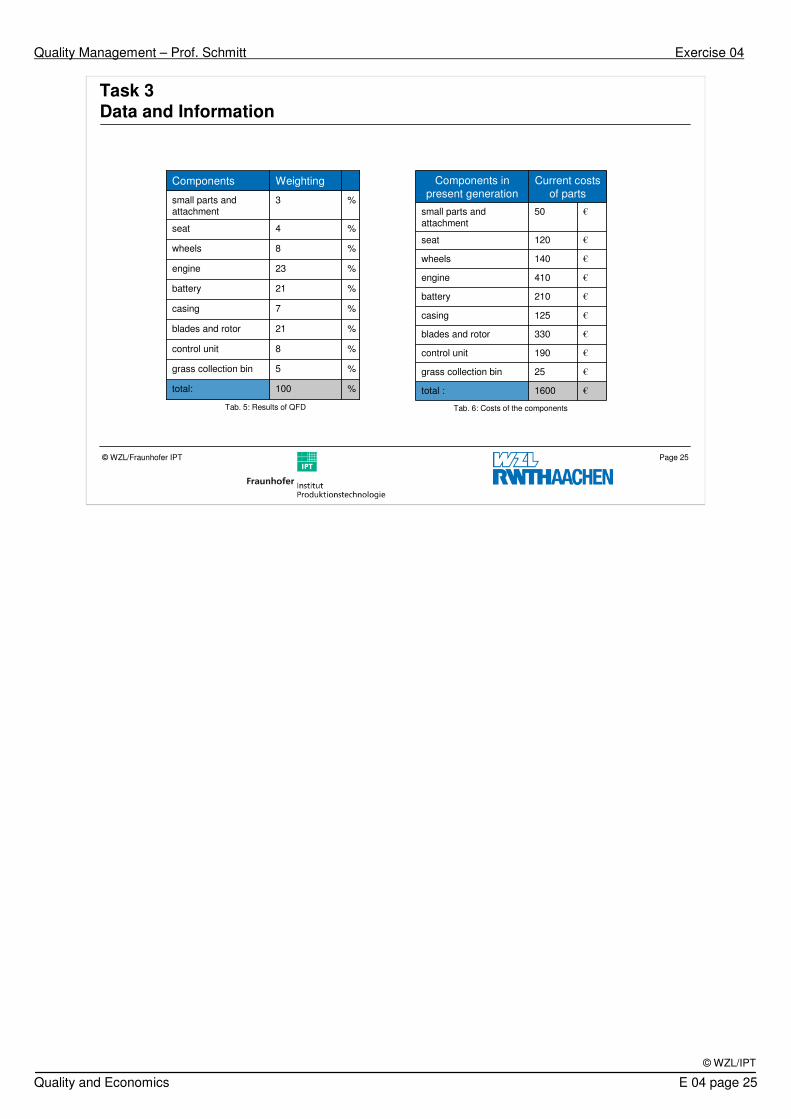
Task 3 Data and Information
€1600total :
€25grass collection bin
€190control unit
€330blades and rotor
€125casing
€210battery
€410engine
€140wheels
€120seat
€50small parts and attachment
Current costsof parts
Components in present generation
Tab. 5: Results of QFD
%100total:
%5grass collection bin
%8control unit
%21blades and rotor
%7casing
%21battery
%23engine
%8wheels
%4seat
%3small parts and attachment
WeightingComponents
Tab. 6: Costs of the components
Quality Management – Prof. Schmitt Exercise 04
Quality and Economics E 04 page 26
© WZL/IPT
Page 26© WZL/Fraunhofer IPT
Task 3 Question
a) Calculate the allowable costs of the new product which will make it possible to reach the prescribed profit margin.
Quality Management – Prof. Schmitt Exercise 04
Quality and Economics E 04 page 27
© WZL/IPT
Page 27© WZL/Fraunhofer IPT
Task 3 Question
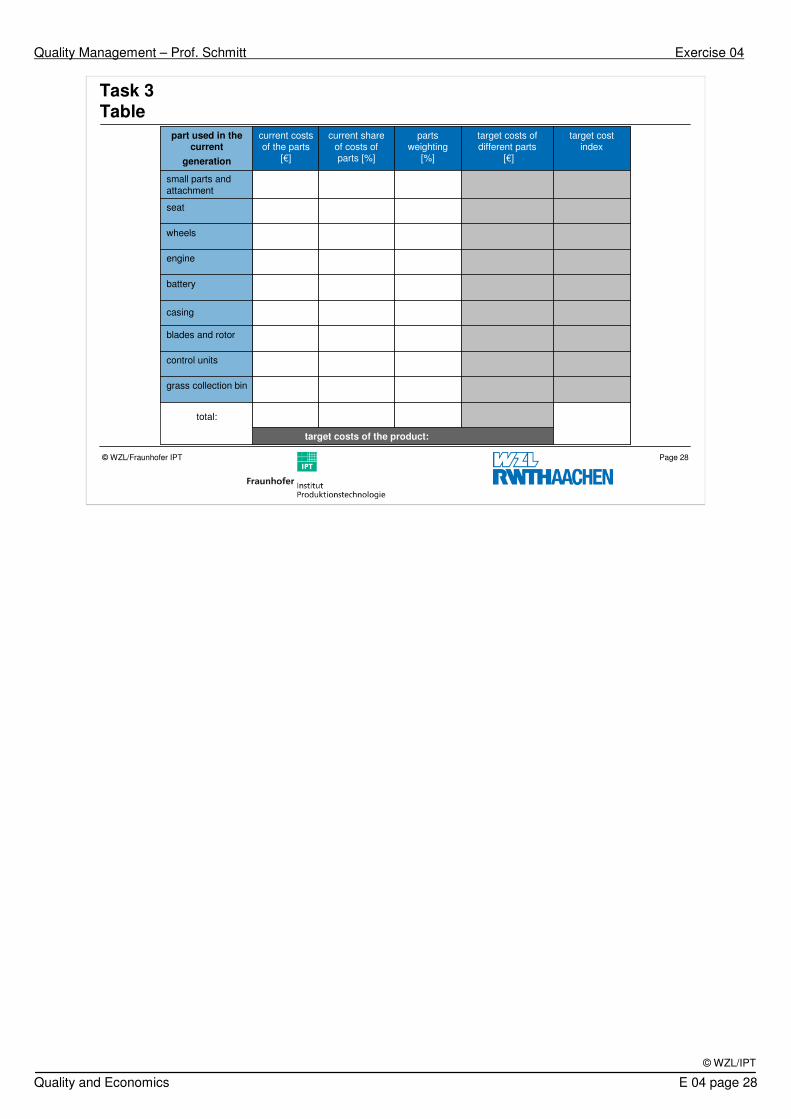
b) Use tables 5 and 6 to calculate the target costs and target cost indices of the different components and enter the values in the table below.
Quality Management – Prof. Schmitt Exercise 04
Quality and Economics E 04 page 28
© WZL/IPT
Page 28© WZL/Fraunhofer IPT
Task 3 Table
target costs of the product:
total:
grass collection bin
control units
blades and rotor
casing
battery
engine
wheels
seat
small parts and attachment
target costindex
target costs of different parts
[€]
partsweighting
[%]
current shareof costs of parts [%]
current costsof the parts
[€]
part used in the current
generation
Quality Management – Prof. Schmitt Exercise 04
Quality and Economics E 04 page 29
© WZL/IPT
Page 29© WZL/Fraunhofer IPT
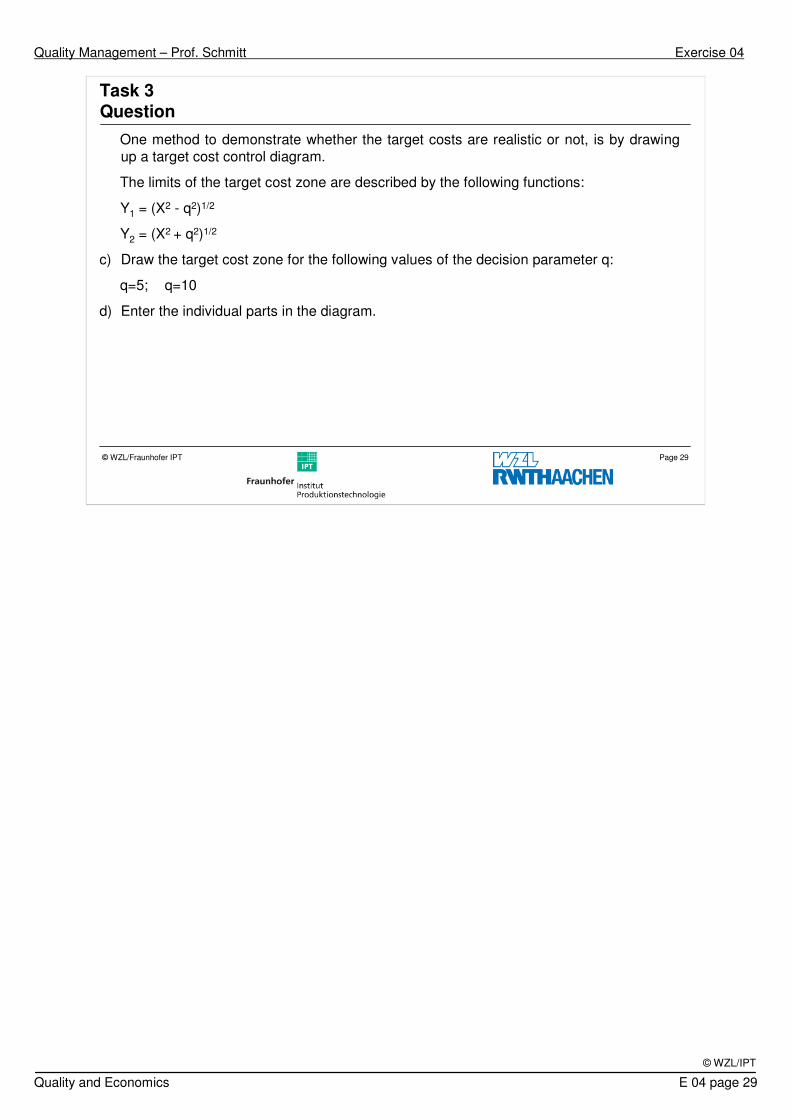
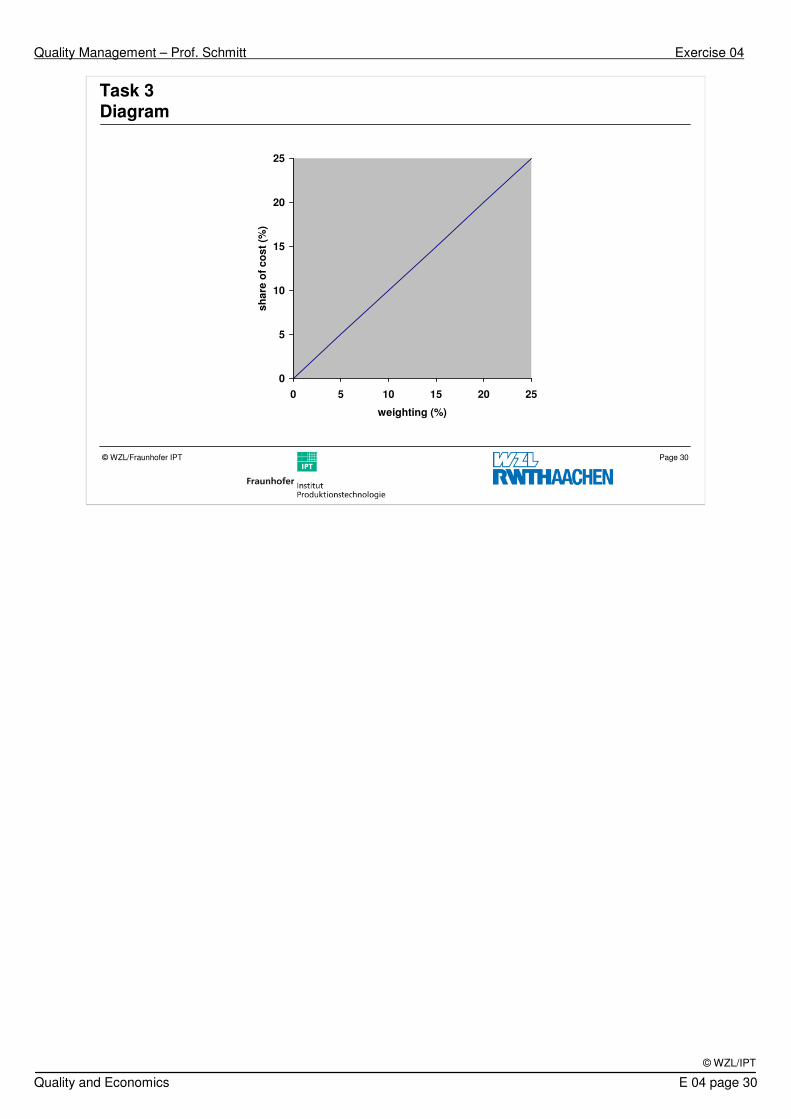
Task 3 Question
One method to demonstrate whether the target costs are realistic or not, is by drawing up a target cost control diagram.
The limits of the target cost zone are described by the following functions:
Y1 = (X2 - q2)1/2
Y2 = (X2 + q2)1/2
c) Draw the target cost zone for the following values of the decision parameter q:
q=5; q=10
d) Enter the individual parts in the diagram.
Quality Management – Prof. Schmitt Exercise 04
Quality and Economics E 04 page 30
© WZL/IPT
Page 30© WZL/Fraunhofer IPT
0
5
10
15
20
25
0 5 10 15 20 25
weighting (%)
sh
are
of
co
st
(%)
Task 3 Diagram
Quality Management – Prof. Schmitt Exercise 04
Quality and Economics E 04 page 31
© WZL/IPT
Page 31© WZL/Fraunhofer IPT
Task 3 Question
e) Interpret the result.
f) On what criteria would you base the selection of a value for parameter q?
Quality Management – Prof. Schmitt Exercise 04
Quality and Economics E 04 page 32
© WZL/IPT
Page 32© WZL/Fraunhofer IPT
Task 3 Question
g) How would you proceed if a component/part is far outside the target cost zone?
![dìdÄR XÖLWÖK èb]SáÖK Üá©K dáRùá ïätáÖK ïZdL`ÖK … · A/CONF.184/6 QKdkS`áÖK ADEOS Advanced Earth Observing Satellite ld©K bkdÖ ÜbÄSáÖK (ïâLNLîÖK) ÑRL¸ÖK](https://img.pdfslide.us/doc/110x75/5c2780cf09d3f240638b4960/didaer-xoelwoek-ebsaoek-ueak-darua-iaetaoek-izdloek-aconf1846.jpg)


![dìdÄR XÖLWÖK èb]SáÖK Üá©K dáRùá ïätáÖK …A/CONF.184/6 èb¥]SáÖK Ü¥á©K Distr.: General êáLtÖK êîtáZÖK ARABIC Original: English ïZdL`ÖK òLm|ÖK zL˛ÉSgLN](https://img.pdfslide.us/doc/110x75/5e3c7cf862218c776d291ec3/ddr-xlwk-bsk-oek-dr-tk-aconf1846-bsk.jpg)