Embed Size (px)
Citation preview
HANIU T-73. 003 C 2
UHI-med-71-01
~ y ~ y 0 I ~ Q ~ ~ ~ ~
a ~ a~ a
~ ' e ~
~ ~
~ ~ ~4 ~
~ ~
UNIHI-SEAGRANT-TR-71-04
Prepared under the
National Science Foundation
SEA GRANT PROGRAM
UNIHI-SEAGRANT- TR-71 -04
CARDIO-RESPIRATORY RESPONSES TO EXERCISE
IN AIR AND WATER AT 1 AND 2 ATA
by
D.A. Lally, T.O. Noore, and S.K. Mong
DEPARTMENT OF PHYSIOLOGY
UNIVERSITY OF HAWAII SCHOOL OF MEDICINE
DECEMBER, 1971
Prepared under the
National Science Foundation
SEA GRANT PROGRAM
The University of Hawaii Sea Grant Program
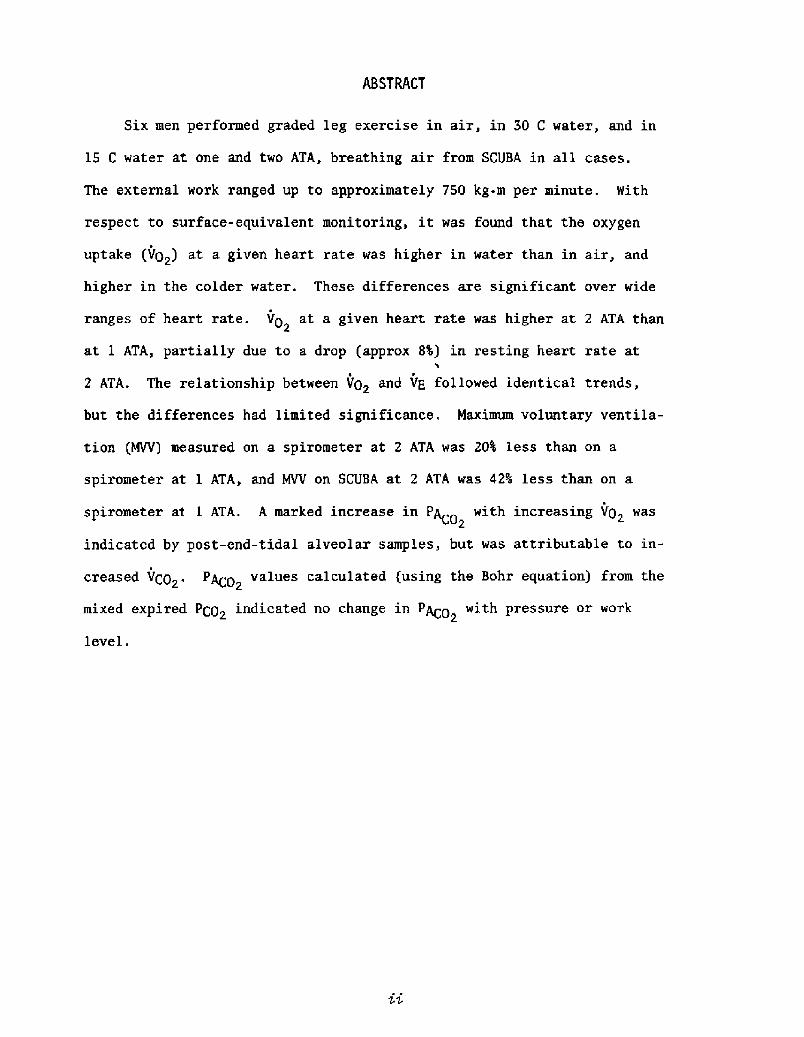
ABSTRACT
Six men performed graded leg exercise in air, in 30 C water, and in
lS C water at one and two ATA, breathing air from SCUBA in all cases.
The external work ranged up to approximately 7SO kg.m per minute. With
respect to surface-equivalent monitoring, it was found that the oxygen
uptake VO2! at a given heart rate was higher in water than in air, and
higher in the colder water. These differences are significant over wide
ranges of heart rate. Vp at a given heart rate was higher at 2 ATA than2
at l ATA, partially due to a drop approx 8't! in resting heart rate at
2 ATA. The relationship between Vp2 and VE followed identical trends,
but the differences had limited significance. Maximum voluntary ventila-
tion N/V! measured on a spirometer at 2 ATA was 204 less than on a
spirometer at 1 ATA, and MVV on SCUBA at 2 ATA was 42% less than on a
spirometer at 1 ATA. A marked increase in P~p with increasing VO2 was- w02
indicated by post-end-tidal alveolar samples, but was attributable to in-
creased VCO . PACO values calculated using the Bohr equation! from the2
mixed exPired PCO2 indicated no change in PACp with Pressure or work2
level.
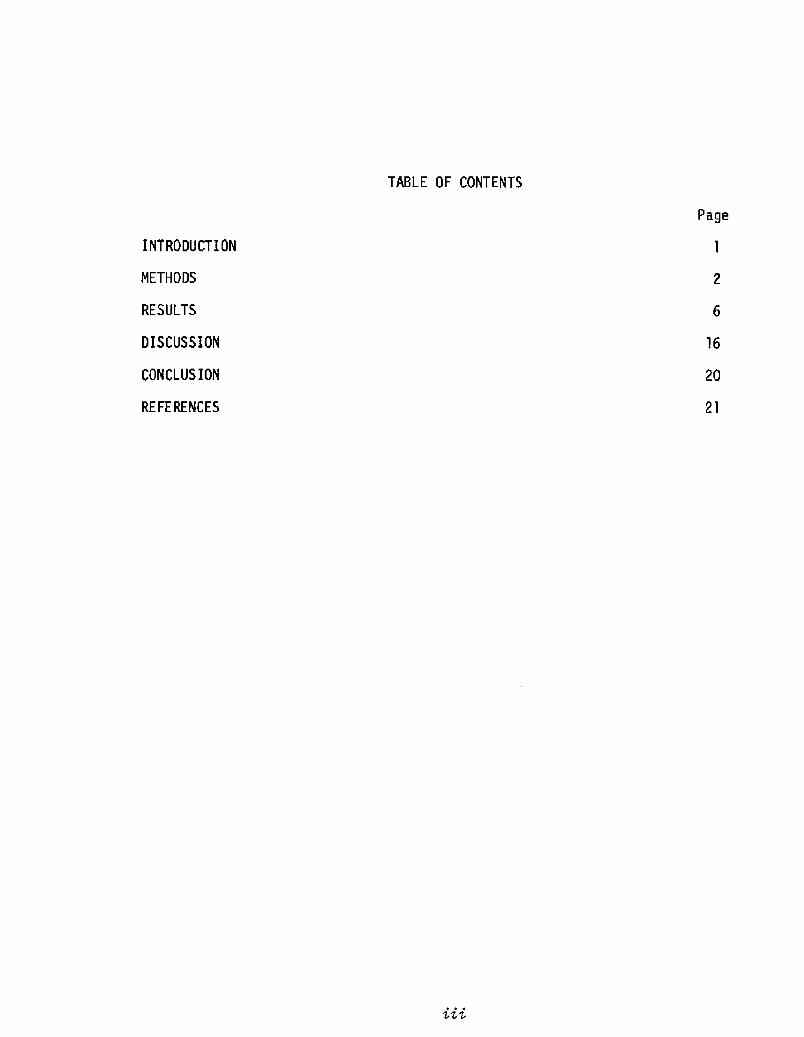
Page
16
20
21
INTRODUCTION
METHODS
RESULTS
DISCUSSION
CONCLUSION
REFERENCES
TABLE OF CONTENTS
INTRODUCTION
The expansion of human activity in the sea has led to a need far
estimating the energy cost of underwater tasks. In particular, the safe
and efficient management of extended diving operations requires a means
of predicting the work and thermal loads of diving in order to establish
the nutritional, rest, and thermal recovery needs of divers.
In turn, this requires the development of adequate means of estimating
energy expenditure during typical underwater tasks via a practical physio-
logical measurement. This has been the subject of several previous inves-
tigations �, 5, ll, 16! which focused on oxygen uptake Vp2! as a measure
of energy cost, and on heart rate fh! and ventilation VE! as estimators
of Vp~.
Accordingly, the present work was undertaken to verify the existence
and magnitude of the effects of water temperature and pressure on the
relations between oxygen uptake, heart rate, and ventilation in. exercising
SCUBA divers,
METHODS
Six healthy adult males, all experienced SCUBA divers, served as sub-
jects at one-week intervals. Their average physical characteristics are
given in Table l.
The experiments comprised graded leg exercise in air, 30 C water, and
15 C water, at both 1 and 2 ATA. The subjects breathed air from SCUBA in
all cases, using a standard 71 fthm tank and a two-stage, double-hose regu-
lator U.S. Divers Co., Santa Ana, Calif.!.
The experimental regimen is shown in Figure 1. Each experiment began
with a rest period, with the subject immersed in the milieu to be tested,
followed by five minutes of moderate exercise and another rest period. The
subject then performed, without interruption, four minutes of "heavy" exer-
cise followed by two minutes of "forced" exercise. The loads and repetition
rates imposed at each level are indicated in the figure. The stroke length
was an individual variable, ranging from 11 to 16 inches. During the last
minute of each exercise and rest interval, expired air was collected to
determine ventilation and oxygen uptake. A cardiac steady state was obtained
at each exercise level. Thus, this was essentially a steady-state experi-
ment. Vp was calculated using the following equation, which corrects for R:2
VP = VE IQ � EQ � FIP FECQ 1,0 � FIQ
in which VE is in STPD.
Heart rate was determined from a continuous ECG record obtained from
precordial surface leads. Respiration rate was recorded continuously by
means of a thermistor sealed in the mouthpiece. The exercise stroke fre-
quency was set by a metronome, and was verified by recording the output of
a photocell whose triggering beam was interrupted by one of the ergometer
pedals.
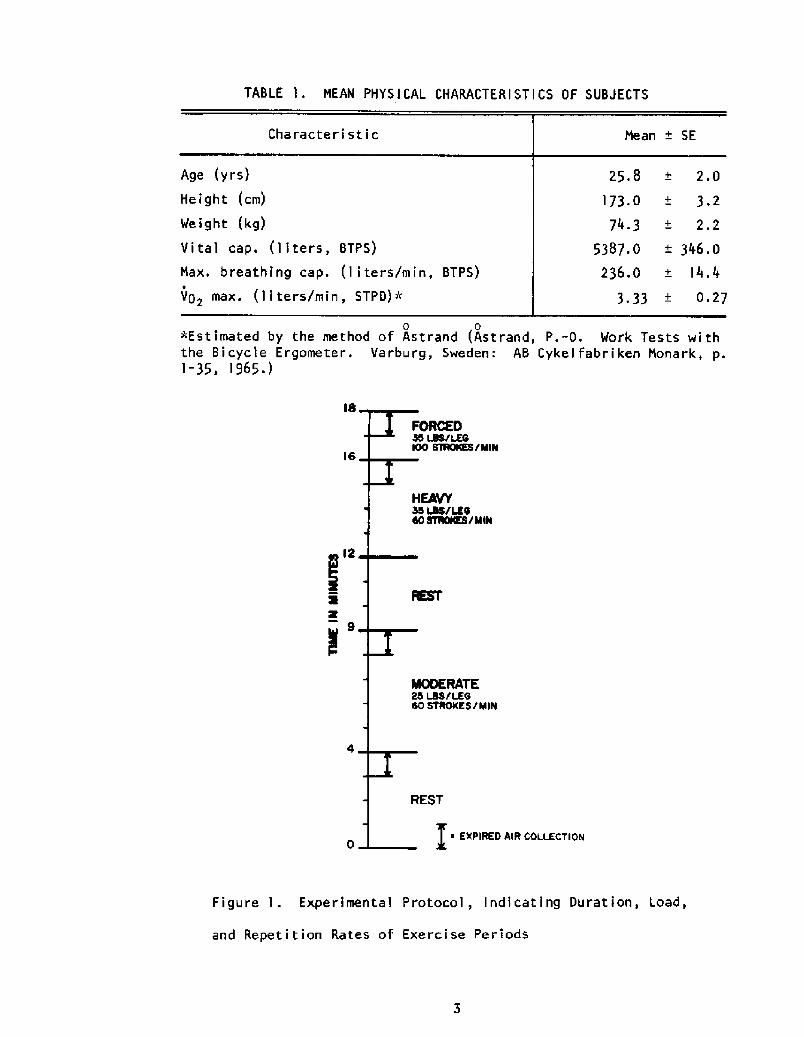
TABLE 'I ~ MEAN PHYSICAL CHARACTERISTICS OF SUBJECTS
0 0*Estimated by the method of Astrand Astrand, P.-O. Work Tests withthe B i cycle Ergometer. Varburg, Sweden: AB Cykel fabr iken Monark, p.l -35, I 965. j l8 FORCH!
LSS/LEOOO STROKES /MIR
l6
KAVY55 LSS/LEO80 STROKES/MIN
OOE RATE25 LSS/LEOSO STROKES/MIN
EST
~ EXPIRED AIR COLLECTION
Figure I. Experimental Protocol, Indicating Duration, Load,
and Repetition Rates of Exercise Periods
The exercise apparatus is shown in Figure 2. The exercise machine
uses a pulley system to convert the horizontal pedal excursions into
vertical displacement of the weights. The machine and subject may be
fully immersed in a constant-temperature water bath, with the exception
of the weights, which are external to the bath to facilitate their varia-
tion.
All experiments were conducted within a pressure vessel �0 feet in
diameter by 40 feet deep! located at the Look Laboratory of Oceanographic
Engineering.
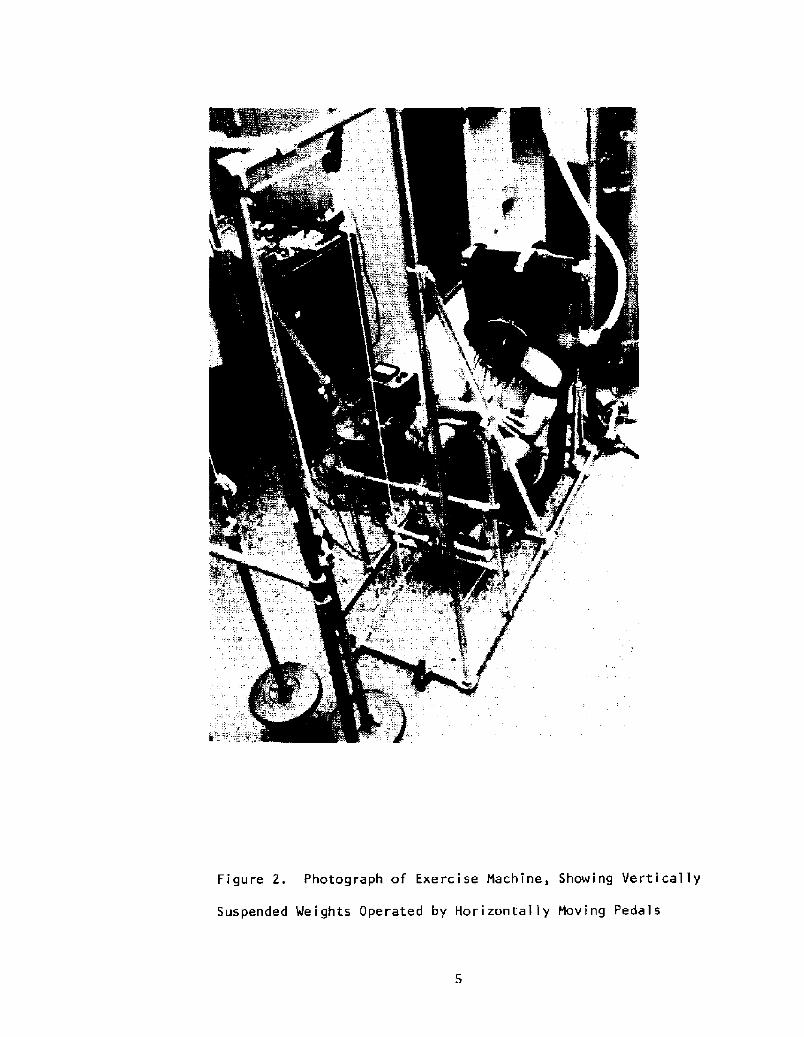
Figure 2. Photograph of Exercise Machine, Showing Vertically
Suspended Weights Operated by Horizontally Moving Pedals
RESULTS
In the following, VE is reported in ATPS units, as conversion to BTPS
offered no normalizing advantage. Heart rates fh! were obtained by count-
ing over one-minute intervals, and are in bpm. Vp> and Vcp> are in STPD.
Table 2 summarizes the pertinent mean data, grouped by work level
category, obtained under the various conditions tested.
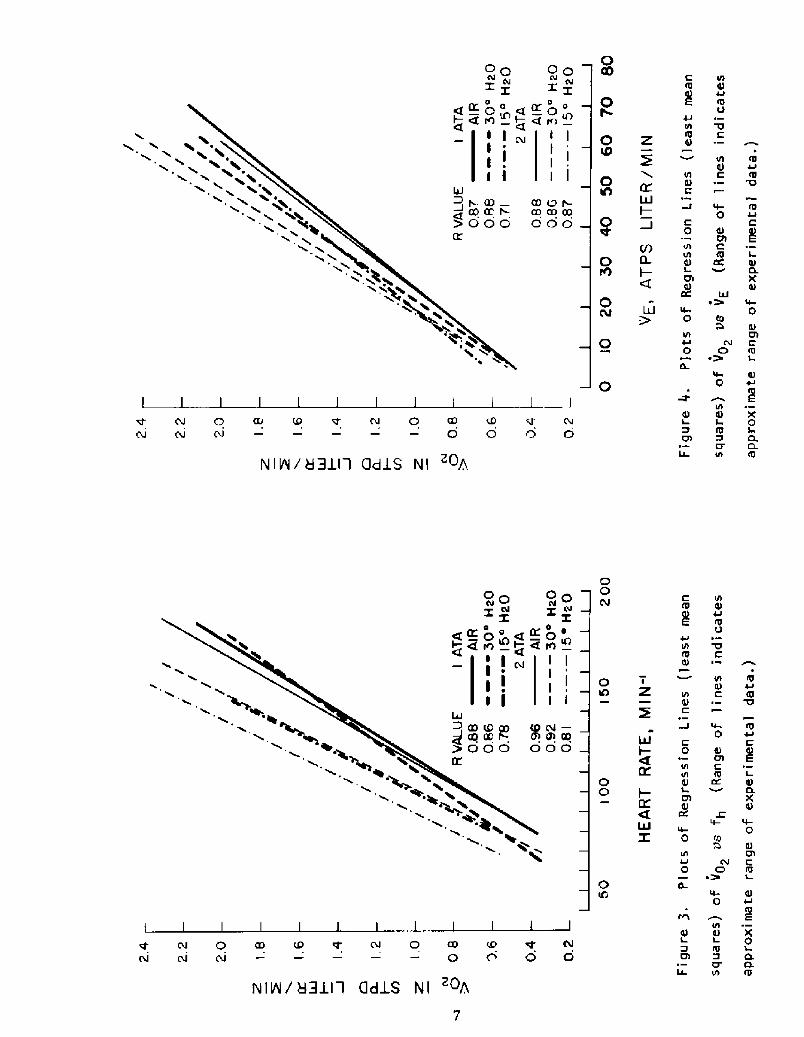
The primary analytic tool employed was simple linear regression rather
than comparison of grouped data. Under each condition, the data on all six
subjects were used to calculate mean squares regression lines for Vp2 va fh
and Vp> vs VE. These two sets of lines are graphed in Figures 3 and 4,
which also give the corresponding correlation coefficients R!. It can be
seen that, in general, at any given fh or VE, the Vp2 is higher under water
than in air, and higher in the colder water. Under a given condition of
immersion, the Vp2 tends to be higher at 2 ATA than at 1 ATA.
The Vp is given in absolute terms, since the SD of the body weight2
is 5.3 kg SE = 2.2! which is only 7% of the mean body weight. Moreover,
the load weight is not proportioned to body weight and the exercise stroke
is essentially horizontal. For these reasons, the normalizing advantage
of using Vp> per kg is small in this case.
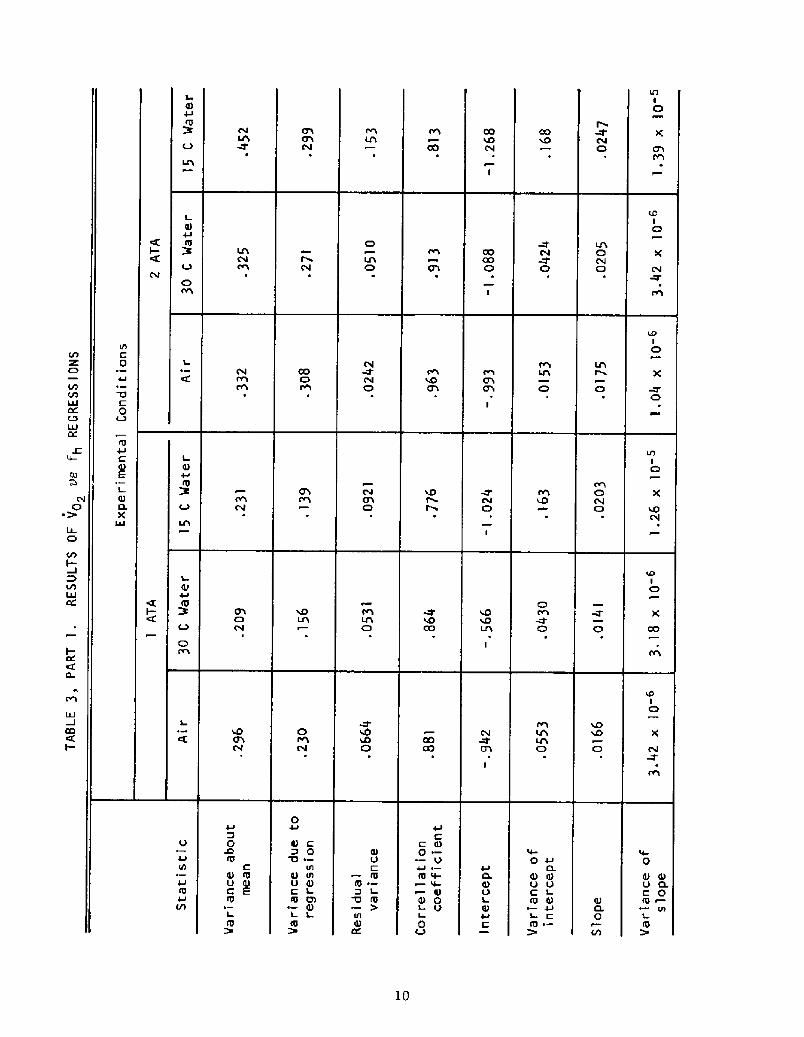
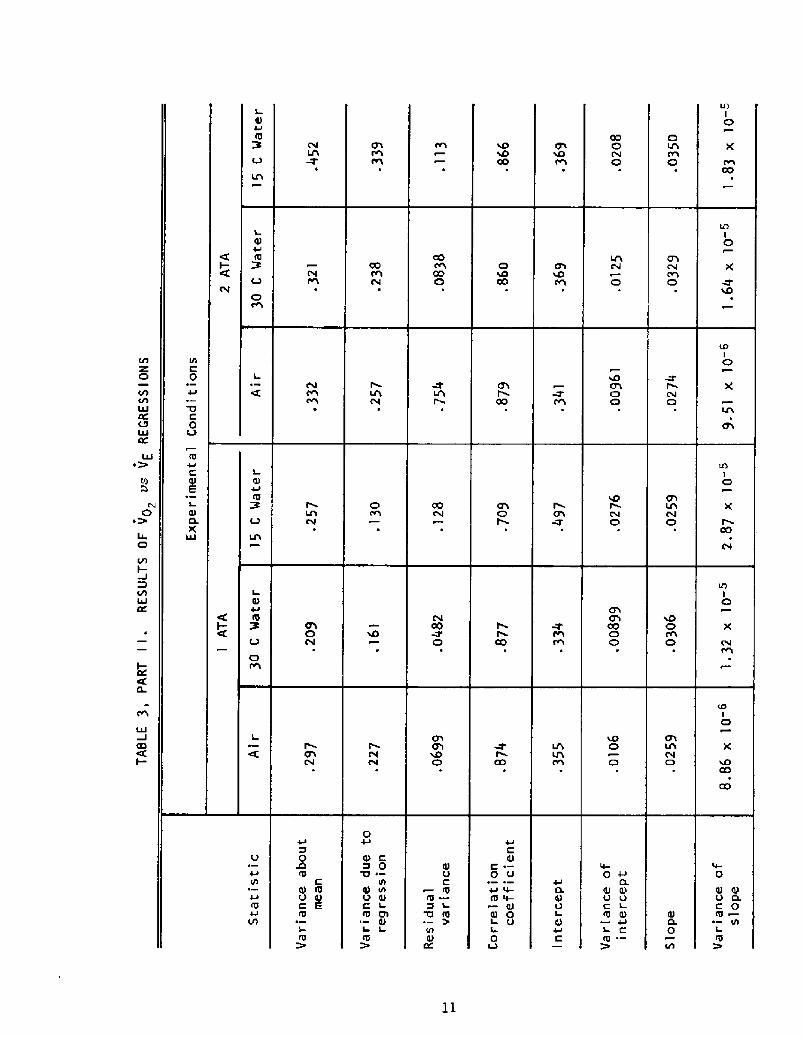
A more detailed evaluation of the regressions yields the statistics
given in Table 3, which tabulates a basic analysis of variance for each
case.
OOAlzz
OOCVx z
0cf m
I
OOO 0
lC0
0
Nllhl/83lll QdJ.S NI OA
0
0 CUOOCIIz z0
th
I
I
OOz c4
g ��0 0 0
0 0
V 0CL
0 8 fg4l
X
0 a,
N I lhl / 833.Il Cld J.S N I OA
CU 0 <9 0! < CU 0 cO Q cf evcU cU CU � � � � � 0 0 0 0
0 m u! 4 cu 0 a!cu cu e � � � � � 0 C 0 0
Z',
IZ
W I�
CO
I� LLJ
I
hf
tL
UJT
Vllg4l
VlQ
c 0
VlQ L-0l
0VIJJ0
6
Vl
Ol
VlCl
C 0VlVl81 ChglIY
IJ 0
4 l5V cVl
C
0 4 ChlgCC
IJJ
~ ! tp�
Cte!
4lJJ
O cVltg
C 04 Ulc fp
IJ- �CI
~ !
tg4Jlgo
JJ
I glCLk S
4 0 Q Chcrtll
tg
tg
c
Il
a 4!4-
0 Q Olctg
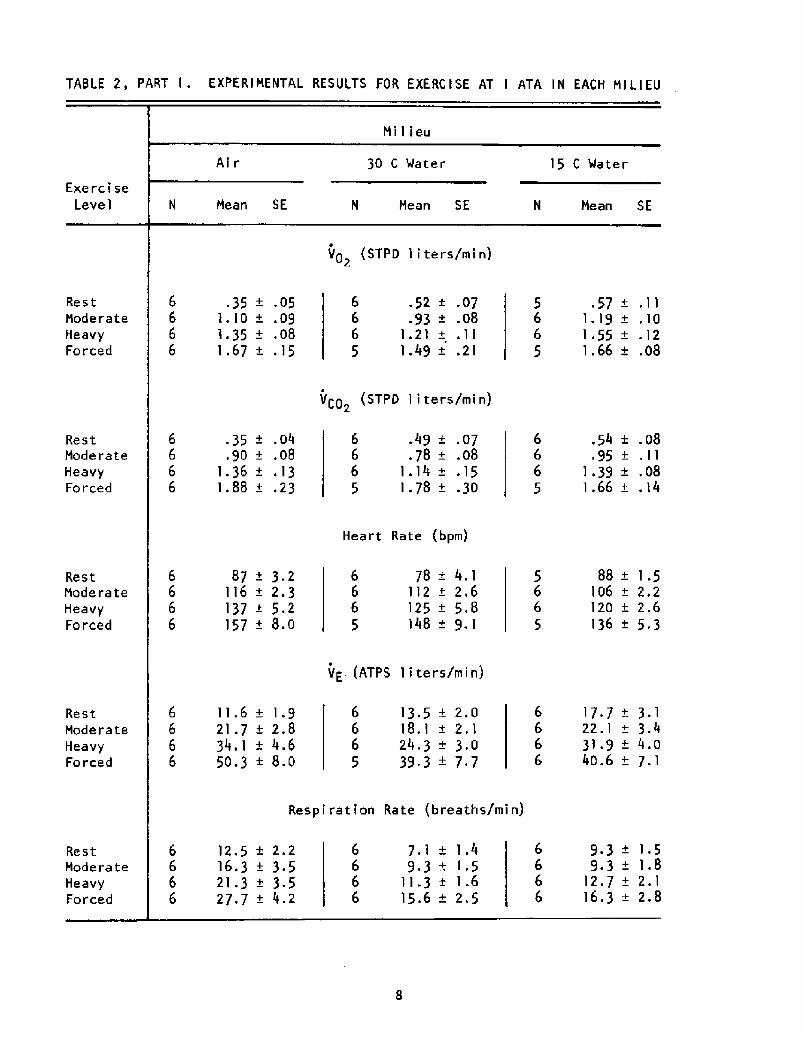
TABLE 2, PART I . EXPERIMENTAL RESULTS FOR EXERCISE AT I ATA IN EACH MILIEU
Milieu
Air 30 C Water 15 C Water
Exercise
Level N Mean SE N Mean SE N Mean SE
VO STPD liters/min!2
VCO STPD liters/min!2
Heart Rate bpm!
VE. ATPS liters/min!
Resp i ra t i on Ra te b reaths/min!
Rest
Moderate
HeavyForced
Rest
Moderate
HeavyForced
Rest
Moderate
HeavyForced
Rest
Moderate
HeavyForced
Rest
Moderate
HeavyForced
35 - +-0510 + .09
I ~ 35 +,08i.67
.35 + .04
.90 + .081.36 + .131.88 + .23
87 + 3.2116 + 2.3137 + 5.2157 + 8.0
11.6 + 1.921.7 + 2.834.1 + 4.650.3 + 8.0
12.5+ 2.216.3 + 3.521.3 + 3-527.7 + 4.2
.52 + .07
.93 + .081.21 + .11
1.49 + .21
.49 + .07
.78 + .081.14 + .151.78 + .30
78 + 4.1112 + 2,6125 + 5,8148 + 9.1
13.5 + 2.018.1 + 2.124.3 + 3.0393+77
+ 1.49 ~ 3+ 1 ~ 5
11.3 + 1.615.6 + 2.5
.57 + .111.19 + .101.55 + .12i.66 + .08
.54 + .08
.95 + .111.39 + .08i.66 + .14
88+ 1-5106 + 2.2120 + 2.6
136 + 5.3
I/ ~ 7+ 3 ~ I22.1 + 3.431.9 4.040.6 + 7.1
9.3 + 1.59.3 + 1.8
12.7 + 2.116.3 + 2.8
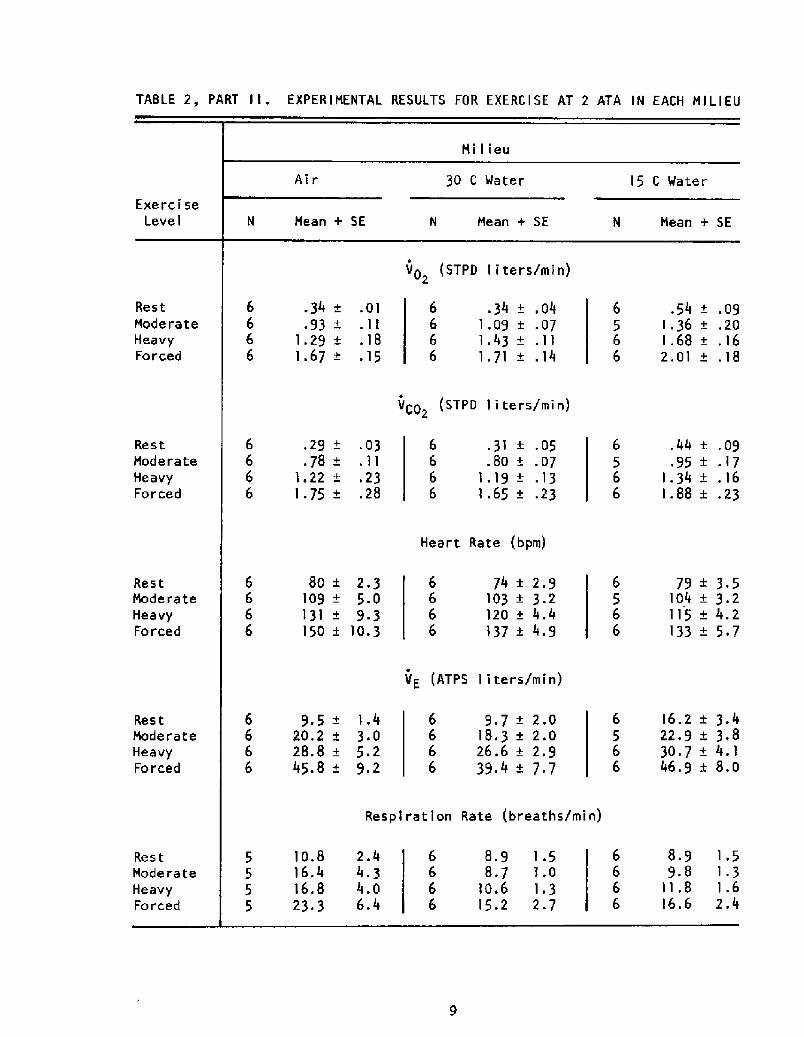
TABLE 2, PART I I . EXPERIMENTAL RESULTS FOR EXERCISE AT 2 ATA IN EACH MILIEU
Milieu
Air 30 C Water 15 G Water
Exercise
Level N Mean + SE N Mean + SEN Mean + SE
Vp STPD liters/min!2
.34 + .01,93 +
1.29 + .181.67 + .15
VC0 STPD liters/min!2
Heart Rate bpm!
80 + 2.3109 + 5.0131 + 9.3150 + 10.3
VE ATPS liters/min!
9 ~ 5 + 1.420,2 + 3.028.8 + 5.245.8 + 9.2
Respiration Rate breaths/min!
5 108 2416.4 4.316.8 4.0
5 23.3 6.4
Rest
Moderate
HeavyForced
Rest
Moderate
HeavyForced
Rest
Moderate
HeavyForced
Res t
Moderate
HeavyForced
Rest
Moderate
HeavyForced
29 +.78 +
1.22 +
1.75 +
.03
.11
~ 23.28
.34 + .041 .09 + .071.43 + .111.71 + .14
.31 + .05
.8P + .P71.19 + .131.65 + .23
74+ 29103 + 3.2120 + 4.4137 + i ~ 9
9.7 + 2.018.3 + 2.026.6 + 2.9394+ 77
6 8.9 1.56 8 7 1.06 10.6 1.36 15.2 2.7
.54 + .091.36 + .201.68 + .162.01 + .18
.44 + .09~ 95 + ~ 17
1.34 + .161.88 + .23
79+35104 + 3.2115 + 4.2133 + 5.7
16.2 + 3.422.9 + 3.830.7 + 4.146.9 + 8.0
6 8.9 1.56 9.8 1.36 11.8 1.66 16.6 2.4
m
CIO
EDI
CV
CD
CDLA
CDCViD
CD
LCIICD
C4
CVCI
m LACD
OOCDth
II!ICD
CDCVCD
CVCACI
CVCl
L.
Q ICIID
m LACD
I-
CL
ICD
mLALACD
04J
VlKCD
VlLLI
CVCD
~ !
IIIC 04J
0L 0
ig
S O.X
U4Jth4JIQ
I/l
0
C
S U gIgI
!
Cll C0
Q VIU 6C L
UlS
L L
!
Ill
U C IIIIg
0~- Iil4lIK
C dl0 i
U~-Ill Ii-
IllS 0
UL.0
Ct.I9U
Q C
0CI
Q SU UCIV 4l~ � 4J
CIII ~!
8 0U 0.C 0III ~
Cl
leItD
V ID CILPi
tD
DQC0CV
L IDc0mCOCi
CCrn
t0~ Dl
tDV
LACVCt
C!
CO
CV
Q IDCCI�CO
mCt
c0
tD
ECt
tD
OLEACVC3
0
tL 0O.
O tDC
ID6.0Vl
11
ttt
0
V L0
tD
V IDE tDCLXlaJ
O
ttl
IDVVl
V 0 IDC
tD IDO gID
tD!
CD c0
0 ~Ih
tQ tt1O SctD 0l~ Q
tD!
ID
O C IDID
L"0 tD~�
IDL ~�0 OV 4-CD tt�
tDtD 0
OL0
It-0
CLIUO O
LID tD
L ID
ID tDO aL 0tD
~ � ttI
tD!
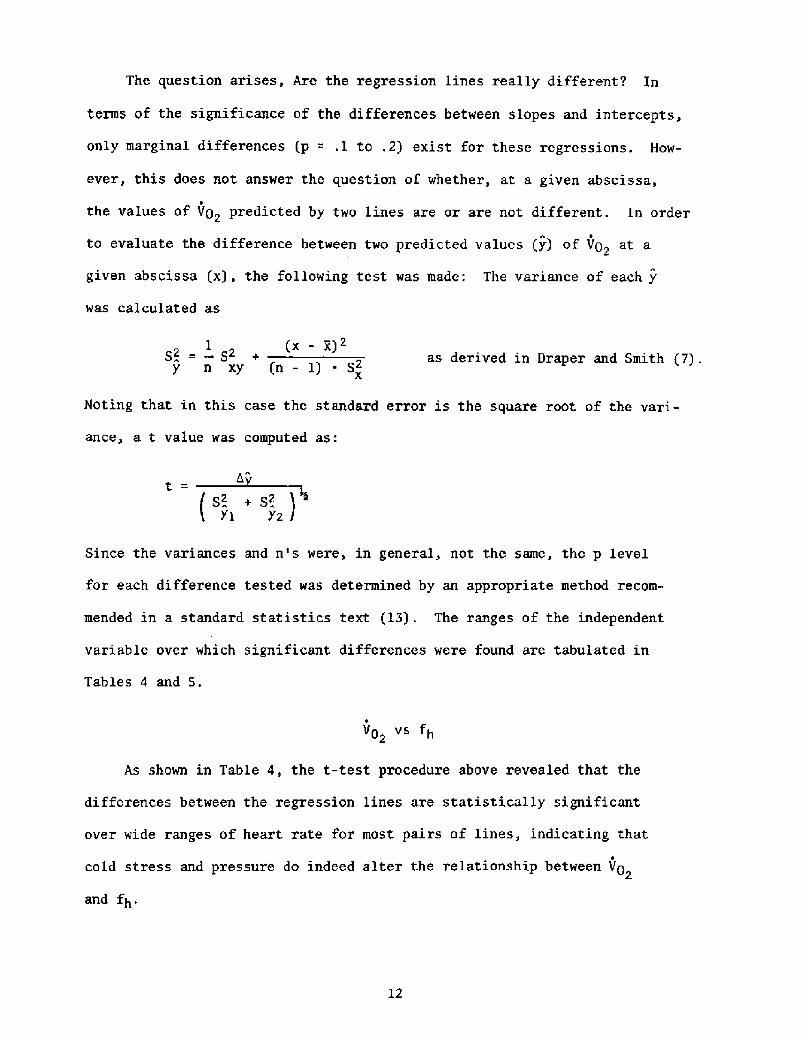
The question arises, Are the regression lines really different? In
terms of the significance of the differences between slopes and intercepts,
only marginal differences p = .l to .2! exist for these regressions. How-
ever, this does not answer the question of whether, at a given abscissa,
the values of V02 predicted by two lines are or are not different. In order
to evaluate the difference between two predicted values {y! of Vp at a
given abscissa x!, the following test was made: The variance of each y
was calculated as
1 x - xS2 S2y n xy n � 1! ~ S2
X
as derived in Draper and Smith {7! .
Noting that in this case the standard error is the square root of the vari-
ance, a t value was computed as:
y> y2
Since the variances and n's were, in general, not the same, the p level
for each difference tested was determined by an appropriate method recom-
mended in a standard statistics text �3!. The ranges of the independent
variable over which significant differences were found are tabulated in
Tables 4 and S.
Vp vs fh2
As shown in Table 4, the t-test procedure above revealed that the
differences between the regression lines are statistically significant
over wide ranges of heart rate for most pairs of lines, indicating that
cold stress and pressure do indeed alter the relationship between Vo2
and fh.
12
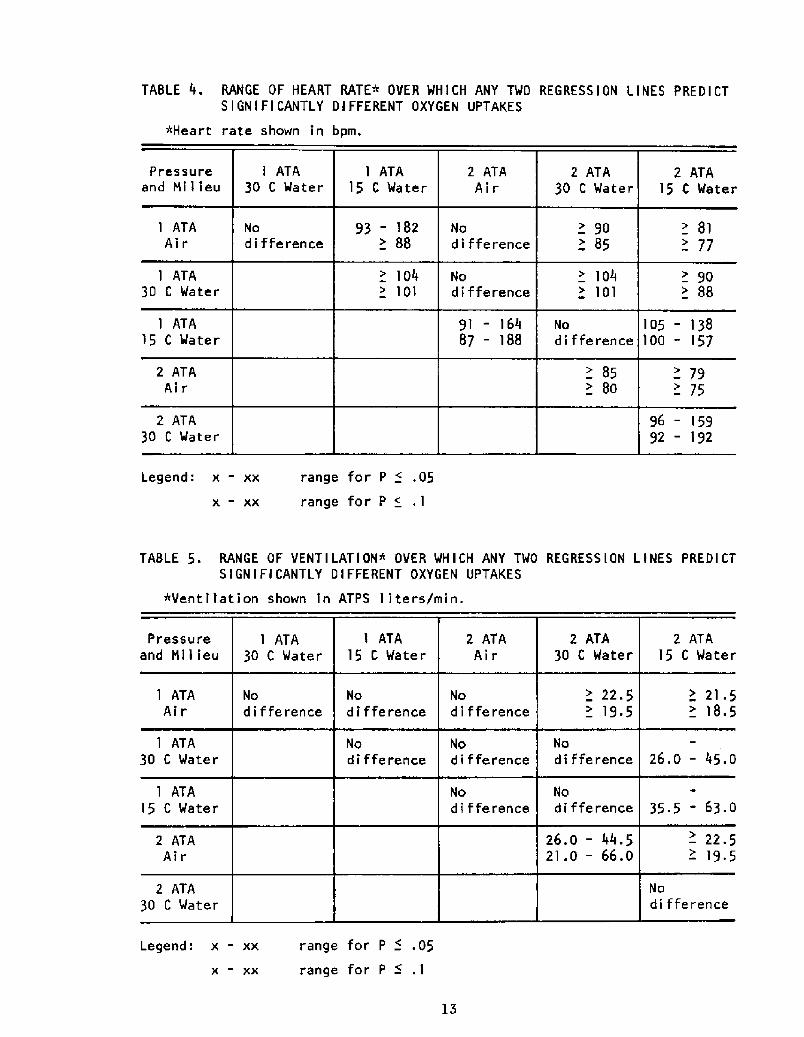
TABLE 4. RANGE OF HEART RATE* OVER WHICH ANY TWD REGRESSION LINES PREDICTS IGNIFI CANTLY DIFFERENT OXYGEN UPTAKES
*Heart rate shown in bpm.
TABLE 5. RANGE OF VENTILATION" OVER WHICH ANY TWO REGRESSION LINES PREDICTSIGNIFICANTLY DIFFERENT OXYGEN UPTAKES
>Vent i I at i on shown in ATPS I i ters/min.
Legend: x - xx range for P < .05
x - xx range for P < .I
13
Legend: x - xx
x XX
range for P ~ .05
range for P < . I
VO2 vs VE
In this case, the data Table 5! indicate that the relationship between4
VO and VE is relatively unaffected by pressure and affected by cold stress
to a lesser extent than the fh rel,ation.
Al veoIar PCO2
Since there has been some suggestion that divers retain C02, the alve-
olar PCO was estimated from the mixed expired PCO> using the Bohr equation,
with Radford's rule of thumb that the dead space in ml equals the body
weight in pounds. The results are tabulated by exercise category in Table
6, in which the three immersion conditions are pooled. By this method of
estimation, no evidence of C02 retention is seen.
Effects of Gas Densit and SCUBA Resistance
The effect of increased gas density and SCUBA airflow resistance were
tested by measuring MVV on a 13.5-liter bell spirometer and on SCUBA at 1
and 2 ATA. These data are presented in Table 7 in terms of the reduction
in MVV under each condition as a percentage of the MVV achieved on the spiro-
meter at 1 ATA.
14
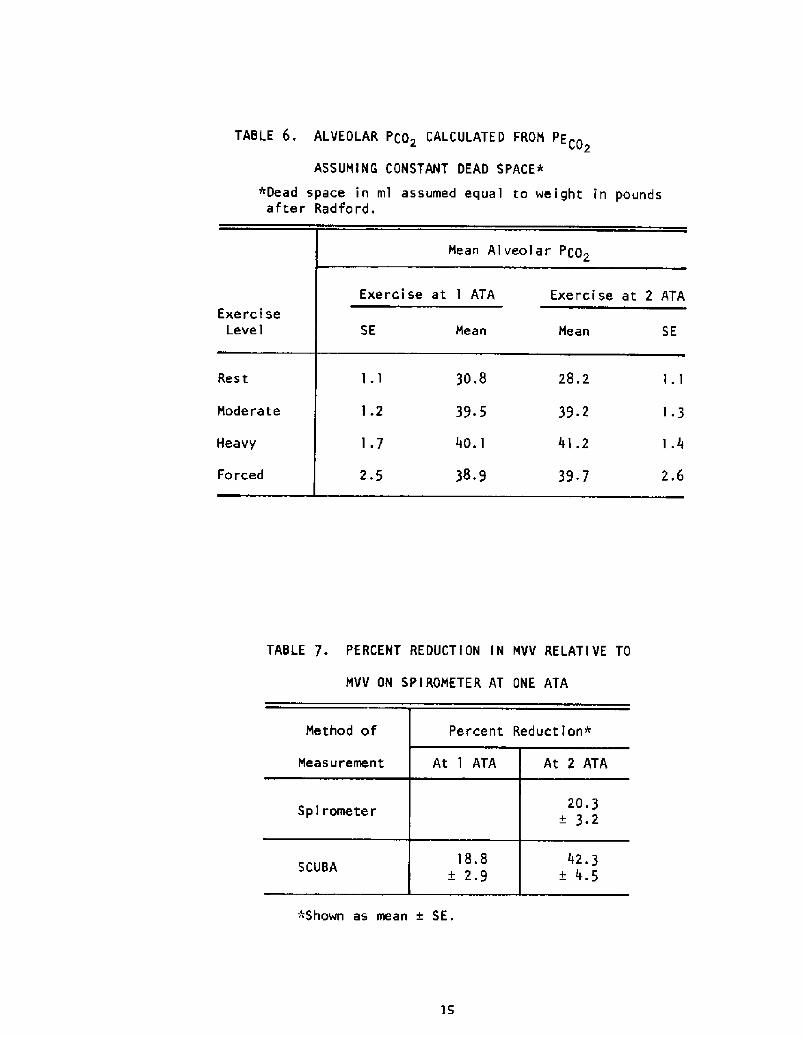
TABLE 6. ALVEOLAR PCO~ CALCULATED FROM PECOCOg
ASSUMING CONSTANT DEAD SPACE+
*Dead space in ml assumed equal to weight in poundsafter Radford,
TABLE 7. PERCENT REDUCTION IN MVV RELATIVE TO
MVV ON S P I ROMET E R AT ONE ATA
"Shown as mean + SE.
15

DISCUSS ION
VP vs fh
The major point of interest is the apparent divergence of the regres-
sion lines with cold stress and pressure, With respect to the calibration' ~
of Vp vs fh, the numerous and wide ranges of significant difference given2
in Table 4, together with the fairly consistent arrangement of the lines,
prompt the conclusion that these differences are real. The import of this
may be illustrated as follows: Suppose that a subj ect exercised at 2 ATA
The Vp predicted from the 1 ATA airin 15' water at an fh of 125 bpm.
16
data would be .69 liter/min lower than that predicted by the 2 ATA 15 C data,
This error is 38% of the 2 ATA value! and is significant practically as
well as statistically. Thus, estimating Vp> from fh under extreme condi-
tions is a very approximate procedure.
The reasons for the relative reduction in heart rate at a given Vp2
i,e., increasing 02/pulse! are controversial. However, it is known that
a cold bradycardia may be elicited in man, at least at rest �!, and that
the heart rate and respiratory responses accompanying a change in Vp2 vary
with the nature of the activity producing that change. The observed in-
creases in 02/pulse, then, may be due to a baro-receptor-mediated brady-
cardia due to peripheral vasoconstriction, or a direct bradycardia reflex
from cold receptors. It is also possible that the change in fh due to in-
creased thermogenesis with increasing cold stress may be disproportionately0
small compared with the change in V02 for reasons unrelated to the reflexes
suggested above. In any case, the present data show a resting bradycardia
in 30 C water compared with air at, both 1 and 2 ATA. The resting heart
rates in 15 C water are nearly identical with those in air at both pressures,
although the Vp>'s are twice as high in 15 C ~ater as in air,
One might expect that such a resting bradycardia would diminish with
time as the receptors accommodate, or that it would be overridden during
exercise. However, recent work on face-immersion breath-hold bradycardia
in our laboratory �2! has suggested that this type of fh response to cold
may be related to heat flux rather than just skin temperature. If this is
so, then an fh decrement due to cold exposure may be expected to remain
during exercise, since the heat flux then increases due to the reduction
in body insulation that accompanies increased muscle perfusion, as shown
dramatically by Keatinge 9!.
Thus, there may be at least two factors contributing to the observed
increases in 0~/pulse with increasing cold stress:
l. A cold bradycardia that persists during exercise.
2. A disproportionately small fh response to the thermogenic VO
increase.
The present data do not allow us to identify the mechanism.
The increased 0~/pulse at 2 ATA compared with the comparable immer-
sion condition at 1 ATA is also interesting. Taunton et al �5! have
reported a similar finding in subj ects breathing air at 2 ATA, and have
reported that the 0~/pulse increases even more while breathing pure 0~
at 2 ATA. Cook �!, who studied exercise in hyperbaric environments with-
out hyperoxia, found no change in O~/pulse in going to 2 ATA, and a sig-
nificant decrease in going to 3 ATA. Thus, it appears that the pressure-
related relative decrement in heart rate reported here is actually PO2
induced, presumably by peripheral chemoreceptors.
17
V0 vs VE2
In contrast to the VO va fh data, there are only four pairs of lines
for which significant differences exist at the .05 level. These are the
extreme cases, comparing exercise in air at 1 and 2 ATA with exercise in
30 C and 15 C water at 2 ATA Table 5! .
Interestingly, at any given level of VO , the range of VO estimated' ~
from VE over the range of conditions tested is less by a factor of 2 or 3
than the range of VO estimated from fh. The relative 1ack of variation2
with cold stress may be attributable to the fact that the VE response to a
thermogenic VO increase is quite similar to the VE response to a comparable2
exercise VO increase, as indicated by preliminary studies in our laboratory.2
The lack of any significant decrease in ventilatory equivalent for 02 VEO !
at 2 ATA, compared with the same condition of immersion at I ATA, is not
in agreement with previous reports. Both Taunton et al �5! and Cook �!,
for example, have reported substantial reductions in VE02 at 2 ATA. The
consistent arrangement of the regression lines suggests that the relative
decrement in VE at 2 ATA may be more real than the statistics indicate.
In any case, it seems reasonable to assume that increases in 02/pulse due
to cold or P0 ! would be accompanied by increases in A-V 02 difference and2
increased 02 extraCtion.
Alveolar P<02
Post-end-tidal alveolar samples were obtained at the ends of the rest
and exercise periods in an effort to estimate Pa . However, the highC02
VCO during exercise vitiated those estimates. Accordingly, the PACO was2 2
calculated as described in "Results", yielding the data shown in Table 6.
These results indicate no change in PACO with increasing exercise load or2
increasing pressure, and imply no C02 retention. However, these estimates
assumed that each subject's dead space was constant. There are reports
that dead space increases during exercise which would make our estimates
too low!, but this is quite controversial, for reasons summarized by
Bouhuys �!. We state only that, by our analysis, there is no reason to
suspect any significant CO~ retention in our subjects under the conditions
tested.
Effects of Gas Densit and SCUBA Resistance
The data of Table 7 show a 20% reduction in MVV at 2 ATA. Mid-
maximal expiratory flow also decreased about 20%, These results agree
with those of Maio and Farhi �0! on the effects of gas density. Table
7 also suggests that, within the experimental error, the effects of gas
density and SCUBA resistance are simply additive. This conclusion has
recently been questioned by Sterk �4!, and should be tested over wider
ranges of gas density and external resistance, since a knowledge of this
combined effect has practical importance.
19
CONCLUSIONS
It has been shown that the calibration of V02 vs fh varies appre-
ciably with cold stress and pressure, while the variation of the calibra-
tion of V0 va SE due to these factors is 2 to 3 times less. Therefore,
if surface equivalent estimation of Vp is to be used, ventilation is the2
predi ctor o f choi ce.
It should also be noted that for non-steady-state exercise, the V0
va fh calibration disintegrates altogether 8!, while the fast neurogenic
component �! of exercise hyperpnea makes it more feasible to follow in-
termittent work by measuring VE.
It is also worth noting that a diver's ventilation can be estimated
by recording tank pressure as a function of time, and that this pressure
can be measured free of artifacts due to motion or seawater conductivity.
Indeed, for closed-circuit SCVBA, the tank pressure decrement is a direct
measure of 02 consumption, since the oxygen supply is a tank of pure 0>.
For these reasons, it is recommended that attention be given to the
accurate measurement and telemetering of tank pressures, rather than heart
rate, as a solution to the problem of measuring the energy cost of under-
water work.
20
REFERENCES
l. Asmussen, E., and N.-G. Kristiansson. The diving bradycardia in
exercising man. Acta Ph siol Scand., 73:527-535, 1968.
2. Bouhuys, A. Respiratory dead space, in Handbook of Ph siolo
Section 3, Vol. I. Am. Physiol. Soc., Washington, D.C,, 1964.
3. Cook, J.C. Work capacity in hyperbaric environments without
4. Costill, D.L., P.J. Cahill and D. Eddy. Metabolic responses to
submaximal exercise in three water temperatures. J. A 1. Ph siol.,
22�!:628-632, 1967.
5. Craig, A.B., and M. Dvorak. Comparison of exercise in air and in
water of different temperatures. Med. 5 Sci. in S orts, lt'3!:
124-130, 1969.
6. O'Angelo, E., and G. Torelli. Neural stimuli increasing respiration
during different types of exercise. J. A 1. Ph siol., 30t'1!:116-
121, 1971.
7. Draper, N. R., and H, Smith. A lied Re ression Anal sis. John
Wiley 5 Sons, Inc., New York, 1966.
8. Gilbert, R., and J.H, Auchincloss. Comparison of cardiovascular
responses to steady- and unsteady-state exercise. J. A 1, Ph siol.,
30�!:388-393, 1971.
9. Keatinge, W.R. Survival in Cold Water. Blackwe11. Scientific
Publications, Oxford, 1969.
10. Maio, D, A., and L.E. Farhi. Effect of gas density on mechanics of
breathing. J. A 1. Ph siol., 23t'5!:687-693, 1967.
ll. Moore, T.O., E.M. Bernauer, G. Seto, Y.S. Park, S.K. Hong, and
E.M. Hayashi. Effect of immersion at different water temperatures
21
1404-1408, 1970.
12. Moore, T.O., D.A. Lally, and S.K. Hong. Apneic bradycardia in
man: Effect of temperature and depth of immersion. In press!
Proc. of 25th Con ress of Ph siolo ical Sciences Satellite
S osium: Recent Pro ress in Fundamental Ph siolo of Divin .
Marseille, 1971,
13. Snedecor, G.W., and W.G. Cochran. Statistical Methods, sixth
ed. Iowa State Univ. Press, Ames, Iowa, 1967.
14. Sterk, W, Effect of SCUBA diving on pulmonary compliance. In
press! Proc. of 25th Con ress of Ph siolo ical Sciences Satellite
S osium: Recent Pro ress in Fundamental Ph siolo of Divin .
Marseille, 1971.
15. Taunton, J.E., E.W. Banister, T.R. Patrick, P. Oforsagd, and W.R.
Duncan. Physical work capacity in hyperbaric environments and
conditions of hyperoxia. J. A 1. Ph siol., 28�!:421-427, 1970.
16. Weltman, G., and G.H. Egstrom. Heart rate and respiratory response
40 S!:479-483, 1969.
22


![H¶Q - Tsuru · 2020. 3. 26. · H ¶ Qw M O y ² \`h w º 0 q q< ¯w è qs {y À ¿px ~U [] A S | f] A UÔb](https://img.pdfslide.us/doc/110x75/611d07fd3dab4f25d75d774e/hq-tsuru-2020-3-26-h-qw-m-o-y-h-w-0-q-q-w-qs-y-.jpg)

![0 1 2 3 4 3 - . / 0 2 3 4 3 - . / 0 5 6 ( 7 * · _ m t [ a Q S \ W [ c } W S s O [ _ _ } Q [ O \ V O q f k y f n m l _ v q f d S W U e P O [ c g O ^ Z Q _ q ] | X O \ e Z q f k y](https://img.pdfslide.us/doc/110x75/5e6734f835d6a5640e267c77/0-1-2-3-4-3-0-2-3-4-3-0-5-6-7-m-t-a-q-s-w-c-w-s-s-o-.jpg)


![+ u A 48 M J A 6... · 2020. 4. 28. · © q i 0-á 0 á 0 %å 0 m ¢ ¥ Q ê0 © ½ ]!0 q i 0-á ] ©0 U = 10+y *E 0-á N u É é0 ¹ ± 0 á 0)- 0 ¥ U B U q ©0 $A-á Ñ0 © ,é0](https://img.pdfslide.us/doc/110x75/60a10f4288115c52484798c0/-u-a-48-m-j-a-6-2020-4-28-q-i-0-0-0-0-m-q-0.jpg)

![~ þP~ á þt 4 °sÀ 0 A±y è ^ ¢ ô ÿ Ê£z ó , q ^ ¢ Ê£U ¬ Ú^ `h {y å Sw sÄÀq`oxÛzÇÌè Ø ç Gq } ~ tzÝ Q È vZ .q¢ÛÇ a]æz£ ¼ Z .q]z Z .¢ G q 0 Þ]£èz«æ¤](https://img.pdfslide.us/doc/110x75/5e79432174a975306e3750de/-p-t-4-s-0-a-y-z-q-u-h-y.jpg)
![Fate of the Gods-score · 2020. 2. 11. · Fate of the Gods-score 1/24/06 8:30 AM p. 6 5157 - 6 - Picc. []! Y Y Y Q Q Q Q Q Q Q Q rit. Fl.!Y Y Y Q Q Q Q Q Q Q Q Ob.!Y Y Y Q Q Q Q](https://img.pdfslide.us/doc/110x75/60b389b4929e0c05c91c8c9f/fate-of-the-gods-score-2020-2-11-fate-of-the-gods-score-12406-830-am-p.jpg)
![+ t q Ë } M g · + t q Ë } M g ½ ½ ½ ½ ½ ½ ½ ½ üü ± r y ½ üü Ô ¦ y ½ +] k P V üü ; [ y P V k PV üü ÷ z . y $ üü F z õ y 0 P¡ üü G } z õ y 1 0¡ üü](https://img.pdfslide.us/doc/110x75/60258d5f392f575fed3aa70a/-t-q-m-g-t-q-m-g-r-y-.jpg)

![¢S Ø C {q H w M w] º...5TVSVHBTIJNBy ¢ S Ø C y Ç Ð F p{q H s© ~ {q H sr 0 Åt Ï{ 0 Å ðMù dXi^M Ðb Ð pb Ôùx ÏS ã tSÇ Ð F pw M SUK q H s© R M S y 0 ÅÇ w b Ï{q](https://img.pdfslide.us/doc/110x75/5fa3c2c285dafd35371dd759/s-c-q-h-w-m-w-5tvsvhbtijnby-s-c-y-f-pq-h-s-q-h-sr.jpg)