Embed Size (px)
Citation preview
Integrated Performance ReportOctober 2017
1
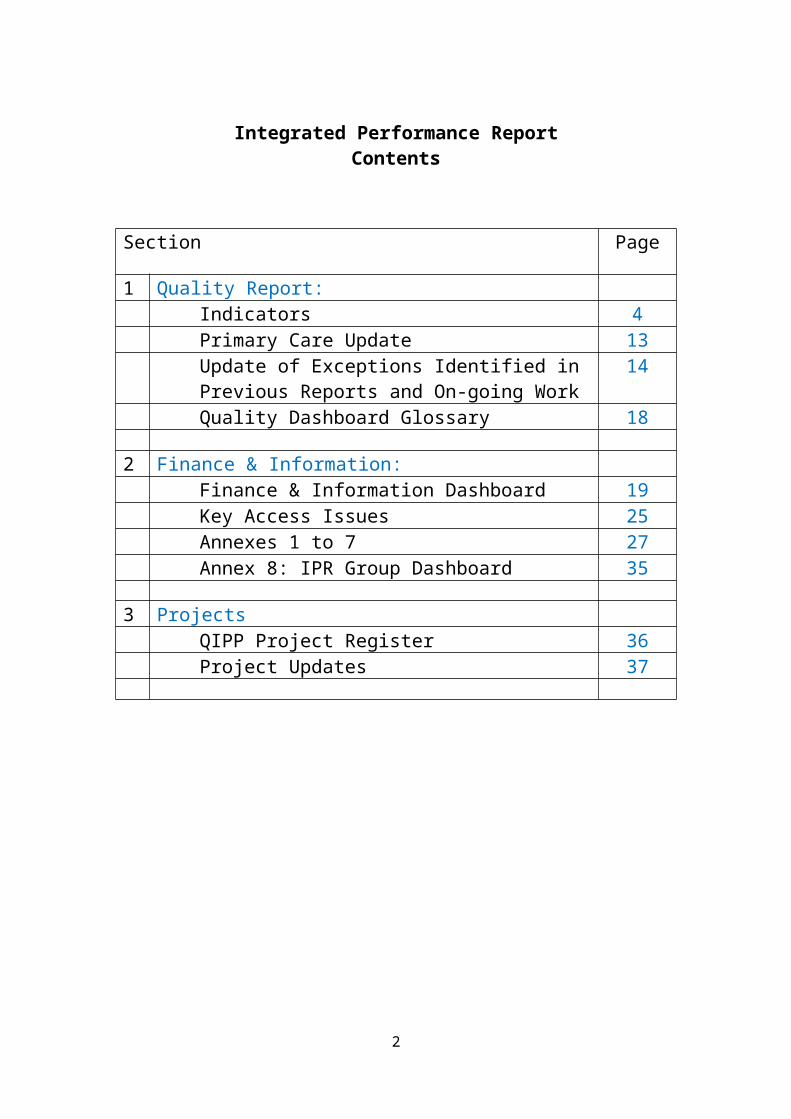
Integrated Performance ReportContents
Section Page
1 Quality Report:Indicators 4Primary Care Update 13Update of Exceptions Identified in Previous Reports and On-going Work
14
Quality Dashboard Glossary 18
2 Finance & Information:Finance & Information Dashboard 19Key Access Issues 25Annexes 1 to 7 27Annex 8: IPR Group Dashboard 35
3 ProjectsQIPP Project Register 36Project Updates 37
2
Wiltshire CCG Quality ReportOctober 2017
CCG Level IndicatorsCCG Level Indicators Reported by Exception
Provider Cohort Level IndicatorsProvider Cohort Level Indicators Reported by Exception
Provider Workforce Cohort Level IndicatorsProvider Workforce Cohort Level Indicators Reported by Exception
Primary Care –update
Update of Exceptions Identified in Previous Reports
Quality Dashboard Glossary
3
CCG Level Indicators
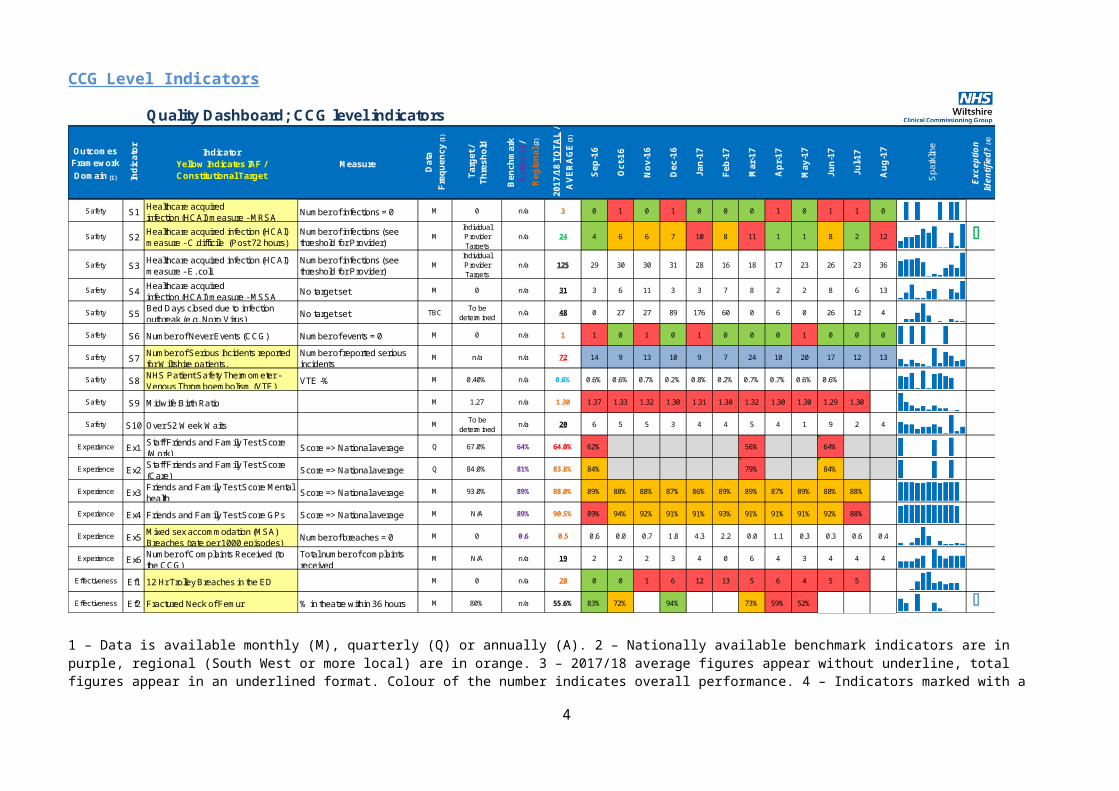
Quality Dashboard; CCG level indicators
Outcomes Framework Domain (1) In
dica
tor
IndicatorYellow Indicates IAF / Constitutional Target
Measure
Dat
aFr
eque
ncy
(1)
Targ
et /
Thre
shol
d
Ben
chm
ark
Nat
iona
l /
Reg
iona
l (2)
2017
/18
TOTA
L /
AVE
RA
GE
(3)
Sep-
16
Oct
-16
Nov
-16
Dec
-16
Jan-
17
Feb-
17
Mar
-17
Apr
-17
May
-17
Jun-
17
Jul-1
7
Aug
-17
Spa
rklin
e
Exce
ptio
n Id
entif
ied?
(4)
Safety S1 Healthcare acquiredinfection (HCAI) measure - MRSA Number of infections = 0 M 0 n/a 3 0 1 0 1 0 0 0 1 0 1 1 0
Safety S2 Healthcare acquired infection (HCAI) measure - C.difficile (Post 72 hours)
Number of infections (see threshold for Provider)
MIndividual Provider Targets
n/a 24 4 6 6 7 10 8 11 1 1 8 2 12 OSafety S3 Healthcare acquired infection (HCAI)
measure - E. coliNumber of infections (see threshold for Provider)
MIndividual Provider Targets
n/a 125 29 30 30 31 28 16 18 17 23 26 23 36
Safety S4Healthcare acquiredinfection (HCAI) measure - MSSA No target set M 0 n/a 31 3 6 11 3 3 7 8 2 2 8 6 13
Safety S5 Bed Days closed due to infection outbreak (e.g. Noro Virus) No target set TBC To be
determinedn/a 48 0 27 27 89 176 60 0 6 0 26 12 4
Safety S6 Number of Never Events (CCG) Number of events = 0 M 0 n/a 1 1 0 1 0 1 0 0 0 1 0 0 0
Safety S7 Number of Serious Incidents reported for Wiltshire patients.
Number of reported serious incidents
M n/a n/a 72 14 9 13 10 9 7 24 10 20 17 12 13
Safety S8 NHS Patient Safety Thermometer - Venous Thromboembolism (VTE) VTE -% M 0.40% n/a 0.6% 0.6% 0.6% 0.7% 0.2% 0.8% 0.2% 0.7% 0.7% 0.6% 0.6%
Safety S9 Midwife:Birth Ratio M 1.27 n/a 1.30 1.37 1.33 1.32 1.30 1.31 1.30 1.32 1.30 1.30 1.29 1.30
Safety S10 Over 52 Week Waits M To be determined
n/a 20 6 5 5 3 4 4 5 4 1 9 2 4
Experience Ex1 Staff Friends and Family Test Score (Work) Score => National average Q 67.0% 64% 64.0% 62% 56% 64%
Experience Ex2 Staff Friends and Family Test Score (Care) Score => National average Q 84.0% 81% 83.8% 84% 79% 84%
Experience Ex3 Friends and Family Test Score Mental health Score => National average M 93.0% 89% 88.0% 89% 88% 88% 87% 86% 89% 89% 87% 89% 88% 88%
Experience Ex4 Friends and Family Test Score GPs Score => National average M N/A 89% 90.5% 89% 94% 92% 91% 91% 93% 91% 91% 91% 92% 88%
Experience Ex5 Mixed sex accommodation (MSA) Breaches (rate per 1000 episodes) Number of breaches = 0 M 0 0.6 0.5 0.6 0.0 0.7 1.8 4.3 2.2 0.0 1.1 0.3 0.3 0.6 0.4
Experience Ex6 Number of Complaints Received (to the CCG)
Total number of complaints received
M N/A n/a 19 2 2 2 3 4 0 6 4 3 4 4 4
Effectiveness Ef1 12 Hr Trolley Breaches in the ED M 0 n/a 20 0 0 1 6 12 13 5 6 4 5 5
Effectiveness Ef2 Fractured Neck of Femur % in theatre within 36 hours M 80% n/a 55.6% 83% 72% 94% 73% 59% 52% O
1 – Data is available monthly (M), quarterly (Q) or annually (A). 2 – Nationally available benchmark indicators are in purple, regional (South West or more local) are in orange. 3 – 2017/18 average figures appear without underline, total figures appear in an underlined format. Colour of the number indicates overall performance. 4 – Indicators marked with a flag are reported in further detail below the dashboard (blue flags indicate that this has already been reported as an exception so will be covered in the Ongoing Exceptions Table). 5 - This data is only for Salisbury Foundation Trust.
4
CCG Level Indicators Reported by Exception
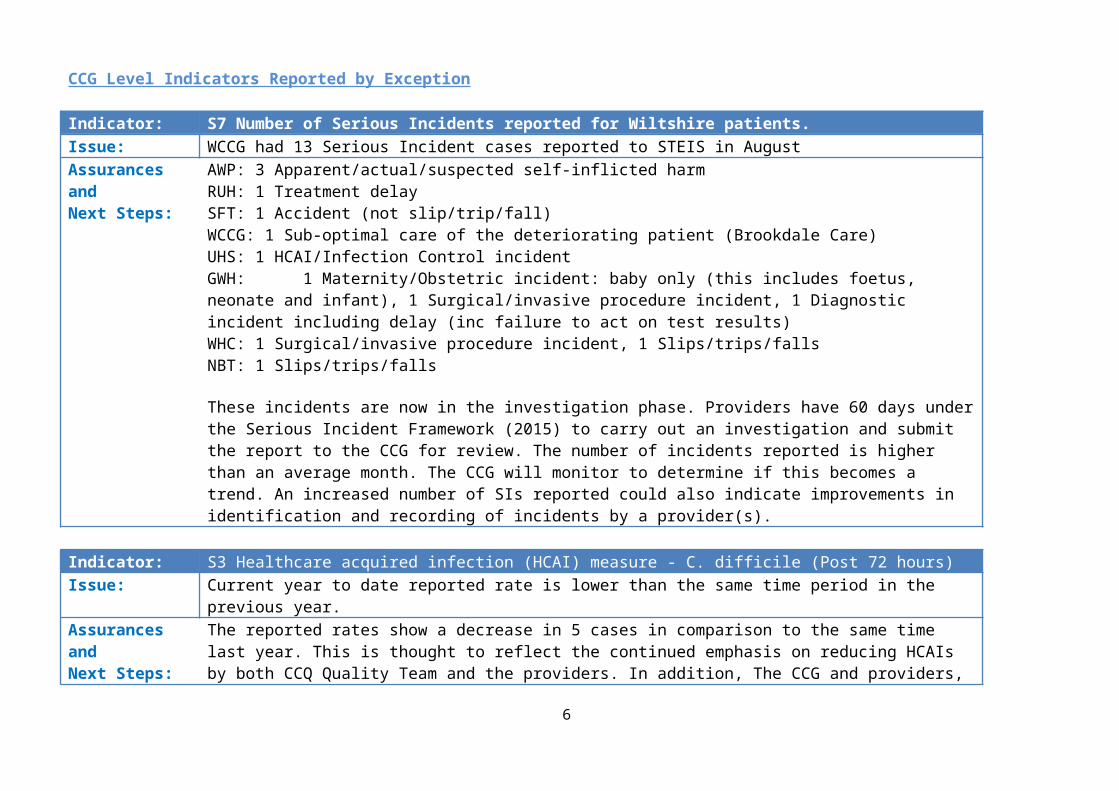
Indicator: S7 Number of Serious Incidents reported for Wiltshire patients.Issue: WCCG had 13 Serious Incident cases reported to STEIS in AugustAssurances andNext Steps:
AWP: 3 Apparent/actual/suspected self-inflicted harmRUH: 1 Treatment delaySFT: 1 Accident (not slip/trip/fall)WCCG: 1 Sub-optimal care of the deteriorating patient (Brookdale Care)UHS: 1 HCAI/Infection Control incidentGWH: 1 Maternity/Obstetric incident: baby only (this includes foetus, neonate and infant), 1 Surgical/invasive procedure incident, 1 Diagnostic incident including delay (inc failure to act on test results)WHC: 1 Surgical/invasive procedure incident, 1 Slips/trips/fallsNBT: 1 Slips/trips/falls
These incidents are now in the investigation phase. Providers have 60 days under the Serious Incident Framework (2015) to carry out an investigation and submit the report to the CCG for review. The number of incidents reported is higher than an average month. The CCG will monitor to determine if this becomes a trend. An increased number of SIs reported could also indicate improvements in identification and recording of incidents by a provider(s).
Indicator: S3 Healthcare acquired infection (HCAI) measure - C. difficile (Post 72 hours)Issue: Current year to date reported rate is lower than the same time period in the previous year.Assurances andNext Steps:
The reported rates show a decrease in 5 cases in comparison to the same time last year. This is thought to reflect the continued emphasis on reducing HCAIs by both CCQ Quality Team and the providers. In addition, The CCG and providers, including the Acute Trusts, are collaborating to improve antimicrobial stewardship (AMS) across the STP and deliver the Quality Premium targets linked to AMS.
It should be noted however, that the August figure indicates a considerable increase in the rate of C.diff reported. These are attributable to RUH and GWH, with SFT recording only 1 case. The Quality Team has sought assurance from the Trusts regarding their winter Infection Prevention and Control plans. Most of the plans have been received. All will be reviewed
5
Provider Cohort Indicators
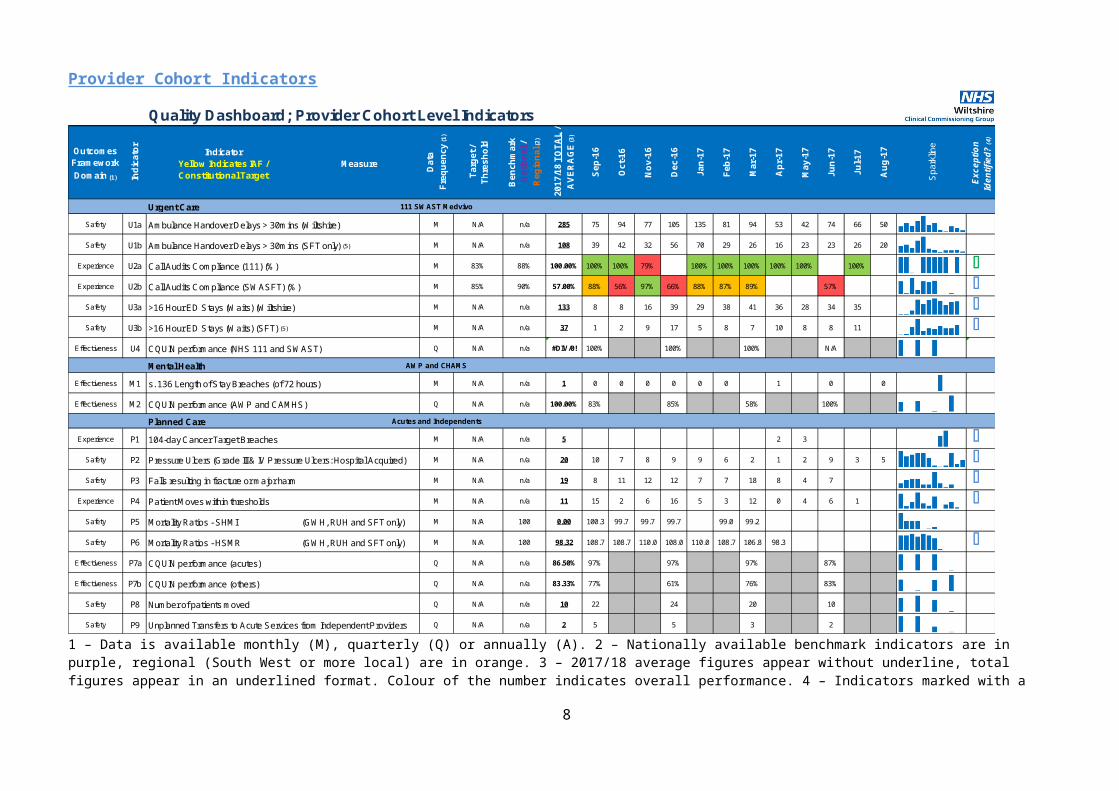
Quality Dashboard; Provider Cohort Level Indicators
Outcomes Framework Domain (1) In
dica
tor
IndicatorYellow Indicates IAF / Constitutional Target
Measure
Dat
aFr
eque
ncy
(1)
Targ
et /
Thre
shol
d
Ben
chm
ark
Nat
iona
l /
Reg
iona
l (2)
2017
/18
TOTA
L /
AVE
RA
GE
(3)
Sep-
16
Oct
-16
Nov
-16
Dec
-16
Jan-
17
Feb-
17
Mar
-17
Apr
-17
May
-17
Jun-
17
Jul-1
7
Aug
-17
Spa
rklin
e
Exce
ptio
n Id
entif
ied?
(4)
Urgent Care 111 SWAST Medvivo
Safety U1a Ambulance Handover Delays > 30mins (Wiltshire) M N/A n/a 285 75 94 77 105 135 81 94 53 42 74 66 50
Safety U1b Ambulance Handover Delays > 30mins (SFT only) (5) M N/A n/a 108 39 42 32 56 70 29 26 16 23 23 26 20
Experience U2a Call Audits Compliance (111) (%) M 83% 88% 100.00% 100% 100% 79% 100% 100% 100% 100% 100% 100% OExperience U2b Call Audits Compliance (SWASFT) (%) M 85% 90% 57.00% 88% 56% 97% 66% 88% 87% 89% 57% O
Safety U3a >16 Hour ED Stays (Waits) (Wiltshire) M N/A n/a 133 8 8 16 39 29 38 41 36 28 34 35 OSafety U3b >16 Hour ED Stays (Waits) (SFT) (5) M N/A n/a 37 1 2 9 17 5 8 7 10 8 8 11 O
Effectiveness U4 CQUIN performance (NHS 111 and SWAST) Q N/A n/a #DIV/0! 100% 100% 100% N/A
Mental Health AWP and CHAMS
Effectiveness M1 s. 136 Length of Stay Breaches (of 72 hours) M N/A n/a 1 0 0 0 0 0 0 1 0 0
Effectiveness M2 CQUIN performance (AWP and CAMHS) Q N/A n/a 100.00% 83% 85% 58% 100%
Planned Care Acutes and Independents
Experience P1 104-day Cancer Target Breaches M N/A n/a 5 0 0 0 0 0 0 0 2 3 OSafety P2 Pressure Ulcers (Grade III & IV Pressure Ulcers: Hospital Acquired) M N/A n/a 20 10 7 8 9 9 6 2 1 2 9 3 5 OSafety P3 Falls resulting in fracture or major harm M N/A n/a 19 8 11 12 12 7 7 18 8 4 7 O
Experience P4 Patient Moves within thresholds M N/A n/a 11 15 2 6 16 5 3 12 0 4 6 1 OSafety P5 Mortality Ratios - SHMI (GWH, RUH and SFT only) M N/A 100 0.00 100.3 99.7 99.7 99.7 99.0 99.2
Safety P6 Mortality Ratios - HSMR (GWH, RUH and SFT only) M N/A 100 98.32 108.7 108.7 110.0 108.0 110.0 108.7 106.8 98.3 OEffectiveness P7a CQUIN performance (acutes) Q N/A n/a 86.50% 97% 97% 97% 87%
Effectiveness P7b CQUIN performance (others) Q N/A n/a 83.33% 77% 61% 76% 83%
Safety P8 Q N/A n/a 10 22 24 20 10
Safety P9 Q N/A n/a 2 5 5 3 2
Number of patients moved
Unplanned Transfers to Acute Services from Independent Providers
1 – Data is available monthly (M), quarterly (Q) or annually (A). 2 – Nationally available benchmark indicators are in purple, regional (South West or more local) are in orange. 3 – 2017/18 average figures appear without underline, total figures appear in an underlined format. Colour of the number indicates overall performance. 4 – Indicators marked with a flag are reported in further detail below the dashboard (blue flags indicate that this has already been reported as an exception so will be covered in the Ongoing Exceptions Table). 5 - This data is only for Salisbury Foundation Trust.
6
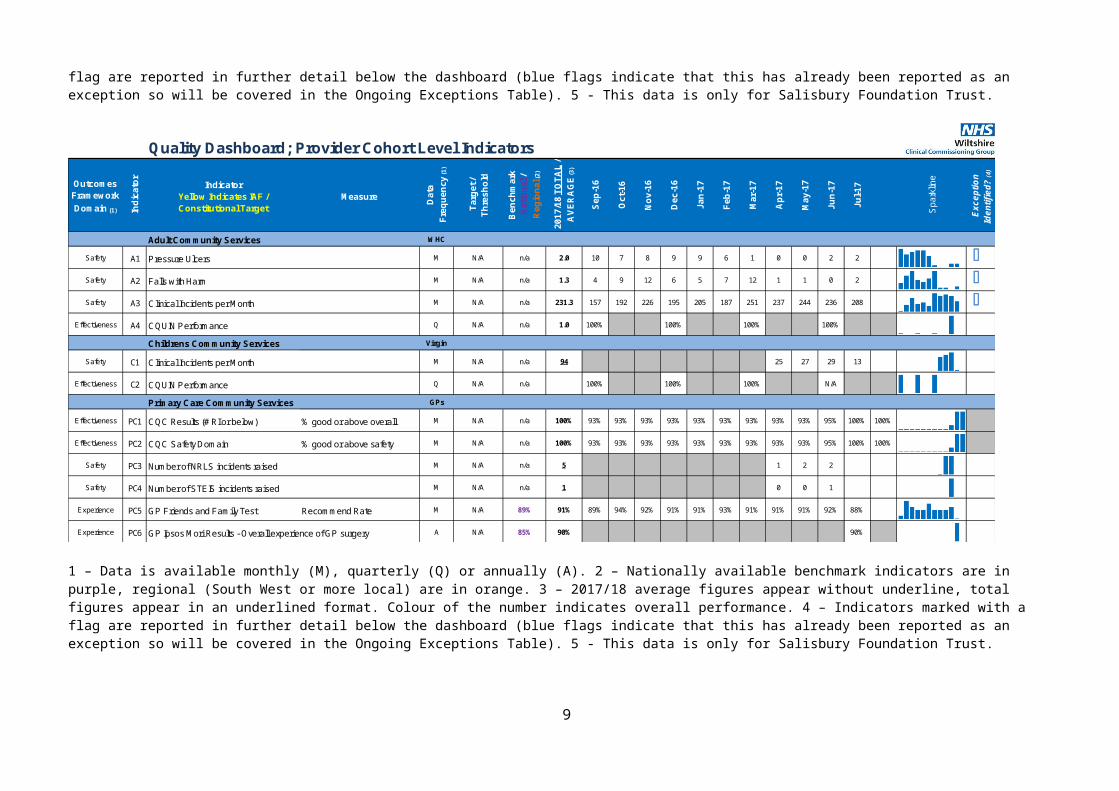
Quality Dashboard; Provider Cohort Level Indicators
Outcomes Framework Domain (1) In
dica
tor
IndicatorYellow Indicates IAF / Constitutional Target
Measure
Dat
aFr
eque
ncy
(1)
Targ
et /
Thre
shol
d
Ben
chm
ark
Nat
iona
l /
Reg
iona
l (2)
2017
/18
TOTA
L /
AVE
RA
GE
(3)
Sep-
16
Oct
-16
Nov
-16
Dec
-16
Jan-
17
Feb-
17
Mar
-17
Apr
-17
May
-17
Jun-
17
Jul-1
7
Spa
rklin
e
Exce
ptio
n Id
entif
ied?
(4)
Adult Community Services WHC
Safety A1 Pressure Ulcers M N/A n/a 2.0 10 7 8 9 9 6 1 0 0 2 2 OSafety A2 Falls with Harm M N/A n/a 1.3 4 9 12 6 5 7 12 1 1 0 2 OSafety A3 Clinical Incidents per Month M N/A n/a 231.3 157 192 226 195 205 187 251 237 244 236 208 O
Effectiveness A4 CQUIN Performance Q N/A n/a 1.0 100% 100% 100% 100%
Childrens Community Services Virgin
Safety C1 Clinical Incidents per Month M N/A n/a 94 25 27 29 13
Effectiveness C2 CQUIN Performance Q N/A n/a 100% 100% 100% N/A
Primary Care Community Services GPs
Effectiveness PC1 CQC Results (# RI or below) % good or above overall M N/A n/a 100% 93% 93% 93% 93% 93% 93% 93% 93% 93% 95% 100% 100%
Effectiveness PC2 CQC Safety Domain % good or above safety M N/A n/a 100% 93% 93% 93% 93% 93% 93% 93% 93% 93% 95% 100% 100%
Safety PC3 Number of NRLS incidents raised M N/A n/a 5 1 2 2
Safety PC4 Number of STEIS incidents raised M N/A n/a 1 0 0 1
Experience PC5 GP Friends and Family Test Recommend Rate M N/A 89% 91% 89% 94% 92% 91% 91% 93% 91% 91% 91% 92% 88%
Experience PC6 GP Ipsos Mori Results - Overall experience of GP surgery A N/A 85% 90% 90%
1 – Data is available monthly (M), quarterly (Q) or annually (A). 2 – Nationally available benchmark indicators are in purple, regional (South West or more local) are in orange. 3 – 2017/18 average figures appear without underline, total figures appear in an underlined format. Colour of the number indicates overall performance. 4 – Indicators marked with a flag are reported in further detail below the dashboard (blue flags indicate that this has already been reported as an exception so will be covered in the Ongoing Exceptions Table). 5 - This data is only for Salisbury Foundation Trust.
7
Provider Cohort Indicators Reported by Exception
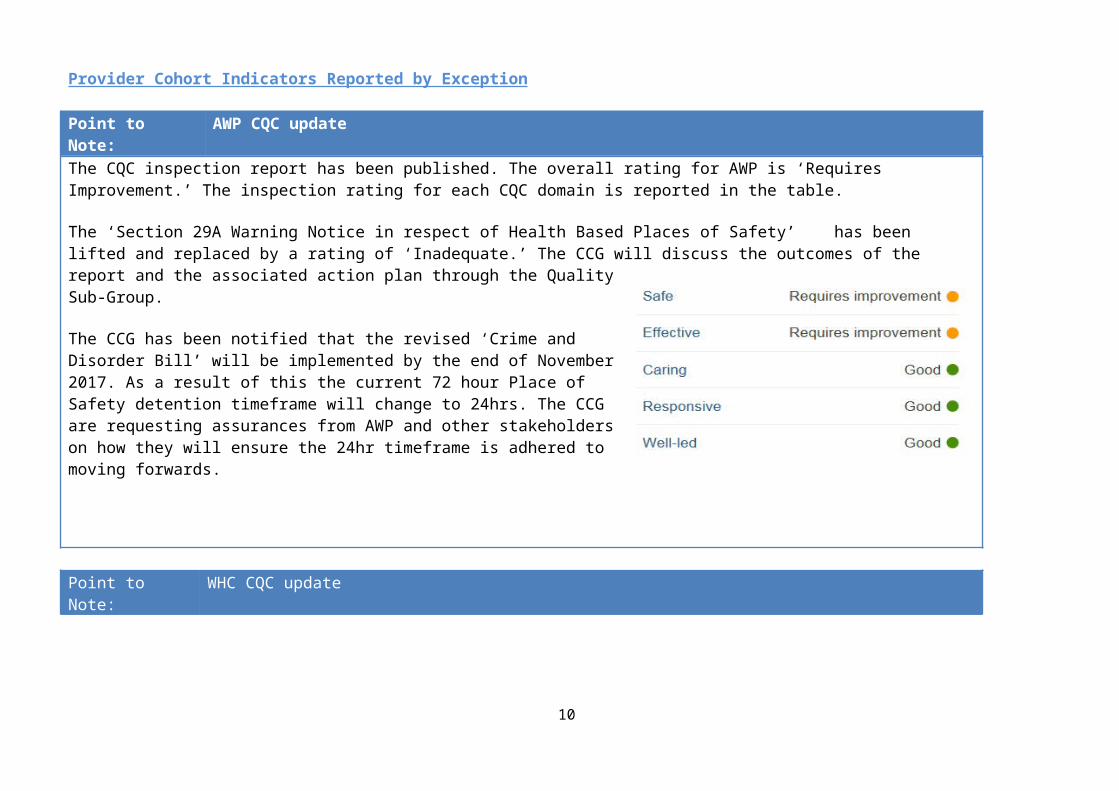
Point to Note: AWP CQC updateThe CQC inspection report has been published. The overall rating for AWP is ‘Requires Improvement.’ The inspection rating for each CQC domain is reported in the table.
The ‘Section 29A Warning Notice in respect of Health Based Places of Safety’ has been lifted and replaced by a rating of ‘Inadequate.’ The CCG will discuss the outcomes of the report and the associated action plan through the Quality Sub-Group.
The CCG has been notified that the revised ‘Crime and Disorder Bill’ will be implemented by the end of November 2017. As a result of this the current 72 hour Place of Safety detention timeframe will change to 24hrs. The CCG are requesting assurances from AWP and other stakeholders on how they will ensure the 24hr timeframe is adhered to moving forwards.
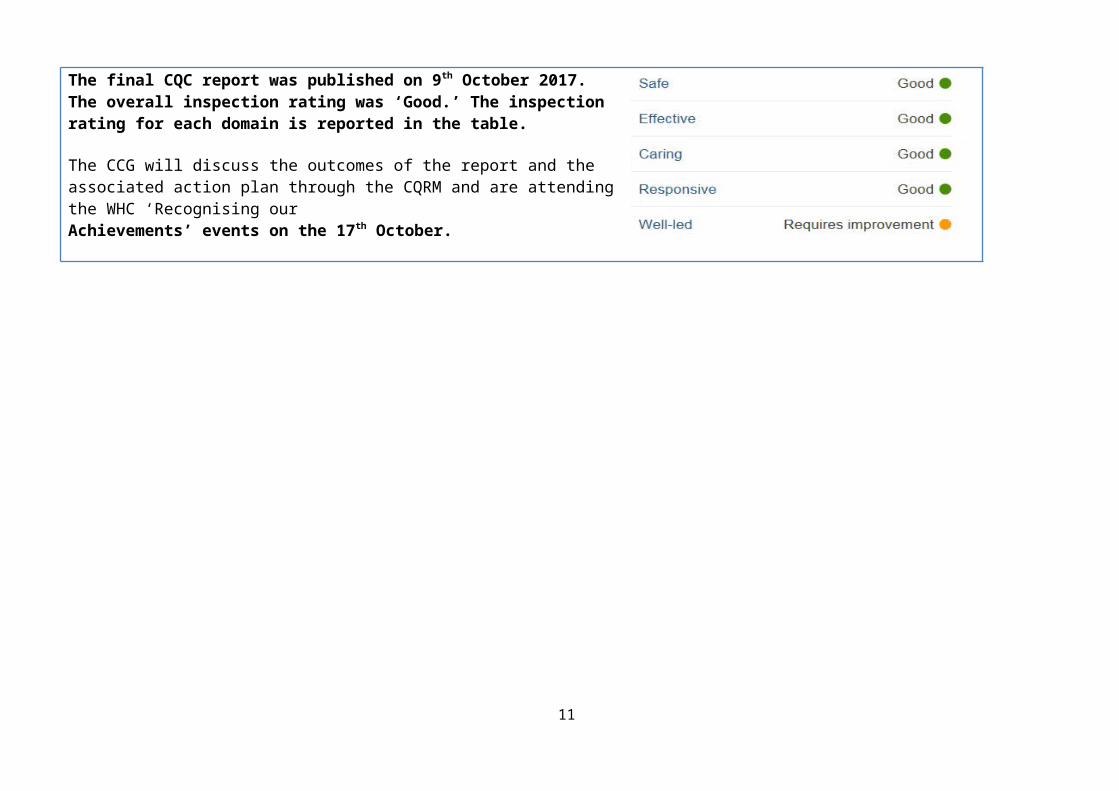
Point to Note: WHC CQC updateThe final CQC report was published on 9th October 2017. The overall inspection rating was ‘Good.’ The inspection rating for each domain is reported in the table.
The CCG will discuss the outcomes of the report and the associated action plan through the CQRM and are attending the WHC ‘Recognising ourAchievements’ events on the 17th October.
8
Point to Note: WCCG Influenza and Winter Escalation PlansWiltshire CCG and the STP in conjunction with Gloucestershire are preparing for the oncoming flu season, given the apparent increased likelihood that the 17/18 flu season will be of increased activity. Wiltshire CCG aim to improve patient safety and experience in relation to influenza and reduce the incidence of influenza and influenza outbreaks across the Wiltshire healthcare landscape by formulating a robust plan to ensure clear and effective routes of communication, prevention and support to providers during periods of increased activity and outbreaks.
9
Provider Workforce Cohort Level Indicators
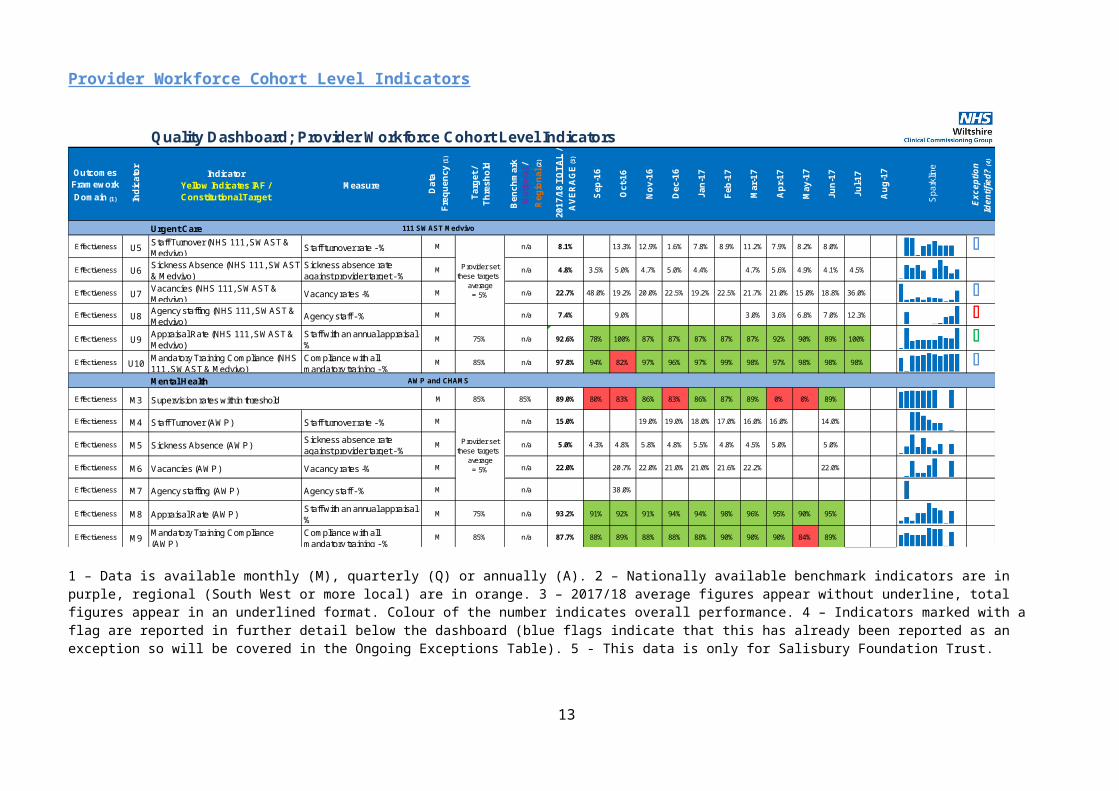
Quality Dashboard; Provider Workforce Cohort Level Indicators
Outcomes Framework Domain (1) In
dica
tor
IndicatorYellow Indicates IAF / Constitutional Target
Measure
Dat
aFr
eque
ncy
(1)
Targ
et /
Thre
shol
d
Ben
chm
ark
Nat
iona
l /
Reg
iona
l (2)
2017
/18
TOTA
L /
AVE
RA
GE
(3)
Sep-
16
Oct
-16
Nov
-16
Dec
-16
Jan-
17
Feb-
17
Mar
-17
Apr
-17
May
-17
Jun-
17
Jul-1
7
Aug
-17
Spa
rklin
e
Exce
ptio
n Id
entif
ied?
(4)
Urgent Care 111 SWAST Medvivo
Effectiveness U5 Staff Turnover (NHS 111, SWAST & Medvivo) Staff turnover rate - % M n/a 8.1% 13.3% 12.9% 1.6% 7.8% 8.9% 11.2% 7.9% 8.2% 8.0% O
Effectiveness U6 Sickness Absence (NHS 111, SWAST & Medvivo)
Sickness absence rate against provider target - %
M n/a 4.8% 3.5% 5.0% 4.7% 5.0% 4.4% 4.7% 5.6% 4.9% 4.1% 4.5%
Effectiveness U7 Vacancies (NHS 111, SWAST & Medvivo) Vacancy rates -% M n/a 22.7% 48.0% 19.2% 20.0% 22.5% 19.2% 22.5% 21.7% 21.0% 15.0% 18.8% 36.0% O
Effectiveness U8 Agency staffing (NHS 111, SWAST & Medvivo) Agency staff - % M n/a 7.4% 9.0% 3.0% 3.6% 6.8% 7.0% 12.3% O
Effectiveness U9 Appraisal Rate (NHS 111, SWAST & Medvivo)
Staff with an annual appraisal - %
M 75% n/a 92.6% 78% 100% 87% 87% 87% 87% 87% 92% 90% 89% 100% OEffectiveness U10 Mandatory Training Compliance (NHS
111, SWAST & Medvivo)Compliance with all mandatory training - %
M 85% n/a 97.8% 94% 82% 97% 96% 97% 99% 98% 97% 98% 98% 98% OMental Health AWP and CHAMS
Effectiveness M3 Supervision rates within threshold M 85% 85% 89.0% 80% 83% 86% 83% 86% 87% 89% 0% 0% 89%
Effectiveness M4 Staff Turnover (AWP) Staff turnover rate - % M n/a 15.0% 19.0% 19.0% 18.0% 17.0% 16.0% 16.0% 14.0%
Effectiveness M5 Sickness Absence (AWP) Sickness absence rate against provider target - %
M n/a 5.0% 4.3% 4.8% 5.8% 4.8% 5.5% 4.8% 4.5% 5.0% 5.0%
Effectiveness M6 Vacancies (AWP) Vacancy rates -% M n/a 22.0% 20.7% 22.0% 21.0% 21.0% 21.6% 22.2% 22.0%
Effectiveness M7 Agency staffing (AWP) Agency staff - % M n/a 38.0%
Effectiveness M8 Appraisal Rate (AWP) Staff with an annual appraisal - %
M 75% n/a 93.2% 91% 92% 91% 94% 94% 98% 96% 95% 90% 95%
Effectiveness M9 Mandatory Training Compliance (AWP)
Compliance with all mandatory training - %
M 85% n/a 87.7% 88% 89% 88% 88% 88% 90% 90% 90% 84% 89%
Provider set these targets -
average = 5%
Provider set these targets -
average = 5%
1 – Data is available monthly (M), quarterly (Q) or annually (A). 2 – Nationally available benchmark indicators are in purple, regional (South West or more local) are in orange. 3 – 2017/18 average figures appear without underline, total figures appear in an underlined format. Colour of the number indicates overall performance. 4 – Indicators marked with a flag are reported in further detail below the dashboard (blue flags indicate that this has already been reported as an exception so will be covered in the Ongoing Exceptions Table). 5 - This data is only for Salisbury Foundation Trust.
10
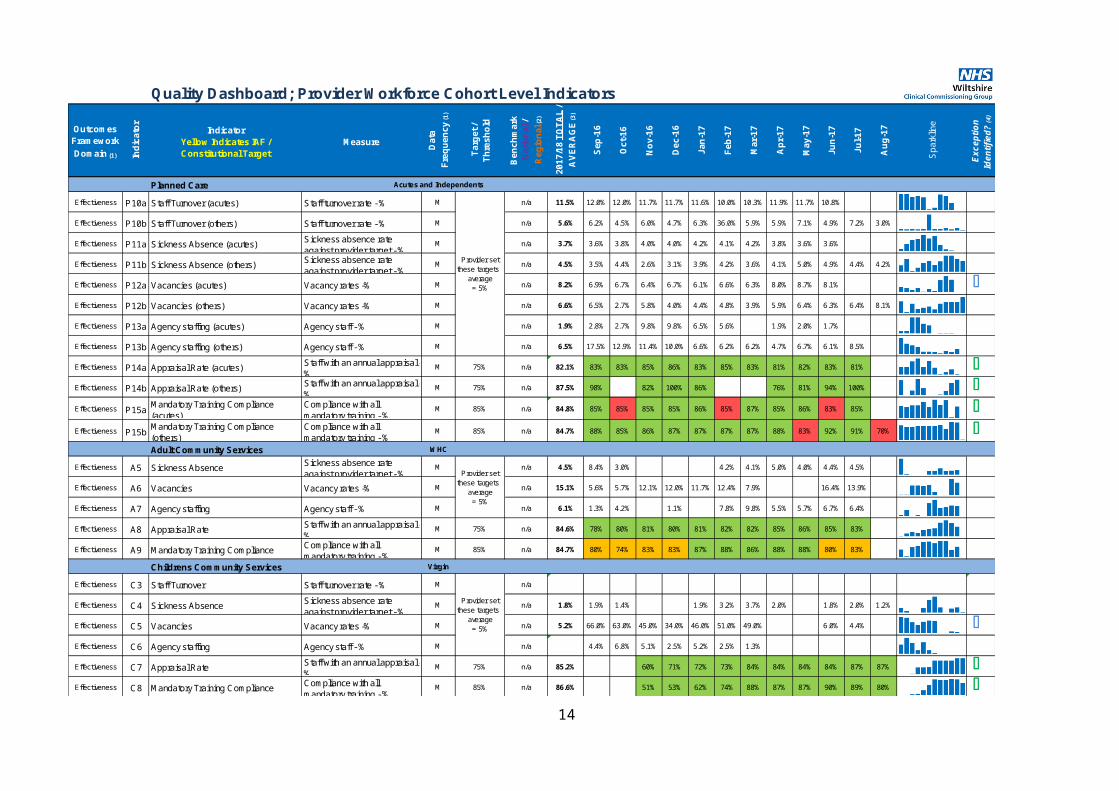
Quality Dashboard; Provider Workforce Cohort Level Indicators
Outcomes Framework Domain (1) In
dica
tor
IndicatorYellow Indicates IAF / Constitutional Target
Measure
Dat
aFr
eque
ncy
(1)
Targ
et /
Thre
shol
d
Ben
chm
ark
Nat
iona
l /
Reg
iona
l (2)
2017
/18
TOTA
L /
AVE
RA
GE
(3)
Sep-
16
Oct
-16
Nov
-16
Dec
-16
Jan-
17
Feb-
17
Mar
-17
Apr
-17
May
-17
Jun-
17
Jul-1
7
Aug
-17
Spa
rklin
e
Exce
ptio
n Id
entif
ied?
(4)
Planned Care Acutes and Independents
Effectiveness P10a Staff Turnover (acutes) Staff turnover rate - % M n/a 11.5% 12.0% 12.0% 11.7% 11.7% 11.6% 10.0% 10.3% 11.9% 11.7% 10.8%
Effectiveness P10b Staff Turnover (others) Staff turnover rate - % M n/a 5.6% 6.2% 4.5% 6.0% 4.7% 6.3% 36.0% 5.9% 5.9% 7.1% 4.9% 7.2% 3.0%
Effectiveness P11a Sickness Absence (acutes) Sickness absence rate against provider target - %
M n/a 3.7% 3.6% 3.8% 4.0% 4.0% 4.2% 4.1% 4.2% 3.8% 3.6% 3.6%
Effectiveness P11b Sickness Absence (others) Sickness absence rate against provider target - %
M n/a 4.5% 3.5% 4.4% 2.6% 3.1% 3.9% 4.2% 3.6% 4.1% 5.0% 4.9% 4.4% 4.2%
Effectiveness P12a Vacancies (acutes) Vacancy rates -% M n/a 8.2% 6.9% 6.7% 6.4% 6.7% 6.1% 6.6% 6.3% 8.0% 8.7% 8.1% OEffectiveness P12b Vacancies (others) Vacancy rates -% M n/a 6.6% 6.5% 2.7% 5.8% 4.0% 4.4% 4.8% 3.9% 5.9% 6.4% 6.3% 6.4% 8.1%
Effectiveness P13a Agency staffing (acutes) Agency staff - % M n/a 1.9% 2.8% 2.7% 9.8% 9.8% 6.5% 5.6% 1.9% 2.0% 1.7%
Effectiveness P13b Agency staffing (others) Agency staff - % M n/a 6.5% 17.5% 12.9% 11.4% 10.0% 6.6% 6.2% 6.2% 4.7% 6.7% 6.1% 8.5%
Effectiveness P14a Appraisal Rate (acutes) Staff with an annual appraisal - %
M 75% n/a 82.1% 83% 83% 85% 86% 83% 85% 83% 81% 82% 83% 81% OEffectiveness P14b Appraisal Rate (others) Staff with an annual appraisal -
%M 75% n/a 87.5% 98% 82% 100% 86% 76% 81% 94% 100% O
Effectiveness P15a Mandatory Training Compliance (acutes)
Compliance with all mandatory training - %
M 85% n/a 84.8% 85% 85% 85% 85% 86% 85% 87% 85% 86% 83% 85% OEffectiveness P15b Mandatory Training Compliance
(others)Compliance with all mandatory training - %
M 85% n/a 84.7% 88% 85% 86% 87% 87% 87% 87% 88% 83% 92% 91% 70% OAdult Community Services WHC
Effectiveness A5 Sickness Absence Sickness absence rate against provider target - %
M n/a 4.5% 8.4% 3.0% 4.2% 4.1% 5.0% 4.0% 4.4% 4.5%
Effectiveness A6 Vacancies Vacancy rates -% M n/a 15.1% 5.6% 5.7% 12.1% 12.0% 11.7% 12.4% 7.9% 16.4% 13.9%
Effectiveness A7 Agency staffing Agency staff - % M n/a 6.1% 1.3% 4.2% 1.1% 7.8% 9.8% 5.5% 5.7% 6.7% 6.4%
Effectiveness A8 Appraisal Rate Staff with an annual appraisal - %
M 75% n/a 84.6% 78% 80% 81% 80% 81% 82% 82% 85% 86% 85% 83%
Effectiveness A9 Mandatory Training Compliance Compliance with all mandatory training - %
M 85% n/a 84.7% 80% 74% 83% 83% 87% 88% 86% 88% 88% 80% 83%
Childrens Community Services Virgin
Effectiveness C3 Staff Turnover Staff turnover rate - % M n/a #DIV/0! Not Av.
Effectiveness C4 Sickness Absence Sickness absence rate against provider target - %
M n/a 1.8% 1.9% 1.4% 1.9% 3.2% 3.7% 2.0% 1.8% 2.0% 1.2%
Effectiveness C5 Vacancies Vacancy rates -% M n/a 5.2% 66.0% 63.0% 45.0% 34.0% 46.0% 51.0% 49.0% 0.0% 0.0% 6.0% 4.4% OEffectiveness C6 Agency staffing Agency staff - % M n/a 0.0% 4.4% 6.8% 5.1% 2.5% 5.2% 2.5% 1.3%
Effectiveness C7 Appraisal Rate Staff with an annual appraisal - %
M 75% n/a 85.2% 60% 71% 72% 73% 84% 84% 84% 84% 87% 87% OEffectiveness C8 Mandatory Training Compliance Compliance with all
mandatory training - %M 85% n/a 86.6% 51% 53% 62% 74% 88% 87% 87% 90% 89% 80% O
Provider set these targets -
average = 5%
Provider set these targets -
average = 5%
Provider set these targets -
average = 5%
11
1 – Data is available monthly (M), quarterly (Q) or annually (A). 2 – Nationally available benchmark indicators are in purple, regional (South West or more local) are in orange. 3 – 2017/18 average figures appear without underline, total figures appear in an underlined format. Colour of the number indicates overall performance. 4 – Indicators marked with a flag are reported in further detail below the dashboard (blue flags indicate that this has already been reported as an exception so will be covered in the Ongoing Exceptions Table). 5 - This data is only for Salisbury Foundation Trust.
Provider Workforce Cohort Indicators Reported by Exception
Indicator: A9 – Mandatory Training ComplianceIssue: WHC reporting Amber for this indicator at 83% (95% target).Assurances andNext Steps:
WHC have reported that there are 92.5% of staff available to complete training due to long term sickness and maternity leave. WHC have confirmed they will be instigating performance and finance meetings, where training compliance is reviewed and any associated actions are put in place. This will be monitored monthly through the CQRM.
12
Primary Care – update
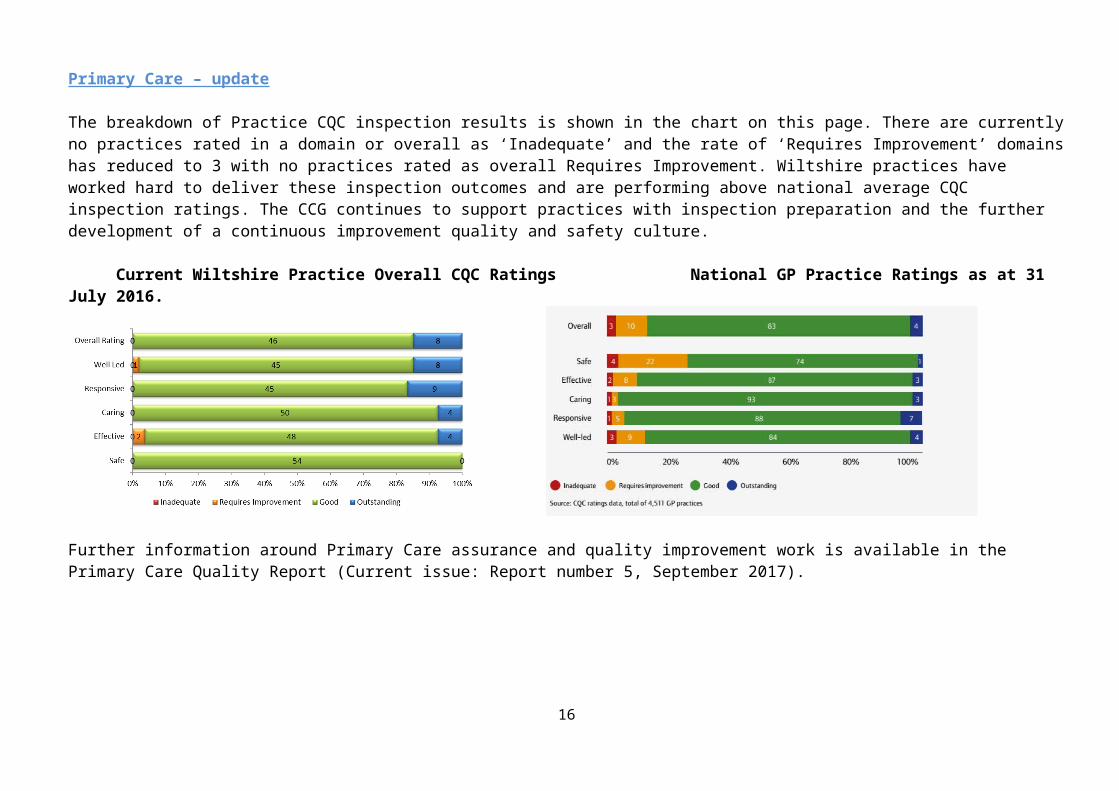
The breakdown of Practice CQC inspection results is shown in the chart on this page. There are currently no practices rated in a domain or overall as ‘Inadequate’ and the rate of ‘Requires Improvement’ domains has reduced to 3 with no practices rated as overall Requires Improvement. Wiltshire practices have worked hard to deliver these inspection outcomes and are performing above national average CQC inspection ratings. The CCG continues to support practices with inspection preparation and the further development of a continuous improvement quality and safety culture.
Current Wiltshire Practice Overall CQC Ratings National GP Practice Ratings as at 31 July 2016.
Further information around Primary Care assurance and quality improvement work is available in the Primary Care Quality Report (Current issue: Report number 5, September 2017).
13
Update of Exceptions Identified in Previous Reports and On-going Work
This section includes information on previously reported exceptions as appropriate and if the identified issue is not resolved and reported in the dashboard within the anticipated time frame.
This is the second publication of this revised reporting format. It is expected that entries on this log will increase over time and a blue flag symbol has been introduced to the dashboard to indicate where indicators are included within this section.
Indicator Provider Action Target Date Responsibility Expected
Outcome Progress to date Date Completed
Reduction in Urinary Tract Infections and Gram Negative Blood Stream infections
Across STP
Collection, and analysis of E-Coli BSI data inform next steps of project steps
03/2018
STP CCG and all Providers (CT as Manager with IP&C lead)
Reduction of at least 10% in gram-negative blood stream infections and urinary tract infections
STP meeting held Decision made to
focus on reducing UTI and Wound infection
Data review on-going
Ongoing
Ef2 Fractured Neck of Femur - Some providers have not reported the % of fractured neck of femur (% in theatre in 36 hours).
All
The quality team will raise this with the providers who have not reported to ensure data is available moving forwards.
October 2017
Main providers (FB as contract lead)
Information to be reported in the monthly quality reports going forward.
SFT #NOF to theatre times in less than 36 hours are decreasing. Aiming for >80% in trajectory plan for improvement but achieved 75% in August. For further discussion at the Quality meetingRUH are above their 80% threshold with 83% of #NOF’s being operated on within 36 hours.GWH show an improvement in August of 90% of patients with #NOF going to theatre within 36 hours.
Ongoing
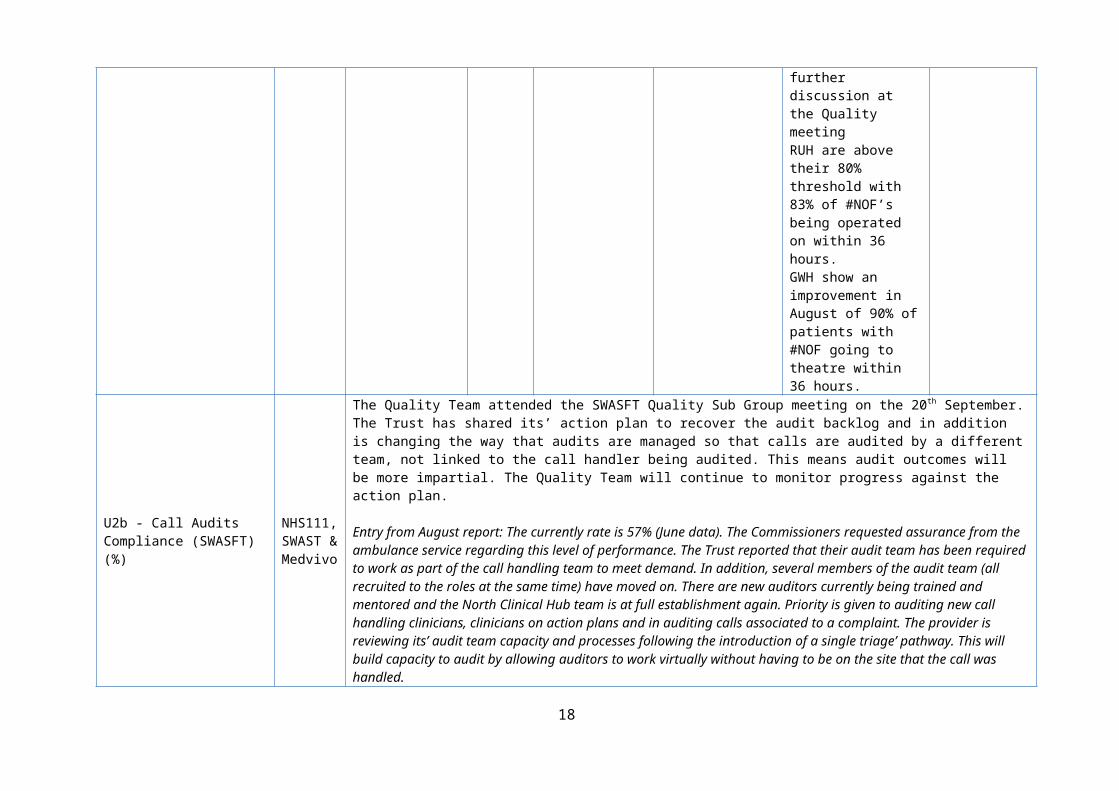
U2b - Call Audits NHS111, The Quality Team attended the SWASFT Quality Sub Group meeting on the 20th September. The Trust has shared
14
Compliance (SWASFT) (%)SWAST & Medvivo
its’ action plan to recover the audit backlog and in addition is changing the way that audits are managed so that calls are audited by a different team, not linked to the call handler being audited. This means audit outcomes will be more impartial. The Quality Team will continue to monitor progress against the action plan.
Entry from August report: The currently rate is 57% (June data). The Commissioners requested assurance from the ambulance service regarding this level of performance. The Trust reported that their audit team has been required to work as part of the call handling team to meet demand. In addition, several members of the audit team (all recruited to the roles at the same time) have moved on. There are new auditors currently being trained and mentored and the North Clinical Hub team is at full establishment again. Priority is given to auditing new call handling clinicians, clinicians on action plans and in auditing calls associated to a complaint. The provider is reviewing its’ audit team capacity and processes following the introduction of a single triage’ pathway. This will build capacity to audit by allowing auditors to work virtually without having to be on the site that the call was handled.
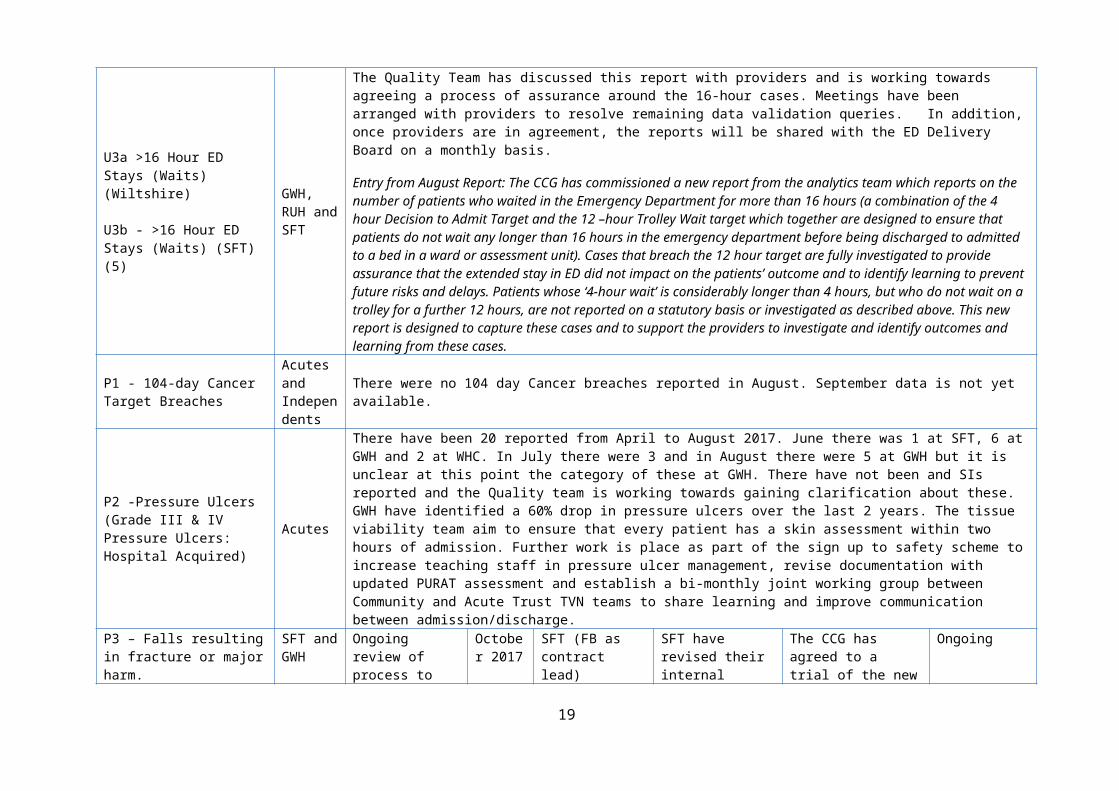
U3a >16 Hour ED Stays (Waits) (Wiltshire)
U3b - >16 Hour ED Stays (Waits) (SFT) (5)
GWH, RUH and SFT
The Quality Team has discussed this report with providers and is working towards agreeing a process of assurance around the 16-hour cases. Meetings have been arranged with providers to resolve remaining data validation queries. In addition, once providers are in agreement, the reports will be shared with the ED Delivery Board on a monthly basis.
Entry from August Report: The CCG has commissioned a new report from the analytics team which reports on the number of patients who waited in the Emergency Department for more than 16 hours (a combination of the 4 hour Decision to Admit Target and the 12 –hour Trolley Wait target which together are designed to ensure that patients do not wait any longer than 16 hours in the emergency department before being discharged to admitted to a bed in a ward or assessment unit). Cases that breach the 12 hour target are fully investigated to provide assurance that the extended stay in ED did not impact on the patients’ outcome and to identify learning to prevent future risks and delays. Patients whose ‘4-hour wait’ is considerably longer than 4 hours, but who do not wait on a trolley for a further 12 hours, are not reported on a statutory basis or investigated as described above. This new report is designed to capture these cases and to support the providers to investigate and identify outcomes and learning from these cases.
P1 - 104-day Cancer Target Breaches
Acutes and Independents
There were no 104 day Cancer breaches reported in August. September data is not yet available.
P2 -Pressure Ulcers (Grade III & IV Pressure Ulcers: Hospital Acquired)
Acutes
There have been 20 reported from April to August 2017. June there was 1 at SFT, 6 at GWH and 2 at WHC. In July there were 3 and in August there were 5 at GWH but it is unclear at this point the category of these at GWH. There have not been and SIs reported and the Quality team is working towards gaining clarification about these.GWH have identified a 60% drop in pressure ulcers over the last 2 years. The tissue viability team aim to ensure that every patient has a skin assessment within two hours of admission. Further work is place as part of the sign up to safety scheme to increase teaching staff in pressure ulcer management, revise documentation with updated PURAT assessment and establish a bi-monthly joint working group between Community and Acute Trust TVN teams to share learning and improve communication between admission/discharge.
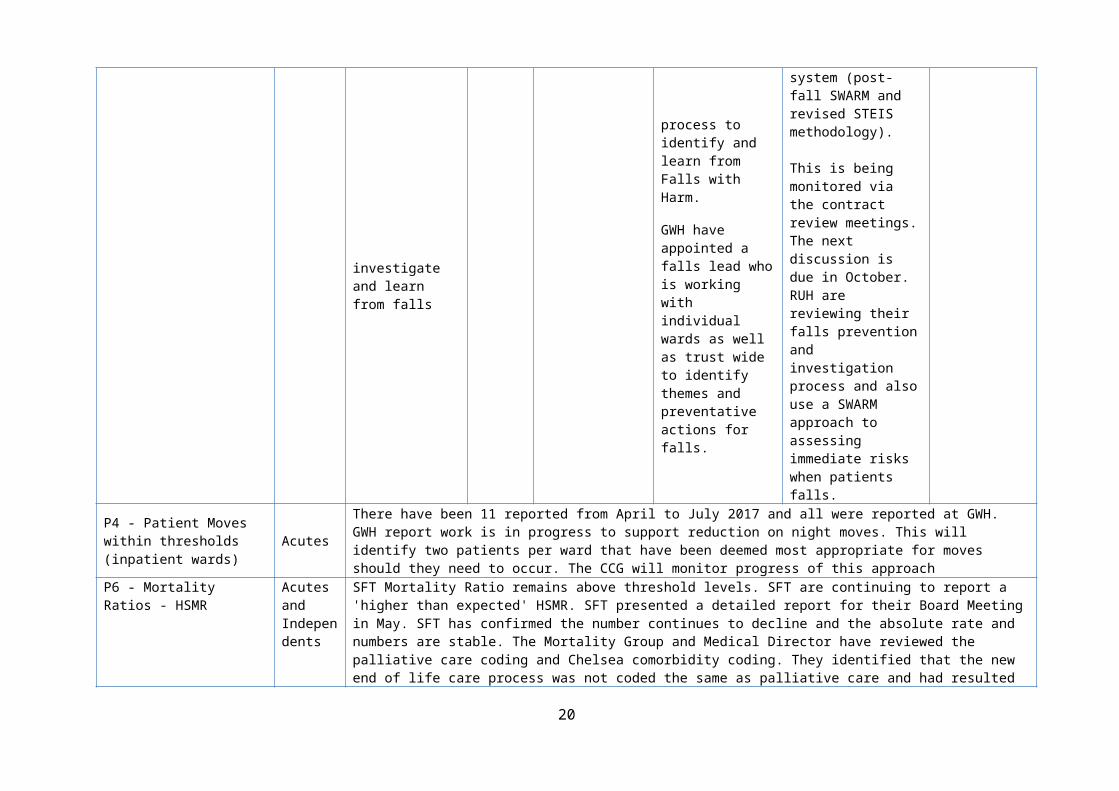
P3 – Falls resulting in SFT and Ongoing review of October SFT (FB as SFT have revised The CCG has agreed Ongoing
15
fracture or major harm. GWHprocess to investigate and learn from falls
2017 contract lead)
their internal process to identify and learn from Falls with Harm.
GWH have appointed a falls lead who is working with individual wards as well as trust wide to identify themes and preventative actions for falls.
to a trial of the new system (post-fall SWARM and revised STEIS methodology).
This is being monitored via the contract review meetings. The next discussion is due in October.RUH are reviewing their falls prevention and investigation process and also use a SWARM approach to assessing immediate risks when patients falls.
P4 - Patient Moves within thresholds (inpatient wards) Acutes
There have been 11 reported from April to July 2017 and all were reported at GWH. GWH report work is in progress to support reduction on night moves. This will identify two patients per ward that have been deemed most appropriate for moves should they need to occur. The CCG will monitor progress of this approach
P6 - Mortality Ratios - HSMR
Acutes and Independents
SFT Mortality Ratio remains above threshold levels. SFT are continuing to report a 'higher than expected' HSMR. SFT presented a detailed report for their Board Meeting in May. SFT has confirmed the number continues to decline and the absolute rate and numbers are stable. The Mortality Group and Medical Director have reviewed the palliative care coding and Chelsea comorbidity coding. They identified that the new end of life care process was not coded the same as palliative care and had resulted in elevated mortality figures. This has now been rectified so EoL is now coded as per palliative care. SFT have developed a gap analysis in reference to the National Guidance on learning from deaths.
A1 - Pressure Ulcers WHC
Pressure Ulcers; 2 reported in July WHC have identified areas that are reporting increased numbers of pressure ulcers and have developed a new internal assurance report on the Pressure Ulcer Risk Assessment Tool (PURAT) data via SystmOne. This will provide the Tissue Viability Nurse (TVN) with information on the patients who have had a PURAT completed on the first visit by a health care professional. This data will be analysed and the report sent to the WHC team leads. The TVN plans to correlate this data with the patients’ pressure ulcer prevention care plan, to ensure that this is activated, completed and personalised to the patient; it is anticipated this will lead to a further reduction in ulcers developing. The CCG will continue to review at monthly CQRM’s. The CCG anticipate improved performance in terms of wound documentation through the national 2017-2019 CQUIN scheme.
16

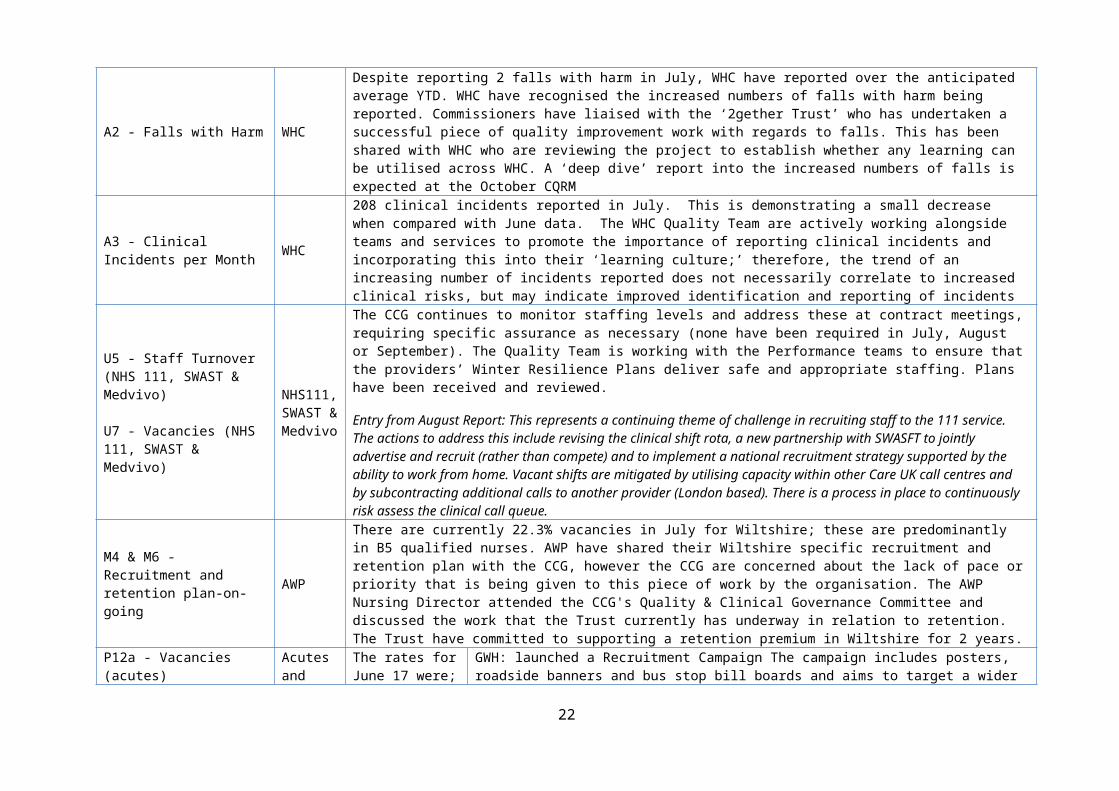
A2 - Falls with Harm WHC
Despite reporting 2 falls with harm in July, WHC have reported over the anticipated average YTD. WHC have recognised the increased numbers of falls with harm being reported. Commissioners have liaised with the ‘2gether Trust’ who has undertaken a successful piece of quality improvement work with regards to falls. This has been shared with WHC who are reviewing the project to establish whether any learning can be utilised across WHC. A ‘deep dive’ report into the increased numbers of falls is expected at the October CQRM
A3 - Clinical Incidents per Month WHC
208 clinical incidents reported in July. This is demonstrating a small decrease when compared with June data. The WHC Quality Team are actively working alongside teams and services to promote the importance of reporting clinical incidents and incorporating this into their ‘learning culture;’ therefore, the trend of an increasing number of incidents reported does not necessarily correlate to increased clinical risks, but may indicate improved identification and reporting of incidents
U5 - Staff Turnover (NHS 111, SWAST & Medvivo)
U7 - Vacancies (NHS 111, SWAST & Medvivo)
NHS111, SWAST & Medvivo
The CCG continues to monitor staffing levels and address these at contract meetings, requiring specific assurance as necessary (none have been required in July, August or September). The Quality Team is working with the Performance teams to ensure that the providers’ Winter Resilience Plans deliver safe and appropriate staffing. Plans have been received and reviewed.
Entry from August Report: This represents a continuing theme of challenge in recruiting staff to the 111 service. The actions to address this include revising the clinical shift rota, a new partnership with SWASFT to jointly advertise and recruit (rather than compete) and to implement a national recruitment strategy supported by the ability to work from home. Vacant shifts are mitigated by utilising capacity within other Care UK call centres and by subcontracting additional calls to another provider (London based). There is a process in place to continuously risk assess the clinical call queue.
M4 & M6 - Recruitment and retention plan-on-going AWP
There are currently 22.3% vacancies in July for Wiltshire; these are predominantly in B5 qualified nurses. AWP have shared their Wiltshire specific recruitment and retention plan with the CCG, however the CCG are concerned about the lack of pace or priority that is being given to this piece of work by the organisation. The AWP Nursing Director attended the CCG's Quality & Clinical Governance Committee and discussed the work that the Trust currently has underway in relation to retention. The Trust have committed to supporting a retention premium in Wiltshire for 2 years.
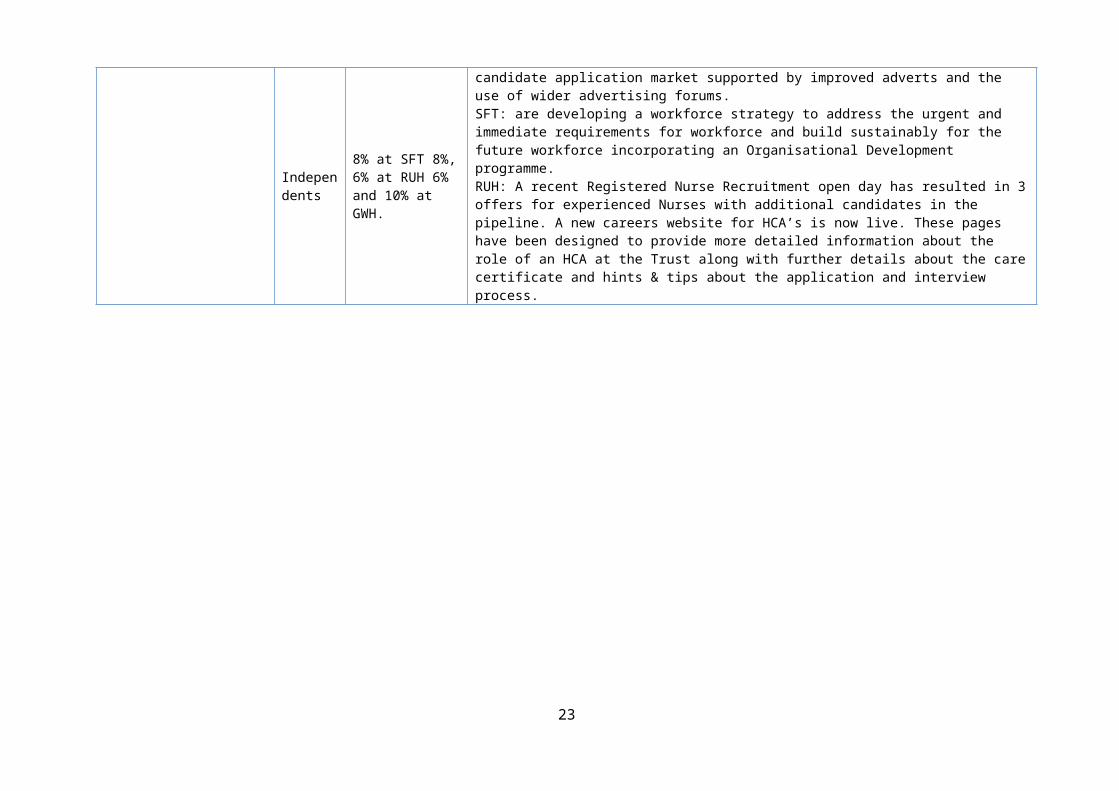
P12a - Vacancies (acutes)
Acutes and Independents
The rates for June 17 were; 8% at SFT 8%, 6% at RUH 6% and 10% at GWH.
GWH: launched a Recruitment Campaign The campaign includes posters, roadside banners and bus stop bill boards and aims to target a wider candidate application market supported by improved adverts and the use of wider advertising forums.SFT: are developing a workforce strategy to address the urgent and immediate requirements for workforce and build sustainably for the future workforce incorporating an Organisational Development programme.RUH: A recent Registered Nurse Recruitment open day has resulted in 3 offers for experienced Nurses with additional candidates in the pipeline. A new careers website for HCA’s is now live. These pages have been designed to provide more detailed information about the role of an HCA at the Trust along with further details about the care certificate and hints & tips about the application and interview process.
17
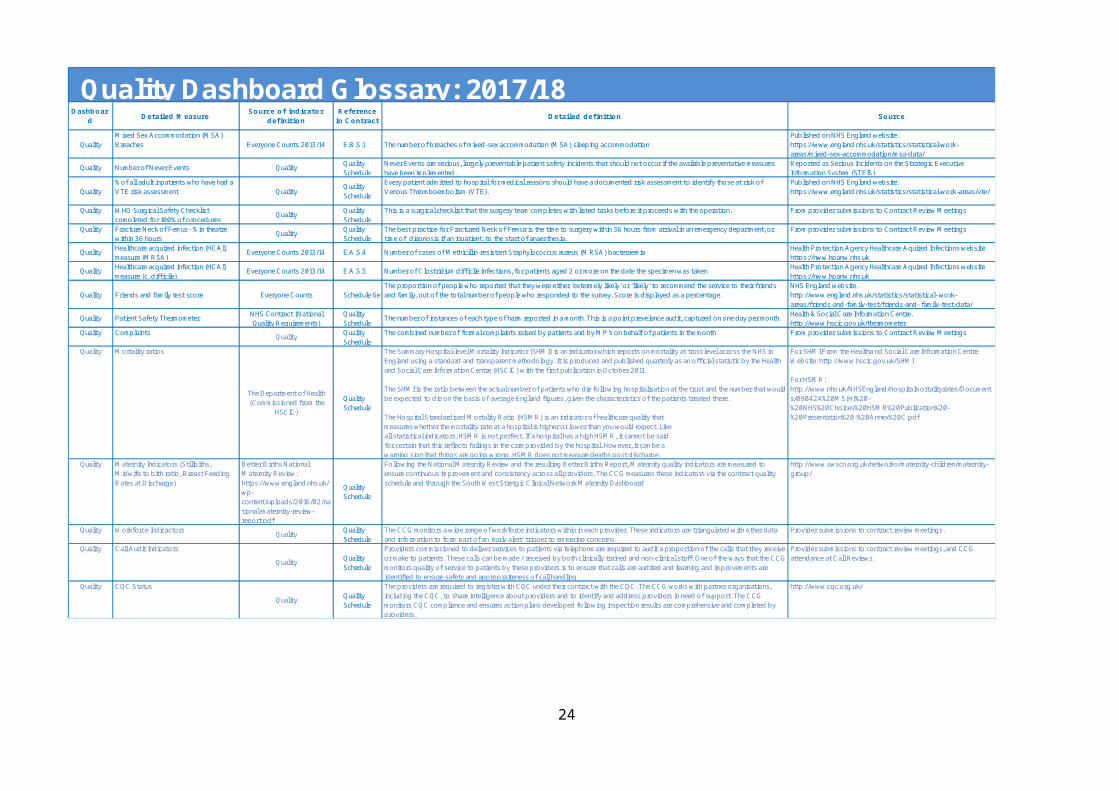
Dashboard Detailed Measure Source of indicator
definitionReference
in Contract Detailed definition Source
QualityMixed Sex Accommodation (MSA) Breaches Everyone Counts 2013/14 E.B.S.1 The number of breaches of mixed-sex accommodation (MSA) sleeping accommodation
Published on NHS England website: https://www.england.nhs.uk/statistics/statistical-work-areas/mixed-sex-accommodation/msa-data/
Quality Number of Never Events Quality Quality Schedule
Never Events are serious, largely preventable patient safety incidents that should not occur if the available preventative measures have been implemented.
Reported as Serious Incidents on the Strategic Executive Information System (STEIS)
Quality% of all adult inpatients who have had a VTE risk assessment Quality Quality
ScheduleEvery patient admitted to hospital for medical reasons should have a documented risk assessment to identify those at risk of Venous Thromboembolism (VTE).
Published on NHS England website: https://www.england.nhs.uk/statistics/statistical-work-areas/vte/
Quality WHO Surgical Safety Checklist completed for 100% of procedures Quality Quality
ScheduleThis is a surgical checklist that the surgery team completes with listed tasks before it proceeds with the operation. From provider submissions to Contract Review Meetings
Quality Fracture Neck of Femur - % in theatre within 36 hours Quality Quality
ScheduleThe best practice for Fractured Neck of Femur is the time to surgery within 36 hours from arrival in an emergency department, or time of diagnosis if an inpatient, to the start of anaesthesia.
From provider submissions to Contract Review Meetings
Quality Healthcare acquired infection (HCAI) measure (MRSA) Everyone Counts 2013/14 E.A.S.4 Number of cases of Methicillin-resistant Staphylococcus aureus (MRSA) bacteraemia Health Protection Agency Healthcare Aquired Infections website
https://nww.hpanw.nhs.ukQuality Healthcare acquired infection (HCAI)
measure (c. difficile) Everyone Counts 2013/14 E.A.S.5 Number of Clostridium difficile infections, for patients aged 2 or more on the date the specimen was taken Health Protection Agency Healthcare Aquired Infections website https://nww.hpanw.nhs.uk
Quality Friends and family test score Everyone Counts Schedule 6eThe proportion of people who reported that they were either 'extermely likely' or 'likely' to recommend the service to their friends and family, out of the total number of people who responded to the survey. Score is displayed as a percentage.
NHS England website. http://www.england.nhs.uk/statistics/statistical- work-areas/friends-and-family-test/friends-and- family-test-data/
Quality Patient Safety Thermometer NHS Contract (National Quality Requirements)
Quality Schedule The number of instances of each type of harm reported in a month. This is a point prevelance audit, captured on one day per month. Health & Social Care Information Centre.
http://www.hscic.gov.uk/thermometerQuality Complaints Quality Quality
ScheduleThe combined number of formal complaints raised by patients and by MP's on behalf of patients in the month From provider submissions to Contract Review Meetings
Quality Mortality ratios
The Department of Health (Commissioned from the
HSCIC)Quality Schedule
The Summary Hospital-level Mortality Indicator (SHMI) is an indicator which reports on mortality at trust level across the NHS in England using a standard and transparent methodology. It is produced and published quarterly as an official statistic by the Health and Social Care Information Centre (HSCIC) with the first publication in October 2011.
The SHMI is the ratio between the actual number of patients who die following hospitalisation at the trust and the number that would be expected to die on the basis of average England figures, given the characteristics of the patients treated there.
The Hospital Standardised Mortality Ratio (HSMR) is an indicator of healthcare quality thatmeasures whether the mortality rate at a hospital is higher or lower than you would expect. Likeall statistical indicators, HSMR is not perfect. If a hospital has a high HSMR, it cannot be saidfor certain that this reflects failings in the care provided by the hospital. However, it can be awarning sign that things are going wrong. HSMR does not measure deaths post discharge.
For SHMI:From the Healtha nd Social Care Information Centre Website: http://www.hscic.gov.uk/SHMI
For HSMR: http://www.nhs.uk/NHSEngland/Hospitalmortalityrates/Documents/090424%20MS(H)%20-%20NHS%20Choices%20HSMR%20Publication%20-%20Presentation%20-%20Annex%20C.pdf
Quality Maternity Indicators (Stillbiths, Midwife to bith ratio, Breast Feeding Rates at Discharge)
Better Births National Maternity Review: https://www.england.nhs.uk/wp-content/uploads/2016/02/national-maternity-review-report.pdf
Quality Schedule
Following the National Maternity Review and the resulting Better Births Report, Maternity quality indicators are measured to ensure continuous improvement and consistency across all providers. The CCG measures these indicators via the contract quality schedule and through the South West Stretgic Clinical Network Maternity Dashboard
http://www.swscn.org.uk/networks/maternity-children/maternity-group/
Quality Workforce Indicactors Quality Quality Schedule
The CCG monitors a wide range of workforce indicators within in each provider. These indicators are triangulated with other data and information to form part of an 'early alert' trigger to emerging concerns.
Provider submissions to contract review meetings.
Quality Call Audit IndicatorsQuality Quality
Schedule
Providers commissioned to deliver services to patients via telephone are required to audit a proportion of the calls that they receive or make to patients. These calls can be made / received by both clinically trained and non-clinical staff. One of the ways that the CCG monitors quality of service to patients by these providers is to ensure that calls are audited and learning and improvements are identified to ensure safety and appropraiteness of call handling.
Provider submissions to contract review meetings, and CCG attendance at Call Reviews.
Quality CQC StatusQuality Quality
Schedule
The providers are required to register with CQC under their contract with the CQC. The CCG works with partner organisations, including the CQC, to share intelligence about providers and to identify and address providers in need of support. The CCG monitors CQC compliance and ensures action plans developed following inspection results are comprehensive and completed by providers.
http://www.cqc.org.uk/
Quality Dashboard Glossary: 2017/18
18
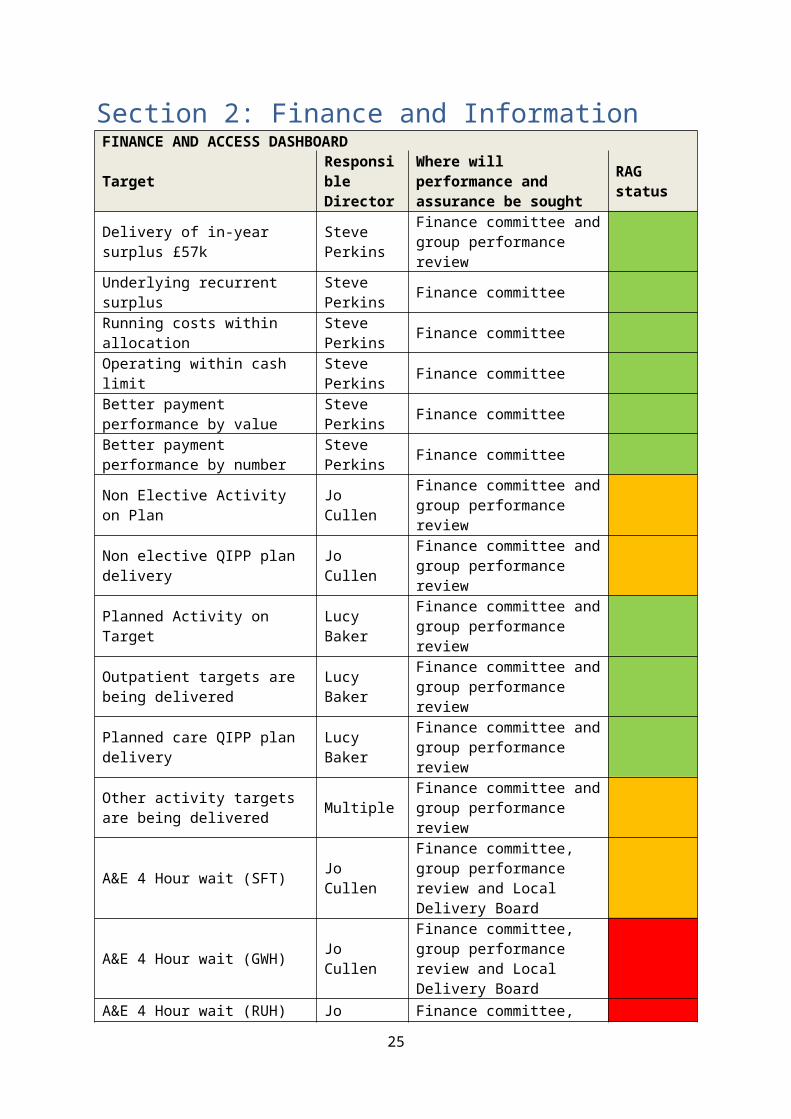
Section 2: Finance and InformationFINANCE AND ACCESS DASHBOARD
Target Responsible Director
Where will performance and assurance be sought RAG status
Delivery of in-year surplus £57k Steve Perkins
Finance committee and group performance review
Underlying recurrent surplus Steve Perkins Finance committee
Running costs within allocation Steve Perkins Finance committee
Operating within cash limit Steve Perkins Finance committee
Better payment performance by value
Steve Perkins Finance committee
Better payment performance by number
Steve Perkins Finance committee
Non Elective Activity on Plan Jo Cullen Finance committee and group performance review
Non elective QIPP plan delivery Jo Cullen Finance committee and group performance review
Planned Activity on Target Lucy Baker Finance committee and group performance review
Outpatient targets are being delivered Lucy Baker Finance committee and group
performance review
Planned care QIPP plan delivery Lucy Baker Finance committee and group performance review
Other activity targets are being delivered Multiple Finance committee and group
performance review
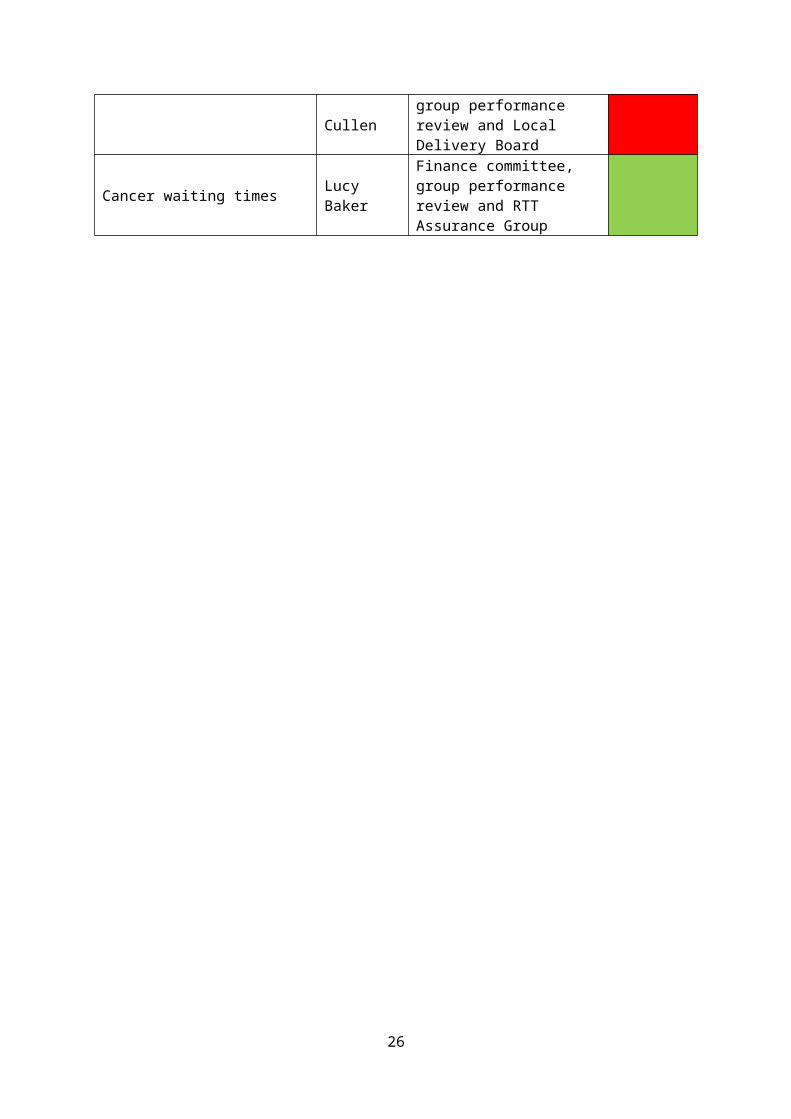
A&E 4 Hour wait (SFT) Jo CullenFinance committee, group performance review and Local Delivery Board
A&E 4 Hour wait (GWH) Jo CullenFinance committee, group performance review and Local Delivery Board
A&E 4 Hour wait (RUH) Jo CullenFinance committee, group performance review and Local Delivery Board
Cancer waiting times Lucy BakerFinance committee, group performance review and RTT Assurance Group
19
Summary
In line with NHS England (NHSE) planning requirements the CCG is required to deliver a cumulative 1% surplus against its available resources including its brought forward surplus. The CCG is monitored on the in-year element of this, £57k, and is not expected to draw down the brought forward balance. In addition, the CCG is required to create a headroom reserve of 1%, of which 0.5% may be utilised as non-recurrent investments, and 0.5% must be held as uncommitted headroom to address system risk. The uncommitted headroom element, held to support system risk, may only be released in conjunction with NHSE / Treasury approval.
£’m1% surplus requirement (includes brought forward balance) 11.66Brought forward balance -11.60In-year reporting surplus 0.06
For month 6, the CCG is forecasting delivery of the planned surplus position.
At month 6, the CCG has received five months of Service Level Agreement Monitoring (SLAM) data. Changes to Identification Rules (IR) which allocate activity between the CCG and Specialist Commissioning are continuing to impact on the reliability of activity data, however the CCG has made prudent forecasts for these contracts based on the current information. The CCG is continuing to work with providers to clarify the outstanding data issues.
There have been some adjustments to the budget in M6, mainly relating to additional allocation receipts, invoicing of Integrated Community Equipment Service (ICES) to Wiltshire Council, and the transfer of Strategic Transformation Partnership (STP) funding to GWH for administration. Details of budget movements are set out in Annex 5.
The CCG is operating within its available resources (both cash and income and expenditure) and has achieved its better payment performance requirements on a year to date basis.
20

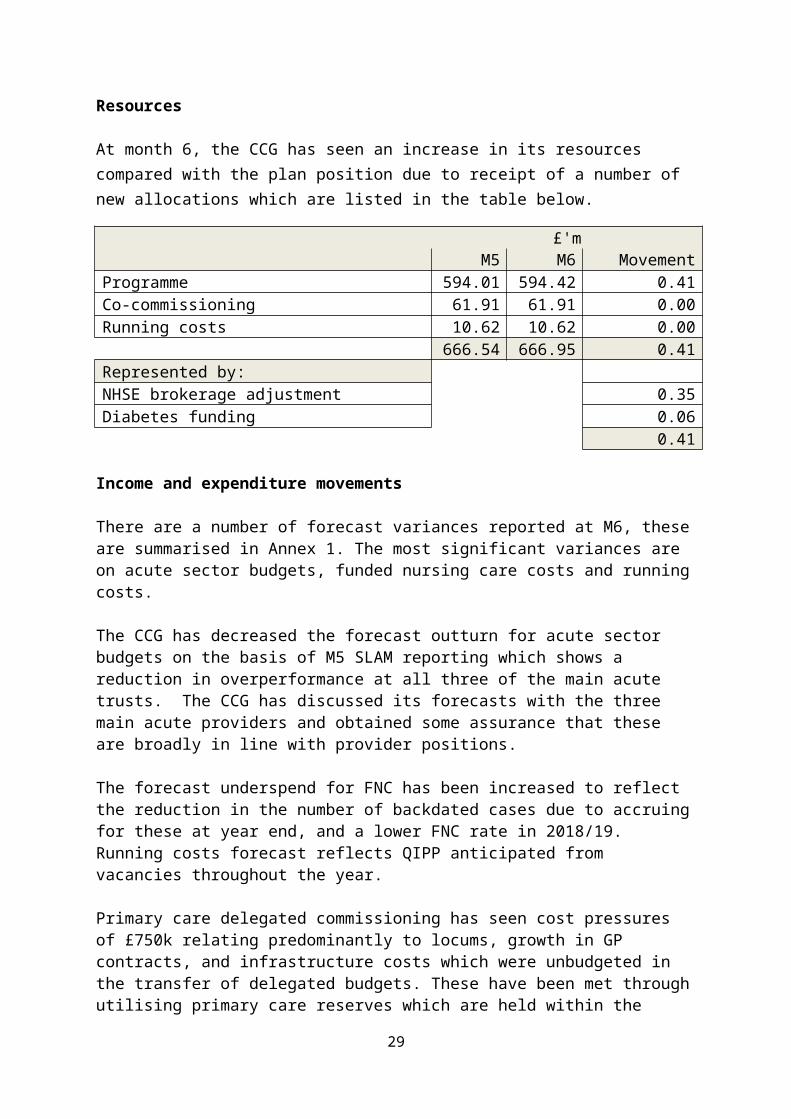
Resources
At month 6, the CCG has seen an increase in its resources compared with the plan position due to receipt of a number of new allocations which are listed in the table below.
£'mM5 M6 Movement
Programme 594.01 594.42 0.41Co-commissioning 61.91 61.91 0.00Running costs 10.62 10.62 0.00
666.54 666.95 0.41Represented by:NHSE brokerage adjustment 0.35Diabetes funding 0.06
0.41
Income and expenditure movements
There are a number of forecast variances reported at M6, these are summarised in Annex 1. The most significant variances are on acute sector budgets, funded nursing care costs and running costs.
The CCG has decreased the forecast outturn for acute sector budgets on the basis of M5 SLAM reporting which shows a reduction in overperformance at all three of the main acute trusts. The CCG has discussed its forecasts with the three main acute providers and obtained some assurance that these are broadly in line with provider positions.
The forecast underspend for FNC has been increased to reflect the reduction in the number of backdated cases due to accruing for these at year end, and a lower FNC rate in 2018/19. Running costs forecast reflects QIPP anticipated from vacancies throughout the year.
Primary care delegated commissioning has seen cost pressures of £750k relating predominantly to locums, growth in GP contracts, and infrastructure costs which were unbudgeted in the transfer of delegated budgets. These have been met through utilising primary care reserves which are held within the delegated primary care budgets. The remaining balance of primary care reserves, £321k, has been allocated to GP resilience.
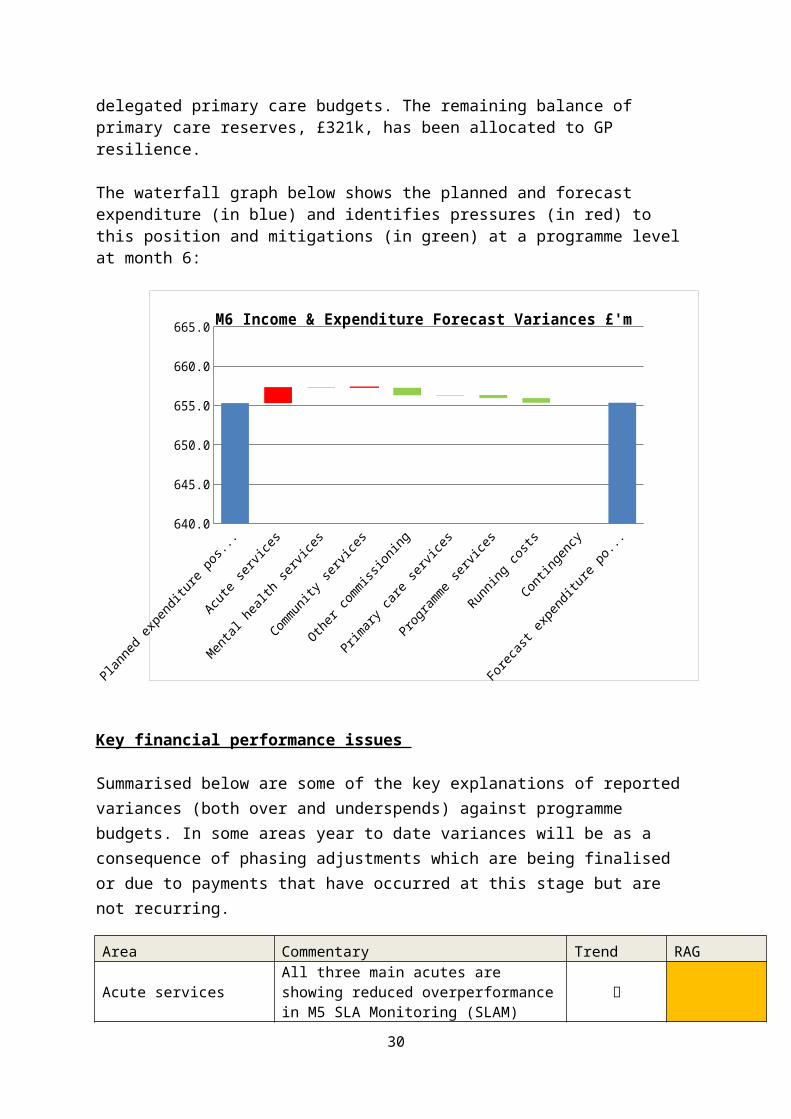
The waterfall graph below shows the planned and forecast expenditure (in blue) and identifies pressures (in red) to this position and mitigations (in green) at a programme level at month 6:
21
640.0
645.0
650.0
655.0
660.0
665.0M6 Income & Expenditure Forecast Variances £'m
Favourable Variance Adverse variance Series2 Planned spend
Key financial performance issues
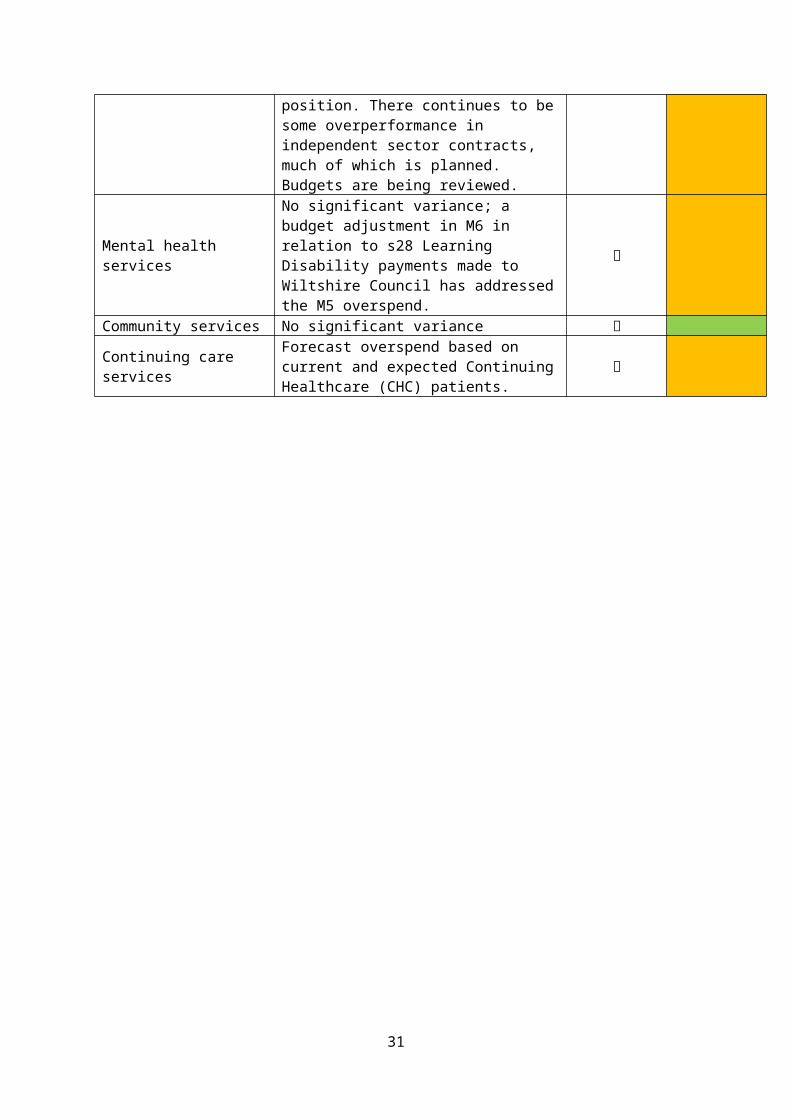
Summarised below are some of the key explanations of reported variances (both over and underspends) against programme budgets. In some areas year to date variances will be as a consequence of phasing adjustments which are being finalised or due to payments that have occurred at this stage but are not recurring.
Area Commentary Trend RAG
Acute services
All three main acutes are showing reduced overperformance in M5 SLA Monitoring (SLAM) position. There continues to be some overperformance in independent sector contracts, much of which is planned. Budgets are being reviewed.
0.68%
Mental health services
No significant variance; a budget adjustment in M6 in relation to s28 Learning Disability payments made to Wiltshire Council has addressed the M5 overspend.
0.01%
Community services No significant variance 0.00%
Continuing care servicesForecast overspend based on current and expected Continuing Healthcare (CHC) patients.
1.98%
22
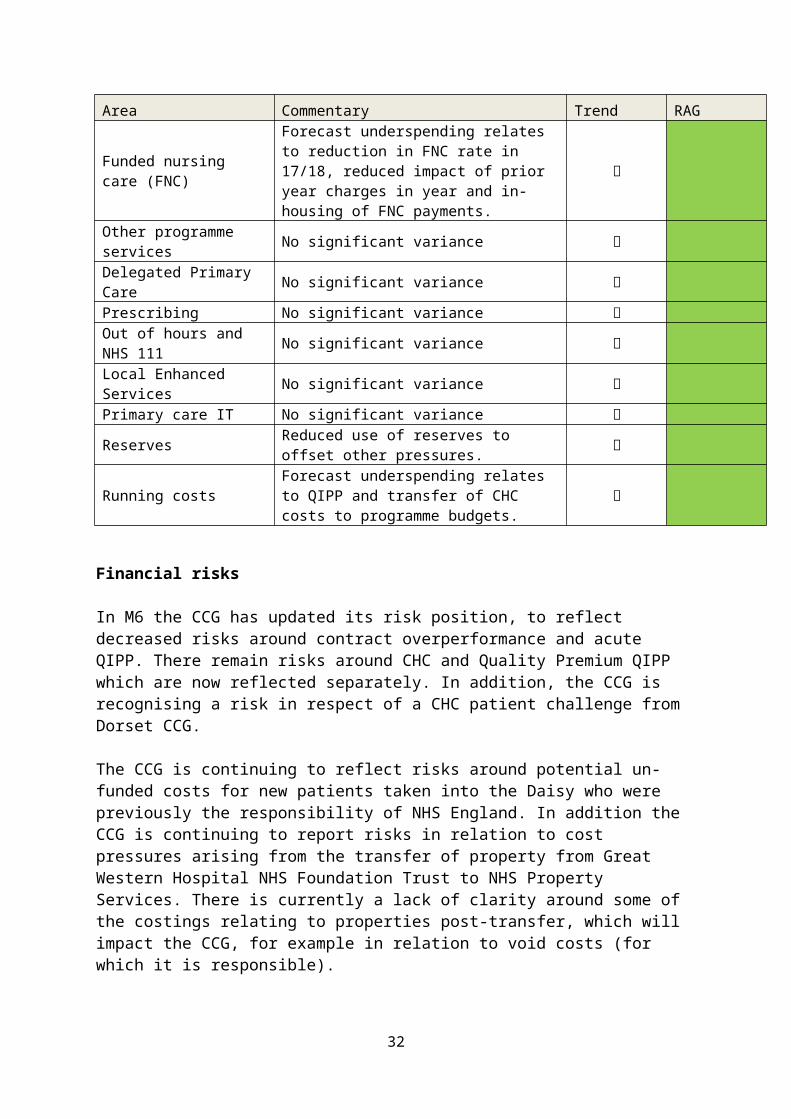
Area Commentary Trend RAG
Funded nursing care (FNC)
Forecast underspending relates to reduction in FNC rate in 17/18, reduced impact of prior year charges in year and in-housing of FNC payments.
-9.01%
Other programme services No significant variance -0.02%Delegated Primary Care No significant variance 0.00%Prescribing No significant variance 0.00%Out of hours and NHS 111 No significant variance 0.00%Local Enhanced Services No significant variance 0.00%Primary care IT No significant variance 0.00%
Reserves Reduced use of reserves to offset other pressures.
-7.95%
Running costs Forecast underspending relates to QIPP and transfer of CHC costs to programme budgets.
-5.65%
Financial risks
In M6 the CCG has updated its risk position, to reflect decreased risks around contract overperformance and acute QIPP. There remain risks around CHC and Quality Premium QIPP which are now reflected separately. In addition, the CCG is recognising a risk in respect of a CHC patient challenge from Dorset CCG.
The CCG is continuing to reflect risks around potential un-funded costs for new patients taken into the Daisy who were previously the responsibility of NHS England. In addition the CCG is continuing to report risks in relation to cost pressures arising from the transfer of property from Great Western Hospital NHS Foundation Trust to NHS Property Services. There is currently a lack of clarity around some of the costings relating to properties post-transfer, which will impact the CCG, for example in relation to void costs (for which it is responsible).
23
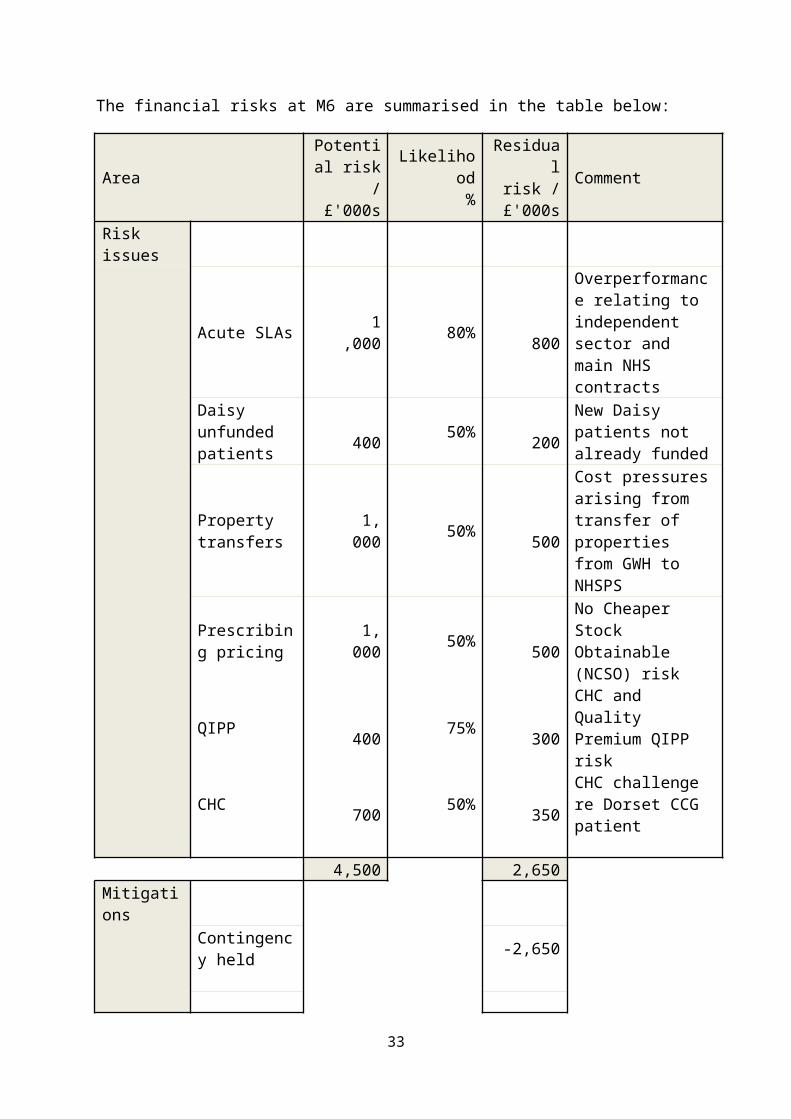
The financial risks at M6 are summarised in the table below:
AreaPotential
risk / £'000s
Likelihood %
Residual risk /
£'000sComment
Risk issues
Acute SLAs 1,000 80% 800
Overperformance relating to independent sector and main NHS contracts
Daisy unfunded patients
400 50% 200 New Daisy patients not already funded
Property transfers 1,000 50% 500
Cost pressures arising from transfer of properties from GWH to NHSPS
Prescribing pricing 1,000 50% 500
No Cheaper Stock Obtainable (NCSO) risk
QIPP 400 75% 300 CHC and Quality Premium QIPP risk
CHC 700 50% 350 CHC challenge re Dorset CCG patient
4,500 2,650Mitigations
Contingency held -2,650
-2,650Net risk position after mitigations 0
24
Key access issues
RTT Incomplete PathwaysIn August 2017, the CCG did not deliver the constitutional target for Referral to Treatment (RTT) performance achieving 91.79%. SFT delivered the target for the second month in a row and are reaching their steady state waiting list size of 17,000. Additional outsourcing at SFT has commenced as part of the CCG's Winter elective plan.
GWH and RUH did not deliver the target in August. A recovery trajectory has been requested from GWH via the monthly Elective Care Board. RUH performance dipped further to 88.5% in month - a revised recovery plan is being developed jointly with commissioners. Wiltshire CCG is working with the RUH to explore alternative ways to reduce waiting times for patients. This will include patients who have not yet been seen in Outpatients at RUH in ENT being re-offered choice by our Referral Management Centre.
The CCG continues to outsource patients at the pre- referral stage of their pathway - a further 781 patients were managed in this way during August. A clinical deep dive is being held in Nov to review elective cardiology pathways at the RUH.
DiagnosticsThe CCG breached the 99% under six week standard for diagnostic waiting times, achieving 97.6%. SFT continued to deliver the constitutional target. RUH, GWH, NBT, Devizes Treatment Centre and University Hospital Southampton all breached in August, there were 200 Wiltshire patient breaches with 13 at SFT, 135 at RUH, 29 at GWH, 7 at North Bristol Trust, 7 at Devizes Treatment Centre and 2 and University Hospitals Southampton.
Revised non obstetric ultrasound guidelines are being discussed at RUH and with primary care following a surge in total demand (primarily from consultant to consultant referrals) in August contributed to a temporary drop in performance, set against a background of ever increasing demand (both consultant generated and primary care). GWH are predicting to deliver in Sept 2017.
Cancer AccessIn August the CCG achieved all cancer targets except 62 day (84.69% against 85% target) caused primarily by 80.69% for Wilts at GWH. A remedial action plan is in place and being monitored; recovery is expected from November. GWH performance against the 62 day target remains the biggest risk. A remedial action plan has been provided in relation to colorectal services. The CCG has worked with the provider and agreed to redirect routine gastro referrals away from GWH from Sept first for three months to support reduced pathways for patients. The CCG continues to focus on all elements of the end to end cancer pathways to deliver sustained Sixty two day delivery.
Mixed Sex AccommodationThere were 5 breaches reported in August; 2 at Gloucester Hospitals and 3 at GWH.
25
A&E AccessAll three trusts breached the ≥95% standard in August. RUH 90.4%, SFT 91.3% and GWH 90.9%.
Ambulance Response TimesSWAST breached the 75% target for red responses on scene with achievement of 59.8% in August.
Delayed Transfers of CareAll 3 main local Acute Trusts reported excess delayed discharge block bed days in August.
Dementia DiagnosisThe CCG achieved 65.6% in August (Target 67%).
Community ServicesFor August, WH&C average length of stay now stands 9 days more than target, DToC has increased to 35% (target 20%), % End of Life patients dying in preferred place is 85% (target is 90%) and reablement has decreased to 68% (target is 86%).
ActivityElective care activity levels have been maintained via increased use of the independent sector. Within NHS providers elective Non Elective spells are 2.8% over plan and Diagnostics excluding Endoscopies are 12.1% over plan.
Appendices- Annex 1 Summary I&E position M6 2017/18- Annex 2 Summary Statement of Financial Position M6 2017/18- Annex 3 Cash Position M6 2017/18- Annex 4 Better Payment Practice Code Performance M6 2017/18- Annex 5 Movement between budgets and resources M6 2017/18- Annex 6 Performance against constitution targets M5 2017/18- Annex 7 Activity monitoring M5 2017/18- Annex 8 IPR Group Dashboard
26

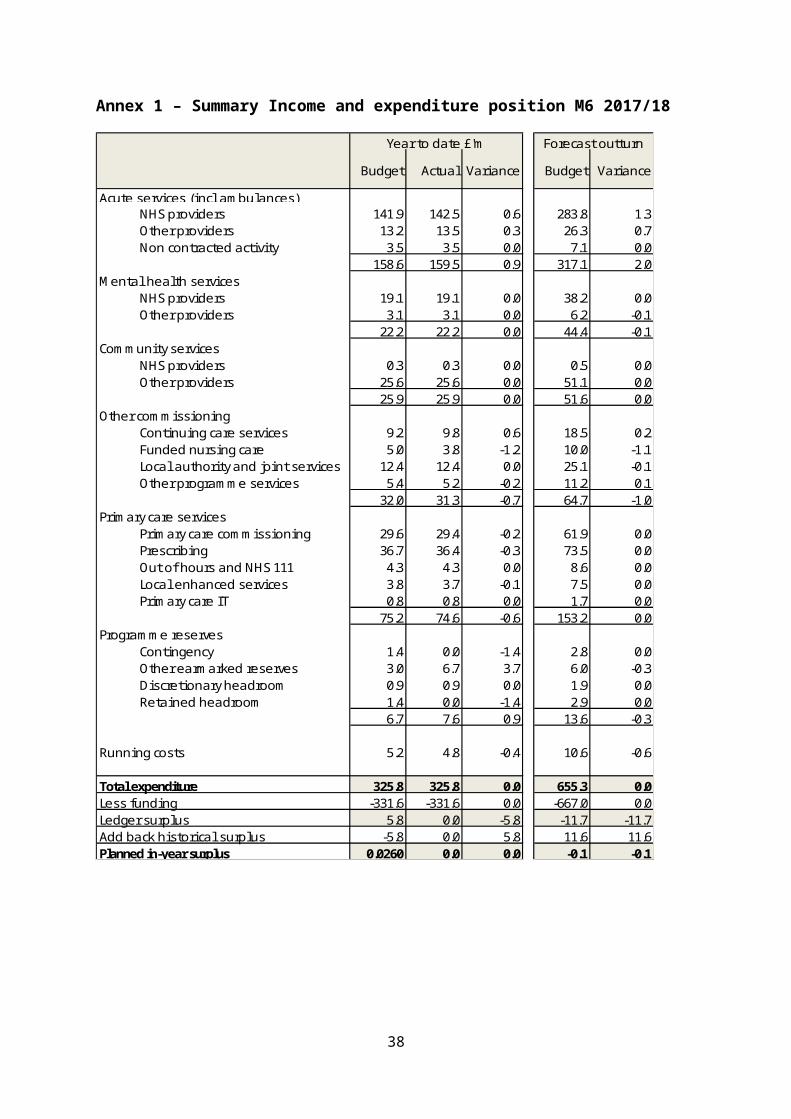
Annex 1 – Summary Income and expenditure position M6 2017/18
Budget Actual Variance Budget Variance
Acute services (incl ambulances)NHS providers 141.9 142.5 0.6 283.8 1.3Other providers 13.2 13.5 0.3 26.3 0.7Non contracted activity 3.5 3.5 0.0 7.1 0.0
158.6 159.5 0.9 317.1 2.0Mental heal th services
NHS providers 19.1 19.1 0.0 38.2 0.0Other providers 3.1 3.1 0.0 6.2 -0.1
22.2 22.2 0.0 44.4 -0.1Community services
NHS providers 0.3 0.3 0.0 0.5 0.0Other providers 25.6 25.6 0.0 51.1 0.0
25.9 25.9 0.0 51.6 0.0Other commiss ioning
Conti nuing care services 9.2 9.8 0.6 18.5 0.2Funded nurs ing care 5.0 3.8 -1.2 10.0 -1.1Loca l authority and joint services 12.4 12.4 0.0 25.1 -0.1Other programme services 5.4 5.2 -0.2 11.2 0.1
32.0 31.3 -0.7 64.7 -1.0Primary care services
Primary care commiss ioning 29.6 29.4 -0.2 61.9 0.0Prescribing 36.7 36.4 -0.3 73.5 0.0Out of hours and NHS 111 4.3 4.3 0.0 8.6 0.0Loca l enhanced services 3.8 3.7 -0.1 7.5 0.0Primary care IT 0.8 0.8 0.0 1.7 0.0
75.2 74.6 -0.6 153.2 0.0Progra mme reserves
Conti ngency 1.4 0.0 -1.4 2.8 0.0Other earmarked reserves 3.0 6.7 3.7 6.0 -0.3Discretionary headroom 0.9 0.9 0.0 1.9 0.0Retained headroom 1.4 0.0 -1.4 2.9 0.0
6.7 7.6 0.9 13.6 -0.3
Running costs 5.2 4.8 -0.4 10.6 -0.6
Total expenditure 325.8 325.8 0.0 655.3 0.0Less funding -331.6 -331.6 0.0 -667.0 0.0Ledger surplus 5.8 0.0 -5.8 -11.7 -11.7Add back his torica l surplus -5.8 0.0 5.8 11.6 11.6Planned in-year surplus 0.0260 0.0 0.0 -0.1 -0.1
Year to date £'m Forecast outturn
27

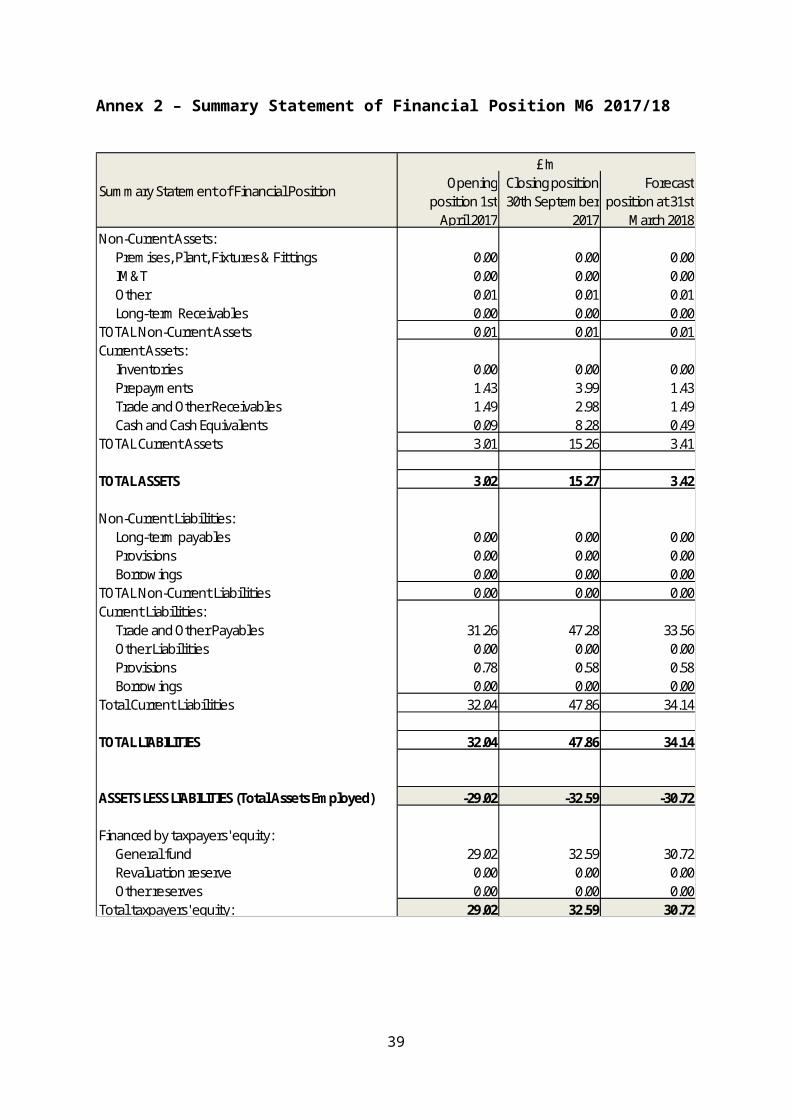
Annex 2 – Summary Statement of Financial Position M6 2017/18
Opening position 1st
April 2017
Closing position 30th September
2017
Forecast position at 31st
March 2018Non-Current Assets:
Premises, Plant, Fixtures & Fittings 0.00 0.00 0.00IM&T 0.00 0.00 0.00Other 0.01 0.01 0.01Long-term Receivables 0.00 0.00 0.00
TOTAL Non-Current Assets 0.01 0.01 0.01Current Assets:
Inventories 0.00 0.00 0.00Prepayments 1.43 3.99 1.43Trade and Other Receivables 1.49 2.98 1.49Cash and Cash Equivalents 0.09 8.28 0.49
TOTAL Current Assets 3.01 15.26 3.41
TOTAL ASSETS 3.02 15.27 3.42
Non-Current Liabilities:Long-term payables 0.00 0.00 0.00Provisions 0.00 0.00 0.00Borrowings 0.00 0.00 0.00
TOTAL Non-Current Liabilities 0.00 0.00 0.00Current Liabilities:
Trade and Other Payables 31.26 47.28 33.56Other Liabilities 0.00 0.00 0.00Provisions 0.78 0.58 0.58Borrowings 0.00 0.00 0.00
Total Current Liabilities 32.04 47.86 34.14
TOTAL LIABILITIES 32.04 47.86 34.14
ASSETS LESS LIABILITIES (Total Assets Employed) -29.02 -32.59 -30.72
Financed by taxpayers' equity:General fund 29.02 32.59 30.72Revaluation reserve 0.00 0.00 0.00Other reserves 0.00 0.00 0.00
Total taxpayers' equity: 29.02 32.59 30.72
Summary Statement of Financial Position
£'m
28
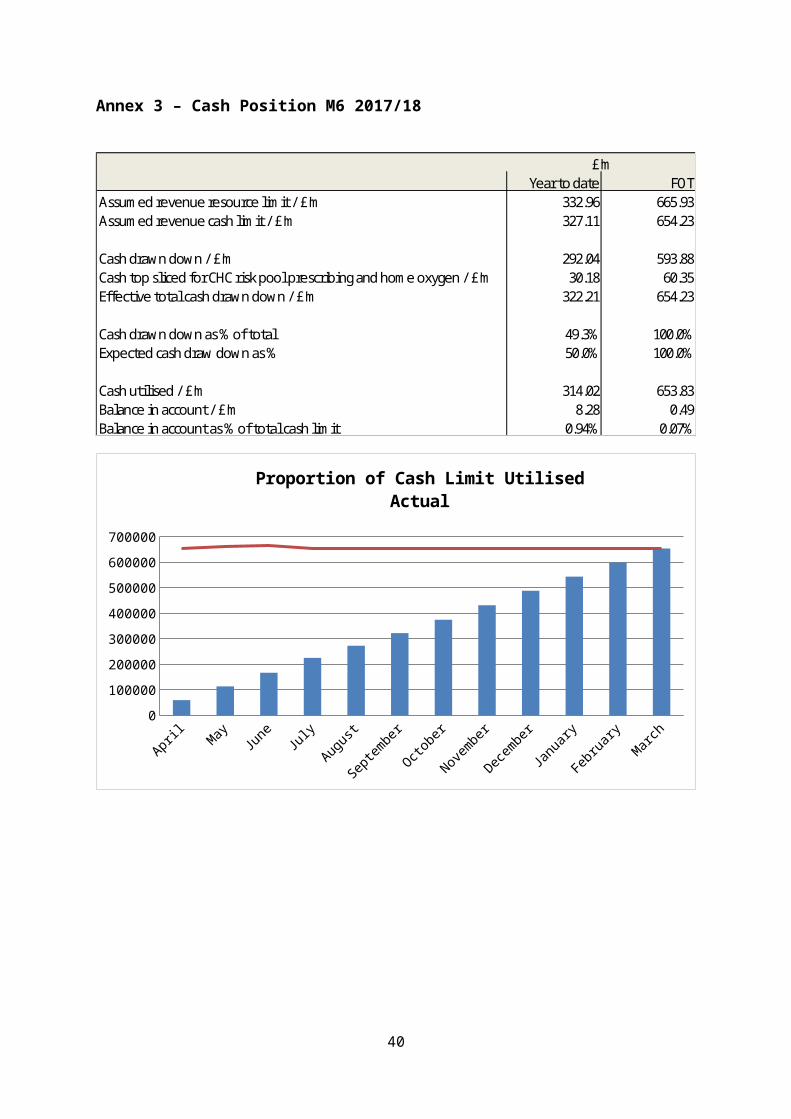
Annex 3 – Cash Position M6 2017/18
Year to date FOTAssumed revenue resource limit / £'m 332.96 665.93Assumed revenue cash limit / £'m 327.11 654.23
Cash drawn down / £'m 292.04 593.88Cash top sliced for CHC risk pool prescribing and home oxygen / £'m 30.18 60.35Effective total cash drawn down / £'m 322.21 654.23
Cash drawn down as % of total 49.3% 100.0%Expected cash draw down as % 50.0% 100.0%
Cash utilised / £'m 314.02 653.83Balance in account / £'m 8.28 0.49Balance in account as % of total cash limit 0.94% 0.07%
£'m
AprilMay June
July
August
Septem
ber
October
November
December
January
February
March
0
100000
200000
300000
400000
500000
600000
700000
Proportion of Cash Limit UtilisedActual
29
Annex 4 – Better Payment Practice Code Performance M6 2017/18
Nos. £'m Nos. £'mNHS
Total bills paid 316 26.75 1,866 168.87Total bills paid within time 315 26.75 1,861 168.87% of bills paid within target 99.7% 100.0% 99.7% 100.0%
Non-NHSTotal bills paid 657 9.53 3,823 61.25Total bills paid within time 651 9.52 3,805 60.89% of bills paid within target 99.1% 99.9% 99.5% 99.4%
ALLTotal bills paid 973 36.28 5,689 230.12Total bills paid within time 966 36.26 5,666 229.76% of bills paid within target 99.3% 99.9% 99.6% 99.8%
Performance vs 30 days BPP ytd Sept 2017In Month YTD
30
Annex 5 - Movement between M5 and M6 budget 2017/18
M5 position £m M6 position £m Movement £m Comment
Acute services (incl ambulances)
NHS providers 283.8 283.8 0.0
Other providers 26.3 26.3 0.0
Non contracted activity 7.1 7.1 0.0
317.1 317.1 0.0
Mental health services
NHS providers 38.2 38.2 0.0
Other providers 6.2 6.2 0.0
44.4 44.4 0.0
Community services
NHS providers 0.4 0.5 0.1 Fracture liaison service moved from local authority and joint services
Other providers 51.1 51.1 0.0
51.5 51.6 0.1
Other commissioning
Continuing care services 18.5 18.5 0.0
Funded nursing care 10.0 10.0 0.0
Local authority and joint services 25.3 25.1 -0.2 Fracture liaison service moved to community & WC invoice for ICES; offset by transfer of STP funding to GWH.
Other programme services 11.2 11.2 0.0
64.9 64.7 -0.2
Primary care services
Primary care co-commissioning 61.9 61.9 0.0
Prescribing 73.5 73.5 0.0
Out of hours 8.6 8.6 0.0
Local enhanced services 7.5 7.5 0.0
Primary care IT 1.7 1.7 0.0
153.2 153.2 0.0
Programme reserves
Contingency 2.8 2.8 0.0
Other reserves 5.5 6.0 0.5NHSE general allocation adjustment, diabetes funding, NHCN funding, and ICES invoice to WC, offset by transfer of STP funding to GWH.
Other allocations 1.9 1.9 0.0
Headroom funding 2.9 2.9 0.0
13.1 13.6 0.5
Running costs 10.6 10.6 0.0
Total expenditure 654.8 655.3 0.5
Less Funding -666.5 -667.0 -0.5
Carried forward surplus -11.7 -11.7 0.0
Add back historical surplus 11.6 11.6 0.0
Planned in-year surplus -0.1 -0.1 0.0
31
Annex 6 – Performance against constitution targets M5 2017/18
32
33

Annex 7 - Activity monitoring M5 2017/18
34
Annex 8 – IPR Group Dashboard
Thismonth
Lastmonth
Constitutional Targets (Wiltshire CCG position unless stated)18 Weeks RTT Incomplete Pathways CCG Total Aug-17 ≥92% ≥92% 91.8% 92.3%
18 Weeks RTT Incomplete Pathways RUH Aug-17 ≥92% ≥92% 90.0% 90.5%
18 Weeks RTT Incomplete Pathways GWH Aug-17 ≥92% ≥92% 90.3% 90.7%
18 Weeks RTT Incomplete Pathways SFT Aug-17 ≥92% ≥92% 93.5% 93.9%
Diagnostic Test within 6 weeks CCG Total Aug-17 ≥99% ≥99% 97.6% 98.1%
Diagnostic Test within 6 weeks RUH Aug-17 ≥99% ≥99% 96.4% 86.8%
Diagnostic Test within 6 weeks GWH Aug-17 ≥99% ≥99% 97.7% 98.5%
Diagnostic Test within 6 weeks SFT Aug-17 ≥99% ≥99% 99.5% 99.6%
52 week wait breaches CCG Total Aug-17 Zero Zero 4 2
Cancer 2WW CCG Total Aug-17 ≥93% ≥93% 93.5% 93.5%
Cancer 2WW Breast CCG Total Aug-17 ≥93% ≥93% 97.9% 95.3%
Cancer 62 days from urgent GP referral to definitive treatment Aug-17 ≥85% ≥85% 84.7% 86.0%NON ELECTIVE SPELLS (Specific Acute)CCG Total M5ytd 17,842 18,349 14,619GWH M5 870 921RUH M5 1,357 1,287SFT M5 1,227 1,240ED ATTENDANCESCCG Total M5ytd 58,050 54,774 43,759GWH M5 1,431 1,515RUH M5 1,958 1,906SFT M5 2,533 2,823NHS 111Calls Offered (BaNES & Wiltshire) M5 12,011 12,847SWASTTotal Incidents (with duplicate calls removed) M5ytd 28,180 28,058 22,522MIUTotal Attendances (Wilts MIUs only) M5 5,430 6,247SWICTotal Attendances M5ytd 12305 7,604 6,251BDUCTotal Attendances M5 142 131NHS 111 PerformanceAnswered <60 secs % M5ytd ≥95% 94.5% 92.2%Abandoned >30 secs calls% M5ytd ≤5% 0.8% 0.9%Ambulance disposition % M5ytd ≤10% 10.5% 10.5%ED Disposition % M5ytd ≤5% 7.3% 7.3%Medvivo PerformanceOOH Telephone Advice Cal ls M5 3,243 3,873OOH PCC Attendances M5 3,043 3,226OOH Home Visits M5 780 821Referrals to Urgent Care at Home M5 67 64Telecare Mobile Responses M5 156 175One number ATC cal ls M5 6,648 6,664ATC Referrals M5 2,245 2,102SWAST PerformanceHear and Treat Percentage M5ytd 11.5% 12.2% 12.6%
See and Treat Percentage M5ytd 36.5% 37.4% 37.5%See and ED Conveyance Percentage M5ytd 45.2% 43.8% 50.0%High Impact InterventionsWeekend discharges % (80% of Weekday)GWH M5ytd ≥80%RUH M5ytd ≥80%SFT M5ytd ≥80%GWH Community M5ytd ≥80%DTOC %GWH Jul-17 3.5% 9.3% 10.1%RUH Jul-17 3.5% 6.1% 6.0%SFT Jul-17 3.5% 5.0% 6.5%GWH Community Children's community services:Non-consultant led services: RTM incomplete Pathways - % waiting under 18 weeks at month end Jun-17 ≥92% ≥92% 82% 81%
% CAMHS T3 new referrals assessed within 12 weeks of referral Apr-17 ≥95% ≥95% 100% 100%
% CAMHS T2 new referrals assessed within 12 weeks of referral Apr-17 100% 100% 100% 100%
Paediatric consultant follow ups seen within 6 weeks of agreed date Jun-17 tbc 32.96% 45.96%
Proportion of children over 14 with a transition plan 100%Children's continuing care: expenditure against ring fenced value within contractNational child measure ment programme- reception chi ldren very overweight 4.37%National child measure ment programme- Year 6 children very overweight 10.17%CAMHS Transformation Plan:% referrals to Single Point of Access which don't meet CAMHS service criteria & are provided with an early help response where appropriate Jun-17 95% 100% 100%% of referrals to CAMHS SPA not accepted Jun-17 10% 28.0% 28.0%% of children and young people who, at the end of CAMHS treatment, self-report main presenting problem has improved 95% Not Available% re-referrals to CAMHS within 12 months tbc Not AvailableNo of CAMHS hospital admissions Jun-17 2 1No of CAMHS hospital bed days Jun-17 171 180No of 11 - 18 year olds attending A&E where mental health is the primary or secondary diagnosis Oct-16 tbc 41 37AWP4 week RTA (Referral to Assessment) Aug-17 ≥95% 98.7% 99.1%4 hour wait - emergency crisis assessment Aug-17 ≥95% 95.0% 93.2%% of admissions gatekept (working adult age) Aug-17 ≥95% 92.7% 90.7%DTOC for wiltshire wards - Adult Aug-17 ≥95%DTOC for wiltshire wards - Later Life Aug-17 7.50%
Timely Review and Care Plan < 4 wks of Review Apr-17 ≥95% 87.3% 89.5%18 week RTT Aug-17 ≥95% 93.7% 91.4%50% of people experiencing first episode of psychosis to access NICE approved care package within <2 wks. (Mandate 6.3) Aug-17 ≥50% 80.0% 100.0%Learning Disabi lity - Proportion of peple with a learning disability on the GP register receiving an annual health check Aug-17 ≥30.7% 48.6% 37.0%Access and waiting time standards for mental health services embedded (Mandate 6.3)
Men
tal H
ealth
9.5% 11.4%
Not Available
Plan
ned
Care
Unp
lann
ed C
are
Com
mun
ity S
ervi
ces
Not yet available
Annual data
NHS Wiltshire CCG IPR Group Dashboard Report DataPeriod
NationalTarget
YTD
LocalTarget
YTD
Performance
35
Section 3: Projects Wiltshire CCG QIPP Project RegisterOctober 2017 (Month 5)
Identified QIPP Scheme Executive Lead Project Manager Clinical Lead
17/18 QIPP target values (£000)
17/18 QIPP activity
reduction
RAG for planned
milestones
RAG for delivery of planned benefits
Exec Lead confidence in
QIPP 17/18 target delivery (%)
Urgent Care QIPP
BCF : Urgent Care at Home
Impact: Admission Avoidance
Director of Intergration
BCF : Intermediate Care
Impact: Admission Avoidance
Director of Intergration
BCF : Step-up Beds (existing)
Impact: Admission Avoidance Ted Wilson
WH&C : High Intensity Care
Impact: Admission AvoidanceTed Wilson
WH&C : Rehab Support Workers
Impact: Supports DischargeTed Wilson
ED Streaming
Impact: Admission AvoidanceJo Cullen
Paedriatric Admissions
Impact: Admission AvoidanceLucy Baker
Right Care : Circulartory Disease
Impact: Admission Avoidance Lucy Baker
Right Care : Trauma and Injuries & MSK Non Elective
Impact: Admission Avoidance
Lucy Baker
Planned Care QIPP
Demand Management Referral Management Centre Lucy Baker Lucy Baker Dr Andy Hall 166 1,383 G G 100%
Demand ManagementClinical Policies Lucy Baker Nadine Fox Dr Helen Osborn 910 1,846 G G 80%
Gastroenterology Lucy Baker Jo Williamson Dr Richard Sandford-Hill 35 174 R R 0%
MSK Lucy Baker Jill WhittingtonDr Tim King
Dr Lindsay KinlinDr Andrew Girdher
0 0 R £0
Savings Target
N/A
Follow-ups inc Patient Initiated Follow Ups Lucy Baker Ashley
Windebank-Brooks Dr Andy Hall 163 2,251 G G 100%
Rheumatology Lucy Baker Nadine Fox Dr Elizabeth Shaw Dr Lynne McReady 240 0 R R 0%
Ophthalmology Lucy Baker Jo Williamson Dr Andy Hall 217 2,522 G G 100%
Other QIPP
Prescribing Jo Cullen Alex GoddardDr Helen Osborn
(TBC) other GP practice
2,500 N/A TBC R TBC
Continued Health CarePatient Reviews Dina McAlpine Kate Purser N/A 500 N/A TBC R TBC
2233 1039Multiple Multiple R
36
The Programme Management Office (PMO) tracks progress of delivery through meetings with project managers and also the Directorate Dashboards which are reviewed monthly by the Executive Management Team. The PMO also produces status reports for the CCG’s Finance and Performance Committee.
A number of mechanisms designed to increase accountability, identified by internal audit and agreed by the CCG’s Audit and Assurance Committee are included in the PMO reporting process and this Integrated Performance Report.
Update on the 17/18 QIPP workstreams
August 2017 performance data is shown in this report.
The 17/18 Delivery Plan included the requirement for QIPP savings to be delivered in order to achieve financial balance. QIPP is divided into the following categories:
Urgent Care – delivered through a combination of workstreams including the Better Care Fund, activities linked to adult community services, Paediatric admission avoidance and elements of the national RightCare programme. The required savings target for urgent care is £2.3m. Urgent Care QIPP is monitored using SLAM data.
Planned Care – a number of schemes identified to deliver the target. Planned Care QIPP is monitored using SUS data.
Other QIPP – delivered through initiatives in Primary Care Prescribing and CHC Reviews. Performance in the other QIPP programmes is monitored using multiple data sources each of which received validation by the Finance department.
Practice contribution to QIPP schemes – GP practices across the three Wiltshire locality groups also contribute to QIPP delivery. This information is made available to practices via a separate practice report, which is produced on a quarterly basis by the CSU. Each report contains a section entitled ‘QIPP projects’, which outlines the contribution that each practice has made, within that locality, towards QIPP delivery.
Non Programme Related Activity – including running costs.
The total QIPP target across all CCG areas is £14.5 million.
In the remainder of this section, high level indicators of performance are shown along with commentary from directors responsible for programme related activity schemes identified to deliver financial savings. Planned Care will indicate both the financial and activity performance.
37
Urgent Care QIPP will be delivered through the following identified workstreams resulting in the delivery of £2.3 million savings:
Initiative Description of Impact Cost Impact
BCF : Urgent Care at Home Admission avoidance £600,000
BCF : Urgent Care at Home Phase 2 Admission avoidance £150,000
BCF : Step Up Beds (Existing) Admission avoidance £105,000
BCF : Intermediate Care (South) Admission avoidance £150,000
ED Streaming Admission avoidance £75,000
WH&C - High Intensity Care Admission avoidance £112,500
WH&C - HomeFirst / Rehab Support Workers Supports discharge £135,863
Paediatric admissions Admission avoidance £630,000
Right Care : Circulatory Disease Admission avoidance £100,000
Right Care : Trauma and Injuries Admission avoidance£175,000
Right Care: MSK Non Elective Admission avoidance
38
Better Care Fund – Elements contributing to CCG Urgent Care QIPP targets
Programme Director: Sue Shelbourne-Barrow
Month 4
1. Non Elective Admissions:Non elective activity to M05 is up 1.2% (212 admissions) on the same period last year. Growth is being seen in the Age 18-64 age band while admissions for those aged 65 and over are broadly similar to last year. Admissions for children are slightly down on last year.
Substantial growth in being seen at RUH which has seen an increase of 6.7% (412 admissions), GWH has seen activity broadly similar to last year which is showing a rise of 0.8% (36 admissions) and activity at SFT is down 1.1% (66 admissions). In terms of QIPP the CCG has seen a greater reduction in activity than planned but this has not translated into the expected financial savings, perhaps suggesting increased acuity in patients.
The BCP schemes have remained broadly similar and continue to be successful in managing population growth in those aged 65 and over, of more than 11% in the last 4 years and ensuring older residents of Wiltshire are able to be cared for and supported in their own communities.
On the wider definition of avoidable admissions originally used for the Better Care Plan admissions are down around 13.5% (505 admissions) with reductions across all 3 age groups. The reduction is those aged 65+ is 16.5% (334 admissions). This continues the trend seen in 2016-17 and is perhaps further evidence that the admissions generally are likely to have a greater acuity. This is also reflected in the National Integration Dashboard which shows Wiltshire has a low level of admissions but a high 90th Centile length of stay.
Using the narrower CCG definition there has also been a reduction in avoidable emergency admissions which to month 3 of around 15% (196 admissions). Reductions are being seen across all 3 broad age bands with the greatest reductions seen in those aged 65 and over of around 19% (120 admissions). In 2016-17 there was an overall increase in the volume of avoidable admissions of 4.2% (178 admissions) in 2016-17. This was driven by increases in admissions for the working age population of 10.1% (150 admissions). For the population aged 65 there has been a marginal increase of 0.7% (18 admissions), as we have seen an increase in the number of patients being managed through our alternative schemes in the community.
2. Delayed Transfers of Care:Delayed Transfers of Care – Days increased slightly in August to 2,329 this is around 700 days over the BCF plan. This represents 75.1 daily delayed days, which is well above the NHS England target for Wiltshire of 42.9 daily delayed days. The
39
monthly average for daily delayed days in 2016/17 was 79.4 which was higher than the 2015/16 average of 49.0.
The main reasons for the increase in the number of delays include;
- Demand outstripping current supply for domiciliary care services
- Workforce challenges across our out of hospital system
- Increased complexity and demand for specialist placements
- Transition to new care providers
Work is ongoing to ensure accuracy and consistency of recording both locally and nationally and new processes have been agreed at SFT. A range of recovery actions are in place and are described later in more detail in the paper but improvements in flow have been seen across the last 3 months as more capacity comes on line.
Other BCP Indicators:
In September 2017 there was a net increase of 31 new permanent admissions taking the total for the YTD to 248 admissions. This sees levels of admissions back to the monthly average of around 36. A simple forecast for year-end would be around 500 which is close to the 525 target. A review of data quality is currently being completed and we expect to see the numbers fall in the next month data is incorrectly coded entries are removed. Keeping these admissions low is one of the key strategic intentions within the Better Care Plan. To achieve this more residents of Wiltshire are receiving longer term care at home post discharge. The Better Care Plan continues to try and reduce the number of permanent admissions to nursing and residential homes.
In relation to the 91 day indicator performance continues to be strong but data for Q4 discharges shows a reduction to around 78.8%. The figure which will be reported for ASCOF was around 66% due to issues around data protection for patients treated by the neighbourhood teams. This is included in the BCF integration dashboard and had the 2016-17 performance been included in the calculation Wiltshire would be the 5th most challenged area in England. Overall NT performance is strongest but currently the summary data we receive cannot be included in our ASCOF return. This again suggests that when we discharge patients home they remain home and independent for longer, again key outcomes we set out to achieve in our Better Care Plan.
In March the Dementia diagnosis rate was 67.1% hitting the BCF and National Target for the first time. 23 practices have achieved the national target, while 18 practices are below 60% and of these 2 are below 40%. The methodology has changed and the denominator is now updated monthly, in August the diagnosis rate was 65.6%, with a net decrease in patients on the register of 16 and an increase in the expected number of 14.
40
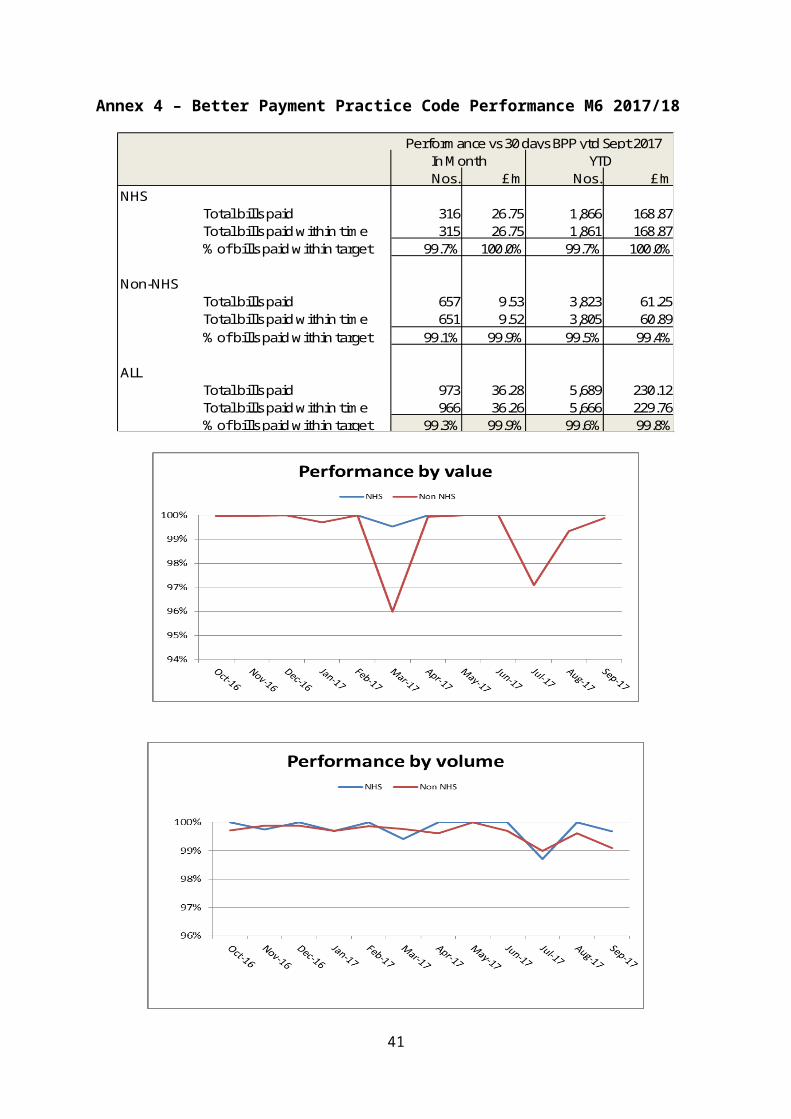
Following a successful procurement exercise last year April saw a number of new providers come on line for our intermediate care bed service and a number of existing providers alter or reduce provision. In July the number of admissions was 50 continuing at similar levels to those seen in Q1. Discharges increased slightly in July to 53. Length of stay for step down rehab patients in June was 32.3 days which is a strong performance, however it should be noted that general average length of stay is impacted on by inappropriate admissions; predominately patients waiting for dom care and long term placements
New help to live at home activity was higher in September than August, ongoing help to live at home activity has been maintained as we have seen greater demand for core services but increasing supply to meet it due to the transition to the new provider in the north of the county and UCAH capacity coming back on line and steadily increasing to levels seen prior to the CQC restriction. UCAH remains under the target of 80 referrals a month but is now also achieving a similar admission avoidance percentage.
41
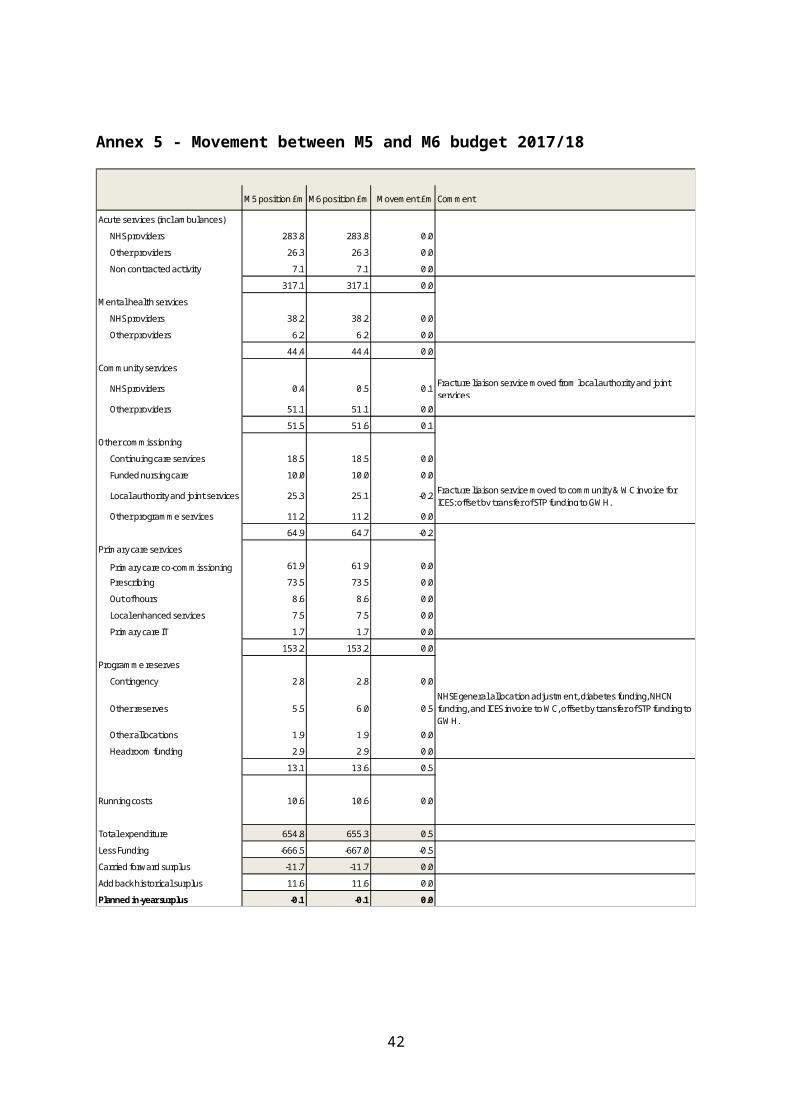
Schemes Continued from the BCF 15/16 & 16/17
1. Care Home Liaison for Dementia
This service is now in place and providing support for 86 care homes in Wiltshire and community services. Following performance analysis and a presentation to the BCP system wide steering Group a decision has been made to refocus the care pathways and ensure closer linkage with hospital front door, urgent care at home and community services. Performance levels in the last few months have suggested this has had an impact.
2. Integrated Discharge
Individual action plans in place with each acute Trust and this is being delivered in line with the system wide DTOC plan. All 3 acute hospitals now have integrated discharge strategies and project structures in place and are delivering to plan, this provides the opportunity to standardise our approach to discharge management across the county.
3. Enabling technologies Inc Telehealth and Telecare
This area of work is being progressed by the Prevention Board of the BCF and agreed actions in place to increase use of telehealth. This will become a core provision option as part of the integrated discharge programme. Agreement has been made to widen the core offer for telecare and offer to a wider range of patients over the age of 65, this approach will be piloted at GWH from the 1st November.
4. Enhancing Urgent Care at Home to include
(a) EOL rapid support
(b) MH crisis management.
(c) Confirmed pathways and non-conveyance opportunities.
Service has consistently been managing a high level of referrals and March and April both saw record numbers of referrals. However, the dom care provider MI home Care was subject to a CQC embargo between May and August 2016 and this impacted considerably on activity levels
Pre the winter period the service will be further bolstered by additional care resource in the urgent care at home model.
5. 72-hour pathway for end of life (SFT)
On track for go live and recruitment completed. Service has now gone live and monthly updates will be provided from September and the service is currently managing around 4 complex patients per week. It is clear from the evidence that
42
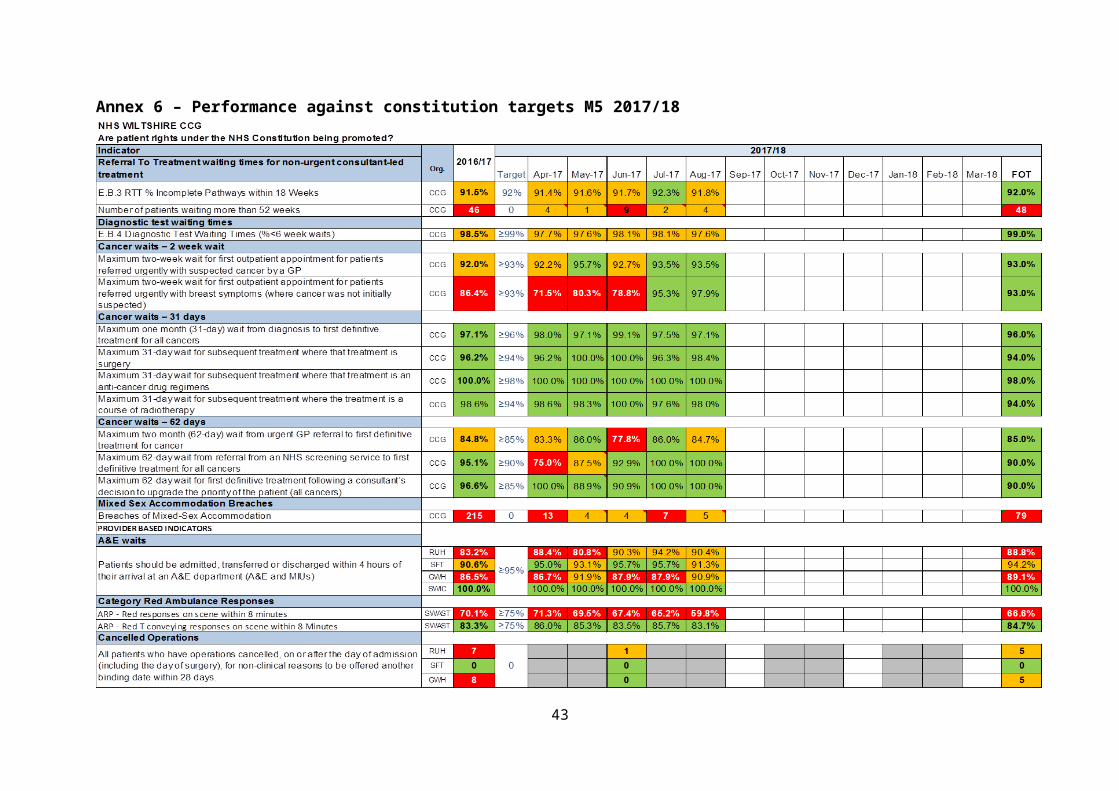
these patients would admit and stay inappropriately in this service had the alternative pathway not been made available
6. Identified key worker as case manager
Where Integrated Teams are in place this is working and key workers play a key part in the discharge and case management of patients. However not all integrated teams are fully operational and we need to establish an overview of service provision so key actions can be prioritised.
Progress is being made on developing a locality based clinical model for intermediate care and this will be key in developing trusted assessment approaches and improving the clinical pathway for intermediate care.
7. Comprehensive service for Dementia patients
See care home liaison update above.
8. Referral Management - revised communications
Was discussed at WYKDD GP forum and GPs agreed with the suggest direction and aim is to roll this out across Wiltshire in the form of a revised BCP Newsletter.
Revised winter planning communications and referral guide were discussed and signed off at the BCP Winter Plan Steering Group has been circulated across the system from the 1st November.
Other campaigns include a focused approach to reviewing care packages in November and releasing bed capacity in December and these will be system wide events.
9. Falls Strategy
Scheme being managed by the system wide bone health group and monthly updates are being provided.
Evaluation of the Fracture Liaison Service at SFT has been undertaken and it is pleasing to note that the service has exceeded its entire core KPIs and have provided a strong case for continuation. This service is now funded until the end of 2017/18.
Fracture liaison services were identified as a key priority through the STP process and further consideration will be given to extending this service to GWH and RUH.
10. Intermediate Care
70 beds continue and service continues to reduce LOS and receive a high level of referrals. Key actions for the next period include:
43
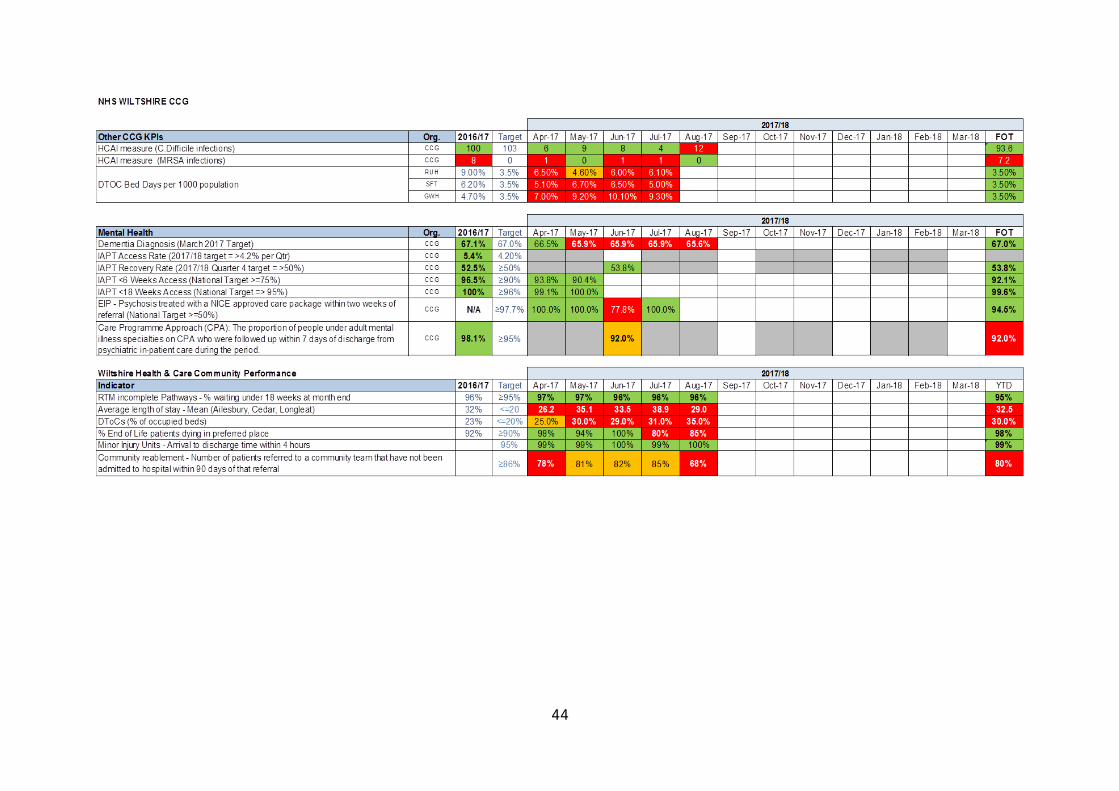
1. Recommissioning of these beds has been successfully completed and new beds are now all online and accepting patients.
2. Commence focused training plans with each home.
3. Audit admissions into ICT beds to determine the proportion of rehab admissions v social care admissions
4. Tightening referral criteria so only rehab patients are managed through the pathway
11.Admission Avoidance
No commentary provided as key points in each relevant scheme area.
12.Step up care (Community hospitals and IC)
Monthly reports continue to be provided but performance has been impacted on by increased demand for step down beds due to pressures at each acute hospital and increase in delayed transfers of care.
Planned actions for the next period:
1. Next quarterly clinical audit to be undertaken to ascertain appropriateness of admission and performance of service;
2. Enhance step up care at home and in CH Beds as part of the integrated discharge programme.
13.Front door assessment and discharge through access to care (Admission avoidance)
Key actions being developed as part of the Integrated Discharge Programme with monthly updated.
14.Community Geriatrics
Service continues to report outcomes on an ongoing basis. There are concerns in relation to the level of service being provided in SFT and this will need review
Planned action for the next period:
1. Undertake clinical audit of community geriatrician service in the South;
2. Agree approach with Sarum GPs for interface with this scheme to improve coverage and outcomes;
3. Ensure that the community geriatrician service and resource plays a key part in the integrated discharge programme across Wiltshire.
44
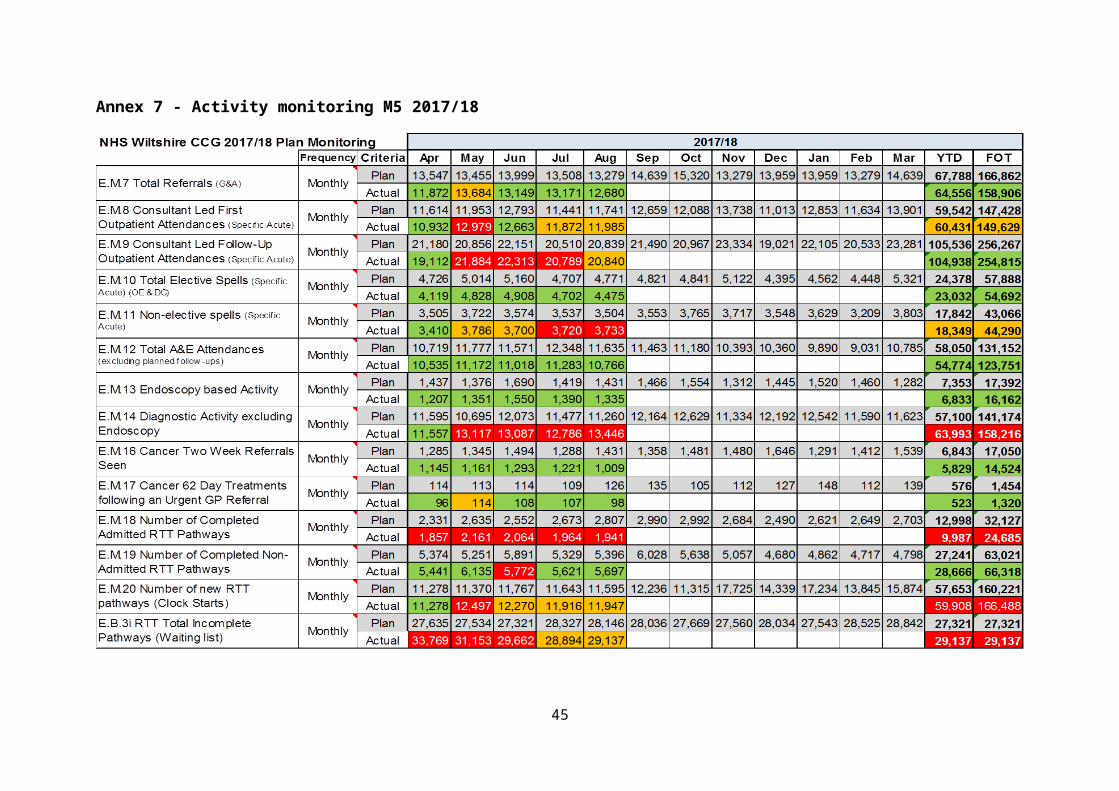
15.72-hour pathway for end of life (GWH and RUH)
Service continues and monthly reports provided.
Confidence level for delivery of overall BCF work streams – 65%Higher Intensity Care (HIC) Programme delivered through Wiltshire Health & Care (WHC) Programme Director: Ted Wilson
Programme delivered through Wiltshire Health & Care (WHC)
This data is now being shown on the monthly dashboard. Admissions to the service were 17, 14, 16, 6, 10 for Mar, Apr, May, June and July and 14 for August. The Length Of Stay has increased to 10.5 days.
Confidence level – 100%
45
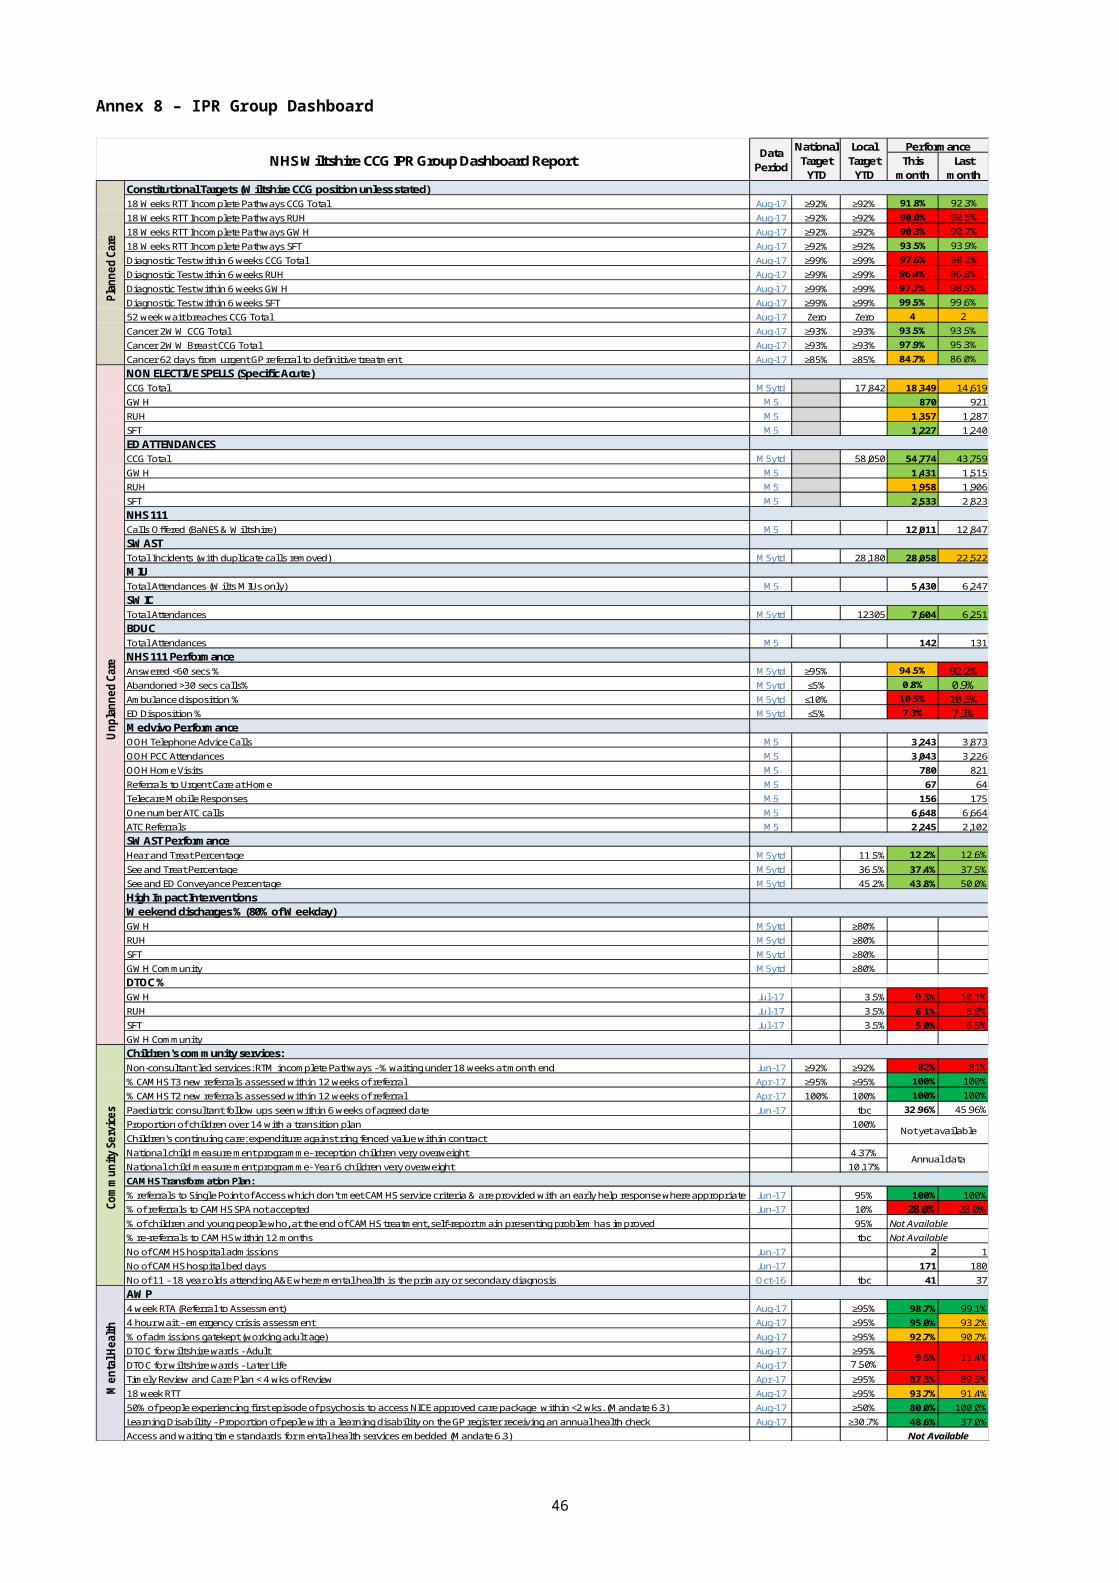
PLANNED CARE QIPPProgramme Director: Lucy Baker
Finance
This section is included to indicate the financial performance of a scheme against target
17/18 Targeted Savings £1,900,000 YTD Targeted Savings £794,995YTD Savings Achieved £1,224,607YTD Variance on Target £429,612
£79,167 -£335,322 £335,321.69-£79,167 -£335,322 -£335,322
Gastroenterology £186,444 £48,319 £30,848 -£335,322 £48,319 Gastroenterology : £48,319
Triage £339,529 -£63,825 £79,167 -£271,497 -£63,825 Triage : -£63,825
Follow Ups £1,206,139 -£9,065 £79,167 -£326,257 -£9,065 Follow Ups : -£9,065
Clinical Priorities£4,357,201 -£117,733 £79,167 -£217,589 -£117,733 Clinical Priorities : -£117,733
PIFU Expansion £1,302,371 -£111,288 £79,167 -£224,033 -111288.3609 PIFU Expansion : -£111,288
Demand Management£3,338,975 -£335,322 £79,167 £0 -335321.6899 Demand Management : -£335,322
Rheumatology 0 79166.66667 0 -335321.69 79166.66667 Rheumatology : £79,167
Apr May Jun Jul Aug Sep Oct Nov Dec Jan Feb Mar YTD Full Year16/17 Baseline + Growth £2,002,404 £2,261,007 £2,368,790 £2,311,612 £2,422,539 £2,142,437 £2,298,938 £2,296,442 £1,898,843 £2,147,229 £1,993,791 £2,276,345 £11,366,352 £26,420,377Planned QIPP Reduction £163,811 £155,211 £155,211 £159,691 £161,072 £171,336 £152,749 £154,814 £154,814 £160,430 £160,430 £150,431 £794,995 £1,900,000
17/18 Plan £1,838,593 £2,105,796 £2,213,579 £2,151,921 £2,261,468 £1,971,100 £2,146,189 £2,141,628 £1,744,028 £1,986,799 £1,833,361 £2,125,914 £10,571,357 £24,520,376
17/18 Actuals £1,933,201 £2,143,532 £2,217,489 £1,907,000 £1,940,523 £10,141,745Difference £94,608 £37,736 £3,910 -£244,921 -£320,945 -£429,612 #
This section is included to indicate whether a scheme is delivering the activity reductions required
17/18 Targeted Reduction 8,176 YTD Targeted Reduction 3,074
YTD Reduction Achieved 6,350YTD Variance on Target 3,276
969 -2,290 2,290-969 -2,290 -2,290
Gastroenterology 915 230 739 -2,290 230 Gastroenterology : 230
Ophthalmology Triage 2,275 -440 969 -1,850 -440 Ophthalmology Triage : -440
Community Service Development15,324 -232 969 -2,058 -232 Community Service Development : -232
Clinical Priorities 2,708 969 0 -2,290 969 Clinical Priorities : 969
PIFU Expansion 15,277 -1,514 969 -776 -1,514 PIFU Expansion : -1514
Demand Management 18,685 -2,290 969 0 -2,290 Demand Management : -2290
Rheumatology 0 0 969 -2290 Rheumatology : 0
Apr May Jun Jul Aug Sep Oct Nov Dec Jan Feb Mar YTD Full Year16/17 Baseline + Growth 10,182 11,732 12,299 11,753 12,291 11,754 12,286 12,287 10,562 12,248 11,129 11,811 58,257 140,334Planned QIPP Reduction 580 593 593 648 660 686 683 700 700 777 777 777 3,074 8,176
17/18 Plan 9,602 11,139 11,706 11,105 11,631 11,069 11,603 11,586 9,862 11,471 10,352 11,033 55,183 132,158
17/18 Actuals 9,585 10,831 11,092 10,072 10,327 51,907Difference -17 -308 -614 -1,033 -1,304 -3,276 #
Planned Care QIPP Performance - Month 5 (August) Reductions in Admissions and Outpatient Attendances
Activity
The below summary includes the combined details of all the individual schemes contributing to the QIPP performance in the planned care work stream.The detail behind each individual scheme can be found on separate tabs within this report.
£0 £200,000 £400,000 £600,000 £800,000 £1,000,000 £1,200,000 £1,400,000 £1,600,000 £1,800,000
Savings to be… YTD Savings Below…YTD Savings Above Target YTD TargetEnd of Year Target
-£400,000-£350,000-£300,000-£250,000-£200,000-£150,000-£100,000-£50,000£0£50,000£100,000
Gastroenterology : £48,319
Triage : -£63,825
Follow Ups : -£9,065
Clinical Priorities : -£117,733
PIFU Expansion : -£111,288
Demand Management : -£335,322
Rheumatology : £79,167
0 1,000 2,000 3,000 4,000 5,000 6,000 7,000 8,000
Reduction to be Delivered YTD Reductions Below TargetYTD Reductions Above TargetYTD Reduction Target
-2,500-2,000-1,500-1,000-50005001,0001,500
Gastroenterology : 230
Ophthalmology Triage : -440
Community Service Development : -232
Clinical Priorities : 969
PIFU Expansion : -1514
Demand Management : -2290
Rheumatology : 0
MSKWH&C responded to WCCG 27.09.17 affirming that they are able to deliver the required service within the financial envelope, however critical issues were raised in terms of phasing and service delivery targets. Issues have also been raised separately in terms of perceived underinvestment which although separate impacts the mobilisation of the new service. WCCG are due to respond to WH&C w/c 09.09.17. There is a risk that this may impact progress however it is believed that a negotiable position can be achieved.
46
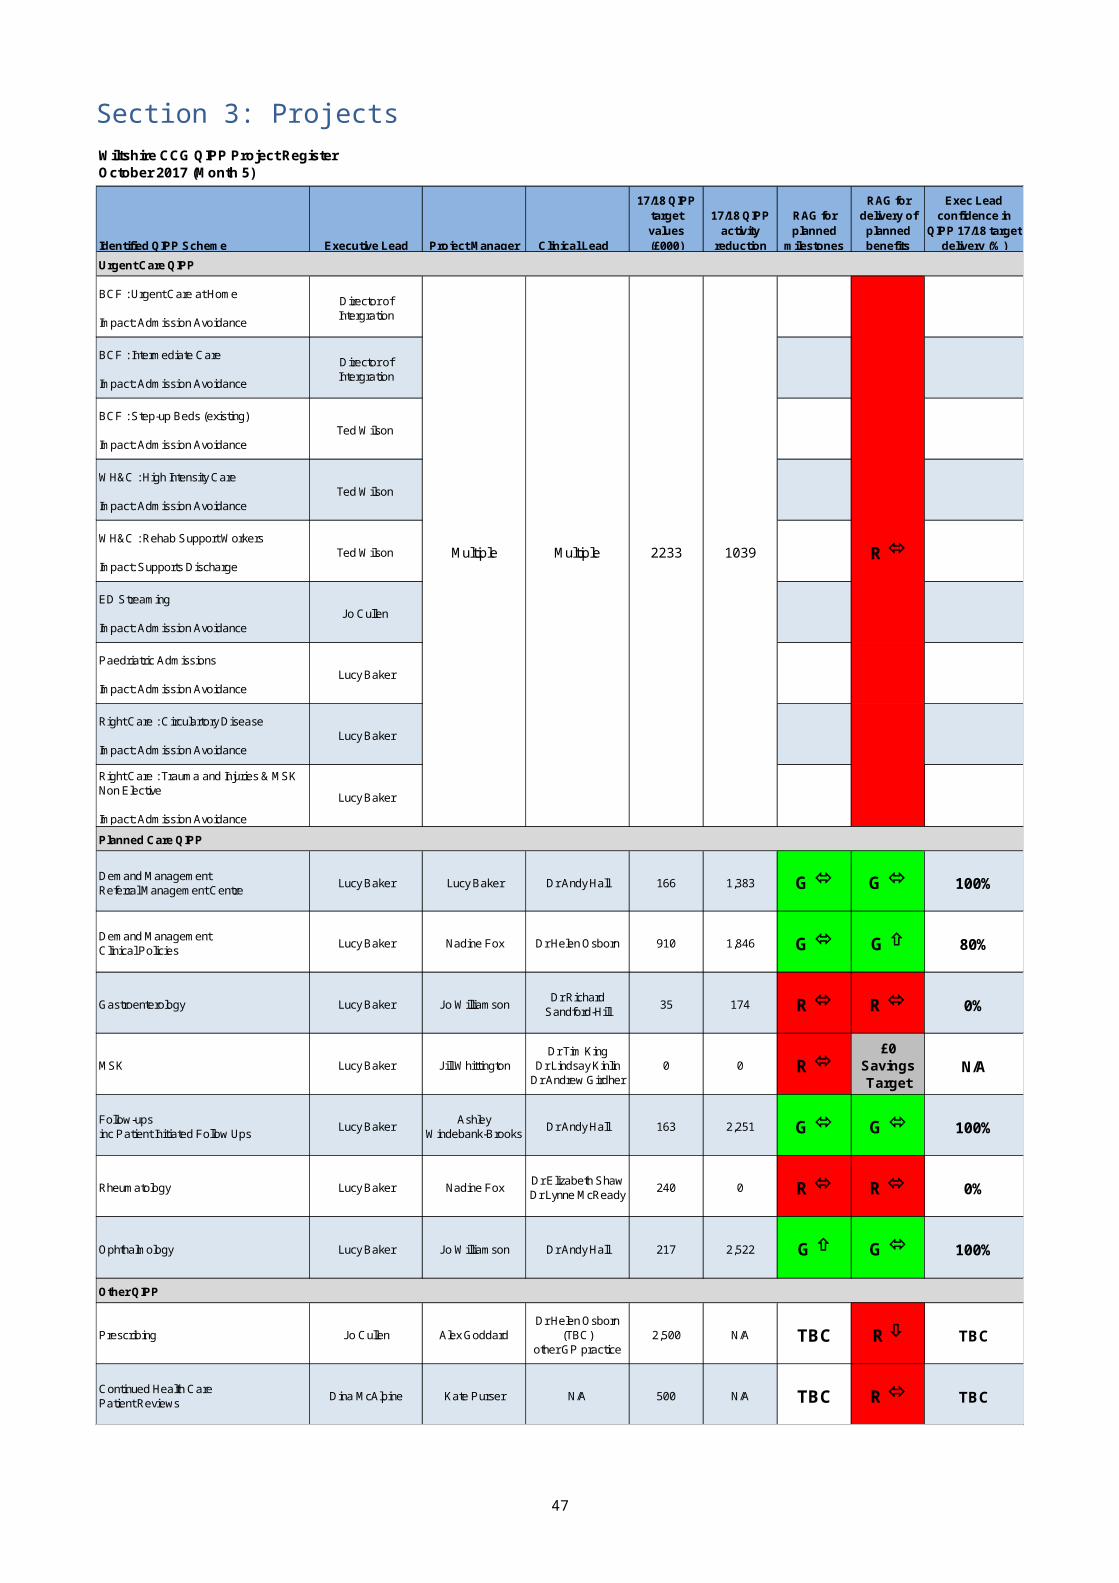
Follow Ups
Finance
This section is included to indicate the financial performance of a scheme against target
17/18 Targeted Savings £163,056 YTD Targeted Savings £49,802
YTD Savings Achieved £161,090
YTD Variance on Target £111,288£111,288 £161,090
Apr May Jun Jul Aug Sep Oct Nov Dec Jan Feb Mar YTD Full Year16/17 Baseline + Growth £234,030 £273,035 £286,037 £273,035 £286,037 £273,035 £286,037 £286,037 £247,032 £286,037 £260,033 £273,035 £1,352,173 £3,263,418Planned QIPP Reduction £8,519 £8,519 £8,519 £12,123 £12,123 £12,123 £14,106 £14,106 £14,106 £19,604 £19,604 £19,604 £49,802 £163,056
17/18 Plan £225,511 £264,516 £277,518 £260,912 £273,914 £260,912 £271,930 £271,930 £232,925 £266,432 £240,429 £253,431 £1,302,371 £3,100,362
17/18 Actuals £212,704 £251,868 £270,477 £222,548 £233,486 £1,191,083Difference -£12,807 -£12,648 -£7,041 -£38,364 -£40,428 -£111,288 #
This section is included to indicate whether a scheme is delivering the activity reductions required
17/18 Targeted Reduction 2,251 YTD Targeted Reduction 691
YTD Reduction Achieved 2,205
YTD Variance on Target 1,5141,514 2,205
Apr May Jun Jul Aug Sep Oct Nov Dec Jan Feb Mar YTD Full Year16/17 Baseline + Growth 2,764 3,224 3,378 3,224 3,378 3,224 3,378 3,378 2,917 3,378 3,071 3,224 15,968 38,537Planned QIPP Reduction 119 119 119 167 167 167 194 194 194 270 270 270 691 2,251
17/18 Plan 2,645 3,105 3,259 3,057 3,211 3,057 3,184 3,184 2,723 3,108 2,800 2,954 15,277 36,286
17/18 Actuals 2,559 2,897 3,035 2,581 2,691 13,763Difference -86 -208 -224 -476 -520 -1,514 #
Activity
Planned Care QIPP Performance - Outpatient Patient Initiated Follow Ups (PIFU) Expansion - Month 5 (August)
£0 £20,000 £40,000 £60,000 £80,000 £100,000 £120,000 £140,000 £160,000 £180,000 £200,000
Savings to be Delivered YTD Savings Below Target YTD Savings Above Target YTD Target End of Year Target
0 250 500 750 1,000 1,250 1,500 1,750 2,000 2,250 2,500
Reduction to be Delivered YTD Reductions Below Target YTD Reductions Above Target YTD Reduction Target End of Year Target
Roll out continues across providers, with most expanding across new specialities. Performance shows over achievement of £111k against the target, representing 98% of the years target.
The primary risk continues that capacity released from a reduction follow ups accepted may not be released as the trusts use that to see patients within their hold files, the benefit of this is a reduction of waiting for follow up to potentially a more appropriate timeframe and then the patient can be considered for discharge or PIFU. The risk is mitigated by including requirements within the contract for 17/18 to apply PIFU to hold files.
47
A secondary risk relates to providers being able to report progress to PIFU internally to identify patients offered a PIFU to those who have taken up the appointment. This is currently being worked on however may take some time to resolve as part of larger reporting issues or IT system changes.
Confidence level – 100%
Demand Management (RSS)
Finance
This section is included to indicate the financial performance of a scheme against target
17/18 Targeted Savings £166,069 YTD Targeted Savings £39,652
YTD Savings Achieved £374,973
YTD Variance on Target £335,322
£335,322 £374,973
Apr May Jun Jul Aug Sep Oct Nov Dec Jan Feb Mar YTD Full Year16/17 Baseline + Growth £584,762 £682,223 £714,709 £682,223 £714,709 £682,223 £714,709 £714,709 £617,249 £714,709 £649,736 £682,223 £3,378,626 £8,154,184Planned QIPP Reduction £6,184 £7,581 £7,581 £8,462 £9,843 £12,965 £17,188 £19,253 £19,253 £19,253 £19,253 £19,253 £39,652 £166,069
17/18 Plan £578,578 £674,641 £707,128 £673,761 £704,867 £669,258 £697,522 £695,456 £597,996 £695,456 £630,483 £662,970 £3,338,975 £7,988,115
17/18 Actuals £546,928 £644,935 £637,605 £574,903 £599,282 £3,003,653Difference -£31,650 -£29,706 -£69,523 -£98,858 -£105,585 -£335,322 #
This section is included to indicate whether a scheme is delivering the activity reductions required
17/18 Targeted Reduction 1,383 YTD Targeted Reduction 330
YTD Reduction Achieved 2,620
YTD Variance on Target 2,2902,290 2,620
Apr May Jun Jul Aug Sep Oct Nov Dec Jan Feb Mar YTD Full Year16/17 Baseline + Growth 3,291 3,840 4,022 3,840 4,022 3,840 4,022 4,022 3,474 4,022 3,657 3,840 19,015 45,892Planned QIPP Reduction 52 63 63 70 82 108 143 160 160 160 160 160 330 1,383
17/18 Plan 3,240 3,776 3,959 3,769 3,940 3,732 3,879 3,862 3,314 3,862 3,496 3,679 18,685 44,509
17/18 Actuals 2,966 3,494 3,477 3,173 3,285 16,395Difference -274 -282 -482 -596 -655 -2,290 #
Planned Care QIPP Performance - Demand Management - Month 5 (August)
Activity
£0 £25,000 £50,000 £75,000 £100,000 £125,000 £150,000 £175,000 £200,000 £225,000 £250,000 £275,000 £300,000 £325,000 £350,000 £375,000 £400,000
Savings to be Delivered YTD Savings Below Target YTD Savings Above Target YTD Target End of Year Target
0 100 200 300 400 500 600 700 800 900 1,000 1,100 1,200 1,300 1,400 1,500 1,600 1,700 1,800 1,900 2,000
Reduction to be Delivered YTD Reductions Below Target YTD Reductions Above Target YTD Reduction Target End of Year Target
Specialty phasing continues as planned. Confidence remains to achieve 100% of QIPP target.
Confidence level – 100%
48

Ophthalmology
Finance
This section is included to indicate the financial performance of a scheme against target
17/18 Targeted Savings £216,690 YTD Targeted Savings £90,140YTD Savings Achieved £163,029
YTD Variance on Target £72,889£72,889 £163,029
-£9,065 -£63,825 £63,824.63£9,065 -£63,825 -£63,825
Ophthalmology Triage£339,529 -£63,825 -£9,065 £0 -£63,825 Ophthalmology Triage : -£63,825
Community Service Development£1,206,139 -£9,065 -£9,065 -£54,760 -£9,065 Community Service Development : -£9,065
Apr May Jun Jul Aug Sep Oct Nov Dec Jan Feb Mar YTD Full Year16/17 Baseline + Growth £283,121 £330,307 £346,036 £330,307 £346,036 £330,307 £346,036 £346,036 £298,849 £346,036 £314,578 £330,307 £1,635,807 £3,947,958Planned QIPP Reduction £18,028 £18,028 £18,028 £18,028 £18,028 £18,028 £18,028 £18,028 £18,028 £18,146 £18,146 £18,146 £90,140 £216,690
17/18 Plan £265,092 £312,279 £328,008 £312,279 £328,008 £312,279 £328,008 £328,008 £280,821 £327,890 £296,432 £312,161 £1,545,667 £3,731,268
17/18 Actuals £274,676 £295,326 £317,061 £288,556 £297,159 £1,472,778Difference £9,584 -£16,953 -£10,947 -£23,723 -£30,849 -£72,889 #
This section is included to indicate whether a scheme is delivering the activity reductions required
17/18 Targeted Reduction 2,522 YTD Targeted Reduction 1,049
YTD Reduction Achieved 1,721YTD Variance on Target 672
672 1,721
-232 -440 440232 -440 -440
Ophthalmology Triage 2,275 -440 -232 0 -440 Ophthalmology Triage : -440
Community Service Development15,324 -232 -232 -207 -232 Community Service Development : -232
Apr May Jun Jul Aug Sep Oct Nov Dec Jan Feb Mar YTD Full Year16/17 Baseline + Growth 3,227 3,765 3,945 3,765 3,945 3,765 3,945 3,945 3,407 3,945 3,586 3,765 18,648 45,006Planned QIPP Reduction 209 210 210 210 210 210 210 210 210 211 211 211 1,049 2,522
17/18 Plan 3,018 3,555 3,735 3,555 3,735 3,555 3,735 3,735 3,197 3,734 3,375 3,554 17,599 42,484
17/18 Actuals 3,170 3,386 3,619 3,347 3,405 16,927Difference 152 -169 -116 -208 -330 -672 #
Activity
Ophthalmology QIPP Performance - Month 5 (August) Reductions in Outpatient Attendances
The below summary includes the combined details of all the individual schemes contributing to the QIPP performance in the ophthalmology work stream: Ophthalmology Triage and Community Service Development
£0 £25,000 £50,000 £75,000 £100,000 £125,000 £150,000 £175,000 £200,000 £225,000
Savings to be… YTD Savings Below…YTD Savings Above Target YTD TargetEnd of Year Target
-£80,000
-£70,000
-£60,000
-£50,000
-£40,000
-£30,000
-£20,000
-£10,000£0
Ophthalmology Triage : -£63,825
Community Service Development : -£9,065
0 250 500 750 1,000 1,250 1,500 1,750 2,000 2,250 2,500 2,750
Reduction to be Delivered YTD Reductions Below TargetYTD Reductions Above TargetYTD Reduction Target -800-700-600-500-400-300-200-1000
Ophthalmology Triage : -440
Community Service Development : -232
QIPP savings show a saving against expected levels of performance due to effective triaging and have now exceeded the target for 17/18.
The plan for the development of a community service model has been approved by Governing Body with mobilisation in 18/19. The Ophthalmology pilot with Evolutio finished at the end of September, with the CCG service commencing on the 1st October.
49
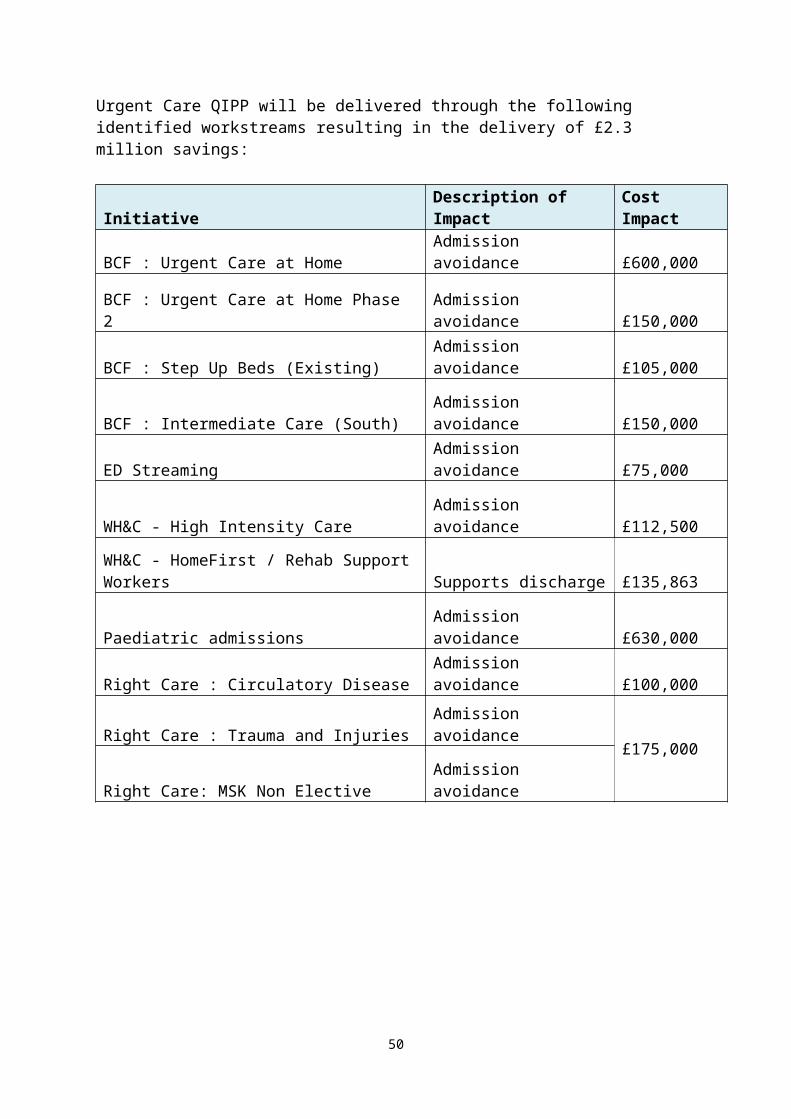
Due to continued pressures in the acute services, the impact of the pilot has not yet been seen in savings in Ophthalmology spend. This is likely due to providers using any released capacity to clear backlog. Regarding the High Cost Drugs element, NICE guidance is on hold until Jan 18, so a temporary workaround is being devised and implemented. Confidence level – 100%
Rheumatology
Finance
This section is included to indicate the financial performance of a scheme against target
17/18 Targeted Savings £240,000 YTD Targeted Savings £79,167
YTD Savings Achieved £0
YTD Variance on Target -£79,167
-£79,167 £0
Apr May Jun Jul Aug Sep Oct Nov Dec Jan Feb Mar YTD Full Year16/17 Baseline + Growth £0 £0 £0 £0 £0 £0 £0 £0 £0 £0 £0 £0 £0 £0Planned QIPP Reduction £15,833 £15,833 £15,833 £15,833 £15,833 £22,976 £22,976 £22,976 £22,976 £22,976 £22,976 £22,976 £79,167 £240,000
17/18 Plan -£15,833 -£15,833 -£15,833 -£15,833 -£15,833 -£22,976 -£22,976 -£22,976 -£22,976 -£22,976 -£22,976 -£22,976 -£79,167 -£240,000
17/18 Actuals £0 £0 £0 £0 £0 £0Difference £15,833 £15,833 £15,833 £15,833 £15,833 £79,167 #
This section is included to indicate whether a scheme is delivering the activity reductions required
17/18 Targeted Reduction 0 YTD Targeted Reduction 0
YTD Reduction Achieved 0
YTD Variance on Target 00
Apr May Jun Jul Aug Sep Oct Nov Dec Jan Feb Mar YTD Full Year16/17 Baseline + Growth 0 0 0 0 0 0 0 0 0 0 0 0 0 0Planned QIPP Reduction 0 0 0 0 0 0 0 0 0 0 0 0 0 0
17/18 Plan 0 0 0 0 0 0 0 0 0 0 0 0 0 0
17/18 Actuals 0 0 0 0 0 0Difference 0 0 0 0 0 0 0
Activity
Planned Care QIPP Performance - Rheumatology - Month 5 (August)
£0 £25,000 £50,000 £75,000 £100,000 £125,000 £150,000 £175,000 £200,000 £225,000 £250,000
Savings to be Delivered YTD Savings Below Target YTD Savings Above Target YTD Target End of Year Target
0 5 10 15 20 25 30 35 40 45 50 55 60 65 70 75 80 85 90 95 100 105 110 115 120
Reduction to be Delivered YTD Reductions Below Target YTD Reductions Above Target YTD Reduction Target End of Year Target
50

Confidence in achieving the £50k QIPP savings attributed to Blueteq have declined as a result of a longer than expected implementation process and issues raised by the Acute trusts. We are now not expecting to see a return until 1819.
The remaining £190k of QIPP savings were based on community services and as the STP project lead has left BaNES no developments have been undertaken with the community services and thus this £190k QIPP saving is no longer achievable.
Confidence level – 0%
51
Gastroenterology
Finance
This section is included to indicate the financial performance of a scheme against target
17/18 Targeted Savings £35,384 YTD Targeted Savings £14,235YTD Savings Achieved £0
YTD Variance on Target -£14,235
-£48,319 -£34,084
Apr May Jun Jul Aug Sep Oct Nov Dec Jan Feb Mar YTD Full Year16/17 Baseline + Growth £34,733 £40,522 £42,451 £40,522 £42,451 £40,522 £42,451 £42,451 £36,663 £42,451 £38,592 £40,522 £200,679 £484,331Planned QIPP Reduction £2,847 £2,849 £2,849 £2,845 £2,845 £2,845 £3,051 £3,051 £3,051 £3,051 £3,051 £3,051 £14,235 £35,384
17/18 Plan £31,886 £37,672 £39,602 £37,677 £39,607 £37,677 £39,401 £39,401 £33,612 £39,401 £35,541 £37,471 £186,444 £448,947
17/18 Actuals £46,030 £51,369 £44,684 £44,844 £47,836 £234,763Difference £14,144 £13,697 £5,082 £7,167 £8,229 £48,319 #
This section is included to indicate whether a scheme is delivering the activity reductions required
17/18 Targeted Reduction 174 YTD Targeted Reduction 70
YTD Reduction Achieved 0
YTD Variance on Target -70-230
Apr May Jun Jul Aug Sep Oct Nov Dec Jan Feb Mar YTD Full Year16/17 Baseline + Growth 170 199 208 199 208 199 208 208 180 208 189 199 985 2,377Planned QIPP Reduction 14 14 14 14 14 14 15 15 15 15 15 15 70 174
17/18 Plan 156 185 194 185 194 185 193 193 165 193 174 184 915 2,203
17/18 Actuals 227 248 217 218 235 1,145Difference 71 63 23 33 41 230 #
Planned Care QIPP Performance - Gastroenterology - Month 5 (August)
Activity
£0 £2,500 £5,000 £7,500 £10,000 £12,500 £15,000 £17,500 £20,000 £22,500 £25,000 £27,500 £30,000 £32,500 £35,000 £37,500 £40,000
Savings to be Delivered YTD Savings Below Target YTD Savings Above Target YTD Target End of Year Target
0 10 20 30 40 50 60 70 80 90 100 110 120 130 140 150 160 170 180 190 200
Reduction to be Delivered YTD Reductions Below Target YTD Reductions Above Target YTD Reduction Target End of Year Target
Confidence in achieving QIPP target has reduced to zero because. 1) There had been some increases in the number of referrals, 2) There is no lead assigned to this project in Wiltshire due to staff member reallocation 3) community plans on hold.
Confidence level – 0%
52
Clinical Policies
Finance
This section is included to indicate the financial performance of a scheme against target
17/18 Targeted Savings £910,477 YTD Targeted Savings £441,865
YTD Savings Achieved £559,598
YTD Variance on Target £117,733######## £117,733 £559,598
Apr May Jun Jul Aug Sep Oct Nov Dec Jan Feb Mar YTD Full Year16/17 Baseline + Growth £865,758 £934,920 £979,557 £985,525 £1,033,306 £816,350 £909,705 £907,208 £699,050 £757,996 £730,852 £950,258 £4,799,066 £10,570,485Planned QIPP Reduction £88,373 £88,373 £88,373 £88,373 £88,373 £88,373 £63,373 £63,373 £63,373 £63,373 £63,373 £63,373 £441,865 £910,477
17/18 Plan £777,385 £846,547 £891,184 £897,152 £944,933 £727,977 £846,331 £843,835 £635,677 £694,623 £667,479 £886,885 £4,357,201 £9,660,008
17/18 Actuals £852,863 £900,034 £947,662 £776,149 £762,760 £4,239,468Difference £75,478 £53,487 £56,478 -£121,003 -£182,173 -£117,733 #
-117733 -117733
This section is included to indicate whether a scheme is delivering the activity reductions required
17/18 Targeted Reduction 1,846 YTD Targeted Reduction 934
YTD Reduction Achieved 0
YTD Variance on Target -934-969 -35
Apr May Jun Jul Aug Sep Oct Nov Dec Jan Feb Mar YTD Full Year16/17 Baseline + Growth 729 704 746 725 738 726 732 734 584 695 626 783 3,642 8,522Planned QIPP Reduction 187 187 187 187 187 187 121 121 121 121 121 121 934 1,846
17/18 Plan 543 517 559 538 551 540 612 613 463 574 505 662 2,708 6,676
17/18 Actuals 663 806 744 753 711 3,677Difference 120 289 185 215 160 969 #
Planned Care QIPP Performance - Clinical Policies - Month 5 (August)
Activity
£0 £50,000 £100,000 £150,000 £200,000 £250,000 £300,000 £350,000 £400,000 £450,000 £500,000 £550,000 £600,000 £650,000 £700,000 £750,000 £800,000 £850,000 £900,000 £950,000
Savings to be Delivered YTD Savings Below Target YTD Savings Above Target YTD Target End of Year Target
0 250 500 750 1,000 1,250 1,500 1,750 2,000
Reduction to be Delivered YTD Reductions Below Target YTD Reductions Above Target YTD Reduction Target End of Year Target
Confidence in achieving the full £910k QIPP savings has declined. One reason for the reduced confidence is that many of the STP policies that have been implemented were based on the original Wiltshire policies. A proportion of the savings achieved ytd are as a result of less cataract procedures.
Confidence level – 80%
53
OTHER QIPP PROGRAMMES
Primary Care – PrescribingProgramme Director: Jo Cullen
Finance
This section is included to indicate the financial performance of a scheme against target
17/18 Targeted Savings £2,500,000 YTD Targeted Savings £186,111
YTD Savings Achieved £122,892
YTD Variance on Target -£63,219
-£63,219
Apr May Jun Jul Aug Sep Oct Nov Dec Jan Feb Mar YTD Full YearPlanned QIPP Savings £25,000 £25,000 £25,000 £25,000 £86,111 £147,222 £208,333 £269,444 £330,556 £391,667 £452,778 £513,889 £186,111 £2,500,000
Rebate Savings £39,197 £41,986 £41,709 £0 £0 £122,892GP Savings £0 £0 £0 £0 £0 £0Difference £14,197 £16,986 £16,709 -£25,000 -£86,111 -£63,219 #
Non Acute Commissioned Services - Prescribing - Patient Reviews - Month 5 (August
£0 £200,000 £400,000 £600,000 £800,000 £1,000,000 £1,200,000 £1,400,000 £1,600,000 £1,800,000 £2,000,000 £2,200,000 £2,400,000 £2,600,000
Savings to be Delivered YTD Savings Below Target YTD Savings Above Target YTD Target End of Year Target
Practices have information to continue with prescribing reviews. POD set up May 2017 and currently live for 5 practices. No prescribing data available until September 2017.
Confidence level - TBC
54
CHC Patient Reviews Programme Director: Dina McAlpine
Finance
This section is included to indicate the financial performance of a scheme against target
17/18 Targeted Savings £500,000 YTD Targeted Savings £53,882YTD Savings Achieved £24,911YTD Variance on Target -£28,971 -£28,971
Non Acute Commissioned Services - Continued Health Care - Patient Reviews - Month 5 (August)
A cohort of 31 individuals has been identified that need a full review to confirm their continuing eligibility status for CHC funding.
9 Reviews have been completed and eligibility decisions made:
4 No longer eligible – Funding ceased1 Remains eligible4 No Longer eligible – funding to cease after 28 days’ notice 3 Further reviews are in progress.
The remainder of the reviews have been delayed due to vacancies and sickness within the CHC team which has created capacity issues.
Confidence level – 75%
55

UPDATE ON OTHER PROGRAMMES
Below is commentary from Programme Directors about selected other programme areas.
The following are included for information. There are no QIPP savings identified for delivery through these programmes currently.
Diabetes Programme Programme Director: Ted Wilson
The Diabetes Programme Board took place on 28th September 2017, following a presentation on the PRIMIS tool the board agreed to rollout PRIMIS for diabetes monitoring, initial practices will be those holding virtual clinics. RUH and SFT representation was present, GWH have been unable to field representation. Joint procurement of pumps with CCG's in the South West was discussed ahead of a business case from the SW Paediatric Network, at present adult pumps are not included in the business case. Dr Atkin is writing a business case regarding the FreeStyle Libre continuous glucose monitor ahead of it being listed in the drug tariff. The first virtual clinic in North and West Wiltshire took place at Beversbrook; initial feedback was positive. In addition 9 HCP's joined the education session that run in conjunction with virtual clinics, these were reported to be mainly GP's. A Diabetes training event took place in Trowbridge during the same week which was well attended.
Diabetes Transformation bid update - Q2 funding has been received. Q2 Assurance submission will be submitted 13th October and rag rated GREEN overall. The additional education places are open for booking; all patients waiting for courses have been invited to book on to a course.
Diabetes Transformation bid update - The interviews for additional Diabetes Specialist Nurse at SFT was successful, the post holder is expected to start at the end of November.A Diabetes Unify collection is to be rolled out recording structured education places, MDT foot teams, diabetes inpatient specialist nursing and practices that will be benefit from transformation funding, the CSU has been made aware.National Diabetes Audit 16/17 - results will be published in November. Recruitment of a consultant to support the virtual clinics in East Wiltshire is still proving challenging all opportunities are being explored.
Confidence Level – 100%
56
End of Life (EOL) Care ProgrammeProgramme Director: Ted Wilson
2016/17 Workstreams, objectives and outcome measures approved by the EoL Programme Board:Education/training, Public Engagement and Refresh Strategy, Wiltshire Dying Well Community Charter, Workforce, Care at Home, Carers, BCF Integrated Commissioners, Dementia in End of Life Care
Progress of workstreams subsumed from 2015/16:Education/Training • Wiltshire CCG Competencies mapping tool template approved for 6 month pilot with view to use as a future framework and to monitor EoL care. • EoL pages on Wilts CCG updated for specific target audiences utilizing e-learning modules, Powerpoint presentations and provider details that offer training. • ACP approved for 6 month pilot - now a KPI within relevant service specs• TEP and Advance Care Planning training, for GP’s, Community Teams and Care Homes roll out commenced • TEP usage now a KPI in relevant service specs• TEP evaluation commenced to support further implementation
Care at Home • Bespoke national modelling tool to inform the business case for a new model of care for palliative care at home being utilised. • Working group to meet to develop the commissioning strategy for palliative care at home and the business case
Dementia• EoL section of the Dementia Strategy Action Plan is now augmented. • Cross group working across respective Board to develop strategy to support information on Dementia and EoL
Public Engagement and Refresh StrategyRefreshed Wiltshire EoLC for Adults Strategy 2017-2020: Jointly developed by Wiltshire CCG and Wiltshire Council. National and local guidelines and policies, best practice models, feedback from patients and insights from health and social care professionals have influenced Strategy. The key objectives embed the recommendations from the National Palliative and End of Life Care Partnership ambitions framework. It reflects upon progress and service provision and acknowledges the collaborative arrangements between the statutory, community and voluntary sector agencies. Subject to an independent report from HealthWatch Wiltshire, following 3 separate public engagement sessions and 91 public responses. Feedback captured will inform the Strategy Implementation Plan which is in development and due at the EoL Programme Board and JCB in March for formal approval/ratification.
57
Wiltshire Dying Well Community Charter:Wiltshire’s End of Life Programme Board has prioritised developing a Wiltshire Dying Well Community Charter. This will set out to outline a visible commitment by individuals, communities and organisations, working together to support the community we all live in, the people with a life limiting illness, their carers, families and all those who are important to them. The Charter is a nationally led idea, but the ideas and commitments within it need to be ones that many local organisations will recognise as important and valid for our local community of Wiltshire. A partnership group has been established :• Conference launch date to coincide with Dying Matters week in May• Community Champions part sourced to include all 3 Wiltshire hospice providers, WH&C, HealthWatch Wiltshire and Public Health • Objectives agreed• Target organisations agreed (to follow hard launch)• Local engagement activities approved and in progress (public feedback received on what is important to them, their families and carers at end of life and EoL pages live on Your Care Your Support Wiltshire)
Workforce:• Working group established - task and finish• Mapping exercise to establish EoL staffing gaps in development to feed into wider workforce programmes.
Carers:EoL pages live on Your Care Your Support Wiltshire (https://www.yourcareyoursupportwiltshire.org.uk/endoflifecare.aspx) and subject to EoL Board approval in March, this detail will also be captured in the next version of the hard copy Carer’s Handbook.
BCF Integrated CommissionersDorothy House Hospice Care currently deliver a rapid discharge service in collaboration with the RUH, through the Better Care Plan. The service provides up to 24 hour home care to support a rapid discharge to preferred place of care at the end of life and support earlier discharge for patients with complex needs. Working with the community teams the service is offering home as a realistic option for place of death and reducing inappropriate delays in discharge to preferred place of care at the end of life.From July to January: • Care is available for patients with < 2 week prognosis and wishing to be discharged home• Care available 24 hours a day for up to four weeks.• Actively supporting EoL patient discharges from RUH• CHC FT is not being initiated in many cases as the Specialist Palliative Care Team at RUH coordinate directly with the EDS service • Covered 125 bed days from July to October• 30 patients supports by Service• 578 visits made to EoL patients at home• 1361.47 hours of care provided to patients at home• 89% of deaths at place of choice (2 patients from 19 RIP)
58
72hr Supported Discharge Service model targets end of life care in Salisbury NHS Foundation Trust and is managed through Salisbury Hospice. The model puts a rapid package of care in place to get people home and die in their preferred place of death. The service aims to enable the safe and timely discharge of patients with palliative or end of life care needs from hospital or hospice to home .This care is available up to 24 hours a day for 72 hours for patients requiring an on-going package of care. Additionally, patients with < 1 week prognosis and wishing to be discharged home, 24 hours a day care is available for up to one week. Working with Patient Flow and Discharge Teams at Salisbury NHS Foundation Trust, the 72hr SDS arrange appropriate packages of care to support seamless transition from hospital to home. The service works closely with existing community services, to include Medvivo, Mears Care and Wiltshire Health and Care to coordinate support for patients requiring larger packages of care.
From September to January:• Care is available up to 24 hours a day for 72 hours for patients requiring an on-going package of care. • Patients with < 1 week prognosis and wishing to be discharged home, 24 hours a day care is available for up to one week. • Arrange appropriate packages of care to support seamless transition from hospital to home• Provides a holding package of care for patients waiting for a CHC FT provider (following authorisation of funding and a care package start date)• The aim is to discharge a patient to the 72 hour Supported Discharge Service within 48 hours of patient being declared medically stable for discharge (24 hours whenever possible).• 40 patients supported by Service• 4 avoided admissions (links with and will accept referrals from community teams) • Facilitated 26 patients discharge prior to start of further packages of care• 11 patients supported to die at home as their preferred place of death • Covering 98 acute bed days from September to January
Confidence Level: N/A
59


![C:przetargidsa 8ZO XXX-18 drukarka 3ddane sprzÄŽtPassMark … · 2018. 5. 28. · ,qwho ;hrq ( y # *+] 1$,qwho &ruh l & # *+] ,qwho ;hrq : # *+] ,qwho &ruh l +4 # *+] 1$ $0' 5\]hq](https://img.pdfslide.us/doc/110x75/609993bed0ae1b0b463885db/cprzetargidsa-8zo-xxx-18-drukarka-3ddane-sprztpassmark-2018-5-28-qwho.jpg)