Embed Size (px)
Citation preview

Monitoring eAccessibility in Europe is a study led by Technosite in partnership with NOVA and CNIPA, in collaboration with I2BC, The Blanck Group and CDLP-NUI, for the European Commission, DG Information Society and Media, Unit H.3 'ICT for inclusion'. The views expressed in the study do not reflect the official position of the European Commission.
Report on the eAccessibility survey for organisations representing people with disabilities, older people and end-users
14th June 2011

Monitoring eAccessibility in Europe (2010-2011)
Report on the eAccessibility survey for organisations representing people with disabilities, older people and end-users
Disclaimer
The study has been commissioned by the European Commission, Directorate General for Information Society and Media, unit ICT for Inclusion. All views expressed in this document, however, are those of the authors and do not necessarily reflect the views of the European Commission.
Neither the European Commission nor any person acting on its behalf is responsible for the use which might be made of the information contained in the present publication.
The European Commission is not responsible for the external web sites referred to in the present publication.
© European Union, 2011
This document is available at: http://www.eaccessibility-monitoring.eu/researchResult.aspx
Rights Restrictions
Reproduction is authorized provided the source is acknowledged
.
2

Monitoring eAccessibility in Europe (2010-2011)
Report on the eAccessibility survey for organisations representing people with disabilities, older people and end-users
TABLE OF CONTENTS1 Executive Summary.............................................................................................................................................102 Introduction.........................................................................................................................................................15
2.1 Design and Methodology........................................................................................................................................................................................... 152.2 Dissemination and publication................................................................................................................................................................................... 152.3 Outcome ................................................................................................................................................................................................ 16
3 The outcome of the survey..................................................................................................................................173.1 Description of the participants...................................................................................................................................................................................173.2 Analysis of the results by technology........................................................................................................................................................................ 20
3.2.1 Telephony........................................................................................................................................................................................................ 213.2.2 Internet............................................................................................................................................................................................................ 403.2.3 Computers....................................................................................................................................................................................................... 533.2.4 Television......................................................................................................................................................................................................... 583.2.5 Home Environment.......................................................................................................................................................................................... 693.2.6 Urban Environment.......................................................................................................................................................................................... 763.2.7 Educational Environment................................................................................................................................................................................. 883.2.8 Assistive Technologies..................................................................................................................................................................................... 953.2.9 Public Procurement........................................................................................................................................................................................ 100
4 Conclusions........................................................................................................................................................1045 Annex I: Detailed results for each question.......................................................................................................115
3
Monitoring eAccessibility in Europe (2010-2011)
Report on the eAccessibility survey for organisations representing people with disabilities, older people and end-users
Index of Tables
Table 1. List of acronyms............................................................................................................................................................................... 11Table 2. Groups of people represented in the survey..................................................................................................................................... 13Table 3. Total eAccessibility score by country................................................................................................................................................ 14Table 4. General results in the EU and Non-EU zones by technology category..............................................................................................15Table 5. Number of responses per country..................................................................................................................................................... 20Table 6. Which groups of people does your organisation represent?.............................................................................................................21Table 7. Please indicate the fields of action of your organisation...................................................................................................................22Table 8. Status of Telephony by country........................................................................................................................................................ 24Table 9. Status of Fixed Telephony................................................................................................................................................................ 27Table 10. Status of Mobile Telephony............................................................................................................................................................. 31Table 11. Status of Mobile Web...................................................................................................................................................................... 35Table 12. Status of Relay Services................................................................................................................................................................. 37Table 13. Status of Emergency Services........................................................................................................................................................ 41Table 14. Status of Internet by country.......................................................................................................................................................... 43Table 15. General results in the field of Internet by zone and by type of service...........................................................................................44Table 16. Status of Public Websites................................................................................................................................................................ 47Table 17. Status of Private Websites.............................................................................................................................................................. 53Table 18. Status of Computers by country..................................................................................................................................................... 57Table 19. Status of Television by country....................................................................................................................................................... 62Table 20. Status of TV Contents..................................................................................................................................................................... 64Table 21. Status of TV Equipment.................................................................................................................................................................. 69Table 22. Status of the Home Environment by country..................................................................................................................................73Table 23. Status of Digital Homes.................................................................................................................................................................. 75Table 24. Status of Telecare Devices............................................................................................................................................................. 77Table 25. Status of the Urban Environment by country..................................................................................................................................81Table 26. Status of the Educational Environment by country.........................................................................................................................92Table 27. Status of the Access to ATs............................................................................................................................................................ 99Table 28. Status of Public Procurement by country...................................................................................................................................... 104Table 29. General results of the survey by country and by technology........................................................................................................108Table 30. Detailed results for Question No.6................................................................................................................................................ 118Table 31. Detailed results for Question No.7................................................................................................................................................ 119Table 32. Detailed results for Question No.8................................................................................................................................................ 120Table 33. Detailed results for Question No.9................................................................................................................................................ 121Table 34. Detailed results for Question No.10.............................................................................................................................................. 122
4
Monitoring eAccessibility in Europe (2010-2011)
Report on the eAccessibility survey for organisations representing people with disabilities, older people and end-users
Table 35. Detailed results for Question No.11.............................................................................................................................................. 123Table 36. Detailed results for Question No.12.............................................................................................................................................. 124Table 37. Detailed results for Question No.13.............................................................................................................................................. 125Table 38. Detailed results for Question No.14.............................................................................................................................................. 126Table 39. Detailed results for Question No.15.............................................................................................................................................. 127Table 40. Detailed results for Question No.16.............................................................................................................................................. 128Table 41. Detailed results for Question No.17.............................................................................................................................................. 129Table 42. Detailed results for Question No.18.............................................................................................................................................. 130Table 43. Detailed results for Question No.19.............................................................................................................................................. 131Table 44. Detailed results for Question No.20.............................................................................................................................................. 132Table 45. Detailed results for Question No.21.............................................................................................................................................. 133Table 46. Detailed results for Question No.22.............................................................................................................................................. 134Table 47. Detailed results for Question No.23.............................................................................................................................................. 135Table 48. Detailed results for Question No.24.............................................................................................................................................. 136Table 49. Detailed results for Question No.25.............................................................................................................................................. 137Table 50. Detailed results for Question No.26.............................................................................................................................................. 138Table 51. Detailed results for Question No.27.............................................................................................................................................. 139Table 52. Detailed results for Question No.28.............................................................................................................................................. 140Table 53. Detailed results for Question No.29.............................................................................................................................................. 141Table 54. Detailed results for Question No.30.............................................................................................................................................. 142Table 55. Detailed results for Question No.31.............................................................................................................................................. 143Table 56. Detailed results for Question No.32.............................................................................................................................................. 144Table 57. Detailed results for Question No.33.............................................................................................................................................. 145Table 58. Detailed results for Question No.34.............................................................................................................................................. 146Table 59. Detailed results for Question No.35.............................................................................................................................................. 147Table 60. Detailed results for Question No.36.............................................................................................................................................. 148
Index of Figures
Figure 1. Total eAccessibility score by country............................................................................................................................................... 15Figure 2. General results in the EU and Non-EU zones by technology field....................................................................................................17Figure 3. Map of the No. of responses per country......................................................................................................................................... 21Figure 4. Groups represented by the participants.......................................................................................................................................... 22Figure 5. Fields of activity of the participants................................................................................................................................................. 23Figure 6. General results in the field of Telephony divided by sub-category..................................................................................................26
5

Monitoring eAccessibility in Europe (2010-2011)
Report on the eAccessibility survey for organisations representing people with disabilities, older people and end-users
Figure 7. Overall results in the field of Telephony by country........................................................................................................................26Figure 8. Status of Fixed Telephony by country............................................................................................................................................. 27Figure 9. Status of Mobile Telephony by country............................................................................................................................................ 31Figure 10. Status of Mobile Web by country................................................................................................................................................... 35Figure 11. Status of Relay Services by country.............................................................................................................................................. 37Figure 12. Status of Emergency Services by country..................................................................................................................................... 41Figure 13. General results in the field of Internet........................................................................................................................................... 44Figure 14. Overall results in the field of Internet by country..........................................................................................................................45Figure 15. Comparison between the accessibility of websites and services in the private and public sectors...............................................46Figure 16. Status of Public Websites by country............................................................................................................................................. 47Figure 17. Status of Private Websites by country........................................................................................................................................... 53Figure 18. General results in the field of Computers...................................................................................................................................... 57Figure 19. Overall results in the field of Computers by country......................................................................................................................57Figure 20. Status of Personal Computers by country...................................................................................................................................... 59Figure 21. General results in the field of Television........................................................................................................................................ 62Figure 22. Overall results in the field of Television by country.......................................................................................................................62Figure 23. Status of TV Contents by country.................................................................................................................................................. 64Figure 24. Use of alternative media for TV content........................................................................................................................................ 66Figure 25. Status of TV Equipment by country............................................................................................................................................... 69Figure 26. General results in the Home Environment..................................................................................................................................... 73Figure 27. Overall results in the Home Environment by country....................................................................................................................73Figure 28. Status of Digital Homes by country............................................................................................................................................... 75Figure 29. Status of Telecare Devices by country.......................................................................................................................................... 77Figure 30. General results in the Urban Environment..................................................................................................................................... 80Figure 31. Overall results in the Urban Environment by country....................................................................................................................81Figure 32. Status of ATMs by country............................................................................................................................................................. 83Figure 33. Status of Vending Machines by country......................................................................................................................................... 85Figure 34. Status of Virtual Kiosks by country................................................................................................................................................ 87Figure 35. Status of Public Transport Information.......................................................................................................................................... 89Figure 36. General results in the Educational Environment............................................................................................................................92Figure 37. Overall results in the Educational Environment by country...........................................................................................................92Figure 38. Status of eBooks by country.......................................................................................................................................................... 94Figure 39. Status of eLearning by country...................................................................................................................................................... 97Figure 40. General results in the field of Assistive Technologies....................................................................................................................99Figure 41. Overall results in the field of Assistive Technologies by country.................................................................................................101Figure 42. General results in the field of Public Procurement.......................................................................................................................104
6

Monitoring eAccessibility in Europe (2010-2011)
Report on the eAccessibility survey for organisations representing people with disabilities, older people and end-users
Figure 43. Overall results in the field of Public Procurement by country......................................................................................................106Figure 44. Czech Republic – Perception of the level of accessibility by technology......................................................................................110Figure 45. Denmark – Perception of the level of accessibility by technology...............................................................................................110Figure 46. France – Perception of the level of accessibility by technology...................................................................................................111Figure 47. Germany – Perception of the level of accessibility by technology...............................................................................................111Figure 48. Greece – Perception of the level of accessibility by technology...................................................................................................112Figure 49. Hungary – Perception of the level of accessibility by technology................................................................................................112Figure 50. Ireland – Perception of the level of accessibility by technology...................................................................................................113Figure 51. Italy – Perception of the level of accessibility by technology.......................................................................................................113Figure 52. Portugal – Perception of the level of accessibility by technology.................................................................................................114Figure 53. Spain – Perception of the level of accessibility by technology.....................................................................................................114Figure 54. Sweden – Perception of the level of accessibility by technology.................................................................................................115Figure 55. The Netherlands – Perception of the level of accessibility by technology....................................................................................115Figure 56. United Kingdom – Perception of the level of accessibility by technology.....................................................................................116Figure 57. Australia – Perception of the level of accessibility by technology................................................................................................116Figure 58. Canada – Perception of the level of accessibility by technology..................................................................................................117Figure 59. Norway – Perception of the level of accessibility by technology..................................................................................................117Figure 60. United States of America – Perception of the level of accessibility by technology.......................................................................118
7

Monitoring eAccessibility in Europe (2010-2011)
Report on the eAccessibility survey for organisations representing people with disabilities, older people and end-users
Table 1. List of acronyms
Acronym Explanation
AD Audio DescriptionAGE AGE Platform EuropeANEC European Association for the Co-ordination of Consumer Representation in StandardisationAT Assistive TechnologyATM Automated Teller MachineAU AustraliaCA CanadaCZ Czech RepublicDE GermanyDK DenmarkDVB Digital Video BroadcastingEDF European Disability ForumES SpainEU European UnionFR FranceGR GreeceHU HungaryICT Information and Communication TechnologiesIE Ireland
8

Monitoring eAccessibility in Europe (2010-2011)
Report on the eAccessibility survey for organisations representing people with disabilities, older people and end-users
Acronym Explanation
IT ItalyNGO Non-Governmental OrganisationNL The NetherlandsNO NorwayPC Personal ComputerPDA Personal Digital AssistantPDF Portable Document FormatPT PortugalSE SwedenSMS Short Message ServiceUK United KingdomURL Uniform Resource LocatorUS / USA United States of AmericaW3C World Wide Web ConsortiumWAI Web Accessibility InitiativeWAP Wireless Application ProtocolWCAG Web Content Accessibility Guidelines
9

Monitoring eAccessibility in Europe (2010-2011)
Report on the eAccessibility survey for organisations representing people with disabilities, older people and end-users
1 Executive SummaryIn order to enrich the contributions of national experts and correspondents to the “Monitoring eAccessibility” Study with the point of view of the end-users of technologies and services, a team of experts designed and developed a survey for organisations representing people with disabilities, older people and for consumer associations.At the end of 2010 and during the first quarter of 2011, an invitation to fill it in was sent to a large number of selected national organisations covering the 17 countries analysed by the study.The survey was made up of 37 questions divided into 20 thematic sections following the division into technology categories already adopted for the study.The survey was closed in mid May 2011 and the response rate was acceptable (76 returned questionnaires from the countries covered by the study plus a few more voluntary participations by organisations of other nations) but it was not evenly distributed among countries.In fact, Norway, Hungary and The Netherlands are finally represented by only one national response despite the efforts spent in contacting and trying to encourage the participation of organisations from those countries.The responding organisations were evenly distributed in terms of groups of people represented (see Table 2).
This was precisely the aim of the survey because it was deemed interesting to collect, alongside the opinions of organisations of people with disabilities, those of associations of older people and consumers’ organisations.
Table 2. Groups of people represented in the surveyPercentag
ePeople with disabilities 42%Older people 24%Socially disadvantaged groups 15%Consumers and end-users 19%
Source: Own elaboration, 2011. Unit: Percentages
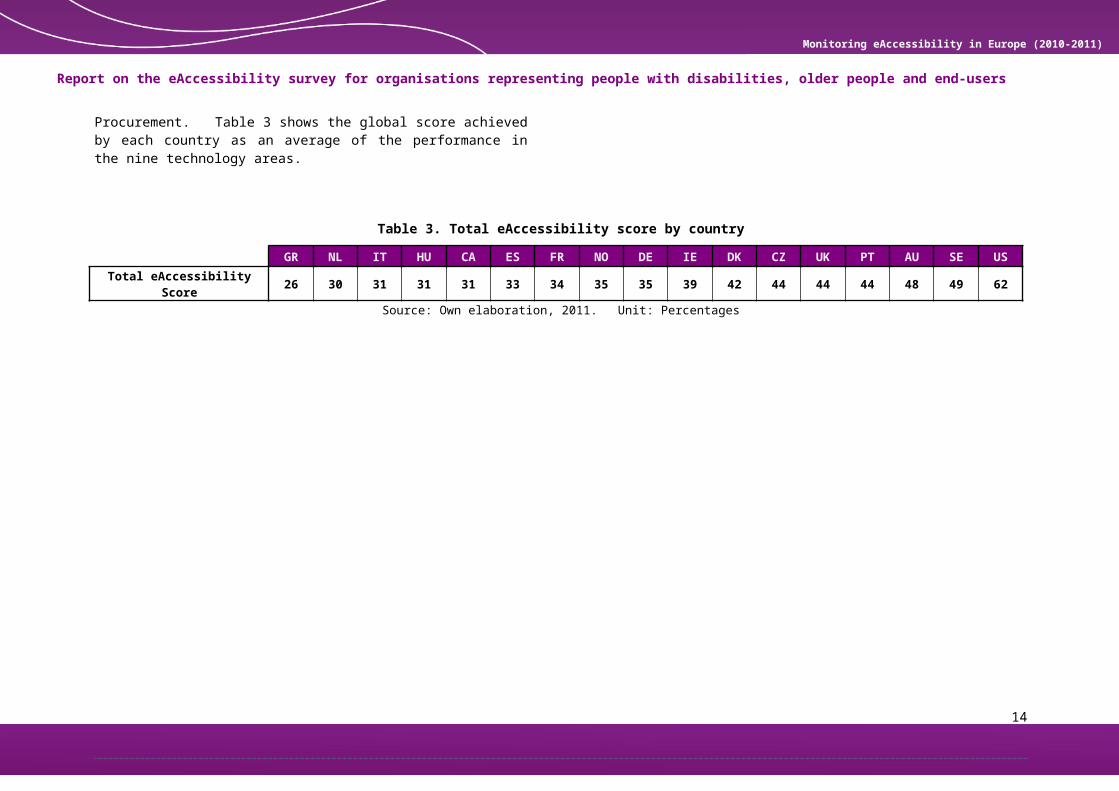
As mentioned above, the data collected by analysing the responses to the survey was organised into the nine technology and policy categories covered by the Study: Telephony, Internet, Computers, Television, Home Environment, Urban Environment, Educational Environment, Assistive Technologies, and Public Procurement. Table 3 shows the global score achieved by each country as an average of the performance in the nine technology areas.
Table 3. Total eAccessibility score by countryGR NL IT HU CA ES FR NO DE IE DK CZ UK PT AU SE US
10

Monitoring eAccessibility in Europe (2010-2011)
Report on the eAccessibility survey for organisations representing people with disabilities, older people and end-users
Total eAccessibility Score 26 30 31 31 31 33 34 35 35 39 42 44 44 44 48 49 62
Source: Own elaboration, 2011. Unit: Percentages
Figure 1. Total eAccessibility score by country
GR NL IT HU CA ES FR NO DE IE DK CZ UK PT AU SE US0
10
20
30
40
50
60
70
80
90
100
2630 31 31 31 33 34 35 35
3942 44 44 44
48 49
62
Source: Own elaboration, 2011. Unit: Percentages
The highest total score was obtained by the U.S.A. (62 points out of 100) followed by Sweden (49), Australia (48), Portugal, UK and Czech Republic (44 each), Denmark (42), Ireland 39, Germany and Norway (34), and Spain (33). These countries qualify as having a medium level of implementation of eAccessibility.
The remaining countries, Canada, Hungary and Italy score 31 each, the Netherlands 30 and Greece 26, did not reach the 33-point threshold and thus classify in the category of “poor level of implementation”. Overall, the European countries score an average of 38 points while the non-EU zone obtains 48 points.
11

Monitoring eAccessibility in Europe (2010-2011)
Report on the eAccessibility survey for organisations representing people with disabilities, older people and end-users
Analysing the performance of the two zones from the perspective of the specific technologies, we can observe that the performance of the non-EU countries, thanks especially to the positive contributions of Australia and the U.S.A., is always higher than that of the European countries.The category to which the organisations involved in the survey assign the highest score is the category of assistive technologies (EU: 50; non-EU:59). The positive outcome in this area is mainly due to the wide availability of AT solutions. Users nonetheless remarked on the significant variations in the quality and presence of support services that sometimes occur on a geographical basis, on the slow update frequency of the approved lists of ATs and by the lack of consistent financial schemes to support the acquisition of assistive solutions.Users also appreciate the availability of more accessible educational technologies (in this study we analysed the level of accessibility of eBooks and eLearning content and platforms) even though eBook readers with good accessibility features are still hard to find, if we exclude two mainstream products (Apple iPad and Amazon Kindle) which do not classify as ATs.The availability of digital copies of books is still lagging, especially in non-English-speaking countries, due to the differences in local languages and to the resistance of publishers to the diffusion of digital copies of material under copyright. eLearning too is evolving but the users perceive it as still poorly accessible and often restricted only to higher education.In this field, the score is 40 for the European countries and 56 for the non-EU zone.
Table 4. General results in the EU and Non-EU zones by technology category
EU NON-EU
Telephony 41 56 Internet 38 50 Computers 32 34 Television 35 38 Home environment 35 48 Urban environment 33 43 Educational environment 40 56 Assistive technologies 50 59 Public procurement 39 50
Source: Own elaboration, 2011. Unit: Percentages
Telephony is another area in which the average scores are good (EU: 41; non-EU: 56) even if this average includes five different sub-categories.In the sub-category of fixed telephony, services are generally good thanks to national telecom operators and good financial schemes. The main complaints come from the hearing-impaired community that would prefer a higher availability of videophone devices and services.Mobile telephony performs even better than landline telephony thanks to the growing availability of smartphones that come with good embedded accessibility features or can easily be made accessible by installing external applications. This technological progress will probably lead to a wider use of mobile web services, too.
12

Monitoring eAccessibility in Europe (2010-2011)
Report on the eAccessibility survey for organisations representing people with disabilities, older people and end-users
The point of view on relay services and access to emergency services is slightly worse. Users in some countries often complain about the insufficient quality and availability of relay services and their incompatibility with emergency services.Internet has always been the most visible face of eAccessibility due to the widespread use of websites and online services and the relative ease with which a website can be made accessible. Yet, despite the presence of international accessibility guidelines and many national regulations, progress in this field is still remarkably slow, especially in the public sector.A very peculiar outcome of this survey is that, while in Europe the websites and online services of private companies are less accessible than the public ones, in the non-EU countries, especially in Australia and the United States, the trend is the opposite. On reading the comments to the questions of this section a plausible explanation was found for this apparent paradox: in these countries, awareness on this matter is growing and there is a widespread concern of incurring cases of discrimination and thus, in legal liability.
Figure 2. General results in the EU and Non-EU zones by technology field
Telephony
Internet
Computers
Television
Home environment
Urban
environment
Educational environment
Assisti
ve technologies
Public procurem
ent
41 3832 35 35 33
40
50
39
5650
3438
4843
56 59
50
EU NON-EU
Source: Own elaboration, 2011. Unit: Percentages
Besides, more care is taken over access to online services by private companies that may have understood that usable and accessible services and websites lead to potential increases in customer reach and income.In the field of Television (EU: 35; non-EU: 38), the English broadcaster BBC, is unanimously considered the worldwide leader as regards the provision of accessible alternative media formats. Elsewhere, the use of subtitling, audio description channels and sign language tends to be weaker due to low normative targets or to inconsistent enforcement.
13
Monitoring eAccessibility in Europe (2010-2011)
Report on the eAccessibility survey for organisations representing people with disabilities, older people and end-users
Even the very small availability of digital TV sets and set-top boxes with built-in accessibility features (text-to-speech, customizable colours, etc.) is perceived as a problem, especially during this period of analogue-to-digital switchover.The most significant outcome in the area of public procurement (EU: 39; non-EU: 50) is that user organisations are not always aware of the existence and the performance of laws and toolkits concerning the procurement of accessible ICT.The technologies related to the home environment and to the idea of independent living are still very young in terms of maturity and this can be clearly seen in the general score table (EU: 35; non-EU: 38).Both Europe and the non-EU zone perform significantly better in the sub-category of telecare devices (as opposed to digital homes), where more products are available from mainstream brands and operators.For the urban environment (EU: 33; non-EU: 43), the only field in which some progress has been achieved is the one related to ATM machines: the major bank institutes are slowly replacing old machines with new ones with accessibility features such as headphone audio interface, high contrast colour options and Braille on the buttons. Vending machines and virtual kiosks remain substantially inaccessible especially due to a lack of accessibility standards and common interfaces for assistive technologies. The quality and availability of built-in accessibility features for retail personal computers remain low (EU: 32; non-EU: 34) with the exception of Apple products, which are said to perform better than Windows PCs out-of-the-box.
14

Monitoring eAccessibility in Europe (2010-2011)
Report on the eAccessibility survey for organisations representing people with disabilities, older people and end-users
2 IntroductionThe main sources of information for the “Monitoring eAccessibility” Study are the data collection activities carried out by national experts both in the field of technologies and in the policy area. Nonetheless, involving more organisations, and associations in the acquisition of information is undoubtedly of great support to the enrichment and to the comprehension of the results. As the voice of the most disadvantaged actors in the Information Society, the overview of NGOs representing people with disabilities and associations of older people, and their perception of the current eInclusion scenario is extremely valuable in terms of fully understanding how national and international policies are being implemented and what could be done to empower end-users and to build an accessible, solid and open ICT market.In order to obtain such viewpoints, a survey was designed and developed and, at the end of 2010 and during the first quarter of 2011, an invitation to fill it in was sent to a selected number of national organisations. The results of this survey are displayed and discussed in this document.
2.1 Design and Methodology
In order to obtain data that could be easily compared to the outcome of the national experts’ questionnaires it was decided to focus the survey on those ICT fields covered by the study (Telephony, Internet, Computers, Television, Home Environment, Urban Environment Educational Environment, Assistive Technologies and Public Procurement) and, in
particular, to the technology and policy status indicators which were already discussed and analysed in the First Annual Report (D1.1.1) and which are available on the online Balanced Score Card.The 37 questions in the survey were consequently divided into 20 thematic sections. The first, “About your Organisation”, was intended to collect facts and figures about the organisations participating in the survey. Each of the following 19 sections addressed a specific aspect of the accessibility of technologies that fall into the scope of this study.The 31 closed questions regarding the various ICTs each had an introductory text and five possible answers. In order to give a numerical value to each answer, and thus to make the data comparable among technologies and countries, each option was assigned a specific value in points on a scale from 0 to 100. If the answer to the question was unknown or if the question did not apply to the field of expertise of the organisation, the user could select an appropriate box to fit this case. An extra field was provided for each question, giving the opportunity to post further suggestions and information to clarify each answer.
2.2 Dissemination and publication
In order to reach the highest number of potential respondents to the Study, the survey was announced through several communication channels.
On the Web: on the portal of the Study: (http://www.eaccessibility-monitoring.eu/); on the
15

Monitoring eAccessibility in Europe (2010-2011)
Report on the eAccessibility survey for organisations representing people with disabilities, older people and end-users
ePractice portal within the related communities (e.g. the eAccessibility community, eGovMoNet, Benchlearning, etc.), on the Web sites of the project and of the consortium partners, and on many other national portals and websites dealing with issues of eInclusion and eAccessibility.
Directly by mail: to a list of pre-selected stakeholders and experts from NGOs already selected by Technosite and suggested by the major European umbrella organisations such as EDF, AGE and ANEC.
By newsletter: counting on the broad distribution of newsletters such as the ePractice Newsletter and the eInclusion Newsletter or the eInclusion newsletter.
During events, meetings and workshops: especially those dealing with eInclusion, ICT and non-discrimination. The Commission also fostered Member State contributions to the survey by involving the representatives of the i2010 eInclusion subgroup in the dissemination of the survey to national NGOs.
The questionnaire was made available throughout December 2010 to fill in online through an accessible HTML form which could be reached from a section of the main website of the Study.The questionnaire was preceded by an introductory letter, a glossary of the key terms used in the document, a guide on how to complete it and a list of reference phone numbers and email addresses to contact in case of difficulties.
In some cases, a Word copy (.doc) was sent to some users and the information coming from offline responses was checked and uploaded to the data collection system by the survey team.During and after the period of the online availability of the survey, the information coming from the organisations was checked constantly by a back-office panel. In order to ensure high return rates, the survey team sent various reminder emails to the list of pre-selected stakeholders and experts, and in some cases also contacted the organisations by phone.The survey was definitively closed in mid May 2011.
2.3 Outcome
Apart from collecting raw data, the main aim of the survey was to capture a more in-depth and personal perception that stakeholders and groups of users may have regarding the advancements made in the last few years in the field of eInclusion. The outcome of such a valuable insight could also provide interesting points of view and suggest strategies on how to improve current policies and activities supporting the reduction of the digital divide. NGOs, users’ associations and people with disabilities have undoubtedly provided a sharper overview on how new technologies and the policies regarding eInclusion are affecting their lives.The results of the survey are presented in the following section.
16

Monitoring eAccessibility in Europe (2010-2011)
Report on the eAccessibility survey for organisations representing people with disabilities, older people and end-users
3 The outcome of the survey
3.1 Description of the participants
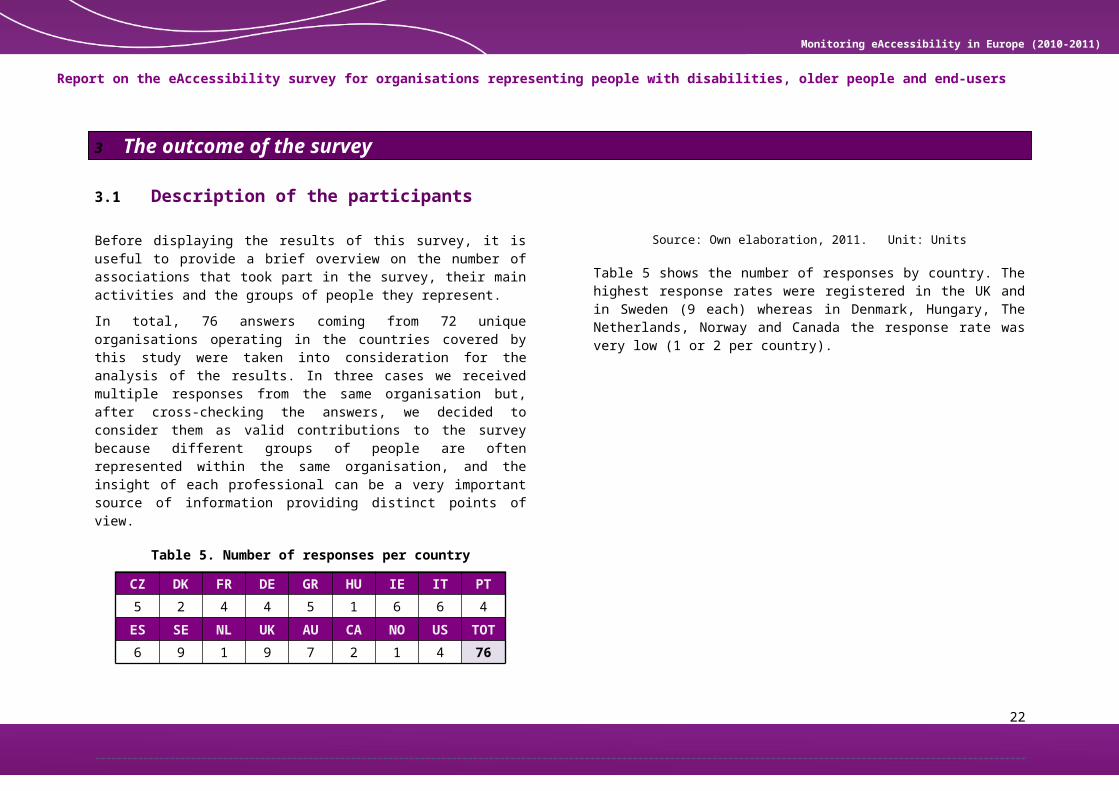
Before displaying the results of this survey, it is useful to provide a brief overview on the number of associations that took part in the survey, their main activities and the groups of people they represent.In total, 76 answers coming from 72 unique organisations operating in the countries covered by this study were taken into consideration for the analysis of the results. In three cases we received multiple responses from the same organisation but, after cross-checking the answers, we decided to consider them as valid contributions to the survey because different groups of people are often represented within the same organisation, and the insight of each professional can be a very important source of information providing distinct points of view.
Table 5. Number of responses per country
CZ DK FR DE GR HU IE IT PT5 2 4 4 5 1 6 6 4
ES SE NL UK AU CA NO US TOT6 9 1 9 7 2 1 4 76
Source: Own elaboration, 2011. Unit: Units
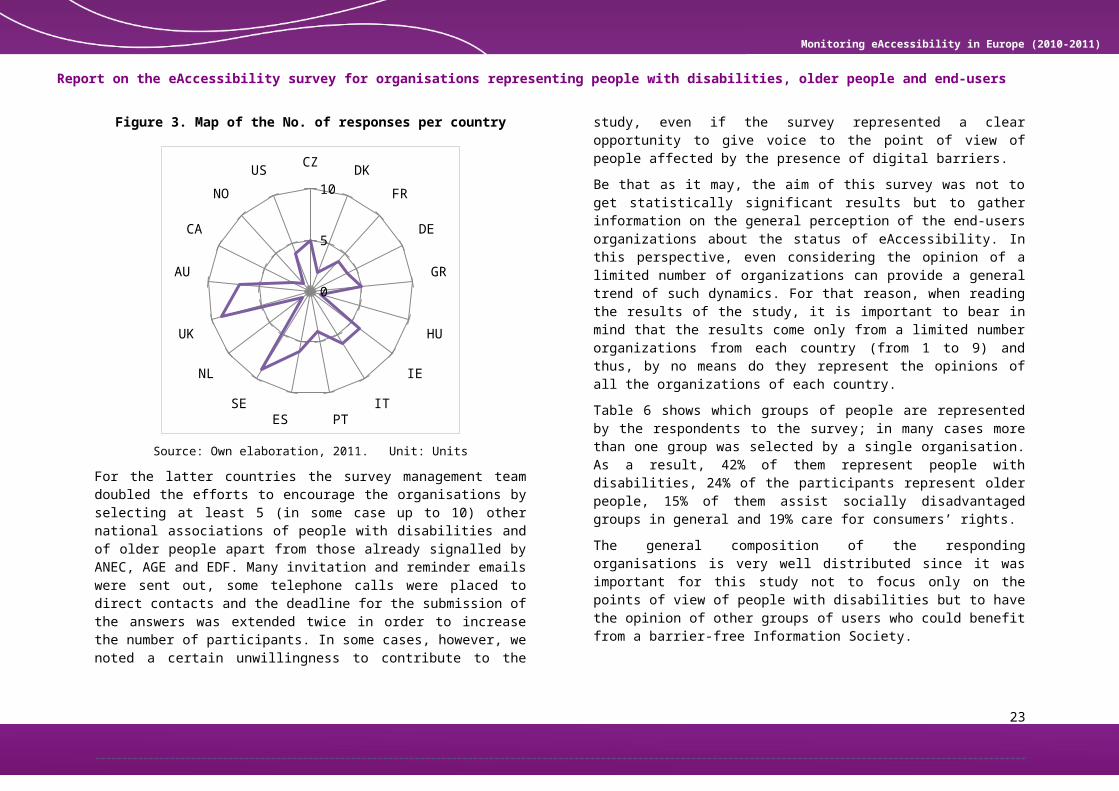
Table 5 shows the number of responses by country. The highest response rates were registered in the UK and in Sweden (9 each) whereas in Denmark, Hungary, The Netherlands, Norway and Canada the response rate was very low (1 or 2 per country).
Figure 3. Map of the No. of responses per country
CZDK
FR
DE
GR
HU
IE
ITPTES
SE
NL
UK
AU
CA
NO
US
0
5
10
Source: Own elaboration, 2011. Unit: UnitsFor the latter countries the survey management team doubled the efforts to encourage the organisations by selecting at least 5 (in some case up to 10) other national associations of people with disabilities and of older people apart from those already signalled by ANEC, AGE and EDF. Many invitation and reminder emails were sent out, some telephone calls were placed to
17

Monitoring eAccessibility in Europe (2010-2011)
Report on the eAccessibility survey for organisations representing people with disabilities, older people and end-users
direct contacts and the deadline for the submission of the answers was extended twice in order to increase the number of participants. In some cases, however, we noted a certain unwillingness to contribute to the study, even if the survey represented a clear opportunity to give voice to the point of view of people affected by the presence of digital barriers.Be that as it may, the aim of this survey was not to get statistically significant results but to gather information on the general perception of the end-users organizations about the status of eAccessibility. In this perspective, even considering the opinion of a limited number of organizations can provide a general trend of such dynamics. For that reason, when reading the results of the study, it is important to bear in mind that the results come only from a limited number organizations from each country (from 1 to 9) and thus, by no means do they represent the opinions of all the organizations of each country.Table 6 shows which groups of people are represented by the respondents to the survey; in many cases more than one group was selected by a single organisation. As a result, 42% of them represent people with disabilities, 24% of the participants represent older people, 15% of them assist socially disadvantaged groups in general and 19% care for consumers’ rights. The general composition of the responding organisations is very well distributed since it was important for this study not to focus only on the points of view of people with disabilities but to have the opinion of other groups of users who could benefit from a barrier-free Information Society.
Table 6. Which groups of people does your organisation represent?
Total No. %People with disabilities 69 42
Older people 39 24Socially disadvantaged groups 25 15Consumers and end-users 32 19
Source: Own elaboration, 2011. Unit: Units and Percentages
Figure 4. Groups represented by the participants
42%
24%
15%
19%People with disabilities
Older people
Socially disadvantaged groups
Consumers and end users
Source: Own elaboration, 2011. Unit: Percentages
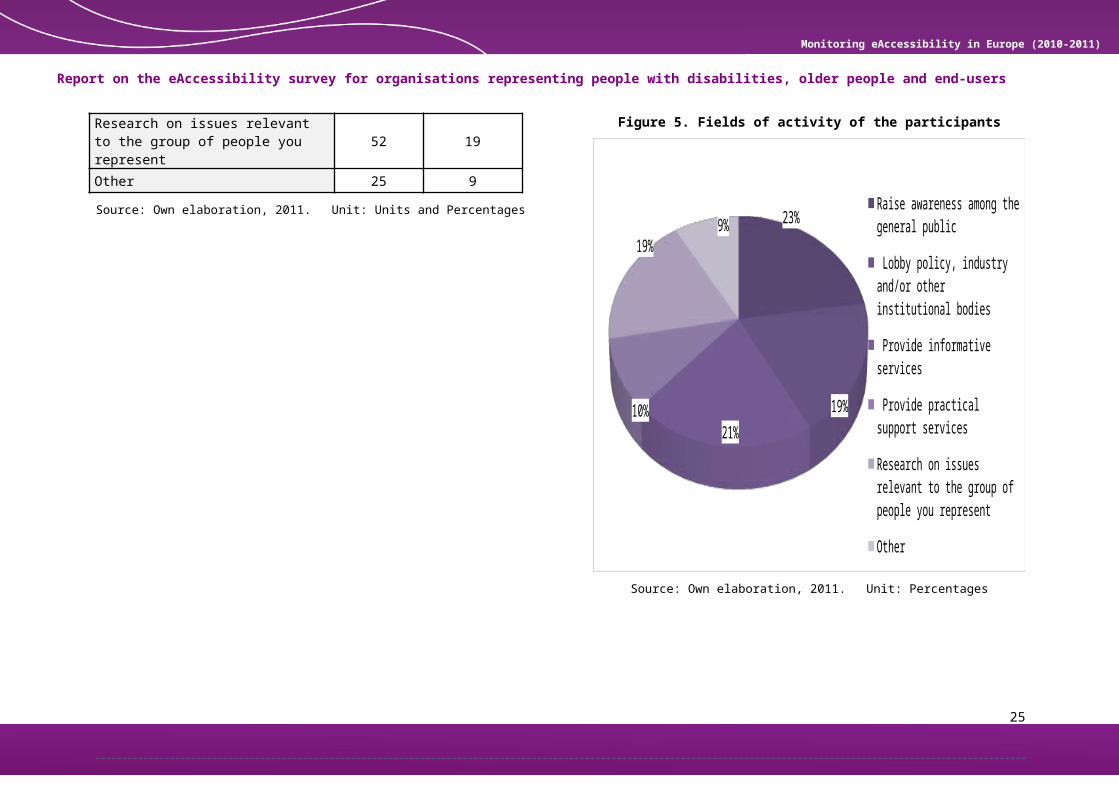
The participant organizations were also asked to indicate their main fields of activity. Even in this case there could be more than one possible answer. Table 7 shows the results of this question: 23% of the organizations work on raising awareness on the problems suffered by the people they represent among the general public, while 19% try to stimulate policy-makers interacting directly with the industry and institutional bodies.
18

Monitoring eAccessibility in Europe (2010-2011)
Report on the eAccessibility survey for organisations representing people with disabilities, older people and end-users
21% of them provide direct information services to their represented groups, and 10% provide practical support services. 19% of the organizations carry out research on issues relevant to their represented groups.
Table 7. Please indicate the fields of action of your organisation
Total No. %Raise awareness among the general public 63 23Lobby policy, industry and/or other institutional bodies 52 19Socially disadvantaged groups Provide informative services (e.g. consumer rights)
57 21
Provide practical support services (e.g. home assistance services) 27 10Research on issues relevant to the group of people you represent 52 19Other 25 9
Source: Own elaboration, 2011. Unit: Units and Percentages
Figure 5. Fields of activity of the participants
23%
19%
21%10%
19%9% Raise awareness among the general
public
Lobby policy, industry and/or other institutional bodies
Provide informative services
Provide practical support services
Research on issues relevant to the group of people you represent
Other
Source: Own elaboration, 2011. Unit: Percentages
19
Monitoring eAccessibility in Europe (2010-2011)
Report on the eAccessibility survey for organisations representing people with disabilities, older people and end-users
3.2 Analysis of the results by technology
In this section, we analyse the outcome of the survey following the scheme already adopted in the Annual Report (D1.1.1) in order to facilitate comparisons and cross-browsing of the results.We shall therefore display the results for each of the nine main technology categories covered by this Study:
1. Telephony (§3.2.1)2. Internet (§3.2.3)3. Computers (§3.2.4)4. Television (§3.2.5)5. Home Environment (§3.2.7)6. Urban Environment (§3.2.8)7. Educational Environment (§3.2.9)8. Assistive Technologies (§3.2.10)9. Public Procurement (§3.2.11)
Each of the above-mentioned sections provides a general score obtained by each of the countries within the scope of the study
and a comparison between the performance of European countries against the non-EU nations (Australia, Canada, Norway and U.S.A.) which have been taken into consideration.The score for each main technology category is the average of the scores of sub-categories investigating more specific technological aspects relating to the main category. Every sub-category is evaluated considering the answers provided by the responding organisations to each of the one or more questions in the survey. For the sake of brevity, the tables providing a detailed report on the answers to each question have been placed at the end of this document, in Chapter 5 (Annex I).Within each sub-category we also report and analyse the most relevant comments added by the organisations.Adding additional information to the answers was not compulsory for the organisations. Thus, for each question, the number of comments and the countries whose comments have been reported may vary.
3.2.1
20

SMART 2008/0066 Monitoring eAccessibility in Europe
Report on the eAccessibility survey for organisations representing people with disabilities, older people and end-users
3.2.2 Telephony
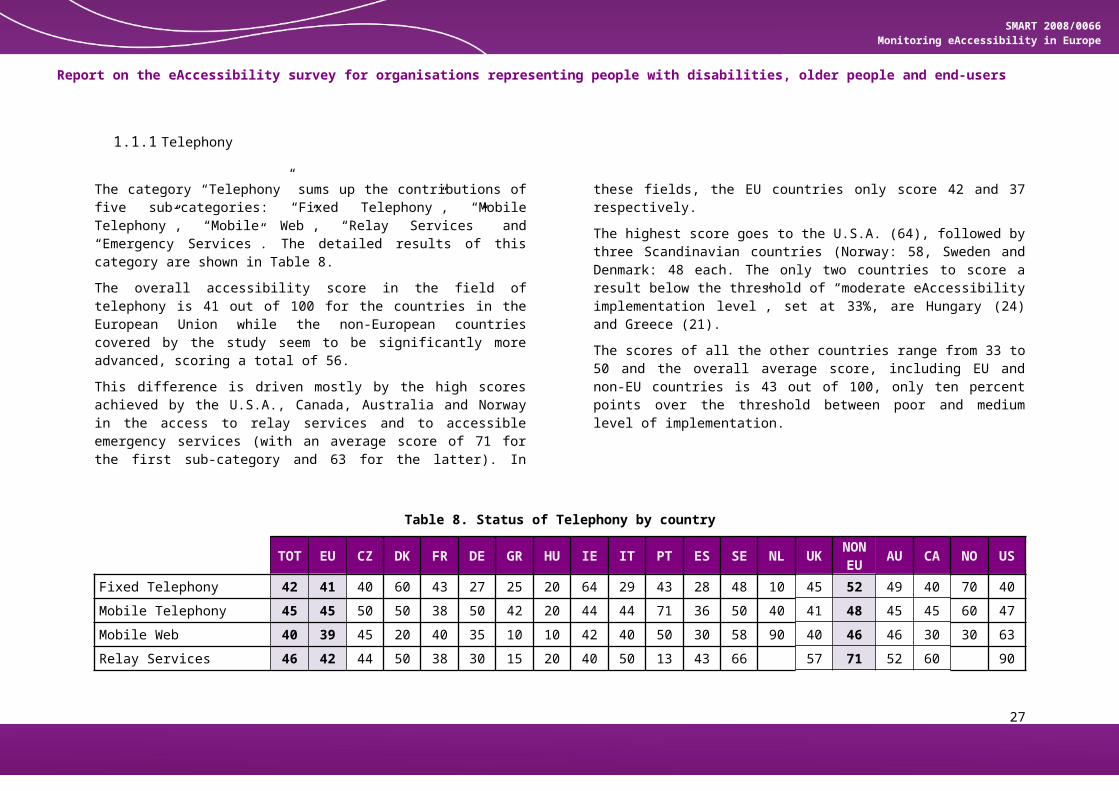
The category “Telephony” sums up the contributions of five sub-categories: “Fixed Telephony”, “Mobile Telephony”, “Mobile Web”, “Relay Services” and “Emergency Services”. The detailed results of this category are shown in Table 8.The overall accessibility score in the field of telephony is 41 out of 100 for the countries in the European Union while the non-European countries covered by the study seem to be significantly more advanced, scoring a total of 56.This difference is driven mostly by the high scores achieved by the U.S.A., Canada, Australia and Norway in the access to relay services and to accessible emergency services (with an average
score of 71 for the first sub-category and 63 for the latter). In these fields, the EU countries only score 42 and 37 respectively.The highest score goes to the U.S.A. (64), followed by three Scandinavian countries (Norway: 58, Sweden and Denmark: 48 each. The only two countries to score a result below the threshold of “moderate eAccessibility implementation level”, set at 33%, are Hungary (24) and Greece (21). The scores of all the other countries range from 33 to 50 and the overall average score, including EU and non-EU countries is 43 out of 100, only ten percent points over the threshold between poor and medium level of implementation.
Table 8. Status of Telephony by country
TOT EU CZ DK FR DE GR HU IE IT PT ES SE NL UK
NON EU
AU CA NO US
Fixed Telephony 42 41 40 60 43 27 25 20 64 29 43 28 48 10 45 52 49 40 70 40Mobile Telephony 45 45 50 50 38 50 42 20 44 44 71 36 50 40 41 48 45 45 60 47Mobile Web 40 39 45 20 40 35 10 10 42 40 50 30 58 90 40 46 46 30 30 63Relay Services 46 42 44 50 38 30 15 20 40 50 13 43 66 57 71 52 60 90Emergency Services 41 37 38 80 25 30 14 50 30 30 25 30 50 30 58 63 60 30 70 80Total Telephony 43 41 43 54 37 34 21 24 44 39 41 33 54 43 48 56 50 44 58 64
21
SMART 2008/0066 Monitoring eAccessibility in Europe
Report on the eAccessibility survey for organisations representing people with disabilities, older people and end-users
Source: Own elaboration, 2011. Unit: Percentages
Figure 6. General results in the field of Telephony divided by sub-category
Fixed Telephony
Mobile Telephony
Mobile Web
Relay Services
Emergency Services
Total Telephony
0 10 20 30 40 50 60 70 80
41
45
39
42
37
41
52
48
46
71
63
56
NON-EU EU
Source: Own elaboration, 2011. Unit: Percentages
Figure 7. Overall results in the field of Telephony by country
GRHUESDEFRITPTNLCZIECAUKAUDKSENOUS
0 10 20 30 40 50 60 70
2124
3334
373941
43434444
4850
5454
5864
Source: Own elaboration, 2011. Unit: Percentages
22
SMART 2008/0066 Monitoring eAccessibility in Europe
Report on the eAccessibility survey for organisations representing people with disabilities, older people and end-users
Accessibility of Fixed Telephony
Figure 8. Status of Fixed Telephony by country
TOTEUCZDKFRDEGRHUIEITPTESSENLUK
NON-EUAUCANOUS
0 10 20 30 40 50 60 70 80 90 100
424140
6043
2725
2064
2943
2848
1045
5249
5570
40Source: Own elaboration, 2011. Unit: Percentages
The level of implementation of eAccessibility in the sub-category of fixed telephony was assessed with two questions.The first question was: Question No. 6: Fixed telephony was once primarily intended for placing voice calls. Nowadays many landline telephone operators are enriching their offer with services such as text/multimedia messages, video calls and access to online content. Could you please estimate the availability of advanced landline phone sets with accessibility features such as voice recognition, text-to-speech, screen readers, big screens and keys, etc., in your country?
The possible answers to question No. 6 were:
a) No availabilityb) Insufficient availabilityc) Some availabilityd) Good availabilitye) Wide availability
A detailed table with the results for this question is available in Annex I (page 116).The second question was: Question No. 7: Some of these landline phone sets may cost more than the ones sold to the general public. To what extent are the possible extra costs of such devices covered by national schemes of financial support or free of charge provision?
The possible answers to question No. 7 were:a) There is no financial support and the cost difference is
high
23

SMART 2008/0066 Monitoring eAccessibility in Europe
Report on the eAccessibility survey for organisations representing people with disabilities, older people and end-users
b) There is no financial support but the extra costs are small
c) There is a limited/fixed amount of financial support but the extra costs are small
d) The extra costs are entirely covered by financial supporte) The cost of the device is entirely free of charge
A detailed table with the results for this question is available in Annex I (page 118).
Table 9. Status of Fixed Telephony
TOT EU CZ DK FR DE GR HU IE IT PT ES SE NL UK
NON EU
AU CA NO US
Total Fixed Telephony 42 41 40 60 43 27 25 20 64 29 43 28 48 10 45 52 49 55 70 40Q.06 - Availability of Accessible phone sets 50 48 50 50 60 43 30 30 62 33 50 45 60 10 50 62 58 60 70Q.07 - Costs of Accessible phone sets 34 33 30 70 25 10 20 10 65 25 37 10 37 10 40 41 40 50 70 10
Source: Own elaboration, 2011. Unit: Percentages
Table 9 shows a summary of the results for fixed telephony, also reporting the value scored by each country in questions No. 6 and No. 7.In the field of fixed telephony, the top score was obtained by Norway (70), Ireland (64) and Denmark (60) but it must be stressed that we could only analyse one response from Norway, so the result could be biased from its being derived from only one point of view. Besides, the Norwegian association only answered question No. 7, so the average score between the two questions could not be answered.
The USA, scored a high mark (70) in the question regarding the availability of landline phone sets provided with accessibility features, but scored a very low mark (10) in the question regarding the presence of financial support for those phone sets and the overall result fell to 40.
Even the result for the worst performers, The Netherlands (10) and Hungary (20), may depend on the slender response rate for those countries.Overall, the results are not very encouraging, with four other countries, Germany, Greece, Italy and Spain below the 33% threshold. The European Union scores an average of 41 out of 100 while the non-EU countries reach 52 out of 100. As the performance of each European country is significantly lower than in the non-EU countries, the global average for all the countries stops at 42 points.
24
SMART 2008/0066 Monitoring eAccessibility in Europe
Report on the eAccessibility survey for organisations representing people with disabilities, older people and end-users
Comments on the answers:
The following comments for the sub-category of fixed telephony were made by responding organisations and associations:
Czech RepublicThe Czech organisations complain about the absence of video-call services on landline telephones, about the low priority given to the distribution of accessible communication equipment and point out that the central regions of the country are usually better served by landline services than the border regions. FranceSome landline phones have integrated accessibility options that make their prices very affordable. Others are more specialised, and are usually more costly. Some persons may benefit from the equity compensation benefit (PCH) to finance such devices.IrelandSome areas (mostly urban) would have access to these kinds of services but rural areas are often disadvantaged. The costs of special phone sets may sometimes be prohibitive. In Ireland, there are “Aids and Appliances” grants available via the health service to cover the cost of AT devices etc., but this budget is often spent a year in advance. A small number of Deaf/Hard of Hearing people use a minicom or fax to communicate via a landline.ItalyOnly two models of fixed telephones with accessibility features have been found available for purchase, and the costs of services are often too high. The only financial measure is a VAT
reduction to 4% and the cost of the devices may be deducted from the tax declaration.PortugalPT Telecom offers a text-to-speech SMS service for fixed telephony; telephones with big screens and keys are available on the mainstream market. There is also the possibility to adapt PBX with Braille displays (usually to adapt workplaces).SwedenTelephones for video and text-telephony and some phones with bigger digits are available. There is a general lack of products for cognitive impairments. County councils are responsible for assistive technologies, and have the right to define what is considered AT or consumer technology. The most common approach is that products sold on the consumer market are not considered assistive technologies. Examples of "consumer products" are phones with hearing aid compatibility, simple amplifiers for phones. All county councils have the approach that the purchase of an "ordinary" telephone should be left to the responsibility of the individual, but the county council will provide the integrative assistive technology necessary to use the telephone.United KingdomAccessible voice phone sets are available (large buttons, increased volume, Large font Caller ID, quick dial and emergency number dial buttons). However, these tend to be for basic telephony functions. The UK has Text-phones (text over PSTN), Videophones (over ADSL internet).
25

SMART 2008/0066 Monitoring eAccessibility in Europe
Report on the eAccessibility survey for organisations representing people with disabilities, older people and end-users
For the financial support, different rules apply. With the “Access to Work” scheme, one can receive the telephony systems with the costs covered by the scheme. Social Services do provide some systems free of charge especially minicoms, screenphones and large button phones. They do not provide video devices.
U.S.A.Deaf people can receive videophones for free. These are specially designed videophones that do not use voice/sound at all.
26
SMART 2008/0066 Monitoring eAccessibility in Europe
Report on the eAccessibility survey for organisations representing people with disabilities, older people and end-users
Accessibility of Mobile Telephony
Figure 9. Status of Mobile Telephony by country
TOTEUCZDKFRDEGRHUIEITPTESSENLUK
NON-EUAUCANOUS
0 10 20 30 40 50 60 70 80 90 100
4545
5050
3850
4220
4444
7136
504041
484545
6047
Source: Own elaboration, 2011. Unit: Percentages
The level of implementation of eAccessibility in the sub-category of mobile telephony was assessed with two questions.
The first question was: Question No. 8: Could you please estimate the availability of mobile phones with accessibility features such as voice recognition, text-to-speech, screen readers, big screens and keys, etc., in your country?The possible answers to question No. 8 were:
a) No availabilityb) Insufficient availabilityc) Some availabilityd) Good availabilitye) Wide availability
A detailed table with the results for this question is available in Annex I (page 119).The second question was: Question No. 9: Some of these accessible mobile phones or phone applications may cost more than the ones sold to the general public. To what extent are the possible extra costs of such devices covered by national schemes of financial support or free of charge provision?The possible answers to question No. 9 were:
a) There is no financial support and the cost difference is high
b) There is no financial support but the extra costs are small
c) There is a limited/fixed amount of financial support but the extra costs are small
d) The extra costs are entirely covered by financial supporte) The cost of the device is entirely free of charge
27

SMART 2008/0066 Monitoring eAccessibility in Europe
Report on the eAccessibility survey for organisations representing people with disabilities, older people and end-users
A detailed table with the results for this question is available in Annex I (page 120).
Table 10. Status of Mobile Telephony
TOT EU CZ DK FR DE GR HU IE IT PT ES SE NL UK
NON EU
AU CA NO US
Total Mobile Telephony 45 45 50 50 38 50 42 20 44 44 71 36 50 40 41 48 45 45 60 47Q.08 - Availability of Accessible mobile phones
61 60 62 50 60 90 54 30 70 47 85 53 60 70 59 65 66 60 50 70
Q.09 - Costs of Accessible mobile phones
29 29 38 50 15 10 30 10 18 42 57 18 40 10 23 30 23 30 70 23
Source: Own elaboration, 2011. Unit: Percentages
Table 10 shows a summary of the results for mobile telephony, also reporting the value scored by each country in questions No. 8 and No. 9.In the field of mobile telephony, the results are generally close to the total average scored by all the countries (45). Only Portugal and Norway score well with 71 for the former and 60 for the latter. On the other hand, Hungary, scoring 20, is the only country in the “poor implementation level”.In the case of mobile telephony, the average scores of European and non-European countries are very similar (45 and 48). A very positive overall result was scored by the answers to question No. 8, regarding the availability of accessible mobile phone
devices. In this case, European countries scored an average of 60 out of 100 and non-EU countries scored 65. Germany and Portugal lead this sector with a score of 90 and 85 respectively.This result is probably due to the ever-growing diffusion of smartphones that allow users to install extra AT software that provides accessibility functions even to mainstream products.On the contrary, financial support for these technological solutions is rather low, as pointed out by the answers to question No. 9, with an average score of 29 in EU and 30 in non-EU countries, both under the “poor implementation” threshold.Only the Czech Republic (38), Denmark (50), Italy (42), Portugal (57), Sweden (40) and Norway (70) seem to have good financial
28

SMART 2008/0066 Monitoring eAccessibility in Europe
Report on the eAccessibility survey for organisations representing people with disabilities, older people and end-users
schemes to support the acquisition of accessible mobile technology.As shown by many of the comments to these two questions, the main reason for these contrasting results can be found in the fact that mobile technologies are rapidly growing and evolving, offering more and more services, including accessibility applications. Unfortunately, financial schemes to cover the costs of assistive technologies evolve less rapidly and often do not cover innovative devices and solutions.Comments to the answers:Czech RepublicThere are devices with big keys, big monochromatic screens; some have voice recognition but poor or old people do not know how use them.FranceA charter was signed in 2005 between mobile phones operators and the National Authority regulating Post and Telecommunications (ARCEP). The implementation of this charter is monitored annually and new developments are added. IrelandMany blind and vision-impaired people now use iPhones, etc. Android phones are less popular as the screen reader for Android is not very good, whereas the VoiceOver screen reader for the iPhone is excellent. This is for blind users; for vision-impaired people the options are wider as many smartphones have high contrast options or the ability to increase text size easily. Also 'Talks' (a screen reader for mobile phones) on the Symbian platform is still popular but since it may cost up to €100, many
users are switching to the iPhone, which provides these functionalities for free.ItalyThere are installable screen readers for Symbian-based phones (Nokia) and iPhones offer built-in accessibility features.The cost of the “Talks” software is covered by the health system, but there are no support services provided by resellers to install the program. The software must be installed by the users or installed for them by someone else.PortugalThe mobile operators finance all the extra software (Talks, Nuance). Apple does not provide any kind of special financing scheme for its iPhones.SwedenThere are some products and brands but it is very difficult for the consumer to get information about which mobile phone has accessibility features.Most features are software, and financial support depends on where you live and what disability you have. Usually the process is easier for vision-impaired people.The NetherlandsThere is concern for the future of the Symbian Operating System which is being dismissed by Nokia in favour of Windows Phone 7. This will make Talks obsolete and the only decent alternative will be to buy an Apple phone.United KingdomThere are not many speech-to-text services available.
29

SMART 2008/0066 Monitoring eAccessibility in Europe
Report on the eAccessibility survey for organisations representing people with disabilities, older people and end-users
The situation in the UK has improved significantly since the first MeAC project, with a number of good models appearing on the market from several manufacturers.The availability of phones is very patchy and variable, particularly those offered officially by the network through their retail partners. Organisation members often complain about the difficulty in finding out about models that would suit them. The accessibility features are often available only on a small range of models, which change frequently, and it requires additional steps to install the software onto the phones.While mobile phones have features to help blind users (Voiceover on the iPhone, and screen readers on Android and Symbian), the facilities for people who require text customisation for readability (people with literacy difficulties, dyslexia, Aspergers, and the ageing population) are currently not well served at all by the preferences in mobile operating systems or browsers.The big mobile phones are not covered by social services provision. Simplicity or clarity of operation are key factors for older people with hearing loss, and these, together with ease of use (big buttons, large text etc) are helpful to large numbers of people. Younger deaf people are likely to appreciate the same smart phone type functionality as other people.
The cost of the screen reader software is £125-150. But the software will work only on more advanced handsets which are more expensive, pushing the price up to more than £300. In comparison, a sighted person can purchase a basic handset (with camera, data, FM radio) for £3.Smartphones incur no extra cost for accessibility features but phones designed for older people are more expensive than the equivalent mainstream models.U.S.A.There is no financial compensation to assist people with disabilities in covering the difference in price between devices with the accessibility features they need in cellphones and devices without.For deaf people, one major frustration is that many cellphone providers do not offer a "data only" plan, i.e. a plan that does not force you to pay for a voice phone plan that deaf people cannot use. This restricts the options to only a small segment of cellphone providers. Even some of those few providers demand that deaf people provide them with proof of deafness, for instance, an audiogram, and do not make allowances for people who cannot use voice phones for other reasons such as speech impairments.
30

SMART 2008/0066 Monitoring eAccessibility in Europe
Report on the eAccessibility survey for organisations representing people with disabilities, older people and end-users
Accessibility of Mobile Web
Figure 10. Status of Mobile Web by country
TOTEUCZDKFRDEGRHUIEITPTESSENLUK
NON-EUAUCANOUS
0 10 20 30 40 50 60 70 80 90 100
4039
4520
4035
1010
4240
5030
5890
404646
3030
63
Source: Own elaboration, 2011. Unit: Percentages
The level of implementation of eAccessibility in the sub-category of mobile web was assessed with one question.The text of the question was: Question No. 10: Many public, private and commercial websites are now available in mobile versions (WAP, .mobi, etc.). When browsing these websites using a mobile phone, how would you rate their level of accessibility?
The possible answers to question No. 10 were:
a) None or poorb) Insufficientc) Faird) Goode) Very good
A detailed table with the results for this question is available in Annex I (page 121).Table 11 shows a summary of the results for mobile web.The results in this sub-category vary significantly from country to country. We have an outstanding mark given by the Dutch organization (90) which may be affected by the absence of other responses to average with. On the other hand there are many low scores, such as those of Greece (10), Hungary (10) and Denmark (20).Six countries are beneath the medium implementation level and the overall performance of the EU countries is 39 while, thanks to the U.S.A. (63), the non-EU countries have a global score of 46.
Table 11. Status of Mobile Web
31

SMART 2008/0066 Monitoring eAccessibility in Europe
Report on the eAccessibility survey for organisations representing people with disabilities, older people and end-users
TOT EU CZ DK FR DE GR HU IE IT PT ES SE NL UK
NON EU
AU CA NO US
Total Mobile Web 40 39 45 20 40 35 10 10 42 40 50 30 58 90 40 46 46 30 30 63Q.10 Accessibility of Mobile Websites 40 39 45 20 40 35 10 10 42 40 50 30 58 90 40 46 46 30 30 63
Source: Own elaboration, 2011. Unit: Percentages
Comments to the answers:Czech RepublicOnly a few private companies have mobile websites. The public sector is still not exploiting this media channel. IrelandThere is a tight mapping between mobile website creation and accessible websites. Mobile websites are generally more accessible. Certainly not in all cases, but much that is good for the mobile web, is also good for accessibilityPortugalGenerally these kinds of websites are simple (simple navigation mechanisms), strongly based on text. They are very simple to access with screen readers.SwedenThe difficulties are mostly connected with the mobile phone and how to operate it. Enlargement of text might be difficult on touch screens because you may accidently hit a link. The actual
construction of the website might be easier to browse for people with both vision and cognitive impairments. In fact, some blind users prefer the mobile version of a site when using a computer so there is great potential in websites that are more focused on a mobile version.United KingdomStandards for the creation and testing of accessible mobile sites are still in their infancy, and it is even worse for mobile apps. Together with the lack of capabilities in mobile browsers that WCAG depends on (the ability to increase the size of text in the browser, for example), accessibility is awful on mobiles. There is some collaboration going on with the British Standards Institute to work out how to engage globally to find/create the right standards.CanadaSome modifications for mobile use are helpful for general accessibility, but there is no direct relationship and it can sometimes be just as frustrating.
32

SMART 2008/0066 Monitoring eAccessibility in Europe
Report on the eAccessibility survey for organisations representing people with disabilities, older people and end-users
Accessibility of Relay Services
Figure 11. Status of Relay Services by country
TOTEUCZDKFRDEGRHUIEITPTESSENLUK
NON-EUAUCANOUS
0 10 20 30 40 50 60 70 80 90 100
464244
5038
3015
2040
5013
4366
NA57
7152
60NA
90
Source: Own elaboration, 2011. Unit: Percentages
The level of implementation of eAccessibility in the sub-category of relay services was assessed with two questions.The first question was: Question No. 11: Are you aware of the existence of any national or local text relay services in your country?The possible answers to question No. 11 were:
a) There are no such servicesb) There are very limited and spotty servicesc) The service is available but it does not meet the number
of requestsd) The service is available and with a sufficient number of
operatorse) The service is available and with a good number of
operators.A detailed table with the results for this question is available in Annex I (page 121).The second question was: Question No. 12: Are you aware of the existence of any national or local video relay services in your country?The possible answers to question No. 12 were:
a) There are no such servicesb) There are very limited and spotty servicesc) The service is available but it does not meet the number
of requestsd) The service is available and with a sufficient number of
operatorse) The service is available and with a good number of
operators.
33

SMART 2008/0066 Monitoring eAccessibility in Europe
Report on the eAccessibility survey for organisations representing people with disabilities, older people and end-users
A detailed table with the results for this question is available in Annex I (page 122).
Table 12. Status of Relay Services
TOT EU CZ DK FR DE GR HU IE IT PT ES SE NL UK
NON EU
AU CA NO US
Total Relay Services 46 42 44 50 38 30 15 20 40 50 13 43 66 57 71 52 60 90Q.11 – Availability of text relay services 54 49 43 70 30 30 20 30 50 70 10 55 70 75 78 74 70 90Q.12 – Availability of video relay services 38 35 45 30 45 10 10 30 30 17 30 62 38 65 30 50 90
Source: Own elaboration, 2011. Unit: Percentages
Table 12 shows a summary of the results for relay services, also reporting the value scored by each country in questions No. 11 and No. 12.In the field of relay services, the difference between European and non-European countries is very great. While the EU average is 42 out of 100, the Australia, Canada and the U.S.A. (the data from Norway was not available in this field) score an average of 71. All three countries are above the high level of implementation threshold, with the U.S.A. being the best performer with an incredible score of 90, which is supported by four different organizations.In Europe, the two best countries in this area are the UK (57) and Sweden (66). On the contrary, Greece (15) and Portugal (13) seem to be lagging behind in the implementation of accessible relay services.
Text relay services seem to be more widely spread than video relay services. In the first case, we have significantly higher scores coming from the UK (75) and from Italy, Denmark and Sweden (70 each). Greece and Portugal still remain the last countries on the scoreboard (20 and 10 respectively).In the sub-category of text relay services, the European Union scores an encouraging 54 out of 100, but the non-EU countries are still ahead with a very strong mark (78).Video relay services are not as developed as the text services, with an EU average of only 38 out of 100 against the 65% average of the non-EU countries.Only Sweden (62) seems to keep up with the United States, that score a very good 90 even in the field of video relay services.Comments to the answers:Denmark
34

SMART 2008/0066 Monitoring eAccessibility in Europe
Report on the eAccessibility survey for organisations representing people with disabilities, older people and end-users
The text relay solutions exist but for some groups of people with disabilities (i.e. the deafblind), the service is old and insufficient.A test video relay service connected to people in employment exists.FranceThe two services, text and video, are associated and provided by the two main operators. These operators (WebSourd and Viable France) are making available a private offer, both for individual and corporate users. Their experimentation phase has been presented and general public implementation is awaited. IrelandThere is a service in place but from anecdotal evidence from bodies representing users it appears that it is not well run, with poor availability of operators.A national relay service exists, but there have been many complaints in the past. However, in recent years demand for this service has fallen dramatically, due to texting.Recently a number of voluntary organisations established a pilot video remote sign language interpreting service. It remains to be seen if this will be successful in improving access to services.ItalyThe relay services are local and mainly available in northern Italy.PortugalThe Portuguese Deaf community already expressed itself against the use of an intermediate person in phone communications.Two years ago Portugal had a video relay service running at the Portuguese Deaf Association but it was discontinued due to insufficient financial support for the Sign Interpreters.
SwedenThere are services available and new services are under development but it is usually linked to public procurement and not available from all the operators.Text relay services are sufficiently available in Stockholm, but not in other regions of Sweden.The text relay service (www.texttelefoni.se) is procured by the National Post and Telecom Agency. So is the Video relay service (www.bildtelefoni.net). This is not open 24/7, but apart from that availability it is good (short queues, many users etc.)United KingdomSpeech to text relay is a very successful service in the UK, This service is available 24 hours, 7 days a week and provided nationally across the country. The service is paid for by the telecoms industry through Universal Service Obligation.Text Relay has operated in the UK since 1990 but has not kept pace with current technology.Video (sign) relay is only just getting off the ground, following some unsuccessful attempts. A particular obstacle is lack of a robust business model. Activities such as the EU REACH112 project are, however, helping to promote need.No government funding available. It is too expensive for most users so, even though there are two main commercial services, they are only accessible by those who can obtain Access to Work funding.AustraliaThere is a need for more operators and for the general public to understand why people use these services.U.S.A.
35

SMART 2008/0066 Monitoring eAccessibility in Europe
Report on the eAccessibility survey for organisations representing people with disabilities, older people and end-users
Nowadays, most signing deaf people use videophones rather than text phones. However, text phones do still seem to be in use by: some non-signing deaf people, and also by some deaf-blind people who do not see well enough to use videophones for signing.
Videophones and video relay services may be used to call people in any part of the US or in any country around the world for free as long as the hearing person one is trying to reach talks in English. There is also an option to request a video relay interpreter who knows Spanish. Ever since the Americans with Disabilities Act was passed, phone access for deaf people via
text relay and then video relay has increased dramatically. Prior to the ADA, in places where a text relay service existed at all (and there were places with zero service) generally depended on volunteer service and usually had strict usage restrictions, such as only calls within the state and not to other states, or calls only during certain hours of the day and/or only for 10 minutes for personal calls, 20 minutes for business calls. These days, these restrictions no longer exist. Usually you only have to wait a few seconds before an interpreter is available for your call.
36

SMART 2008/0066 Monitoring eAccessibility in Europe
Report on the eAccessibility survey for organisations representing people with disabilities, older people and end-users
Accessibility of Emergency Services
Figure 12. Status of Emergency Services by country
TOTEUCZDKFRDEGRHUIEITPTESSENLUK
NON-EUAUCANOUS
0 10 20 30 40 50 60 70 80 90 100
413738
8025
3014
503030
2530
5030
5863
6030
7080
Source: Own elaboration, 2011. Unit: Percentages
The level of implementation of accessibility in the sub-category of emergency services was assessed with one question.The text of the question was: Question No. 13: Emergency services can generally be accessed dialing 1-1-2 (most of Europe), 9-1-1 (USA) or other national numbers from fixed or mobile telephones. People with speech and/or hearing impairments may need alternative channels like text telephones, real-time text telephone (also known as ToIP, Text over IP), videophones, etc. in order to be granted equally reliable emergency services. Could you please estimate the availability of such alternative emergency services in your country?The possible answers to question No. 10 were:
a) No availabilityb) Insufficient availabilityc) Some availabilityd) Good availabilitye) Wide availability
A detailed table with the results for this question is available in Annex I (page 123).Table 13 shows a summary of the results for the accessibility of emergency services.Overall, access to emergency services for people with disabilities, especially for those with hearing impairments, seems to be difficult.
37
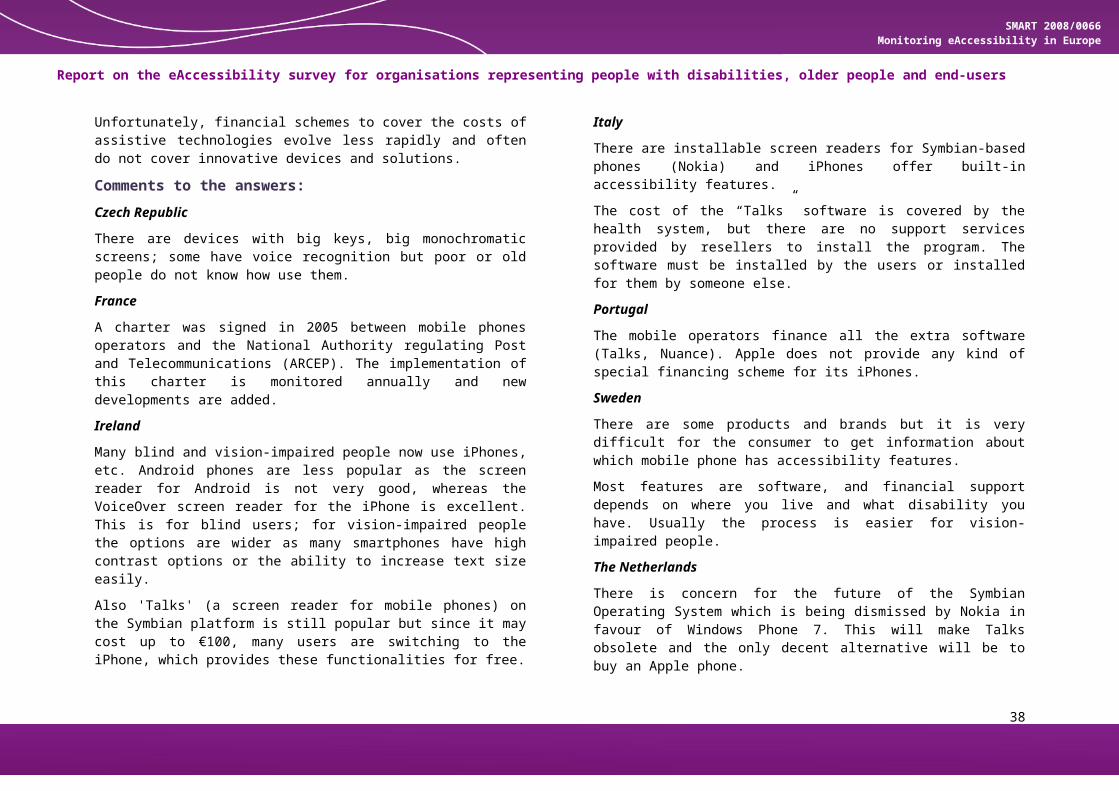
SMART 2008/0066 Monitoring eAccessibility in Europe
Report on the eAccessibility survey for organisations representing people with disabilities, older people and end-users
Table 13. Status of Emergency Services
TOT EU CZ DK FR DE GR HU IE IT PT ES SE NL UK NON
EU AU CA NO USTotal Accessibility of Emergency Services 41 37 38 80 25 30 14 50 30 30 25 30 50 30 58 63 60 30 70 80Q.13 Availability of Accessible Emergency Services
41 37 38 80 25 30 14 50 30 30 25 30 50 30 58 63 60 30 70 80
Source: Own elaboration, 2011. Unit: Percentages
In the EU zone (which reaches an average score of 41 against the score of 63 obtained by non-EU countries), only Denmark (80), the UK (58), Sweden (50) express scores which are well inside the “medium level of implementation” area. Most of the other EU countries score between 25 and 38 (CZ) while the lowest level of implementation is achieved by Greece (14). The US, Norway and Australia score, respectively, 80, 70 and 60.Comments to the answers:Czech RepublicAlternative emergency services can only be accessed by text message or fax.There are some developments and some changes are expected within 2 years.DenmarkText telephony is possible and an sms service has been established.France
France is part of the REACH112 Consortium for the test phase. IrelandThe Department of Communications conducted a consultation exercise in August 2009 on the provision of an Emergency Call Answering Service (ECAS). No update has been published by the department on the piloting or provision of an accessible public Emergency Call Answering Service in the meantime.The service is planned (and promised), but as yet is not available.Possible delays in text messages are a problem. PortugalIn the Faro district a text message can be sent to 911120000. SwedenThere are projects being conducted. But services are only available during office hours, not 24 hours. And for SMS you have to report the phone number to the emergency service operator, restricting the use from somebody else’s phone and putting extra administration on the user if you change your number. For people with cognitive impairments there are no alternative solutions.
38

SMART 2008/0066 Monitoring eAccessibility in Europe
Report on the eAccessibility survey for organisations representing people with disabilities, older people and end-users
The NetherlandsNetherlands will adopt a kind of SMS system and there is not yet a solution for the visually impaired.
United KingdomUK has 999 as the voice but also as SMS, text messaging for emergency. You need to register your mobile to access the service.U.S.A.The access of deaf/hard of hearing/speech impaired people to 911 services is somewhat uneven in the US.
39

SMART 2008/0066 Monitoring eAccessibility in Europe
Report on the eAccessibility survey for organisations representing people with disabilities, older people and end-users
3.2.3 Internet
The category Internet consists of two sub-categories: “Public Websites” and “Private Websites”. Detailed considerations on these two sectors shall be made in the following chapters while a summary of the outcome is provided here in Table 14.Internet and the accessibility of websites has always been one of the most visible faces of eAccessibility. This is probably a trend that will be confirmed even in the years to come since the access to Web content is becoming ever more ubiquitous, being the access to online content integrated in more and more everyday technologies and devices. A website, which is basically a software technology, has the advantage of being more flexible than hardware devices and thus easier to adapt to special needs and accessibility standards. Yet progress in this field is still incredibly slow, especially in the public sector, albeit being mostly regulated by national laws and directives.
Figure 13. General results in the field of Internet
Public Websites
Private Websites
Total Internet
0 10 20 30 40 50 60
40
37
38
47
52
50
NON EU EU
Source: Own elaboration, 2011. Unit: Percentages
Table 14. Status of Internet by country
TOT EU CZ DK FR DE GR HU IE IT PT ES SE NL UK
NON EU
AU CA NO US
Public Websites 41 40 37 30 31 45 23 30 40 30 62 51 49 23 39 47 49 27 23 61Private Websites 40 37 47 30 38 33 13 20 39 38 46 38 47 30 35 52 53 30 30 67Total Internet 41 38 42 30 35 39 18 25 39 34 54 45 48 27 37 50 51 28 27 64
Source: Own elaboration, 2011. Unit: Percentages
40

SMART 2008/0066 Monitoring eAccessibility in Europe
Report on the eAccessibility survey for organisations representing people with disabilities, older people and end-users
Figure 14. Overall results in the field of Internet by country
GRHUNLNOCADKITFRUKDEIECZESSEAUPTUS
0 10 20 30 40 50 60 70
182527272830
3435
373939
4245
4851
5464
Source: Own elaboration, 2011. Unit: Percentages
The perception user organizations have of the progress in the area of website accessibility is clearly still insufficient and this is supported by an overall score of 38 points in the EU zone. The non-EU zone performs slightly better (50), especially thanks to the contribution of the U.S.A., with a more encouraging score of 64 out of 100. In Europe, according to the national associations, the leading countries in the overall status of Internet accessibility are Portugal (54), Sweden (48) and Spain (45) while four countries display a poor level of implementation: Denmark (30), the Netherlands (27), Hungary (25) and Greece (18).Italy (34) is only a point over the “medium level of implementation” threshold and even Ireland and the UK show very little progress (39 and 37 respectively) despite having very strong regulations on the matter of website accessibility.The survey also revealed an interesting fact in terms of the proportion of accessible public websites and services against the accessibility of private websites and services.
Table 15. General results in the field of Internet by zone and by type of service
EU NON-EU
Public Websites 46 45
Private Websites 36 46
Public Services 43 54
Private Services 40 58
Source: Own elaboration, 2011. Unit: Percentages
41

SMART 2008/0066 Monitoring eAccessibility in Europe
Report on the eAccessibility survey for organisations representing people with disabilities, older people and end-users
As Table 15 and Figure 15 clearly show, in European countries the accessibility of public websites is generally better than the performance of the private sector (43 against 36 for websites and 43 against 40 for online services). The reason for this trend can be found in the fact that existing legislation is less compulsory for private companies.A completely opposite trend has been registered in the non-EU countries where all four countries, and especially Australia and the U.S.A., score higher points in the private sector. In this case, private websites score 46 against 45 (public websites) and even for the online services there seem to be more cases of success in the private sector than in the public sector (58 against 54).This positive trend may probably be driven by the greater risk of legal liability for private companies which incur in episodes of discrimination but nonetheless there were comments stating that companies may be finally achieving a greater awareness in this matter and understanding the economic advantages of eAccessibility in terms of an increase of the general level of usability and of a wider customer reach.
Figure 15. Comparison between the accessibility of websites and services in the private and public sectors
Public Websites Private Websites Public Services Private Services0
10
20
30
40
50
60
70
46
36
4340
45 46
5458
EUNON-EU
Source: Own elaboration, 2011. Unit: Percentages
42

SMART 2008/0066 Monitoring eAccessibility in Europe
Report on the eAccessibility survey for organisations representing people with disabilities, older people and end-users
Accessibility of Public Websites
Figure 16. Status of Public Websites by country
TOTEUCZDKFRDEGRHUIEITPTESSENLUK
NON-EUAUCANOUS
0 10 20 30 40 50 60 70 80 90 100
4140
373031
4523
3040
3062
5149
2339
4749
2723
61Source: Own elaboration, 2011. Unit: Percentages
The perception of users of the level of implementation of eAccessibility in the sub-category of public websites was assessed with three questions.The first question was: Question No. 14: In many countries there are policies, laws or regulations addressing the accessibility of public websites, sometimes with explicit deadlines regarding the enforcement of such measures. Nonetheless progress in this field is very slow. In your experience, approximately how many public websites in your country are at least fairly accessible and/or have an accessibility statement?The possible answers to question No. 14 were:
a) None or almost none are accessibleb) Some websites are accessiblec) About 1 out of 2 are accessibled) Most websites are accessiblee) Almost every website is accessible
A detailed table with the results for this question is available in Annex I (page 124).The second question was: Question No. 15: How would you rate the average level of quality of public websites in terms of accessibility and ease of use? If you are familiar with WCAG 1.0 or WCAG 2.0 accessibility guidelines, you can use levels A, AA, AAA as a reference.The possible answers to question No. 15 were:
a) Insufficient (less than level A)b) Sufficient (level A)c) Fair (between A and AA)d) Good (level AA)
43
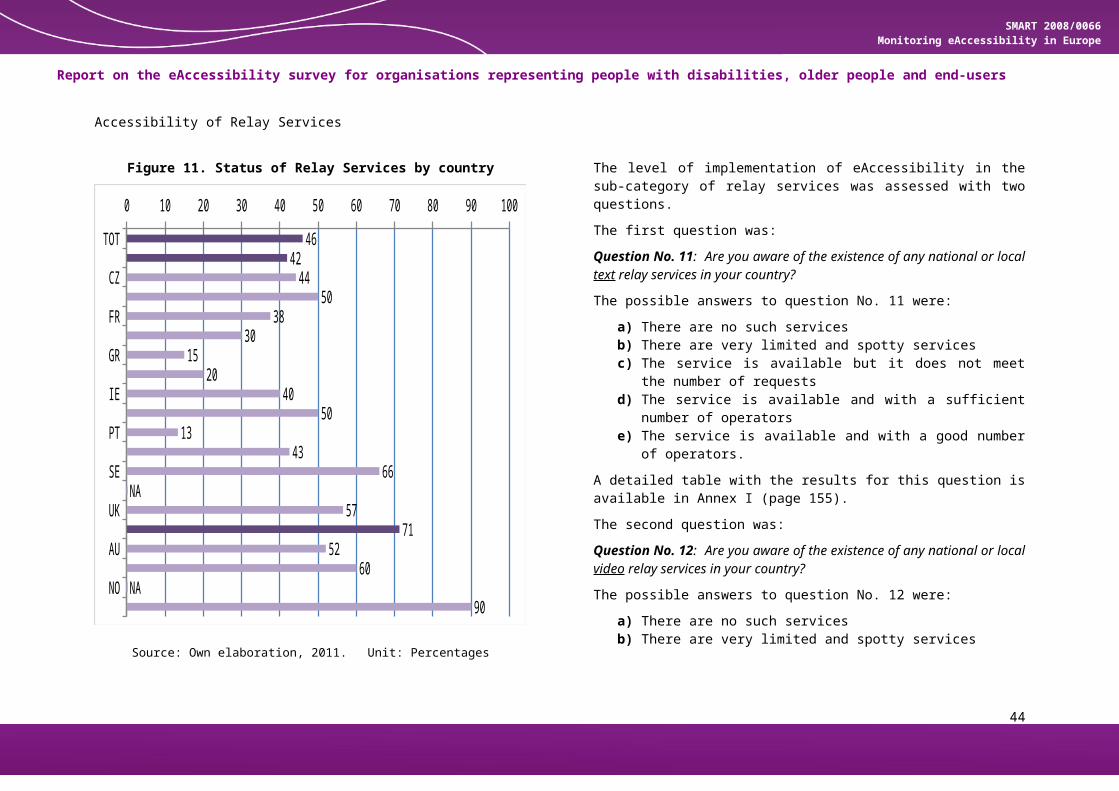
SMART 2008/0066 Monitoring eAccessibility in Europe
Report on the eAccessibility survey for organisations representing people with disabilities, older people and end-users
e) Very good (between AA and AAA)A detailed table with the results for this question is available in Annex I (page 125).The third question was: Question No. 16: When using public online eGovernment services to request certificates, pay taxes, etc., how often do you encounter barriers which are so difficult to overcome that you are forced to switch to another channel to complete them (e.g. by telephone operator or going to a physical public office)?The possible answers to question No. 16 were:
a) Alwaysb) Oftenc) Sometimesd) Rarelye) Never
A detailed table with the results for this question is available in Annex I (page 126). shows a summary of the results for public websites, also reporting the value scored by each country in questions No. 14, No. 15 and No. 16.As already commented in the main Internet chapter, the overall situation of the accessibility of public websites is not proportionate to all the efforts that have been spent on this subject over the last decade by international initiatives, such as the WAI, or by national measures.
Table 16. Status of Public Websites
TOT EU CZ DK FR DE GR HU IE IT PT ES SE NL UK
NON EU
AU CA NO US
Total Public Websites 41 40 37 30 31 45 23 30 40 30 62 51 49 23 39 47 49 27 23 61Q.14 – Quantity of accessible public websites
45 45 34 50 40 55 34 30 43 38 75 50 50 30 45 46 50 30 30 50
Q.15 – Quality of public websites 33 31 40 10 23 30 14 30 30 18 50 50 45 10 30 42 47 10 10 63Q.16 – Online public services 44 43 38 30 30 50 22 30 47 33 60 53 53 30 43 54 50 40 30 70
Source: Own elaboration, 2011. Unit: Percentages
44

SMART 2008/0066 Monitoring eAccessibility in Europe
Report on the eAccessibility survey for organisations representing people with disabilities, older people and end-users
The average score of 40 in the EU zone is almost in line with the non-EU score of 47 and in both the zones only two countries seem to be best performers: Portugal (62) and the U.S.A. (61). As explained in the comments, this data may refer only to central and state agencies, not to local authorities.The only other countries to be above average in Europe are Spain (51), Sweden (49) and Germany (45) while six European countries still show a poor level of implementation: Denmark (30), France (31), Greece (23), Hungary (30), Italy (30) and The Netherlands (23).In general the results from the specific questions show that the situation is slightly better in terms of number of websites that are at least fairly accessible (the EU average scores 45 and the non-EU zone scores 46). On the other hand, when we consider the average quality of the websites, the score is usually lower. The score for Europe is only 31 and in terms of WCAG classification, which the question referred to, that would mean that the average public website is only slightly better than a full Level A. The answers to question No. 15 show that 5 European countries out of 13 have public websites with an average level of quality that is inferior to WCAG Level A: Denmark (10), France (23), Greece (14), Italy (18), the Netherlands (10). The situation of online public services is more or less aligned with the website trend with best performances in the U.S.A. (70), Portugal (60), Spain and Sweden (53 each).Comments to the answers:Czech RepublicState and regional public websites are Level Double A, but local authorities usually score Level A minus.Denmark
A survey on Danish public websites was carried out in 2010: http://webtjek.itst.dk/vurderinger-2010GermanyAccessibility of websites is low. German law requires federal websites and the websites of the authorities to be accessible. This includes, for instance, municipalities. However these are often not accessible at all as there is no funding to work on them. Furthermore, the issue of accessibility of websites is unknown to the public. 80 to 90% of all German websites are insufficiently accessible.As there are legal requirements to ensure accessibility (WCAG 1.0 level) federal services are usually accessible. Germany is expecting an update from WCAG 1.0 to 2.0 in the near future which will force the government to add further services to their websites (e.g. plain language, signing). Although there will be a period of time to implement additional services, it will ultimately improve accessibility of the government websites. However, it might not have a significant effect on private websites (e.g. companies, organisations).GreeceThe Greek government has a strong political commitment to support vulnerable social groups. However, so far, according to a study entitled “An overview of web accessibility in Greece: a comparative study 2004/2008”, only 1% of public websites are considered accessible.For more information see: Basdekis, I., Klironomos, I., Metaxas, I., & Stephanidis, C. (2010). An overview of web accessibility in Greece: a comparative study 2004-2008. Universal Access in the Information Society, 9 (2), 185-190.Ireland
45

SMART 2008/0066 Monitoring eAccessibility in Europe
Report on the eAccessibility survey for organisations representing people with disabilities, older people and end-users
There is still only a very small amount of public sector websites and services that are accessible in Ireland. This shows a disconnection between initiatives like Riga/Barcelona and their practical application. Also the approach to eAccessibility may need to change. Those who are well disposed to accessibility and best practice will do it, and maybe the message isn't getting through to those who are not. Legislation also needs “teeth”, otherwise it is pointless. Much legislation in Ireland is not binding and is couched in terms like 'as far as practicable'.Most public sector websites have attempted to address accessibility since the enactment of the Disability Act 2005. However the approach and implementation differ greatly as does the actual level of accessibility.The National Disability Authority conducts a monitoring survey on the accessibility of public services that contains a question on web accessibility. The self-declared level of conformance rating Double A with WCAG 2.0 is approximately 40%. However from auditing carried out for an award scheme run by NDA the level is much lower than this. While many public sector websites fail on one or two specific checkpoints, many are quite close to achieving conformance rating Double A. Inconsistent or inaccurate application of the guidelines is the main reason for checkpoint failures during a full audit.As regards access to public online services, email access is usually available to Deaf/Hard of Hearing people, but text access is seldom available for real-time access.ItalyOnly approximately 5% of the public websites is accessible. Most of the remaining websites are usually partially accessible except for a few sections where it is sometimes impossible to access.
Even if the estimate is difficult, globally speaking, the perception is that Law 4/2004 helped to raise awareness and the sensibilisation about this matter.For online services there is often at least one step of the process that requires a sighted person.In some cases access to online services is not clear and direct. People often need to read several website pages with attention before they can finally reach the required information.PortugalAccording to the 1st study to the 192 UN members, Portugal appears in 2nd place (UWEM methodology). The latest information revealed by Program ACESSO at Forum SI, quotes that in 351 websites, with more than 40 thousands pages the webax index is equal to 5.8 (on a scale of 1-10). For example in 77% of 40853 pages analysed, all images found had the alt text. The answer to question No. 16 refers to Government and Central Administration websites. Local public websites are not addressed by legislation and have lower accessibility. Data from Central Public Administration shows 68% (A) and 11% (AA) - Nov.2010. The same sample and methodology in 2008 showed: 61% (A)SwedenAt the moment there are no national guidelines, no developed targets or monitoring going on, WCAG 2.0 has not been translated. Guidelines are being developed by government agencies without NGOs in the process. The lack of monitoring and targets is worrying as new services are rapidly being developed by agencies and local authorities. Municipalities are forcing citizens to use digital solutions (most of them developed without testing accessibility) as the only way to choose a school for a child. Communication between parents and teachers is sometimes forced to one single web-based solution that is not
46

SMART 2008/0066 Monitoring eAccessibility in Europe
Report on the eAccessibility survey for organisations representing people with disabilities, older people and end-users
accessible or even user friendly. The national system for application to higher education is centralised only through the Web and many authorities and public offices have separate systems for job applications.This development of websites without accessibility requirements is creating barriers for people with disabilities to get higher education and jobs.Most government websites have embedded video clips with very limited information in sign language.The lack of national strategy and monitoring is alarming.The access to online services seems to depend a lot on the user’s patience and communication skills. At local government level there are many different services being developed where accessibility varies a great deal; the problem to get personal support is also raised by users.A known problem for deaf sign language users of videophones is that they can't get in contact with their police/local health center by phone. In Sweden, deaf videophone users have SIP-addresses and the procedure for calling them from an "ordinary" phone is by first calling the video relay service and then tell the interpreter the SIP address of the deaf person. The Police won't call you back because you can't leave the instructions for calling through the video relay service to the machine.The Netherlands3% of public sites are accessible.Phone-desks are slowly being replaced by e-desks. Accessibility should therefore be on a Doble A level with even extra support for screenreader users in forms. There is also a problem with the use of PDF files to give important information.United Kingdom
The issue is the ability of vision-impaired people in understanding and using websites affectively. Also in their limited access to assistive technology and the support needed to make it work effectively for them.There was guidance that was put into place which stated that all new government websites should be Double A compliant (WCAG 1.0) by December 2009 and all government agencies and non departmental bodies should be Double A compliant by March 2011. Following the Equality Act coming into force in October 2010, it was reported that a government eAccessibility Forum would be set up which, among other things, would look at the accessibility of public websites in time for the Paralympics in 2012.Recent surveys in the UK of public websites have still found many public websites are still nowhere near accessible enough. This is a current priority in the UK.Technical standards in compliance may be met by public websites; however there may still be some degree of inaccessibility due to the complex nature of some sites or topic areas.There are some websites that do quite well in this area, however other high profile ones which have serious accessibility issues. Many public websites have not yet considered the change to WCAG 2.0 which is the current set of guidance for Web accessibility. This varies hugely - some come up to Double A standard, many don't come anywhere near A.The access to online services depends very much on the capabilities of the individual. For instance, a person whose first language is Sign may struggle with many regular forms but may be able to complete the task with the assistance of a sign language interpreter.
47

SMART 2008/0066 Monitoring eAccessibility in Europe
Report on the eAccessibility survey for organisations representing people with disabilities, older people and end-users
Access to eGovernment services is definitely an issue. Complicated and inaccessible websites make it often impossible to use these services online, which for many would be preferable to completing print documentation and travelling into physical offices.Many elderly people and people with literacy or learning difficulties are forced to switch to another channel to obtain a service due to site complexity. The main group of people who tend to find eGovernment usable are blind users who can master complex assistive technologies such as screen readers. The important thing here is that 'accessible' isn't enough. Sites need to be 'usable' or else people won't be able to use them.AustraliaThe Australian government is moving to compulsory adoption of WCAG 2.0 Level A by 2012. Level Double A should be achieved by 2014.All Australian Government websites need to be accessible in a couple of years, and other public websites have a little more time. Australian Government agencies are aware of this, but probably the public is not. More work needs to be done. For people who are blind or vision impaired, less than 5% of information is accessible.
There needs to be a “Name and Shame” website. The Tax website is an example of an online service many people have problems with.CanadaAwareness is growing and progress is being made, but it is slow and incomplete. Misconceptions abound. It would be useful to have accessible design techniques included in the basic education of Web developers.U.S.A.People who are blind probably face the biggest accessibility barriers, where many websites are difficult for them to use. However, government websites do usually follow "508" regulations for Web accessibility, though private websites are not always accessible. Deaf people do face some Web-related accessibility issues also, particularly in relation to whether on-line video content has captions or whether purely audio content has a transcript available. Frustratingly, even sites that do seem to be trying hard to be accessible to blind people continue to completely ignore the accessibility needs of deaf people. Attention deficit disorder, which presents it own set of Web accessibility issues, rarely receives attention.
48

SMART 2008/0066 Monitoring eAccessibility in Europe
Report on the eAccessibility survey for organisations representing people with disabilities, older people and end-users
Accessibility of Private Websites
Figure 17. Status of Private Websites by country
TOTEUCZDKFRDEGRHUIEITPTESSENLUK
NON-EUAUCANOUS
0 10 20 30 40 50 60 70 80 90 100
4037
4730
3833
1320
3938
4638
4730
355253
3030
67Source:
Own elaboration, 2011. Unit: Percentages
The perception of users of the level of implementation of eAccessibility in the sub-category of private websites was assessed with three questions.The first question was: Question No. 17: Although many policies, laws and regulations are in place for public websites, the accessibility of private websites is not equally addressed. Focusing especially on commercial websites (such as transport companies, online stores, online banking, etc.), approximately how many private websites are at least fairly accessible and/or have an accessibility statement? The possible answers to question No. 17 were:
a) None or almost none are accessibleb) Some websites are accessiblec) About 1 out of 2 are accessibled) Most websites are accessiblee) Almost every website is accessible
A detailed table with the results for this question is available in Annex I (page 127).The second question was: Question No. 18: During your online commercial operations and transactions, how often do you encounter barriers which are so difficult to overcome that you are forced to switch to another channel to complete them (e.g. by telephone operator or going to a physical store)?The possible answers to question No. 18 were:
a) Alwaysb) Oftenc) Sometimes
49

SMART 2008/0066 Monitoring eAccessibility in Europe
Report on the eAccessibility survey for organisations representing people with disabilities, older people and end-users
d) Rarelye) Never
A detailed table with the results for this question is available in Annex I (page 128).The third question was: Question No. 19: Social networks and interactive websites (Web 2.0) are often considered as community enablers, reducing social, geographical and cultural divides. Could you rate the average level of accessibility of these websites?The possible answers to question No. 19 were:
a) None or poorb) Insufficientc) Faird) Goode) Very good
A detailed table with the results for this question is available in Annex I (page 129).
Table 17. Status of Private Websites
TOT EU CZ DK FR DE GR HU IE IT PT ES SE NL UK
NON EU
AU CA NO US
Total Private Websites 40 37 47 30 38 33 13 20 39 38 46 38 47 30 35 52 53 30 30 67Q.17 - Quantity of accessible private websites
38 36 46 45 35 14 10 23 38 40 33 53 30 35 46 47 30 30 55
Q.18 - Online private services 43 40 50 30 30 50 14 30 47 30 55 47 48 30 36 58 63 30 30 70
Q.19 - Social networks 39 36 46 30 40 15 10 46 46 43 34 40 30 35 53 50 30 30 75Source: Own elaboration, 2011. Unit: Percentages
Table 17 shows a summary of the results for private websites, also reporting the value scored by each country in questions No. 17, No. 18 and No. 19.As expected, the general performance of private websites is inferior to that of public websites for most of the European
countries but there are some surprising exceptions in the EU zone and in all four non-EU countries.The average score in the EU zone is 37 while in the non-EU zone the score is 52 (whereas the U.S.A and Australia score 67 and 53, respectively).
50

SMART 2008/0066 Monitoring eAccessibility in Europe
Report on the eAccessibility survey for organisations representing people with disabilities, older people and end-users
Only the Czech Republic, Sweden and Portugal seem to stand above the average (47, 47 and 46). Greece and Hungary only score 13 and 20, respectively. The results from the specific questions show that the situation is slightly better in terms of quality of the online services than for the quantity of accessible websites (the EU average scores 40 against 36 and the non-EU zone scores 58 against 46). The switch to alternative channels for online services with accessibility issues seems to be, in general, easier for private services rather than for public ones mainly because private companies, unlike the public sector, often offer more than one contact channel in order to increase their customer reach.The accessibility of social networks (question No. 19) is still perceived as insufficient from most of the organizations worldwide whereas it is appreciated by organizations representing deaf or hard of hearing people who can browse them with less difficulty than users with sight impairments. Comments to the answers:FranceAccessibility guidelines have been agreed upon. They were established following the 2005 disability law . Nonetheless, no enforcement is ensured for the implementation of the recommended measures.GermanyVisual captchas very often make it impossible for blind people to continue using private services. Similar arguments apply to people who cannot operate a mouse, are of low vision etc.A quick check on Facebook revealed several accessibility problems. Lack of awareness of accessibility issues, the will to produce something appealing and the use of non-HTML conform objects is bound to lead to something which is not accessible.
GreeceThere are on-going discussions for appropriate legislation specifically related to eInclusion to be enacted in the near future.IrelandWith the development of new techniques such as Web 2.0, AJAX, dynamic content updating, Flash, etc. there are more opportunities to get the accessibility of a website wrong. Not that these technologies are bad, but many need special attention in order to ensure that they are accessible and this knowledge is often rare, or rarely applied. Facebook is poor, there are accessible Twitter clients.There is a high usage of social networks among Deaf people and the Deaf Community generally in Ireland.ItalyA few websites are fully accessible. The majority are not entirely inaccessible either though, except maybe for some sections which may be impossible to access.Assistive Technologies help to access at least partially the content of websites. There has been an increase in the availability of accessible online banking services.Social network websites may be very hard to use for people with sight impairments. The hardest things to do are usually to keep track of the navigation and to use the editing functions. It can be too frustrating sometimes, leading to abandoning the site.SwedenBigger banks are usually better; train transport websites are very bad; online stores vary significantly. There is no monitoring and there is no consumer protection if private websites are not
51

SMART 2008/0066 Monitoring eAccessibility in Europe
Report on the eAccessibility survey for organisations representing people with disabilities, older people and end-users
accessible. But usually there are alternatives for citizens to contact the companies, for public websites the alternatives are not always available.It is often cheaper to use online solutions, so the lack of accessibility will put extra costs on the consumer.Often the user can see the information on social networks, but to edit or administrate content is usually impossible or very difficult. Some users appreciate mobile version or light versions of websites such as Facebook.The NetherlandsOften private websites are at least partly accessible. Biggest problems: growing use of Captchas without speech alternative and the accessibility of forms and PDFs.United KingdomWith regard to online banking, the websites make it impossible for deaf customers to register for online banking. They always request telephone numbers and do not recognise access codes to relay services.Although some websites are accessible, there are not many that are accessible enough for users to complete a transaction or benefit from the service offered. There are reports from some user groups that a number of travel websites are inaccessible. Even if some websites are accessible it is unusual to find that they will have an accessibility statement.From looking at approx. 100 websites in banking, transport, and online stores, one can see more accessibility statements than there were years ago. But most of the sites are doing accessibility 'box ticking' exercises and the statements are regularly not backed up by the real accessibility of the sites.
The apparent complex nature of some websites or the subject matter can easily encourage vision-impaired people to revert to alternative ways of completing transactions.Using online banking and booking transport online are key services but it is difficult to find website providers that have taken account of accessibility when delivering their services.Text relay prefix lengthens the phone number which is not taken into account on websites.If users learn how to work around accessibility difficulties on sites then they have a better chance of completing transactions on a website. But the needs of people who are less technologically competent are being missed time after time.Many sites are designing interactive websites using dynamic interfaces which are not accessible to screen readers. However, the W3C have been working on WAI-ARIA guidelines (Accessible Rich Internet Applications) which will make these interfaces accessible to screen reader users. However, the web designer has to incorporate ARIA into the website when they are designing, so there is a matter here of educating these designers.AustraliaMore work needs to be done in this field. People with disabilities are consumers, customers and clients as well as anyone else. If a website is accessible, it also makes it easier for older people and people from non-English speaking backgrounds as well.CanadaGrowing awareness and legal liability have made an impact on the accessibility of private websites.Alternative versions of social network websites may be more accessible but often they don’t provide the same functionalities.
52

SMART 2008/0066 Monitoring eAccessibility in Europe
Report on the eAccessibility survey for organisations representing people with disabilities, older people and end-users
3.2.4Computers
This category takes into account the contribution of the sub-category “Personal Computers”.Detailed considerations in this sector shall be reported in the following chapter while a summary of the outcome is provided here in Table 18.
Figure 18. General results in the field of Computers
Personal Computers
Total Computers
0 5 10 15 20 25 30 35
32
32
34
34
NON EU EU
Source: Own elaboration, 2011. Unit: Percentages
Figure 19. Overall results in the field of Computers by country
NODKNLESITCADEGRHUAUUKSEFRCZUSIEPT
0 10 20 30 40 50 60
NA1010
1518
202526
3033
3537
404343
5050
Source: Own elaboration, 2011. Unit: Percentages
53

SMART 2008/0066 Monitoring eAccessibility in Europe
Report on the eAccessibility survey for organisations representing people with disabilities, older people and end-users
In the field of computers and in particular in the sector of personal computers the overall situation is quite bad. Personal computers are almost never provided with accessibility features out-of-the-box. The EU countries score a very low 32 points average and the non-EU are pretty much aligned with an average score of 34.
The highest scores are given by Ireland and Portugal (50 each), followed by the U.S.A. and the Czech Republic (43 each).The worst reports come from Denmark and The Netherlands (10 each) and Canada (20).Interesting considerations may be found in the comments from the answers to question No. 20.
Table 18. Status of Computers by country
TOT EU CZ DK FR DE GR HU IE IT PT ES SE NL UK
NON EU
AU CA NO US
Q.20 – Accessibility of retail personal computers
33 32 43 10 40 25 26 30 50 18 50 15 37 10 35 34 33 20 43
Total Computers 33 32 43 10 40 25 26 30 50 18 50 15 37 10 35 34 33 20 43
Source: Own elaboration, 2011. Unit: Percentages
54

SMART 2008/0066 Monitoring eAccessibility in Europe
Report on the eAccessibility survey for organisations representing people with disabilities, older people and end-users
Personal Computers
Figure 20. Status of Personal Computers by country
TOTEUCZDKFRDEGRHUIEITPTESSENLUK
NON-EUAUCANOUS
0 10 20 30 40 50 60 70 80 90 100
3332
4310
402526
3050
1850
1537
1035
3433
20NA
43
Source: Own elaboration, 2011. Unit: Percentages
The level of implementation of accessibility in the sub-category of personal computers was assessed with one question.The text of the question was: Question No. 20: When buying a Personal Computer from an online or physical consumer electronics retail store, how often does it come with out-of-the-box accessibility features and software and are these features well documented and easy to activate autonomously?
The possible answers to question No. 20 were:
a) Almost no accessibility feature is provided or documented out-of-the-box
b) There are some accessibility features but they are not clearly documented and at first an external help is required for their activation
c) There are many accessibility features but they are not clearly documented and at first an external help is required for their activation
d) There are many documented accessibility features but at first an external help is required for their activation
e) There is a rich set of accessibility features which are well documented and can be activated autonomously
A detailed table with the results for this question is available in Annex I (page 131).Figure 20 shows the chart of the results for the accessibility of personal computers.
55

SMART 2008/0066 Monitoring eAccessibility in Europe
Report on the eAccessibility survey for organisations representing people with disabilities, older people and end-users
Comments to the answers:Czech RepublicOlder people need to understand the technology basics before using its special features such as the accessibility ones.GermanyWindows 7 has speech recognition, a magnifying function and a text to speech output. In Germany text to speech is not available in German, allegedly due to licensing problems! IrelandMany operating systems have good accessibility features; they need some getting used to but that is the end-users’ responsibility.Apple products have very good accessibility features.Instructions to operate PCs are often complex and in elaborate English: this can result in difficulties for many people with hearing loss. People who are sign language users are more likely to have difficulty with complex English, and most people with acquired hearing loss are elderly, and also are more likely to have difficulty with complex technical instructions.ItalyThe accessibility features of the different Operating Systems are often unknown to the user. Most of the times people with disabilities buy a personal computer at a retail store but then seek for assistance by associations which provide support services (such as the Italian Union of the Blind) in order to install the appropriate assistive technologies.
Sweden
The voice recognition in Microsoft is not available in the Swedish versions of programs so there is not full use of the major integrated accessibility features.SeniorNet Sweden has produced a DVD giving instructions on adjusting Windows 7.The NetherlandsOnly in Apple computers is accessibility is sufficient, but the documentation does not reach the user.United KingdomSome inbuilt accessibility features of computers can initially be promising but have limited value with more complex tasks like Web browsing.Most computers these days rely on a 'suck it and see' approach which can be daunting for inexperienced people and they may not appreciate the full extent of features built into the system.The only Personal Computer provider that provides accessibility out-of-the-box is Apple as they have embedded speech and magnification into their operating system. Speech is available from when the computer is switched on for the first time, but magnification has to be switched after the initial set-up. There is documentation for these accessibility features in the print manual or online. Windows based computers offer some accessibility features but they are not as comprehensive or as well documented and very often external help is required for their activation. This is often because people are not aware there are any features available. While Apple and Microsoft include some accessibility features (and Apple include Voiceover as standard) these features are rarely sufficient to cater for all the needs of disabled or older users, and those people's awareness of these features is usually awful, even with best-practice sites like BBC My Web My Way
56

SMART 2008/0066 Monitoring eAccessibility in Europe
Report on the eAccessibility survey for organisations representing people with disabilities, older people and end-users
(www.bbc.co.uk/accessibility) to provide information and video guides.AustraliaApple products are accessible out-of-the-box, whereas Microsoft products often require you to obtain additional software to make it accessible, sometimes the extra software is very
expensive. You can use services like Microsoft Narrator but it stops working in the middle of doing things, or with some websites it doesn't work at all.CanadaThis too is improving but slowly.
3.2.5
57

SMART 2008/0066 Monitoring eAccessibility in Europe
Report on the eAccessibility survey for organisations representing people with disabilities, older people and end-users
3.2.6 Television
The category Television sums up the contributions of the two sub-categories “TV Content” and “TV Equipment”.
Detailed considerations on these two sectors are made in the following chapters while a summary of the outcome is provided here in Table 19.
Figure 21. General results in the field of Television
Accessible TV Content
Accessible TV Equipment
Total Television
0 5 10 15 20 25 30 35 40
36
34
35
39
38
38
NON EU EU
Source: Own elaboration, 2011. Unit: Percentages
Figure 22. Overall results in the field of Television by country
HUNLESFRDENOIEITGRAUCASEDKCZPTUSUK
0 10 20 30 40 50 60
181818
21242526
2931
343840
4247
5050
55
Source: Own elaboration, 2011. Unit: Percentages
58
SMART 2008/0066 Monitoring eAccessibility in Europe
Report on the eAccessibility survey for organisations representing people with disabilities, older people and end-users
The two sub-categories score similar average points, both in the EU and in the non-EU countries, thus bringing to a very even grand total. The European countries score 35 out of 100 and the non-EU zone reaches a slightly higher value of 38.The absolute leader of this sector, with an overall score of 55, is the UK (thanks to the incredible work carried out by the BBC), followed at 50 points by the U.S.A. and, quite unexpectedly, by Portugal and the Czech Republic (50 and 47).Many European countries are still experiencing a poor level of implementation, including Greece (31), Italy (29), Ireland (26),
Germany (24), France (21), Spain, The Netherlands and Hungary (18 each).It is quite interesting to notice that not all the English speaking countries perform particularly well even though they have the advantage of sharing the same language and they could thus possibly re-use alternative media tracks. Canada and Australia only score 38 and 34, respectively, and Ireland is well below, with a score of 26. This topic is analysed in greater detail in the section regarding TV Content.
Table 19. Status of Television by country
TOT EU CZ DK FR DE GR HU IE IT PT ES SE NL UK
NON EU
AU CA NO US
Accessible TV Content 37 36 54 33 22 29 30 17 22 38 42 24 42 17 58 39 37 37 40 45Accessible TV Equipment 35 34 39 50 20 20 33 20 30 21 58 13 37 20 53 38 31 40 10 55
Total Television 36 35 47 42 21 24 31 18 26 29 50 18 40 18 55 38 34 38 25 50
Source: Own elaboration, 2011. Unit: Percentages
59

SMART 2008/0066 Monitoring eAccessibility in Europe
Report on the eAccessibility survey for organisations representing people with disabilities, older people and end-users
Accessibility of TV contents
Figure 23. Status of TV Contents by country
TOTEUCZDKFRDEGRHUIEITPTESSENLUK
NON-EUAUCANOUS
0 10 20 30 40 50 60 70 80 90 100
3736
5433
222930
1722
3842
2442
1758
393737
4045
Source: Own elaboration, 2011. Unit: Percentages
The perception of users of the level of implementation of eAccessibility in the sub-category of TV content was assessed with three questions.The first question was: Question No. 21: Please provide an estimate of the availability of subtitling of TV programmes in your country and in your language. The possible answers to question No. 21 were:
a) Very little or no availabilityb) Insufficient availabilityc) Some availabilityd) Good availabilitye) Almost full availability
A detailed table with the results for this question is available in Annex I (page 132).The second question was: Question No. 22: Please provide an estimate of the availability of TV programmes with an auxiliary audio description channel in your country.The possible answers to question No. 22 were:
a) Very little or no availabilityb) Insufficient availabilityc) Some availabilityd) Good availabilitye) Almost full availability
A detailed table with the results for this question is available in Annex I (page 132).
60
SMART 2008/0066 Monitoring eAccessibility in Europe
Report on the eAccessibility survey for organisations representing people with disabilities, older people and end-users
The third question was: Question No. 23: Please provide an estimate of the availability of TV programmes with real time sign language translation in your country.The possible answers to question No. 23 were:
a) Very little or no availabilityb) Insufficient availabilityc) Some availabilityd) Good availabilitye) Almost full availability
A detailed table with the results for this question is available in Annex I (page 133).
Table 20. Status of TV Contents
TOT EU CZ DK FR DE GR HU IE IT PT ES SE NL UK
NON EU
AU CA NO US
Total TV Contents 37 36 54 33 22 29 30 17 22 38 42 24 42 17 58 39 37 37 40 45Q.21 – Subtitling 53 50 58 30 30 40 40 30 42 37 70 38 61 30 70 72 66 90 70 75Q.22 – Audio description 32 33 70 40 17 30 25 10 14 40 20 22 40 10 50 27 23 10 10 50Q.23 – Sign language 26 27 35 30 20 17 25 10 10 37 35 13 26 10 53 18 22 10 10
Source: Own elaboration, 2011. Unit: Percentages
Table 20 shows a summary of the results for TV content, also reporting the value scored by each country in questions No. 21, No. 22 and No. 23.As expected, the excellent work in the field of accessibility carried out by the British TV content provider BBC has been acknowledged by the British organisations. The UK, unlike most other countries, scores very high marks in the provision of all three alternative content channels, scoring 70 in the use of subtitling, 50 in the use of audio description channels and 53 in the use of sign language.Even if in the field of subtitling Canada scores 90 (which may be biased by the lack of many responses to the survey) and the
U.S.A. score 75, both values besting the one obtained by the UK, these two countries gain lower marks in the other two alternative media channels.In the use of subtitling, other European countries obtain high marks: Portugal (70), Sweden (61) and the Czech Republic (58) and the only countries that fall within the “poor implementation level” (Denmark, Hungary, France, The Netherlands) do so by just a few percent points, scoring 30 out of 100 each.In the use of audio description channels, the best score is obtained by the Czech Republic (70) while the UK and the U.S.A. both score 50, followed by Sweden, Denmark and Italy, scoring 40 each.
61

SMART 2008/0066 Monitoring eAccessibility in Europe
Report on the eAccessibility survey for organisations representing people with disabilities, older people and end-users
The use of sign language is the one which has the least overall score: 27 for the EU zone and 18 for the non-EU countries. The higher score of the European countries in this case is granted almost only by the UK (53) and few other countries that reach the level of “medium eAccessibility implementation”: Italy (37), Czech Republic and Portugal (35 each).All the other countries perform quite badly and, among the worst performers we can point out Hungary, Ireland, the Netherlands and, surprisingly, Canada and the U.S.A. (all scoring only 10 out of 100).
Figure 24. Use of alternative media for TV content
Subtitling Audio Description Sign Language0
10
20
30
40
50
60
70
80
90
100
50
3327
72
27
18
EUNON-EU
Source: Own elaboration, 2011. Unit: PercentagesFigure 24 shows a comparison of the scores obtained by the EU and the non-EU zones in relation to the different auxiliary media channels used by TV content providers.
Comments to the answers:
Czech RepublicSubtitling is good in state TV but poor in private TV.DenmarkOnly the two public service channels provide subtitling of most Danish programmes. Subtitling of live programmes needs to be improved. The other channels don't provide subtitles for Danish programmes.A few drama series on one public service channel are provided with audio description.Three news programmes per day are provided with real time sign language and few other programmes.FranceNational broadcasting corporations, and in general those reaching more than 2.5% of the public, have obligations, since 2005, to provide only programmes which are accessible to all.See: http://www.csa.fr/outils/faq/faq.php?id=128848A monitoring was released in 2007 by the Conseil Supérieur de l'Audiovisuel (High Council for the Audiovisual Media) – CSA. See: http://www.mdsf.org/files/CSACNCPHRapport2.pdf A law of 2009 sets out obligations regarding audio description. So far, there is an obligation of providing a monthly original programme in audio description for the national public broadcasters and the 3 main private ones. It should be applied in 2011. Some obligations exist regarding the broadcasting of at least 3 news programmes each day. It includes obligations for one children’s channel: a weekly programme has to be provided in sign language.Greece
62

SMART 2008/0066 Monitoring eAccessibility in Europe
Report on the eAccessibility survey for organisations representing people with disabilities, older people and end-users
Prisma+ is a digital terrestrial commercial-free channel provided by ERT, the public broadcaster in Greece. It is the only channel in Greece which is accessible for people with disabilities.In addition to Prisma+, major broadcasters provide a shorter news edition in sign language. In the Greek Parliament, since 2000, interpreting is provided every time there is a statement by the Prime Minister, or a matter that concerns all the country like education, health, or the social security (broadcast by television channel of the Greek Parliament).All major TV stations provide a thirty-minute news coverage daily with real time sign language.IrelandNot enough is provided for in the law for subtitling.Many broadcasters have low levels of subtitling; also, many advertisers (including public service bodies) fail to subtitle their ads (which is incredibly counterproductive). The national broadcaster, RTE, has provided audio descriptions for only one of its own programmes to date. In addition RTE does not provide capability to carry audio description in the uplink of its programming to SKY. UPC, the second biggest digital TV service provider in Ireland, provides no audio description capability in their programming.The use of sign language is very poor. The national broadcaster seems to take the view that only programmes aimed specifically at the Deaf Community should be signed (i.e. about 3 mins of a news bulletin each day, and about 8 half-hour programmes per year).
ItalyThe service of audio description is good but the availability is very poor and sometimes it has technical problems.
Only some movies are audio described and the quality level is too low.This sign language translation service concerns particularly the main TV programmes about news and/or culture.PortugalAll the movies are transmitted in the original language with captions in Portuguese. Some soap-operas (Portuguese and Brazilian ones) also have subtitling in Portuguese specifically made for deaf people and broadcasted by Tele-text.RTP (the public broadcaster) transmitted some series with audio description. The sound channel is broadcast by the national radio.The use of sign language is more available than audio description channels. Debates, religious programmes, maybe two main news programmes per day have it.SwedenAccording to statistics from EFHOH, the European Federation for the Hard of Hearing, less than 70 percent of the content was subtitled in 2010. When the organisations demand 100 percent it is not satisfying. Live programmes, local news programmes are examples where subtitles are lacking.The availability of subtitling is very good in publicly funded television. Not as good in private television.A film with audio description was shown on Public Service television for the first time in January 2010. Since 2004, 2 out of 5 public service television channels have offered audio subtitles in Swedish for programmes with subtitles in a foreign language. But the consumer needs to buy 2 set-top boxes and it is really complicated to access. Audio subtitles are more user friendly and can be used by many viewers with difficulties to read subtitles for different reasons.
63

SMART 2008/0066 Monitoring eAccessibility in Europe
Report on the eAccessibility survey for organisations representing people with disabilities, older people and end-users
Only 15 minutes programmes, 5 days a week (Mon-Fri) are provided with sign language translation. There are programmes produced in sign language, especially for children, but it is rare that "ordinary" shows are translated.United KingdomUK Communication Act 2003 requests 70% of air time to be subtitled but the UK has now reached 100% even if not always with superb quality subtitling. UK associations are proud of being leaders in this sector in EU.UK is at or near '100%' on the main channels but lower on minor channels and not presently available on interactive services, or required on Web-based TV. This could be a potential issue for the future.All public service broadcasters offer 90-100% subtitling, but coverage of digital commercial channels is patchy.The major UK broadcasters have voluntarily agreed to broadcast 20% of content with auxiliary audio channels by the end of 2011 but this is not a legal requirement, which still stands at 10%. At present, nearly all broadcasters are audio describing above 10 per cent, with a few exceeding 20 per cent.UK has 5% of air time in sign language and that is what the Deaf Community wanted and asked for.No 'closed signing' services are available, and open signing tends to be broadcasted at 'unsocial' hours.There are some separate channels with signing but only some signing on mainstream channels.
Some digital channels contribute to a scheme run by the British Sign Language Broadcasting Trust.AustraliaMoving towards 100%; currently around 60% of programmes are subtitled.Captioning for people who are deaf is starting to lack quality and accuracy.Australia is planning to do a trial with audio description in the second half of 2011, but it won't be nationwide. If the trial is well received, a full service may be rolled out, not just by the government networks, but the commercial free-to-air and pay TV networks in Australia as well.Sign language was briefly used during the flood crisis, but the commercial channels keep moving away from the "signer" to get close-ups of the person talking instead.U.S.A.There are still some smaller TV stations (local channels and also many smaller cable stations) that have little or no captioning. But most programming on most major stations these days do have captions, including some Spanish stations (though mostly for movies, not news).Sign language programmes are almost non-existent. People with videophones are apparently able to periodically receive short video clips with signed stories for very young deaf children. The use of sign language has been replaced, almost completely by captioning since the ‘90s.
64

SMART 2008/0066 Monitoring eAccessibility in Europe
Report on the eAccessibility survey for organisations representing people with disabilities, older people and end-users
Accessibility of TV equipment
Figure 25. Status of TV Equipment by country
TOTEUCZDKFRDEGRHUIEITPTESSENLUK
NON-EUAUCANOUS
0 10 20 30 40 50 60 70 80 90 100
3534
3950
2020
3320
3021
5813
3720
5338
3140
1055
Source: Own elaboration, 2011. Unit: Percentages
The perception of users of the level of implementation of eAccessibility in the sub-category of accessible TV equipment was assessed with two questions.The first question was: Question No. 24: How would you rate the availability of (end-user) equipment (e.g. TV sets, receivers, set top boxes) required to enable auxiliary channels of information, such as audio description, subtitling and signing, in your country?The possible answers to question No. 24 were:
a) None: there are no such devices availableb) Insufficient: accessibility aware TV devices are very
difficult to findc) Fair: a limited range of niche products are availabled) Good: many products are, at least to some extent,
accessibility-awaree) Very good: most mainstream devices are accessibility-
awareA detailed table with the results for this question is available in Annex I (page 134).The second question was: Question No. 25: To what extent are the possible extra costs of such accessibility aware TV equipment covered by national schemes of financial support or free of charge provision (i.e. the possible difference of cost between a mainstream TV device and an accessibility aware one)?The possible answers to question No. 25 were:
a) There is no financial support and the cost difference is high
65
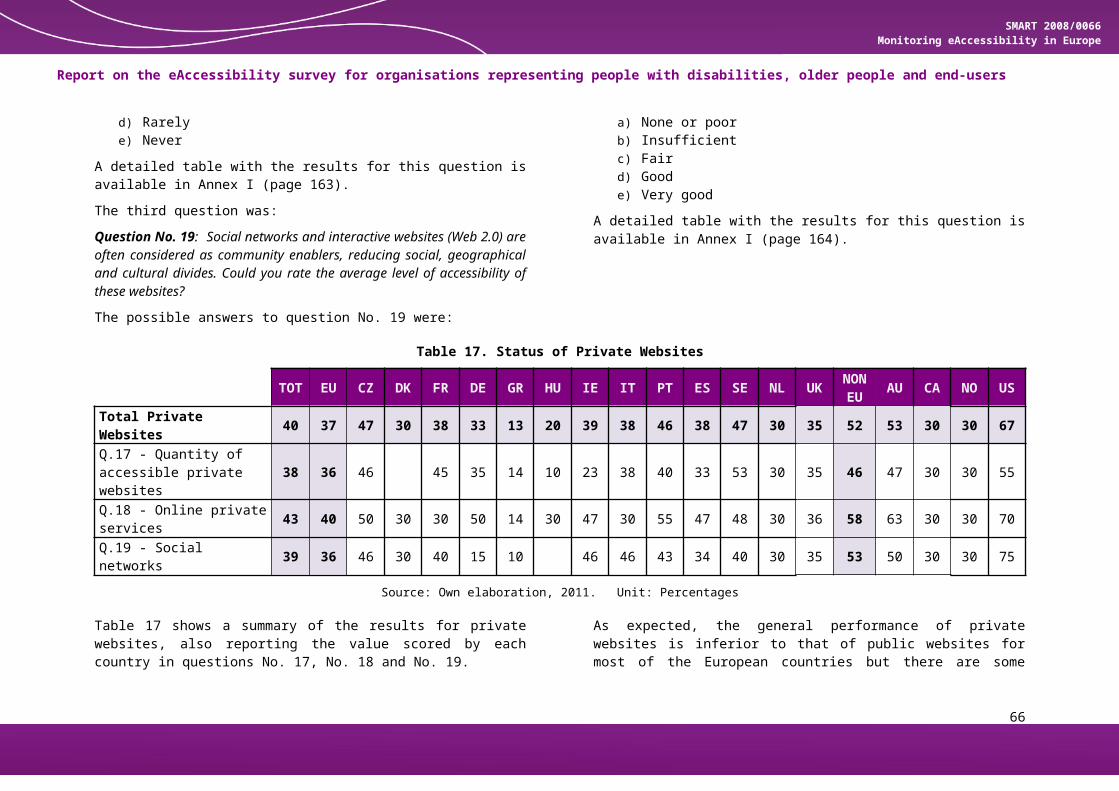
SMART 2008/0066 Monitoring eAccessibility in Europe
Report on the eAccessibility survey for organisations representing people with disabilities, older people and end-users
b) There is no financial support but the extra costs are small
c) There is a limited/fixed amount of financial support but the extra costs are small
d) The extra costs are entirely covered by financial support e) The cost of the equipment is entirely free of charge
A detailed table with the results for this question is available in Annex I (page 135).
Table 21. Status of TV Equipment
TOT EU CZ DK FR DE GR HU IE IT PT ES SE NL UK
NON EU
AU CA NO US
Total TV Equipment 35 34 39 50 20 20 33 20 30 21 58 13 37 20 53 38 31 40 10 55Q.24 – Availability of accessible TV equipment 43 43 54 40 30 30 50 30 38 22 45 15 41 30 70 45 37 50 10 70Q.25 – Costs of accessible TV equipment 26 26 23 60 10 10 15 10 22 20 70 10 33 10 37 30 25 30 40
Source: Own elaboration, 2011. Unit: Percentages
Table 21 shows a summary of the results for TV equipment, also reporting the value scored by each country in questions No. 24 and No. 25.While the display of captioning is available for free on most TV sets and set-top-boxes, more advanced accessibility features (including test-to-speech and speech-to-text services) are still generally absent from mainstream products.
In the UK, the Royal National Institute for the Blind has helped develop a special digital TV set-top-box including these features but the high costs and the low distribution of these solutions are still a problem for the international community. The best performers in this particular sector are Portugal (58), the United Kingdom (53), the United States (55) and Denmark (50).
Many countries, on the other hand, are still lagging, including Norway (10), Spain (13), France, Germany, Hungary, The Netherlands (20 each) and Italy (21).Comments to the answers:IrelandThe current Irish specification called SAORVIEW for the set-top box for the national Digital Terrestrial TV service does not have audio description (AD) capacity. Digital TV services are well received by many people with hearing loss who use these services. However, many people are not aware of how to access them (especially free-to-air).For many people who pay for their TV service, there is little difference in cost between analogue and digital services which
66

SMART 2008/0066 Monitoring eAccessibility in Europe
Report on the eAccessibility survey for organisations representing people with disabilities, older people and end-users
are much more accessible. The main additional costs are associated with connection/set-top charges.Extra costs should be provided by Government as part of Household Package given to People with Disabilities on State Disability Payments.ItalyThe Italian Union of the Blind (UICI) is trying to involve RAI (the national public broadcaster) in the production of accessible decoders with Text-to-Speech features since at the moment there are none available on the market.PortugalAssistive devices for the accessibility of Digital TV are covered by state support.SwedenAccording to a recent report there is no equipment available on the market that can deliver audio description. But the problem is that the operators for satellite, cable and terrestrial transmissions are controlling the market and they are not requesting the equipment from manufacturers that probably could easily be made available. The Tele-Text system is an outdated system, the Swedish organisations want the system used in the States, with close captioning functionalities, voice-recognition, speech–to-text. The texts of Tele-text usually hop in live broadcasting. Subtitling is usually available through Tele-text, and does not require special set-top boxes. The public television channels have separate audio channels that read subtitling out loud (for people with hearing impairment). As audio subtitling requires two set-top boxes this is an extra cost (almost 100 SEK) for the consumer with visual or cognitive impairments, including dyslexia.
The NetherlandsThere are Subtitling products, but no accessible set-top-boxes for blind and partially sighted people.United KingdomMainstream retailers don’t seem to have the knowledge to impart the benefits of access features to mainstream products.Modern digital (DVB) televisions will generally have subtitle and audio description accessibility features built in.Not all Freeview boxes and televisions can receive audio description. Sky and Freesat devices offer access to AD, as does Virgin Cable and the BBC I Player. However, access services such as audio description are only one part of what blind and partially sighted people need to be able to enjoy television. They also need the on-screen information spoken out loud in order to find the programme they want to watch, and to be able to access the electronic programme guide and other menus and programme information. There is currently only one accessible product on the market in the UK that meets this need. It is called The Goodmans SmartTalk GDB20TT, and RNIB helped to design it. The UK Digital Switchover Help Scheme is making the extra costs smaller than they would be otherwise but many users still complain that the financial support to cover the extra costs, which are very high, is not enough.AustraliaAustralian organisations are trying to push the idea that accessibility features should be included in mainstream equipment.
U.S.A.
67

SMART 2008/0066 Monitoring eAccessibility in Europe
Report on the eAccessibility survey for organisations representing people with disabilities, older people and end-users
All TV sets 13 inches or larger sold in the US since July 1, 1993 have a built-in caption decoder for deaf people. Thus, the situation for deaf people is excellent.
68

SMART 2008/0066 Monitoring eAccessibility in Europe
Report on the eAccessibility survey for organisations representing people with disabilities, older people and end-users
3.2.7Home Environment
The category home environment sums up the contributions of the two sub-categories, “digital homes” and “telecare devices”.Detailed considerations on these two sectors are made in the following chapters while a summary of the outcome is provided here in Table 22.
Figure 26. General results in the Home Environment
Digital Homes
Telecare Devices
Total Home Environment
0 10 20 30 40 50 60
29
49
35
41
60
48
NON EU EU
Source: Own elaboration, 2011. Unit: Percentages
Figure 27. Overall results in the Home Environment by country
NLGRITFRESCANODEIEUKCZPTHUAUSEDKUS
0 10 20 30 40 50 60 70 80
NA17
2424
293030
323436
3940
4350
5460
70
Source: Own elaboration, 2011. Unit: Percentages
69
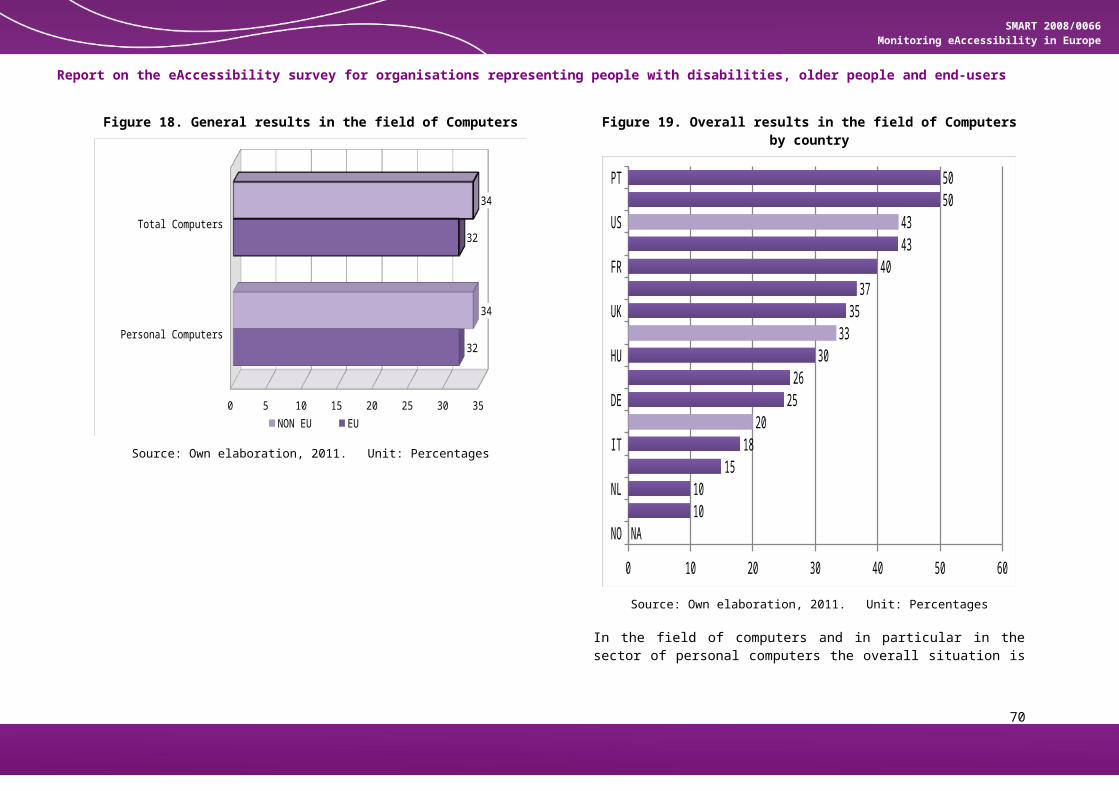
SMART 2008/0066 Monitoring eAccessibility in Europe
Report on the eAccessibility survey for organisations representing people with disabilities, older people and end-users
Table 22. Status of the Home Environment by country
TOT EU CZ DK FR DE GR HU IE IT PT ES SE NL UK
NON EU
AU CA NO US
Digital Homes 30 29 30 70 17 23 10 30 30 17 30 14 53 25 41 46 30 30Telecare Devices 50 49 57 40 40 50 30 70 42 38 60 58 57 58 60 57 70Total Home Environment 37 35 39 60 24 32 17 43 34 24 40 29 54 36 48 50 30 30 70
Source: Own elaboration, 2011. Unit: Percentages
The technologies related to the home environment and to independent living are still very young in terms of maturity and this can be clearly seen in the general score table.
Both the EU and the non-EU zone perform significantly better in the field of telecare devices, where more products are available from mainstream brands and operators.
The EU scores an average of 35 while the non-EU countries score 48. For the EU, the score for digital homes is significantly lower than average (29) while 49 is the average score for the availability of telecare devices.The worst performing countries are Greece (17), France and Italy (24 each), Norway and Canada (30 each).
70

SMART 2008/0066 Monitoring eAccessibility in Europe
Report on the eAccessibility survey for organisations representing people with disabilities, older people and end-users
Accessibility of Digital Homes
Figure 28. Status of Digital Homes by country
TOTEUCZDKFRDEGRHUIEITPTESSENLUK
NON-EUAUCANOUS
0 10 20 30 40 50 60 70 80 90 100
302930
7017
2310
3030
1730
1453
NA25
4146
3030
NASource: Own elaboration, 2011. Unit: Percentages
The level of implementation of accessibility in the sub-category “digital homes” was assessed with the following question: Question No. 26: A digital home may improve the independent living of many categories of people simplifying the access to home equipment, electronic appliances, etc. Could you please estimate how many digital home devices are provided to people with special needs in your country by the national social/health system?The possible answers to question No. 26 were:
a) Noneb) Only a very limited selection of basic devicesc) There is a sufficient selection of basic devicesd) A good range of basic devicese) A wide range of devices, including more expensive ones
A detailed table with the results for this question is available in Annex I (page 137).Table 23 shows a summary of the results for the access to digital home solutions.Even though many home automation devices would probably help improve the independent living of many people with disabilities and older citizens, the stage of maturity of these technologies is apparently still too low to be considered within the scope of national schemes.The main activities in this field are usually represented by experimentations at local level.This is reflected by the results of the survey on this topic since most countries fall within the level of poor implementation.
71

SMART 2008/0066 Monitoring eAccessibility in Europe
Report on the eAccessibility survey for organisations representing people with disabilities, older people and end-users
The only two European countries that have probably worked harder on the implementation of solutions and pilots in this field are Denmark (scoring 70) and Sweden (53).The low number of responses could indeed bias the Danish score but it is interesting to notice that while in many other countries there are national lists of ATs that fall within the scope of financial support schemes, in Denmark there is no such list. So, while in other countries the lists of ATs may be slow to get
updated, in Denmark it is a committee that decides, case by case, if an AT can be provided by the health system. This scheme is surely more apt to welcome innovative solutions, including new digital home devices.The only non-EU country scoring a good average is Australia (46). The average score in Europe is 29 and 41 in the non-EU zone.
Table 23. Status of Digital Homes
TOT EU CZ DK FR DE GR HU IE IT PT ES SE NL UK
NON EU
AU CA NO US
Total Digital Homes 30 29 30 70 17 23 10 30 30 17 30 14 53 25 41 46 30 30Q.26 – Access to digital home devices 30 29 30 70 17 23 10 30 30 17 30 14 53 25 41 46 30 30
Source: Own elaboration, 2011. Unit: Percentages
Comments to the answers:Czech RepublicDigital home devices generally have high prices while people with disabilities have a low social status and income.IrelandThe access to such devices depends on funding and is, in general, limited.SwedenOnly some projects or local tryouts are being put in place.United Kingdom
There is no provision of digital home devices to people with sight problems by the national social/health system in the UK. Blind people identify the poor availability of such devices as an issue, for example in relation to increasing difficulty in using domestic appliances (white goods), heating and security systems.AustraliaThis sector needs to be addressed more effectively.U.S.A.There is no "national/social" health system in the US, unless you mean medicare or medicaid health insurance. Medicaid does tend to have a strong bias toward supporting institutionalized care but not really providing much support for people with
72

SMART 2008/0066 Monitoring eAccessibility in Europe
Report on the eAccessibility survey for organisations representing people with disabilities, older people and end-users
disabilities to live in their own home in the community. There might be a few states where the picture looks a bit better, but these would be exceptions.
Access to Telecare Devices
Figure 29. Status of Telecare Devices by country
TOTEUCZDKFRDEGRHUIEITPTESSENLUK
NON-EUAUCANOUS
0 10 20 30 40 50 60 70 80 90 100
5049
574040
5030
7042
3860
5857
NA5860
57NANA
70
Source: Own elaboration, 2011. Unit: Percentages
The level of implementation of accessibility in the sub-category “access to telecare devices” was assessed with the following question: Question No. 27: Telecare devices can help monitoring real time emergencies and lifestyle changes over time of certain risk categories even at a distance and preserving an independent living. How would you rate the ease of access to these devices in your country in terms of range of available products and support provided to the user?The possible answers to question No. 27 were:
a) None: there are no such products or servicesb) Very difficult: few products are available and almost no
support is providedc) Not so easy: the range of products is limited and there is
not much assistance d) It could be easier: there is a certain amount of available
products and some assistance is provided e) Quite easy: many products are available and assistance
can be easily obtainedA detailed table with the results for this question is available in Annex I (page 138).Figure 29 shows a summary of the results for the accessibility of telecare devices.As in the case of digital home devices, telecare devices are still in the process of being tested and assessed by national health systems.
73

SMART 2008/0066 Monitoring eAccessibility in Europe
Report on the eAccessibility survey for organisations representing people with disabilities, older people and end-users
Table 24. Status of Telecare Devices
TOT EU CZ DK FR DE GR HU IE IT PT ES SE NL UK
NON EU
AU CA NO US
Total Telecare Devices 50 49 57 40 40 50 30 70 42 38 60 58 57 58 60 57 70Q.27 – Access to telecare devices 50 49 57 40 40 50 30 70 42 38 60 58 57 58 60 57 70
Source: Own elaboration, 2011. Unit: Percentages
Unlike home automation devices though (which can be very expensive without a financial support scheme), telecare devices and services can be found on the open market for reasonable prices and are provided by mainstream brands and national telecom operators (like in the case of Portugal Telecom).Thus in general the average score in this field is higher: the average score for Europe is 49 and many countries contribute with above-average scores.Hungary obtains the highest vote (70) but the response comes from only one organisation and may not reflect the real situation.Portugal scores 60, Spain 58 and the Czech Republic and Sweden follow with 57. The U.S.A. also performs well (70), and Australia, too, is above-average (57). Comments to the answers:Czech Republic
Some organisations are working on the development of some telecare support schemes and the situation is expected to change.IrelandThere is only a very limited access (no national programme for example), and there are costs involved.This is a very new field and will probably take time to bed into system.PortugalPortugal Telecom offers some of these products.SwedenOnly some projects or local try-outs are being put in place.United KingdomThere are no such devices for people with hearing loss.The identification of needs, along with the development of potential technological solutions, is important.
74

SMART 2008/0066 Monitoring eAccessibility in Europe
Report on the eAccessibility survey for organisations representing people with disabilities, older people and end-users
These products and services are rare. Whilst there has been some experimentation and research, the organisations of the blind have not been contacted by companies wishing to consider the needs of blind or low vision customers. The client group for such services would have a high proportion of people with sight problems, and so their needs would need to be considered in design and in any procurement.Some devices are available on the free market.AustraliaThere is currently a project in the private sector involving tracking those who are in an emergency.
U.S.A.There is the case of a woman who has some devices in her home that let her occasionally speak with a carer instead of having them come to her home when she needs guidance at night (she is autistic and needs reminders for things like drinking water or taking medicines. As she is autistic, she becomes overloaded with stimulation if there is someone in her home for too many hours a day, so being able to talk with someone remotely for the occasional overnight issues, her experience enables her to live more independently). There are also some hospitals installing remote video interpreting equipment for deaf people.
75
SMART 2008/0066 Monitoring eAccessibility in Europe
Report on the eAccessibility survey for organisations representing people with disabilities, older people and end-users
3.2.8Urban Environment
The category urban environment includes four sub-categories, “ATMs”, “vending machines”, “virtual kiosks” and “public transportation information”.Table 25 displays a summary of the average scores per country obtained in the accessibility of the four sub-categories of the urban environment.A quick overview of the outcome in terms of scores and comments by the organisations suggests that the only field in which some progress has been achieved is that of ATM machines. Even though the geographic distribution of these accessible units is far from ensuring satisfactory coverage, the major banking institutes are slowly replacing old machines with new ones which come provided with accessibility features such as headphone audio interface, high contrast colour options and Braille on the buttons. The good performance of ATM machines goes along with the progress in the field of online banking (discussed earlier) which can be brought back to an increase of awareness lately expressed by banks in regard to the accessibility issues.As a total, the availability of accessible ATM machines scores 46 in Europe and 61 points in the non-EU zone.The performance of vending machines and virtual kiosks is, on the other hand, quite poor and in both cases this may be due to the total lack of universal directives or standards for producers to follow in order to install at least the most rudimentary accessibility features on their machines. Why would a person with vision impairments, for instance, choose to spend ten or more minutes trying to figure out how a ticket-vending machine works and which accessibility features it has or does not have if the main reason for choosing to use a
machine instead of the ticket counter is to avoid queues and wasting time?
Figure 30. General results in the Urban Environment
ATMs
Vending Machines
Virtual Kiosks
Public Transportation Information
Total Urban Environment
0 10 20 30 40 50 60 70
46
28
29
30
33
61
41
35
35
43
NON EU EU
Source: Own elaboration, 2011. Unit: Percentages
76

SMART 2008/0066 Monitoring eAccessibility in Europe
Report on the eAccessibility survey for organisations representing people with disabilities, older people and end-users
Figure 31. Overall results in the Urban Environment by country
HUNOGRDEITFRESNLCAIE
AUUKDKCZSEPTUS
0 10 20 30 40 50 60 70
102021
2429303030
3334353738
4142
4566
Source: Own elaboration, 2011. Unit: Percentages
Until universal interfaces are implemented on a large scale, maybe using wireless communication protocols to display information and selection options on personal mobile devices, including interactions and payment transactions, this sector will probably continue to lag in the field of accessibility.The overall availability of accessible vending machines reaches 29 points in Europe and 41 in the non-European countries. The average score of virtual kiosks is very similar (EU: 30, non-EU: 35). Another area in which there seems to be some progress, but only on very small scale and in a very limited number of major municipalities, is the availability of multi-channel and accessible public transport information.A sarcastic comment from an organisation suggests caring about the accessibility of public transport itself before even starting worrying about the accessibility of transport information. This bitter comment reveals an underlying need that people with disabilities have to be able to live and to move independently in the urban environment. This need, at the moment, is nowhere close to being met since, to quote another comment from a Swedish organisation, some people say that “they feel so insecure when using public transport that they might refrain from travelling”.Even in this case, where multi-channels of information are adopted, mainly visual (big screens) and audio (public address systems), the information is not always equally available and updated with the same frequency.
Many airports are adopting policies to reduce acoustic announcements. This can lead to blind people missing out on
77

SMART 2008/0066 Monitoring eAccessibility in Europe
Report on the eAccessibility survey for organisations representing people with disabilities, older people and end-users
information regarding a change of gate, a flight delay or a last call for passengers. On the other hand, deaf people may have problems if the information about changes in flight schedules is not updated clearly and quickly on the screens.More than in the case of vending machines and virtual kiosks, users have expressed a deep concern and a strong necessity to improve the overall situation.Even in this case, the survey confirms the lack of satisfaction for the low level of implementation of accessibility policies in transport information services. Europe scores an average of 30 and the non-EU countries reach a slightly higher 35 out of 100.
Overall, the best performance is scored by the U.S.A., with a total of 66 points. In Europe, the highest levels of implementation are reached by Portugal (45), Sweden (42) and Czech Republic (41), while Hungary (10), Greece (21) and Germany achieve the lowest scores.
Table 25. Status of the Urban Environment by country
TOT EU CZ DK FR DE GR HU IE IT PT ES SE NL UK
NON EU
AU CA NO US
Q.28 – Availability accessible ATMs 48 46 50 50 30 30 26 10 38 43 80 40 59 70 57 61 58 40 50 83
Q.28 – Availability of accessible vending machines
30 28 38 30 23 25 22 10 30 20 43 27 38 30 20 41 30 30 10 65
Q.30 – Availability of accessible virtual kiosks 30 29 34 30 30 25 22 10 30 22 37 25 40 10 33 35 30 30 10 57
Q.31 – Availability of accessible public transport information
31 30 42 40 35 15 14 10 38 30 20 27 33 10 37 35 22 30 10 60
Total Urban Environment 35 33 41 38 30 24 21 10 34 29 45 30 42 30 37 43 35 33 20 66
78

SMART 2008/0066 Monitoring eAccessibility in Europe
Report on the eAccessibility survey for organisations representing people with disabilities, older people and end-users
Source: Own elaboration, 2011. Unit: Percentages
79

SMART 2008/0066 Monitoring eAccessibility in Europe
Report on the eAccessibility survey for organisations representing people with disabilities, older people and end-users
Accessibility of ATMs
Figure 32. Status of ATMs by country
TOTEUCZDKFRDEGRHUIEITPTESSENLUK
NON-EUAUCANOUS
0 10 20 30 40 50 60 70 80 90 100
4846
5050
3030
2610
3843
8040
5970
5761
5840
5083
Source: Own elaboration, 2011. Unit: Percentages
The level of implementation of accessibility in the sub-category “ATMs” was assessed with the following question: Question No. 28: Automated Teller Machines (cash dispensing machines) are widely available outside banks, in shopping centers, etc. Many of them are equipped with embedded accessibility features. Please estimate to what extent these accessibility aware ATMs are available in your country (e.g. speech output and keyboard to go along with the touch-screen, designed to be accessible by wheelchair users, etc.).The possible answers to question No. 28 were:
a) No availabilityb) Insufficient availabilityc) Some availabilityd) Good availabilitye) Wide availability
A detailed table with the results for this question is available in Annex I (page 139).Figure 32 shows a chart of the results for the accessibility of ATMs.According to the data from the survey, the best performing nation is the U.S.A., with a very good 83 out of 100. Second comes Portugal (80), and the third best country is The Netherlands with a score of 70.All the other scores are within a medium level of implementation, except for France and Germany (30 each), Greece (26) and Hungary (10) that fall into the area of “poor implementation”.
80

SMART 2008/0066 Monitoring eAccessibility in Europe
Report on the eAccessibility survey for organisations representing people with disabilities, older people and end-users
Comments to the answers:FranceIt is very difficult to gather figures on the availability of accessible ATMs. GreeceATMs, as well as online eBanking systems, do not provide many accessibility features in Greece.IrelandAIB, the biggest high street bank in Ireland, has recently updated its ATM stock with an NCR model that provides many accessibility features, including large tactile keys, large well-lit funnel for the insertion of the bank card, good colour differentiation and headphone jack plug. Unfortunately the software to enable audio output has not been enabled yet.A review of the accessibility of ATMs is being carried out at present by a government department.PortugalThere are voice output and magnification interfaces for the main operations.More than 85% have voice output for the blind but they provide only a few services: cash, payment of services and code change. There are many problems for physical access due to their location and positioning. SwedenThe situation is varies significantly. Some bigger banks provide speech, but tactile solutions are lacking. Wheelchair
accessibility is also very bad. Often they are hard to use because of bad design and position. There are general accessibility problems for people with cognitive disabilities.ATMs commonly have speech output and Braille text on the keyboard buttons. Some of them are placed lower to afford accessibility to wheelchair users.The NetherlandsThe situation has improved for visually impaired users but some banks are thinking of replacing buttons with touch-screens and this may become a problem.United KingdomMost ATMs are very accessible but many times the requests and the information given are confusing, so sometimes it is easier to use the ticket office.While availability is good, there is random dispersal of accessible ATM devices around the country with little or no awareness by customers or service owners (banks). The technology includes synthetic speech, the ability to alter screen resolution and font size and other audio feedback/physical accessibility attributes, but there are no incentives for providers to market these services or to purchase them from vendor manufacturers. It would be better to have: wider deployment of synthetic speech; control of devices through mobile and other hand-held systems; profile-based information resident on smart cards such that machine behaviour is altered as a result of profile information (e.g. if your profile indicates you are partially sighted, your ideal colour preferences are automatically implemented on screen); tactile and high visibility mark-up on keyboards; research into optimising user experience through touch-screen systems.
81

SMART 2008/0066 Monitoring eAccessibility in Europe
Report on the eAccessibility survey for organisations representing people with disabilities, older people and end-users
Accessibility of Vending Machines
Figure 33. Status of Vending Machines by country
TOTEUCZDKFRDEGRHUIEITPTESSENLUK
NON-EUAUCANOUS
0 10 20 30 40 50 60 70 80 90 100
3028
3830
2325
2210
3020
4327
3830
2041
3030
1065
Source: Own elaboration, 2011. Unit: Percentages
The level of implementation of accessibility in the sub-category “vending machines” was assessed with the following question: Question No. 29: Electronic vending machines (like ticket vending machines in train or bus stations, etc.) are being placed everywhere. Unfortunately some of them may not be accessible to certain categories of people. To what extent are vending machines with accessibility features available in your country (e.g. speech output and keyboard to go along with the touch-screen, designed to be accessible by wheelchair users, etc.).The possible answers to question No. 29 were:
a) No availabilityb) Insufficient availabilityc) Some availabilityd) Good availabilitye) Wide availability
A detailed table with the results for this question is available in Annex I (page 139).Figure 33 displays a chart of the results for the accessibility of vending machines per country.The U.S.A. is still the country with the highest score (65). All the other countries score significantly lower averages. The first country in Europe is Portugal (43), and the Czech Republic and Sweden follow at 38.Othe rcountries have a poor level of implementation. Hungary and Norway are the lowest (10 each) and UK and Italy are close, scoring only 20 points each.
82

SMART 2008/0066 Monitoring eAccessibility in Europe
Report on the eAccessibility survey for organisations representing people with disabilities, older people and end-users
Comments to the answers:PortugalThe Metro (subway) in Lisbon has vending machines with voice output in some stations.SwedenNo accessibility for blind users, worse than for ATMs.United KingdomOne of the areas discussed most frequently by users are their problems with travel and transport services. The use of touch screen ticket machines at railway stations is increasing, but machines with speech output or tactile keyboards are practically non-existent.
AustraliaSome vending machines use touch screens, which are inaccessible to people who are blind, vision impaired or deaf-blind.U.S.A.The Washington DC area metro system seems to have at least a few ticket machines at each station that are wheelchair accessible, and/or have Braille buttons. However public transportation in DC tends to be more accessible (because it’s more modern) compared to some other cities. Other types of vending machines such as soda machines, etc., don't seem to be designed to be accessible for blind people.
83

SMART 2008/0066 Monitoring eAccessibility in Europe
Report on the eAccessibility survey for organisations representing people with disabilities, older people and end-users
Accessibility of Virtual Kiosks
Figure 34. Status of Virtual Kiosks by country
TOTEUCZDKFRDEGRHUIEITPTESSENLUK
NON-EUAUCANOUS
0 10 20 30 40 50 60 70 80 90 100
3029
343030
2522
1030
2237
2540
103335
3030
1057
Source: Own elaboration, 2011. Unit: Percentages
The level of implementation of accessibility in the sub-category “virtual kiosks” was assessed with the following question: Question No. 30: Interactive info points and virtual kiosks may be a very practical way to provide information (e.g. maps, touristic info, etc.), services (e.g. public utility services, eParticipation, etc.) or help avoid queues (e.g. in airports, in public offices, etc.). Please estimate to what extent interactive info points and virtual kiosks with accessibility features are available in your country.The possible answers to question No. 30 were:
a) No availabilityb) Insufficient availabilityc) Some availabilityd) Good availabilitye) Wide availability
A detailed table with the results for this question is available in Annex I (page 140).Figure 34 shows a summary of the results for the accessibility of virtual kiosks.The level of accessibility of virtual kiosks is perceived by user organisations as even worse than that of vending machines, mostly because these machines are rarely available in cities and are even more rarely equipped with accessibility features. At tourist attraction sites, where virtual information kiosks could be more widely used, there is still a tendency to use audio guides, printed information (accompanied by Braille translation, where available).The U.S.A. scores an average of 57 points, followed by Sweden (37) and Portugal (34). These are the only three countries to
84

SMART 2008/0066 Monitoring eAccessibility in Europe
Report on the eAccessibility survey for organisations representing people with disabilities, older people and end-users
pass the 33-point threshold below which the implementation level is considered “poor”.The worst marks are scored by Norway, The Netherlands and Hungary (10 each).
Comments to the answers:Czech RepublicAccessible virtual kiosks are available only in bigger cities.Ireland
Some public authorities did install kiosks with some level of accessibility prior to the enactment of the Disability Act 2005. SwedenNo accessible kiosks are available for blind people.United KingdomSpeech output is often not converted also to text.There are no incentives for providers to market these services or to purchase them from manufacturers. Virtual kiosks not widely used in the UK.
85

SMART 2008/0066 Monitoring eAccessibility in Europe
Report on the eAccessibility survey for organisations representing people with disabilities, older people and end-users
Accessibility of Public Transport Information
Figure 35. Status of Public Transport Information
TOTEUCZDKFRDEGRHUIEITPTESSENLUK
NON-EUAUCANOUS
0 10 20 30 40 50 60 70 80 90 100
3130
4240
351514
1038
3020
2733
103735
2230
1060
Source: Own elaboration, 2011. Unit: Percentages
86

SMART 2008/0066 Monitoring eAccessibility in Europe
Report on the eAccessibility survey for organisations representing people with disabilities, older people and end-users
The level of implementation of accessibility in the sub-category “accessibility of public transport information” was assessed with the following question: Question No.31: In airports, stations and bus stops it is important for travellers to have access to updated and precise transport information. Often the information provided on screens, through loud speakers or through interactive kiosks may not be accessible to everyone. How would you rate the level of accessibility to public transport information in your country?The possible answers to question No. 31 were:
a) Bad: certain categories of passengers could completely miss relevant information in most airports/stations
b) Insufficient: certain categories of passengers could miss part of the information in some airports/stations
c) Fair: multi-channel sources of information are available only in a few airports/station
d) Good: multi-channel sources of information are already or are being installed in many airports/stations
e) Very good: almost every airport/station is provided with multi-channel sources of information
A detailed table with the results for this question is available in Annex I (page 141).Figure 35 shows a chart of the results for the accessibility of public transport information.With regard to the situation of public transport information, apart from the highest score, which goes to the U.S.A. (60), the situation in Europe is slightly different from the outcome of the other fields of the so-called “urban environment”.
Here, the highest score belongs to the Czech Republic (40), followed by Denmark (40), Ireland (38), UK (37) and France (35). All the other European countries score a poor level of implementation. Comments to the answers:GermanyThe main channel is vision. Sometimes (mostly at railway stations) audio announcements are made. In very rare cases information is relayed using different techniques (text to speech on request by pressing a button or electromagnetically to a mobile device).IrelandThere have been improvements, but more needs to be done. Sometimes the infrastructure is in place, but operators fail to use them properly, e.g. changes to a travel service may be announced via PA systems, but not updated on display screens!ItalyIn some cities, some public buses are provided with PA systems. The same happens on some trains but on the whole, the service is insufficient.SwedenSome positive reports come from certain bus stops in Stockholm that have a button to get spoken information on bus arrivals. Some good examples of information are also provided via mobile phone. People with cognitive impairments have stated that they feel so insecure when using public transport that they might refrain from travelling. The main problem is represented by train stations that have become worse since there is more than one operator. United Kingdom
87

SMART 2008/0066 Monitoring eAccessibility in Europe
Report on the eAccessibility survey for organisations representing people with disabilities, older people and end-users
Audio announcements are the only way for many blind and partially sighted people to obtain real-time travel information when travelling independently. As audio announcements typically supply only a fraction of the real-time information that is displayed across the numerous visual screens, blind and partially sighted travellers are routinely excluded from most of the information because it is made available through visual means alone.
Other issues include the introduction of touch-screen self service points, rapidly being introduced at railway stations and other transport hubs. The design of these devices completely excludes people who may need larger fonts or who use speech output as their method for reading on-screen information.
As the Apple iPhone interface demonstrates, touch screen technology can be designed to accommodate blind and partially sighted users at no extra cost. There is no longer any justification for this situation. The industry responsible for manufacturing "self service" points must follow the example set by Apple iPhone to enable blind and partially sighted travellers to have the same options and choices as non-disabled people. It is also essential for the organisations buying these products to specify in their requirements that they must be accessible and usable to blind and partially sighted people.
A major advantage of self-service points based on hardware that is fixed to the floor, is that blind and partially sighted people are more likely to remember the physical location and use the devices when they require. Blind people find it difficult or impossible to identify a member of staff to ask for information (even if they are wearing high visibility clothing) however we understand many service providers rely on this measure alone, as their sole way to address this issue. For different reasons some railway stations have "telephone-style information points”, often a phone situated on a circular
sign saying "Information point". Anyone can pick up the phone to speak to a member of staff for assistance and travel information. As this is an audio method of communication, it is also accessible to blind travellers. Greater recognition of the issues and solutions outlined above should be urgently encouraged and spread across the transport sector, as this will enable blind and partially sighted citizens to find, access and read real-time travel information for themselves and thus travel independently and with confidence. It would be nice if the transport itself were accessible - not a lot of good knowing about it if you can't get on it.There is still a lack of text information for deaf travellers who do not hear announcements.Multi-channel sources of information are now well done on the London Transport networks (underground, trains and buses).AustraliaSome accessible information is available; there are accessible iPhone apps that can provide the information on personal devices. But this won't help if you are at a generic bus stop and multiple buses pull up and move off, without informiong what bus number they are.U.S.A.Most airports and train stations these days seem to make it fairly easy for deaf people to find a visual listing of arrivals/ departures, times, delays, etc. The frustration is that any unusual changes (e.g., plane suddenly changing gates) either are not given visually at all or else are provided much later than spoken announcements.
88

SMART 2008/0066 Monitoring eAccessibility in Europe
Report on the eAccessibility survey for organisations representing people with disabilities, older people and end-users
89

SMART 2008/0066 Monitoring eAccessibility in Europe
Report on the eAccessibility survey for organisations representing people with disabilities, older people and end-users
3.2.9Educational Environment
The category educational environment sums up the contributions of the two sub-categories, “eBooks” and “eLearning”.A summary of the outcome is provided here in Table 26 along with the results of questions No. 32 and No. 33.The accessibility of the educational environment, which is starting to depend very strongly on the use of software and web-based solutions, surely needs to be analysed in greater depth.
Figure 36. General results in the Educational Environment
eBooks
eLearning
Total Educational Environment
0 10 20 30 40 50 60 70
49
32
40
64
48
56
NON EU EU
Source: Own elaboration, 2011. Unit: Percentages
Figure 37. Overall results in the Educational Environment by country
NLCAGRPTITIEDKNOCZESFRDEHUUKSEAUUS
0 10 20 30 40 50 60 70 80 90
1015
2428
3037
4040
454748485050
5358
83
Source: Own elaboration, 2011. Unit: Percentages
90

SMART 2008/0066 Monitoring eAccessibility in Europe
Report on the eAccessibility survey for organisations representing people with disabilities, older people and end-users
It is of utmost importance that every child and student be given the chance to fully exercise his or her right to be educated and to become an integrated and productive member of the Information Society.A correct and diffuse use of eBooks and eLearning courses may help to break down many digital barriers due to sensory disabilities and to problems of geographical divide.
This is why we decided to concentrate on these two particular technological sectors. We recommend tackling this area of eInclusion with a broader investigation scope, including software products (educational software) and hardware appliances (such as electronic blackboards, etc.).More detailed considerations on eBooks and eLearning is made in the following two chapters.
Table 26. Status of the Educational Environment by country
TOT EU CZ DK FR DE GR HU IE IT PT ES SE NL UK
NON EU
AU CA NO US
Q.32 – Availability of accessible eBooks and eReaders
52 49 50 70 60 57 34 50 57 30 20 60 64 10 63 64 70 20 50 83
Q.33 – Availability of accessible eLearning courses
35 32 40 10 35 40 14 17 30 35 34 41 10 38 48 46 10 30 83
Total Educational Environment 44 40 45 40 48 48 24 50 37 30 28 47 53 10 50 56 58 15 40 83
Source: Own elaboration, 2011. Unit: Percentages
91

SMART 2008/0066 Monitoring eAccessibility in Europe
Report on the eAccessibility survey for organisations representing people with disabilities, older people and end-users
Accessibility of eBooks
Figure 38. Status of eBooks by country
TOTEUCZDKFRDEGRHUIEITPTESSENLUK
NON-EUAUCANOUS
0 10 20 30 40 50 60 70 80 90 100
524950
7060
5734
5057
3020
6064
106364
7020
5083
Source: Own elaboration, 2011. Unit: Percentages
The level of implementation of accessibility in the sub-category “eBooks” was assessed with the following question: Question No. 32: The market of digital books is rapidly growing, stimulating publishers and hardware producers. Many categories of people shall benefit from this revolution, especially if the eBooks shall be compatible with commonly available assistive technologies and eBook readers shall be equipped with simple accessibility features (such as text-to-speech, vocal commands, etc.). How easy is it to find, buy and read an eBook in your country (preferably in your language)?The possible answers to question No. 32 were:
a) Very difficult: the choice of eBooks in our language is very scarce.
b) Difficult: the choice of eBooks is very limited and not very accessible
c) Not so easy: the choice of eBooks is limited but growing and there may be accessibility issues
d) Easy: the choice of eBooks is good and some accessible eBook readers are available
e) Very easy: there is a wide choice of eBooks and eReaders with accessibility features.
A detailed table with the results for this question is available in Annex I (page 141).Figure 38 displays a chart on the accessibility of eBooks.Over the past few years, the availability of digital copies of printed books and the number of eReaders (computer programs or tablet-like portable devices) on the mainstream market has grown considerably.
92

SMART 2008/0066 Monitoring eAccessibility in Europe
Report on the eAccessibility survey for organisations representing people with disabilities, older people and end-users
Many of these devices, which may in some cases be provided with text read-aloud functionalities, do not have accessibility features that would allow a blind person to navigate menus and lists of books. Moreover, if publishers put on the market both the digital copy and the audio-book (a version of the book read by human actors), they may decide to inhibit the read-aloud feature on the digital copy thus preventing the possibility of a synthesized voice to read the book aloud to vision-impaired users.At the moment, apart from a few niche products, the only mainstream devices that come with good accessibility features are the Apple iPad and the Amazon Kindle. Unfortunately these two multi-use products, which are rather costly and can hardly be categorised as AT devices only, are not included on the lists of approved assistive technologies.Even the availability of eBooks in national languages different from English is quite spotty, mainly due to the resistance which local publishers may exert in releasing digital copies of books to avoid a potential loss of profits in case of an illegal distribution of the electronic versions.Anyway the market in this field is moving quite rapidly and probably soon there will be a wider and more accessible choice of books and devices.As to confirm this, the overall score in this field is rather high: the EU average is 49 and the on-EU countries score 64, mainly thanks to the contribution of the U.S.A. (83) and Australia (70).In Europe Denmark and Sweden perform the best, with 70 points and 64 respectively, closely followed by the UK (63).Other European countries only reach a poor level of implementation: The Netherlands (10), Portugal (20) and Italy (30). Comments to the answers:
Czech RepublicThe situation is good for blind users, complicated for others.DenmarkAccording to the Library Act passed by the Danish Parliament in 2000: Article 15: "The Danish National Library for the Blind will serve as a national centre for the public libraries by procuring for them materials specially designed for blind, partially sighted and others whose handicap prevent them from reading normal printed text. The Danish National Library for the Blind will provide lending material from Denmark and abroad as part of the service provided by the public library service to the above-mentioned groups of users". "Part 2. The Danish National Library for the Blind will provide advice to the library service about matters of importance to the service of the group of users mentioned in part 1." The Danish National Library for the Blind (NOTA) is an institution under the Danish Ministry of Culture. NOTA provides services to the blind, the visually impaired and other persons whose disability prevents them from reading standard printed material. It is NOTA's vision to provide full access to the information society for everybody including people with disabilities. NOTA produces and mediates materials in audio, in Braille and as computer files. NOTA's collection of materials is available to those who fulfil the conditions for registration as NOTA users. The Danish National Library for the Blind is also a resource centre, providing advice to the rest of the library service in questions concerning the disabled. NOTA has begun converting the production of analogue talking books to digital talking books with structure. This conversion is a large scale project as it includes both the development of new recording techniques and the conversion of 120,000 hours of analogue recording to digital recording with structure. As a pilot project, NOTA already offers the possibility to join NOTA Digital Audio Book Club so that users can become familiar with the new digital possibilities.
93

SMART 2008/0066 Monitoring eAccessibility in Europe
Report on the eAccessibility survey for organisations representing people with disabilities, older people and end-users
GermanyThe accessibility of eBook readers is the main problem for users with disabilities.GreeceThe Pan-Hellenic Association for the Blind provides a series of accessible eBooks to its members.IrelandThere are no solutions specific to the Irish market. Irish customers tend to use the Amazon, Apple and Sony offerings.ItalyeBook readers are not accessible. Only recently you can read an eBook with an Apple device but it is too early yet to evaluate its potentials.PortugalLeya Group, a Portuguese eBook seller, has an app for iPad/iPhone with good text Zoom. The books are already compatible with VoiceOver (with text-to-speech and Braille). Titles in Portuguese are still lacking.SwedenThere are books in Daisy standard available for many users via a public agency TPB, but the digital search system is not accessible for people with dyslexia. Daisy players are not supported financially for people with intellectual disabilities.
The NetherlandsThe biggest problem for visually impaired is the inaccessibility of the hardware and software eReaders.United KingdomThe amount of eBooks is growing but the assistive technologies available to read the books in an affective, comprehendible and comfortable manner are limited.There is now a wide range of eBooks available. There is also a good choice of eBooks which publishers have enabled text to speech on, but there are still books which cannot be read using text to speech as publishers have switched this facility off, especially if there is a human voice audio version available to be bought separately. The number of accessible eBook readers is far more limited, especially for people unable to use (larger) print. The iPad is the best, but it is very expensive. The Amazon Kindle has been improving its accessibility features. Other eBook readers have text to speech on the book content but not on the menus an are thus difficult to operate.AustraliaeBooks are mostly available from blindness specific libraries, as loans or burn-on-demand, and now some public libraries are offering services.NorwayDaisy eBooks are accessible.
94

SMART 2008/0066 Monitoring eAccessibility in Europe
Report on the eAccessibility survey for organisations representing people with disabilities, older people and end-users
Accessibility of eLearning
Figure 39. Status of eLearning by country
TOTEUCZDKFRDEGRHUIEITPTESSENLUK
NON-EUAUCANOUS
0 10 20 30 40 50 60 70 80 90 100
3532
4010
3540
14NA
1730
3534
4110
3848
4610
3083
Source: Own elaboration, 2011. Unit: Percentages
The level of implementation of accessibility in the sub-category “eLearning” was assessed with the following question: Question No. 33: eLearning can be a powerful technology, enabling students to reduce geographical divides, workers to increase their skills and companies to re-qualify their employees. Yet the complexity of certain eLearning platforms and the richness of multimedia in the content may introduce digital barriers if accessibility is not taken into account. According to your experience to which extent are these courses universally designed and accessible to everyone?The possible answers to question No. 33 were:
a) Very little: it is very rare to find an eLearning course with an acceptable level of accessibility
b) Little: some courses are available but the level of accessibility is not very high
c) Fair: some courses are available and they are usually a special adaptation of non-accessible material
d) Good: there is a good range of accessible courses and their quality is acceptable
e) Wide: there is a wide range of universally designed and accessible courses
A detailed table with the results for this question is available in Annex I (page 144).Figure 39 shows a summary of the results for the accessibility of eLearning.The overall picture of the accessibility of eLearning is rather negative. In the non-EU countries there is a very high average scored by the U.S.A. (83) but that is the only outstanding result.In Europe the average score drops to 32 out of 100. The highest votes go to Sweden (41), Germany and Czech Republic (40) but
95

SMART 2008/0066 Monitoring eAccessibility in Europe
Report on the eAccessibility survey for organisations representing people with disabilities, older people and end-users
some countries obtain a very low score: Denmark and the Netherlands (10 each), Greece (14), Ireland (17).The organisations mainly complain about the fact that the offer of accessible courses is quite poor in quantity and that it is often confined in higher levels of education.In some cases, when schools and universities decide to switch over to internet communication solutions to keep in touch with students and parents, the products they choose are often inaccessible, thus introducing new digital barriers.
Comments to the answers:Czech RepublicThe eLearning courses are formally accessible; however their content is often nonsensical (when related to people with disabilities).IrelandThe offer is increasing as eLearning is becoming more and more appealing. Anyway there are not many courses beyond those provided by early adopters.Portugal
eLearning courses are available mainly for higher education.SwedenAn increasing problem is that the communication between teachers, students and parents in some municipalities is only via inaccessible system. Also to apply for and follow higher education there are different systems with very poor accessibility in use and this makes communication much more difficult for disabled students, even if they have the right to accessible material, they will probably not be able to use the same communication channels as the other students.United KingdomIn the UK, video tutorials must include subtitles.Accessible Virtual Learning Environments are now available, as are tools like Moodle for authoring eLearning content which can be made accessible. A lot of work is happening; much of it is very innovative, but often accessibility work is ghettoised into a small community of companies creating materials for students whose needs are very different from those in the mainstream.AustraliaeLearning is becoming more popular, but people with print disabilities are being left out.
96
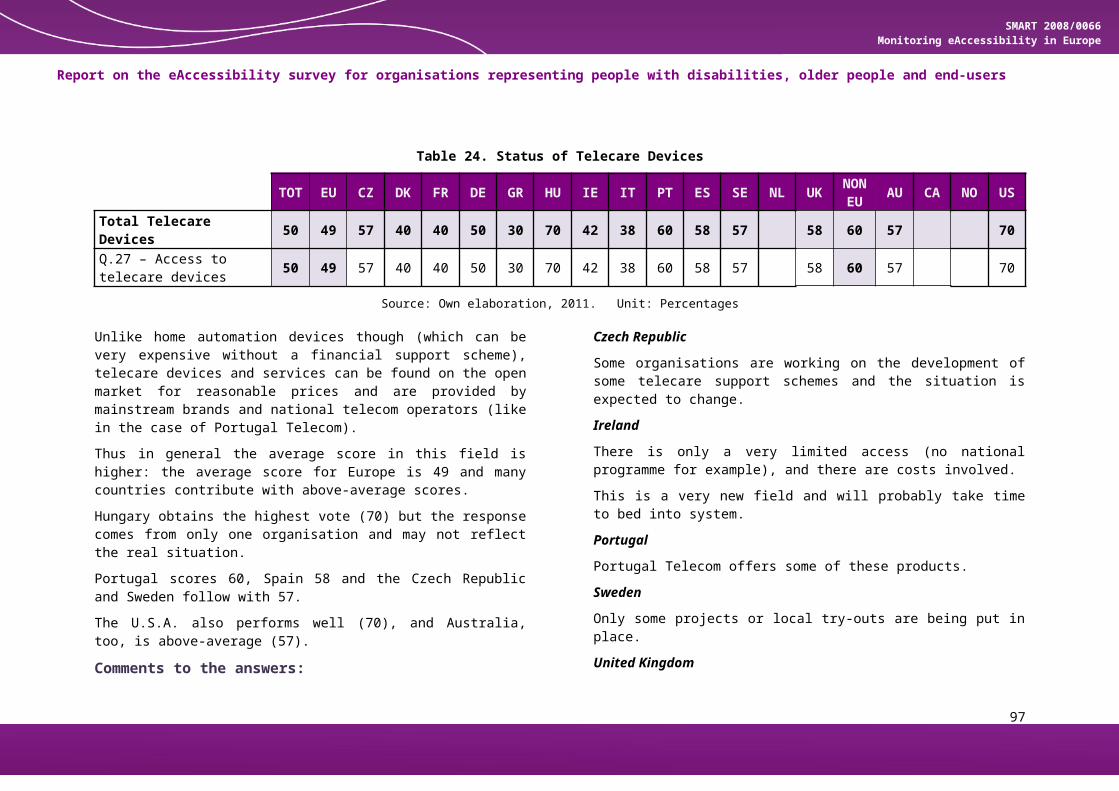
SMART 2008/0066 Monitoring eAccessibility in Europe
Report on the eAccessibility survey for organisations representing people with disabilities, older people and end-users
3.2.10 Assistive TechnologiesThe category assistive technologies mainly investigates the support structures that allow the “access to ATs”.A summary of the outcome is provided here in Table 27 along with the scores for questions No. 34 and No. 35. The most visible result of this category is that the sector of ATs is the one that gets the highest marks, scoring a global average value of 52 (EU: 50; non-EU 59).Almost every country covered by the study score marks which classify as medium-high levels of implementation. The only two countries which score a poor result are Spain (28) and Hungary (30). The only Dutch organisation that responded to the survey placed The Netherlands at the top of the performance chart, scoring a very positive 70 out of 100.Australia and Denmark follow at 65 points, Sweden and the U.S.A. at 63.Even if the availability of ATs is perceived by the organisations in all the countries as very good (EU score: 55; non-EU score:65), the same cannot be said of the financial schemes to support the costs of their acquisition. The average EU score in this case drops to 46, and in some cases, as in the case of Spain (15), the score is very low.This trend is confirmed by the comments to the survey which point out a great number of weaknesses of AT distribution and funding schemes. Almost every country considers the level of assistance provided as too variable. Great differences in the availability of support
centres and financial schemes may occur from a municipality or county to another (Sweden). Financial support may be in place for the accommodation of workplaces (as compulsory by law), but the same level of assistance is not provided for ATs to be used at home, thus making it sometimes hard to access to online recruiting websites and forms (UK). Where lists of approved ATs are used (Italy), these lists tend to be obsolete, lacking an adequate update frequency with the result of not being aligned to the needs of users, to the latest technological innovations and to market costs.
Figure 40. General results in the field of Assistive Technologies
Access to ATs
0 5 10 15 20 25 30 35 40 45 50
32
48
NON EU EU
Source: Own elaboration, 2011. Unit: Percentages
97

SMART 2008/0066 Monitoring eAccessibility in Europe
Report on the eAccessibility survey for organisations representing people with disabilities, older people and end-users
Table 27. Status of the Access to ATs
TOT EU CZ DK FR DE GR HU IE IT PT ES SE NL UK
NON EU
AU CA NO US
Total Access to ATs 52 50 54 65 39 58 44 30 50 48 60 28 63 70 49 59 65 45 50 63Q.34 – Assistance services for the acquisition of ATs
57 55 62 60 43 55 58 54 46 55 40 63 70 58 65 70 50 50 70
Q.35 – Financial support for the acquisition of ATs 47 46 46 70 35 60 30 30 45 50 65 15 63 70 40 54 60 40 50 57
Source: Own elaboration, 2011. Unit: Percentages
98

SMART 2008/0066 Monitoring eAccessibility in Europe
Report on the eAccessibility survey for organisations representing people with disabilities, older people and end-users
Access to Assistive Technologies
Figure 41. Overall results in the field of Assistive Technologies by country
ESHUFRGRCAITUKIE
NOCZDEPTUSSEDKAUNL
0 10 20 30 40 50 60 70 80
2830
394445
48495050
5458
6063636565
70
Source: Own elaboration, 2011. Unit: Percentages
The level of implementation of accessibility in the sub-category “access to assistive technologies” was assessed with the following two questions: The first one was:Question No. 34: If a person in your country needs an Assistive Technology (AT) to operate an ICT device (such as a PC, a mobile phone, etc.), could you estimate how easy the overall process of acquirement would be (including phases such as finding information, receiving assistance in the choice of a suitable AT, buying it and being supported in its correct installation)?The possible answers to question No. 34 were:
a) None: there are no servicesb) Difficult: almost no assistance is available and/or there
are not many support structuresc) Not so easy: there is a limited amount of assistance but
there are not enough support structures d) It could be easier: there is a certain amount of assistance
in most of the phases but more support structures are needed
e) Quite easy: assistance can be easily obtained and there are many support structures
A detailed table with the results for this question is available in Annex I (page 145).The second question was:Question No. 35: If a person in your country needs an Assistive Technology (AT) to operate an ICT device (such as a PC, a mobile phone, etc.), could you estimate how easy the overall process of acquirement would be (including phases such as finding information, receiving assistance in the choice of a
99

SMART 2008/0066 Monitoring eAccessibility in Europe
Report on the eAccessibility survey for organisations representing people with disabilities, older people and end-users
suitable AT, buying it and being supported in its correct installation)?The possible answers to question No. 35 were:
a) Bad: There is no provision of ATsb) Poor: the range of provided ATs is limited and most of
the costs bears upon the userc) Sufficient: the range of products is limited but the costs
are supported by public fundsd) Good: there is a good range of products but the list of
refunded devices and technologies is tends to be obsolete
e) Very good: the range of refunded products is wide and often updated with the latest devices
A detailed table with the results for this question is available in Annex I (page 146).Table 27 shows a summary of the results for the access to assistive technologies and in particular the results for question No. 34 and No. 35 and comments on the results can be found in the main chapter regarding the category of assistive technologies (§3.2.10).
Comments to the answers:Czech RepublicThe prices for ATs are too high.DenmarkThe Danish policy on disability, and thus also on assistive technology, is based on three main principles: solidarity (implies taxation support), compensation (implies support for additional costs experienced by people with disabilities) and sector responsibility (implies that responsibility for grants for assistive technology is placed with the authority where the need arises).
The Social Services Act grants for assistive devices and consumer goods in the home. The various acts set criteria for the allocation of assistive devices and other aid measures. They all have in common the fact that cases are always decided by means of an assessment of the individual in question. Unlike various other countries, there are no lists in Denmark of products approved as aids qualifying for support. GermanyAs long as people are employed, assistance is readily available.ItalyThe problem is that the sector is very fragmented and as the duties are divided between NGOs, private companies, public organisations, etc., there is no central coordination of efforts.The list of approved ATs is not updated with enough frequency and this leads to a misalignment with the real market needs and costs.PortugalThe assistance after the purchase is not very good.SwedenThe access to assistive technologies may vary significantly, leading to big inequalities with regard to sex, age, geography, communication skills, and type of disability. It is usually easier for young people and more difficult for people with cognitive and other invisible disabilities.The range of AT differs between county councils, as do policies concerning who can get them etc.
United Kingdom
100

SMART 2008/0066 Monitoring eAccessibility in Europe
Report on the eAccessibility survey for organisations representing people with disabilities, older people and end-users
There is no UK-wide strategy for people to acquire AT, so much relies on the availability of local provision (which is highly variable), through contact with a commercial supplier or voluntary organisation such as RNIB (Royal National Institute of the Blind). There are also some free or lower cost solutions that do not enjoy a dealer network and therefore rely much more on voluntary organisations and word of mouth. There are some volunteer services to support installation, but they vary in their availability and often cannot provide training. If the sequences are: awareness, information and advice, acquisition, installation, training and ongoing support, then there are weaknesses at each of these stages.Organisations like AbilityNet do a great job in assessing people for ATs when people approach them. Similarly, the BBC’s website on accessibility provides a wealth of information on operating systems, browser accessibility features settings and ATs. However, the great majority of people who could benefit from customisation or the use of an AT are not aware that these facilities are available, or how to go about getting them. Initiates are in plan (Race2012, the UK eAccessibility Forum Action Plan, UK Online Centres) which aim to help this, but there is much more which could be done.The financial support for ATs depends on the category of assistance needed, and whether they are for work or social use etc.Rather a narrow scope of Assistive Technologies are considered by the health or social service providers, and this rarely if ever extends to products such as navigation aids such as talking GPS, communication aids such as a talking mobile phone or computer with screen magnification and a scanner, or a video magnifier.
Financial support is not available in all areas and is reliant on local councils.The UK 'Access to Work' scheme really helps employees get the ATs they need to do the jobs they are employed to do. Unfortunately for those disabled people who are looking for work there is almost no help at all, which prevents many disabled people from getting employment as they don't have the ATs to be able to apply for jobs on job websites.‘Access to Work’ in the UK is providing towards it but many users of ATs are complaining that they are not given the best, which would work for them, but the cheapest solution.AustraliaThere are blindness agencies and Quantum Technology which is the main provider of AT products in Australia.U.S.A.A deaf person who wants a videophone can find the process fairly simple, though a bit slow. Blind people may have to pay for their own screen readers for home use (though for office use, the ADA says the employer should purchase it).Given that Medicaid (the nearest thing to government-funded medical insurance for people with disabilities) usually has a very strong bias toward forcing people into institutions and completely dependent on other people for all their care, social, and general living needs, I doubt there is much coverage for purchase of assistive technologies that people with disabilities can use to actually be independent.
101

SMART 2008/0066 Monitoring eAccessibility in Europe
Report on the eAccessibility survey for organisations representing people with disabilities, older people and end-users
3.2.11 Public Procurement
Figure 42. General results in the field of Public Procurement
Public Procurement Accessibility Tools
Total Public Procurement
0 5 10 15 20 25 30 35 40 45 50
30
30
50
50
NON EU EU
Source: Own elaboration, 2011. Unit: Percentages
The category public procurement concerns the presence of public procurement schemes to support the acquisition of accessible goods and services.Detailed considerations on this sector are made here and in the following chapter while a summary of the outcome is provided here in .
The most significant outcome of this section of the survey is that the organisations of people with disabilities and older people are not always aware of the existence and the performance of laws and toolkits concerning the procurement of accessible ICT. As to prove this, most of the answers to this question were a “don’t know”.This may be due to the fact that in some cases the law only applies to the public sector and in other cases, even if the regulations have a broader scope, the level of enforcement is weak and insufficiently monitored.Overall, the performance of the EU zone is rather mediocre with six countries (Czech Republic, Denmark, France, Germany, Greece and Hungary) scoring 30 points. In Ireland, although a very good ICT Procurement Toolkit is provided by the National Disability Authority, the effects seem to be weak and the score reaches only 34 out of 100.The same applies to Italy (40), while the best performers are the UK, Sweden and Portugal (50 each) and Spain (47).In the non-EU area, only Australia obtains a score that is above average (60) while the U.S.A., Norway and Canada are all at 30 points.
102
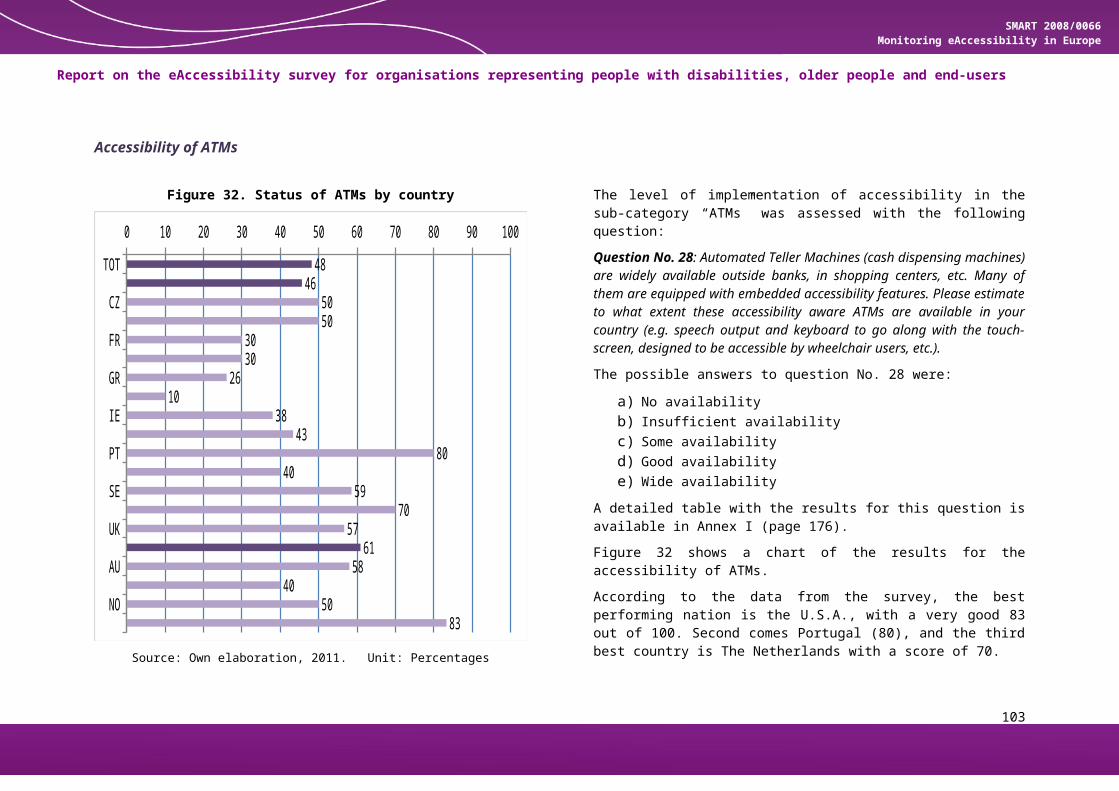
SMART 2008/0066 Monitoring eAccessibility in Europe
Report on the eAccessibility survey for organisations representing people with disabilities, older people and end-users
Table 28. Status of Public Procurement by country
TOT EU CZ DK FR DE GR HU IE IT PT ES SE NL UK
NON EU
AU CA NO US
Q.36 – Policies on Accessible Public Procurement
30 30 30 30 30 30 30 30 34 40 40 47 50 50 50 50 60 30 30 30
Total Public Procurement 30 30 30 30 30 30 30 30 34 40 40 47 50 50 50 50 60 30 30 30
Source: Own elaboration, 2011. Unit: Percentages
103

SMART 2008/0066 Monitoring eAccessibility in Europe
Report on the eAccessibility survey for organisations representing people with disabilities, older people and end-users
Public Procurement Accessibility Tools
Figure 43. Overall results in the field of Public Procurement by country
FRDEGRITPTNLCANOIECZDKUKHUESSEUSAU
0 10 20 30 40 50 60 70
3030303030303030
344040
4750505050
60
Source: Own elaboration, 2011. Unit: Percentages
The level of implementation of accessibility in the sub-category “public procurement accessibility tools” was assessed with the following question: Question No. 36: Are you aware of the existence of any laws and/or regulations in your country that require publicly procured ICT to satisfy accessibility requirements? If the answer is YES, could you estimate their grade of enforcement?The possible answers to question No. 36 were:
a) Bad: almost none of the procured ICT products are accessible
b) Insufficient: some efforts are in place but the enforcement is still insufficient
c) Sufficient: some efforts are in place but the enforcement is just about sufficient
d) Good: the efforts are good but the scope of the laws/regulations is restricted to few ICT products
e) Very good: the efforts are good and many ICT products are covered by the laws/regulations
A detailed table with the results for this question is available in Annex I (page 147).Comments to the answers:DenmarkIn Denmark this matter is provided for by a Public Procurement Directive - 2004/18/ef.GreeceCurrently there is no specific legal framework that refers to eInclusion. However, the Greek Constitution in Article 5A, Section II states the following: “All persons are entitled to
104

SMART 2008/0066 Monitoring eAccessibility in Europe
Report on the eAccessibility survey for organisations representing people with disabilities, older people and end-users
information, as specified by law. Restrictions to this right may be imposed by law only insofar as they are absolutely necessary and justified for reasons of national security, of combating crime or of protecting rights and interests of third parties. All persons are entitled to participate in the Information Society. Facilitation of access to electronically handled information, as well as of the production, exchange and diffusion thereof constitutes an obligation of the State, always in observance of the guarantees of articles 9, 9A and 19”. As a result, there are on-going discussions for appropriate legislation specifically related to eInclusion to be enacted in the near future. It has to be stressed that, since 2007, Greece has signed the UN Convention on the Rights of Persons with Disabilities. The Convention is in the process of ratification by the Greek Parliament, to become part of Greek legislation.
Significant progress has been made in the actual implementation of policy measures, directly affecting nationally funded projects addressing eInclusion. To this direction, the recent adoption by the Greek government of the criterion of accessibility and the principle of non-discrimination as pre-requisites for pre-selection and funding in all implementation stages for projects funded under the National Strategic Reference Framework (NSRF) 2007-2013 can be considered as a major positive step.
IrelandThe National Disability Authority has released an ICT Public Procurement Toolkit which is extremely complete and useful.ItalyA law is in force but it is difficult to estimate the level of enforcement. Some public libraries have interesting projects going on. SwedenThe Procurement Directive was implemented in Sweden so it is possible to make accessibility requirements yet there is no regulation that enforces the its use, and there is no monitoring of how many public offices that are actually using the possibility to make accessibility requirements. The Equality ombudsman lost a case of Discrimination in which a blind person was denied work at the National Social Security Agency because of an inaccessible computer system. The court decided that it was too expensive to make the system accessible. If there had been regulations about compulsory accessibility requirements the case might have been judged in another way.United KingdomThere are many standards; regulation is weak ("reasonable adjustments") and the enforcement extremely rare.AustraliaMore work needs to be done in this field.
105

SMART 2008/0066 Monitoring eAccessibility in Europe
Report on the eAccessibility survey for organisations representing people with disabilities, older people and end-users
4 ConclusionsDespite the lack of a higher number of responses from countries such as Denmark, Hungary, The Netherlands, Canada and Norway, which may have biased the outcome of some figures, the overall picture emerging from the analysis of the data from this survey seems to be generally in line with the knowledge we have from the previous and current studies on eAccessibility.As can be seen Figures Figure 44 to Figure 60 and in Table 29, most of the analysed countries score an even average in most of the technology fields.Nonetheless, in some cases, we can clearly see spikes of excellence in specific technological fields and cases of lagging improvement in others.The Czech Republic has an average of 44 points out of 100 and this score is mostly constant throughout all the categories of technologies. There is a slightly above-average performance in the field of assistive technologies. Denmark obtains high scores especially in assistive technologies, home environment and telephony while there seems to be a poorer performance in the field of computers.France scores its best results in the educational environment but then seems to lose ground in the accessibility of TV contents and equipment and in the availability of digital homes and Telecare devices.Germany performs well in the availability of AT related devices and services and in the area of the educational environment but demonstrates poor progress in the accessibility of the urban environment.
Greece is seemingly the country with the lowest level of accessibility in most categories. The very low average of 26 is surely a sign that more work should be done to adopt eAccessibility strategies. The best performances are in assistive technologies and in the area of TV content, probably thanks to the presence of new digital platforms.Getting in touch with organisations from Hungary was particularly complicated, probably for linguistic reasons. Nonetheless, some good reports come in the sectors of public procurement, educational environment and home environment.Ireland scores a good average of 39 but users would like to enjoy more accessible TV contents.In Italy, the overall average still shows a poor level of advancement and the only three areas in which the performance is higher than average are assistive technologies, telephony and internet.With a good average of 44, Portugal has lower marks only in the field of education and public procurement.Spain is on the threshold between poor and medium level of implementation of eAccessibility. Very low marks were scored in the accessibility of TV content and in the accessibility of personal computers.Sweden has the highest average in Europe (49) but the organisations would probably want to see more improvements in the fields of television, computers and urban environment.Another country in which we found it very hard to persuade the national organisations to take part in the survey (and this time probably not for linguistic barriers) was The Netherlands. Only
106

SMART 2008/0066 Monitoring eAccessibility in Europe
Report on the eAccessibility survey for organisations representing people with disabilities, older people and end-users
after many contacts were we able to get a response from a Dutch organisation and this has probably biased the outcome. The average score for the country is only 30 and in some cases, television, computers and educational environment, the score is below 20.Another very good performance was scored by the United Kingdom. Thanks to the well-known excellence of the national broadcaster, the BBC, in the field of accessibility, the British organisations granted to the sector of television the highest score worldwide (55).
Australia performs very well (48) but with some below-average scores in the fields of television, computers and urban environment. Canada, despite the higher expectations, obtains a very low average (31) but, as in the case of Norway (35), the low response rate could play a significant role in the outcome.The United States of America scores the highest average (62) and very high marks are given, especially to the categories of education and home environment.
Table 29. General results of the survey by country and by technology
Tota
l
Tota
l EU
coun
tries
Czec
h Re
publ
icDe
nmar
k
Fran
ce
Germ
any
Gree
ce
Hung
ary
Irela
nd
Italy
Portu
gal
Spai
n
Swed
en
The
Neth
erla
nds
Unite
d Ki
ngdo
mTo
tal N
on-E
U co
untri
esAu
stra
lia
Cana
da
Norw
ay
U.S.
A.
Telephony 43 41 43 52 37 34 21 24 44 39 41 33 54 43 48 56 50 44 58 64Internet 41 38 42 30 35 39 18 25 39 34 54 45 48 27 37 50 51 28 27 64Computers 33 32 43 10 40 25 26 30 50 18 50 15 37 10 35 34 33 20 43Television 36 35 47 42 21 24 31 18 26 29 50 18 40 18 55 38 34 38 25 50Home Environment 37 35 39 60 24 32 17 43 34 24 40 29 54 36 48 50 30 30 70Urban Environment 35 33 41 38 30 24 21 10 34 29 45 30 42 30 37 43 35 33 20 66Educational Environment 44 40 45 40 48 48 24 50 37 30 28 47 53 10 50 56 58 15 40 83Assistive Technologies 52 50 54 65 39 58 44 30 50 48 60 28 63 70 49 59 65 45 50 63Public Procurement 41 39 40 40 30 30 30 50 34 30 30 50 50 30 47 50 60 30 30 50Total 40 38 44 42 34 35 26 31 39 31 44 33 49 30 44 48 48 31 35 62
Source: Own elaboration, 2011. Unit: Percentages
107
SMART 2008/0066 Monitoring eAccessibility in Europe
Report on the eAccessibility survey for organisations representing people with disabilities, older people and end-users
Figure 44. Czech Republic – Perception of the level of accessibility by technology
Telephony
Internet
Computers
Television
Home EnvironmentUrban Environment
Educational Environment
Assistive Technologies
Public Procurement
0
50
100
Source: Own elaboration, 2011. Unit: Percentages
Figure 45. Denmark – Perception of the level of accessibility by technology
Telephony
Internet
Computers
Television
Home EnvironmentUrban Environment
Educational Environment
Assistive Technologies
Public Procurement
0
50
100
Source: Own elaboration, 2011. Unit: Percentages
108

SMART 2008/0066 Monitoring eAccessibility in Europe
Report on the eAccessibility survey for organisations representing people with disabilities, older people and end-users
Figure 46. France – Perception of the level of accessibility by technology
Telephony
Internet
Computers
Television
Home EnvironmentUrban Environment
Educational Environment
Assistive Technologies
Public Procurement
0
50
100
Source: Own elaboration, 2011. Unit: Percentages
Figure 47. Germany – Perception of the level of accessibility by technology
Telephony
Internet
Computers
Television
Home EnvironmentUrban Environment
Educational Environment
Assistive Technologies
Public Procurement
0
50
100
Source: Own elaboration, 2011. Unit: Percentages
109
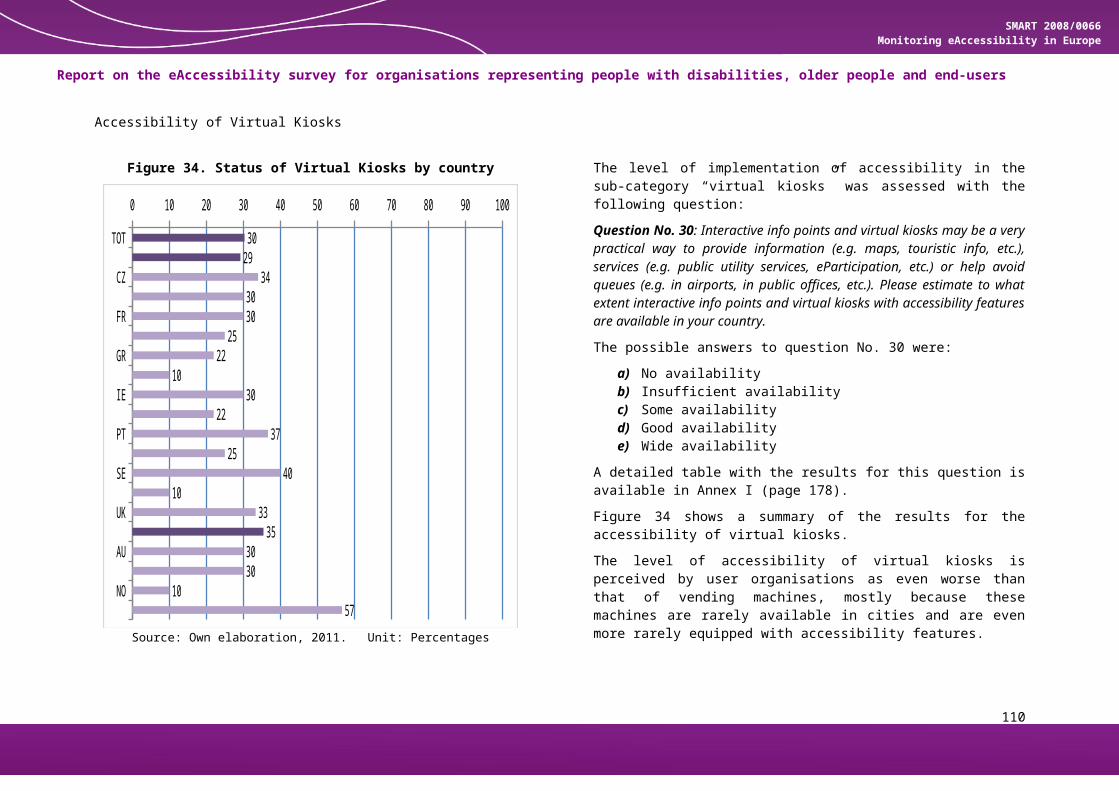
SMART 2008/0066 Monitoring eAccessibility in Europe
Report on the eAccessibility survey for organisations representing people with disabilities, older people and end-users
Figure 48. Greece – Perception of the level of accessibility by technology
Telephony
Internet
Computers
Television
Home EnvironmentUrban Environment
Educational Environment
Assistive Technologies
Public Procurement
0
50
100
Source: Own elaboration, 2011. Unit: Percentages
Figure 49. Hungary – Perception of the level of accessibility by technology
Telephony
Internet
Computers
Television
Home EnvironmentUrban Environment
Educational Environment
Assistive Technologies
Public Procurement
0
50
100
Source: Own elaboration, 2011. Unit: Percentages
110

SMART 2008/0066 Monitoring eAccessibility in Europe
Report on the eAccessibility survey for organisations representing people with disabilities, older people and end-users
Figure 50. Ireland – Perception of the level of accessibility by technology
Telephony
Internet
Computers
Television
Home EnvironmentUrban Environment
Educational Environment
Assistive Technologies
Public Procurement
0
50
100
Source: Own elaboration, 2011. Unit: Percentages
Figure 51. Italy – Perception of the level of accessibility by technology
Telephony
Internet
Computers
Television
Home EnvironmentUrban Environment
Educational Environment
Assistive Technologies
Public Procurement
0
50
100
Source: Own elaboration, 2011. Unit: Percentages
111

SMART 2008/0066 Monitoring eAccessibility in Europe
Report on the eAccessibility survey for organisations representing people with disabilities, older people and end-users
Figure 52. Portugal – Perception of the level of accessibility by technology
Telephony
Internet
Computers
Television
Home EnvironmentUrban Environment
Educational Environment
Assistive Technologies
Public Procurement
0
50
100
Source: Own elaboration, 2011. Unit: Percentages
Figure 53. Spain – Perception of the level of accessibility by technology
Telephony
Internet
Computers
Television
Home EnvironmentUrban Environment
Educational Environment
Assistive Technologies
Public Procurement
0
50
100
Source: Own elaboration, 2011. Unit: Percentages
112
SMART 2008/0066 Monitoring eAccessibility in Europe
Report on the eAccessibility survey for organisations representing people with disabilities, older people and end-users
Figure 54. Sweden – Perception of the level of accessibility by technology
Telephony
Internet
Computers
Television
Home EnvironmentUrban Environment
Educational Environment
Assistive Technologies
Public Procurement
0
50
100
Source: Own elaboration, 2011. Unit: Percentages
Figure 55. The Netherlands – Perception of the level of accessibility by technology
Telephony
Internet
Computers
Television
Home EnvironmentUrban Environment
Educational Environment
Assistive Technologies
Public Procurement
0
50
100
Source: Own elaboration, 2011. Unit: Percentages
113

SMART 2008/0066 Monitoring eAccessibility in Europe
Report on the eAccessibility survey for organisations representing people with disabilities, older people and end-users
Figure 56. United Kingdom – Perception of the level of accessibility by technology
Telephony
Internet
Computers
Television
Home EnvironmentUrban Environment
Educational Environment
Assistive Technologies
Public Procurement
0
50
100
Source: Own elaboration, 2011. Unit: Percentages
Figure 57. Australia – Perception of the level of accessibility by technology
Telephony
Internet
Computers
Television
Home EnvironmentUrban Environment
Educational Environment
Assistive Technologies
Public Procurement
0
50
100
Source: Own elaboration, 2011. Unit: Percentages
114

SMART 2008/0066 Monitoring eAccessibility in Europe
Report on the eAccessibility survey for organisations representing people with disabilities, older people and end-users
Figure 58. Canada – Perception of the level of accessibility by technology
Telephony
Internet
Computers
Television
Home EnvironmentUrban Environment
Educational Environment
Assistive Technologies
Public Procurement
0
50
100
Source: Own elaboration, 2011. Unit: Percentages
Figure 59. Norway – Perception of the level of accessibility by technology
Telephony
Internet
Computers
Television
Home EnvironmentUrban Environment
Educational Environment
Assistive Technologies
Public Procurement
0
50
100
Source: Own elaboration, 2011. Unit: Percentages
115

SMART 2008/0066 Monitoring eAccessibility in Europe
Report on the eAccessibility survey for organisations representing people with disabilities, older people and end-users
Figure 60. United States of America – Perception of the level of accessibility by technology
Telephony
Internet
Computers
Television
Home EnvironmentUrban Environment
Educational Environment
Assistive Technologies
Public Procurement
0
50
100
Source: Own elaboration, 2011. Unit: Percentages
5 Annex I: Detailed results for each question
Question No.6
Fixed telephony was once primarily intended for placing voice calls. Nowadays many landline telephone operators are enriching their offer with services such as text/multimedia messages, video calls and access to online content. Could you please estimate the availability of advanced landline phone sets with accessibility features such as voice recognition,
116
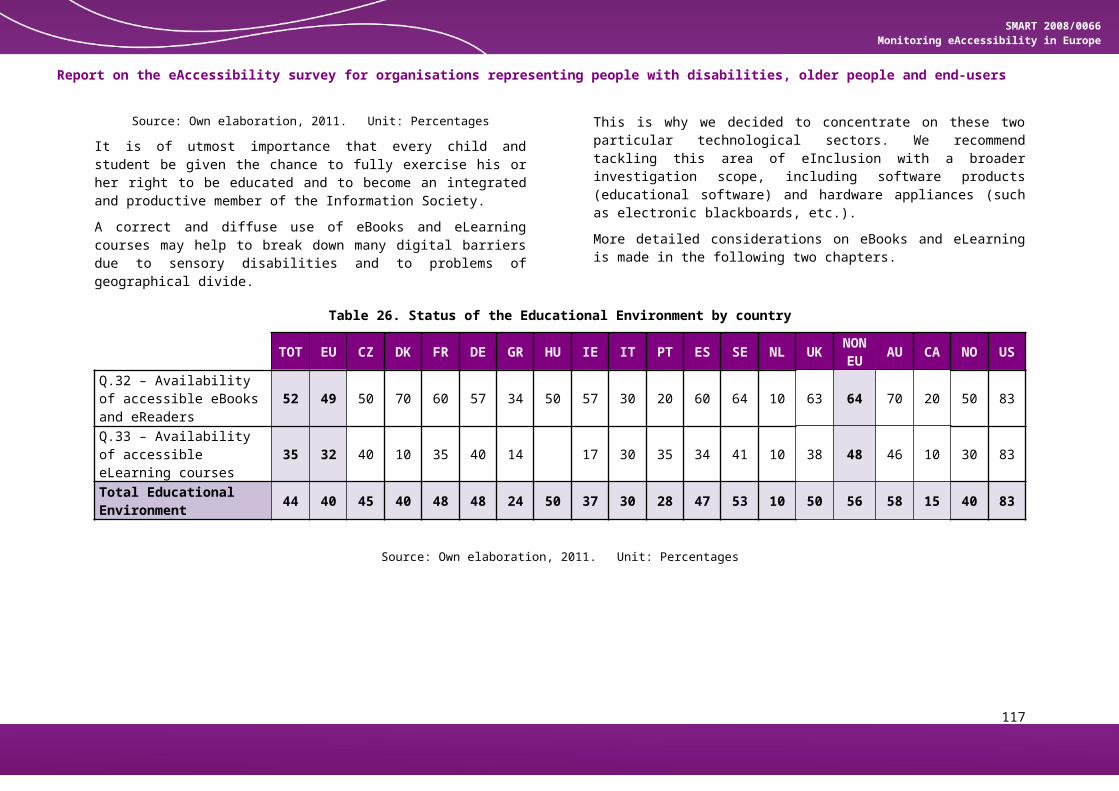
SMART 2008/0066 Monitoring eAccessibility in Europe
Report on the eAccessibility survey for organisations representing people with disabilities, older people and end-users
text-to-speech, screen readers, big screens and keys, etc., in your country?
Table 30. Detailed results for Question No.6
Tota
l
EU c
ount
ries
Czec
h Re
publ
ic
Denm
ark
Fran
ce
Germ
any
Gree
ce
Hung
ary
Irela
nd
Italy
Portu
gal
Spai
n
Swed
en
The
Neth
erla
nds
Unite
d Ki
ngdo
m
Non
-EU
co
untr
ies
Aust
ralia
Cana
da
Norw
ay
U.S.
A.
No. of Organisations answering 76 62 5 2 4 4 5 1 6 6 4 6 9 1 9 14 7 2 1 4No availability 2 2 0 0 0 0 0 0 0 1 0 0 0 1 0 0 0 0 0 0Insufficient availability 21 18 1 0 1 1 5 1 0 4 0 2 1 0 2 3 1 1 0 1Some availability 24 22 3 2 1 2 0 0 3 0 4 1 3 0 3 2 2 0 0 0Good availability 9 8 1 0 1 0 0 0 1 1 0 1 3 0 0 1 1 0 0 0Wide availability 8 4 0 0 1 0 0 0 1 0 0 0 1 0 1 4 1 1 0 2Don’t know 9 5 0 0 0 1 0 0 1 0 0 1 0 0 2 4 2 0 1 1This question does not concern us 3 3 0 0 0 0 0 0 0 0 0 1 1 0 1 0 0 0 0 0Total Score (%) 50 48 50 50 60 43 30 30 62 33 50 45 60 10 50 62 58 60 70
Source: Own elaboration, 2011. Unit: Percentages
117

SMART 2008/0066 Monitoring eAccessibility in Europe
Report on the eAccessibility survey for organisations representing people with disabilities, older people and end-users
Question No.7
Some of these landline phone sets may cost more than the ones sold to the general public. To what extent are the possible extra costs of such devices covered by national schemes of financial support or free of charge provision?
Table 31. Detailed results for Question No.7
Tota
l
EU c
ount
ries
Czec
h Re
publ
ic
Denm
ark
Fran
ce
Germ
any
Gree
ce
Hung
ary
Irela
nd
Italy
Portu
gal
Spai
n
Swed
en
The
Neth
erla
nds
Unite
d Ki
ngdo
m
Non
-EU
co
untr
ies
Aust
ralia
Cana
da
Norw
ay
U.S.
A.
No. of Organisations answering 76 62 5 2 4 4 5 1 6 6 4 6 9 1 9 14 7 2 1 4There is no financial support and the cost difference is high 20 18 2 0 2 1 2 1 0 2 2 3 1 1 1 2 1 0 0 1
There is no financial support but the extra costs are small 7 7 0 0 1 0 2 0 0 1 0 0 2 0 1 0 0 0 0 0
There is a limited/fixed amount of financial support but the extra costs are small 18 14 2 1 1 0 0 0 2 1 0 0 3 0 4 4 3 1 0 0
The extra costs are entirely covered by financial support 2 1 0 0 0 0 0 0 1 0 0 0 0 0 0 1 0 0 1 0
The cost of the device is entirely free of charge 3 3 0 1 0 0 0 0 1 0 1 0 0 0 0 0 0 0 0 0
Don’t know 24 17 1 0 0 3 1 0 2 2 1 3 2 0 2 7 3 1 0 3This question does not concern us 2 2 0 0 0 0 0 0 0 0 0 0 1 0 1 0 0 0 0 0Total Score (%) 34 33 30 70 25 10 20 10 65 25 37 10 37 10 40 41 40 50 70 10
Source: Own elaboration, 2011. Unit: Percentages
118

SMART 2008/0066 Monitoring eAccessibility in Europe
Report on the eAccessibility survey for organisations representing people with disabilities, older people and end-users
Question No.8
Could you please estimate the availability of mobile phones with accessibility features such as voice recognition, text-to-speech, screen readers, big screens and keys, etc., in your country?
Table 32. Detailed results for Question No.8
Tota
l
EU c
ount
ries
Czec
h Re
publ
ic
Denm
ark
Fran
ce
Germ
any
Gree
ce
Hung
ary
Irela
nd
Italy
Portu
gal
Spai
n
Swed
en
The
Neth
erla
nds
Unite
d Ki
ngdo
m
Non
-EU
co
untr
ies
Aust
ralia
Cana
da
Norw
ay
U.S.
A.
No. of Organisations answering 76 62 5 2 4 4 5 1 6 6 4 6 9 1 9 14 7 2 1 4No availability 0 0 0 0 0 0 0 0 0 0 0 0 0 0 0 0 0 0 0 0Insufficient availability 11 11 1 0 2 0 1 1 0 3 0 1 1 0 1 0 0 0 0 0Some availability 24 18 1 1 0 0 2 0 2 1 0 3 3 0 5 6 2 1 1 2Good availability 18 15 2 0 0 0 2 0 1 2 1 2 3 1 1 3 2 1 0 0Wide availability 15 12 1 0 2 1 0 0 2 0 3 0 1 0 2 3 1 0 0 2Don’t know 5 5 0 1 0 3 0 0 1 0 0 0 0 0 0 0 0 0 0 0This question does not concern us 3 1 0 0 0 0 0 0 0 0 0 0 1 0 0 2 2 0 0 0Total Score (%) 61 60 62 50 60 90 54 30 70 47 85 53 60 70 59 65 66 60 50 70
Source: Own elaboration, 2011. Unit: Percentages
119

SMART 2008/0066 Monitoring eAccessibility in Europe
Report on the eAccessibility survey for organisations representing people with disabilities, older people and end-users
Question No.9:
Some of these accessible mobile phones or phone applications may cost more than the ones sold to the general public. To what extent are the possible extra costs of such devices covered by national schemes of financial support or free of charge provision?
Table 33. Detailed results for Question No.9
Tota
l
EU c
ount
ries
Czec
h Re
publ
ic
Denm
ark
Fran
ce
Germ
any
Gree
ce
Hung
ary
Irela
nd
Italy
Portu
gal
Spai
n
Swed
en
The
Neth
erla
nds
Unite
d Ki
ngdo
mN
on-E
U
coun
trie
sAu
stra
lia
Cana
da
Norw
ay
U.S.
A.
No. of Organisations answering 76 62 5 2 4 4 5 1 6 6 4 6 9 1 9 14 7 2 1 4There is no financial support and the cost difference is high 26 22 2 0 3 1 0 1 4 2 0 3 1 1 4 4 2 0 0 2There is no financial support but the extra costs are small 15 14 0 0 1 0 4 0 0 0 1 2 3 0 3 1 0 1 0 0There is a limited/fixed amount of financial support but the extra costs are small 9 7 2 1 0 0 0 0 1 1 0 0 1 0 1 2 1 0 0 1
The extra costs are entirely covered by financial support 6 5 1 0 0 0 0 0 0 2 2 0 0 0 0 1 0 0 1 0The cost of the device is entirely free of charge 1 1 0 0 0 0 0 0 0 0 0 0 1 0 0 0 0 0 0 0Don’t know 16 12 0 1 0 3 1 0 1 1 1 1 2 0 1 4 2 1 0 1This question does not concern us 3 1 0 0 0 0 0 0 0 0 0 0 1 0 0 2 2 0 0 0Total Score (%) 29 29 38 50 15 10 30 10 18 42 57 18 40 10 23 30 23 30 70 23
Source: Own elaboration, 2011. Unit: Percentages
120

SMART 2008/0066 Monitoring eAccessibility in Europe
Report on the eAccessibility survey for organisations representing people with disabilities, older people and end-users
Question No.10
Many public, private and commercial websites are now available in mobile versions (WAP, .mobi, etc.). When browsing these websites using a mobile phone, how would you rate their level of accessibility?
Table 34. Detailed results for Question No.10
Tota
l
EU c
ount
ries
Czec
h Re
publ
ic
Denm
ark
Fran
ce
Germ
any
Gree
ce
Hung
ary
Irela
nd
Italy
Portu
gal
Spai
n
Swed
en
The
Neth
erla
nds
Unite
d Ki
ngdo
m
Non
-EU
co
untr
ies
Aust
ralia
Cana
da
Norw
ay
U.S.
A.
No. of Organisations answering 76 62 5 2 4 4 5 1 6 6 4 6 9 1 9 14 7 2 1 4None or poor 11 11 1 1 1 0 4 1 1 0 0 1 0 0 1 0 0 0 0 0Insufficient 26 21 0 1 1 3 0 0 1 4 2 4 2 0 3 5 2 2 1 0Fair 15 11 2 0 1 1 0 0 2 1 0 1 0 0 3 4 2 0 0 2Good 10 9 1 0 1 0 0 0 1 1 2 0 2 0 1 1 1 0 0 0Very good 3 2 0 0 0 0 0 0 0 0 0 0 1 1 0 1 0 0 0 1Don’t know 10 7 1 0 0 0 1 0 1 0 0 0 3 0 1 3 2 0 0 1This question does not concern us 1 1 0 0 0 0 0 0 0 0 0 0 1 0 0 0 0 0 0 0Total Score (%) 40 39 45 20 40 35 10 10 42 40 50 30 58 90 40 46 46 30 30 63
Source: Own elaboration, 2011. Unit: Percentages
Question No.11
Are you aware of the existence of any national or local text relay services in your country?
121

SMART 2008/0066 Monitoring eAccessibility in Europe
Report on the eAccessibility survey for organisations representing people with disabilities, older people and end-users
Table 35. Detailed results for Question No.11
Tota
l
EU c
ount
ries
Czec
h Re
publ
ic
Denm
ark
Fran
ce
Germ
any
Gree
ce
Hung
ary
Irela
nd
Italy
Portu
gal
Spai
n
Swed
en
The
Neth
erla
nds
Unite
d Ki
ngdo
m
Non
-EU
co
untr
ies
Aust
ralia
Cana
da
Norw
ay
U.S.
A.
No. of Organisations answering 76 62 5 2 4 4 5 1 6 6 4 6 9 1 9 14 7 2 1 4There are no such services 6 6 0 0 0 0 3 0 0 0 3 0 0 0 0 0 0 0 0 0There are very limited and spotty services 8 8 2 0 2 1 0 1 1 0 0 1 0 0 0 0 0 0 0 0The service is available but it does not meet the number of requests 9 8 0 1 0 0 1 0 3 0 0 1 2 0 0 1 1 0 0 0
The service is available and with a sufficient number of operators 13 10 1 0 0 0 0 0 1 1 0 2 2 0 3 3 2 1 0 0
The service is available and with a good number of operators. 8 4 0 1 0 0 0 0 0 0 0 0 2 0 1 4 2 0 0 2
Don’t know 21 17 2 0 1 3 1 0 1 1 1 2 2 0 3 4 1 1 0 2This question does not concern us 11 9 0 0 1 0 0 0 0 4 0 0 1 1 2 2 1 0 1 0Total Score (%) 54 49 43 70 30 30 20 30 50 70 10 55 70 75 78 74 70 90
Source: Own elaboration, 2011. Unit: Percentages
Question No.12
Are you aware of the existence of any national or local video relay services in your country?
122

SMART 2008/0066 Monitoring eAccessibility in Europe
Report on the eAccessibility survey for organisations representing people with disabilities, older people and end-users
Table 36. Detailed results for Question No.12
Tota
l
EU c
ount
ries
Czec
h Re
publ
ic
Denm
ark
Fran
ce
Germ
any
Gree
ce
Hung
ary
Irela
nd
Italy
Portu
gal
Spai
n
Swed
en
The
Neth
erla
nds
Unite
d Ki
ngdo
m
Non
-EU
co
untr
ies
Aust
ralia
Cana
da
Norw
ay
U.S.
A.
No. of Organisations answering 76 62 5 2 4 4 5 1 6 6 4 6 9 1 9 14 7 2 1 4There are no such services 10 10 0 0 0 0 4 1 2 0 2 1 0 0 0 0 0 0 0 0There are very limited and spotty services 16 15 2 2 2 0 0 0 2 1 1 1 0 0 4 1 1 0 0 0The service is available but it does not meet the number of requests 7 6 1 0 1 0 0 0 0 0 0 1 3 0 0 1 0 1 0 0
The service is available and with a sufficient number of operators 5 5 1 0 1 0 0 0 1 0 0 0 1 0 1 0 0 0 0 0
The service is available and with a good number of operators. 3 1 0 0 0 0 0 0 0 0 0 0 1 0 0 2 0 0 0 2
Don’t know 26 18 1 0 0 4 1 0 1 1 1 3 3 1 2 8 5 1 0 2This question does not concern us 9 7 0 0 0 0 0 0 0 4 0 0 1 0 2 2 1 0 1 0Total Score (%) 38 35 45 30 45 10 10 30 30 17 30 62 38 65 30 50 90
Source: Own elaboration, 2011. Unit: Percentages
Question No.13
Emergency services can generally be accessed dialling 1-1-2 (most of Europe), 9-1-1 (USA) or other national numbers from fixed or mobile telephones. People with speech and/or hearing impairments may need alternative channels like text telephones, real-time text telephone (also known as ToIP, Text over IP), videophones, etc. in order to be granted
123

SMART 2008/0066 Monitoring eAccessibility in Europe
Report on the eAccessibility survey for organisations representing people with disabilities, older people and end-users
equally reliable emergency services. Could you please estimate the availability of such alternative emergency services in your country?
Table 37. Detailed results for Question No.13
Tota
l
EU c
ount
ries
Czec
h Re
publ
ic
Denm
ark
Fran
ce
Germ
any
Gree
ce
Hung
ary
Irela
nd
Italy
Portu
gal
Spai
n
Swed
en
The
Neth
erla
nds
Unite
d Ki
ngdo
m
Non
-EU
co
untr
ies
Aust
ralia
Cana
da
Norw
ay
U.S.
A.
No. of Organisations answering 76 62 5 2 4 4 5 1 6 6 4 6 9 1 9 14 7 2 1 4No availability 16 16 1 0 2 1 4 0 3 0 2 2 1 0 0 0 0 0 0 0Insufficient availability 10 9 2 0 1 1 1 0 0 1 1 1 0 1 0 1 0 1 0 0Some availability 14 12 1 0 1 1 0 1 0 0 1 0 4 0 3 2 2 0 0 0Good availability 11 7 1 1 0 0 0 0 0 0 0 1 2 0 2 4 2 0 1 1Wide availability 3 2 0 1 0 0 0 0 1 0 0 0 0 0 0 1 0 0 0 1Don’t know 13 9 0 0 0 1 0 0 2 1 0 2 1 0 2 4 2 1 0 1This question does not concern us 9 7 0 0 0 0 0 0 0 4 0 0 1 0 2 2 1 0 0 1Total Score (%) 41 37 38 80 25 30 14 50 30 30 25 30 50 30 58 63 60 30 70 80
Source: Own elaboration, 2011. Unit: Percentages
Question No.14
In many countries there are policies, laws or regulations addressing the accessibility of public websites, sometimes with explicit deadlines regarding the enforcement of such measures. Nonetheless progress in this field is very slow. In your experience, approximately how many public websites in your country are at least fairly accessible and/or have an accessibility statement?
124

SMART 2008/0066 Monitoring eAccessibility in Europe
Report on the eAccessibility survey for organisations representing people with disabilities, older people and end-users
Table 38. Detailed results for Question No.14
Tota
l
EU c
ount
ries
Czec
h Re
publ
ic
Denm
ark
Fran
ce
Germ
any
Gree
ce
Hung
ary
Irela
nd
Italy
Portu
gal
Spai
n
Swed
en
The
Neth
erla
nds
Unite
d Ki
ngdo
m
Non
-EU
co
untr
ies
Aust
ralia
Cana
da
Norw
ay
U.S.
A.
No. of Organisations answering 76 62 5 2 4 4 5 1 6 6 4 6 9 1 9 14 7 2 1 4None or almost none are accessible 1 1 0 0 0 0 1 0 0 0 0 0 0 0 0 0 0 0 0 0Some websites are accessible 38 30 4 0 3 1 3 1 4 4 0 2 3 1 4 8 3 2 1 2About 1 out of 2 are accessible 8 6 1 1 0 1 0 0 0 0 0 1 0 0 2 2 1 0 0 1Most websites are accessible 20 17 0 0 1 2 1 0 2 1 3 2 3 0 2 3 3 0 0 0Almost every website is accessible 2 1 0 0 0 0 0 0 0 0 1 0 0 0 0 1 0 0 0 1Don’t know 6 6 0 0 0 0 0 0 0 1 0 1 3 0 1 0 0 0 0 0This question does not concern us 1 1 0 1 0 0 0 0 0 0 0 0 0 0 0 0 0 0 0 0Total Score (%) 45 45 34 50 40 55 34 30 43 38 75 50 50 30 45 46 50 30 30 50
Source: Own elaboration, 2011. Unit: Percentages
Question No.15
How would you rate the average level of quality of public websites in terms of accessibility and ease of use? If you are familiar with WCAG 1.0 or WCAG 2.0 accessibility guidelines, you can use levels A, Double-A, Triple-A as a reference.
125

SMART 2008/0066 Monitoring eAccessibility in Europe
Report on the eAccessibility survey for organisations representing people with disabilities, older people and end-users
Table 39. Detailed results for Question No.15
Tota
l
EU c
ount
ries
Czec
h Re
publ
ic
Denm
ark
Fran
ce
Germ
any
Gree
ce
Hung
ary
Irela
nd
Italy
Portu
gal
Spai
n
Swed
en
The
Neth
erla
nds
Unite
d Ki
ngdo
m
Non
-EU
co
untr
ies
Aust
ralia
Cana
da
Norw
ay
U.S.
A.
No. of Organisations answering 76 62 5 2 4 4 5 1 6 6 4 6 9 1 9 14 7 2 1 4Insufficient (less than level A) 25 20 0 1 2 1 4 0 3 3 0 1 1 1 3 5 2 2 1 0Sufficient (level A) 10 10 2 0 0 2 1 1 0 2 0 0 1 0 1 0 0 0 0 0Fair (between A and Double-A) 16 13 2 0 1 1 0 0 1 0 3 1 1 0 3 3 2 0 0 1Good (level Double-A) 8 3 0 0 0 0 0 0 1 0 0 2 0 0 0 5 3 0 0 2Very good (between Double-A and Triple-A) 1 1 0 0 0 0 0 0 0 0 0 0 1 0 0 0 0 0 0 0
Don’t know 14 13 1 0 1 0 0 0 1 0 1 2 5 0 2 1 0 0 0 1This question does not concern us 2 2 0 1 0 0 0 0 0 1 0 0 0 0 0 0 0 0 0 0Total Score (%) 33 31 40 10 23 30 14 30 30 18 50 50 45 10 30 42 47 10 10 63
Source: Own elaboration, 2011. Unit: Percentages
Question No.16
When using public online eGovernment services to request certificates, pay taxes, etc., how often do you encounter barriers which are so difficult to overcome that you are forced to switch to another channel to complete them (e.g. by telephone operator or going to a physical public office)?
126

SMART 2008/0066 Monitoring eAccessibility in Europe
Report on the eAccessibility survey for organisations representing people with disabilities, older people and end-users
Table 40. Detailed results for Question No.16
Tota
l
EU c
ount
ries
Czec
h Re
publ
ic
Denm
ark
Fran
ce
Germ
any
Gree
ce
Hung
ary
Irela
nd
Italy
Portu
gal
Spai
n
Swed
en
The
Neth
erla
nds
Unite
d Ki
ngdo
m
Non
-EU
co
untr
ies
Aust
ralia
Cana
da
Norw
ay
U.S.
A.
No. of Organisations answering 76 62 5 2 4 4 5 1 6 6 4 6 9 1 9 14 7 2 1 4Always 5 5 1 0 1 0 2 0 0 1 0 0 0 0 0 0 0 0 0 0Often 25 21 1 1 2 1 3 1 3 3 0 0 2 1 3 4 2 1 1 0Sometimes 27 25 3 0 1 1 0 0 1 2 2 5 4 0 6 2 0 1 0 1Rarely 11 7 0 0 0 1 0 0 2 0 2 1 1 0 0 4 2 0 0 2Never 2 1 0 0 0 0 0 0 0 0 0 0 1 0 0 1 0 0 0 1Don’t know 4 2 0 0 0 1 0 0 0 0 0 0 1 0 0 2 2 0 0 0This question does not concern us 2 1 0 1 0 0 0 0 0 0 0 0 0 0 0 1 1 0 0 0Total Score (%) 44 43 38 30 30 50 22 30 47 33 60 53 53 30 43 54 50 40 30 70
Source: Own elaboration, 2011. Unit: Percentages
Question No.17
Although many policies, laws and regulations are in place for public websites, the accessibility of private websites is not equally addressed. Focusing especially on commercial websites (such as transport companies, online stores, online banking, etc.), approximately how many private websites are at least fairly accessible and/or have an accessibility statement?
127

SMART 2008/0066 Monitoring eAccessibility in Europe
Report on the eAccessibility survey for organisations representing people with disabilities, older people and end-users
Table 41. Detailed results for Question No.17
Tota
l
EU c
ount
ries
Czec
h Re
publ
ic
Denm
ark
Fran
ce
Germ
any
Gree
ce
Hung
ary
Irela
nd
Italy
Portu
gal
Spai
n
Swed
en
The
Neth
erla
nds
Unite
d Ki
ngdo
m
Non
-EU
co
untr
ies
Aust
ralia
Cana
da
Norw
ay
U.S.
A.
No. of Organisations answering 76 62 5 2 4 4 5 1 6 6 4 6 9 1 9 14 7 2 1 4None or almost none are accessible 9 9 0 0 1 0 4 1 2 0 0 1 0 0 0 0 0 0 0 0Some websites are accessible 42 33 3 0 1 3 1 0 4 4 3 4 3 1 6 9 4 2 1 2About 1 out of 2 are accessible 4 4 0 0 0 1 0 0 0 0 0 0 1 0 2 0 0 0 0 0Most websites are accessible 13 9 2 0 2 0 0 0 0 1 1 1 2 0 0 4 3 0 0 1Almost every website is accessible 2 1 0 0 0 0 0 0 0 0 0 0 1 0 0 1 0 0 0 1Don’t know 5 5 0 1 0 0 0 0 0 1 0 0 2 0 1 0 0 0 0 0This question does not concern us 1 1 0 1 0 0 0 0 0 0 0 0 0 0 0 0 0 0 0 0Total Score (%) 38 36 46 45 35 14 10 23 38 40 33 53 30 35 46 47 30 30 55
Source: Own elaboration, 2011. Unit: Percentages
Question No.18
During your online commercial operations and transactions, how often do you encounter barriers which are so difficult to overcome that you are forced to switch to another channel to complete them (e.g. by telephone operator or going to a physical store)?
128
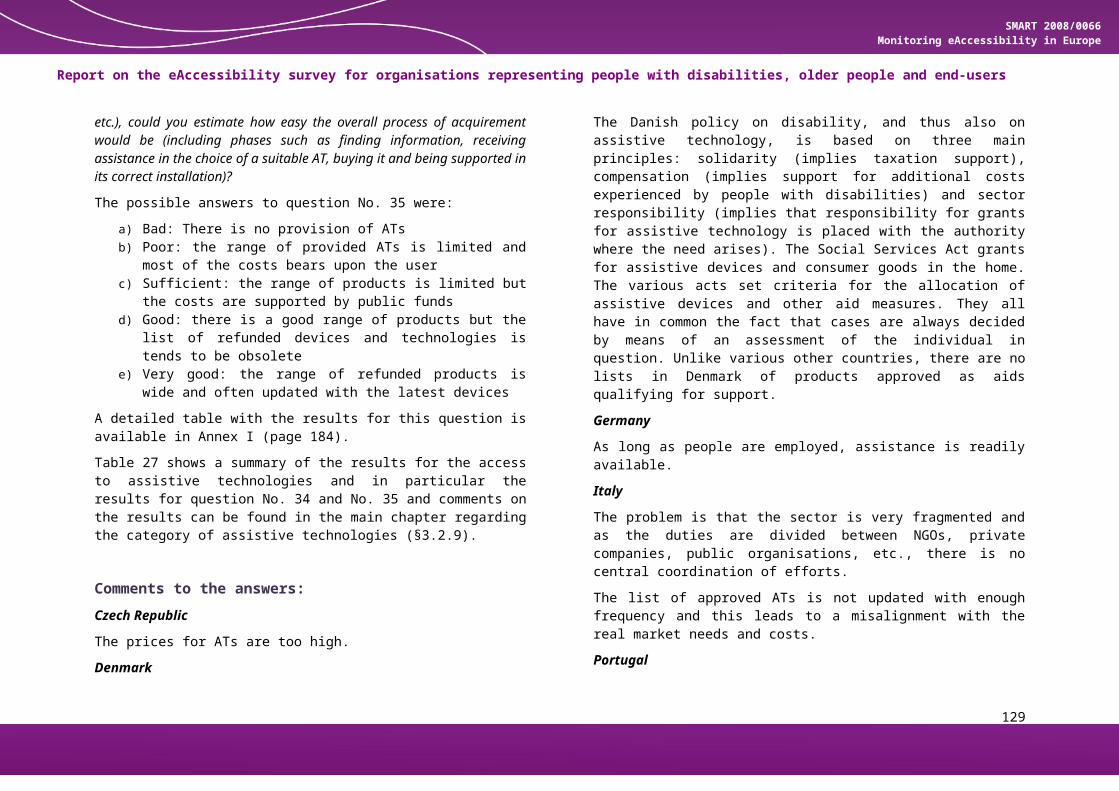
SMART 2008/0066 Monitoring eAccessibility in Europe
Report on the eAccessibility survey for organisations representing people with disabilities, older people and end-users
Table 42. Detailed results for Question No.18
Tota
l
EU c
ount
ries
Czec
h Re
publ
ic
Denm
ark
Fran
ce
Germ
any
Gree
ce
Hung
ary
Irela
nd
Italy
Portu
gal
Spai
n
Swed
en
The
Neth
erla
nds
Unite
d Ki
ngdo
m
Non
-EU
co
untr
ies
Aust
ralia
Cana
da
Norw
ay
U.S.
A.
No. of Organisations answering 76 62 5 2 4 4 5 1 6 6 4 6 9 1 9 14 7 2 1 4Always 5 5 0 0 1 0 4 0 0 0 0 0 0 0 0 0 0 0 0 0Often 30 27 1 1 2 0 1 1 2 5 1 3 4 1 5 3 0 2 1 0Sometimes 20 15 3 0 1 3 0 0 3 0 1 1 1 0 2 5 4 0 0 1Rarely 11 9 1 0 0 0 0 0 1 0 2 2 3 0 0 2 0 0 0 2Never 3 0 0 0 0 0 0 0 0 0 0 0 0 0 0 3 2 0 0 1Don’t know 6 5 0 0 0 1 0 0 0 1 0 0 1 0 2 1 1 0 0 0This question does not concern us 1 1 0 1 0 0 0 0 0 0 0 0 0 0 0 0 0 0 0 0Total Score (%) 43 40 50 30 30 50 14 30 47 30 55 47 48 30 36 58 63 30 30 70
Source: Own elaboration, 2011. Unit: Percentages
Question No.19
Social networks and interactive websites (Web 2.0) are often considered as community enablers, reducing social, geographical and cultural divides. Could you rate the average level of accessibility of these websites?
129

SMART 2008/0066 Monitoring eAccessibility in Europe
Report on the eAccessibility survey for organisations representing people with disabilities, older people and end-users
Table 43. Detailed results for Question No.19
Tota
l
EU c
ount
ries
Czec
h Re
publ
ic
Denm
ark
Fran
ce
Germ
any
Gree
ce
Hung
ary
Irela
nd
Italy
Portu
gal
Spai
n
Swed
en
The
Neth
erla
nds
Unite
d Ki
ngdo
m
Non
-EU
co
untr
ies
Aust
ralia
Cana
da
Norw
ay
U.S.
A.
No. of Organisations answering 76 62 5 2 4 4 5 1 6 6 4 6 9 1 9 14 7 2 1 4None or poor 14 14 0 0 1 3 4 0 0 1 1 1 2 0 1 0 0 0 0 0Insufficient 23 19 1 1 2 1 0 0 3 2 0 2 1 1 5 4 1 2 1 0Fair 15 10 4 0 0 0 0 0 0 0 1 2 2 0 1 5 4 0 0 1Good 7 5 0 0 0 0 0 0 2 1 1 0 0 0 1 2 1 0 0 1Very good 5 3 0 0 1 0 0 0 0 1 0 0 1 0 0 2 0 0 0 2Don’t know 10 10 0 0 0 0 1 1 1 1 1 1 3 0 1 0 0 0 0 0This question does not concern us 2 1 0 1 0 0 0 0 0 0 0 0 0 0 0 1 1 0 0 0Total Score (%) 39 36 46 30 40 15 10 46 46 43 34 40 30 35 53 50 30 30 75
Source: Own elaboration, 2011. Unit: Percentages
130

SMART 2008/0066 Monitoring eAccessibility in Europe
Report on the eAccessibility survey for organisations representing people with disabilities, older people and end-users
Question No.20
When buying a Personal Computer from an online or physical consumer electronics retail store, how often does it come with out-of-the-box accessibility features and software and are these features well documented and easy to activate autonomously?
Table 44. Detailed results for Question No.20
Tota
l
EU c
ount
ries
Czec
h Re
publ
ic
Denm
ark
Fran
ce
Germ
any
Gree
ce
Hung
ary
Irela
nd
Italy
Portu
gal
Spai
n
Swed
en
The
Neth
erla
nds
Unite
d Ki
ngdo
mN
on-E
U
coun
trie
sAu
stra
lia
Cana
da
Norw
ay
U.S.
A.
No. of Organisations answering 76 62 5 2 4 4 5 1 6 6 4 6 9 1 9 14 7 2 1 4Almost no accessibility feature is provided or documented out-of-the-box 25 21 1 1 1 1 4 0 1 3 1 3 3 1 1 4 2 1 0 1
There are some accessibility features but they are not clearly documented and at first an external help is required for their activation 21 17 1 0 2 3 0 1 0 2 0 1 1 0 6 4 2 1 0 1
There are many accessibility features but they are not clearly documented and at first an external help is required for their activation 5 4 0 0 0 0 0 0 3 0 1 0 0 0 0 1 1 0 0 0
There are many documented accessibility features but at first an external help is required for their activation 2 1 0 0 0 0 0 0 0 0 0 0 1 0 0 1 1 0 0 0
There is a rich set of accessibility features which are well documented and can be activated autonomously 8 7 1 0 1 0 1 0 1 0 1 0 1 0 1 1 0 0 0 1
Don’t know 13 10 2 1 0 0 0 0 1 0 1 2 2 0 1 3 1 0 1 1This question does not concern us 2 2 0 0 0 0 0 0 0 1 0 0 1 0 0 0 0 0 0 0Total Score (%) 33 32 43 10 40 25 26 30 50 18 50 15 37 10 35 34 33 20 43
Source: Own elaboration, 2011. Unit: Percentages
131

SMART 2008/0066 Monitoring eAccessibility in Europe
Report on the eAccessibility survey for organisations representing people with disabilities, older people and end-users
Question No.21
Please provide an estimate of the availability of subtitling of TV programmes in your country and in your language.
Table 45. Detailed results for Question No.21
Tota
l
EU c
ount
ries
Czec
h Re
publ
ic
Denm
ark
Fran
ce
Germ
any
Gree
ce
Hung
ary
Irela
nd
Italy
Portu
gal
Spai
n
Swed
en
The
Neth
erla
nds
Unite
d Ki
ngdo
m
Non
-EU
co
untr
ies
Aust
ralia
Cana
da
Norw
ay
U.S.
A.
No. of Organisations answering 76 62 5 2 4 4 5 1 6 6 4 6 9 1 9 14 7 2 1 4Very little or no availability 6 6 1 0 1 1 1 0 0 0 0 2 0 0 0 0 0 0 0 0Insufficient availability 12 12 0 2 2 1 0 1 2 2 0 0 1 1 0 0 0 0 0 0Some availability 22 19 1 0 1 1 3 0 3 1 1 2 4 0 2 3 2 0 0 1Good availability 15 11 2 0 0 1 0 0 0 0 2 1 2 0 3 4 2 0 1 1Almost full availability 10 6 1 0 0 0 0 0 0 0 1 0 2 0 2 4 1 1 0 2Don’t know 5 3 0 0 0 0 1 0 1 0 0 1 0 0 0 2 1 1 0 0This question does not concern us 6 5 0 0 0 0 0 0 0 3 0 0 0 0 2 1 1 0 0 0Total Score (%) 53 50 58 30 30 40 40 30 42 37 70 38 61 30 70 72 66 90 70 75
Source: Own elaboration, 2011. Unit: Percentages
132

SMART 2008/0066 Monitoring eAccessibility in Europe
Report on the eAccessibility survey for organisations representing people with disabilities, older people and end-users
Question No.22
Please provide an estimate of the availability of TV programmes with an auxiliary audio description channel in your country.
Table 46. Detailed results for Question No.22
Tota
l
EU c
ount
ries
Czec
h Re
publ
ic
Denm
ark
Fran
ce
Germ
any
Gree
ce
Hung
ary
Irela
nd
Italy
Portu
gal
Spai
n
Swed
en
The
Neth
erla
nds
Unite
d Ki
ngdo
m
Non
-EU
co
untr
ies
Aust
ralia
Cana
da
Norw
ay
U.S.
A.
No. of Organisations answering 76 62 5 2 4 4 5 1 6 6 4 6 9 1 9 14 7 2 1 4Very little or no availability 27 18 0 0 2 1 1 1 4 1 2 2 3 1 0 9 5 2 1 1Insufficient availability 18 18 1 1 1 1 3 0 1 3 2 3 0 0 2 0 0 0 0 0Some availability 8 7 0 1 0 1 0 0 0 0 0 0 3 0 2 1 0 0 0 1Good availability 6 6 0 0 0 0 0 0 0 2 0 0 2 0 2 0 0 0 0 0Almost full availability 4 2 2 0 0 0 0 0 0 0 0 0 0 0 0 2 1 0 0 1Don’t know 11 10 2 0 1 1 1 0 1 0 0 1 1 0 2 1 0 0 0 1This question does not concern us 2 1 0 0 0 0 0 0 0 0 0 0 0 0 1 1 1 0 0 0Total Score (%) 32 33 70 40 17 30 25 10 14 40 20 22 40 10 50 27 23 10 10 50
Source: Own elaboration, 2011. Unit: Percentages
Question No.23
Please provide an estimate of the availability of TV programmes with real time sign language translation in your
133

SMART 2008/0066 Monitoring eAccessibility in Europe
Report on the eAccessibility survey for organisations representing people with disabilities, older people and end-users
country.
Table 47. Detailed results for Question No.23
Tota
l
EU c
ount
ries
Czec
h Re
publ
ic
Denm
ark
Fran
ce
Germ
any
Gree
ce
Hung
ary
Irela
nd
Italy
Portu
gal
Spai
n
Swed
en
The
Neth
erla
nds
Unite
d Ki
ngdo
m
Non
-EU
co
untr
ies
Aust
ralia
Cana
da
Norw
ay
U.S.
A.
No. of Organisations answering 76 62 5 2 4 4 5 1 6 6 4 6 9 1 9 14 7 2 1 4Very little or no availability 32 26 2 0 2 2 1 1 5 1 1 5 5 1 0 6 3 1 0 2Insufficient availability 16 15 1 2 2 1 3 0 0 1 1 1 1 0 2 1 1 0 0 0Some availability 8 7 0 0 0 0 0 0 0 0 2 0 3 0 2 1 1 0 0 0Good availability 4 4 0 0 0 0 0 0 0 1 0 0 0 0 3 0 0 0 0 0Almost full availability 1 1 1 0 0 0 0 0 0 0 0 0 0 0 0 0 0 0 0 0Don’t know 6 3 1 0 0 0 1 0 1 0 0 0 0 0 0 3 1 1 0 1This question does not concern us 9 6 0 0 0 1 0 0 0 3 0 0 0 0 2 3 1 0 1 1Total Score (%) 26 27 35 30 20 17 25 10 10 37 35 13 26 10 53 18 22 10 10
Source: Own elaboration, 2011. Unit: Percentages
Question No.24
How would you rate the availability of (end-user) equipment (e.g. TV sets, receivers, set top boxes) required to enable auxiliary channels of information, such as audio description, subtitling and signing, in your country?
134

SMART 2008/0066 Monitoring eAccessibility in Europe
Report on the eAccessibility survey for organisations representing people with disabilities, older people and end-users
Table 48. Detailed results for Question No.24
Tota
l
EU c
ount
ries
Czec
h Re
publ
ic
Denm
ark
Fran
ce
Germ
any
Gree
ce
Hung
ary
Irela
nd
Italy
Portu
gal
Spai
n
Swed
en
The
Neth
erla
nds
Unite
d Ki
ngdo
m
Non
-EU
co
untr
ies
Aust
ralia
Cana
da
Norw
ay
U.S.
A.
No. of Organisations answering 76 62 5 2 4 4 5 1 6 6 4 6 9 1 9 14 7 2 1 4None: there are no such devices available 13 11 0 0 0 1 1 0 0 4 1 3 1 0 0 2 1 0 1 0Insufficient: accessibility aware TV devices are very difficult to find 19 15 2 1 2 0 0 1 4 0 0 1 3 1 0 4 3 1 0 0
Fair: a limited range of niche products are available 12 10 1 1 0 1 2 0 0 0 2 0 1 0 2 2 1 0 0 1
Good: many products are, at least to some extent, accessibility aware 15 12 1 0 0 0 2 0 1 1 1 0 2 0 4 3 1 1 0 1
Very good: most mainstream devices are accessibility aware 4 3 1 0 0 0 0 0 0 0 0 0 0 0 2 1 0 0 0 1
Total Useful Votes 63 51 5 2 2 2 5 1 5 5 4 4 7 1 8 12 6 2 1 3Don’t know 11 10 0 0 2 2 0 0 1 1 0 2 1 0 1 1 0 0 0 1This question does not concern us 2 1 0 0 0 0 0 0 0 0 0 0 1 0 0 1 1 0 0 0Total Participants 76 62 5 2 4 4 5 1 6 6 4 6 9 1 9 14 7 2 1 4Total Score (%) 43 43 54 40 30 30 50 30 38 22 45 15 41 30 70 45 37 50 10 70
Source: Own elaboration, 2011. Unit: Percentages
Question No.25
To what extent are the possible extra costs of such accessibility aware TV equipment covered by national schemes of
135
SMART 2008/0066 Monitoring eAccessibility in Europe
Report on the eAccessibility survey for organisations representing people with disabilities, older people and end-users
financial support or free of charge provision (i.e. the possible difference of cost between a mainstream TV device and an accessibility aware one)?
Table 49. Detailed results for Question No.25
Tota
l
EU c
ount
ries
Czec
h Re
publ
ic
Denm
ark
Fran
ce
Germ
any
Gree
ce
Hung
ary
Irela
nd
Italy
Portu
gal
Spai
n
Swed
en
The
Neth
erla
nds
Unite
d Ki
ngdo
m
Non
-EU
co
untr
ies
Aust
ralia
Cana
da
Norw
ay
U.S.
A.
No. of Organisations answering 76 62 5 2 4 4 5 1 6 6 4 6 9 1 9 14 7 2 1 4There is no financial support and the cost difference is high 25 22 1 0 2 1 3 1 3 3 0 4 2 1 1 3 2 0 0 1
There is no financial support but the extra costs are small 11 9 2 1 0 0 1 0 1 0 0 0 2 0 2 2 1 1 0 0
There is a limited/fixed amount of financial support but the extra costs are small 7 6 0 0 0 0 0 0 1 1 0 0 1 0 3 1 1 0 0 0
The extra costs are entirely covered by financial support 3 2 0 0 0 0 0 0 0 0 1 0 1 0 0 1 0 0 0 1
The cost of the equipment is entirely free of charge 1 1 0 1 0 0 0 0 0 0 0 0 0 0 0 0 0 0 0 0
Don’t know 23 18 2 0 2 3 1 0 1 1 3 2 2 0 1 5 2 1 0 2This question does not concern us 6 4 0 0 0 0 0 0 0 1 0 0 1 0 2 2 1 0 1 0Total Score (%) 26 26 23 60 10 10 15 10 22 20 70 10 33 10 37 30 25 30 40
Source: Own elaboration, 2011. Unit: Percentages
136

SMART 2008/0066 Monitoring eAccessibility in Europe
Report on the eAccessibility survey for organisations representing people with disabilities, older people and end-users
Question No.26
A digital home may improve the independent living of many categories of people simplifying the access to home equipment, electronic appliances, etc. Could you please estimate how many digital home devices are provided to people with special needs in your country by the national social/health system?
Table 50. Detailed results for Question No.26
Tota
l
EU c
ount
ries
Czec
h Re
publ
ic
Denm
ark
Fran
ce
Germ
any
Gree
ce
Hung
ary
Irela
nd
Italy
Portu
gal
Spai
n
Swed
en
The
Neth
erla
nds
Unite
d Ki
ngdo
m
Non
-EU
co
untr
ies
Aust
ralia
Cana
da
Norw
ay
U.S.
A.
No. of Organisations answering 76 62 5 2 4 4 5 1 6 6 4 6 9 1 9 14 7 2 1 4None 17 16 1 0 2 1 4 0 0 2 0 4 1 0 1 1 1 0 0 0Only a very limited selection of basic devices 24 20 3 0 1 2 0 1 3 1 3 1 2 0 3 4 2 1 1 0
There is a sufficient selection of basic devices 2 2 1 1 0 0 0 0 0 0 0 0 0 0 0 0 0 0 0 0
A good range of basic devices 2 1 0 0 0 0 0 0 0 0 0 0 1 0 0 1 1 0 0 0A wide range of devices, including more expensive ones 4 3 0 1 0 0 0 0 0 0 0 0 2 0 0 1 1 0 0 0
Don’t know 24 18 0 0 1 1 1 0 3 3 1 1 2 1 4 6 1 1 0 4This question does not concern us 3 2 0 0 0 0 0 0 0 0 0 0 1 0 1 1 1 0 0 0Total Score (%) 30 29 30 70 17 23 10 30 30 17 30 14 53 25 41 46 30 30
Source: Own elaboration, 2011. Unit: Percentages
137
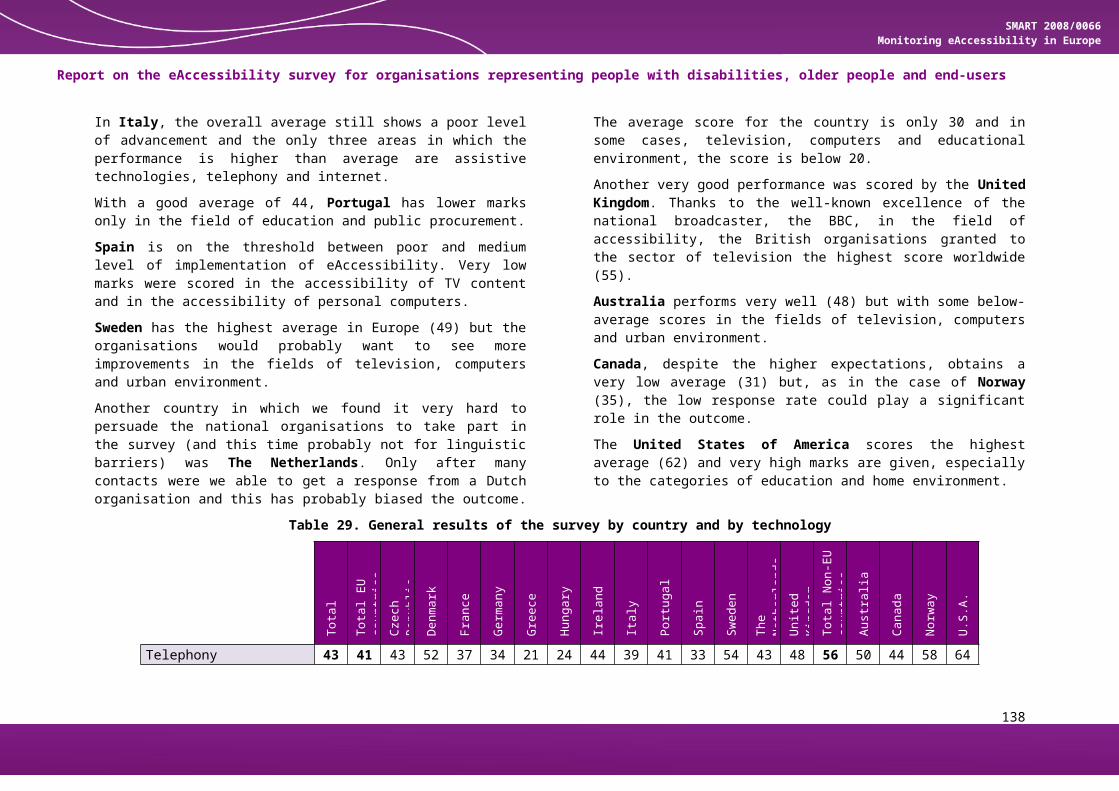
SMART 2008/0066 Monitoring eAccessibility in Europe
Report on the eAccessibility survey for organisations representing people with disabilities, older people and end-users
Question No.27
Telecare devices can help monitoring real time emergencies and lifestyle changes over time of certain risk categories even at a distance and preserving an independent living. How would you rate the ease of access to these devices in your country in terms of range of available products and support provided to the user?
Table 51. Detailed results for Question No.27
Tota
l
EU c
ount
ries
Czec
h Re
publ
ic
Denm
ark
Fran
ce
Germ
any
Gree
ce
Hung
ary
Irela
nd
Italy
Portu
gal
Spai
n
Swed
en
The
Neth
erla
nds
Unite
d Ki
ngdo
mN
on-E
U
coun
trie
sAu
stra
lia
Cana
daNo
rway
U.S.
A.
No. of Organisations answering 76 62 5 2 4 4 5 1 6 6 4 6 9 1 9 14 7 2 1 4None: there are no such products or services 5 5 0 1 1 0 1 0 1 1 0 0 0 0 0 0 0 0 0 0Very difficult: few products are available and almost no support is provided 12 11 1 0 1 0 2 0 0 2 1 1 2 0 1 1 1 0 0 0
Not so easy: the range of products is limited and there is not much assistance 14 14 0 0 1 2 1 0 4 1 1 1 1 0 2 0 0 0 0 0
It could be easier: there is a certain amount of available products and some assistance is provided 16 13 2 1 1 0 0 1 0 1 1 3 2 0 1 3 2 0 0 1
Quite easy: many products are available and assistance can be easily obtained 3 3 0 0 0 0 0 0 0 0 1 0 1 0 1 0 0 0 0 0
Don’t know 22 14 2 0 0 2 1 0 1 1 0 1 2 1 3 8 3 2 0 3This question does not concern us 4 2 0 0 0 0 0 0 0 0 0 0 1 0 1 2 1 0 1 0Total Score (%) 50 49 57 40 40 50 30 70 42 38 60 58 57 58 60 57 70
Source: Own elaboration, 2011. Unit: Percentages
138

SMART 2008/0066 Monitoring eAccessibility in Europe
Report on the eAccessibility survey for organisations representing people with disabilities, older people and end-users
Question No.28
Automated Teller Machines (cash dispensing machines) are widely available outside banks, in shopping centres, etc. Many of them are equipped with embedded accessibility features. Please estimate to what extent these accessibility aware ATMs are available in your country (e.g. speech output and keyboard to go along with the touch-screen, designed to be accessible by wheelchair users, etc.).
Table 52. Detailed results for Question No.28
Tota
l
EU c
ount
ries
Czec
h Re
publ
ic
Denm
ark
Fran
ce
Germ
any
Gree
ce
Hung
ary
Irela
nd
Italy
Portu
gal
Spai
n
Swed
en
The
Neth
erla
nds
Unite
d Ki
ngdo
m
Non
-EU
co
untr
ies
Aust
ralia
Cana
da
Norw
ay
U.S.
A.
No. of Organisations answering 76 62 5 2 4 4 5 1 6 6 4 6 9 1 9 14 7 2 1 4No availability 10 10 1 0 2 1 4 1 0 0 0 0 0 0 1 0 0 0 0 0Insufficient availability 19 17 1 0 1 2 0 0 3 3 0 4 2 0 1 2 1 1 0 0Some availability 13 9 1 1 0 1 0 0 2 2 0 1 1 0 0 4 2 1 1 0Good availability 15 13 1 0 1 0 0 0 0 1 2 1 3 1 3 2 1 0 0 1Wide availability 9 6 1 0 0 0 1 0 0 0 2 0 1 0 1 3 1 0 0 2Don’t know 5 4 0 0 0 0 0 0 1 0 0 0 1 0 2 1 1 0 0 0This question does not concern us 5 3 0 1 0 0 0 0 0 0 0 0 1 0 1 2 1 0 0 1Total Score (%) 48 46 50 50 30 30 26 10 38 43 80 40 59 70 57 61 58 40 50 83
Source: Own elaboration, 2011. Unit: Percentages
Question No.29
139

SMART 2008/0066 Monitoring eAccessibility in Europe
Report on the eAccessibility survey for organisations representing people with disabilities, older people and end-users
Electronic vending machines (like ticket vending machines in train or bus stations, etc.) are being placed everywhere. Unfortunately some of them may not be accessible to certain categories of people. To what extent are vending machines with accessibility features available in your country (e.g. speech output and keyboard to go along with the touch-screen, designed to be accessible by wheelchair users, etc.).
Table 53. Detailed results for Question No.29
Tota
l
EU c
ount
ries
Czec
h Re
publ
ic
Denm
ark
Fran
ce
Germ
any
Gree
ce
Hung
ary
Irela
nd
Italy
Portu
gal
Spai
n
Swed
en
The
Neth
erla
nds
Unite
d Ki
ngdo
m
Non
-EU
co
untr
ies
Aust
ralia
Cana
da
Norw
ay
U.S.
A.
No. of Organisations answering 76 62 5 2 4 4 5 1 6 6 4 6 9 1 9 14 7 2 1 4No availability 15 13 1 0 1 1 2 1 1 3 0 1 0 0 2 2 1 0 1 0Insufficient availability 35 30 1 1 2 3 3 0 4 3 2 5 3 1 2 5 2 2 0 1Some availability 7 6 3 0 0 0 0 0 1 0 0 0 2 0 0 1 1 0 0 0Good availability 3 1 0 0 0 0 0 0 0 0 1 0 0 0 0 2 0 0 0 2Wide availability 1 0 0 0 0 0 0 0 0 0 0 0 0 0 0 1 0 0 0 1Don’t know 10 8 0 0 1 0 0 0 0 0 1 0 3 0 3 2 2 0 0 0This question does not concern us 5 4 0 1 0 0 0 0 0 0 0 0 1 0 2 1 1 0 0 0Total Score (%) 30 28 38 30 23 25 22 10 30 20 43 27 38 30 20 41 30 30 10 65
Source: Own elaboration, 2011. Unit: Percentages
Question No.30
Interactive info points and virtual kiosks may be a very practical way to provide information (e.g. maps, touristic info, etc.), services (e.g. public utility services, eParticipation, etc.) or help avoid queues (e.g. in airports, in public offices,
140

SMART 2008/0066 Monitoring eAccessibility in Europe
Report on the eAccessibility survey for organisations representing people with disabilities, older people and end-users
etc.). Please estimate to what extent interactive info points and virtual kiosks with accessibility features are available in your country.
Table 54. Detailed results for Question No.30
Tota
l
EU c
ount
ries
Czec
h Re
publ
ic
Denm
ark
Fran
ce
Germ
any
Gree
ce
Hung
ary
Irela
nd
Italy
Portu
gal
Spai
n
Swed
en
The
Neth
erla
nds
Unite
d Ki
ngdo
m
Non
-EU
co
untr
ies
Aust
ralia
Cana
da
Norw
ay
U.S.
A.
No. of Organisations answering 76 62 5 2 4 4 5 1 6 6 4 6 9 1 9 14 7 2 1 4No availability 18 14 0 0 1 1 2 1 1 3 1 1 0 1 2 4 3 0 1 0Insufficient availability 30 27 4 1 2 3 3 0 4 1 1 3 3 0 2 3 0 2 0 1Some availability 9 8 1 0 1 0 0 0 1 1 0 0 3 0 1 1 1 0 0 0Good availability 5 2 0 0 0 0 0 0 0 0 1 0 0 0 1 3 1 0 0 2Wide availability 0 0 0 0 0 0 0 0 0 0 0 0 0 0 0 0 0 0 0 0Don’t know 10 8 0 0 0 0 0 0 0 1 0 2 3 0 2 2 1 0 0 1This question does not concern us 4 3 0 1 0 0 0 0 0 0 1 0 0 0 1 1 1 0 0 0Total Score (%) 30 29 34 30 30 25 22 10 30 22 37 25 40 10 33 35 30 30 10 57
Source: Own elaboration, 2011. Unit: Percentages
Question No.31
In airports, stations and bus stops it is important for travellers to have access to updated and precise transport information. Often the information provided on screens, through loud speakers or through interactive kiosks may not be accessible to everyone. How would you rate the level of accessibility to public transport information in your country?
141

SMART 2008/0066 Monitoring eAccessibility in Europe
Report on the eAccessibility survey for organisations representing people with disabilities, older people and end-users
Table 55. Detailed results for Question No.31
Tota
l
EU c
ount
ries
Czec
h Re
publ
ic
Denm
ark
Fran
ce
Germ
any
Gree
ce
Hung
ary
Irela
nd
Italy
Portu
gal
Spai
n
Swed
en
The
Neth
erla
nds
Unite
d Ki
ngdo
m
Non
-EU
co
untr
ies
Aust
ralia
Cana
da
Norw
ay
U.S.
A.
No. of Organisations answering 76 62 5 2 4 4 5 1 6 6 4 6 9 1 9 14 7 2 1 4Bad: certain categories of passengers could completely miss relevant information in most airports/stations
28 24 0 1 1 3 4 1 1 2 2 3 3 1 2 4 3 0 1 0
Insufficient: certain categories of passengers could miss part of the information in some airports/stations
23 20 3 0 2 1 1 0 1 3 2 1 2 0 4 3 1 1 0 1
Fair: multi-channel sources of information are available only in a few airports/station 10 8 1 0 0 0 0 0 3 0 0 2 0 0 2 2 1 0 0 1Good: multi-channel sources of information are already or are being installed in many airports/stations
7 6 1 1 1 0 0 0 0 1 0 0 2 0 0 1 0 0 0 1
Very good: almost every airport/station is provided with multi-channel sources of information
2 1 0 0 0 0 0 0 0 0 0 0 0 0 1 1 0 0 0 1
Don’t know 6 3 0 0 0 0 0 0 1 0 0 0 2 0 0 3 2 1 0 0This question does not concern us 0 0 0 0 0 0 0 0 0 0 0 0 0 0 0 0 0 0 0 0Total Score (%) 31 30 42 40 35 15 14 10 38 30 20 27 33 10 37 35 22 30 10 60
Source: Own elaboration, 2011. Unit: Percentages
Question No.32
The market of digital books is rapidly growing, stimulating publishers and hardware producers. Many categories of people shall benefit from this revolution, especially if the eBooks shall be compatible with commonly available assistive technologies and eBook readers shall be equipped with simple accessibility features (such as text-to-speech, vocal
142

SMART 2008/0066 Monitoring eAccessibility in Europe
Report on the eAccessibility survey for organisations representing people with disabilities, older people and end-users
commands, etc.). How easy is it to find, buy and read an eBook in your country (preferably in your language)?
Table 56. Detailed results for Question No.32
Tota
l
EU c
ount
ries
Czec
h Re
publ
ic
Denm
ark
Fran
ce
Germ
any
Gree
ce
Hung
ary
Irela
nd
Italy
Portu
gal
Spai
n
Swed
en
The
Neth
erla
nds
Unite
d Ki
ngdo
mN
on-E
U
coun
trie
sAu
stra
lia
Cana
da
Norw
ay
U.S.
A.
No. of Organisations answering 76
62 5 2 4 4 5 1 6 6 4 6 9 1 9 1
4 7 2 1 4
Very difficult: the choice of eBooks in our language is very scarce. 10 9 1 0 0 0 1 0 0 3 2 0 1 1 0 1 0 1 0 0
Difficult: the choice of eBooks is very limited and not very accessible 7 6 0 0 0 1 2 0 0 0 2 0 0 0 1 1 0 1 0 0
Not so easy: the choice of eBooks is limited but growing and there may be accessibility issues
18
16 2 0 1 0 2 1 2 3 0 2 1 0 2 2 1 0 1 0
Easy: the choice of eBooks is good and some accessible eBook readers are available
22
16 2 1 1 2 0 0 1 0 0 2 3 0 4 6 5 0 0 1
Very easy: there is a wide choice of eBooks and eReaders with accessibility features. 6 3 0 0 0 0 0 0 0 0 0 0 2 0 1 3 1 0 0 2
Don’t know 11
10 0 0 2 1 0 0 3 0 0 2 1 0 1 1 0 0 0 1
This question does not concern us 2 2 0 1 0 0 0 0 0 0 0 0 1 0 0 0 0 0 0 0
Total Score (%) 52
49
50
70
60
57
34
50
57
30
20
60
64
10
63
64
70
20
50
83
Source: Own elaboration, 2011. Unit: Percentages
143
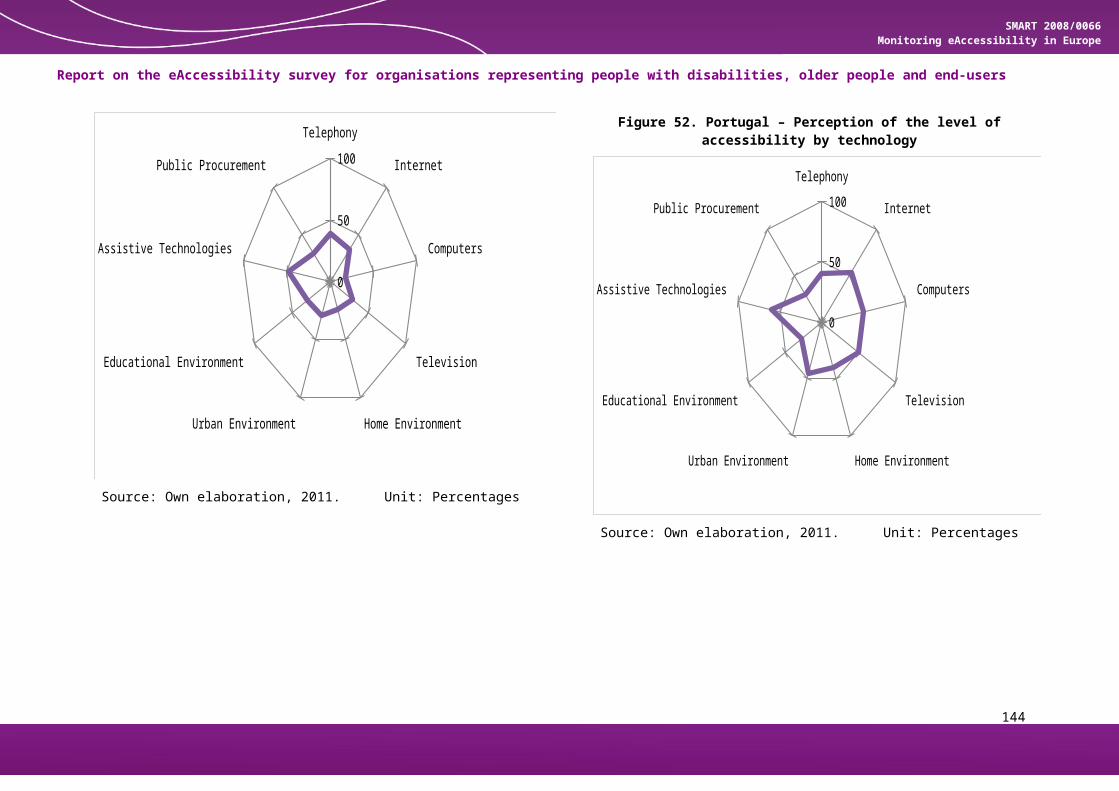
SMART 2008/0066 Monitoring eAccessibility in Europe
Report on the eAccessibility survey for organisations representing people with disabilities, older people and end-users
Question No.33
eLearning can be a powerful technology, enabling students to reduce geographical divides, workers to increase their skills and companies to re-qualify their employees. Yet the complexity of certain eLearning platforms and the richness of multimedia in the content may introduce digital barriers if accessibility is not taken into account. According to your experience to which extent are these courses universally designed and accessible to everyone?
Table 57. Detailed results for Question No.33
Tota
l
EU c
ount
ries
Czec
h Re
publ
ic
Denm
ark
Fran
ce
Germ
any
Gree
ce
Hung
ary
Irela
nd
Italy
Portu
gal
Spai
n
Swed
en
The
Neth
erla
nds
Unite
d Ki
ngdo
mN
on-E
U
coun
trie
sAu
stra
lia
Cana
da
Norw
ay
U.S.
A.
No. of Organisations answering 76 62 5 2 4 4 5 1 6 6 4 6 9 1 9 14 7 2 1 4Very little: it is very rare to find an eLearning course with an acceptable level of accessibility 20 17 0 1 2 0 4 0 2 2 0 1 2 1 2 3 1 2 0 0
Little: some courses are available but the level of accessibility is not very high 16 14 2 0 1 1 1 0 1 1 3 2 2 0 0 2 1 0 1 0
Fair: some courses are available and they are usually a special adaptation of non-accessible material 13 11 2 0 0 1 0 0 0 2 1 2 1 0 2 2 2 0 0 0
Good: there is a good range of accessible courses and their quality is acceptable 3 2 0 0 0 0 0 0 0 0 0 0 1 0 1 1 0 0 0 1
Wide: there is a wide range of universally designed and accessible courses 5 2 0 0 1 0 0 0 0 0 0 0 1 0 0 3 1 0 0 2
Don’t know 19 16 1 1 0 2 0 1 3 1 0 1 2 0 4 3 2 0 0 1This question does not concern us 0 0 0 0 0 0 0 0 0 0 0 0 0 0 0 0 0 0 0 0Total Score (%) 35 32 40 10 35 40 14 17 30 35 34 41 10 38 48 46 10 30 83
Source: Own elaboration, 2011. Unit: Percentages
144

SMART 2008/0066 Monitoring eAccessibility in Europe
Report on the eAccessibility survey for organisations representing people with disabilities, older people and end-users
Question No.34
If a person in your country needs an Assistive Technology (AT) to operate an ICT device (such as a PC, a mobile phone, etc.), could you estimate how easy the overall process of acquirement would be (including phases such as finding information, receiving assistance in the choice of a suiTable AT, buying it and being supported in its correct installation)?
Table 58. Detailed results for Question No.34
Tota
l
EU c
ount
ries
Czec
h Re
publ
ic
Denm
ark
Fran
ce
Germ
any
Gree
ce
Hung
ary
Irela
nd
Italy
Portu
gal
Spai
n
Swed
en
The
Neth
erla
nds
Unite
d Ki
ngdo
mN
on-E
U
coun
trie
sAu
stra
lia
Cana
da
Norw
ay
U.S.
A.
No. of Organisations answering 76 62 5 2 4 4 5 1 6 6 4 6 9 1 9 14 7 2 1 4None: there are no services 0 0 0 0 0 0 0 0 0 0 0 0 0 0 0 0 0 0 0 0Difficult: almost no assistance is available and/or there are not many support structures 10 10 0 0 1 1 0 0 1 3 1 2 0 0 1 0 0 0 0 0
Not so easy: there is a limited amount of assistance but there are not enough support structures 27 22 3 1 2 1 3 0 2 1 1 2 3 0 3 5 1 2 1 1
It could be easier: there is a certain amount of assistance in most of the phases but more support structures are needed 21 17 1 1 0 2 2 0 2 0 2 0 2 1 4 4 4 0 0 0
Quite easy: assistance can be easily obtained and there are many support structures 5 3 1 0 0 0 0 0 0 1 0 0 1 0 0 2 1 0 0 1
Don’t know 12 9 0 0 1 0 0 1 1 1 0 2 2 0 1 3 1 0 0 2This question does not concern us 1 1 0 0 0 0 0 0 0 0 0 0 1 0 0 0 0 0 0 0Total Score (%) 57 55 62 60 43 55 58 54 46 55 40 63 70 58 65 70 50 50 70
145

SMART 2008/0066 Monitoring eAccessibility in Europe
Report on the eAccessibility survey for organisations representing people with disabilities, older people and end-users
Source: Own elaboration, 2011. Unit: Percentages
Question No.35
National social/health systems often provide or refund certain Assistive Technologies to the end user. How would you define the quality of this service in your country in terms of range of available products and percentage of expenses bearing upon the user?
Table 59. Detailed results for Question No.35
Tota
l
EU c
ount
ries
Czec
h Re
publ
ic
Denm
ark
Fran
ce
Germ
any
Gree
ce
Hung
ary
Irela
nd
Italy
Portu
gal
Spai
n
Swed
en
The
Neth
erla
nds
Unite
d Ki
ngdo
mN
on-E
U
coun
trie
sAu
stra
lia
Cana
da
Norw
ay
U.S.
A.
No. of Organisations answering 76 62 5 2 4 4 5 1 6 6 4 6 9 1 9 14 7 2 1 4Bad: There is no provision of ATs 5 5 0 0 1 0 1 0 0 0 0 3 0 0 0 0 0 0 0 0Poor: the range of provided ATs is limited and most of the costs bears upon the user 26 22 3 0 2 0 3 1 2 2 1 1 2 0 5 4 2 1 0 1
Sufficient: the range of products is limited but the costs are supported by public funds 11 8 1 1 0 1 1 0 1 1 0 0 0 0 2 3 0 1 1 1
Good: there is a good range of products but the list of refunded devices and technologies is tends to be obsolete 11 11 0 0 1 1 0 0 1 2 2 0 2 1 1 0 0 0 0 0
Very good: the range of refunded products is wide and often updated with the latest devices 8 5 1 1 0 0 0 0 0 0 1 0 2 0 0 3 2 0 0 1
Don’t know 13 9 0 0 0 2 0 0 2 0 0 2 2 0 1 4 3 0 0 1This question does not concern us 2 2 0 0 0 0 0 0 0 1 0 0 1 0 0 0 0 0 0 0Total Score (%) 47 46 46 70 35 60 30 30 45 50 65 15 63 70 40 54 60 40 50 57
146

SMART 2008/0066 Monitoring eAccessibility in Europe
Report on the eAccessibility survey for organisations representing people with disabilities, older people and end-users
Source: Own elaboration, 2011. Unit: Percentages
Question No.36
Are you aware of the existence of any laws and/or regulations in your country that require publicly procured ICT to satisfy accessibility requirements? If the answer is YES, could you estimate their grade of enforcement?
Table 60. Detailed results for Question No.36
Tota
l
EU c
ount
ries
Czec
h Re
publ
ic
Denm
ark
Fran
ce
Germ
any
Gree
ce
Hung
ary
Irela
nd
Italy
Portu
gal
Spai
n
Swed
en
The
Neth
erla
nds
Unite
d Ki
ngdo
mN
on-E
U
coun
trie
sAu
stra
lia
Cana
da
Norw
ay
U.S.
A.
No. of Organisations answering 76 62 5 2 4 4 5 1 6 6 4 6 9 1 9 14 7 2 1 4Bad: almost none of the procured ICT products are accessible 6 6 1 1 0 0 0 0 1 2 0 0 1 0 0 0 0 0 0 0Insufficient: some efforts are in place but the enforcement is still insufficient 25 20 2 0 1 1 4 0 3 2 1 1 0 1 4 5 2 1 1 1
Sufficient: some efforts are in place but the enforcement is just about sufficient 3 3 0 0 0 0 0 1 0 0 0 0 1 0 1 0 0 0 0 0
Good: the efforts are good but the scope of the laws/regulations is restricted to few ICT products 6 5 0 1 0 0 0 0 1 1 0 1 0 0 1 1 0 0 0 1
Very good: the efforts are good and many ICT products are covered by the laws/regulations 5 3 1 0 0 0 0 0 0 0 0 0 1 0 1 2 2 0 0 0
Don’t know 30 24 1 0 3 3 1 0 1 1 3 4 5 0 2 6 3 1 0 2This question does not concern us 1 1 0 0 0 0 0 0 0 0 0 0 1 0 0 0 0 0 0 0Total Score (%) 41 39 40 40 30 30 30 50 34 30 30 50 50 30 47 50 60 30 30 50
147

SMART 2008/0066 Monitoring eAccessibility in Europe
Report on the eAccessibility survey for organisations representing people with disabilities, older people and end-users
Source: Own elaboration, 2011. Unit: Percentages
148