Embed Size (px)
Citation preview
12/29/14
1
Thank you for par-cipa-ng in PorkBridge 2014.
To start the presenta-on, advance one slide by pressing “enter” or the down arrow or right arrow key.
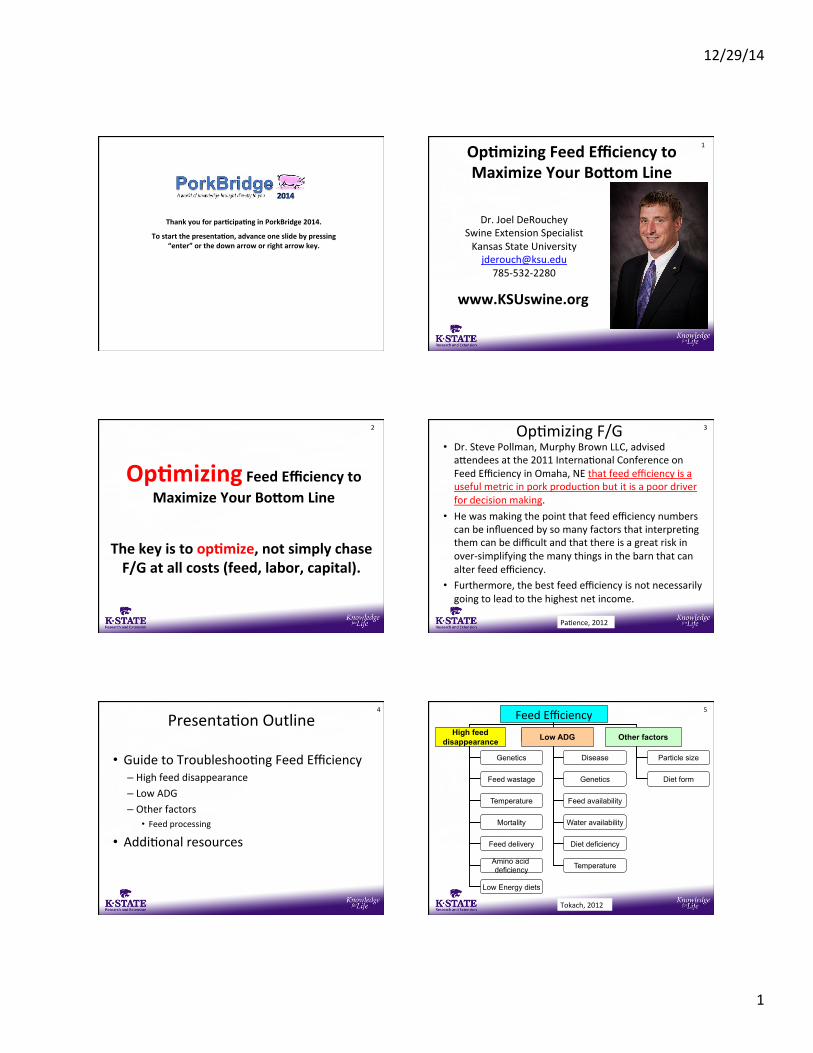
Op-mizing Feed Efficiency to Maximize Your BoLom Line
Dr. Joel DeRouchey Swine Extension Specialist Kansas State University [email protected] 785-‐532-‐2280
www.KSUswine.org
1
Op-mizing Feed Efficiency to Maximize Your BoLom Line
The key is to op-mize, not simply chase F/G at all costs (feed, labor, capital).
2 OpKmizing F/G • Dr. Steve Pollman, Murphy Brown LLC, advised aWendees at the 2011 InternaKonal Conference on Feed Efficiency in Omaha, NE that feed efficiency is a useful metric in pork producKon but it is a poor driver for decision making.
• He was making the point that feed efficiency numbers can be influenced by so many factors that interpreKng them can be difficult and that there is a great risk in over-‐simplifying the many things in the barn that can alter feed efficiency.
• Furthermore, the best feed efficiency is not necessarily going to lead to the highest net income.
3
PaKence, 2012
PresentaKon Outline
• Guide to TroubleshooKng Feed Efficiency – High feed disappearance – Low ADG – Other factors
• Feed processing
• AddiKonal resources
4 Feed Efficiency
High feed disappearance Low ADG Other factors
Genetics
Feed wastage
Temperature
Mortality
Feed delivery
Amino acid deficiency
Low Energy diets
Disease
Genetics
Feed availability
Water availability
Diet deficiency
Temperature
Particle size
Diet form
Low ADG Other factors High feed disappearance
Feed Efficiency 5
Tokach, 2012
12/29/14
2
Feed Efficiency
High feed disappearance
Genetics
Feed wastage
Temperature
Mortality
Feed delivery
Amino acid deficiency
Low Energy diets
High feed disappearance
Feed Efficiency 6
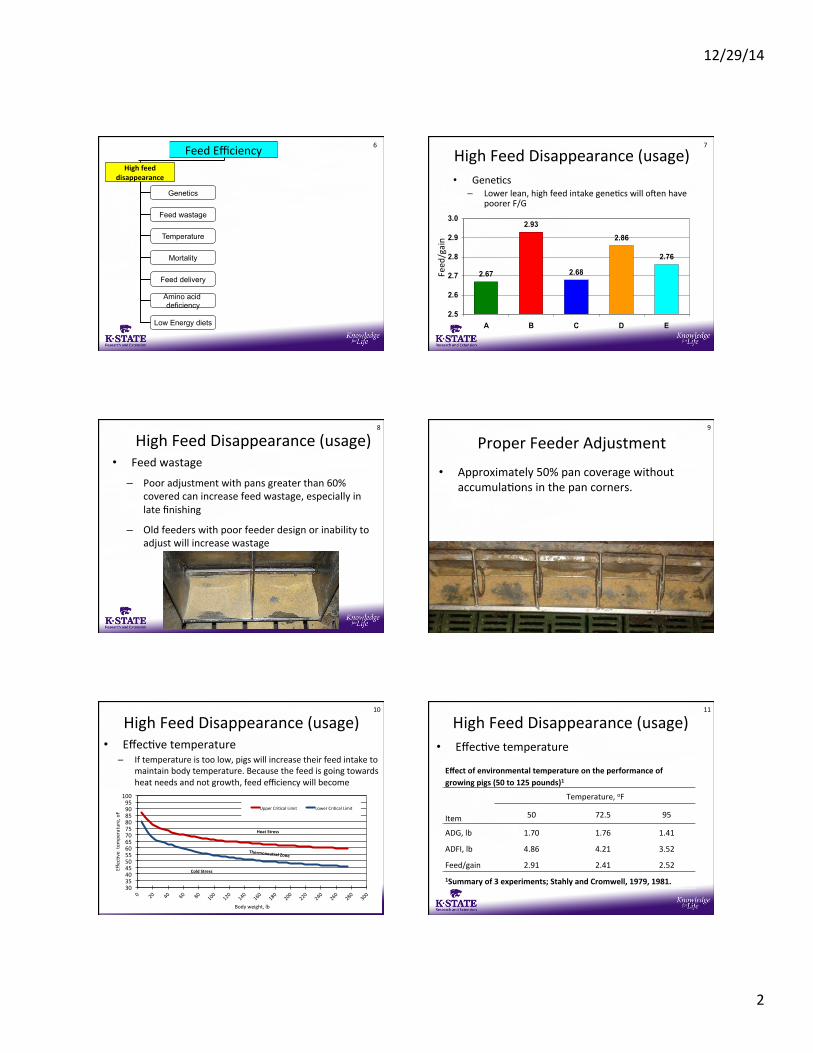
High Feed Disappearance (usage) • GeneKcs
– Lower lean, high feed intake geneKcs will oden have poorer F/G
2.67
2.93
2.68
2.86
2.76
2.5
2.6
2.7
2.8
2.9
3.0
A B C D E
Feed
/gain
7
High Feed Disappearance (usage) • Feed wastage
– Poor adjustment with pans greater than 60% covered can increase feed wastage, especially in late finishing
– Old feeders with poor feeder design or inability to adjust will increase wastage
8
Proper Feeder Adjustment
• Approximately 50% pan coverage without accumulaKons in the pan corners.
9
High Feed Disappearance (usage) • EffecKve temperature
– If temperature is too low, pigs will increase their feed intake to maintain body temperature. Because the feed is going towards heat needs and not growth, feed efficiency will become poorer.
30 35 40 45 50 55 60 65 70 75 80 85 90 95 100
0 20
40
60
80
100
120
140
160
180
200
220
240
260
280
300
EffecKve te
mpe
rature, oF
Body weight, lb
Upper CriKcal Limit Lower CriKcal Limit
Thermoneutral Zone
Cold Stress
Heat Stress
10
High Feed Disappearance (usage) • EffecKve temperature
Effect of environmental temperature on the performance of growing pigs (50 to 125 pounds)1 Item
Temperature, oF
50 72.5 95
ADG, lb 1.70 1.76 1.41
ADFI, lb 4.86 4.21 3.52
Feed/gain 2.91 2.41 2.52 1Summary of 3 experiments; Stahly and Cromwell, 1979, 1981.
11
12/29/14
3
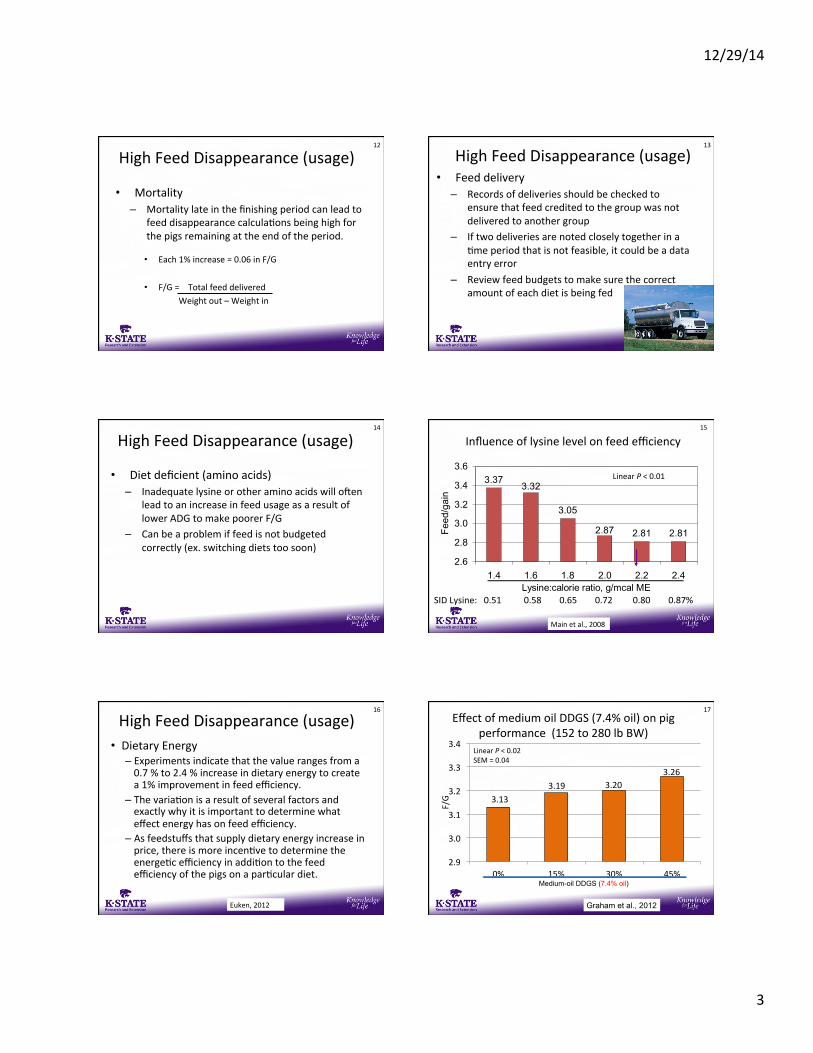
High Feed Disappearance (usage)
• Mortality – Mortality late in the finishing period can lead to
feed disappearance calculaKons being high for the pigs remaining at the end of the period.
• Each 1% increase = 0.06 in F/G
• F/G = Total feed delivered Weight out – Weight in
12
High Feed Disappearance (usage) • Feed delivery
– Records of deliveries should be checked to ensure that feed credited to the group was not delivered to another group
– If two deliveries are noted closely together in a Kme period that is not feasible, it could be a data entry error
– Review feed budgets to make sure the correct amount of each diet is being fed
13
High Feed Disappearance (usage)
• Diet deficient (amino acids) – Inadequate lysine or other amino acids will oden
lead to an increase in feed usage as a result of lower ADG to make poorer F/G
– Can be a problem if feed is not budgeted correctly (ex. switching diets too soon)
14
Influence of lysine level on feed efficiency
3.37
3.05
2.81 2.812.87
3.32
2.6
2.8
3.0
3.2
3.4
3.6
1.4 1.6 1.8 2.0 2.2 2.4Lysine:calorie ratio, g/mcal ME
Feed
/gai
n
Main et al., 2008
SID Lysine: 0.51 0.58 0.65 0.72 0.80 0.87%
Linear P < 0.01
15
High Feed Disappearance (usage) • Dietary Energy
– Experiments indicate that the value ranges from a 0.7 % to 2.4 % increase in dietary energy to create a 1% improvement in feed efficiency.
– The variaKon is a result of several factors and exactly why it is important to determine what effect energy has on feed efficiency.
– As feedstuffs that supply dietary energy increase in price, there is more incenKve to determine the energeKc efficiency in addiKon to the feed efficiency of the pigs on a parKcular diet.
16
Euken, 2012
3.13 3.19 3.20
3.26
2.9
3.0
3.1
3.2
3.3
3.4
0% 15% 30% 45%
F/G
Linear P < 0.02 SEM = 0.04
Effect of medium oil DDGS (7.4% oil) on pig performance (152 to 280 lb BW)
Medium-oil DDGS (7.4% oil)
Graham et al., 2012
17
12/29/14
4
Added Fat RecommendaKons • Should I have fat in my diets currently?
– Long on space = No • Gain improvements not required while increasing feed cost
– Short on space = Yes/No/Maybe • Evaluate net return and determine opKmum level by dietary phase. • Strategy should be different as economics change (corn-‐fat-‐market prices)
• Which season are pigs to be marketed? – Pigs placed in midsummer/fall/early winter months can/should forgo added fat due to growth rate improvements to come with cooler weather.
– Late Spring/Summer marketed pigs have more potenKal revenue benefit to be fed added fat starKng in February/March to capture growth rate (carcass weight advantages)
18 Feed Efficiency
Low ADG
Disease
Genetics
Feed availability
Water availability
Diet deficiency
Temperature
Low ADG
Feed Efficiency 19
Energy use by the pig
Gross energy fecal energy
DigesKble energy urinary energy
Metabolizable energy maintenance
Produc(on
20
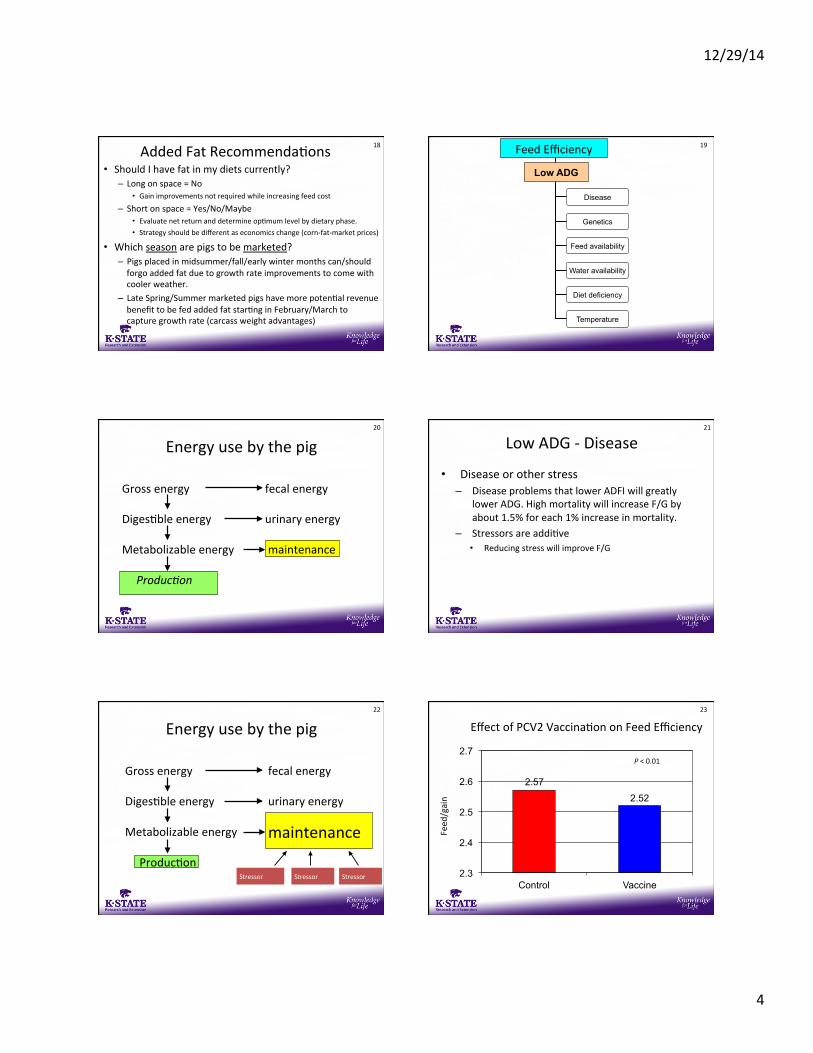
Low ADG -‐ Disease
• Disease or other stress – Disease problems that lower ADFI will greatly
lower ADG. High mortality will increase F/G by about 1.5% for each 1% increase in mortality.
– Stressors are addiKve • Reducing stress will improve F/G
21
maintenance
Energy use by the pig
Gross energy fecal energy
DigesKble energy urinary energy
Metabolizable energy
ProducKon
Stressor Stressor Stressor
22
Effect of PCV2 VaccinaKon on Feed Efficiency
Feed
/gain
2.57
2.52
2.3
2.4
2.5
2.6
2.7
Control Vaccine
P < 0.01
23
12/29/14
5
Low ADG – Feed Availability • Feed availability
– LimiKng feed intake intenKonally or unintenKonally (Plugged or empty feeders or bins) will lower ADFI and ADG
– High stocking density will decrease ADFI and ADG
24
Low ADG – Water Availability • Water availability
– Lack of water availability will reduce ADFI and ADG and F/G will get worse • Plugged nipples, dirty cups, low water pressure
25
Low ADG – Diet Deficiency
• Diet deficient (amino acids, salt, other) • Oden feed intake is reduced as a result of a
diet deficiency – Amino acid deficiencies – Inadequate salt levels will greatly reduce ADG
26
Low ADG – Barn Temperature • EffecKve temperature
– High environmental temperature will decrease ADFI and ADG.
– Feed efficiency is not altered much by high temperature, unless it is so high that feed intake is close to the maintenance requirement. Then, F/G will become poorer because there is less energy available for ADG since more of it is going towards maintenance requirements.
27
Feed Efficiency
Other factors
Particle size
Diet form
Other factors
Feed Efficiency 28
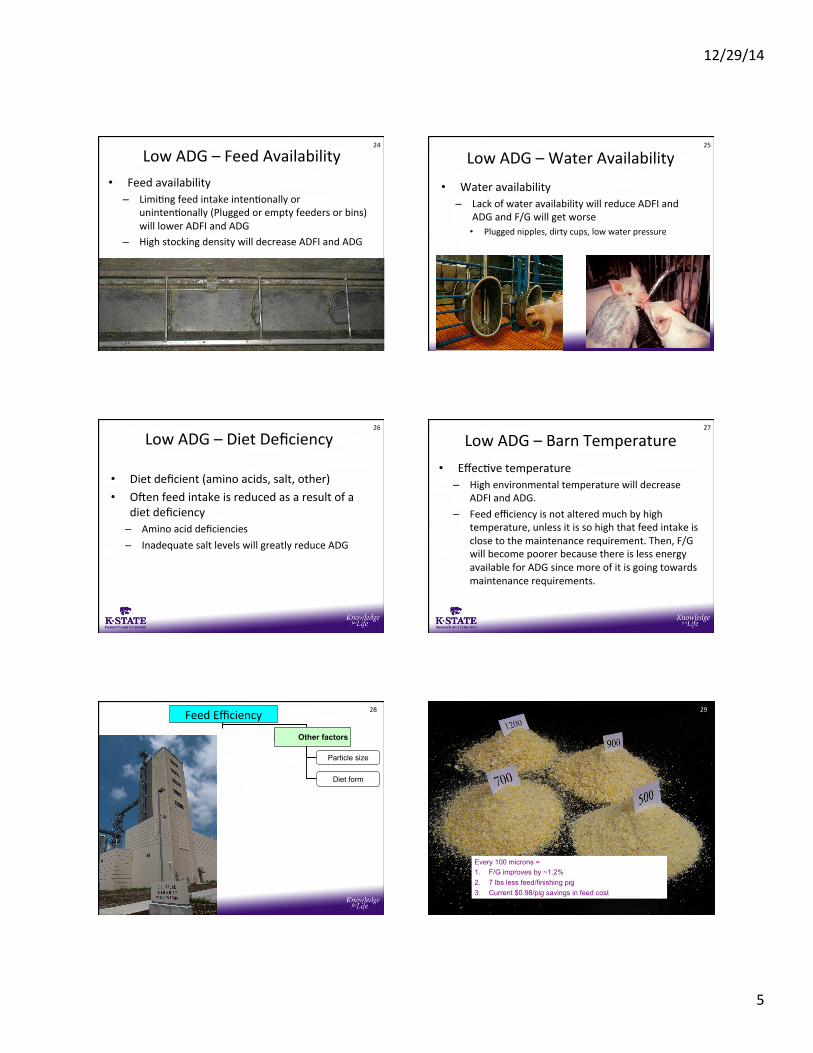
Every 100 microns = 1. F/G improves by ~1.2% 2. 7 lbs less feed/finishing pig 3. Current $0.98/pig savings in feed cost
29
12/29/14
6
3.0
3.1
3.2
3.3
3.4
3.5
800 600 400
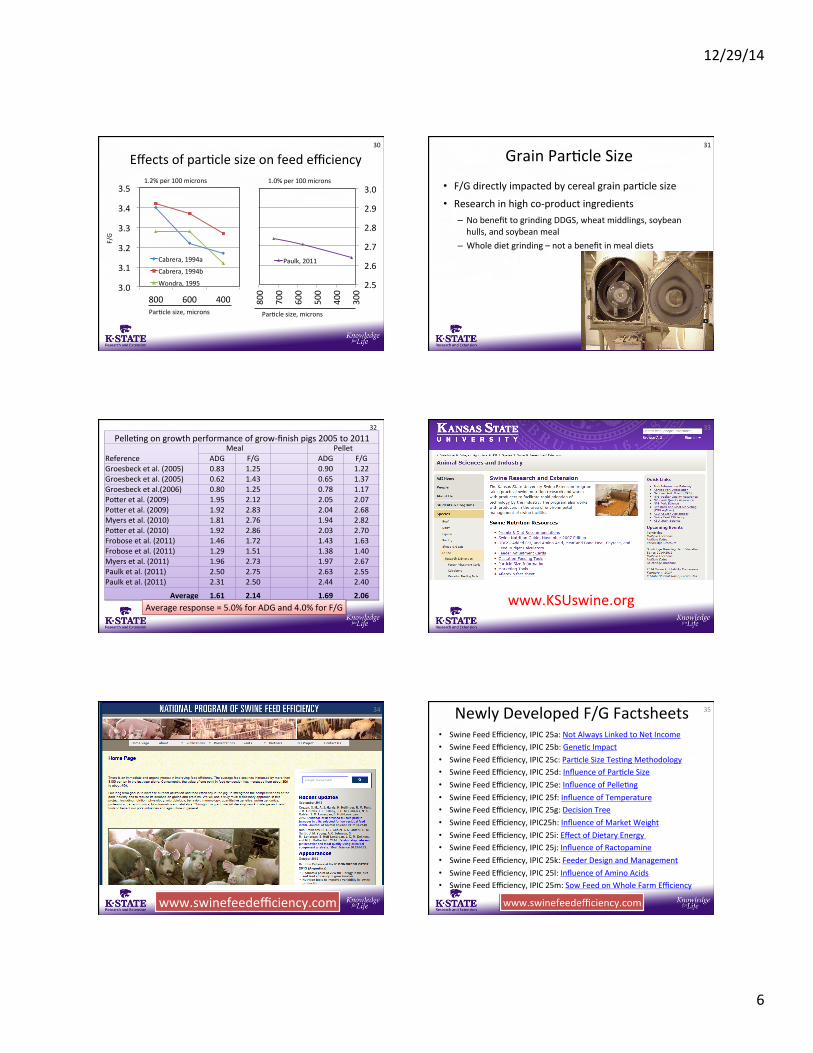
Cabrera, 1994a
Cabrera, 1994b
Wondra, 1995
Effects of parKcle size on feed efficiency
F/G
ParKcle size, microns
2.5
2.6
2.7
2.8
2.9
3.0
300
400
500
600
700
800
Paulk, 2011
1.2% per 100 microns 1.0% per 100 microns
ParKcle size, microns
30
Grain ParKcle Size
• F/G directly impacted by cereal grain parKcle size
• Research in high co-‐product ingredients – No benefit to grinding DDGS, wheat middlings, soybean hulls, and soybean meal
– Whole diet grinding – not a benefit in meal diets
31
PelleKng on growth performance of grow-‐finish pigs 2005 to 2011
Reference Meal Pellet
ADG F/G ADG F/G Groesbeck et al. (2005) 0.83 1.25 0.90 1.22 Groesbeck et al. (2005) 0.62 1.43 0.65 1.37 Groesbeck et al.(2006) 0.80 1.25 0.78 1.17 PoWer et al. (2009) 1.95 2.12 2.05 2.07 PoWer et al. (2009) 1.92 2.83 2.04 2.68 Myers et al. (2010) 1.81 2.76 1.94 2.82 PoWer et al. (2010) 1.92 2.86 2.03 2.70 Frobose et al. (2011) 1.46 1.72 1.43 1.63 Frobose et al. (2011) 1.29 1.51 1.38 1.40 Myers et al. (2011) 1.96 2.73 1.97 2.67 Paulk et al. (2011) 2.50 2.75 2.63 2.55 Paulk et al. (2011) 2.31 2.50 2.44 2.40
Average 1.61 2.14 1.69 2.06 Average response = 5.0% for ADG and 4.0% for F/G
32
32 33
www.KSUswine.org
33
www.swinefeedefficiency.com
34 34 Newly Developed F/G Factsheets • Swine Feed Efficiency, IPIC 25a: Not Always Linked to Net Income • Swine Feed Efficiency, IPIC 25b: GeneKc Impact • Swine Feed Efficiency, IPIC 25c: ParKcle Size TesKng Methodology • Swine Feed Efficiency, IPIC 25d: Influence of ParKcle Size • Swine Feed Efficiency, IPIC 25e: Influence of PelleKng • Swine Feed Efficiency, IPIC 25f: Influence of Temperature • Swine Feed Efficiency, IPIC 25g: Decision Tree • Swine Feed Efficiency, IPIC25h: Influence of Market Weight • Swine Feed Efficiency, IPIC 25i: Effect of Dietary Energy • Swine Feed Efficiency, IPIC 25j: Influence of Ractopamine • Swine Feed Efficiency, IPIC 25k: Feeder Design and Management • Swine Feed Efficiency, IPIC 25l: Influence of Amino Acids • Swine Feed Efficiency, IPIC 25m: Sow Feed on Whole Farm Efficiency
35
www.swinefeedefficiency.com
12/29/14
7
Thank you!
WWW.KSUswine.org
36