Embed Size (px)
Citation preview


“Snapshot in time” Assists with patient assessment BUT:
–Do NOT replace eyes-on/hands-on care
–Are just one piece of clinical judgment–ALL have pitfalls/malfunctions/limitations–Is more complex than ever

Non-invasive method of determining Carbon Dioxide levels in
intubated and non-intubated patients
Uses infra-red technology, to monitor exhaled breath to determine CO2 levels numerically and by
waveform (capnogram).

EtCO2 is directly related to theventilation status of the patient (as
opposed to SAo2, which relates oxygenation of the patient)
Capnography can be used to verifyendotracheal tube/Combi-Tube & King Airway placement and
monitor its position, assess ventilation and treatments, and to evaluate resuscitative efforts during CPR
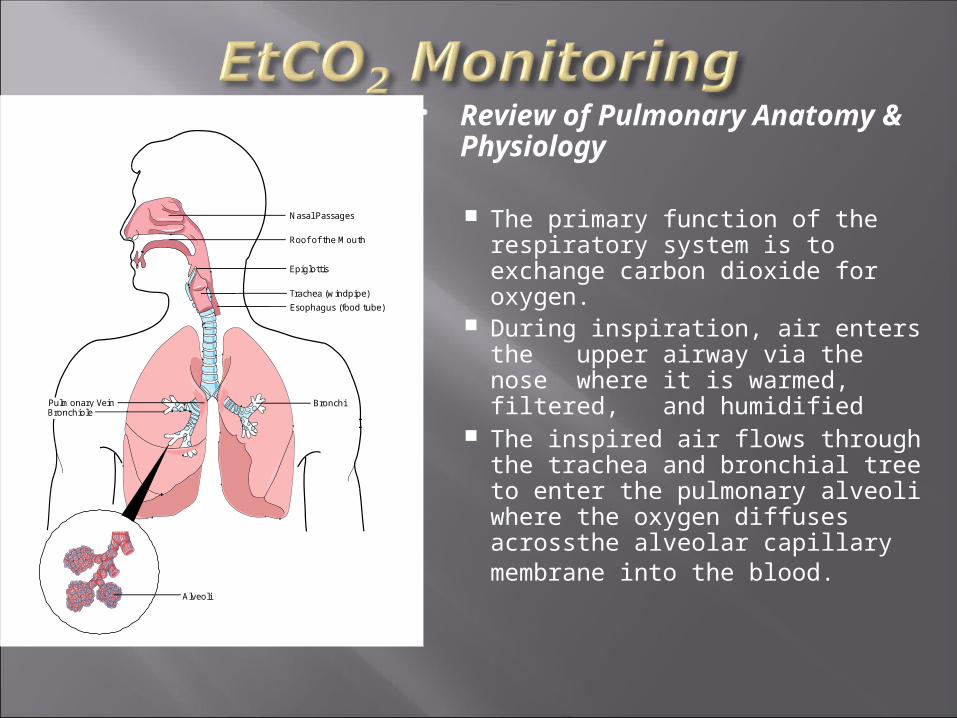
Review of Pulmonary Anatomy & Physiology
The primary function of therespiratory system is to
exchange carbon dioxide for oxygen.
During inspiration, air enters theupper airway via the
nose where it is warmed, filtered, and humidified
The inspired air flows throughthe trachea and
bronchial tree to enter the pulmonary alveoli where the oxygen diffusesacross the alveolar capillary
membrane into the blood.
Nasal Passages
Roof of the Mouth
Epiglottis
Trachea (windpipe)
Esophagus (food tube)
Alveoli
BronchiPulmonary VeinBronchiole
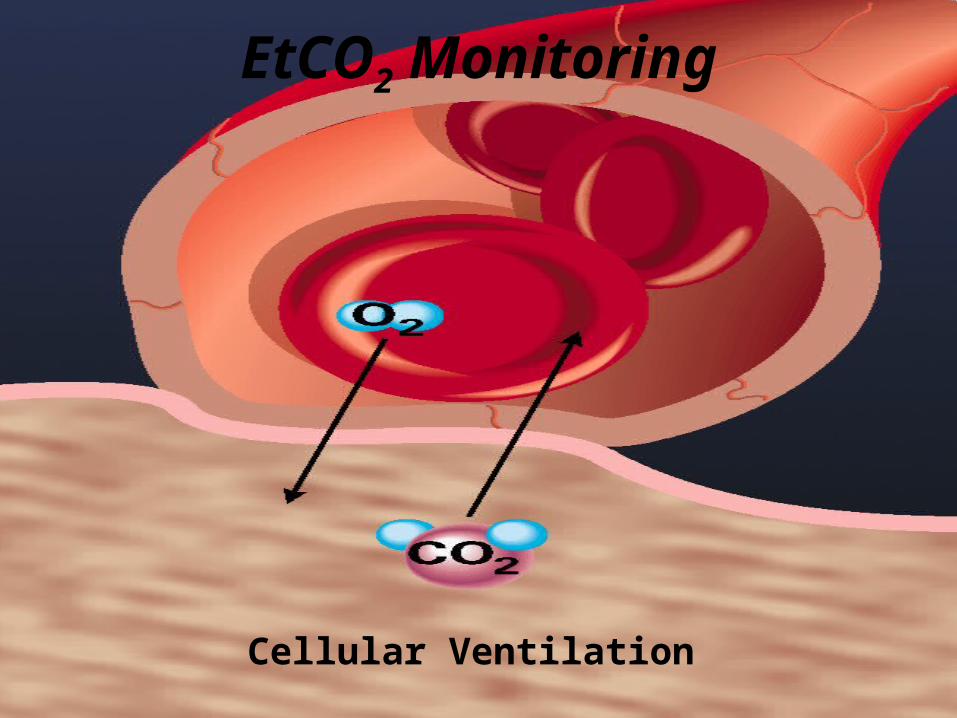
Cellular Ventilation
EtCO2 Monitoring

Alveolar Ventilation
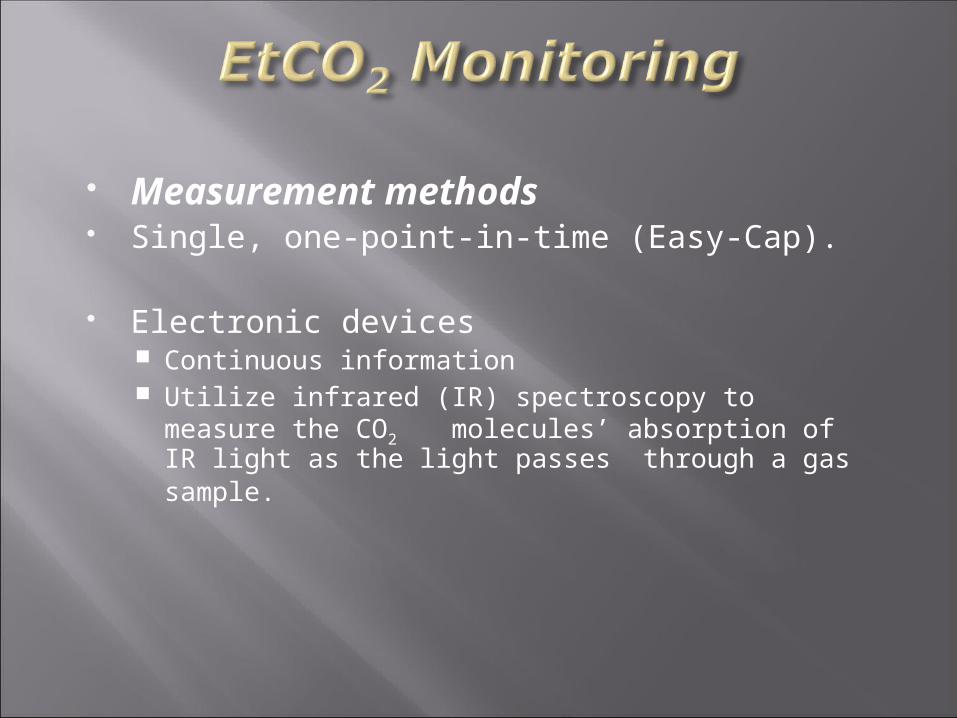
Measurement methods Single, one-point-in-time (Easy-Cap).
Electronic devices Continuous information Utilize infrared (IR) spectroscopy to measure the
CO2 molecules’ absorption of IR light as the light passes through a gas sample.

Electronic Devices: Mainstream
Located directly on the patient’s endotracheal tube Sidestream
Remote from the patient.
Mainstream sampling Occurs at the airway of an intubated patient Was not originally intended for use on non-intubated
patients. Heavy and bulky adapter and sensor assemblies may
make this method uncomfortable for non-intubated patients.
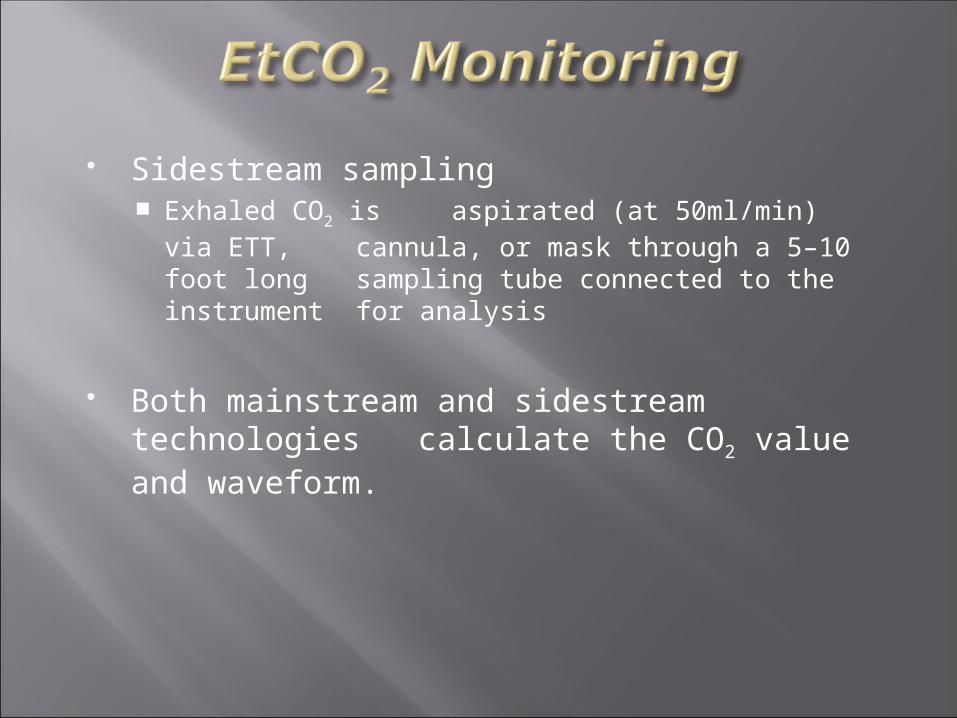
Sidestream sampling Exhaled CO2 is aspirated (at 50ml/min) via
ETT, cannula, or mask through a 5–10 foot long sampling tube connected to the instrument for analysis
Both mainstream and sidestream technologies calculate the CO2 value and waveform.
A new technology, Microstream, utilizes amodified sidestream sampling method,
and employs a microbeam IR sensor thatspecifically isolates the CO2
waveform.
Microstream can be used on both intubatedand non-intubated patients.
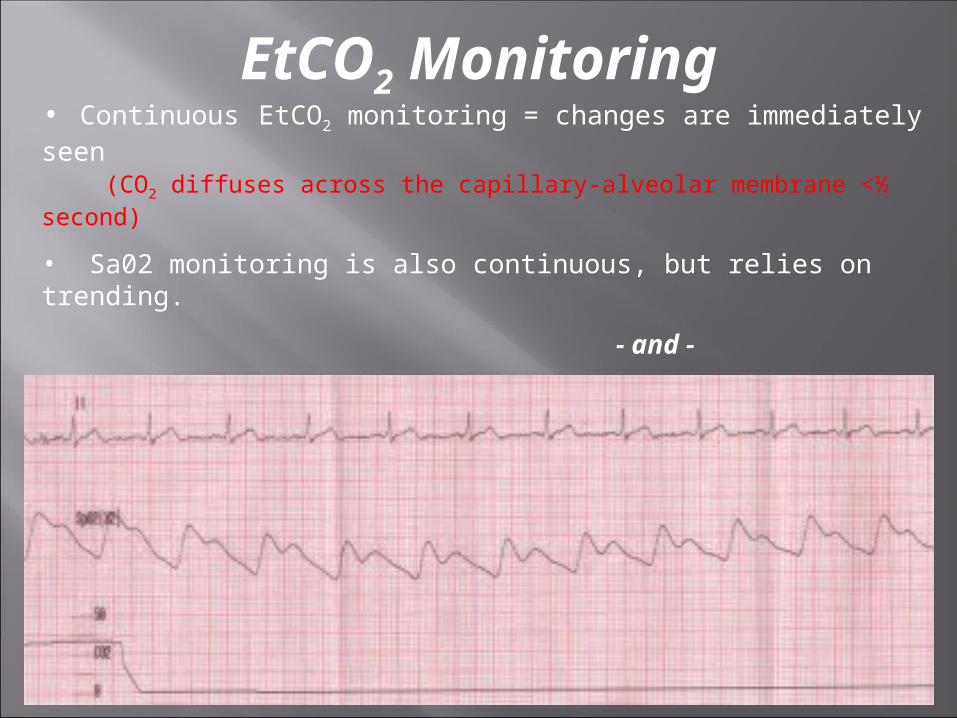
EtCO2 Monitoring• Continuous EtCO2 monitoring = changes are immediately seen (CO2 diffuses across the capillary-alveolar membrane <½ second)
• Sa02 monitoring is also continuous, but relies on trending.
- and -
• The oxygen content in blood can maintain for several minutesafter apnea (especially w/ pre-oxygenation)
Definitions
Tachypnea Abnormally rapid respiration
Hyperventilation Increased minute volume that results in lowered CO2
levels (hypocapnia)
Hypoventilation Reduced rate & depth of breathing that causes an
increase in carbon dioxide (hypercapnia)
EtCO2 Numerical Values (Ventilatory Assessment)
Normal = 35-45mmHg
< 35mmHg = Hyperventilation Respiratory alkalosis
> 45mmHg = Hypoventilation Respiratory acidosis
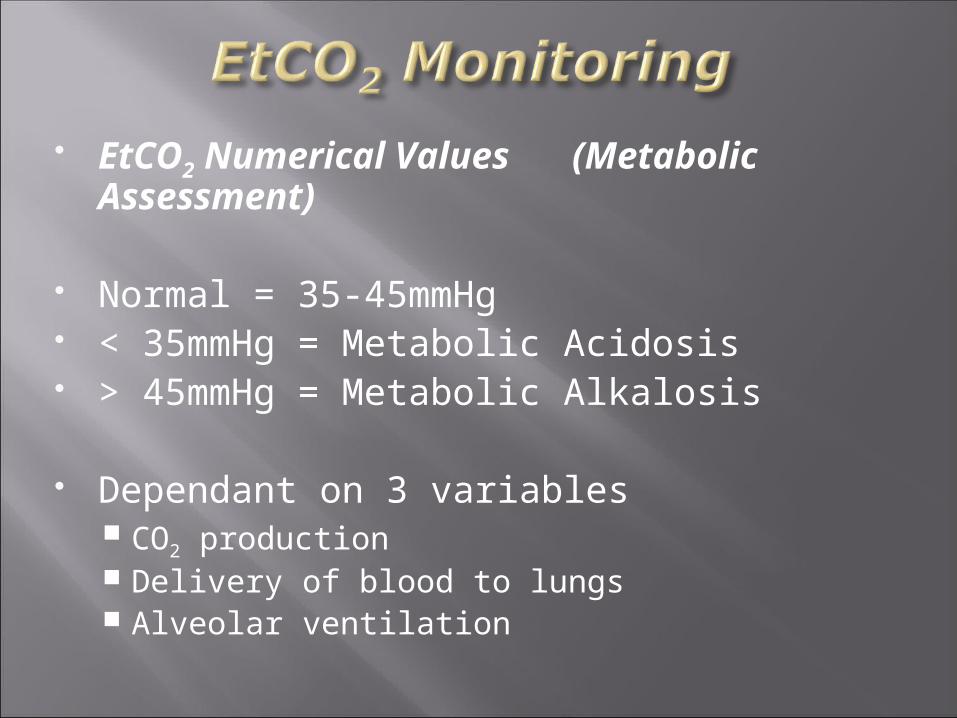
EtCO2 Numerical Values (Metabolic Assessment)
Normal = 35-45mmHg < 35mmHg = Metabolic Acidosis > 45mmHg = Metabolic Alkalosis
Dependant on 3 variables CO2 production Delivery of blood to lungs Alveolar ventilation
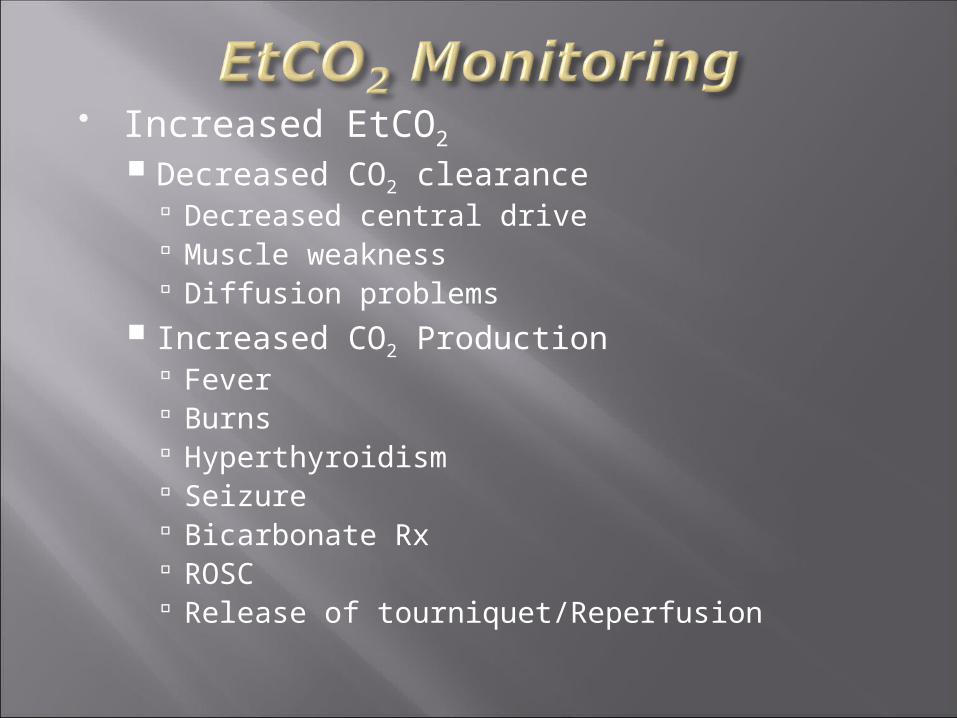
Increased EtCO2
Decreased CO2 clearance Decreased central drive Muscle weakness Diffusion problems
Increased CO2 Production Fever Burns Hyperthyroidism Seizure Bicarbonate Rx ROSC Release of tourniquet/Reperfusion
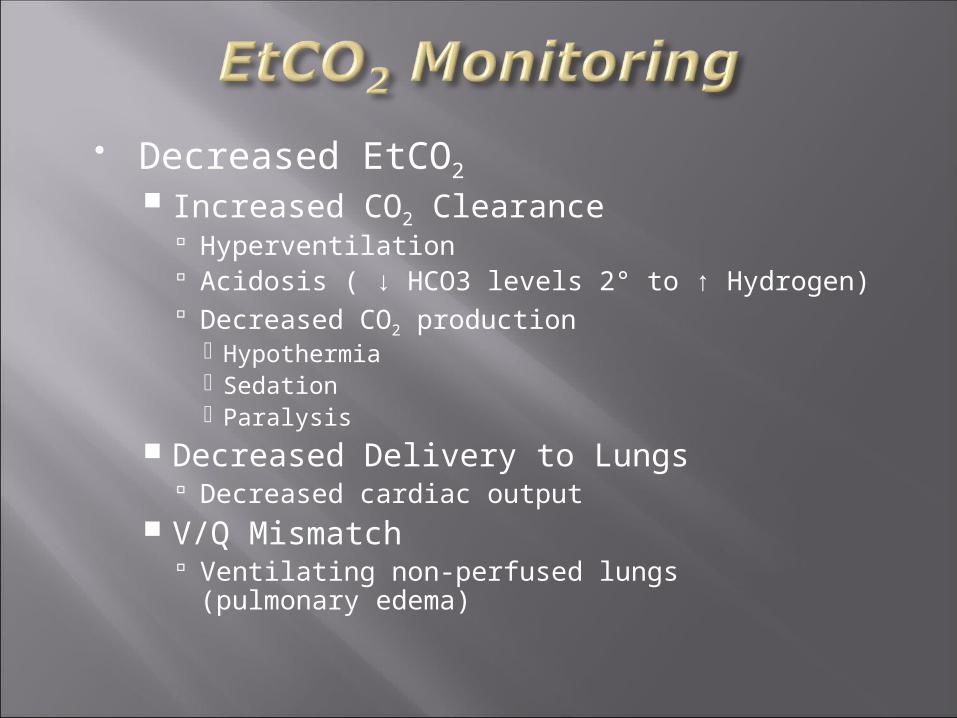
Decreased EtCO2
Increased CO2 Clearance Hyperventilation Acidosis ( ↓ HCO3 levels 2° to ↑ Hydrogen) Decreased CO2 production
Hypothermia Sedation Paralysis
Decreased Delivery to Lungs Decreased cardiac output
V/Q Mismatch Ventilating non-perfused lungs
(pulmonary edema)
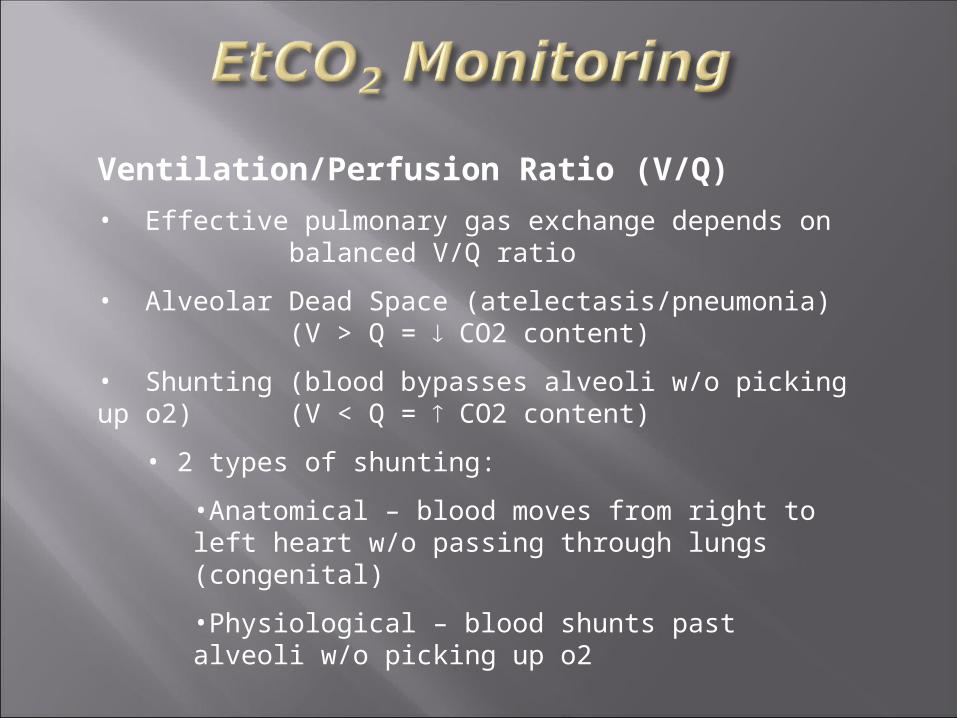
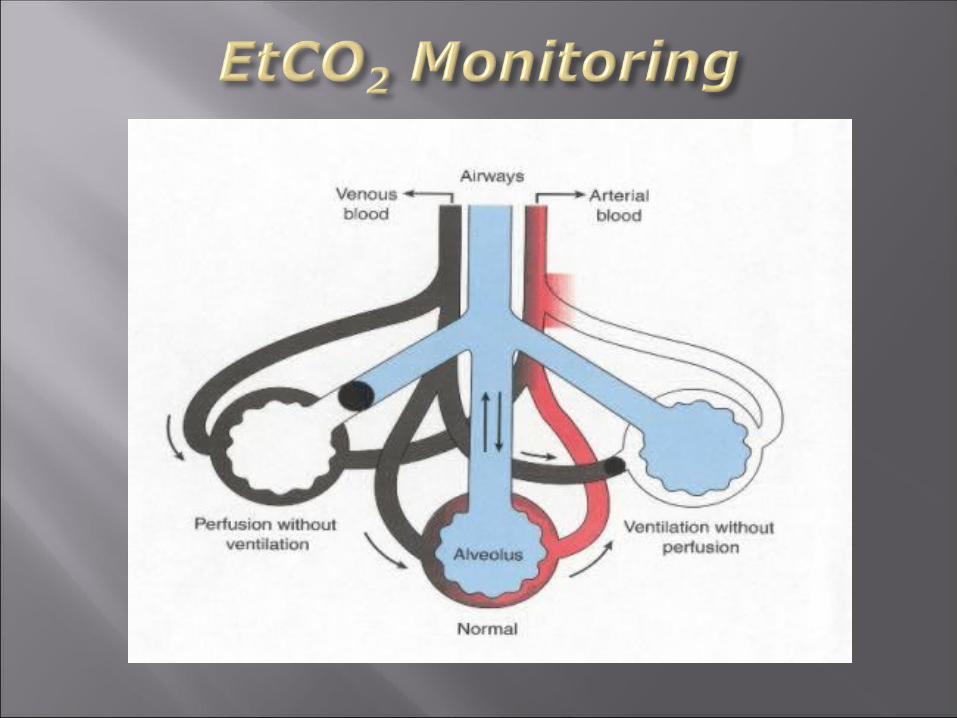
Ventilation/Perfusion Ratio (V/Q)
• Effective pulmonary gas exchange depends onbalanced V/Q ratio
• Alveolar Dead Space (atelectasis/pneumonia) (V > Q = CO2 content)
• Shunting (blood bypasses alveoli w/o picking up o2)(V < Q = CO2 content)
• 2 types of shunting:
•Anatomical – blood moves from right to left heart w/o passing through lungs (congenital)
•Physiological – blood shunts past alveoli w/o picking up o2
Ventilation/Perfusion Ratio (V/Q)
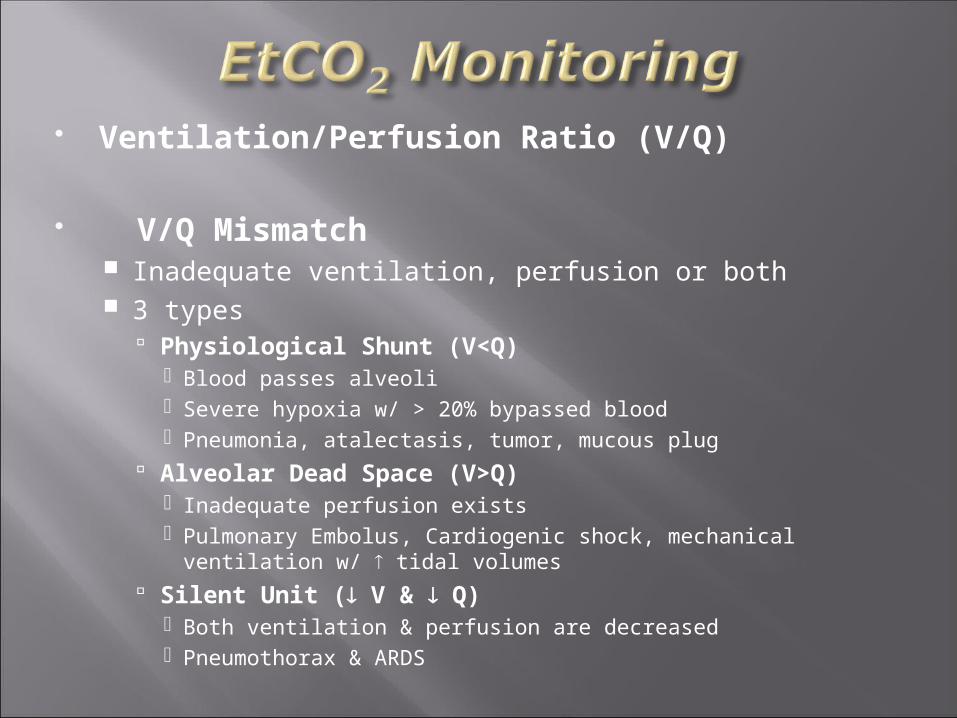
V/Q Mismatch Inadequate ventilation, perfusion or both 3 types
Physiological Shunt (V<Q) Blood passes alveoli Severe hypoxia w/ > 20% bypassed blood Pneumonia, atalectasis, tumor, mucous plug
Alveolar Dead Space (V>Q) Inadequate perfusion exists Pulmonary Embolus, Cardiogenic shock, mechanical ventilation w/
tidal volumes Silent Unit ( V & Q)
Both ventilation & perfusion are decreased Pneumothorax & ARDS

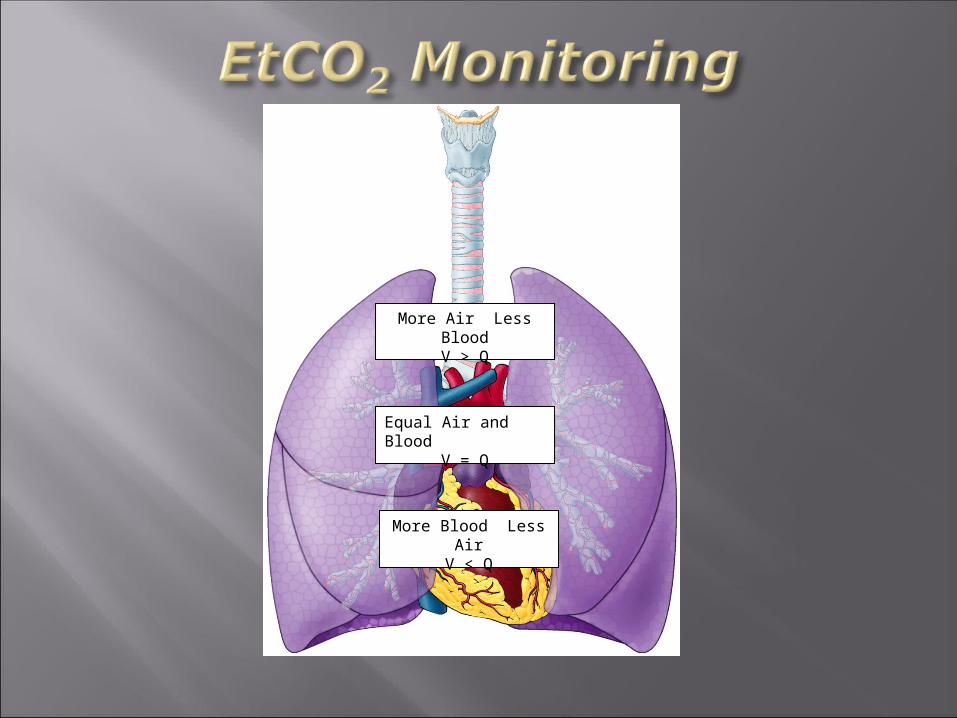
More Air Less BloodV > Q
Equal Air and BloodV = Q
More Blood Less Air
V < Q
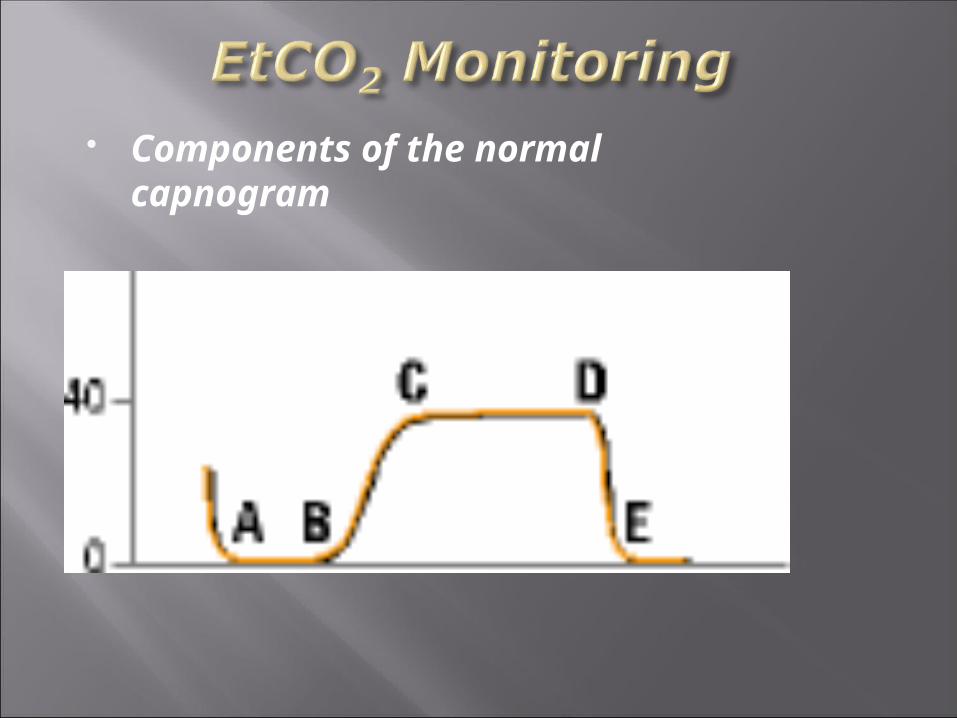
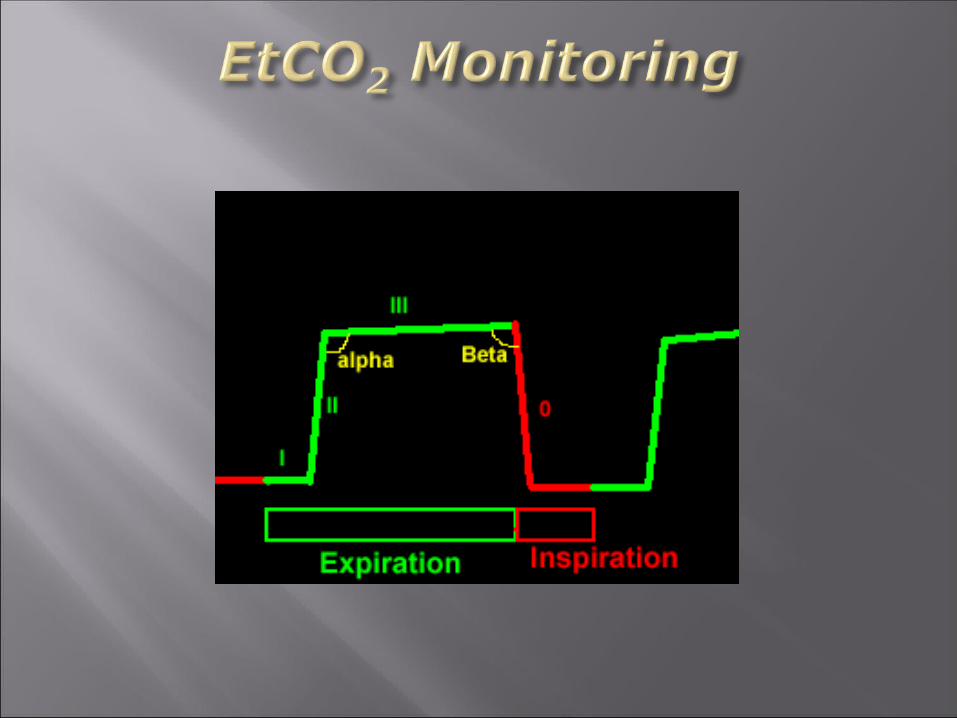
Components of the normalcapnogram
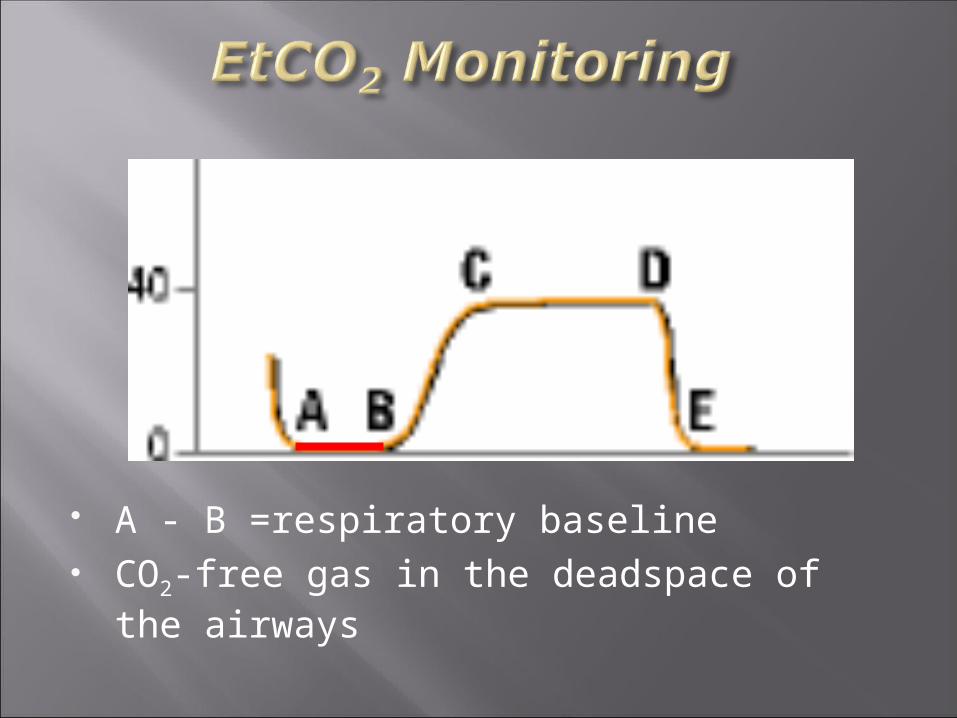
A - B =respiratory baseline CO2-free gas in the deadspace of the
airways
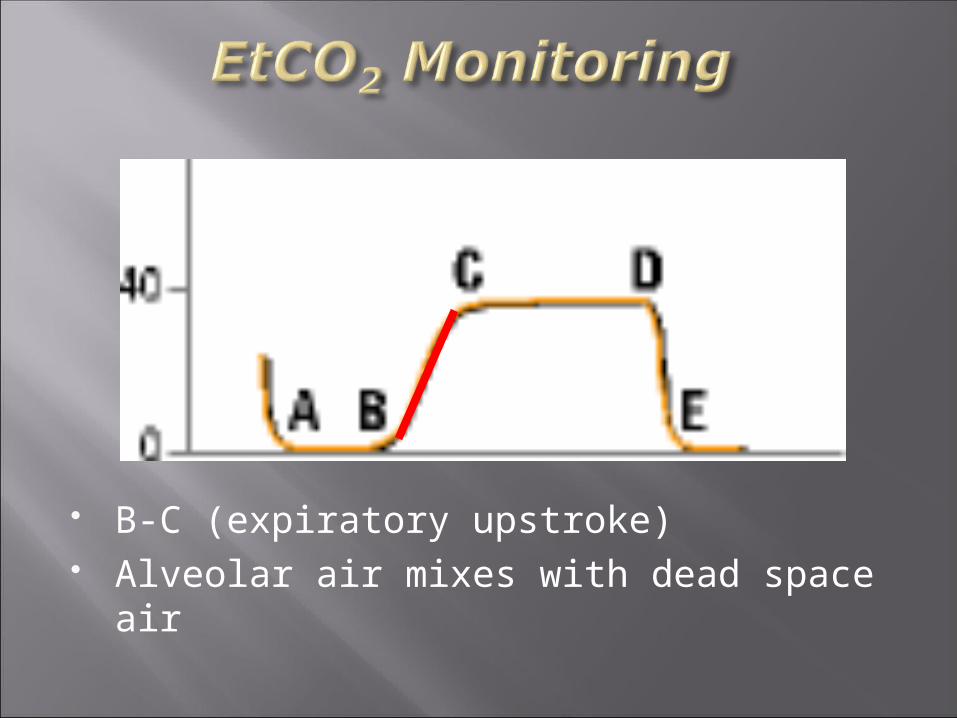
B-C (expiratory upstroke) Alveolar air mixes with dead space air
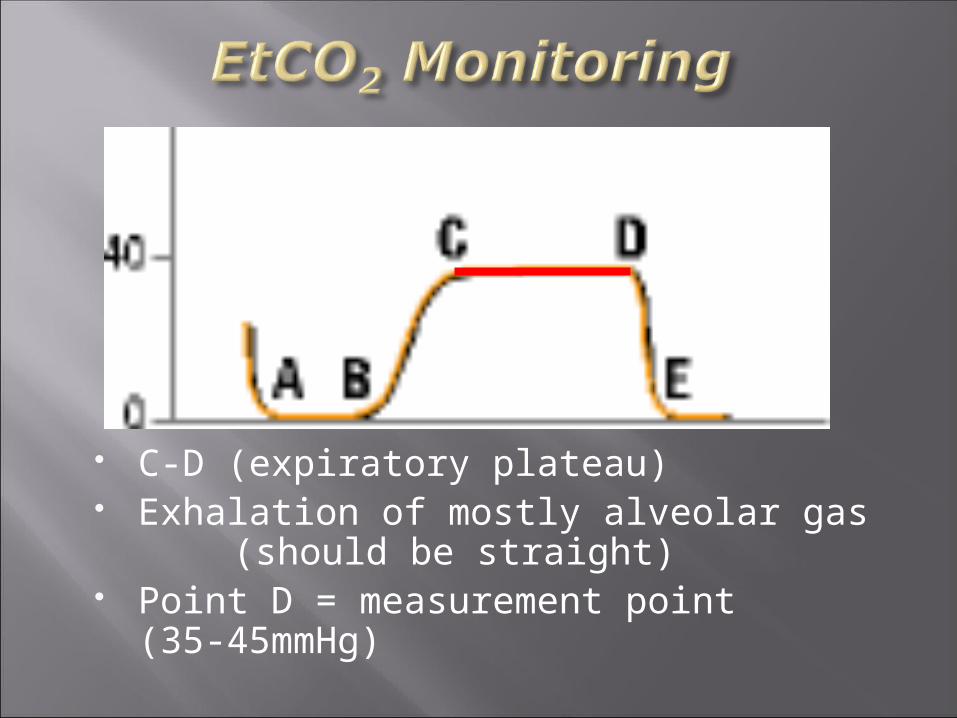
C-D (expiratory plateau) Exhalation of mostly alveolar gas
(should be straight) Point D = measurement point
(35-45mmHg)
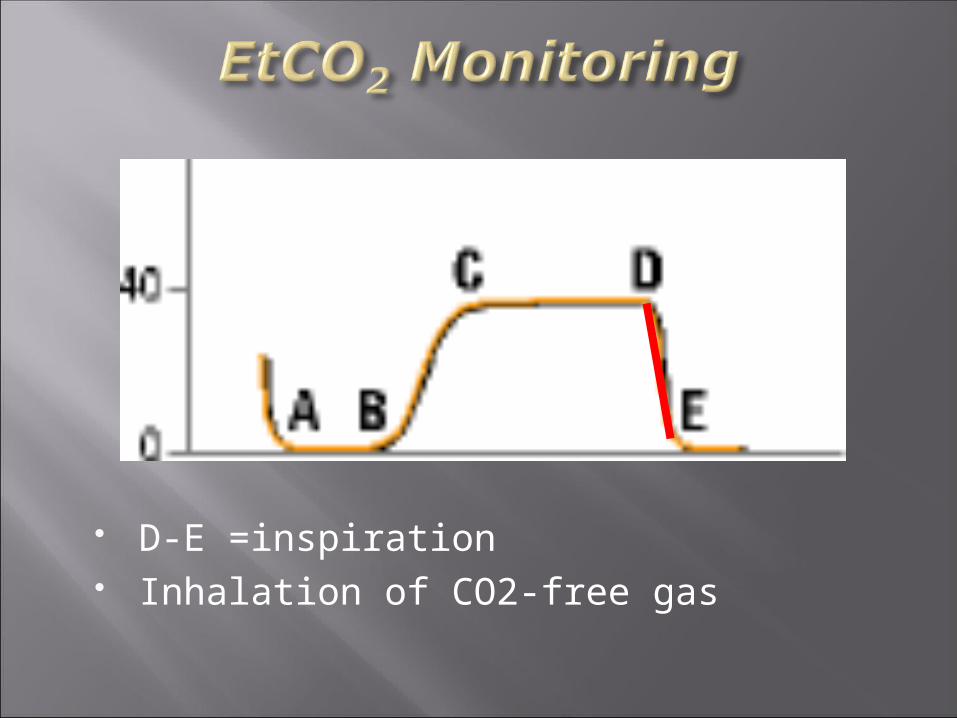
D-E =inspiration Inhalation of CO2-free gas
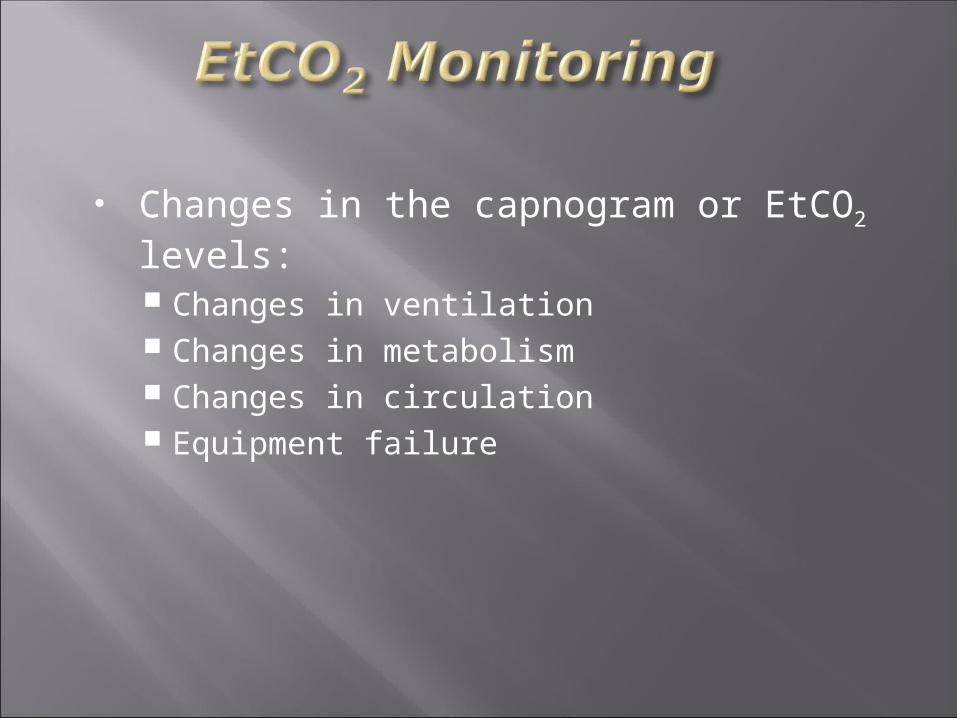
Changes in the capnogram or EtCO2 levels: Changes in ventilation Changes in metabolism Changes in circulation Equipment failure
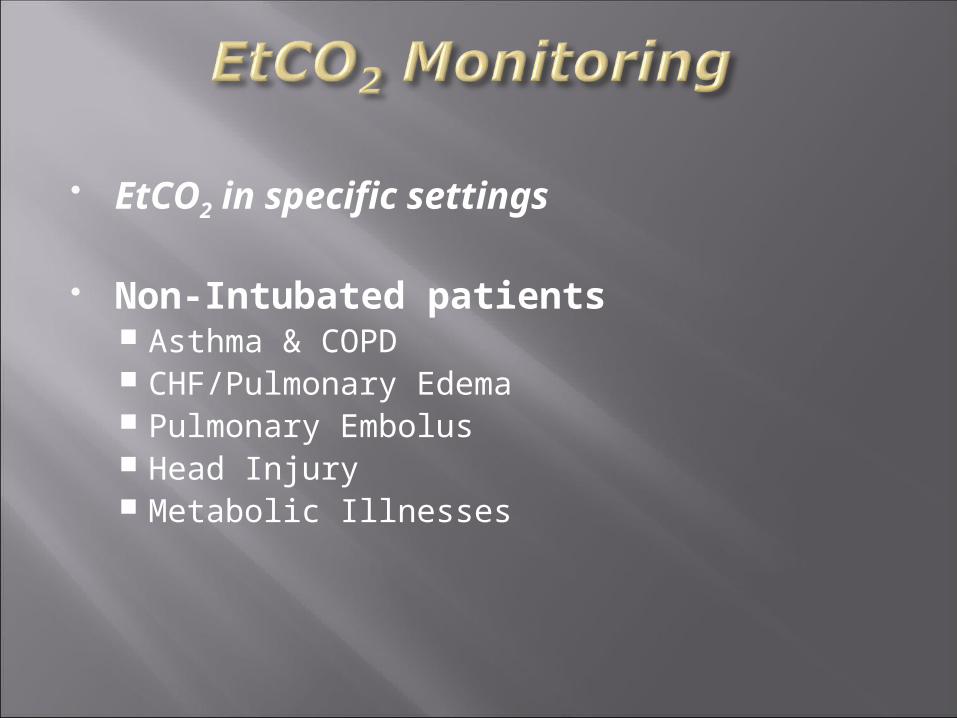
EtCO2 in specific settings
Non-Intubated patients Asthma & COPD CHF/Pulmonary Edema Pulmonary Embolus Head Injury Metabolic Illnesses
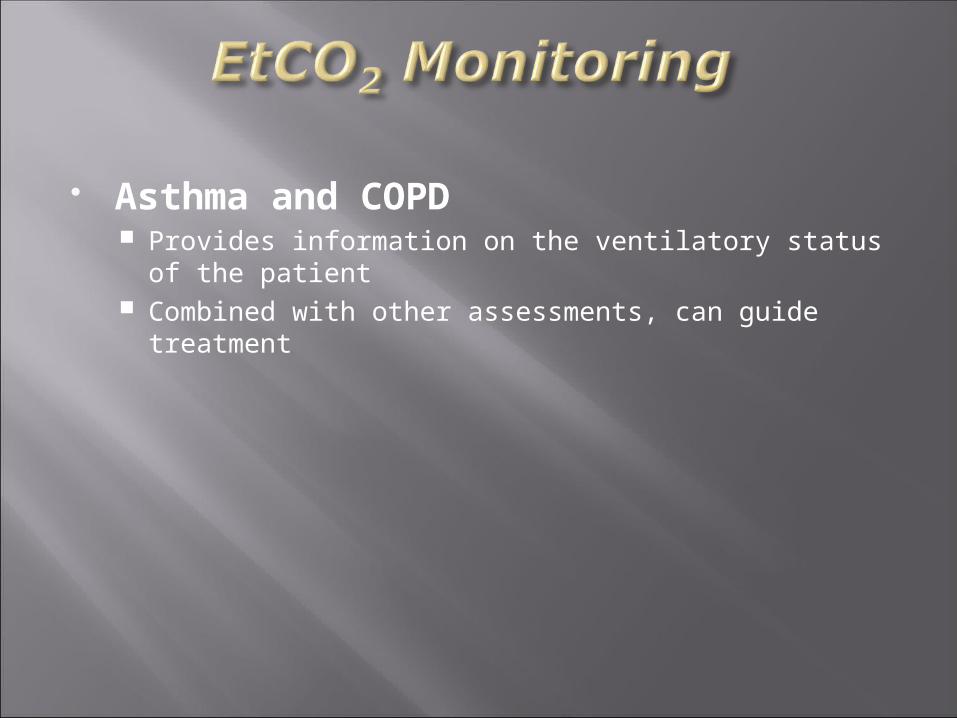
Asthma and COPD Provides information on the ventilatory status of the
patient Combined with other assessments, can guide treatment
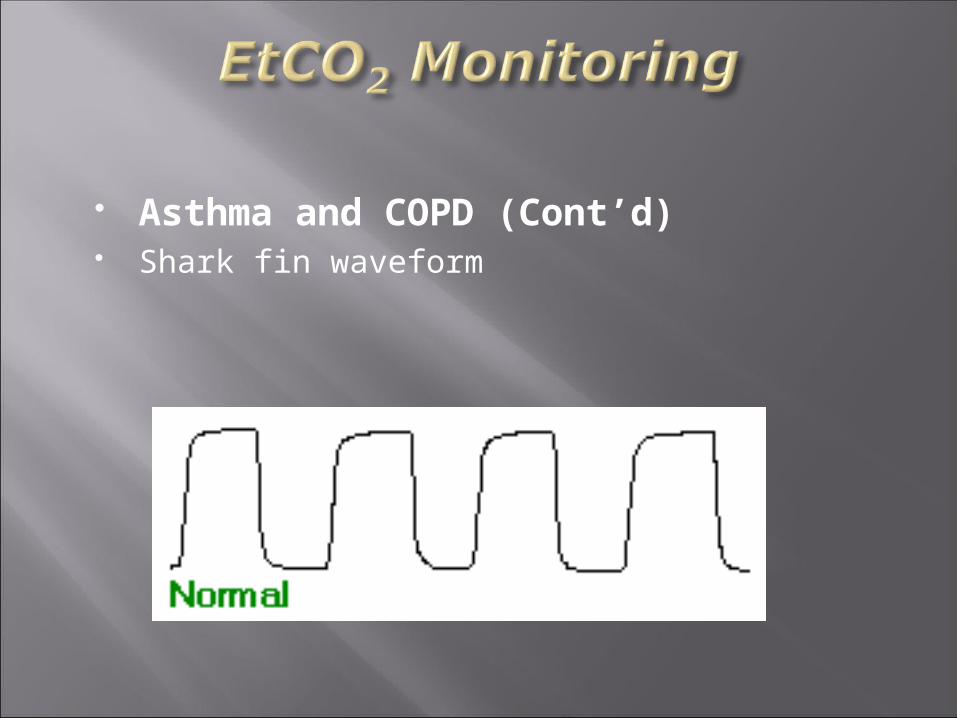
Asthma and COPD (Cont’d) Shark fin waveform
Asthma and COPD (Cont’d) Ventilatory assistance and/or intubation
may be considered with severe dyspneaand respiratory acidosis (EtCO2 >50mmHg)
18% of ventilated asthma patients suffer atension pneumothorax
New ACLS standards recommend ETI forasthma patients who deteriorate despiteaggressive treatment.
Emphysema
EtCO2 & CHF/Pulmonary Edema Wave forms will be normal (there is no
bronchospasm) Values may be increased (hypoventilation) or
decreased (hyperventilation)
Pulmonary Embolus
“Normal” waveform but low numerical value(why?)
Look for other signs and symptoms
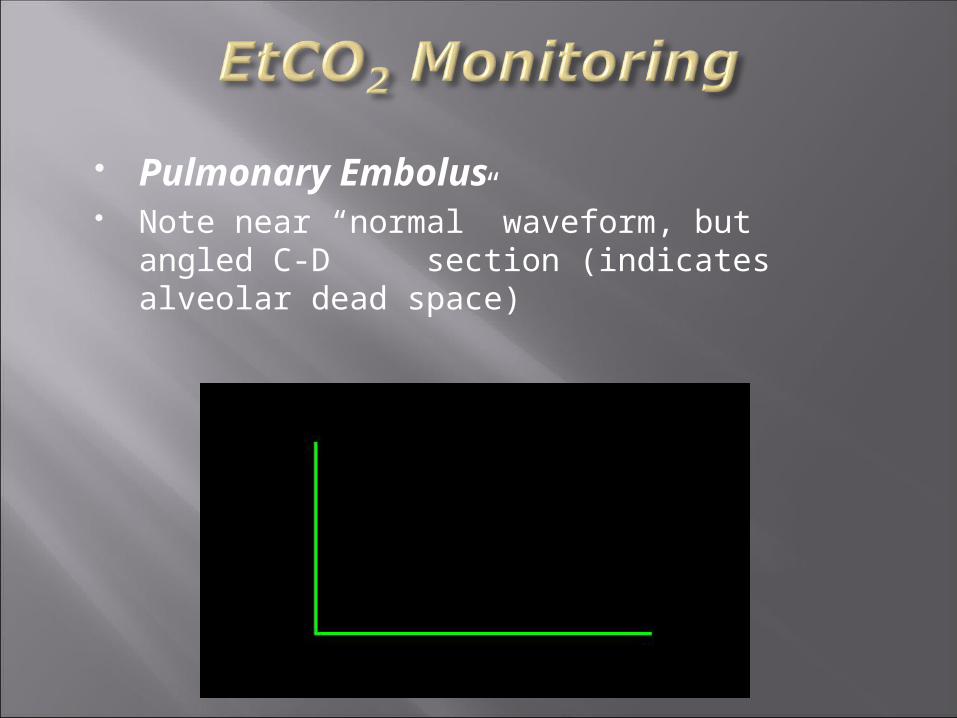
Pulmonary Embolus Note near “normal” waveform, but angled C-
D section (indicates alveolar dead space)
EtC02 is very useful in monitoring intubated head- injured patients.
Hyperventilation = Hypocapnia = Cerebral Ischemia
Target EtC02 value of 35-38 mmHg
Head Injury
Hypothermia
Hyperventilation

Hypoventilation

EtCO2 in the Intubated Patient
Identifies esophageal intubations & accidental extubations (head/neck motion can cause ETT movement of 5 cm)
Waveforms/numerical values are absentor greatly diminished
Do not rely on capnography alone to assureintubation!
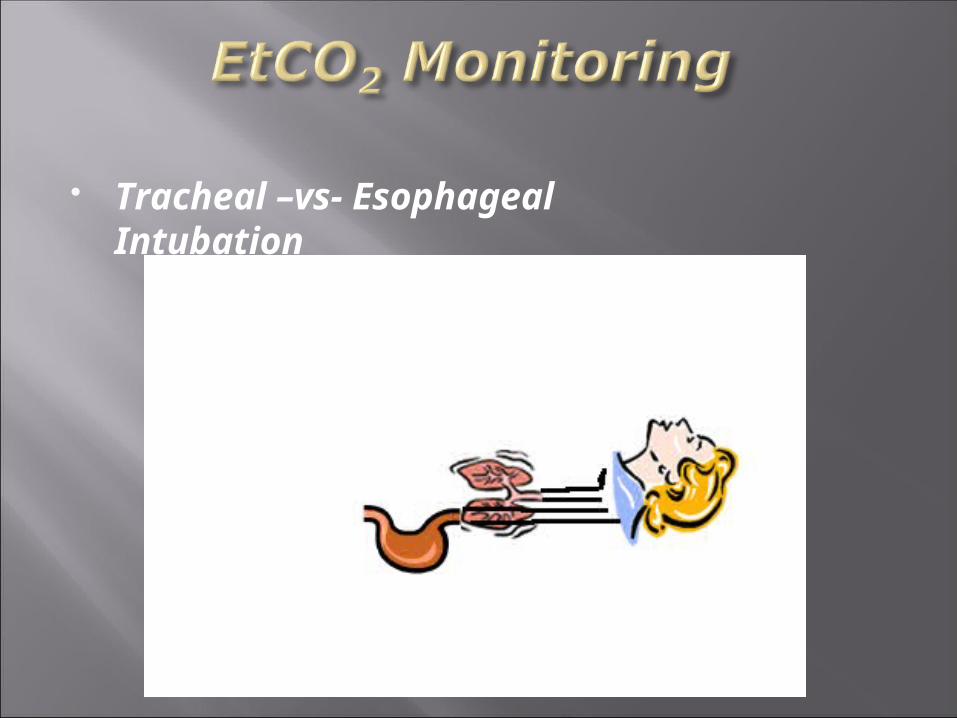
Tracheal –vs- Esophageal Intubation

Esophageal Intubation
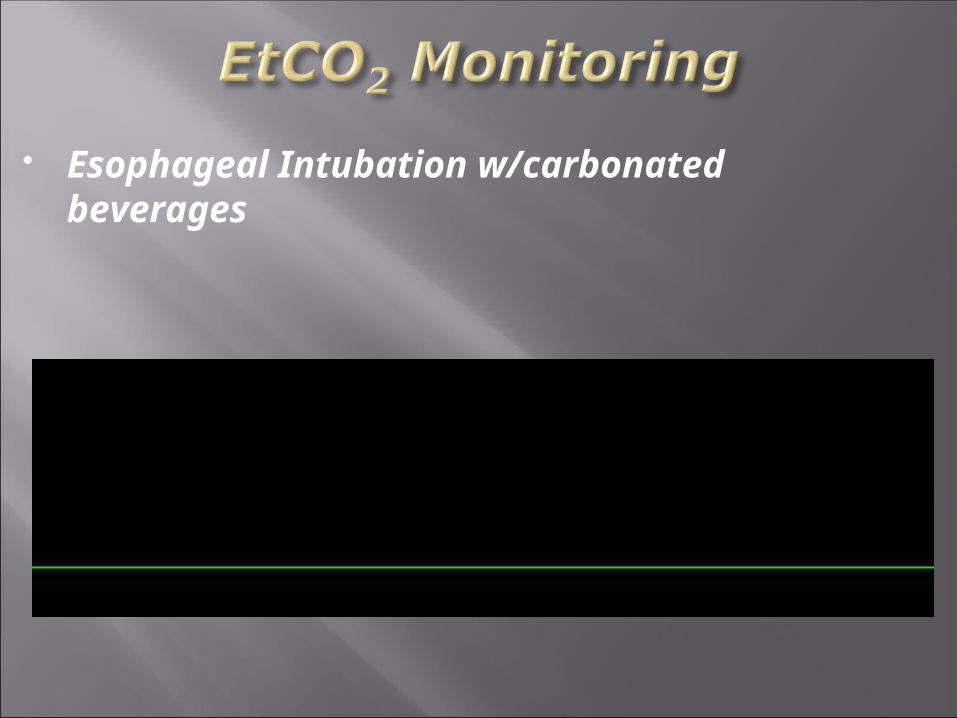
Esophageal Intubation w/carbonatedbeverages
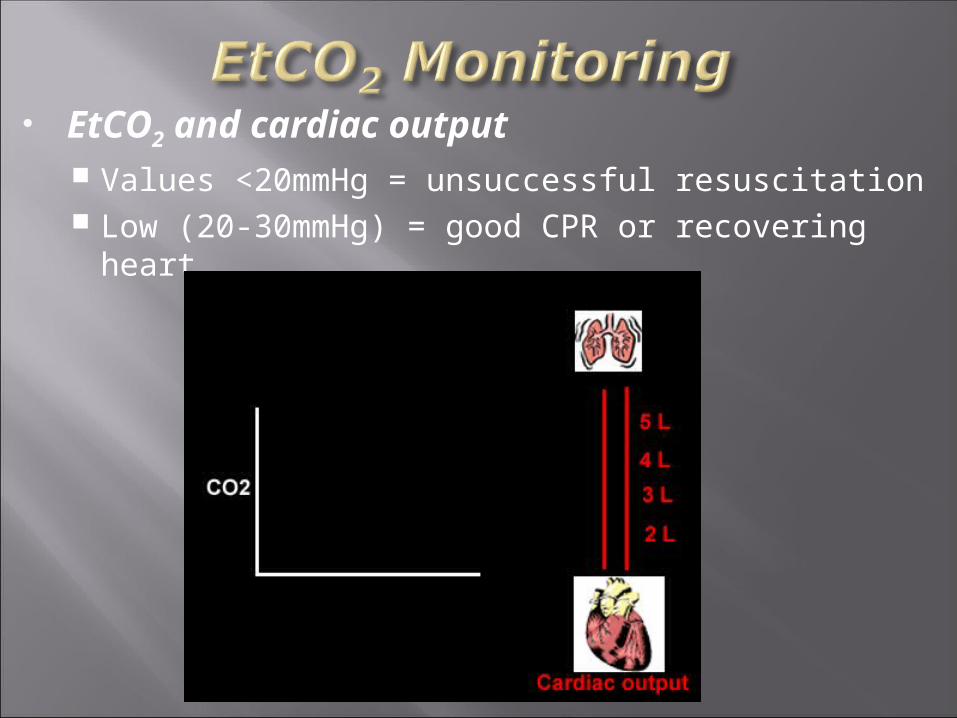
EtCO2 and cardiac output Values <20mmHg = unsuccessful resuscitation Low (20-30mmHg) = good CPR or recovering heart
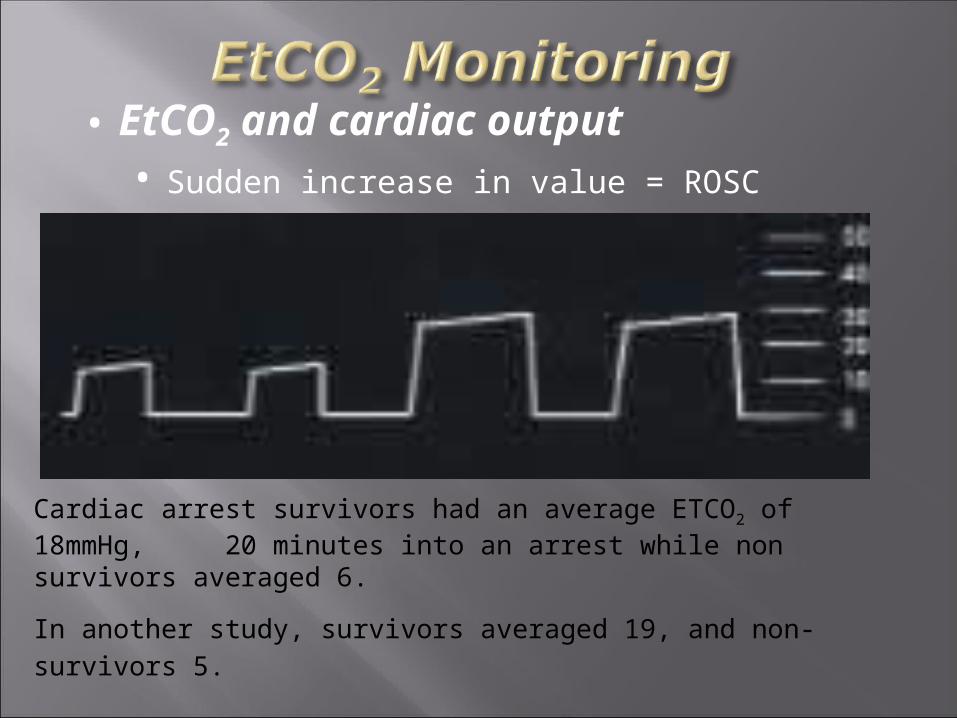
• EtCO2 and cardiac output• Sudden increase in value = ROSC
Cardiac arrest survivors had an average ETCO2 of 18mmHg, 20 minutes into an arrest while non survivors averaged 6.
In another study, survivors averaged 19, and non-survivors 5.
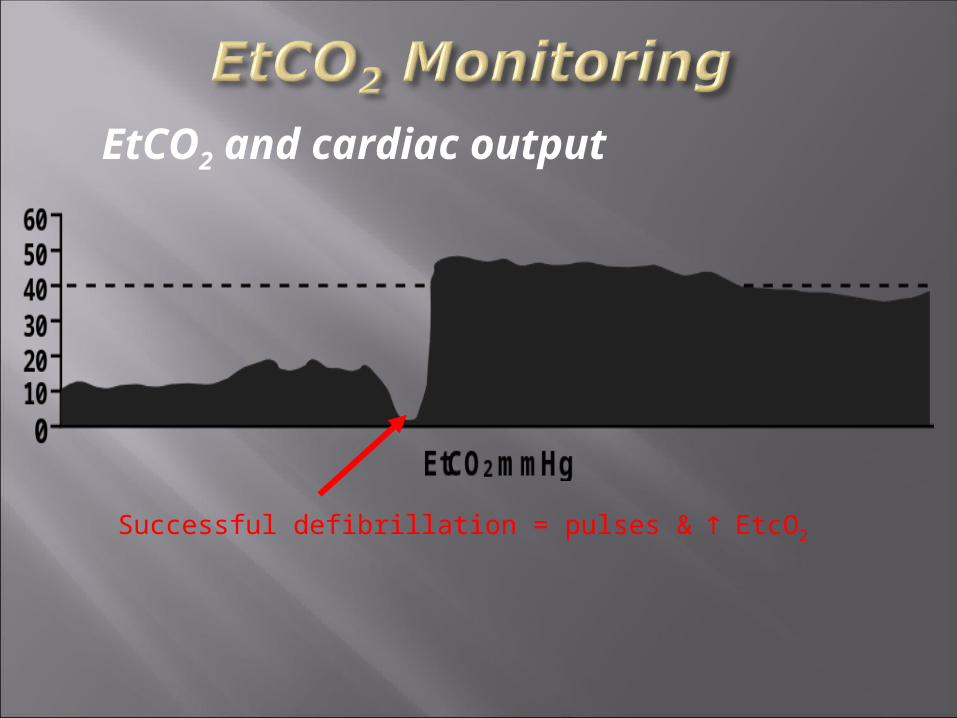
EtCO2 and cardiac output
Successful defibrillation = pulses & EtcO2
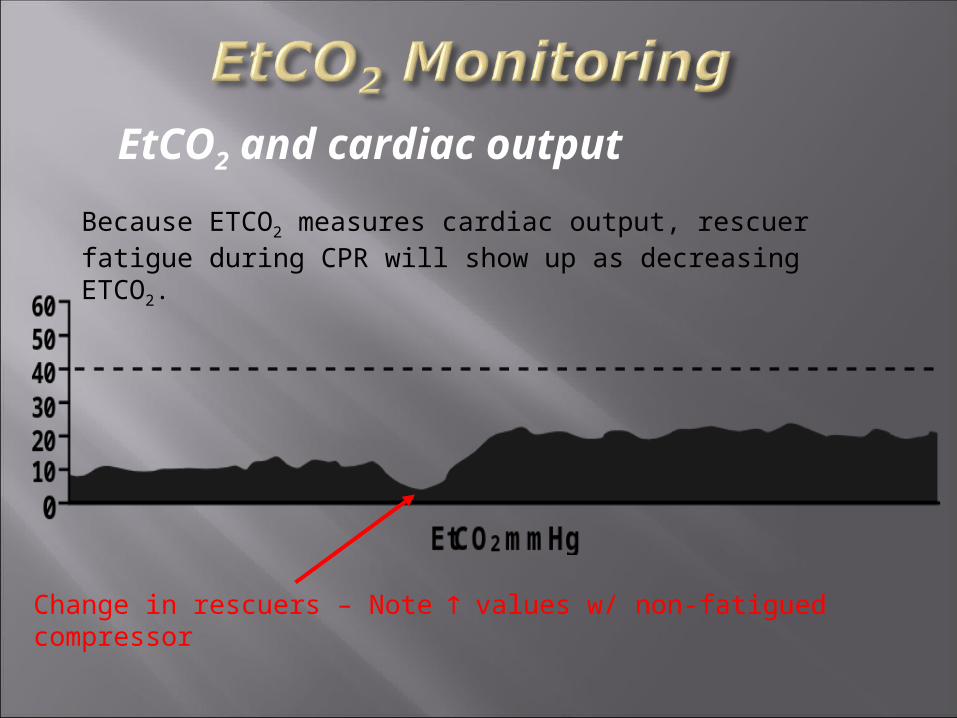
EtCO2 and cardiac output
Because ETCO2 measures cardiac output, rescuer fatigue during CPR will show up as decreasing ETCO2.
Change in rescuers – Note values w/ non-fatigued compressor
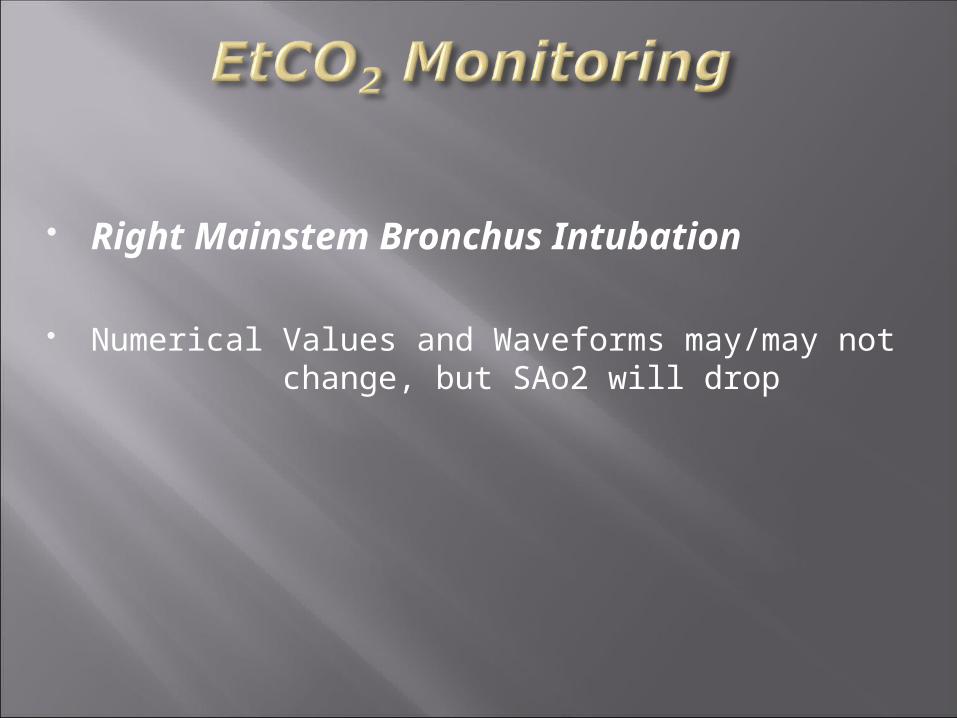
Right Mainstem Bronchus Intubation
Numerical Values and Waveforms may/may notchange, but SAo2 will drop
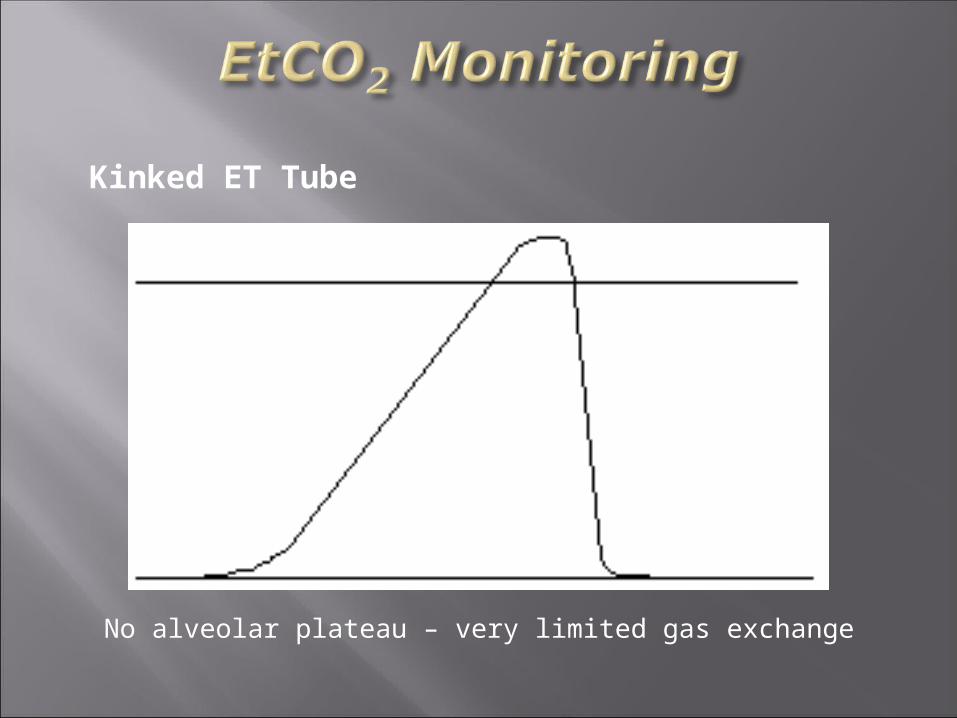
Kinked ET Tube
No alveolar plateau – very limited gas exchange

Spontaneous Respirations in the paralyzed patient (Curare Cleft)
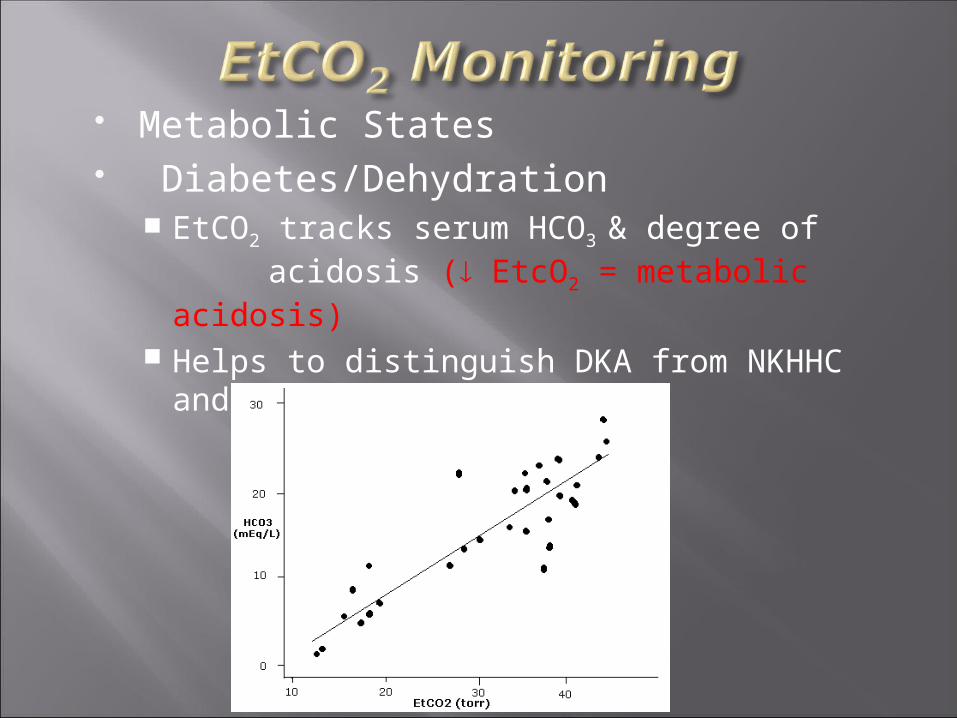
Metabolic States Diabetes/Dehydration
EtCO2 tracks serum HCO3 & degree ofacidosis ( EtcO2 = metabolic
acidosis) Helps to distinguish DKA from NKHHC and
dehydration
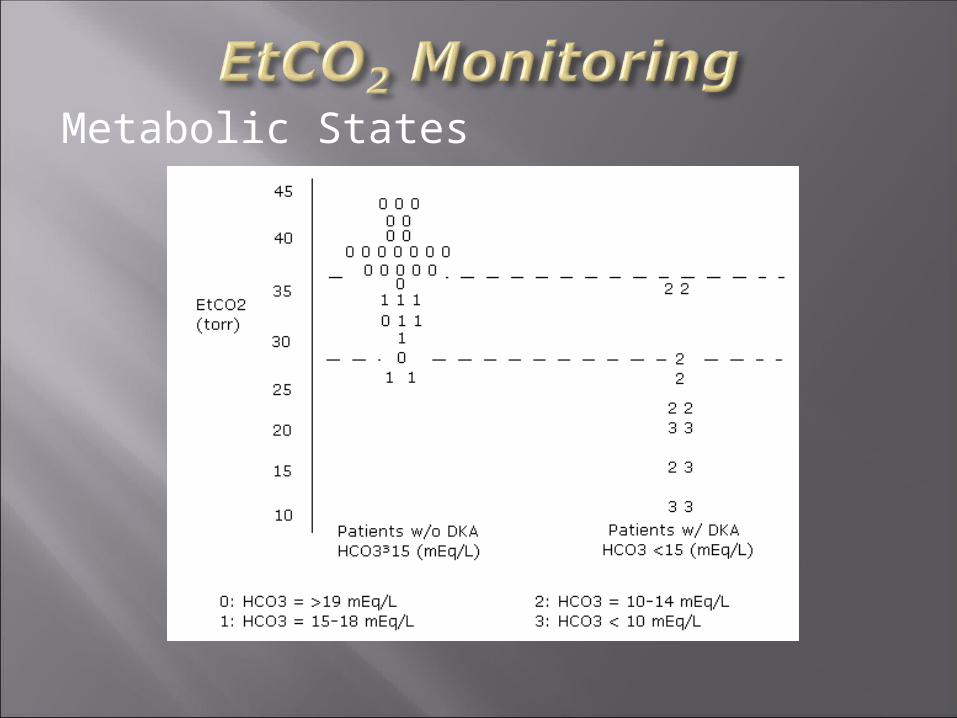
Metabolic States
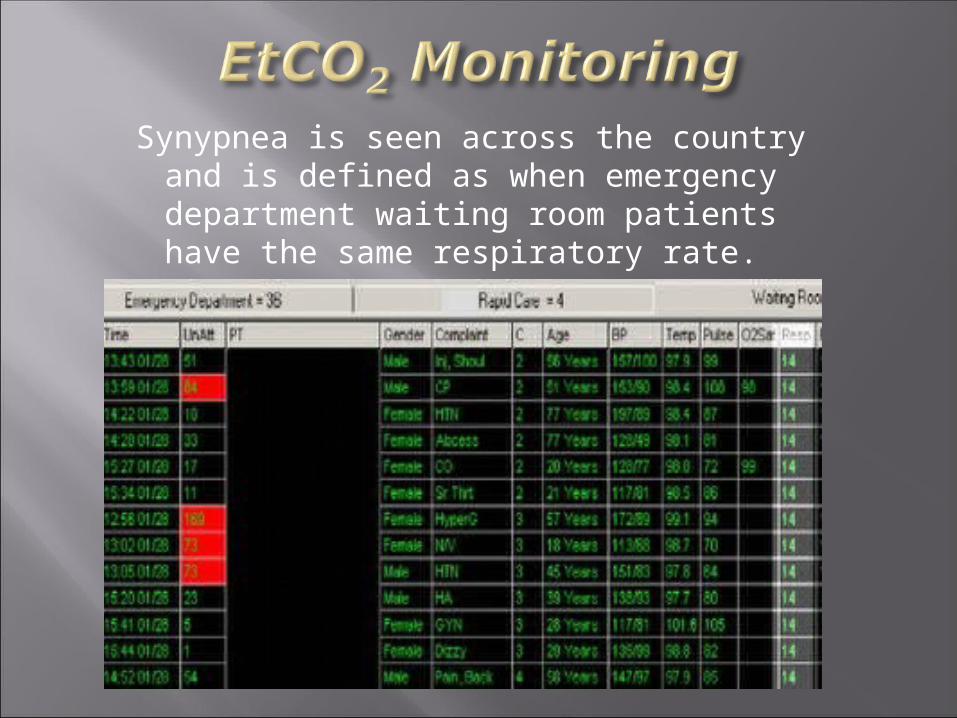
Synypnea is seen across the country and is defined as when emergency
department waiting room patients have the same respiratory rate.

TroubleshootingSudden increase in EtCO2
Malignant HyperthermiaVentilation of previously unventilated lung
Increase of blood pressureRelease of tourniquet
Bicarb causes a temporary <2 minute rise in ETCO2
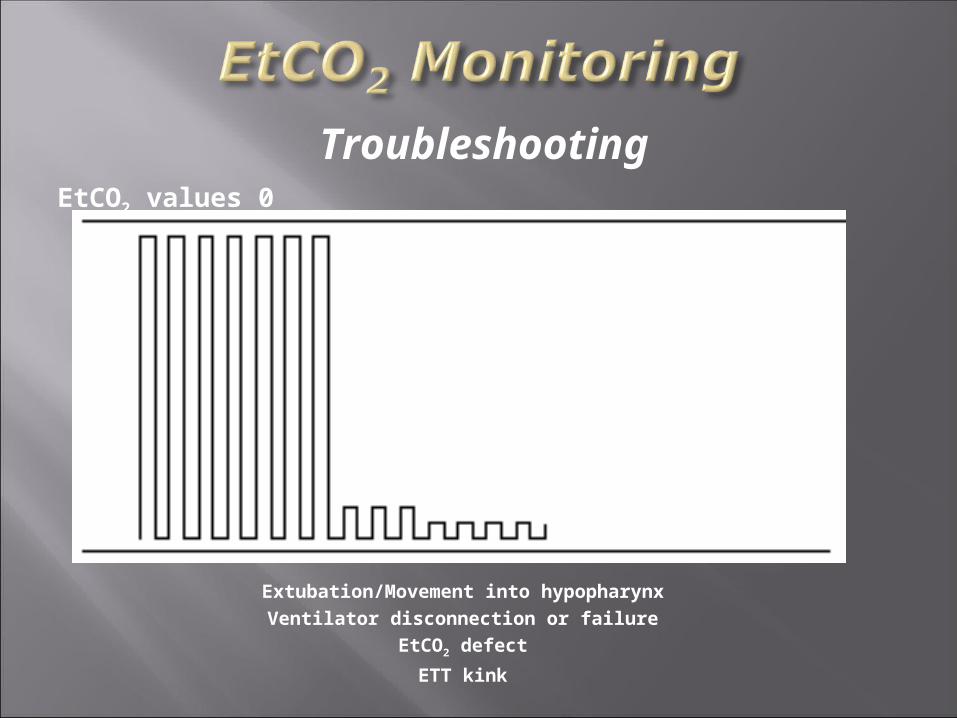
EtCO2 values 0
Extubation/Movement into hypopharynxVentilator disconnection or failure
EtCO2 defect
ETT kink
Troubleshooting
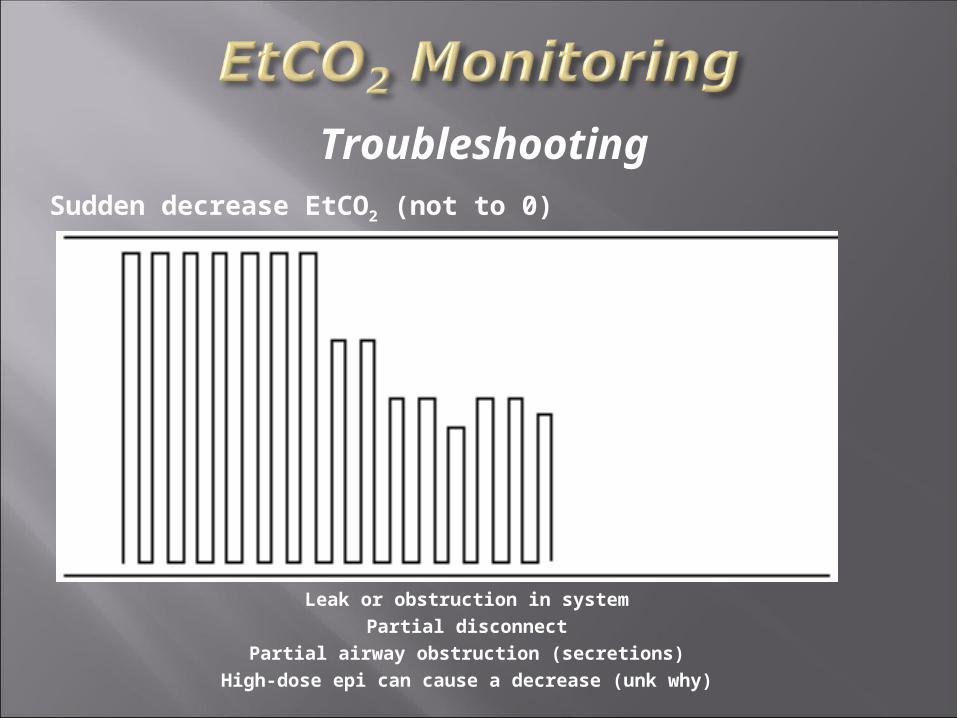
Sudden decrease EtCO2 (not to 0)
Leak or obstruction in systemPartial disconnect
Partial airway obstruction (secretions)High-dose epi can cause a decrease (unk why)
Troubleshooting

Change in Baseline
Calibration errorMechanical failureWater in system
Troubleshooting
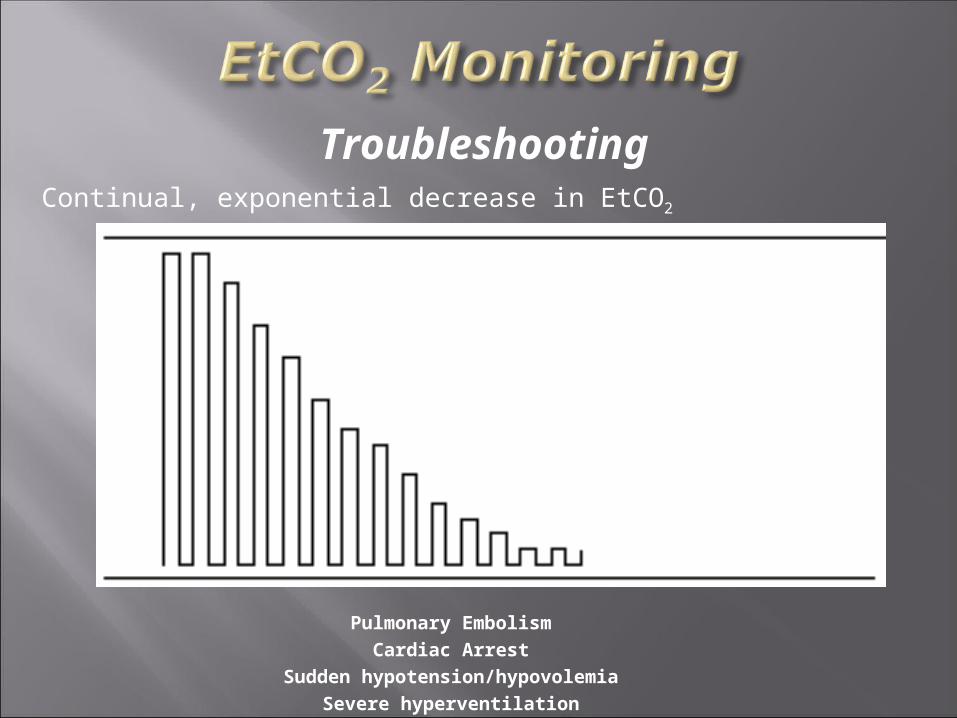
Continual, exponential decrease in EtCO2
Pulmonary EmbolismCardiac Arrest
Sudden hypotension/hypovolemiaSevere hyperventilation
Troubleshooting

Gradual increase in EtCO2
Rising body temperatureHypoventilation
Partial airway obstruction (foreign body)Reactive airway disease
Troubleshooting

Many special thanks to: JEMS Magazine (http://www.jems.com/)
Peter Canning, EMT-P (http://emscapnography.blogspot.com/)
Dr. Baruch Krauss ([email protected])
Bhavani-Shankar Kodali MD (http://www.capnography.com/)
Bob Page, AAS, NREMT-P, CCEMT-P
Steve Berry (https://www.iamnotanambulancedriver.com/mm5/merchant.mvc?)
Dr. Reuben Strayer ([email protected])
UTSW/BIOTEL EMS SYSTEM (http://www.utsouthwestern.edu/)
Oridion Medical Systems (http://www.oridion.com/global/english/home.html)
Blogborgymi (http://blogborygmi.blogspot.com/)
University of Adelaide, South Australia
(http://www.health.adelaide.edu.au/paed-anaes/talks/CO2/capnography.html)