Embed Size (px)
Citation preview
- science of green technology
Transcription analysis of glucose de-repressed Aspergillus nidulans mutant
using Febit Geniom® One system
By Ph.D student Jesper MogensenCenter for Microbial Biotechnology&H. Bjørn NielsenCenter for Biological Sequence Analysis
CMB/CBS
H. Bjørn Nielsen, Microarray workshop, August 2004, Thailand Slide 2
Why this project?
We would like to be the first to publish results using ”full-genome” oligonucleotide array for Aspergillus nidulans
It was decided to compare the wild-type A. nidulans against a glucose de-repressed creA mutant because of the severe effects observed in this mutant (change in morphology)
It was decided to use the two most different growth conditions (repressing and non-repressing) in shake-flask experiments to avoid time consuming fermentations
CMB/CBS
H. Bjørn Nielsen, Microarray workshop, August 2004, Thailand Slide 3
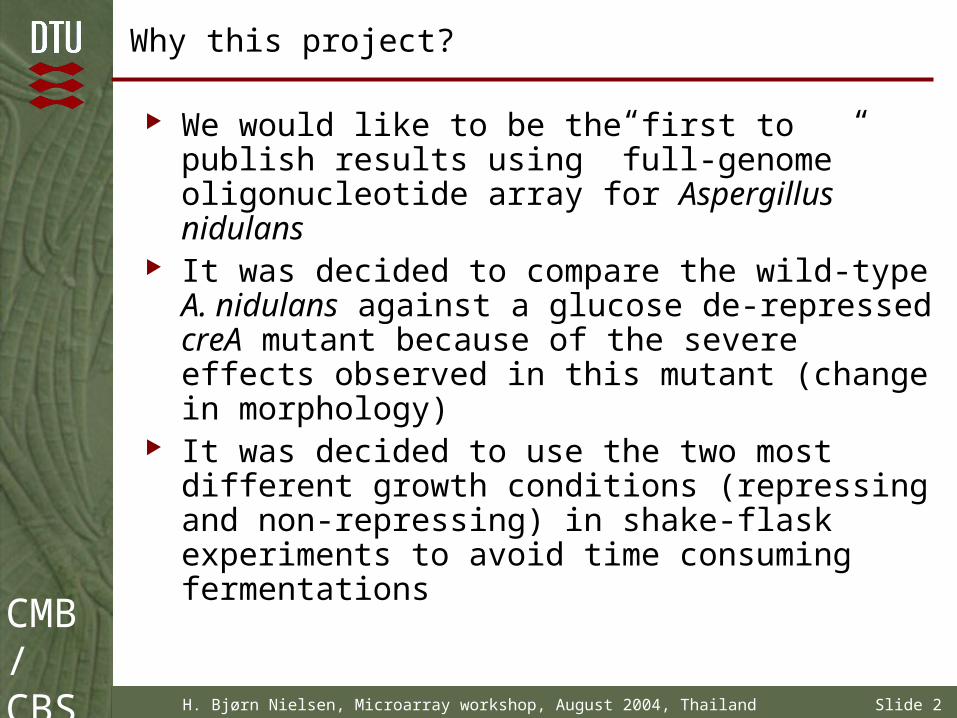
Why is Aspergillus nidulans interesting?
Aspergillus nidulans is interesting because: More than 55 years of genetic experience Can grow on complex substrates It is ”easy” to work with in the laboratory Is used as model organism Sequence available for A. nidulans (Broad Institute)
CMB/CBS
H. Bjørn Nielsen, Microarray workshop, August 2004, Thailand Slide 4
CreA: The history
CreA = carbon (catabolite) repressor Discovered in a study about nitrogen metabolite
repression in A. nidulans in 1973 (Arst et al. 1973) Metabolically favourable carbon sources such as D-
glucose are preferred, and when these are available, enzymes and permeases that allow the utilization of alternative carbon sources are not produced
The corresponding repressor in S. cerevisiae is called Mig1 (which is more intensively studied than CreA)
CMB/CBS
H. Bjørn Nielsen, Microarray workshop, August 2004, Thailand Slide 5
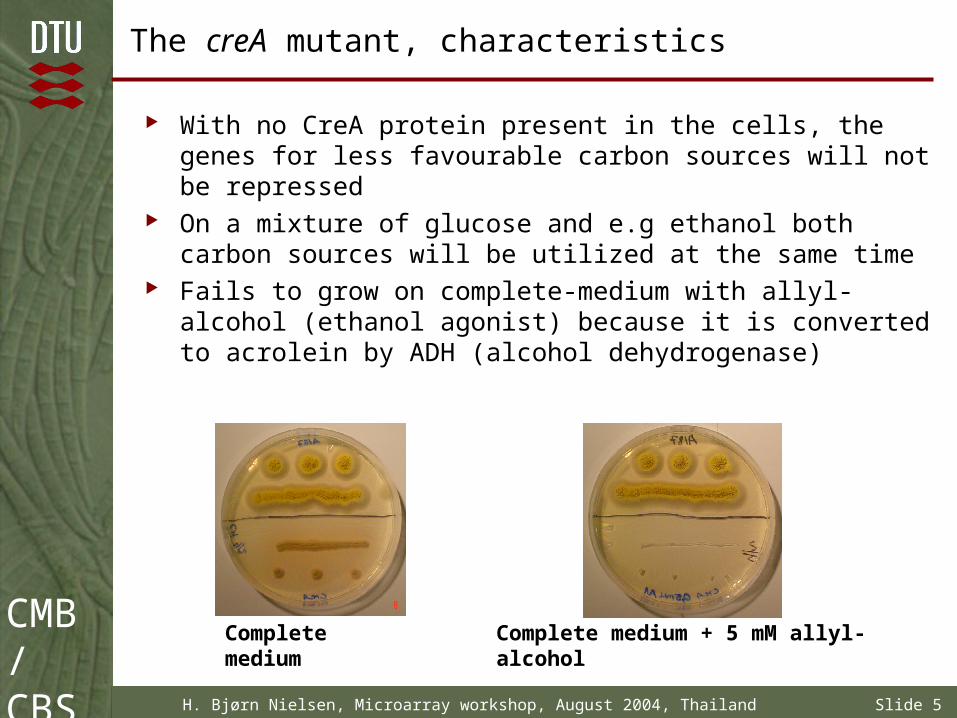
The creA mutant, characteristics
With no CreA protein present in the cells, the genes for less favourable carbon sources will not be repressed
On a mixture of glucose and e.g ethanol both carbon sources will be utilized at the same time
Fails to grow on complete-medium with allyl-alcohol (ethanol agonist) because it is converted to acrolein by ADH (alcohol dehydrogenase)
Complete medium Complete medium + 5 mM allyl-alcohol
CMB/CBS
H. Bjørn Nielsen, Microarray workshop, August 2004, Thailand Slide 6
CreA…what is known in Aspergillus?
CreA inhibits transcription of many genes by binding to specific sequences in the promoter of these genes:1. Catabolism of less preferred carbon sources
2. Gluconeogenic and glyoxalate cycle enzymes
3. Genes related to secondary metabolism (e.g. penicillin)
Northern blot analysis of creA mRNA reveals a complex expression profile dependent on carbon source
Strong repressing carbon sources: glucose, xylose, sucrose and acetate
Intermediate repressing carbon sources: mannose, maltose, fructose, mannitol and galactose
Non repressing carbon sources: glycerol, lactose, arabinose and ethanol
CMB/CBS
H. Bjørn Nielsen, Microarray workshop, August 2004, Thailand Slide 7
CreA…what is missing?
General overview of affected genes in creA deleted mutant using transcription analysis
Understanding the interaction with CreB, CreC and/or other regulating proteins
Understanding the mechanism behind the CreA induction and repression
Understanding the pleiotropic effects Pleiotropism: The control by a single gene of several
distinct and seemingly unrelated phenotypic effects (e.g. morphology)
CMB/CBS
H. Bjørn Nielsen, Microarray workshop, August 2004, Thailand Slide 8
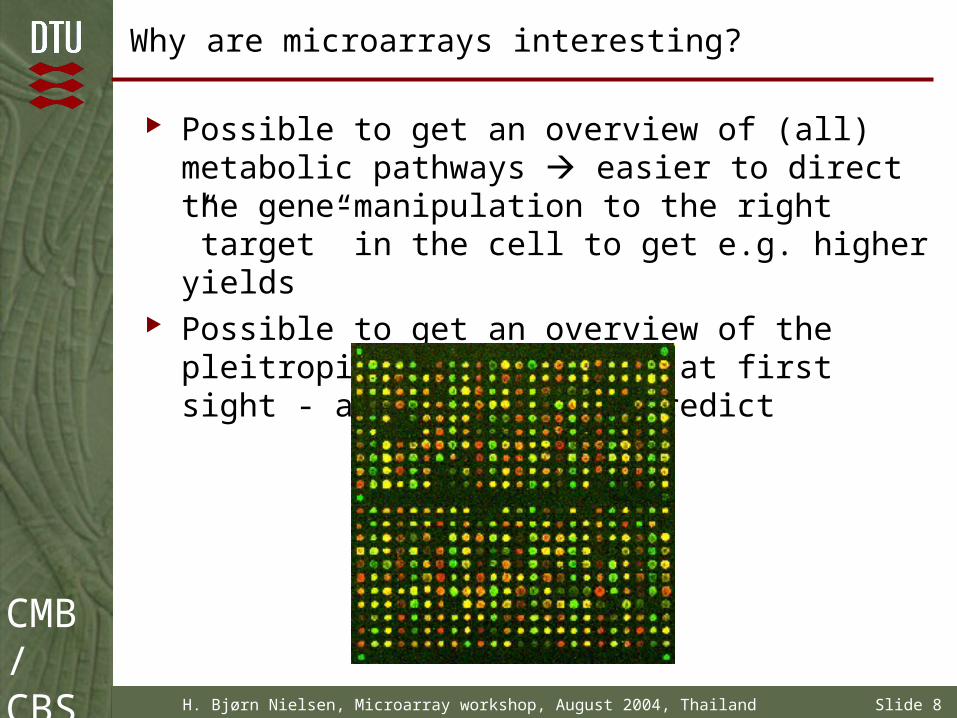
Why are microarrays interesting?
Possible to get an overview of (all) metabolic pathways easier to direct the gene-manipulation to the right ”target” in the cell to get e.g. higher yields
Possible to get an overview of the pleitropic effects that – at first sight - are not easy to predict
CMB/CBS
H. Bjørn Nielsen, Microarray workshop, August 2004, Thailand Slide 9
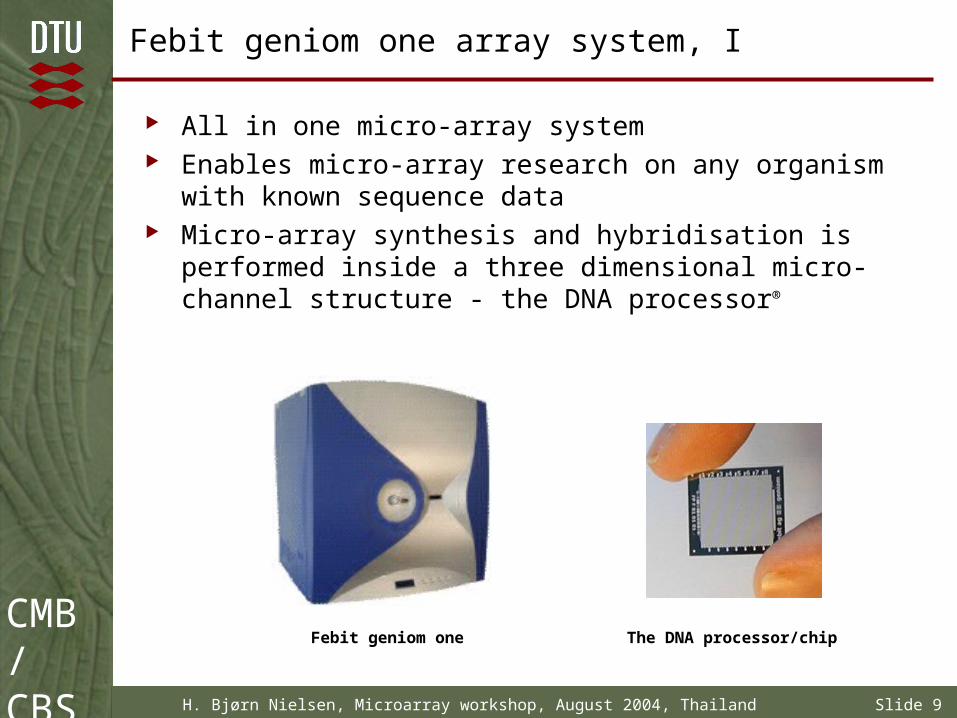
Febit geniom one array system, I
All in one micro-array system Enables micro-array research on any organism with known
sequence data Micro-array synthesis and hybridisation is performed inside a
three dimensional micro-channel structure - the DNA processor®
Febit geniom one The DNA processor/chip
CMB/CBS
H. Bjørn Nielsen, Microarray workshop, August 2004, Thailand Slide 10
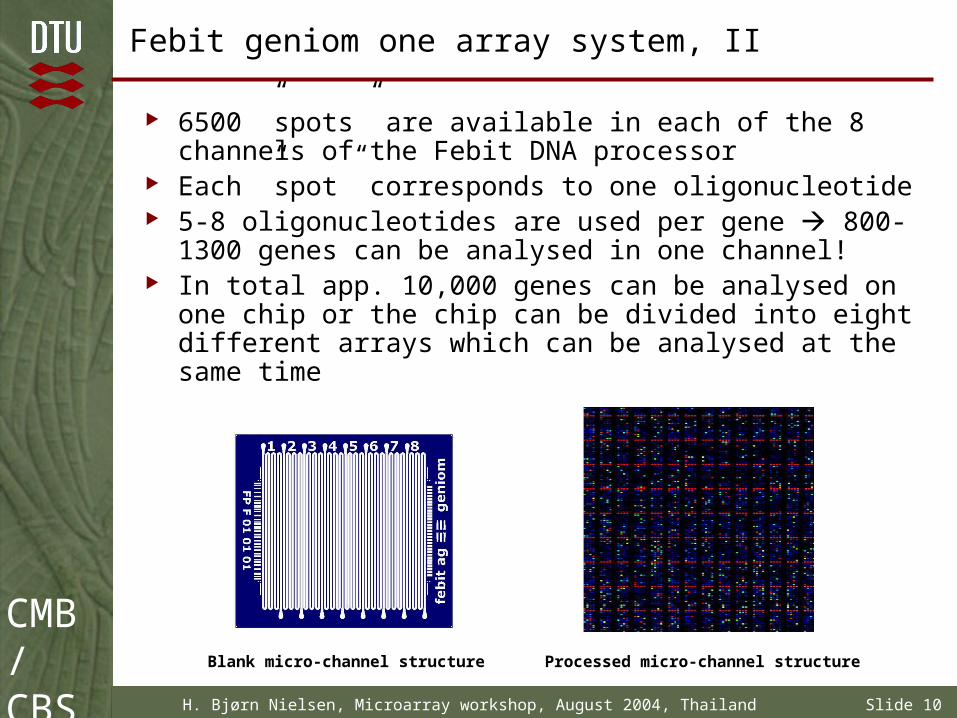
Febit geniom one array system, II
6500 ”spots” are available in each of the 8 channels of the Febit DNA processor
Each ”spot” corresponds to one oligonucleotide 5-8 oligonucleotides are used per gene 800-1300
genes can be analysed in one channel! In total app. 10,000 genes can be analysed on one chip
or the chip can be divided into eight different arrays which can be analysed at the same time
Processed micro-channel structureBlank micro-channel structure
CMB/CBS
H. Bjørn Nielsen, Microarray workshop, August 2004, Thailand Slide 11
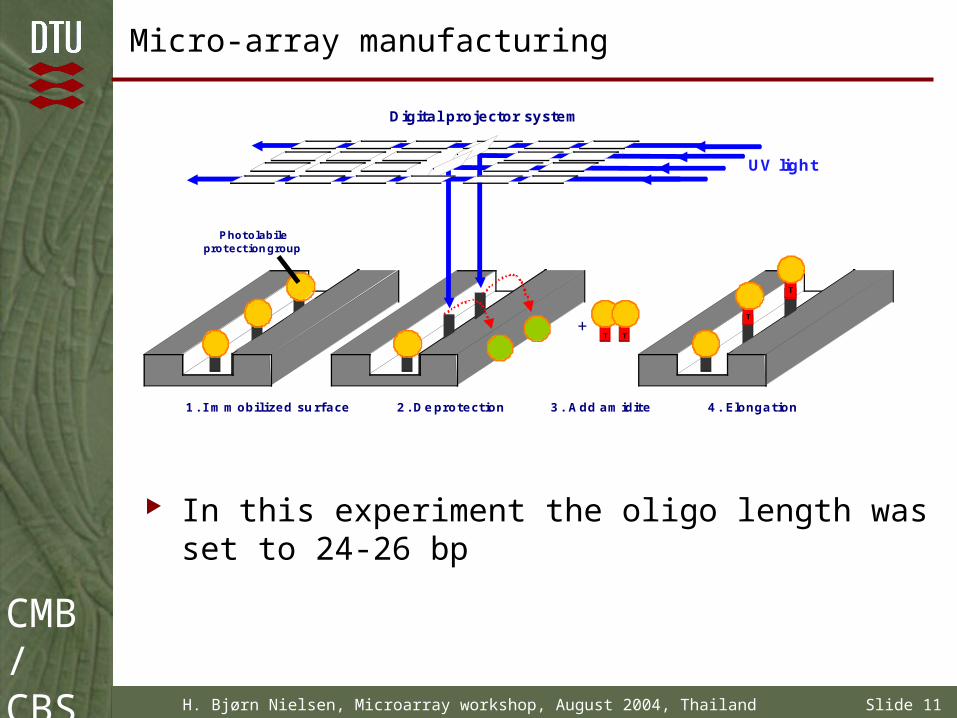
Micro-array manufacturing
In this experiment the oligo length was set to 24-26 bp
Microstructure
Digital projector system
1. I mmobilized surface
UV light
+
Photolabileprotectiongroup
4. Elongation2. Deprotection 3. Add amidite
TT
T
T
CMB/CBS
H. Bjørn Nielsen, Microarray workshop, August 2004, Thailand Slide 12
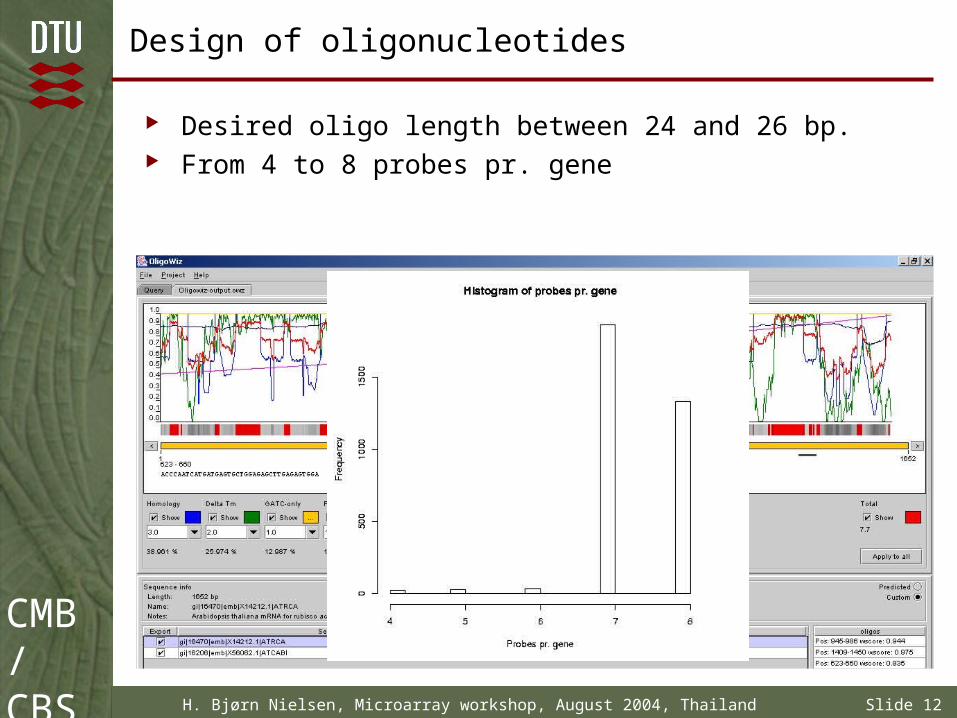
Design of oligonucleotides
Desired oligo length between 24 and 26 bp. From 4 to 8 probes pr. gene
CMB/CBS
H. Bjørn Nielsen, Microarray workshop, August 2004, Thailand Slide 13
Febit experiment overview, I
Sequence data for oligo design was obtained from MIT/Whitehead (now Broad institute) Aspergillus nidulans database
3278 annotated genes were selected (from 9540 putative genes). Genes with pfam-entry were preferred!
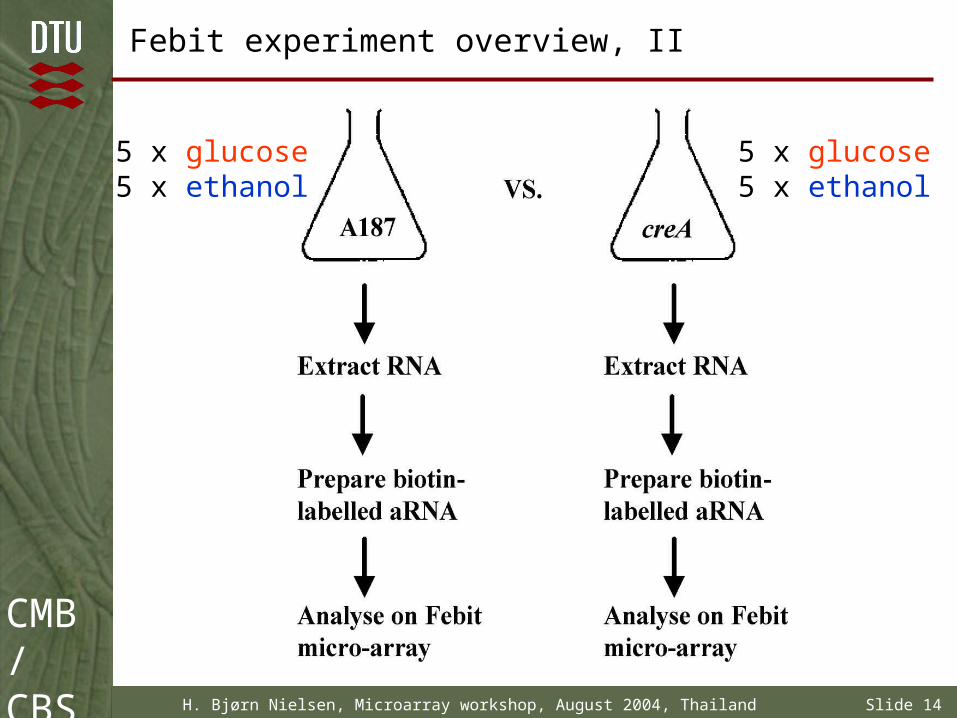
Wildtype A. nidulans (A187) will be compared with creA mutant
Growth conditions: minimal-medium + glucose or ethanol as carbon source
2 strains, 2 growth conditions, 5 biological replicates 20 individual shake flasks
CMB/CBS
H. Bjørn Nielsen, Microarray workshop, August 2004, Thailand Slide 14
Febit experiment overview, II
5 x glucose5 x ethanol
5 x glucose5 x ethanol
CMB/CBS
H. Bjørn Nielsen, Microarray workshop, August 2004, Thailand Slide 15
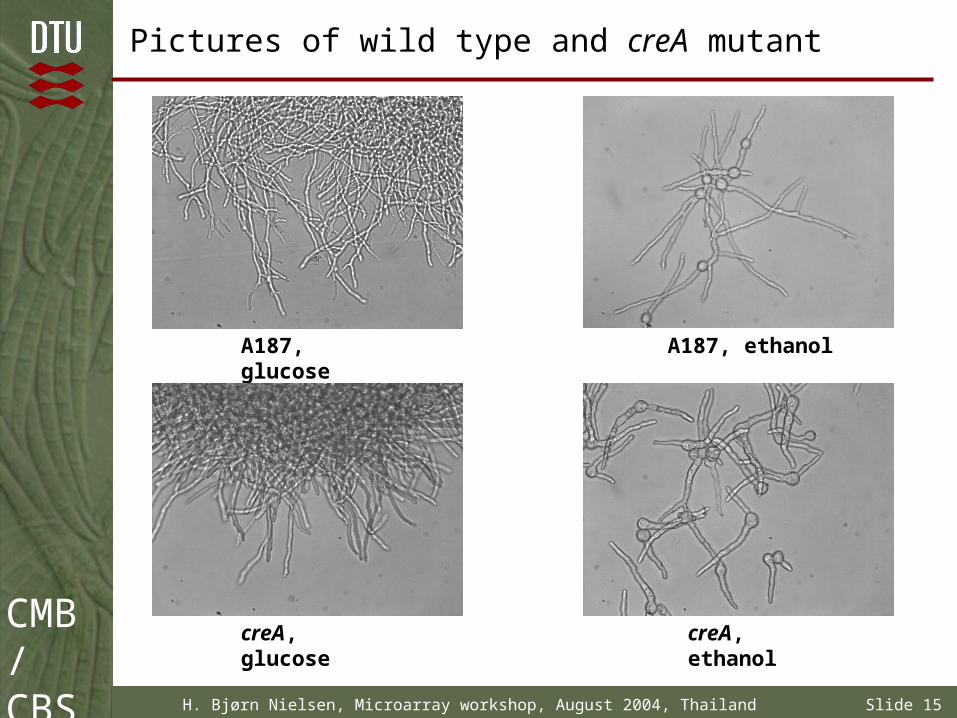
Pictures of wild type and creA mutant
A187, glucose
creA, ethanol
A187, ethanol
creA, glucose
CMB/CBS
H. Bjørn Nielsen, Microarray workshop, August 2004, Thailand Slide 16
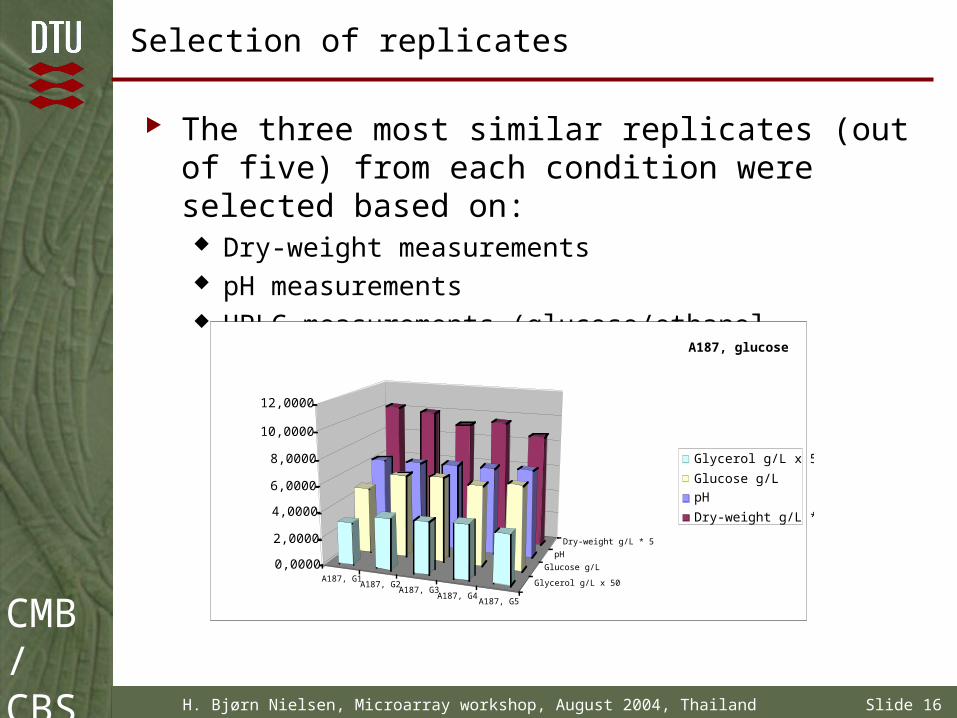
Selection of replicates
The three most similar replicates (out of five) from each condition were selected based on: Dry-weight measurements pH measurements HPLC measurements (glucose/ethanol, glycerol)
A187, G1A187, G2
A187, G3A187, G4
A187, G5
Glycerol g/L x 50
Glucose g/L
pH
Dry-weight g/L * 5
0,0000
2,0000
4,0000
6,0000
8,0000
10,0000
12,0000
A187, glucose
Glycerol g/L x 50
Glucose g/L
pH
Dry-weight g/L * 5
CMB/CBS
H. Bjørn Nielsen, Microarray workshop, August 2004, Thailand Slide 17
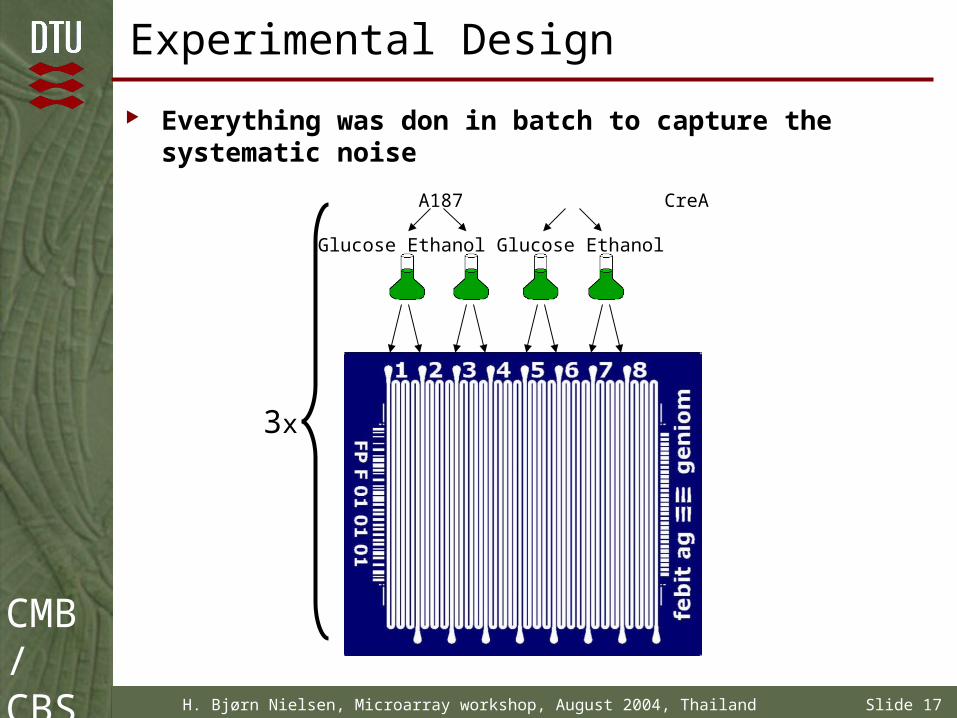
Experimental Design
Everything was don in batch to capture the systematic noise
A187 CreA
Glucose Ethanol Glucose Ethanol
3x
CMB/CBS
H. Bjørn Nielsen, Microarray workshop, August 2004, Thailand Slide 18
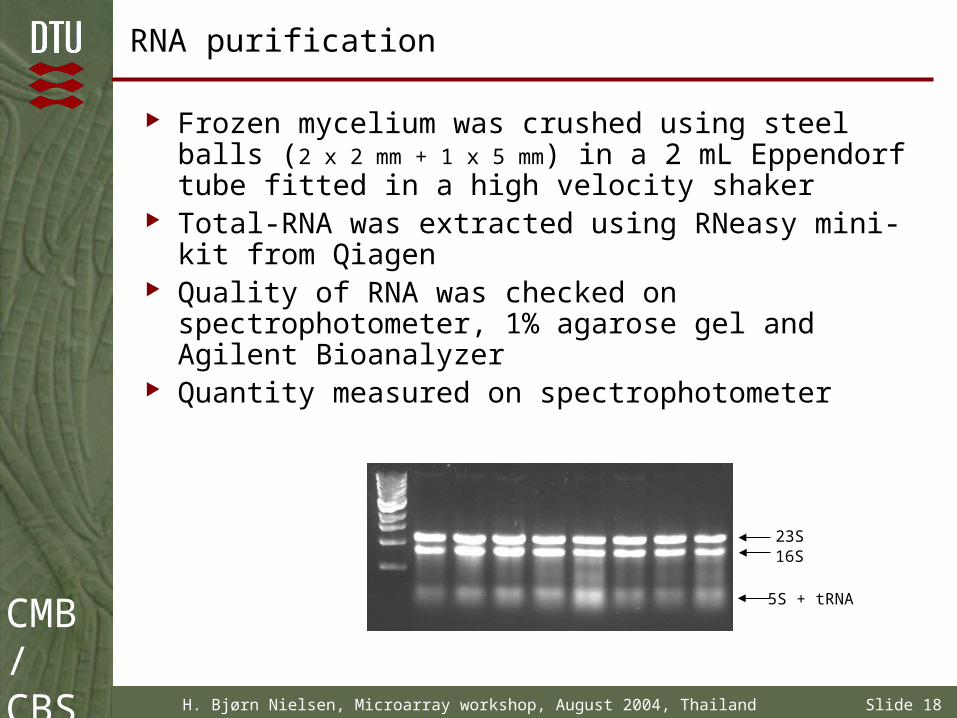
RNA purification
Frozen mycelium was crushed using steel balls (2 x 2
mm + 1 x 5 mm) in a 2 mL Eppendorf tube fitted in a high velocity shaker
Total-RNA was extracted using RNeasy mini-kit from Qiagen
Quality of RNA was checked on spectrophotometer, 1% agarose gel and Agilent Bioanalyzer
Quantity measured on spectrophotometer
23S16S
5S + tRNA
CMB/CBS
H. Bjørn Nielsen, Microarray workshop, August 2004, Thailand Slide 19
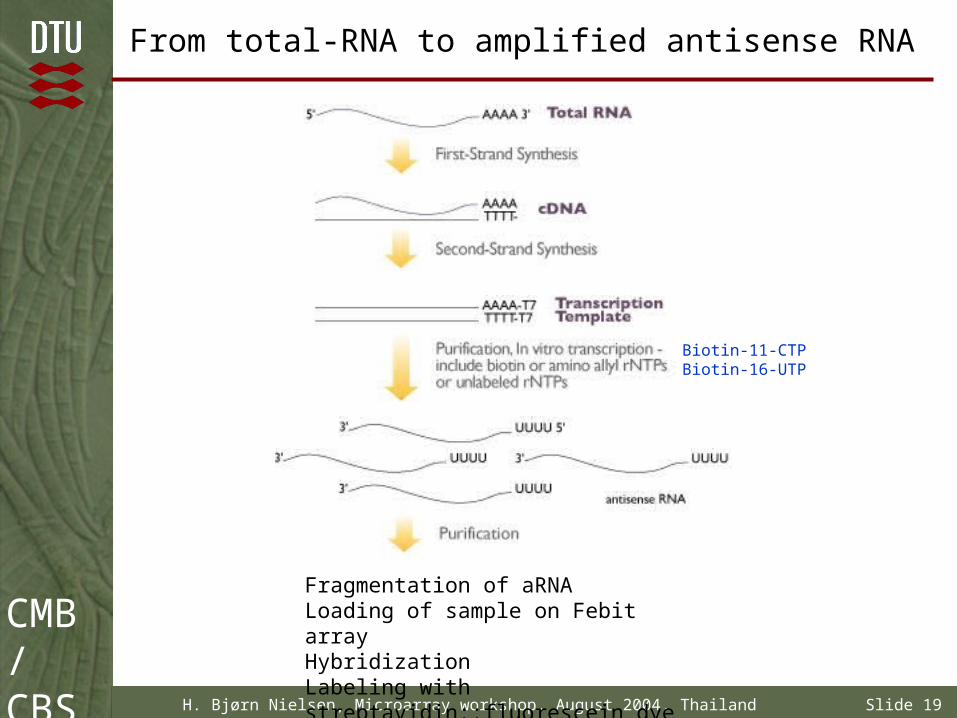
From total-RNA to amplified antisense RNA
Biotin-11-CTPBiotin-16-UTP
Fragmentation of aRNALoading of sample on Febit arrayHybridizationLabeling with streptavidin::fluorescein dye
CMB/CBS
H. Bjørn Nielsen, Microarray workshop, August 2004, Thailand Slide 20
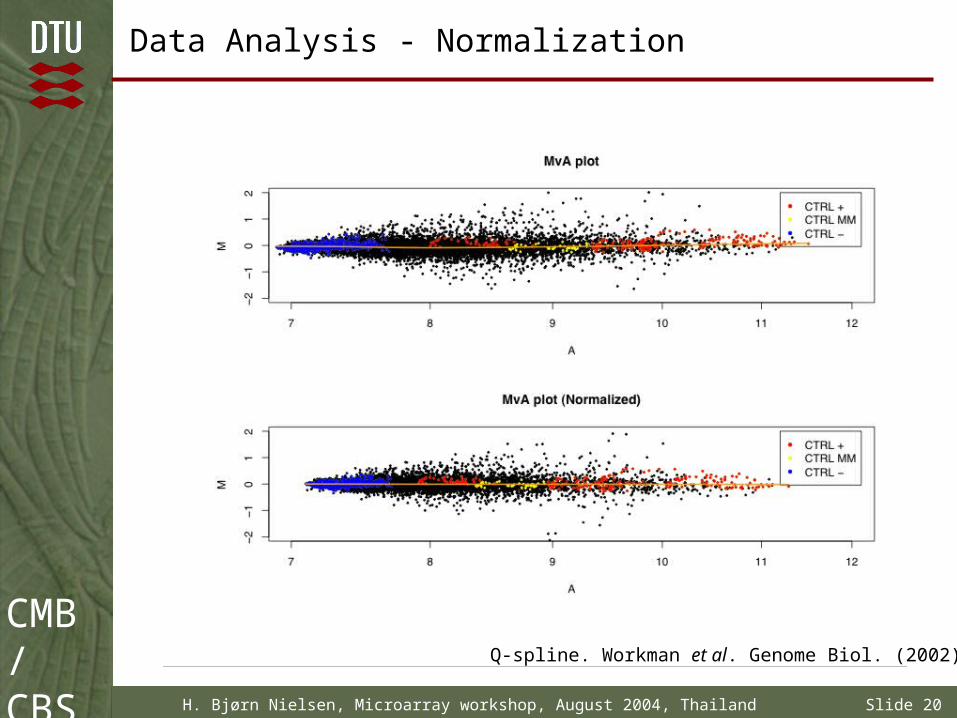
Data Analysis - Normalization
Q-spline. Workman et al. Genome Biol. (2002)
CMB/CBS
H. Bjørn Nielsen, Microarray workshop, August 2004, Thailand Slide 21
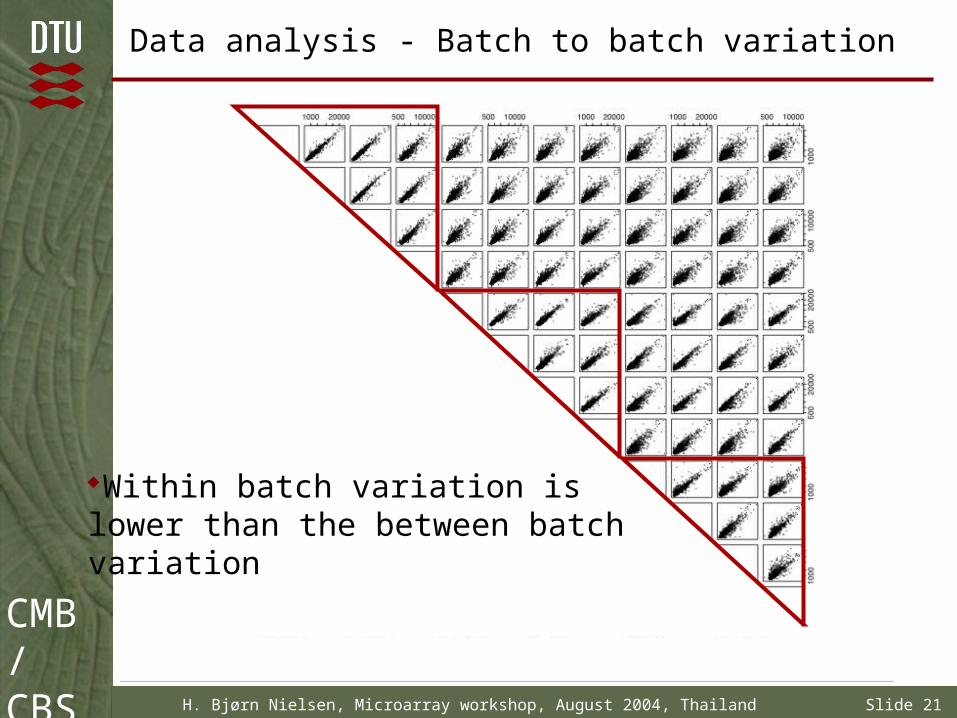
Data analysis - Batch to batch variation
Within batch variation is lower than the between batch variation
CMB/CBS
H. Bjørn Nielsen, Microarray workshop, August 2004, Thailand Slide 22
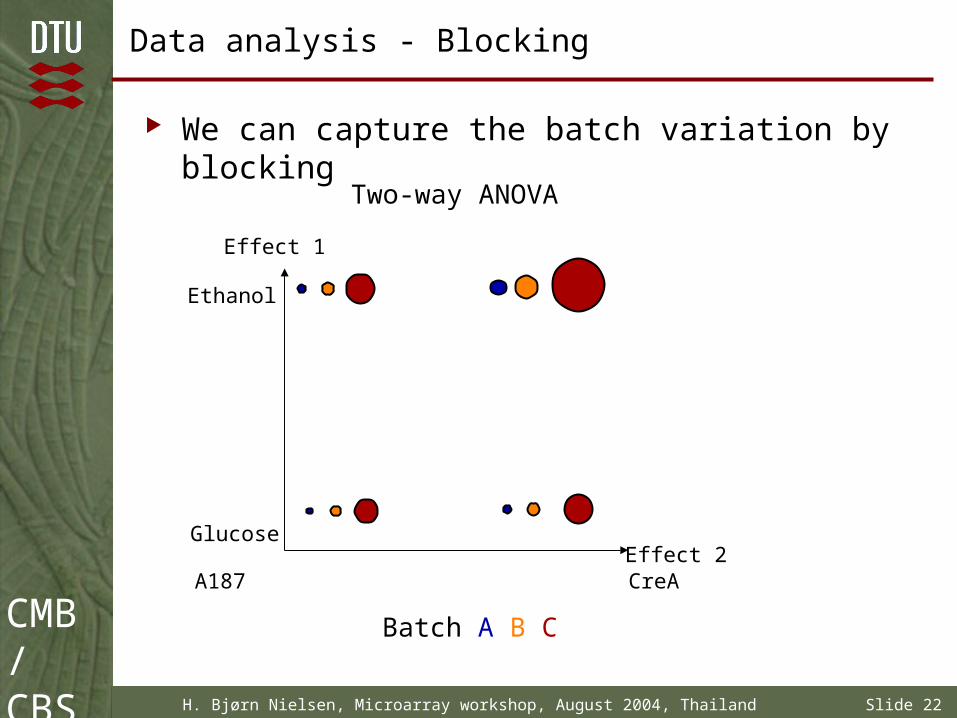
Data analysis - Blocking
We can capture the batch variation by blocking
Two-way ANOVA
Glucose
Ethanol
A187 CreA
Effect 1
Effect 2
Batch A B C
CMB/CBS
H. Bjørn Nielsen, Microarray workshop, August 2004, Thailand Slide 23
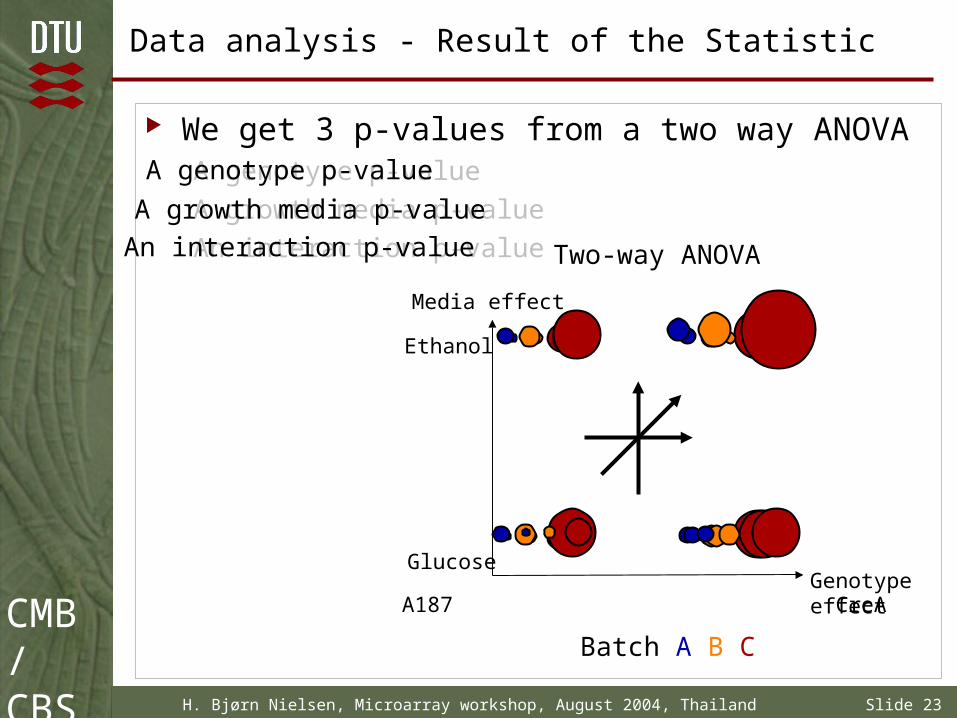
Data analysis - Result of the Statistic
We get 3 p-values from a two way ANOVAA genotype p-value
A growth media p-value
An interaction p-value Two-way ANOVA
Glucose
Ethanol
A187 CreA
Media effect
Genotypeeffect
Batch A B C
A genotype p-value
A growth media p-value
An interaction p-value
CMB/CBS
H. Bjørn Nielsen, Microarray workshop, August 2004, Thailand Slide 24
Data analysis - Threshold
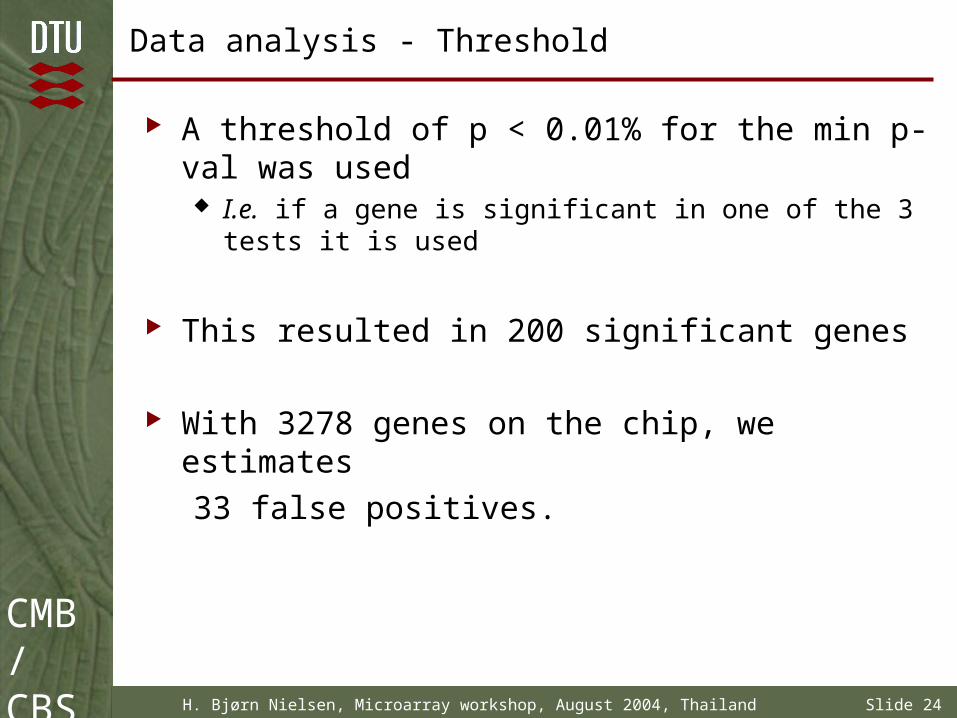
A threshold of p < 0.01% for the min p-val was used I.e. if a gene is significant in one of the 3 tests it is used
This resulted in 200 significant genes
With 3278 genes on the chip, we estimates
33 false positives.
CMB/CBS
H. Bjørn Nielsen, Microarray workshop, August 2004, Thailand Slide 25
Clustering of genes into 12 clusters
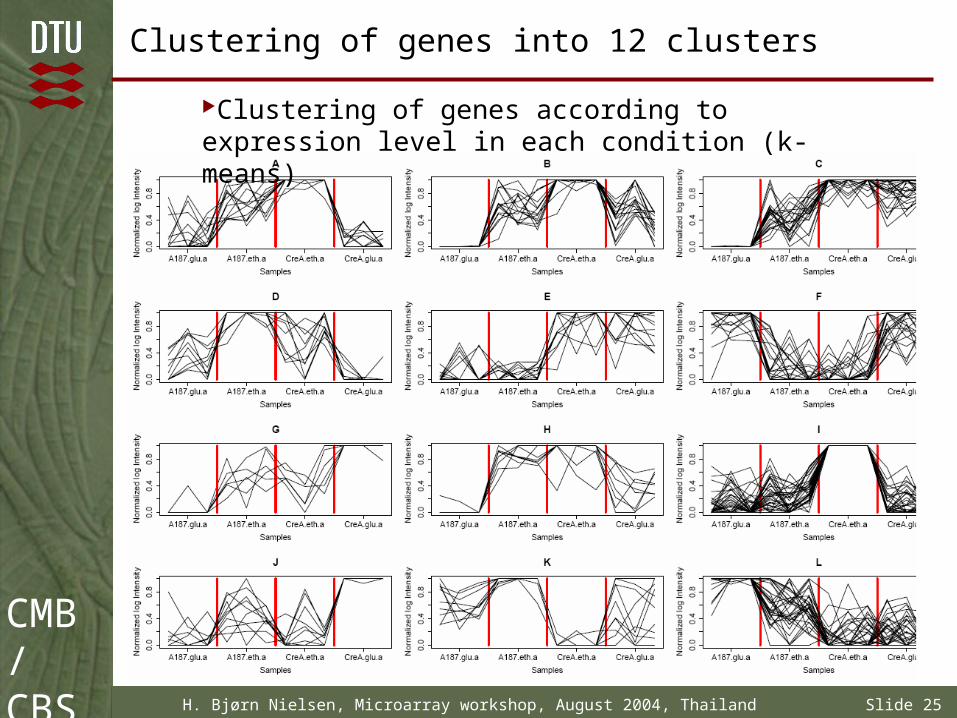
Clustering of genes according to expression level in each condition (k-means)

CMB/CBS
H. Bjørn Nielsen, Microarray workshop, August 2004, Thailand Slide 26
The influence of CreA, I
Theory: CreA is always present at a certain level and represses genes under both repressing and de-repressing conditions (11 out of 200 most significant genes)
BUT repression is for some genes less under
de-repressing conditions (cluster C)
(24 out of 200 most significant genes)
CMB/CBS
H. Bjørn Nielsen, Microarray workshop, August 2004, Thailand Slide 27
The influence of CreA, II
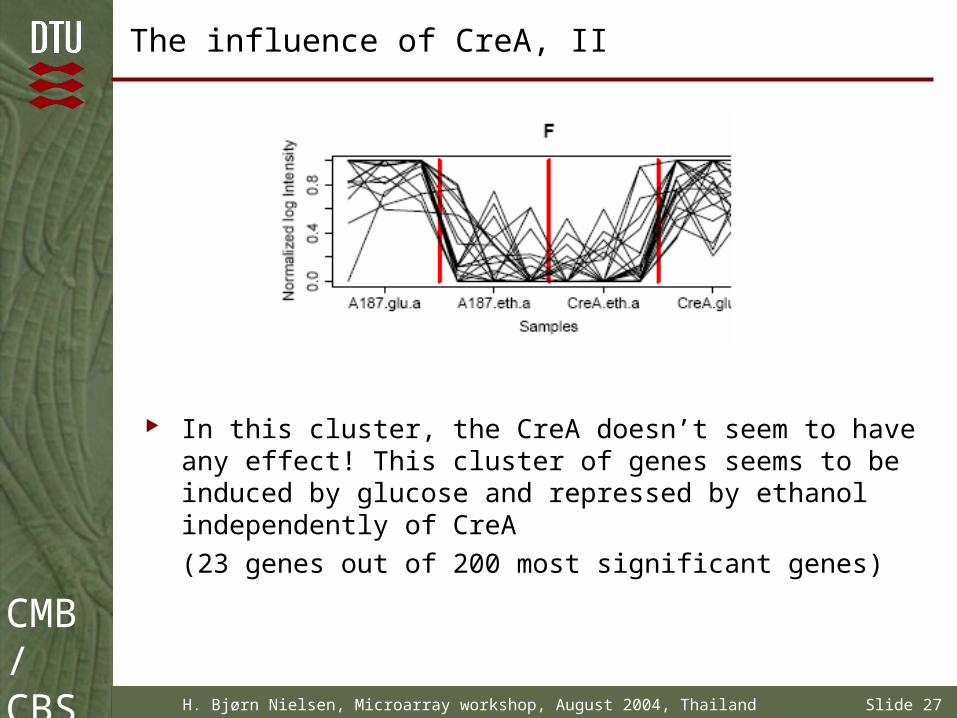
In this cluster, the CreA doesn’t seem to have any effect! This cluster of genes seems to be induced by glucose and repressed by ethanol independently of CreA
(23 genes out of 200 most significant genes)
CMB/CBS
H. Bjørn Nielsen, Microarray workshop, August 2004, Thailand Slide 28
The influence of CreA, III
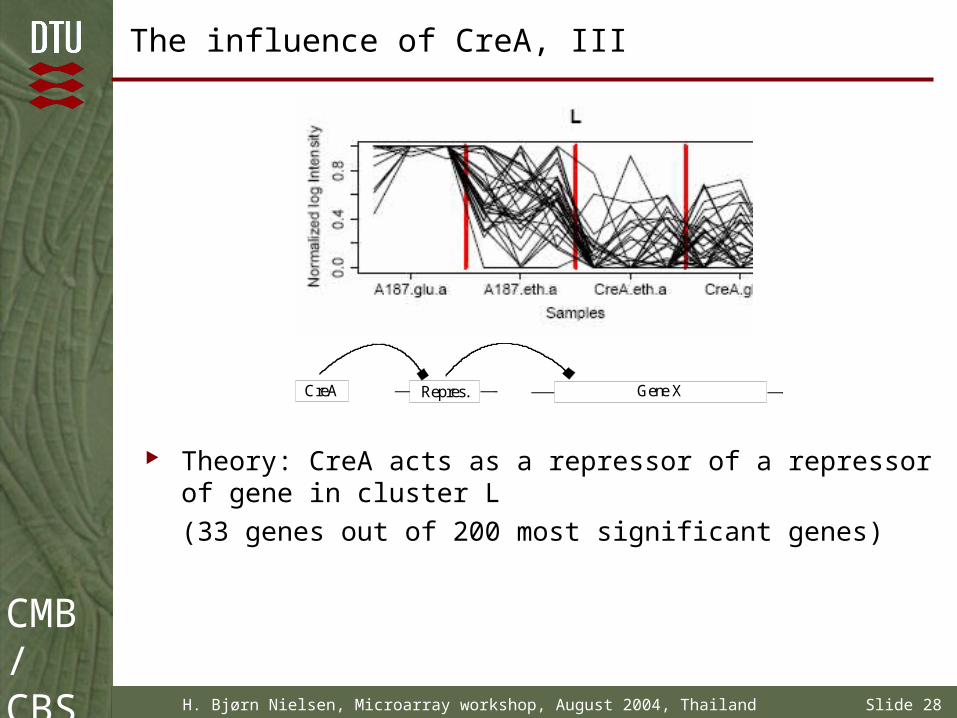
Theory: CreA acts as a repressor of a repressor of gene in cluster L
(33 genes out of 200 most significant genes)
Gene XRepres.CreA
CMB/CBS
H. Bjørn Nielsen, Microarray workshop, August 2004, Thailand Slide 29
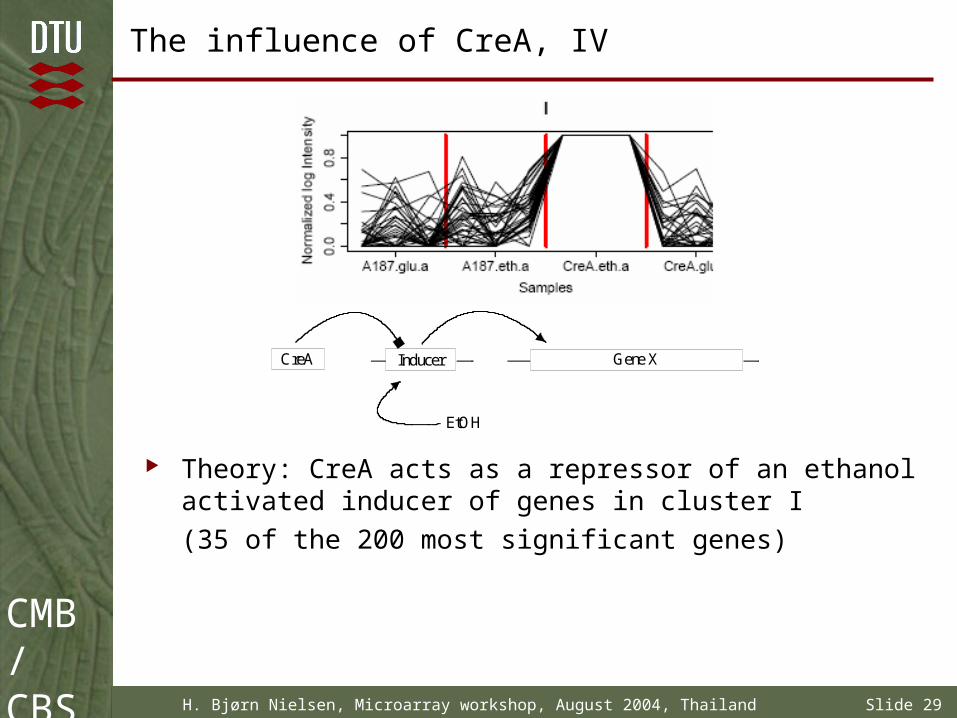
The influence of CreA, IV
Theory: CreA acts as a repressor of an ethanol activated inducer of genes in cluster I
(35 of the 200 most significant genes)
Gene XInducerCreA
EtOH
CMB/CBS
H. Bjørn Nielsen, Microarray workshop, August 2004, Thailand Slide 30
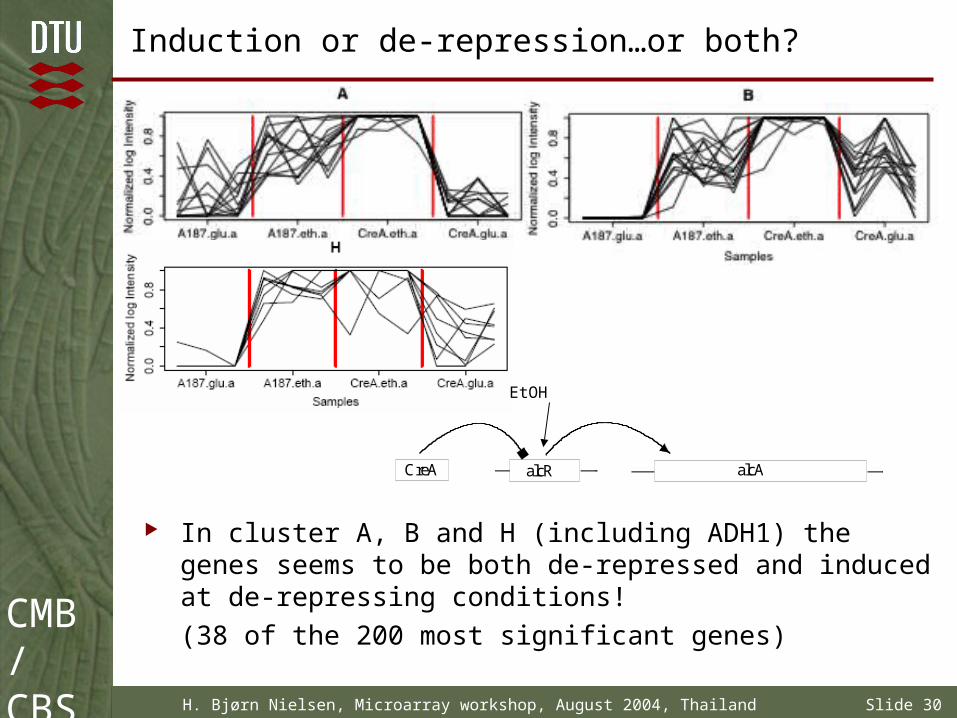
Induction or de-repression…or both?
In cluster A, B and H (including ADH1) the genes seems to be both de-repressed and induced at de-repressing conditions!
(38 of the 200 most significant genes)
alcAalcRCreA
EtOH
CMB/CBS
H. Bjørn Nielsen, Microarray workshop, August 2004, Thailand Slide 31
Conclusions
With the expression analysis it has been possible to cluster the 200 most significant genes in 12 different clusters, where the genes seem to be either directly, indirectly or not regulated by CreA
With the use of micro-array analysis it is possible to get an overview of the pleiotropic effects (indirect regulation by CreA)
CMB/CBS
H. Bjørn Nielsen, Microarray workshop, August 2004, Thailand Slide 32
Future plans
Search for CreA binding sites in promoters Better annotation of most significant genes Run Northern blot (ugpA, gfaA, pcmA, ungA, creA)
(Gerald Hofmann) Compare the expression profile with flux analysis
model (Helga David) Biological interpretation of result
CMB/CBS
H. Bjørn Nielsen, Microarray workshop, August 2004, Thailand Slide 33
Acknowledgment
Jesper Mogensen Professor Jens Nielsen Gerald Hofmann Michael Lynge Nielsen People at CMB and CBS