Embed Size (px)
Citation preview

1ReSIST courseware — M. Kaâniche, K. Kanoun, J-C. Laprie — Dependability and Security Evaluation
Dependability andSecurity evaluation of
computer-based systemsMohamed Kaâniche, Karama Kanoun, Jean-Claude Laprie
{mohamed.kaaniche, karama.kanoun, jean-claude.laprie}@laas.fr

2ReSIST courseware — M. Kaâniche, K. Kanoun, J-C. Laprie — Dependability and Security Evaluation
Focus of the lecture
Attributes
Threats
Means
Availability
Reliability
SafetyConfidentiality
Integrity
Maintainability
Faults
Errors
Failures
Fault Prevention
Fault Tolerance
Fault Removal
Fault Forecasting
Security
Dependabilityaccidental
+malicious

3ReSIST courseware — M. Kaâniche, K. Kanoun, J-C. Laprie — Dependability and Security Evaluation
Outline
� Introduction
� ordinal and quantitative evaluation
� Definitions of quantitative measures
� Probabilistic evaluation methods
� Combinatorial models: reliability block diagrams, fault trees
� State-based models: Markov chains
� Case studies
� Evaluation with regard to malicious threats
� Conclusion
� References

4ReSIST courseware — M. Kaâniche, K. Kanoun, J-C. Laprie — Dependability and Security Evaluation
Dependability evaluation
� Estimate the present number, the future incidence andthe likely consequences of faults
� Assess the level of confidence to be placed in the targetsystems with regards to their ability to meet specifiedobjectives
� Support engineering and design decisions
� comparative evaluation of candidate architectures
� prediction of the level of resilience in operation
� reliability, resource and cost allocation based onquantified predictions

5ReSIST courseware — M. Kaâniche, K. Kanoun, J-C. Laprie — Dependability and Security Evaluation
Two types of evaluation
Qualitativeor “ordinal”
Quantitativeor “probabilistic”
identify, classify, and rank thefailure modes or the eventcombinations (componentfailures or environmental
conditions) that would lead tosystem failures
evaluate in terms ofprobabilities the extentto which some of the
attributes are satisfied
attributes � measures
6ReSIST courseware — M. Kaâniche, K. Kanoun, J-C. Laprie — Dependability and Security Evaluation
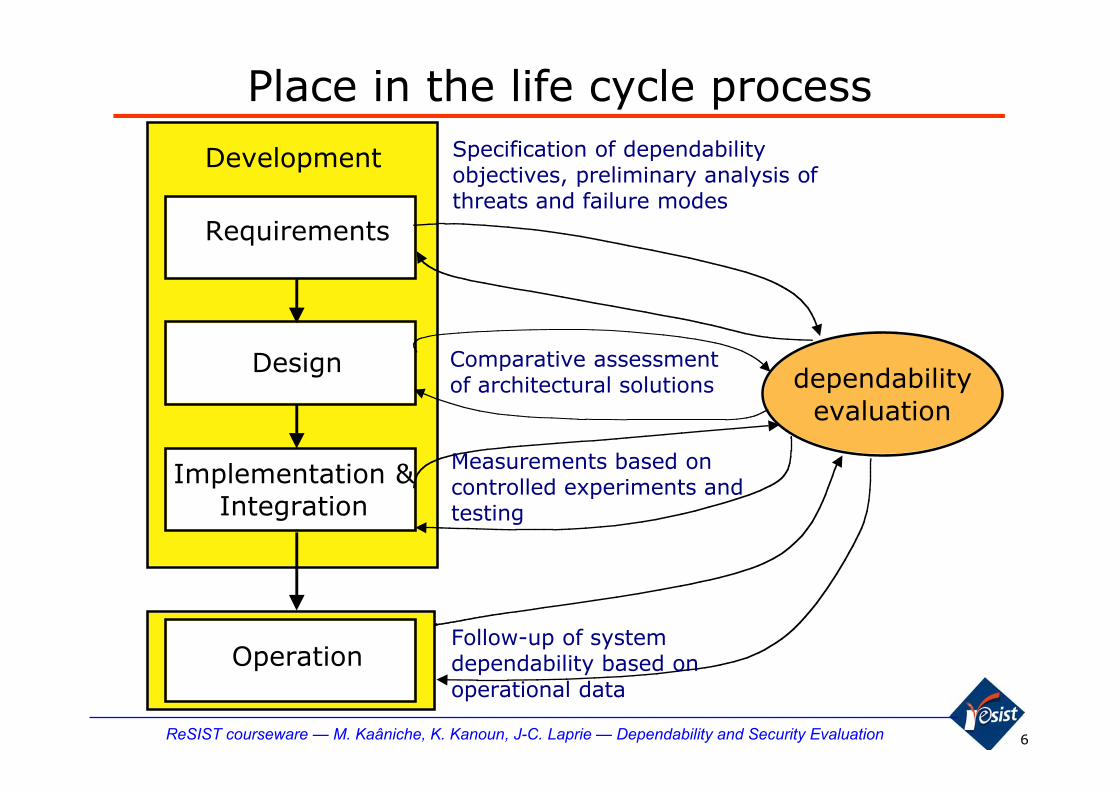
Place in the life cycle process
dependabilityevaluation
Development
Operation
Requirements
Design
Implementation &Integration
Specification of dependabilityobjectives, preliminary analysis ofthreats and failure modes
Comparative assessmentof architectural solutions
Measurements based oncontrolled experiments andtesting
Follow-up of systemdependability based onoperational data
7ReSIST courseware — M. Kaâniche, K. Kanoun, J-C. Laprie — Dependability and Security Evaluation
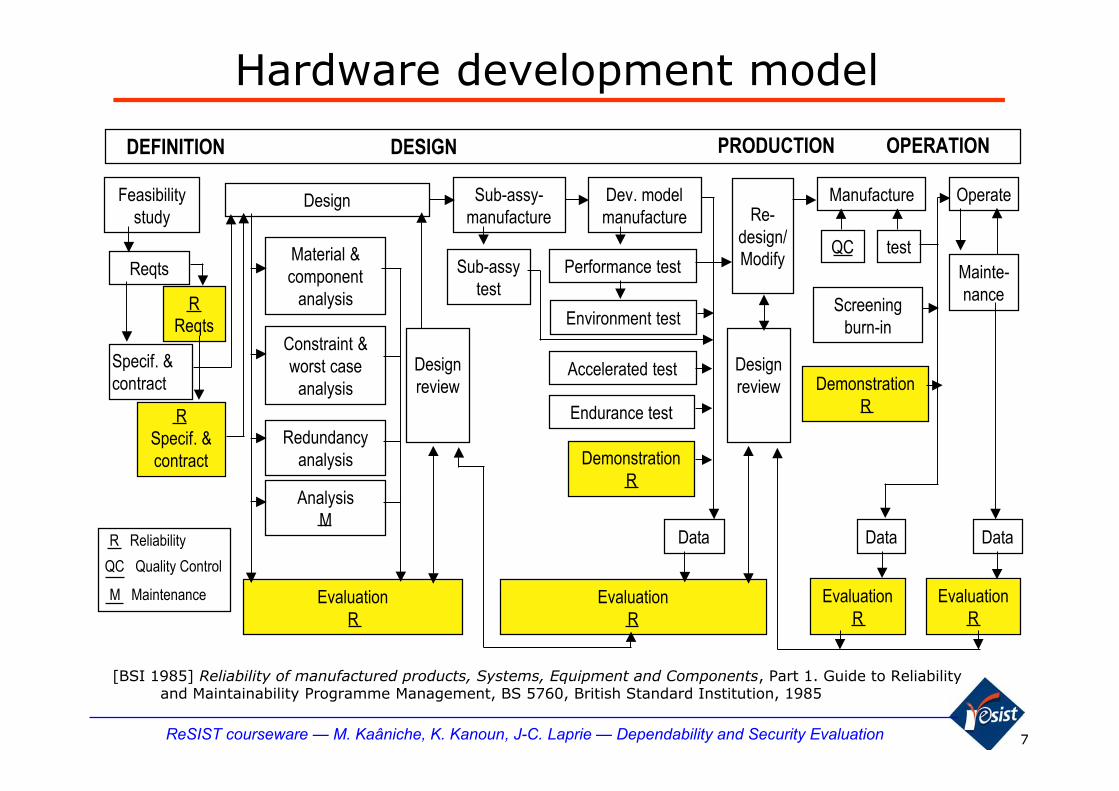
Hardware development model
[BSI 1985] Reliability of manufactured products, Systems, Equipment and Components, Part 1. Guide to Reliabilityand Maintainability Programme Management, BS 5760, British Standard Institution, 1985
Feasibilitystudy
Reqts
Design
DEFINITION DESIGN PRODUCTION OPERATION
Specif. &contract
RReqts
RSpecif. &contract
R Reliability
QC Quality Control
M Maintenance
Material &component
analysis
Constraint &worst case
analysis
Redundancyanalysis
AnalysisM
EvaluationR
Designreview
Sub-assy-manufacture
Dev. modelmanufacture
Sub-assytest
Performance test
Environment test
Accelerated test
Endurance test
DemonstrationR
Re-design/Modify
EvaluationR
EvaluationR
Manufacture
QC test
Data
Operate
Screeningburn-in
Designreview Demonstration
R
Data
EvaluationR
Data
Mainte-nance

8ReSIST courseware — M. Kaâniche, K. Kanoun, J-C. Laprie — Dependability and Security Evaluation
Avionics: ARP 4754 Standard
Aircraft levelFunctional HazardAssessment (FHA)
System SafetyAssessment
(SSA)
Aircraft LevelRequirements
Allocation ofAircraft Functions
to Systems
Development ofSystem Architecture
Allocation ofRequirements
to HW&SW
SystemImplementation
Prelim. SystemSafety Assessment
(PSSA)
CommonCause
Analyses
(CCAs)
Physical System
Implementation
Item ReqtsItem Reqts,Safety objectives,Analyses Required
Failure modes, Effects,Classification, Safety Reqts
Separation Reqts
Separation&
Verification
Failuremodes &Effects
FunctionalInteractions
Architectural Reqts
SystemArchitecture
AircraftFunctions
SystemFunctions
System Development ProcessSafety Assessment Process
System levelFHA
Certification
Failure condition, Effects,Classification, Safetyobjectives

9ReSIST courseware — M. Kaâniche, K. Kanoun, J-C. Laprie — Dependability and Security Evaluation
Dependability requirements andquantitative objectives
� Specification of dependability objectives
� Critical dependability attributes, degraded modes
� Qualitative AND/OR Quantitative objectives
� Telecommunication system� Unavailability: 2 minutes/year � availability = 99.996%
� Less than 0.01 % of phone call not processed properly
� Mean time to repair = 4 hours
� Space system (NASA)� “The on-orbit space station shall be capable of operating in the
microgravity mode, as defined in .., for 30 day continuousperiods per the mission profile … with a reliability of 0.80”
� “Satellite communication shall provide 6 out of 12 channels ofdownlink at 10Mbits/sec rate for two years of continuousoperation”

10ReSIST courseware — M. Kaâniche, K. Kanoun, J-C. Laprie — Dependability and Security Evaluation
Consequence
Minor
Major
Hazardous/Severe-Major
Catastrophic
Probable
Rare
Extremely rare
Extremely improbable
Probability of occurrence (per hour)
> 1.10-5
1.10-5 > > 1.10-7
1.10-7 > > 1.10-9
< 1.10-9
Airborne systems
Minor Failure conditions which would not significantly reduce aircraft safety, and which would involvecrew actions that are well within their capabilities. Minor failure conditions may include, forexample, a slight reduction is safety margins or functional capabilities, a slight increase in crewworkload, such as, routine flight plan changes, or some inconvenience to occupants
Failure conditions which would prevent continued safe flight and landing
Failure conditions which would reduce the capability of the aircraft or the ability of the crew tocope with adverse operating conditions to the extent that there would be, e.g.,, a significantreduction in safety margins or functional capabilities, a significant increase in crew workload orin conditions impairing crew efficiency, or disconfort to occupants, possibly including injuries.
Failure conditions which would reduce the capability of the aircraft or the ability of the crew tocope with adverse operating conditions to the extent that there would be:
a) a large reduction in safety margins or functional capabilities
b) Physical distress or higher workload such that the flight crew could not be relied on to perform their task accurately or completely, or
c) Adverse effects on occupants including serious or potentially fatal injuries to a small number of those occupants
Hazardous/Severe-Major
Catastrophic
Major
11ReSIST courseware — M. Kaâniche, K. Kanoun, J-C. Laprie — Dependability and Security Evaluation
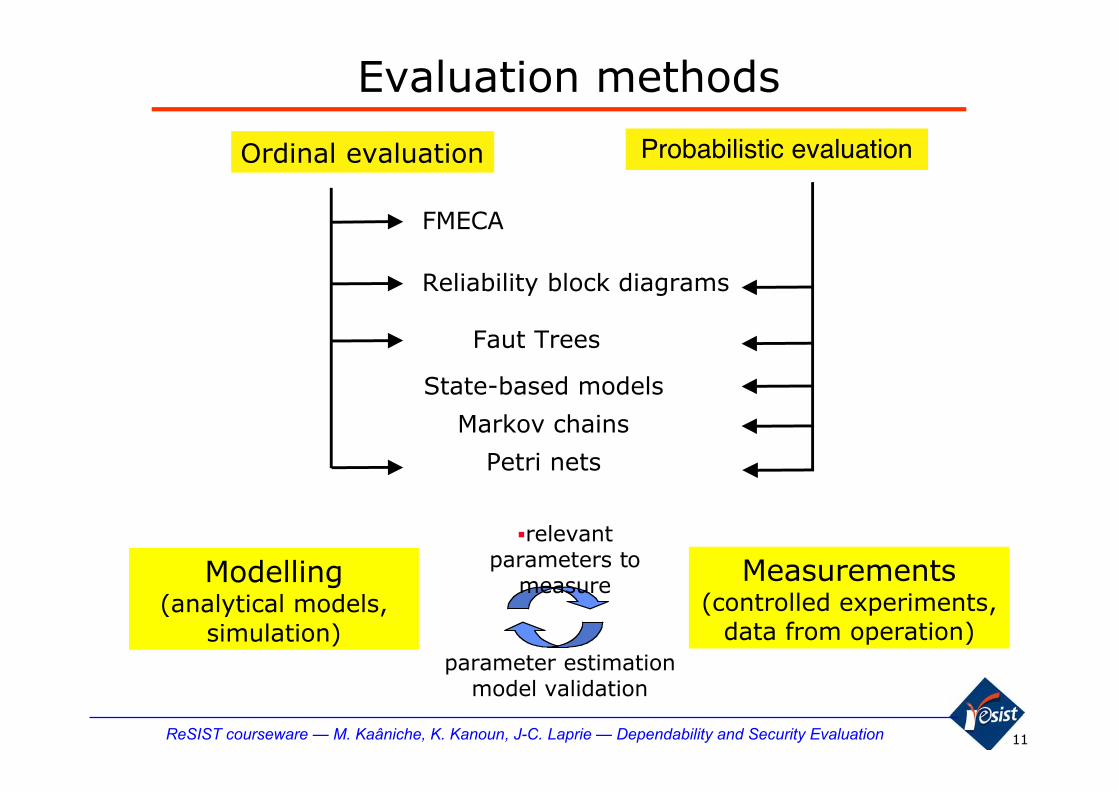
Evaluation methods
Modelling(analytical models,
simulation)
Measurements(controlled experiments,
data from operation)parameter estimation
model validation
�relevantparameters to
measure
Ordinal evaluation Probabilistic evaluation
FMECA
Reliability block diagrams
Faut Trees
State-based models
Markov chains
Petri nets
12ReSIST courseware — M. Kaâniche, K. Kanoun, J-C. Laprie — Dependability and Security Evaluation
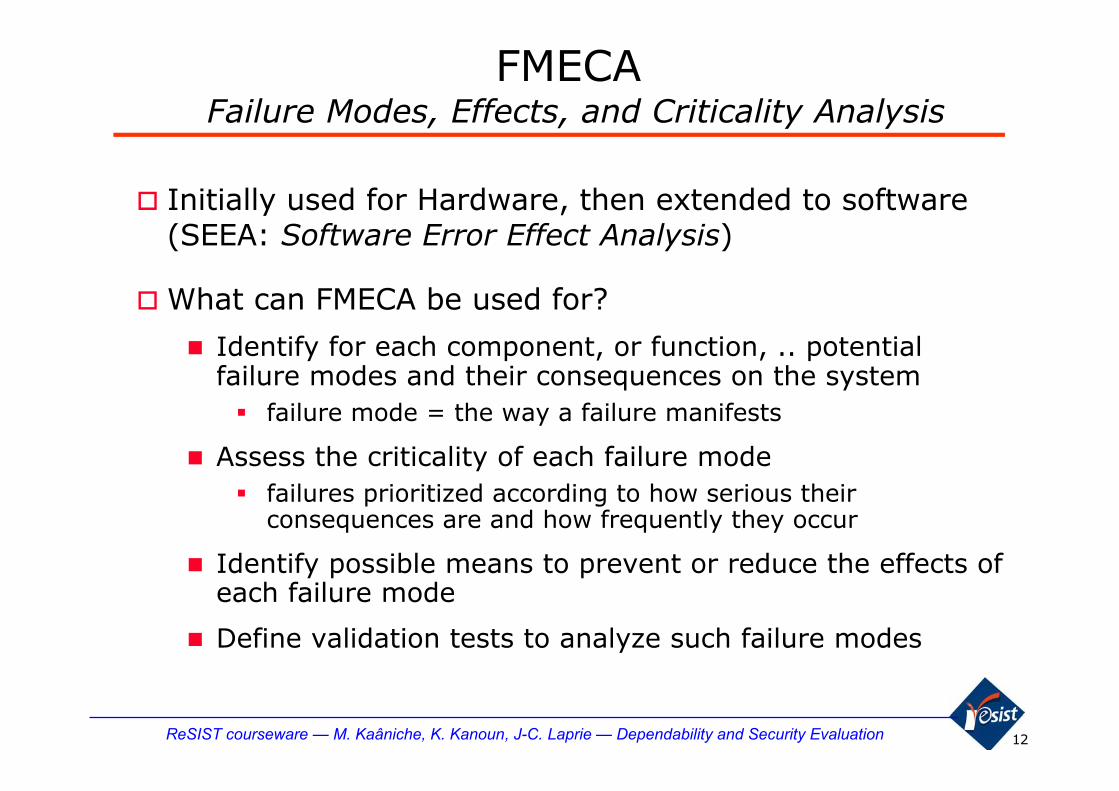
FMECA Failure Modes, Effects, and Criticality Analysis
� Initially used for Hardware, then extended to software(SEEA: Software Error Effect Analysis)
�What can FMECA be used for?
� Identify for each component, or function, .. potentialfailure modes and their consequences on the system� failure mode = the way a failure manifests
� Assess the criticality of each failure mode� failures prioritized according to how serious their
consequences are and how frequently they occur
� Identify possible means to prevent or reduce the effects ofeach failure mode
� Define validation tests to analyze such failure modes
13ReSIST courseware — M. Kaâniche, K. Kanoun, J-C. Laprie — Dependability and Security Evaluation
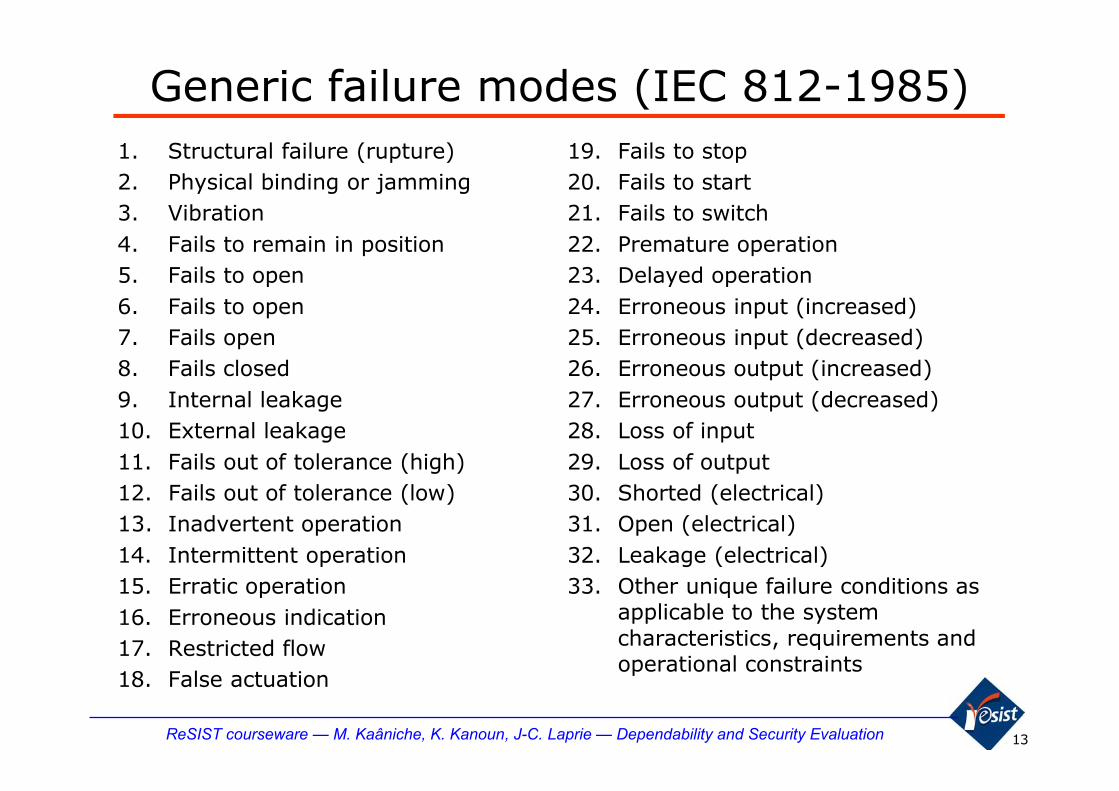
Generic failure modes (IEC 812-1985)1. Structural failure (rupture)2. Physical binding or jamming3. Vibration4. Fails to remain in position5. Fails to open6. Fails to open7. Fails open8. Fails closed9. Internal leakage10. External leakage11. Fails out of tolerance (high)12. Fails out of tolerance (low)13. Inadvertent operation14. Intermittent operation15. Erratic operation16. Erroneous indication17. Restricted flow18. False actuation
19. Fails to stop20. Fails to start21. Fails to switch22. Premature operation23. Delayed operation24. Erroneous input (increased)25. Erroneous input (decreased)26. Erroneous output (increased)27. Erroneous output (decreased)28. Loss of input29. Loss of output30. Shorted (electrical)31. Open (electrical)32. Leakage (electrical)33. Other unique failure conditions as
applicable to the systemcharacteristics, requirements andoperational constraints
14ReSIST courseware — M. Kaâniche, K. Kanoun, J-C. Laprie — Dependability and Security Evaluation
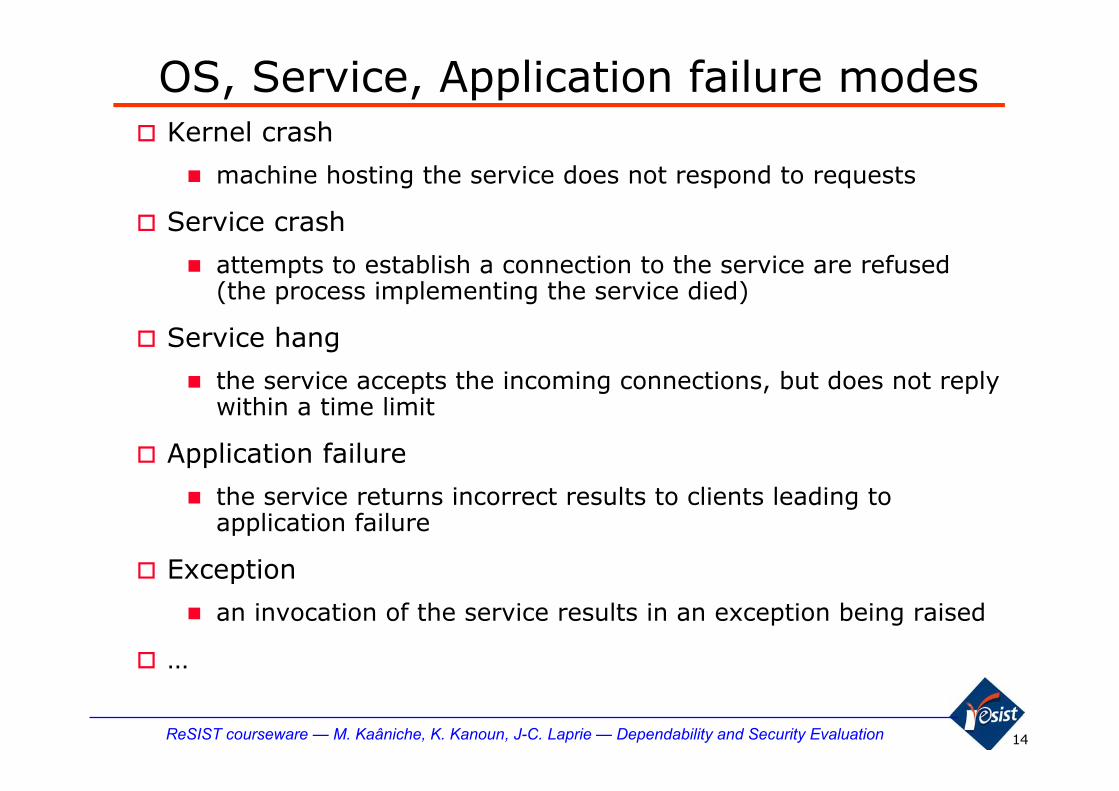
OS, Service, Application failure modes� Kernel crash
� machine hosting the service does not respond to requests
� Service crash
� attempts to establish a connection to the service are refused(the process implementing the service died)
� Service hang
� the service accepts the incoming connections, but does not replywithin a time limit
� Application failure
� the service returns incorrect results to clients leading toapplication failure
� Exception
� an invocation of the service results in an exception being raised
� …
15ReSIST courseware — M. Kaâniche, K. Kanoun, J-C. Laprie — Dependability and Security Evaluation
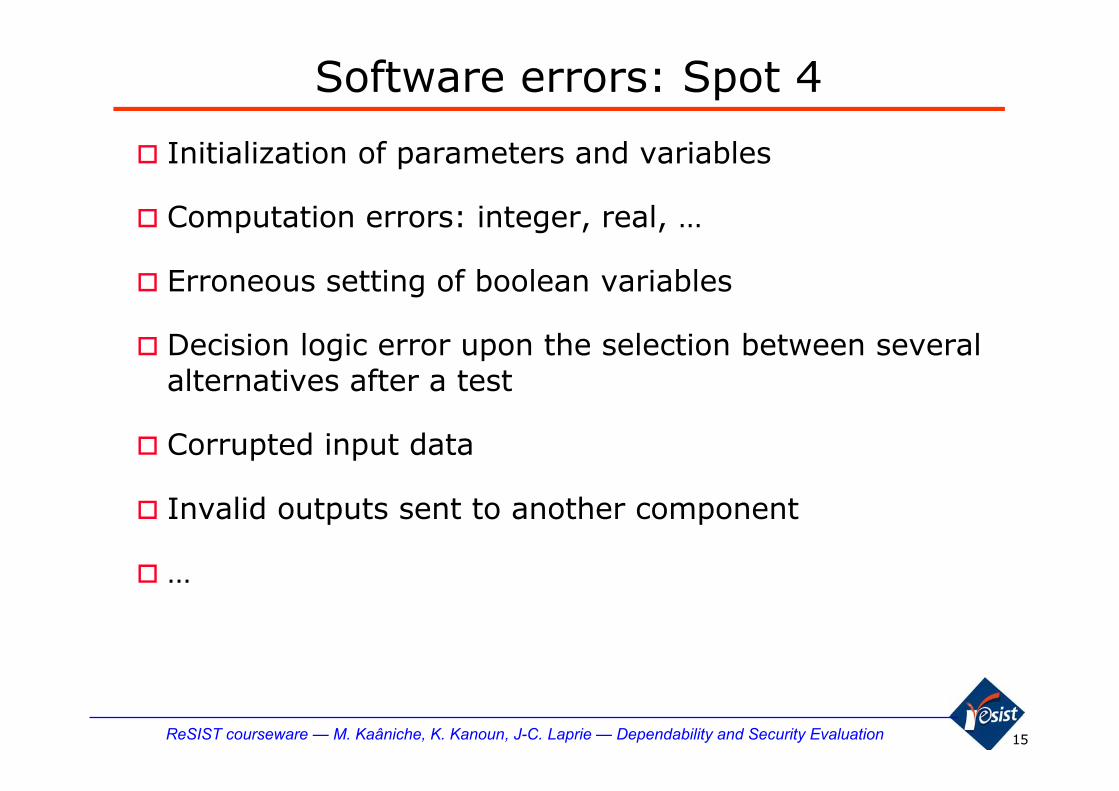
Software errors: Spot 4
� Initialization of parameters and variables
� Computation errors: integer, real, …
� Erroneous setting of boolean variables
� Decision logic error upon the selection between severalalternatives after a test
� Corrupted input data
� Invalid outputs sent to another component
� …
16ReSIST courseware — M. Kaâniche, K. Kanoun, J-C. Laprie — Dependability and Security Evaluation
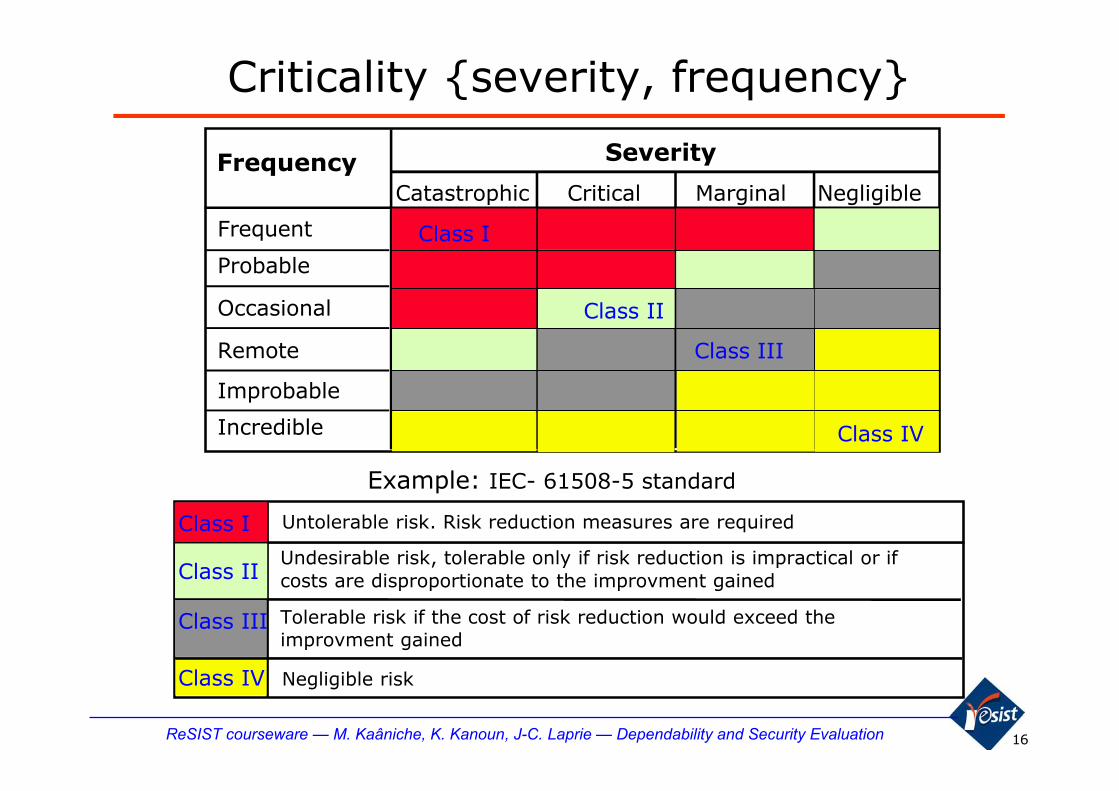
Criticality {severity, frequency}
Frequency Severity
Catastrophic Critical Marginal Negligible
Probable
Occasional
Remote
Improbable
Incredible
Frequent Class I
Class IV
Class II
Class III
Example: IEC- 61508-5 standard
Untolerable risk. Risk reduction measures are required
Undesirable risk, tolerable only if risk reduction is impractical or ifcosts are disproportionate to the improvment gained
Negligible risk
Class I
Class II
Class III
Class IV
Tolerable risk if the cost of risk reduction would exceed theimprovment gained

17ReSIST courseware — M. Kaâniche, K. Kanoun, J-C. Laprie — Dependability and Security Evaluation
Acceptable risk
� Various principles exist to determine acceptable risk:
� MEM: “Minimum Endogenous Mortality”� a new or modified system shall not "significantly" increase a
technologically caused death rate for any age group
� GAMAB: “Globalement au Moins Aussi Bon”, “Globally atleast as good”� any new solution shall in total be at least equally good as
the existing one
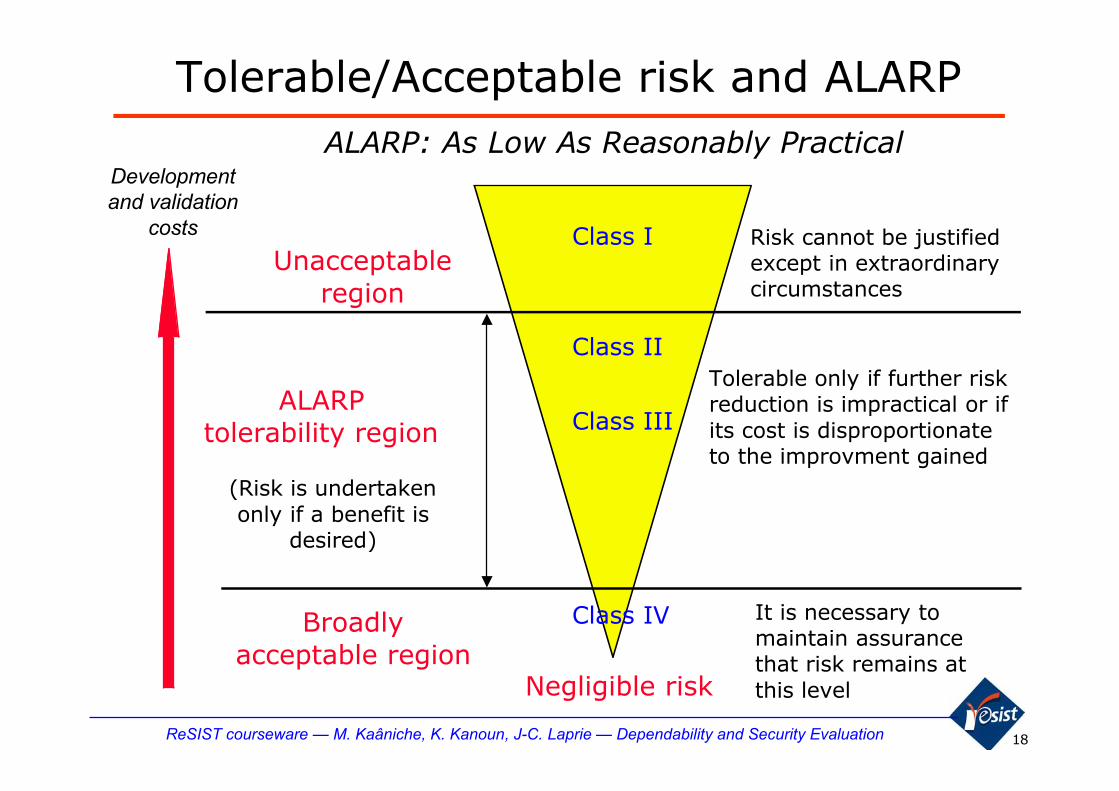
� ALARP: “As Low As Reasonably Practically”
� …
18ReSIST courseware — M. Kaâniche, K. Kanoun, J-C. Laprie — Dependability and Security Evaluation
Tolerable/Acceptable risk and ALARPALARP: As Low As Reasonably Practical
(Risk is undertakenonly if a benefit is
desired)
Risk cannot be justifiedexcept in extraordinarycircumstances
Unacceptableregion
ALARPtolerability region
Broadlyacceptable region
Negligible risk
Tolerable only if further riskreduction is impractical or ifits cost is disproportionateto the improvment gained
It is necessary tomaintain assurancethat risk remains atthis level
Developmentand validation
costs Class I
Class II
Class III
Class IV

19ReSIST courseware — M. Kaâniche, K. Kanoun, J-C. Laprie — Dependability and Security Evaluation
FMECA steps
� Breakdown the system into components
� Identify the functional structure and how thecomponents contribute to functions
� Define failure modes of each component, their causes,effects and severities
� Local effect: on the system element under study
� Global effect: on the highest considered system level
� Enumerate possible means to detect and isolate thefailures
� Identify mitigation actions to prevent or reduce theeffects of failure at the design level or in operation

20ReSIST courseware — M. Kaâniche, K. Kanoun, J-C. Laprie — Dependability and Security Evaluation
FMECA Worksheet
Ref.n° function
failuremode
failurecause
local
Description of unit
operationalmode
Description of failure Failure effect
global
Probabilityof occurrence
Criticalitylevel
Commentsdetectionmeans
correctiveactions
Detection & mitigation
21ReSIST courseware — M. Kaâniche, K. Kanoun, J-C. Laprie — Dependability and Security Evaluation
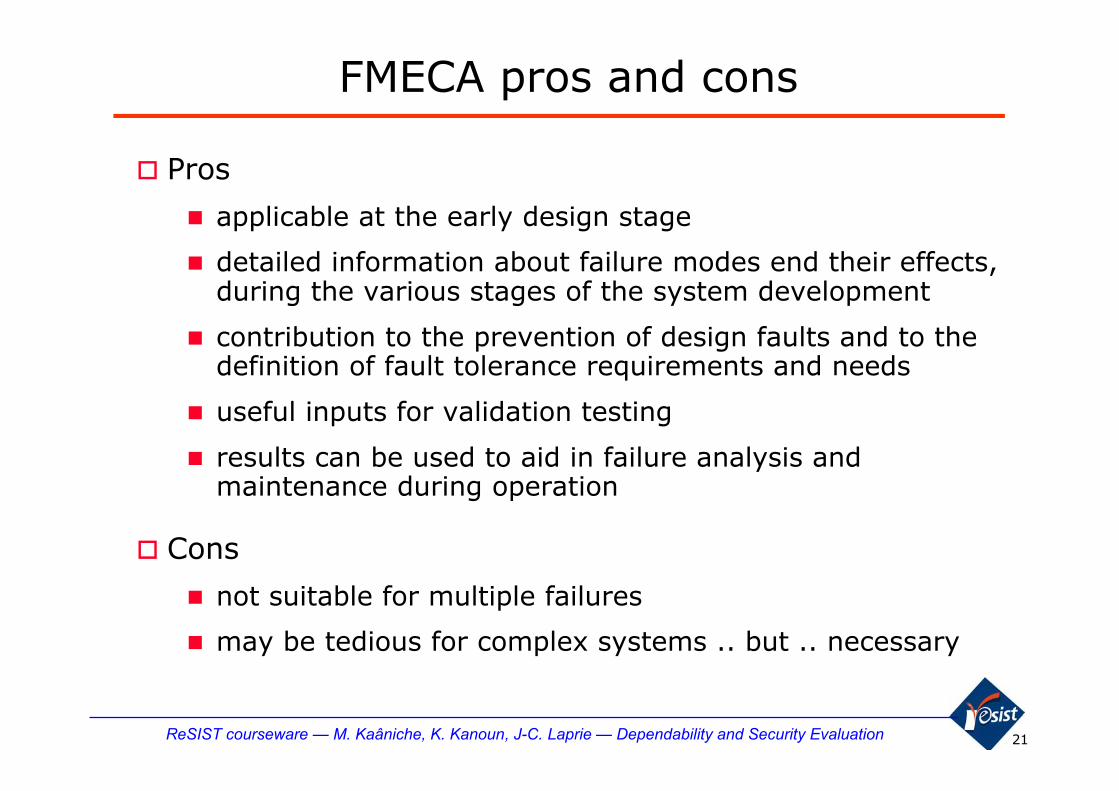
FMECA pros and cons
� Pros
� applicable at the early design stage
� detailed information about failure modes end their effects,during the various stages of the system development
� contribution to the prevention of design faults and to thedefinition of fault tolerance requirements and needs
� useful inputs for validation testing
� results can be used to aid in failure analysis andmaintenance during operation
� Cons
� not suitable for multiple failures
� may be tedious for complex systems .. but .. necessary
22ReSIST courseware — M. Kaâniche, K. Kanoun, J-C. Laprie — Dependability and Security Evaluation
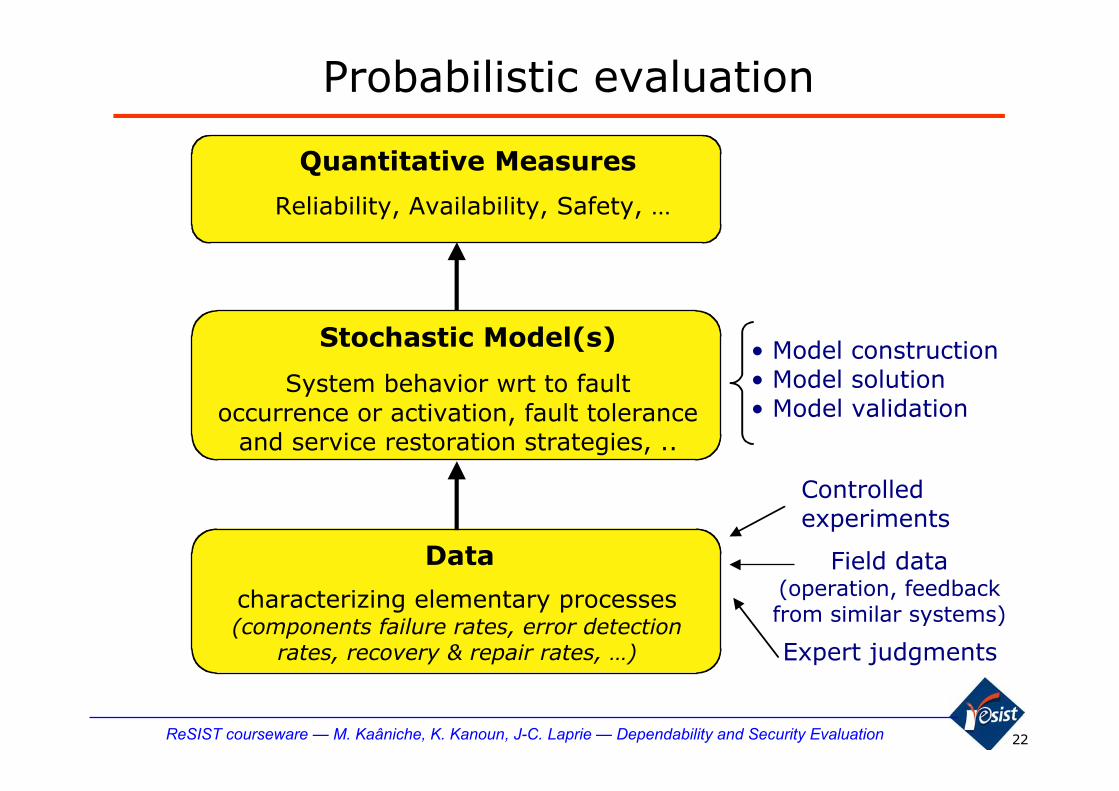
Probabilistic evaluation
Quantitative Measures
Reliability, Availability, Safety, …
Stochastic Model(s)
System behavior wrt to faultoccurrence or activation, fault tolerance
and service restoration strategies, ..
Data
characterizing elementary processes(components failure rates, error detection
rates, recovery & repair rates, …)
• Model construction• Model solution• Model validation
Controlledexperiments
Field data(operation, feedbackfrom similar systems)
Expert judgments

23ReSIST courseware — M. Kaâniche, K. Kanoun, J-C. Laprie — Dependability and Security Evaluation
Dependability measures
Service implementssystem function:
correct service
X = 1
Service does not implementsystem function:
incorrect service
X = 0
failure
restoration
Quantitative measures
Measure ofCONTINUOUSdelivery of a
correct service(time to failure)
MAINTAINABILITY RELIABILITY
Measure of deliverycorrect service
relative toALTERNATION
correct/incorrect
Measure ofCONTINUOUSdelivery of an
incorrect service(time to restoration)
AVAILABILITY

24ReSIST courseware — M. Kaâniche, K. Kanoun, J-C. Laprie — Dependability and Security Evaluation
Dependability measures
Reliability: Rk(u)=Prob. {θk > u} = Prob.{X(τ)=1 ∀ τ ∈ [tk-1, tk-1+u]}
Availability: A(t) = Prob. {X(t) = 1} = E {X(t)}
Maintainability: Mk(u) = Prob. {ξk ≤ u}
X(t)
1
0
timet1t0=0 t2 tk-1 tk
θ1 ξ1 θ2 ξ2 θk ξk
tk-1 t tk-1+θk
u

25ReSIST courseware — M. Kaâniche, K. Kanoun, J-C. Laprie — Dependability and Security Evaluation
Multi-performing systems
� More than two service delivery modes
� Correct service � progressive performance degradation
� Incorrect service � failure consequences
� X = {x1, x2, …xn}
� xk: service delivery modes (accomplishment levels)
� two extreme cases� 1 correct service mode — several incorrect service modes� Several correct service modes — 1 incorrect service mode
� xk are usually ordered, order induced by� performance levels: perf(x1) > perf(x2) > … > perf(xn)� criticality levels: crit(x1) < crit(x2) < … < cri(xn)
⇓x1 > x2 >…> xn

26ReSIST courseware — M. Kaâniche, K. Kanoun, J-C. Laprie — Dependability and Security Evaluation
Multi-performing systems: measures
� Reliability-like measures: continuous delivery of service according to modes {x1, …xp}
(time to service delivery in modes {xp+1, …xn})
x1 xp…… xn……
Rp(t) = Prob.{X(τ) ∈ {x1, …, xp} ∀ τ ∈ [0, t] }
� Availability-like measures:service delivery according to {x1, …xp} relative to alternationbetween modes {x1, …xn}
Ap(t) = Prob.{X(t) ∈ {x1, …, xp} }

27ReSIST courseware — M. Kaâniche, K. Kanoun, J-C. Laprie — Dependability and Security Evaluation
Particular cases
� 1 correct service mode: x1 = c
� 2 incorrect service modes with very different severity levels
� Benign incorrect service: x2 = ib� Catastrophic incorrect service: x3 = ic
R1(t) = Prob.{X(τ) = c ∀ τ ∈ [0, t] } � Reliability
R2(t) = Prob.{X(τ) ∈ {x1, x2} ∀ τ ∈ [0, t] } � Safety
x1=c
x2=ib
x3=ic
catastrophic failure
benign failure
restoration
28ReSIST courseware — M. Kaâniche, K. Kanoun, J-C. Laprie — Dependability and Security Evaluation
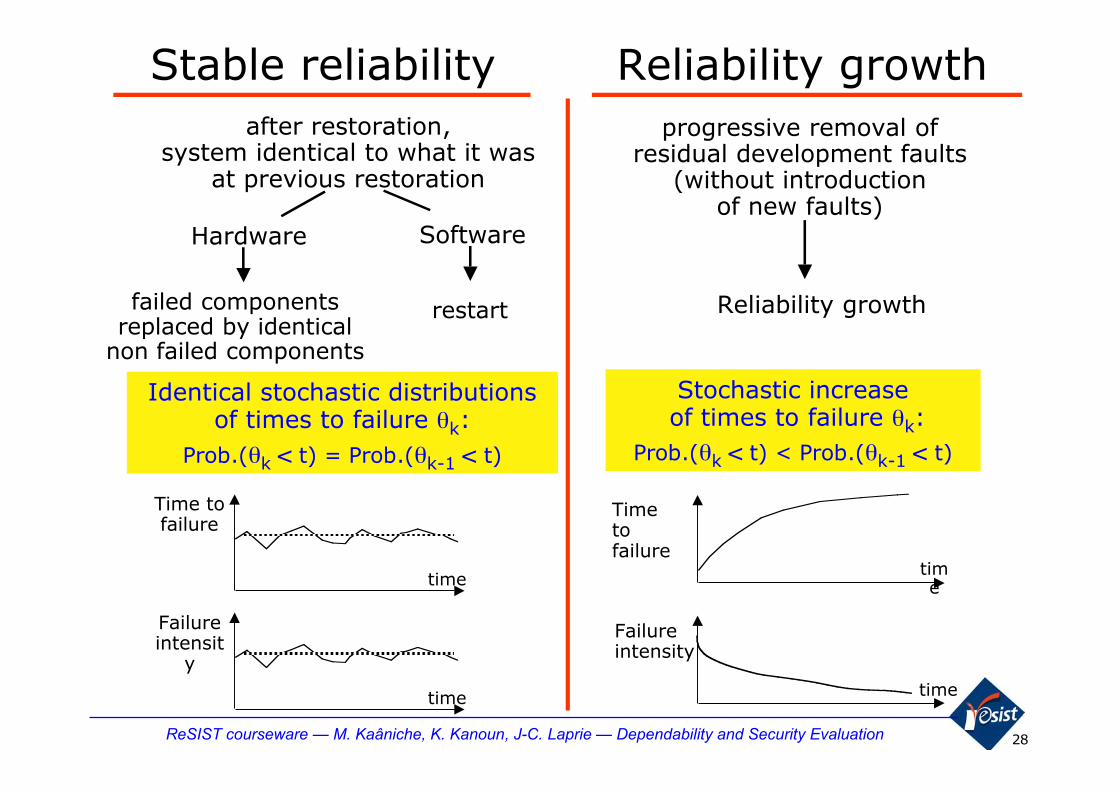
Stable reliability Reliability growth
Identical stochastic distributionsof times to failure θk:
Prob.(θk < t) = Prob.(θk-1 < t)
after restoration,system identical to what it was
at previous restoration
progressive removal ofresidual development faults
(without introductionof new faults)
failed componentsreplaced by identical
non failed components
Hardware Software
restart Reliability growth
time
Time tofailure
Stochastic increase of times to failure θk:
Prob.(θk < t) < Prob.(θk-1 < t)
time
Timetofailure
time
Failureintensit
ytime
Failureintensity

29ReSIST courseware — M. Kaâniche, K. Kanoun, J-C. Laprie — Dependability and Security Evaluation
Time to failure characterizationθ : time to failure random variable
(similar analysis when considering time to restoration ξ)
name symbol definition properties
Distributionfunction
ComplementaryDistrib. function(survival funct.)
F(t) Prob.(θ ≤ t)
R(t) Prob.(θ > t)
Probabilitydensity function f(t)
f(t).Δt= Prob.(t <θ≤ t+Δt)
f(t) = =dF(t)
dt
-dR(t)
dt
hazard ratez(t)
z(t).Δt= Prob.(θ≤t+Δt |θ>t)
z(t) =1
R(t)
-dR(t)
dt
monotonous increasingfunction: F(0)=0 F(∞)=1
monotonous decreasingfunction: R(0)=1 R(∞)=0
∫ f(t).dt = 10
∞
Mean time to failure : E(θ)=MTTF = ∫ t.f(t).dt0
∞= ∫ R(t).dt
0
∞

30ReSIST courseware — M. Kaâniche, K. Kanoun, J-C. Laprie — Dependability and Security Evaluation
Statistical estimationN identical systems tested under the same conditions during [t0, t]
� Times to failure identically distributed: F(t)
� N(t0) = Number of systems delivering correct service at t0 = N
� N(t) = Number of systems delivering correct service at time t
N independent executions
System fails before t System operational until t
F(t) R(t)
� N(t): random variable with Binomial distribution
nProb. [ N (t)=n ] = C [Rc(t)] • [1- R (t)]N
N-nn
E [ N(t)] = N. R(t)N(t)
N(t0)R(t, t+u) =
N(t+u)
N(t)⇒Estimator : R(t) =
^ ^
Bernouilli trials

31ReSIST courseware — M. Kaâniche, K. Kanoun, J-C. Laprie — Dependability and Security Evaluation
Statistical estimation
S1
S2
S3
S4
S5
S6
S7
N(t0) = 7 (1 - 7)
N(t) = 4 ( 3, 4, 5, 6)
N(t+u)= 2 ( 4, 6)
R(t) =N(t)
N(t0)= 1 -
N(t0) - N(t)
N(t0)⇒ F(t) =
N(t0) - N(t)
N(t0)
tt0 t+u
✰
✰
✰
✰
✰
✰
✰
^ ^
Example :
R(t) =N(t)
N(t0)^
=4
7
2
4R(t, t+u) =
N(t+u)
N(t)^
=

32ReSIST courseware — M. Kaâniche, K. Kanoun, J-C. Laprie — Dependability and Security Evaluation
Statistical estimation: f(t)
N(t0) = 7 (1 - 7)
N(t) = 5 (1, 3, 4, 6, 7)
N(t+Δt) = 3 (1, 3, 6)
f(t) = [ 1 -d dt N(t0)
]E[N(t)] = -1N(t0)
d E [ N(t)]dt
= limΔt = 0
E [ N(t)] - E [ N(t+Δt)]
N(t0) . Δt
S1
S2
S3
S4
S5
S6
S7
tt0 t+Δt
✰
✰
✰
✰
✰
✰
✰
Estimator : f(t) =^ N(t) - N(t+Δt)
N(t0) . Δt
f(t) =^ (5-3)
7
2
7=
f(t) = Prob.( t < θ≤ t+dt ) =dF(t)
dt
d [ 1-R(t)]dt
=

33ReSIST courseware — M. Kaâniche, K. Kanoun, J-C. Laprie — Dependability and Security Evaluation
Statistical estimation: z(t)
N(t0) = 7 (1 - 7)
N(t) = 5 (1, 3, 4, 6, 7)
N(t+Δt) = 3 (1, 3, 6)
z(t) = -1E [N(t)]
d E [ N(t)]dt
= limΔt = 0
E [ N(t)] - E [ N(t+Δt)]
N(t) . Δt
S1
S2
S3
S4
S5
S6
S7
tt0 t+Δt
✰
✰
✰
✰
✰
✰
✰
Estimator : z(t) =^ N(t) - N(t+Δt)
N(t0) . Δt
z(t) =^ (5-3)
5
2
5=
z(t) = d [ 1-R(t)]R(t). dt

34ReSIST courseware — M. Kaâniche, K. Kanoun, J-C. Laprie — Dependability and Security Evaluation
Statistical estimation: MTTF
0 ≤ θ(1) ≤ θ(2)≤ …… ≤ θ(N)
^ 1
NEstimator : MTTF = [ θ (1)
+ θ(2) +…… + θ(N) ]= Σ1
N
N
i = 1
θ(i)
S1
S2
S3
.
.
.
SN
time
✰
✰
✰
✰
✰
✰
✰
θ(2) θ(N)θ(1)
35ReSIST courseware — M. Kaâniche, K. Kanoun, J-C. Laprie — Dependability and Security Evaluation
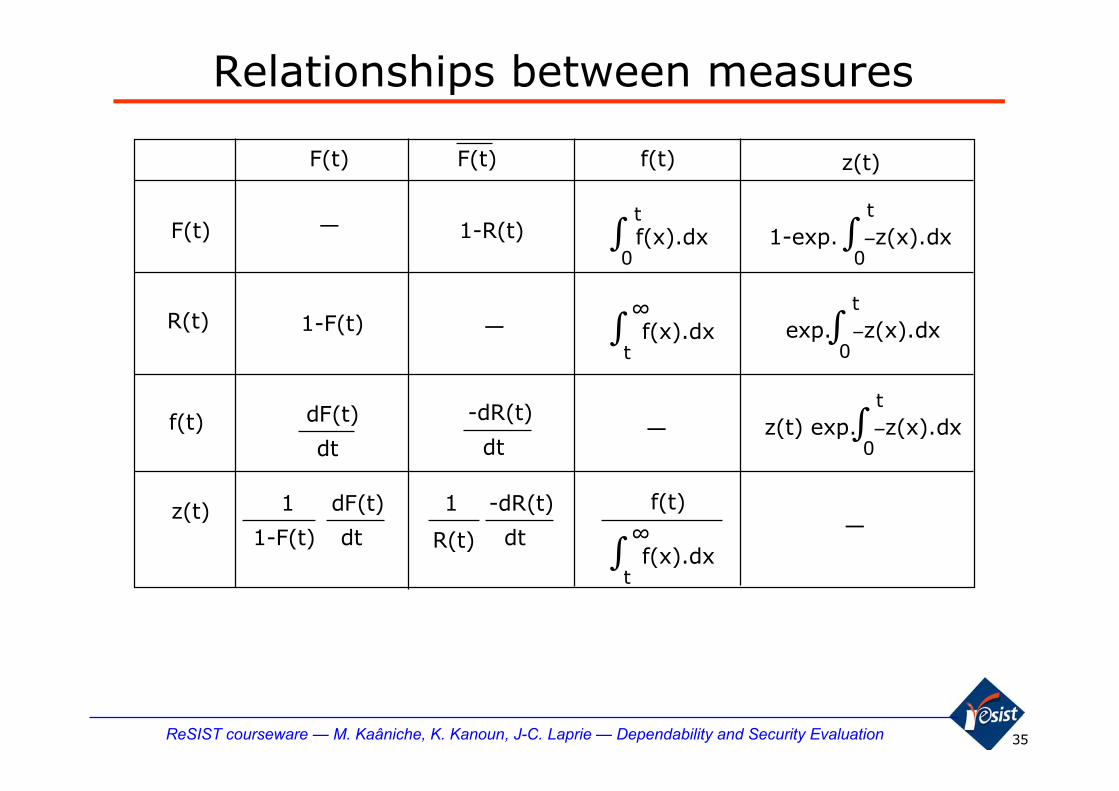
Relationships between measures
F(t)
F(t)
R(t)
f(t) -dR(t)
dt
z(t) 1
R(t)
-dR(t)
dt
∫ f(x).dx0
t
F(t) f(t) z(t)
1-R(t)
∫ f(x).dxt
∞
∫ −z(x).dx0
t1-exp.
1-F(t) ∫ −z(x).dx0
texp.
dF(t)
dt∫ −z(x).dx0
tz(t) exp.
1 dF(t)
dt1-F(t)
f(t)
∫ f(x).dxt
∞
—
—
—
—

36ReSIST courseware — M. Kaâniche, K. Kanoun, J-C. Laprie — Dependability and Security Evaluation
Operation : λ(t) ≈ constant = λ
λ(t)
t
design operation wearout
accidental faultsDevelopmentfaults, production
defects
Hardware components failure rate

37ReSIST courseware — M. Kaâniche, K. Kanoun, J-C. Laprie — Dependability and Security Evaluation
Constant failure rate� z(t) = constant = λ ⇒ θ exponentially distributed
f(t) = λ exp.(-λt)
E(θ) = MTTF = 1/λ
R(t) = exp.(-λt)
⇒z(t) =1
R(t)
-dR(t)dt
= λ F(t) = 1 - exp.(-λt)
Prob. {correct service until t+T | correct service until t) =Prob.(correct service until t+T)
R(t+T)
R(t)= = exp (-λT)
� Exponential distribution: memoryless property
Prob.(correct service until t)
� Number of failures per unit of time: a Homogeneous Poisson Process
38ReSIST courseware — M. Kaâniche, K. Kanoun, J-C. Laprie — Dependability and Security Evaluation
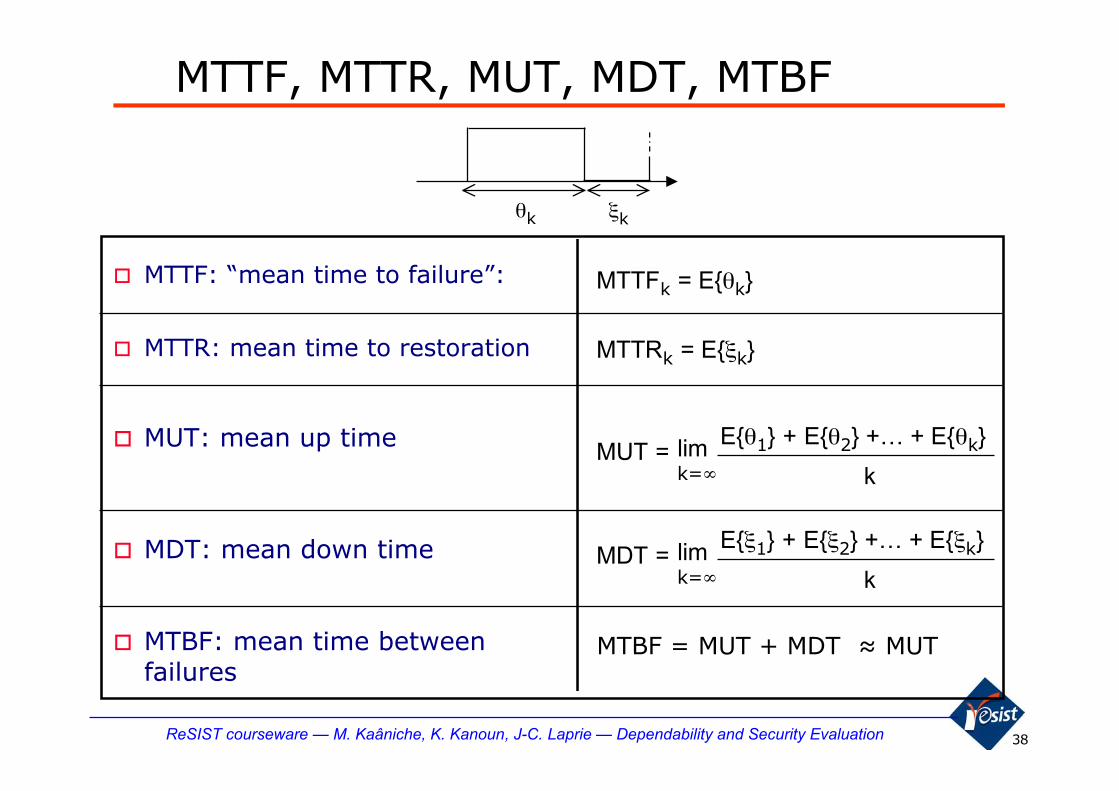
MTTF, MTTR, MUT, MDT, MTBF
� MUT: mean up time
� MTBF: mean time betweenfailures
MUT = limk=∞
E{θ1} + E{θ2} +… + E{θk}
k
� MDT: mean down time MDT = limk=∞
E{ξ1} + E{ξ2} +… + E{ξk}
k
MTBF = MUT + MDT ≈ MUT
� MTTF: “mean time to failure”: MTTFk = E{θk}
� MTTR: mean time to restoration MTTRk = E{ξk}
θk ξk

39ReSIST courseware — M. Kaâniche, K. Kanoun, J-C. Laprie — Dependability and Security Evaluation
Availability
� A(t) = Prob. {X(t) = 1} = E {X(t)} A(t) = 1-A(t) = Prob. {X(t) = 0}
� U(T): cumulated uptime (“correct service delivery time”) in [0,T]
Average Availability in [0,T] = proportion of cumulated uptime in [0,T]
E {U(T)} =1T
E { X(t)dt} =1T
∫ T
0E {X(t)}dt =1
T∫ T
0Aav(T)A(t) dt =1
T∫ T
0
� Steady-state Availability:
A = MUT
MUT+MDTA = 1-A =
MDT
MUT+MDT
Availability
UnavailabilityDowntime (min/year)
0.99
5256
0.01
0.999
525.6
0.001
0.9999
52.56
0.0001
0.99999
5.256
0.00001
0.999999
0.5256
0.000001
A= lim A(t) = lim Aav(T)t=∞ T=∞
⇐ stable reliability

40ReSIST courseware — M. Kaâniche, K. Kanoun, J-C. Laprie — Dependability and Security Evaluation
Single component system� Failure rate: λ ⇒ MTTF = 1/λ
A(t+dt)= Prob. (correct service at t AND no failure in [t, t+dt] ) + Prob. (incorrect service at t AND restoration in [t, t+dt] )
A(t+dt) = A(t) (1- λdt) + (1-A(t)) μdt
dA(t)
dt= μ - (λ+μ)A(t)⇒
� Reliability: R(t) = F(t)= exp.(-λt)
� Restoration rate: μ ⇒ MTTR =1/μ
� Availability: A(t)
A(t)
1
0
A(0)=1μ
λ + μ
≈ 1/μ
exp. (-(λ + μ)t)μ
λ + μ+
λ
λ + μA(t)=
t
A(0)=0
μ
λ + μ[1-exp. (- (λ + μ)t]A(t)=

41ReSIST courseware — M. Kaâniche, K. Kanoun, J-C. Laprie — Dependability and Security Evaluation
System-Level DependabilityModeling Techniques
Probabilistic Evaluation

42ReSIST courseware — M. Kaâniche, K. Kanoun, J-C. Laprie — Dependability and Security Evaluation
Multi-component systems modelling
� Model construction � describe system behavior takinginto account:
� structure
� components failures, fault tolerance/restoration strategies
� Model processing � evaluate quantitative measures
Combinatorial models(Reliability block diagrams,
fault trees, reliability graphs, ..)
State-based models(Markov chains, Stochastic Petrinets, non-Markovian models, ..)
Stochasticallyindependent components
Stochasticdependencies
43ReSIST courseware — M. Kaâniche, K. Kanoun, J-C. Laprie — Dependability and Security Evaluation
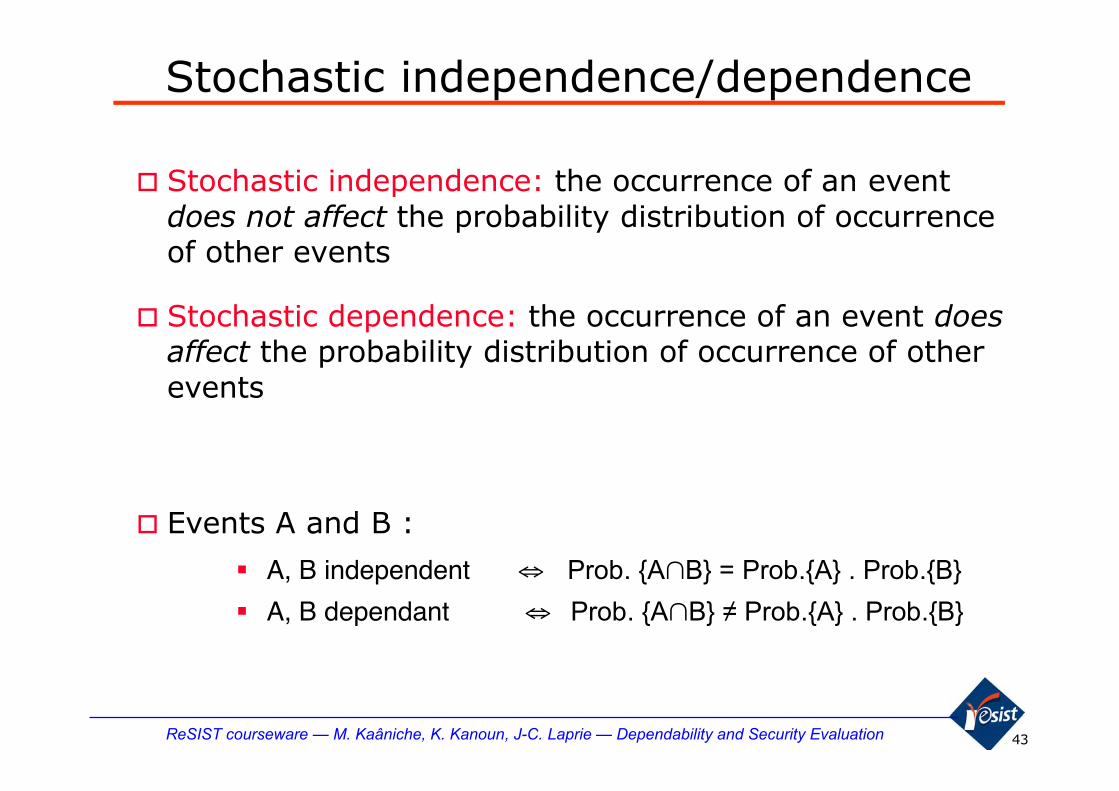
Stochastic independence/dependence
� Stochastic independence: the occurrence of an eventdoes not affect the probability distribution of occurrenceof other events
� Stochastic dependence: the occurrence of an event doesaffect the probability distribution of occurrence of otherevents
� Events A and B :
� A, B independent ⇔ Prob. {A∩B} = Prob.{A} . Prob.{B}
� A, B dependant ⇔ Prob. {A∩B} ≠ Prob.{A} . Prob.{B}

44ReSIST courseware — M. Kaâniche, K. Kanoun, J-C. Laprie — Dependability and Security Evaluation
Reliability Block Diagrams� Graph topology describing how components reliability
affect system reliability
� each component represented as a block
SERIESnon-redundant systems
Component1
Components whose failure lead tosystem failure
Component2
Componentn
PARALLELredundant systems
Component1
Component2
Componentn
Components whose failure lead tosystem failure only in
combination with others
GRAPH PATH ⇔ CORRECT SERVICE
45ReSIST courseware — M. Kaâniche, K. Kanoun, J-C. Laprie — Dependability and Security Evaluation
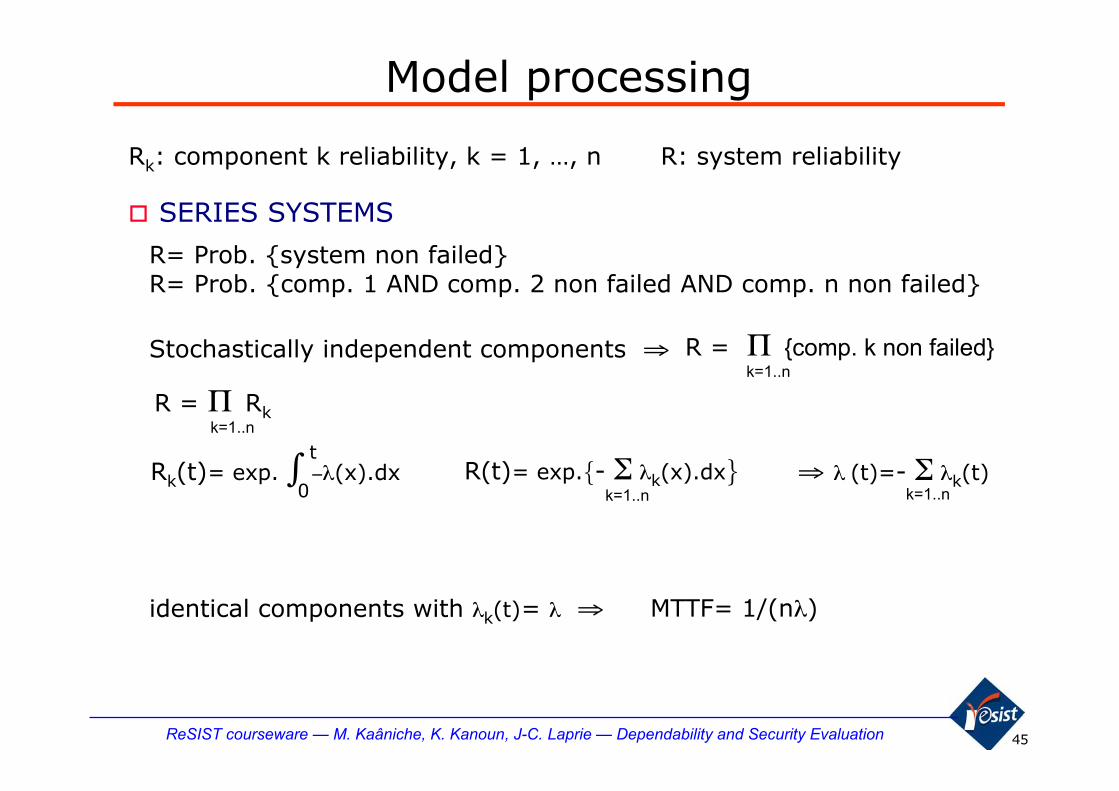
Model processing
Rk: component k reliability, k = 1, …, n R: system reliability
� SERIES SYSTEMS
R= Prob. {system non failed}R= Prob. {comp. 1 AND comp. 2 non failed AND comp. n non failed}
Stochastically independent components ⇒ R = Π {comp. k non failed}k=1..n
R = Π Rkk=1..n
∫ −λ(x).dxt
Rk(t)= exp.0
R(t)= exp.{- Σ λk(x).dx}k=1..n
⇒ λ (t)=- Σ λk(t)k=1..n
identical components with λk(t)= λ ⇒ MTTF= 1/(nλ)

46ReSIST courseware — M. Kaâniche, K. Kanoun, J-C. Laprie — Dependability and Security Evaluation
Model processingModel processing
�PARALLEL SYSTEMS
� System failed only when All components failed
1- R = Π (1 - Rk) ⇒ R = 1 - Π (1 - Rk)
Rk (t) = exp( - λk t) ⇒ R (t) = 1 - Π (1 -exp( - λkt))
Identical components: ⇒ MTTF = {Σ 1/k }. 1/ λ
The MTTF of a parallel system with n components is higher than the MTTFof a single component ( n = 2 ⇒ improvement factor 1.5 )
k=1, .,n
k=1..n k=1..n
k=1..n

47ReSIST courseware — M. Kaâniche, K. Kanoun, J-C. Laprie — Dependability and Security Evaluation
Parallel-Series systems
C21
C23
C22
C111
C12
C112
C11
C1 C2
R 11 = R 111 . R 112
R 1 = 1 - (1 - R 11) . (1 - R 12)
R 2 = 1 - (1 - R 21) . (1 - R 22) . (1 - R 23)
R = R 1 . R 2

48ReSIST courseware — M. Kaâniche, K. Kanoun, J-C. Laprie — Dependability and Security Evaluation
“k-out of-n” systems with voter
� n components and a voter
� System non failed when less than k components failed
C1
C2
Cn
k/n..
RC: reliability of Component j j=1,…n (identical comp.)
Rv: reliability of Voter
R: system reliability
R (t) = [ C [Rc(t)] • [1- Rc(t)] ] • Rv j=k
∑n
jn
n-jj
49ReSIST courseware — M. Kaâniche, K. Kanoun, J-C. Laprie — Dependability and Security Evaluation
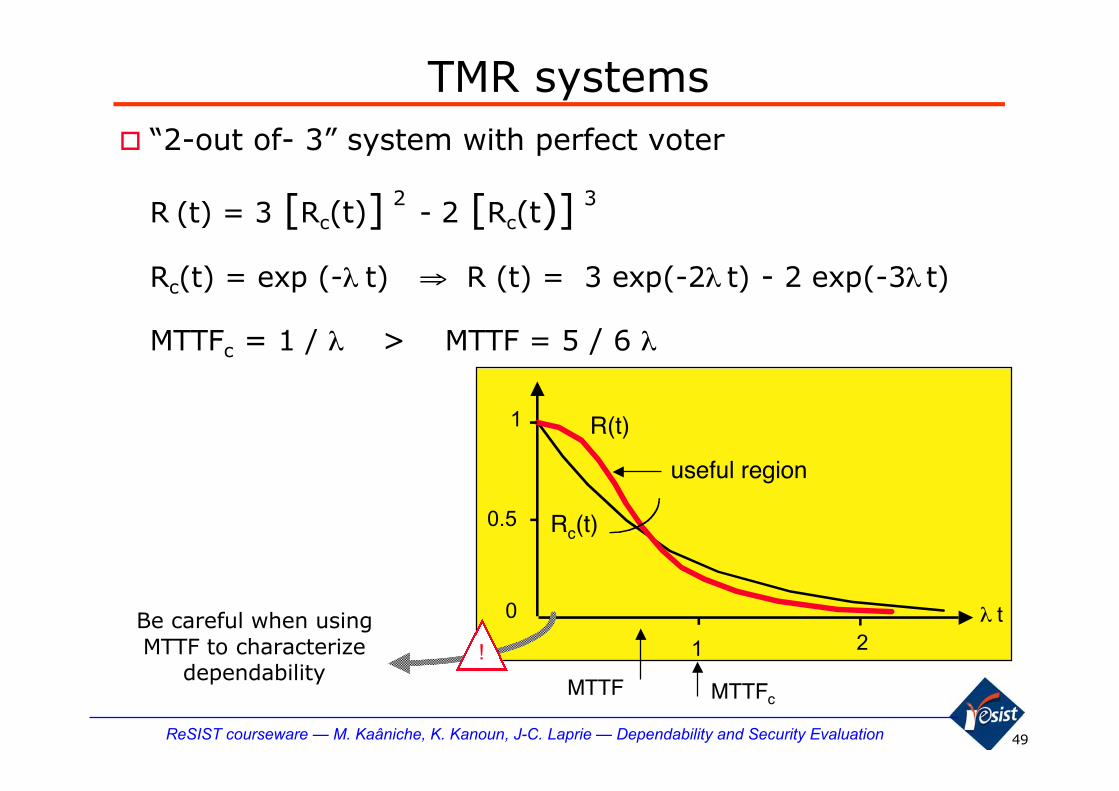
TMR systems� “2-out of- 3” system with perfect voter
R (t) = 3 [Rc(t)] 2 - 2 [Rc(t)]
3
Rc(t) = exp (-λ t) ⇒ R (t) = 3 exp(-2λ t) - 2 exp(-3λ t)
MTTFc = 1 / λ > MTTF = 5 / 6 λ
MTTF MTTFc
1 2
1
0.5
λ t
Rc(t)
R(t)
useful region
0
!
Be careful when usingMTTF to characterize
dependability

50ReSIST courseware — M. Kaâniche, K. Kanoun, J-C. Laprie — Dependability and Security Evaluation
More complex structuresMore complex structures
� transform into a “series-parallel” topology
C2 operational at t : C2 failed at t :
R(t) = Prob. { system operational during [0, t] / C2 operational at t } . R2 + Prob. {system operational during [0, t] / C2 failed at t } . (1- R2)
R(t) = {1 - (1- R4).(1- R5) }. R2 + {1 - (1- R1R4).(1- R3R5) } . (1- R2)
C1
C2
C3
C4
C5
C4
C5
C1
C3
C4
C5

51ReSIST courseware — M. Kaâniche, K. Kanoun, J-C. Laprie — Dependability and Security Evaluation
Availability evaluation
� The same approach can be applied provided that thecomponents are stochastically independent with respectto failures AND restorations ⇒ 1 repairman percomponent
Ak: component k availability, k=1, …, n
A: system availability
A = Π Akk=1..n
A = 1- Π {1- Ak}k=1..n
Series systems:
Parallel systems:

52ReSIST courseware — M. Kaâniche, K. Kanoun, J-C. Laprie — Dependability and Security Evaluation
System with n components and m replicas ofeach component
1 2 n
1 2 n
1 2 n
n components
mcomponents
1
1
1
n components
2
2
2
n
n
n
Architecture GR: Global Redundancy Architecture LR: Local Redundancy
ri(t) = Reliability of component i
R t r tGR i
i
nm( ) [ ( )]= − −
=
∏1 11
R t r tLR im
i
n
( ) [ ( ( )) ]= − −=
∏ 1 11
53ReSIST courseware — M. Kaâniche, K. Kanoun, J-C. Laprie — Dependability and Security Evaluation
System with n components and m replicas ofeach component
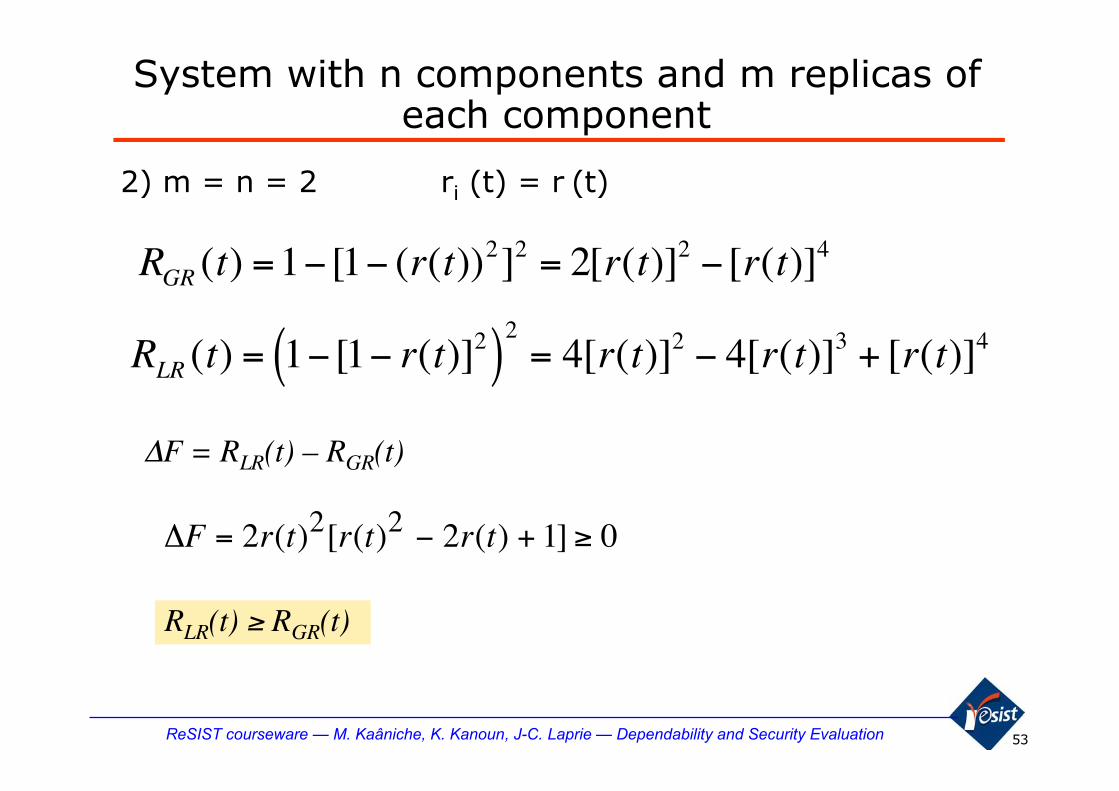
2) m = n = 2 ri (t) = r (t)
ΔF = RLR(t) – RGR(t)
R t r t r t r tGR ( ) [ ( ( )) ] [ ( )] [ ( )]= − − = −1 1 22 2 2 4
R t r t r t r t r tLR ( ) [ ( )] [ ( )] [ ( )] [ ( )]= − −( ) = − +1 1 4 42 2 2 3 4
ΔF r t r t r t= − + ≥2 2 1 02 2( ) [ ( ) ( ) ]
RLR(t) ≥ RGR(t)
54ReSIST courseware — M. Kaâniche, K. Kanoun, J-C. Laprie — Dependability and Security Evaluation
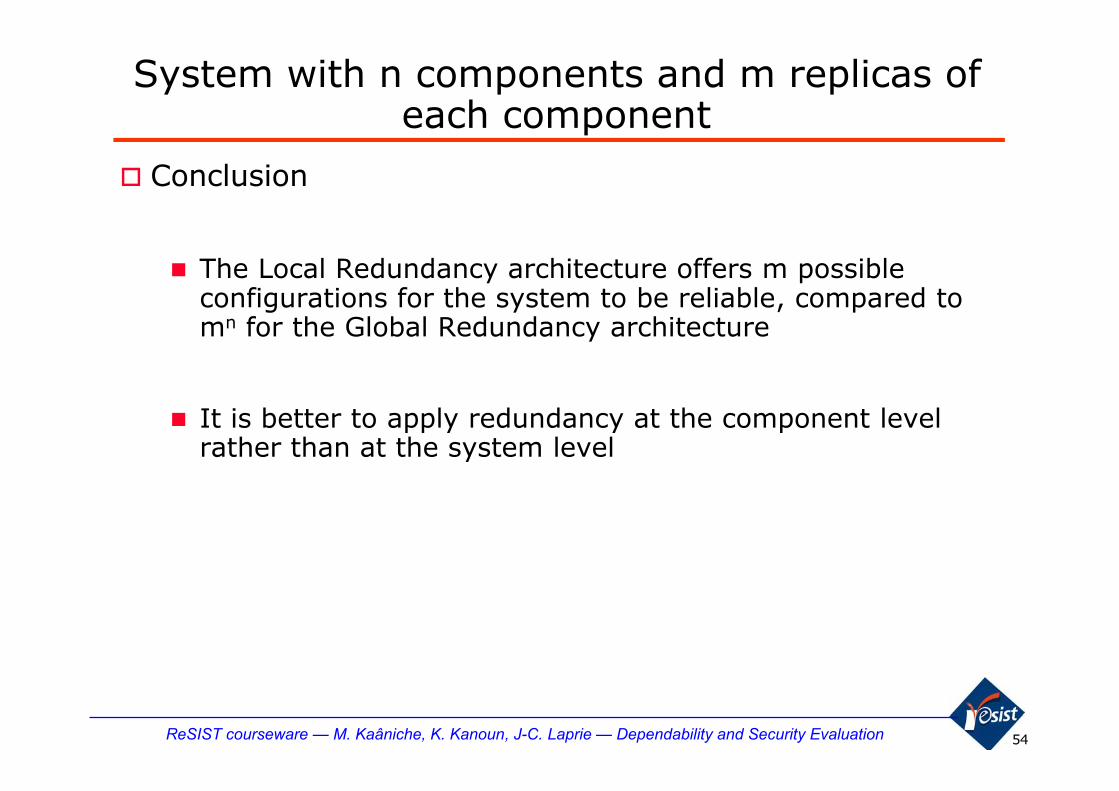
System with n components and m replicas ofeach component
� Conclusion
� The Local Redundancy architecture offers m possibleconfigurations for the system to be reliable, compared tomn for the Global Redundancy architecture
� It is better to apply redundancy at the component levelrather than at the system level

55ReSIST courseware — M. Kaâniche, K. Kanoun, J-C. Laprie — Dependability and Security Evaluation
Fault trees
� Deductive top-down approach: effects ➣ causes
� Starting from an undesirable event, represent graphicallyits possible causes (combinations of events)
� Combination of events: Logical gates
AND OR
Basic gates
E E
E1 E2 E1 E2
Decomposable event:
Elementary event:

56ReSIST courseware — M. Kaâniche, K. Kanoun, J-C. Laprie — Dependability and Security Evaluation
Example
� System: 3 components X, Y, Z� X, Y: parallel
� Z: series with {X,Y}
X
YZ
Elementary events: failures of X, Y, ZSystem event: system failure
System failure
{X,Y} failureZ failure
X failure Y failure

57ReSIST courseware — M. Kaâniche, K. Kanoun, J-C. Laprie — Dependability and Security Evaluation
Model processing
Stochastically independent components
� AND gate
� Output event E occurs when input events E1 AND E2 AND … En occur
� Two elementary events:
E = E1∩ E2 ∩ … ∩ En
Prob.(E) = Prob.(E1) . Prob.(E2). … . Prob.(En)
� OR gate
� Output event E occurs when input event E1 OR E2 … OR En occur
E = E1∪ E2 ∪ … ∪ En
E = E1∩ E2 ∩ … ∩ En
Prob.(E) = 1 - [1 - Prob.(E1)] . [1 - Prob.(E2)]. … . [1 - Prob.(En)]
E = E1∪ E2
Prob.(E) = Prob.(E1) + Prob.(E2) - Prob.(E1). Prob. (E2)]

58ReSIST courseware — M. Kaâniche, K. Kanoun, J-C. Laprie — Dependability and Security Evaluation
ExampleSystem failure
{X,Y} failureZ failure
X failure Y failure
[1 - RX] [1 - RY]
1 - RZ
1 - RX 1 - RY
1 - R = 1 - RZ + [1 - RX] . [1 - RY] - [1 - RZ] [1 - RX][1 - RY]
R = RZ [RX + RY - RX RY]
⇓

59ReSIST courseware — M. Kaâniche, K. Kanoun, J-C. Laprie — Dependability and Security Evaluation
Minimal cut sets
� Cut set
� set of events whose simultaneous occurrence leads to theoccurrence of the top event of the tree
� Minimal cut-set
� Cut-set that does not include any other
� Order: number of events of the cut set� Order 1: a single event could lead to Top event
� Each minimal cut set of a fault tree describes significantcombination of faults that could lead to system failure
� Critical components
� Identify design weaknesses � redundancy needs
60ReSIST courseware — M. Kaâniche, K. Kanoun, J-C. Laprie — Dependability and Security Evaluation
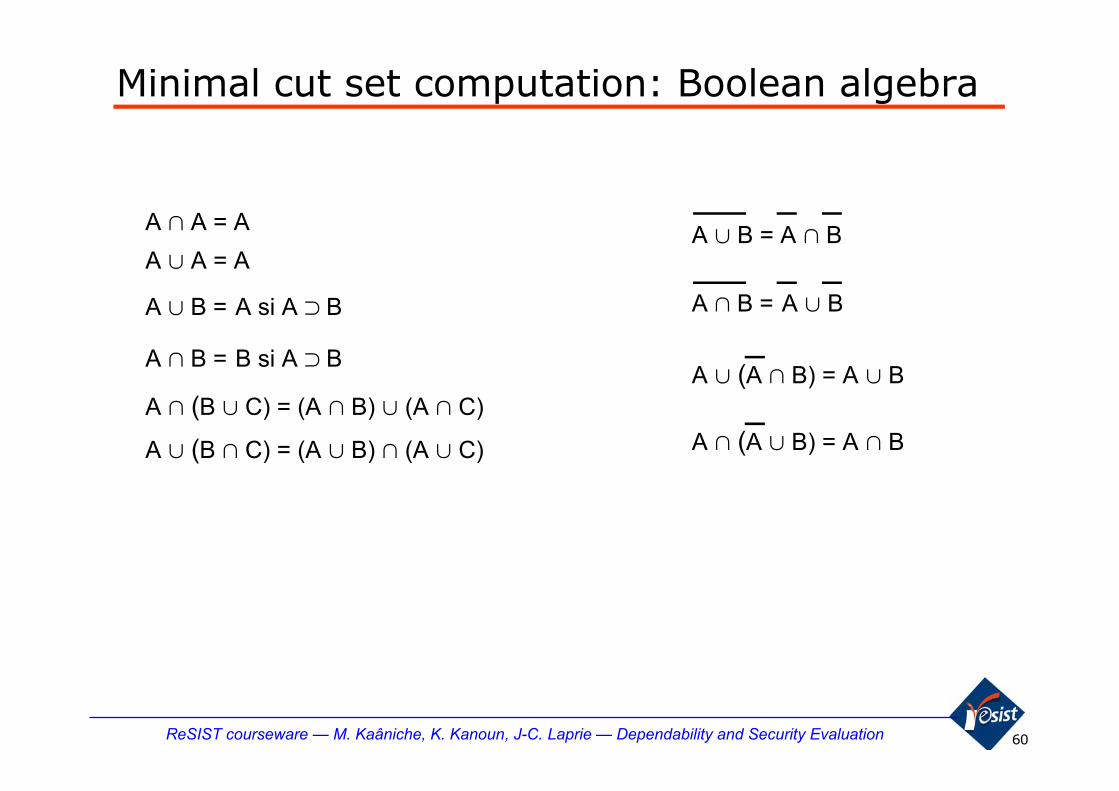
Minimal cut set computation: Boolean algebra
A ∩ A = A
A ∪ A = A
A ∪ B = A si A ⊃ B
A ∩ B = B si A ⊃ B
A ∩ (B ∪ C) = (A ∩ B) ∪ (A ∩ C)
A ∪ (B ∩ C) = (A ∪ B) ∩ (A ∪ C)
A ∪ B = A ∩ B
A ∩ B = A ∪ B
A ∪ (A ∩ B) = A ∪ B
A ∩ (A ∪ B) = A ∩ B
61ReSIST courseware — M. Kaâniche, K. Kanoun, J-C. Laprie — Dependability and Security Evaluation
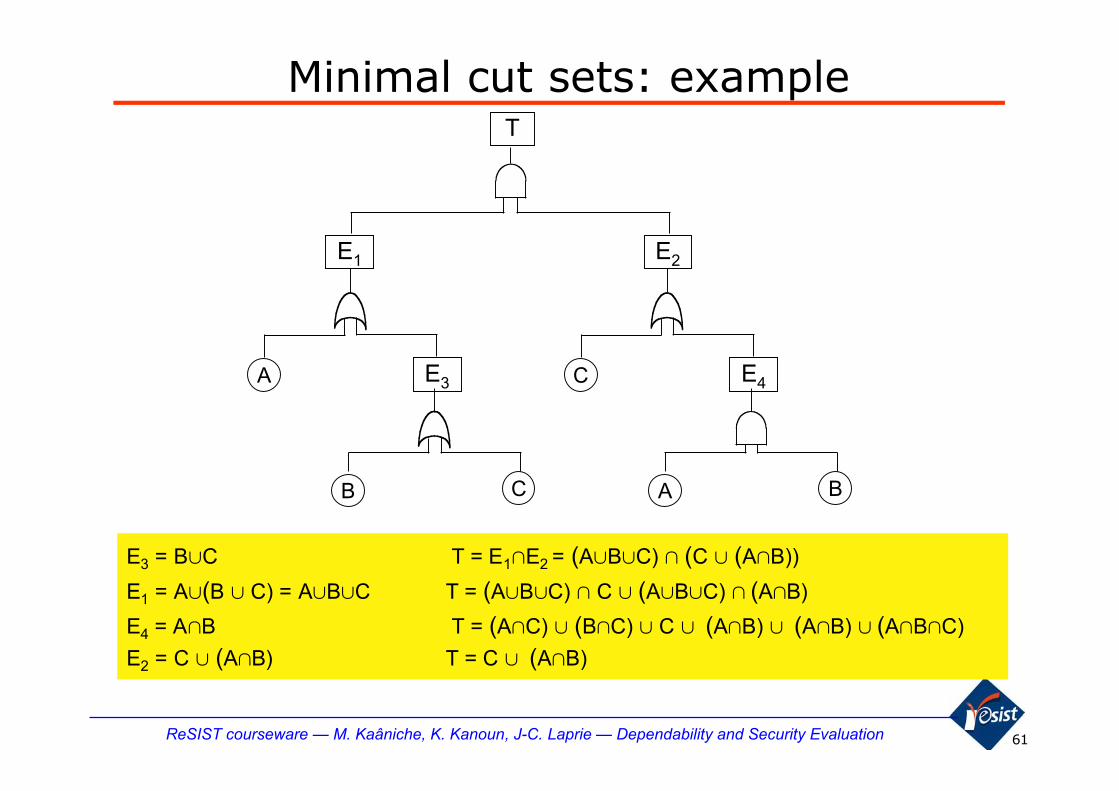
Minimal cut sets: example
E3 = B∪C T = E1∩E2 = (A∪B∪C) ∩ (C ∪ (A∩B))
E1 = A∪(B ∪ C) = A∪B∪C T = (A∪B∪C) ∩ C ∪ (A∪B∪C) ∩ (A∩B)
E4 = A∩B T = (A∩C) ∪ (B∩C) ∪ C ∪ (A∩B) ∪ (A∩B) ∪ (A∩B∩C)
E2 = C ∪ (A∩B) T = C ∪ (A∩B)
T
E1 E2
E3A
B C
E4C
A B

62ReSIST courseware — M. Kaâniche, K. Kanoun, J-C. Laprie — Dependability and Security Evaluation
Reduced fault tree
Prob.{T}= Prob.{C∪(A∩B)}= Prob.{C}+Prob.{A} Prob.{B} - Prob.{A} Prob.{B} Prob.{C}
T
EC
A B

63ReSIST courseware — M. Kaâniche, K. Kanoun, J-C. Laprie — Dependability and Security Evaluation
Cut sets: Reliability computation
Prob.(T)bounds: ∑ Prob.{Ci} - ∑ ∑ Prob.{Ci ∩ Cj}≤ Prob.{T}≤∑ Prob.{Ci}
i = 1
m
j = 2
m
i = 1
j-1
i = 1
m
Prob.{T} ≈ ∑ Prob.{Ci}i = 1
m
Ci minimal cut set - order mi : Ci = E1i ∩ E2i ∩ … ∩ Emi
Emi : basic events T : top event
Prob.{T} = P{C1 ∪ C2 ∪ … Cm }
Prob.{T} = ∑ Prob.{Ci} - ∑ ∑ Prob.{Ci ∩ Cj}
+ ∑ ∑ ∑ Prob.{Ci ∩ Cj} + … (-1)m Prob.{Ci ∩ Cj … ∩ Cm}
j = 2
m
i = 1
j-1
i = 1
m
k = 3
m
j = 2
k-1
i = 1
j-1
If probability of occurrence of basic events small:

64ReSIST courseware — M. Kaâniche, K. Kanoun, J-C. Laprie — Dependability and Security Evaluation
Reliability block diagrams & Fault trees
� Pros
� useful support to understand system failures andrelationships with components failures
� Model processing is easy: powerful tools exist
� Helpful to identify weak points in the design
� Cons
� Components and events should be stochasticallyindependent� some extensions take into account some kinds of
dependencies (e.g., extended fault trees)

65ReSIST courseware — M. Kaâniche, K. Kanoun, J-C. Laprie — Dependability and Security Evaluation
Stochastic dependencies: example� system with two components: C1 (primary), C2 (standby)
λ1
C1
λ2(t)
λ2sb
λ2a
t
C1 failure
C2
C2 standby C2 active
λ1(t)
0 ⇒ λ1 exp (- λ1τ) dτ exp (- λ2sbτ) exp (- λ2a (t - τ))∫ t
R(t) = exp (- λ1t) + λ1 exp (- λ2a t ) ∫ exp (- (λ1+ λ2sb- λ2a)τ) dτ0
t
R(t) = Prob. {System operational during [0, t]}� C1 operational during [0, t] ⇒ exp (- λ1t)� C1 fails at τ AND C2 nonfailed during [0, τ ] AND C2 operational during [τ, t]
R(t) = exp (- λ1t) + λ1 exp (- λ2a t ) { (1- exp (- (λ1+ λ2sb- λ2a)t}/(λ1+ λ2sb- λ2a)

66ReSIST courseware — M. Kaâniche, K. Kanoun, J-C. Laprie — Dependability and Security Evaluation
State-based models
� Example
� system: two components X,Y; 1 repairman per component
� component states:� Xc, Yc (correct service); Xi, Yi (incorrect service)
� system states: (Xc, Yc), (Xi, Yc), (Xc, Yi), (Xi, Yi)
failure Y ( Xc, Yi )
( Xi, Yc )
( Xi, Yi )( Xc, Yc )
restoration Yrestoration X
failure X
failure X failure Y
restoration Xrestoration Y
①
②
④
③
Redundant system:� Correct service: ①, ②, ③� Incorrect service: ④
Nonredundant system:� Correct service: ①� Incorrect service: ②, ③, ④
67ReSIST courseware — M. Kaâniche, K. Kanoun, J-C. Laprie — Dependability and Security Evaluation
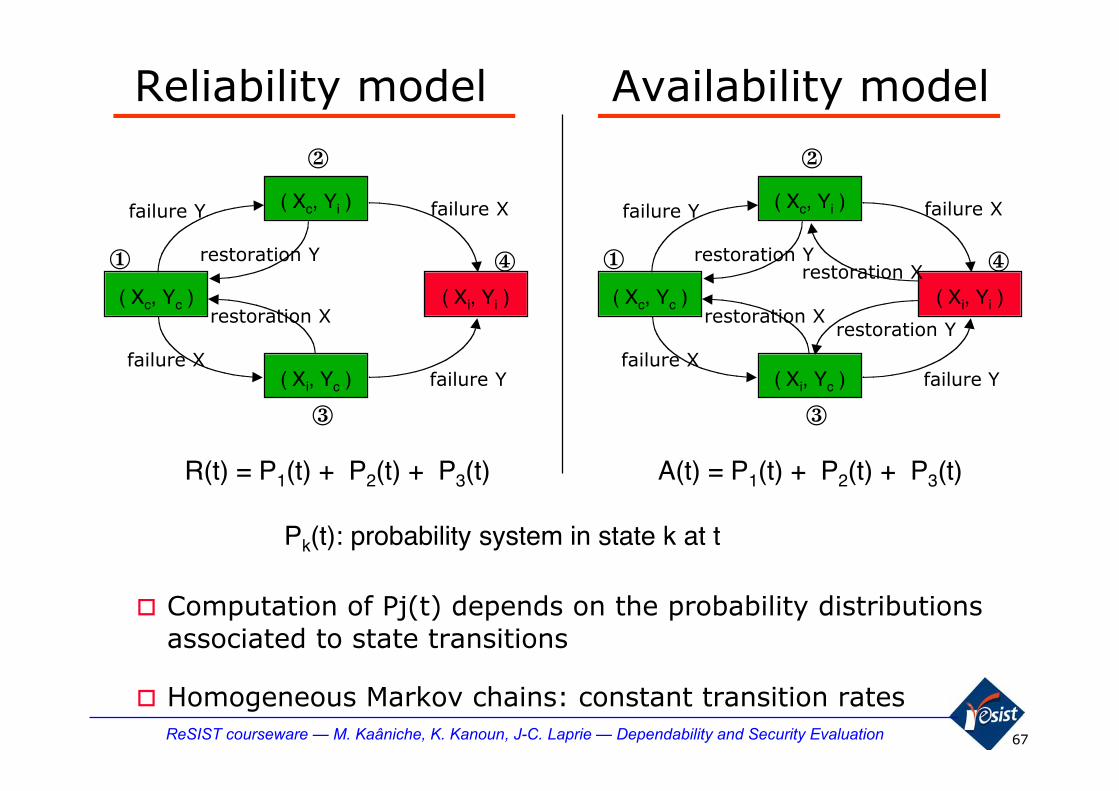
Reliability model
� Computation of Pj(t) depends on the probability distributionsassociated to state transitions
� Homogeneous Markov chains: constant transition rates
Availability model
failure Y ( Xc, Yi )
( Xi, Yc )
( Xi, Yi )( Xc, Yc )
restoration Y
failure X
failure Xfailure Y
restoration X
①
②
④
③
failure Y ( Xc, Yi )
( Xi, Yc )
( Xi, Yi )( Xc, Yc )
restoration Yrestoration X
failure X
failure Xfailure Y
restoration Xrestoration Y
①
②
④
③
A(t) = P1(t) + P2(t) + P3(t)R(t) = P1(t) + P2(t) + P3(t)
Pk(t): probability system in state k at t
68ReSIST courseware — M. Kaâniche, K. Kanoun, J-C. Laprie — Dependability and Security Evaluation
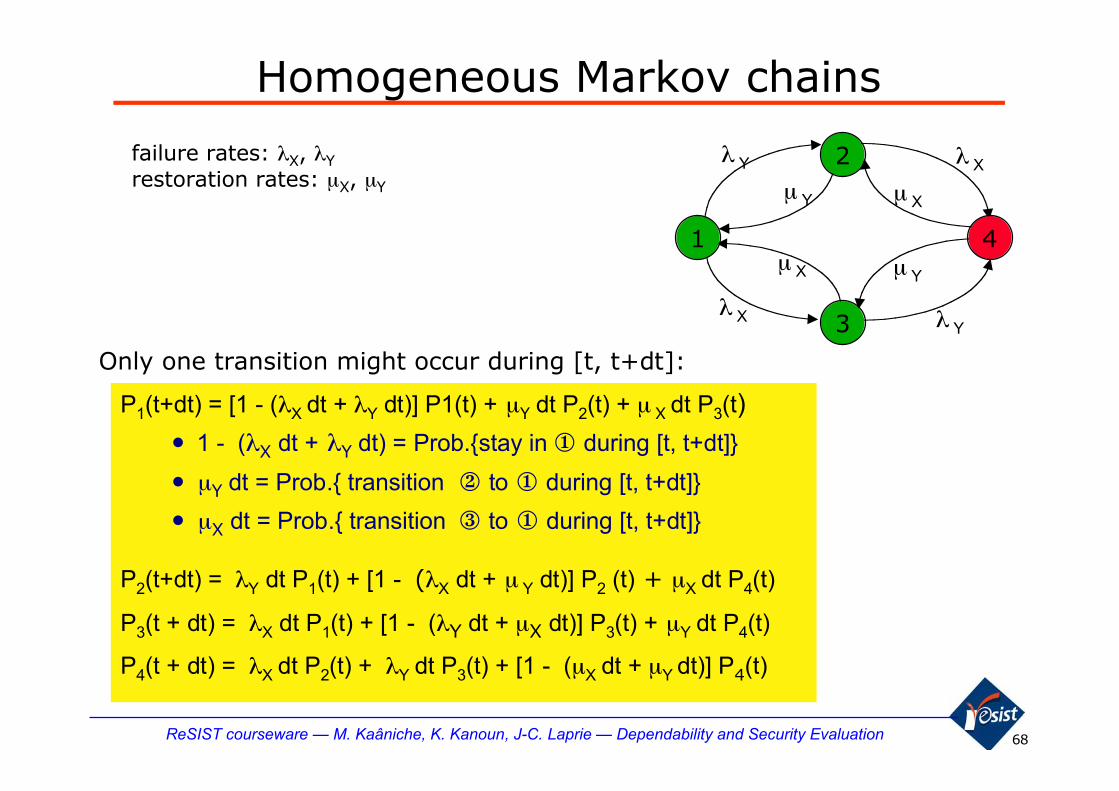
Homogeneous Markov chains
failure rates: λX, λYrestoration rates: μX, μY
P1(t+dt) = [1 - (λX dt + λY dt)] P1(t) + μY dt P2(t) + μ X dt P3(t)
• 1 - (λX dt + λY dt) = Prob.{stay in ① during [t, t+dt]}
• μY dt = Prob.{ transition ② to ① during [t, t+dt]}
• μX dt = Prob.{ transition ③ to ① during [t, t+dt]}
P2(t+dt) = λY dt P1(t) + [1 - (λX dt + μ Y dt)] P2 (t) + μX dt P4(t)
P3(t + dt) = λX dt P1(t) + [1 - (λY dt + μX dt)] P3(t) + μY dt P4(t)
P4(t + dt) = λX dt P2(t) + λY dt P3(t) + [1 - (μX dt + μY dt)] P4(t)
Only one transition might occur during [t, t+dt]:
λ X
λ Y
μ Y
μ X
μ X
λ X
λ Y
μ Y
1
2
3
4
69ReSIST courseware — M. Kaâniche, K. Kanoun, J-C. Laprie — Dependability and Security Evaluation
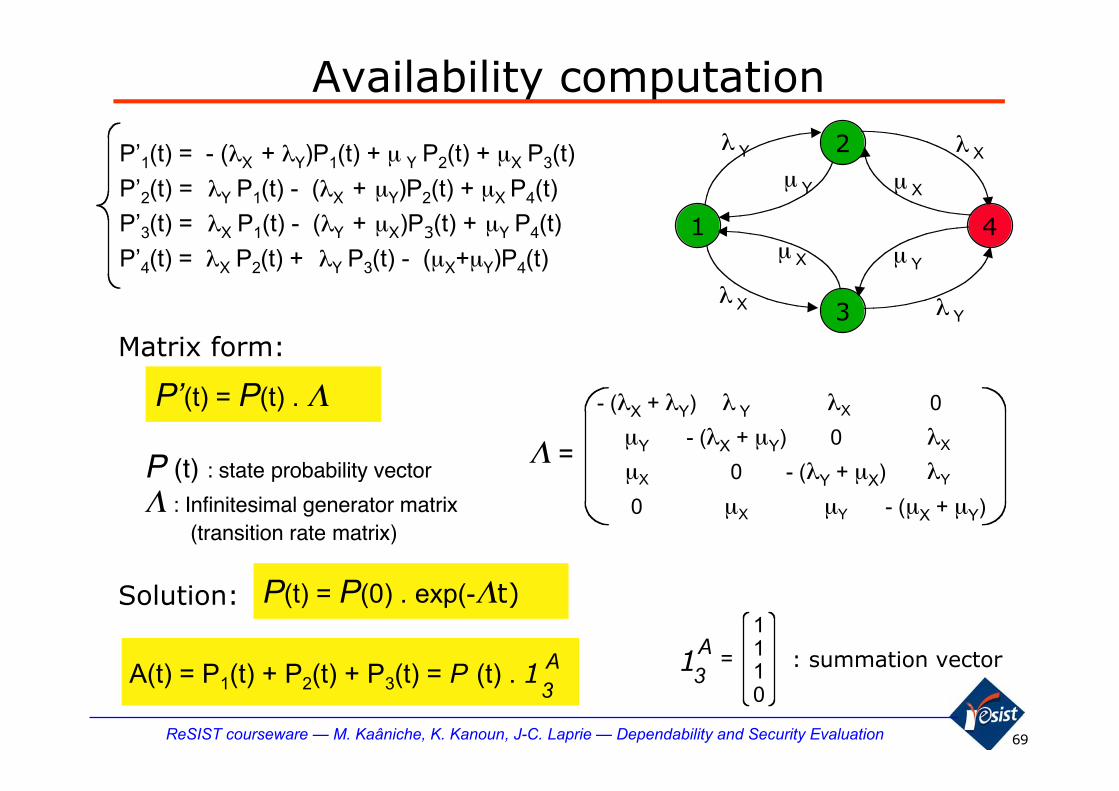
Availability computation
λ X
λ Y
μ Y
μ X
μ X
λ X
λ Y
μ Y
1
2
3
4
P’1(t) = - (λX + λY)P1(t) + μ Y P2(t) + μX P3(t)
P’2(t) = λY P1(t) - (λX + μY)P2(t) + μX P4(t)
P’3(t) = λX P1(t) - (λY + μX)P3(t) + μY P4(t)
P’4(t) = λX P2(t) + λY P3(t) - (μX+μY)P4(t)
Matrix form:
P’(t) = P(t) . Λ - (λX + λY) λ Y λX 0
μY - (λX + μY) 0 λX
μX 0 - (λY + μX) λY
0 μX μY - (μX + μY)
Λ =P (t) : state probability vector
Λ : Infinitesimal generator matrix (transition rate matrix)
3AA(t) = P1(t) + P2(t) + P3(t) = P (t) . 1 : summation vector=
1110
13A
Solution: P(t) = P(0) . exp(-Λt)
70ReSIST courseware — M. Kaâniche, K. Kanoun, J-C. Laprie — Dependability and Security Evaluation
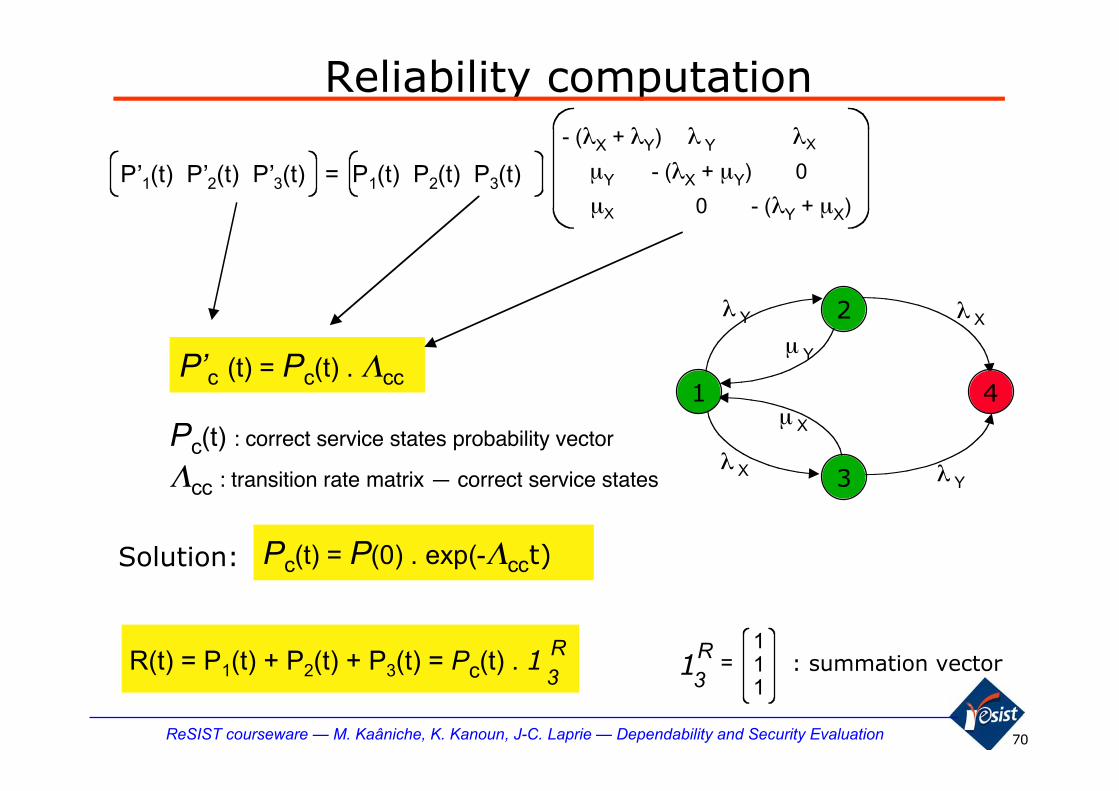
Reliability computation
λ X
λ Y
μ Y
μ X
λ X
λ Y
1
2
3
4P’c (t) = Pc(t) . Λcc
- (λX + λY) λ Y λX
μY - (λX + μY) 0
μX 0 - (λY + μX)
P’1(t) P’2(t) P’3(t) = P1(t) P2(t) P3(t)
Pc(t) : correct service states probability vector
Λcc : transition rate matrix — correct service states
3RR(t) = P1(t) + P2(t) + P3(t) = Pc(t) . 1 : summation vector=
111
13R
Solution: Pc(t) = P(0) . exp(-Λcct)
71ReSIST courseware — M. Kaâniche, K. Kanoun, J-C. Laprie — Dependability and Security Evaluation
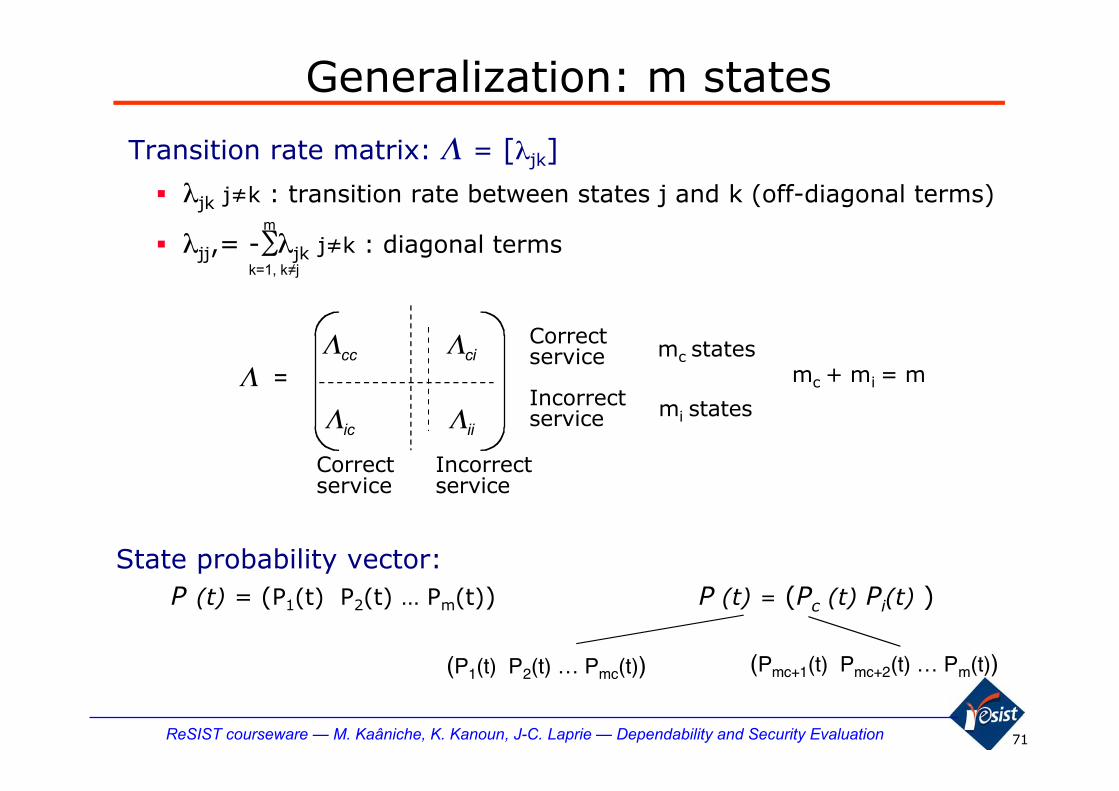
Generalization: m states
Transition rate matrix: Λ = [λjk]
State probability vector: P (t) = (P1(t) P2(t) … Pm(t)) P (t) = (Pc (t) Pi(t) )
� λjk j≠k : transition rate between states j and k (off-diagonal terms)
� λjj,= - λjk j≠k : diagonal terms k=1, k≠j
∑m
Λcc Λci
Λic Λii
Λ =
Correctservice
Incorrectservice
mc states
mi states
Correctservice
Incorrectservice
mc + mi = m
(P1(t) P2(t) … Pmc(t)) (Pmc+1(t) Pmc+2(t) … Pm(t))

72ReSIST courseware — M. Kaâniche, K. Kanoun, J-C. Laprie — Dependability and Security Evaluation
Quantitative measures: summary
� A (t) = P(0) . exp (Λ t) . 1mc
� A = lim A(t) = Πc . 1mc
� Πc = (0 0 … 0 1j 0 … 0) . Λj . 1mc
� Λj = obtained from Λ by replacing jth column by “1”
� R(t) = Pc(0) . exp (Λcct) . 1mc
� MTTF = -Pc(0) . Λcc . 1mc
� MTTR = -Pi (0) . Λii . 1mi
� MUT =
� MDT =
Πc . 1mc
Πc . Λ ci . 1mi
MUT + MDT = MTBF =Πc . Λ ci . 1mi
1
Πi . 1mi
Πc . Λ ci . 1mi
mc "1", mi "0"=
1 . .10 . .0
1mcA
mc "1"= 1mc
1 . .
1
A
A
mi "1"= 1mi
1 . .
1
-1 A
-1
-1
t=∞

73ReSIST courseware — M. Kaâniche, K. Kanoun, J-C. Laprie — Dependability and Security Evaluation
exp [Λ t ]: solution methodsexp [Λ t ]: solution methods
� Taylor series
� Numerical integration P’ (t) = P (t) . ΛΛΛΛ : Runge-Kutta
� Uniformization
� Laplace Transforms
� Analytical approximation
Problem: Model Stiffness
msec
Error & Fault handling
sec hour day month year
failures
maintenance
solicitation
Time to occurrence or duration of considered events
74ReSIST courseware — M. Kaâniche, K. Kanoun, J-C. Laprie — Dependability and Security Evaluation
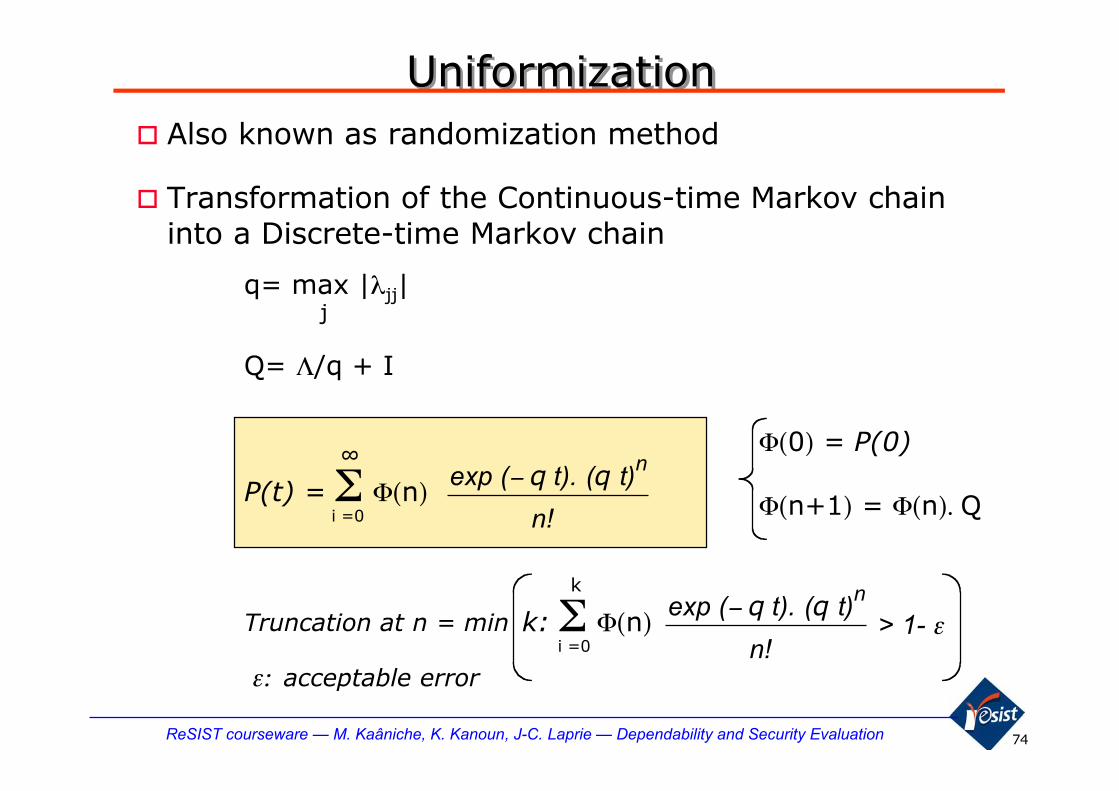
UniformizationUniformization� Also known as randomization method
� Transformation of the Continuous-time Markov chaininto a Discrete-time Markov chain
q= max |λjj|j
Q= Λ/q + I
P(t) = Σ Φ(n)exp (− q t). (q t)
n
i =0
∞
n! Φ(n+1) = Φ(n). Q
Φ(0) = P(0)
Truncation at n = min k: Σ Φ(n)exp (− q t). (q t)
n
i =0
k
n!> 1- ε
ε: acceptable error
75ReSIST courseware — M. Kaâniche, K. Kanoun, J-C. Laprie — Dependability and Security Evaluation
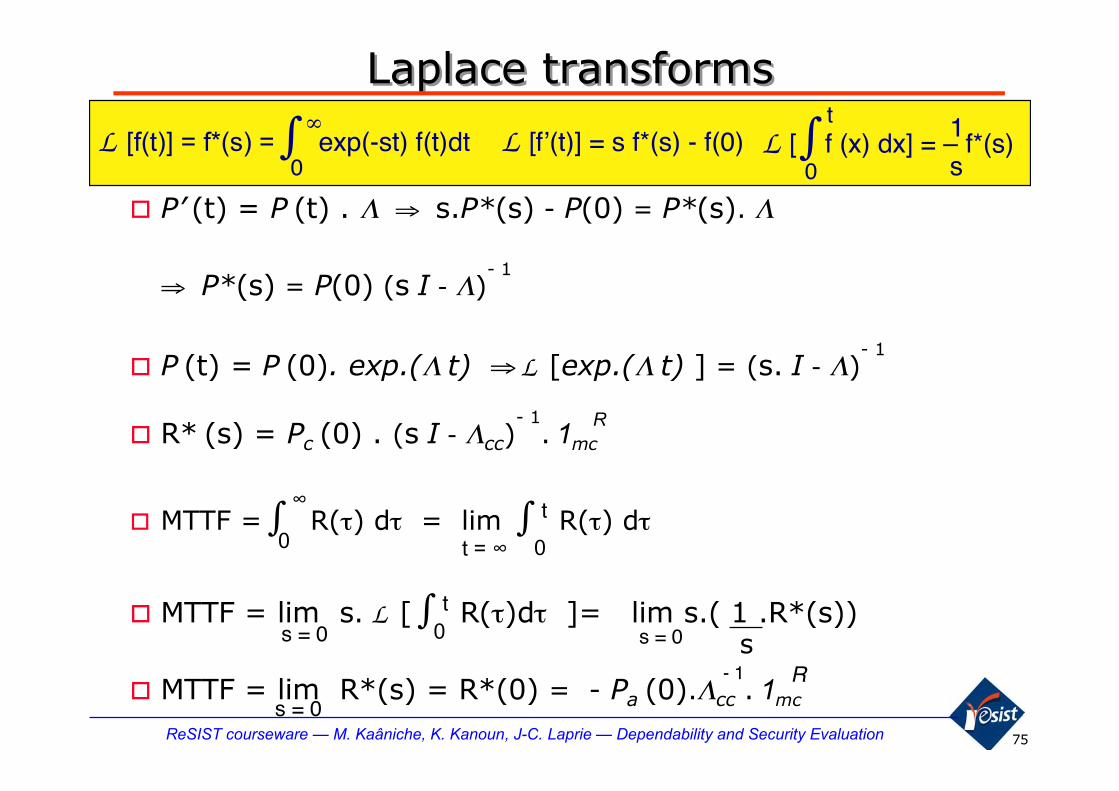
Laplace transformsLaplace transforms
� P’ (t) = P (t) . Λ ⇒ s.P*(s) - P(0) = P*(s). Λ
⇒ P*(s) = P(0) (s I - Λ)- 1
� P (t) = P (0). exp.(Λ t) ⇒ L [exp.(Λ t) ] = (s. I - Λ)- 1
� R* (s) = Pc (0) . (s I - Λcc)- 1
. 1mc
� MTTF = ∫ R(τ) dτ = lim ∫ R(τ) dτ
� MTTF = lim s. L [ ∫ R(τ)dτ ]= lim s.( 1 .R*(s))
� MTTF = lim R*(s) = R*(0) = - Pa (0).Λcc . 1mc
0
∞
t = ∞
s = 0 s- 1 R
R
0
t
0t
s = 0
s = 0
L [f’(t)] = s f*(s) - f(0) L [f(t)] = f*(s) = exp(-st) f(t)dt∫0
∞L [ ∫ f (x) dx] = – f*(s)
0
t 1
s

76ReSIST courseware — M. Kaâniche, K. Kanoun, J-C. Laprie — Dependability and Security Evaluation
Example: Two component system,1 repairman per component
Example: Two component system,1 repairman per component
� Availability
Λ =
- 2 λ 2 λ 0
μ - (λ + μ ) λ
0 2 μ - 2 μ
s I - Λ =s+2 λ -2 λ 0
-μ s+λ+μ -λ
0 -2 μ s+2 μdet. (s I - Λ ) = s (s+λ+μ) [s + 2(λ+μ)]
A * (s) = (1 0 0 ) . (s I - Λ)- 1
110
= s 2 + 3(λ+μ) s + 2μ(2λ+μ)
det (s I - Λ )
A (t) = μ (μ + 2λ)(μ + λ)2
exp (- (μ + λ)t)
steady-stateavailability : A λ « μ ⇒ negligible terms as soon as t » 1/μ
+2λ2
(μ + λ)2exp (- 2 (μ + λ)t)-
λ2
(μ + λ)2
2 λ
μ 2 μ
λ
31 2

77ReSIST courseware — M. Kaâniche, K. Kanoun, J-C. Laprie — Dependability and Security Evaluation
Example: Two component system, 1 repairman per component
Example: Two component system, 1 repairman per component
� Direct computation of steady-state availability
Λ2 =
- 2 λ 1 0
μ 1 λ
0 1 - 2 μ
A = ( 0 1 0 ) . Λ2 . -1
A1mc = ( 1 1 0 ) det (Λ2) = 2(μ + λ)
= μ (μ + 2λ)(μ + λ) 2
2
Λaa =- 2 λ 2 λ
μ - (λ + μ )s I - Λaa =
s+2 λ -2 λ
-μ s+λ+μ
det (s I - Λaa ) = s2 + (3λ+μ)s + 2λ2 s1,2 = - (μ+3λ) ± √μ2 + 6μλ+λ2
2
R* (s)= s + μ + 3λ
(s - s1) (s - s2 ) R (t)=
s1 + μ + 3λ
s1 - s2
exp(s1 t) - s2 + μ + 3λ
s1 - s2
exp(s2 t)
s1 ≈ μ
-2λ2
s2 ≈ -μ λ « μ ⇒ R(t) ≈ (1 + 2 ) exp( - t) - 2 λ2
μ2 μ2λ2 λ2
μ2 exp(- μ t) ≈ exp( - t)μ2λ2
� Reliability
110

78ReSIST courseware — M. Kaâniche, K. Kanoun, J-C. Laprie — Dependability and Security Evaluation
Example: Two component system, 1 repairman per component
Example: Two component system, 1 repairman per component
� Mean times
MTTF = - (1 0) . Λcc -1 1
1MTTF =
μ + 3λ
2 λ2≈
μ
2 λ2
MUT = μ + 2λ
2 λ2≈
μ
2 λ2
MDT = 1 2 μ
MTBF = MUT + MDT = 2 μλ2(μ + λ)2
λeq ≈ μ
2λ2
� Conclusion� the system behaves as a single component with a constant
failure rate λeq
79ReSIST courseware — M. Kaâniche, K. Kanoun, J-C. Laprie — Dependability and Security Evaluation
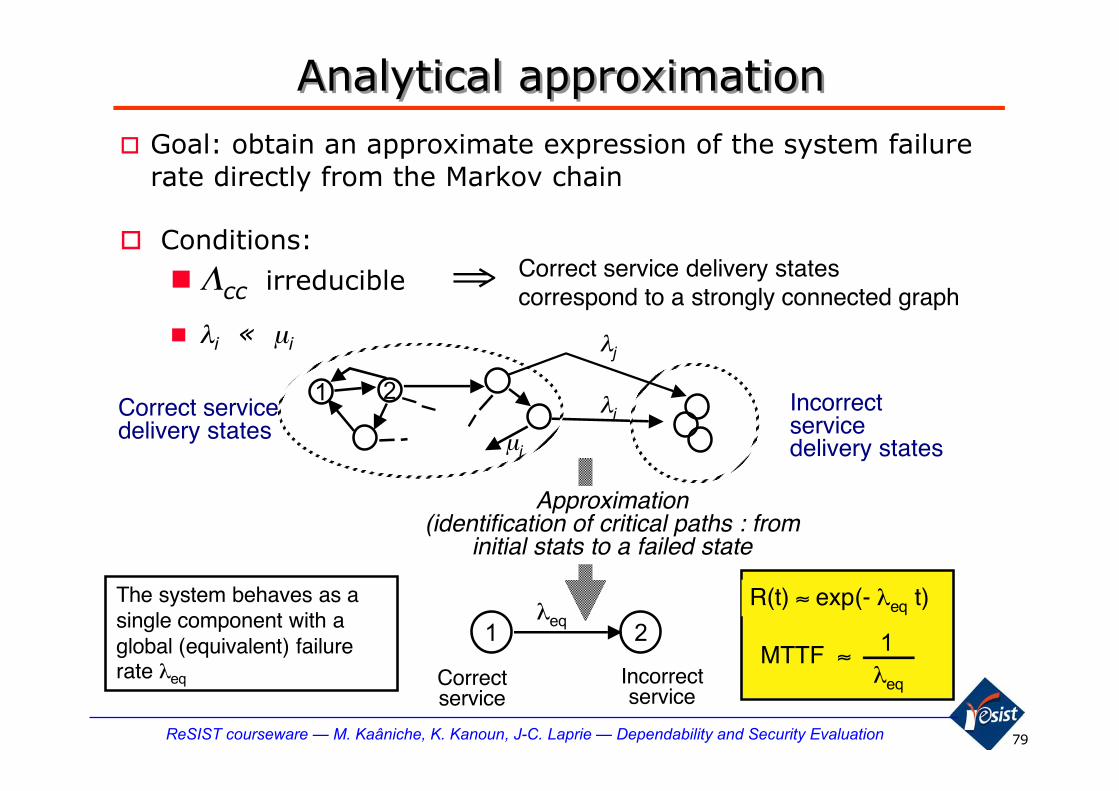
λeq
1MTTF ≈
R(t) ≈ exp(- λeq t)
Analytical approximationAnalytical approximation� Goal: obtain an approximate expression of the system failure
rate directly from the Markov chain
� Conditions:
� Λcc irreducible ⇒� λi « μi
Correct service delivery statescorrespond to a strongly connected graph
The system behaves as asingle component with aglobal (equivalent) failurerate λeq
λi Correct servicedelivery states
1 2
Correctservice
Incorrectservice
λeq
Approximation(identification of critical paths : from
initial stats to a failed state
1 2
μi
λj
Incorrectservicedelivery states
80ReSIST courseware — M. Kaâniche, K. Kanoun, J-C. Laprie — Dependability and Security Evaluation
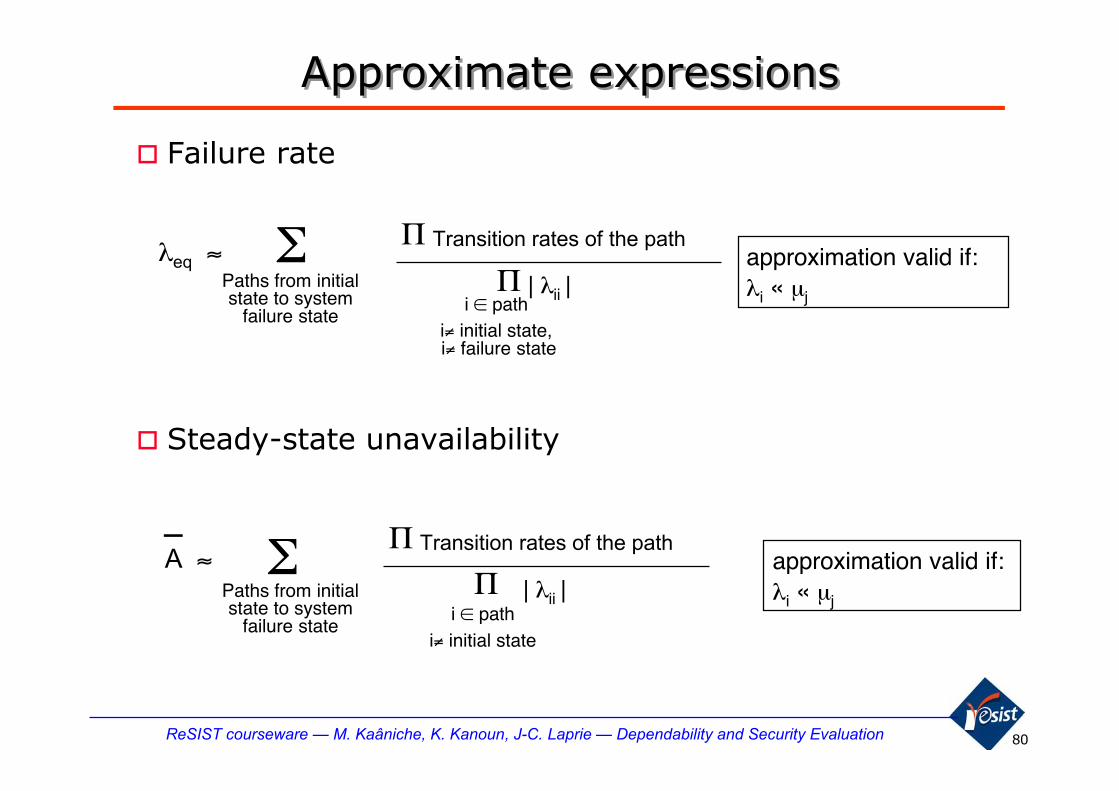
Approximate expressionsApproximate expressions
� Failure rate
λeq ≈ Σ Π Transition rates of the path
Paths from initialstate to system
failure state
Π | λii | i ∈ path
i≠ initial state, i≠ failure state
approximation valid if:λi « μj
A ≈ Σ Π Transition rates of the path
Π | λii | approximation valid if:λi « μj
� Steady-state unavailability
Paths from initialstate to system
failure statei ∈ path
i≠ initial state

81ReSIST courseware — M. Kaâniche, K. Kanoun, J-C. Laprie — Dependability and Security Evaluation
ExamplesExamples� Example 1
� Example 2
2 λ
μ 2 μ
λ
31 2
1 path : 1 ➙ 2 ➙ 3
λeq ≈ 2λ . λ≈ μ
2λ2
λ + μ A ≈
2μ
λeq
μ2
λ2
≈
paths: 1 ➙ 51 ➙ 2 ➙ 51 ➙ 2 ➙ 3➙ 51 ➙ 2 ➙ 3➙ 4
λ1 , λ2 « μ1 , μ2
3λ1 . 2λ2
2λ1 + 2λ2 + μ1
λeq ≈ 3λ2 + +3λ1 . 2λ1 . λ2
(2λ1+ 2λ2 + μ1).(2μ1 + λ1+ λ2)
+3λ1 . 2λ1 . λ1
(2λ1 + 2λ2 +μ1).(2μ1 + λ1 +λ2)5 4
System failure states
2 μ1
λ1
31 23 μ1
4
2 λ1
5
3λ2 2λ2 λ2
μ2
μ1
3 λ1

82ReSIST courseware — M. Kaâniche, K. Kanoun, J-C. Laprie — Dependability and Security Evaluation
State agregationMotivation : reduction of the number of states
State agregationMotivation : reduction of the number of states
� Previous example—identical components : λX=λY= λ μX=μY=μ
P1(t + dt) = [1 - (λ dt + λ dt)] P1(t) + μ dt P2(t) + μ dt P3(t)
P2(t + dt) = λ dt P1(t) + [1 - (λ dt + μ dt)] P2(t) + μ dt P4(t)
P3(t + dt) = λ dt P1(t) + [1 - (λ dt + μ dt)] P3(t) + μ dt P4(t)
P4(t + dt) = λ dt P2(t) + λ dt P3(t) + [1 - (μ dt + μ dt)] P4(t)
P1(t + dt) = [1 - 2 λ dt] P1(t) + μ dt [P2(t) + P3(t)]
P2(t +dt) + P3(t +dt) = 2 λdt P1(t) + [1 - (λdt + μdt)] [P2(t) + P3(t)] + 2μ dt P4(t)
P4(t +dt) = λ dt [P2(t) + P3(t)] + [1 - 2 μ dt] P4(t)
⇔
2 λ
μ 2 μ
λ
2, 3 41
λ
λ
μ
μ
μ
λ
λ
μ1
3
4
2
Λ =- 2 λ 2 λ 0
μ - (λ + μ ) λ
0 2 μ - 2 μ

83ReSIST courseware — M. Kaâniche, K. Kanoun, J-C. Laprie — Dependability and Security Evaluation
GeneralizationGeneralization� Motivation : state space reduction
� Exploit symmetries (identical components or behaviours)
� P = { P1,P2, …Ps } partition of state space E, s < m = |E|
λ i, Pj = Σ λ ik : rate of transition from state i to Pj
� Model reducible with respect to P if for each (Pi,Pj),λ k, Pj
are identical for each state k of Pi. These identicalvalues correspond to the rate associated to the transitionfrom Pi to Pj of the agregated Markov chain.
� System with n components, 2 states per composant
� without agregation → |E| ≥ 2 n
� identical components, with agregation → |E| ≥ n+1
k ∈ Pj

84ReSIST courseware — M. Kaâniche, K. Kanoun, J-C. Laprie — Dependability and Security Evaluation
Illustration on the exampleIllustration on the example
⇔
2 λλλλ
μμμμ 2 μμμμ
λλλλ
P2 P3P1
P1, P2, P3
P = { 1, (2, 3), 4 }
λ 1, P2 = 2 λ λ 2, P1
= μ λ 2, P3 = λ λ 4, P2
= 2 μ
λ 3, P1 = μ λ 3, P3
= λ
λ k, Pj : rate of transition from state k to partition Pj : k Pj
λλλλ
λλλλ
μμμμ
μμμμ
μμμμ
λλλλ
λλλλ
μμμμ1
3
4
2

85ReSIST courseware — M. Kaâniche, K. Kanoun, J-C. Laprie — Dependability and Security Evaluation
Markov reward models
� Useful for combined performance-availability evaluation(“performability”)
� Extension of continuous time Markov chains with rewards
� Reward: performance index, capacity, cost, etc.
� Quantitative measures
� ri = reward rate associated with state i of the Markov chain
� Z(t) = rX(t) : instantaneous reward rate of Markov chain X(t)
Y(t) = Z(x) .dx∫t
0
Expected instantaneous reward rate: E[Z(t)] = Σ ri . Pi (t)
Expected steady-state reward rate: lim E[Z(t)] = Σ ri . πi t=∞
� Y(t) = accumulated reward in [0, t]
E[Y(t)] = Σ ri . Pi (x). dx∫t
0

86ReSIST courseware — M. Kaâniche, K. Kanoun, J-C. Laprie — Dependability and Security Evaluation
Modelling of complex systems� Model largeness
� Number ofcomponents,dependencies
� Stiffness
� parameters ondifferent time scales
� Largeness/stiffness tolerance andavoidance techniques
� Automatic generation of statespace using Stochastic Petri netsand their extensions
� Structured model compositionapproaches with explicitdescription of dependencies
� Hierarchical modeldecomposition and aggregation
� Robust model solution andefficient storage techniques
� Non exponentialdistributions
� Use of semi-Markov or nonMarkovian models
� Approximation by exponentialmodels using method of stage
� Use of simulation
87ReSIST courseware — M. Kaâniche, K. Kanoun, J-C. Laprie — Dependability and Security Evaluation
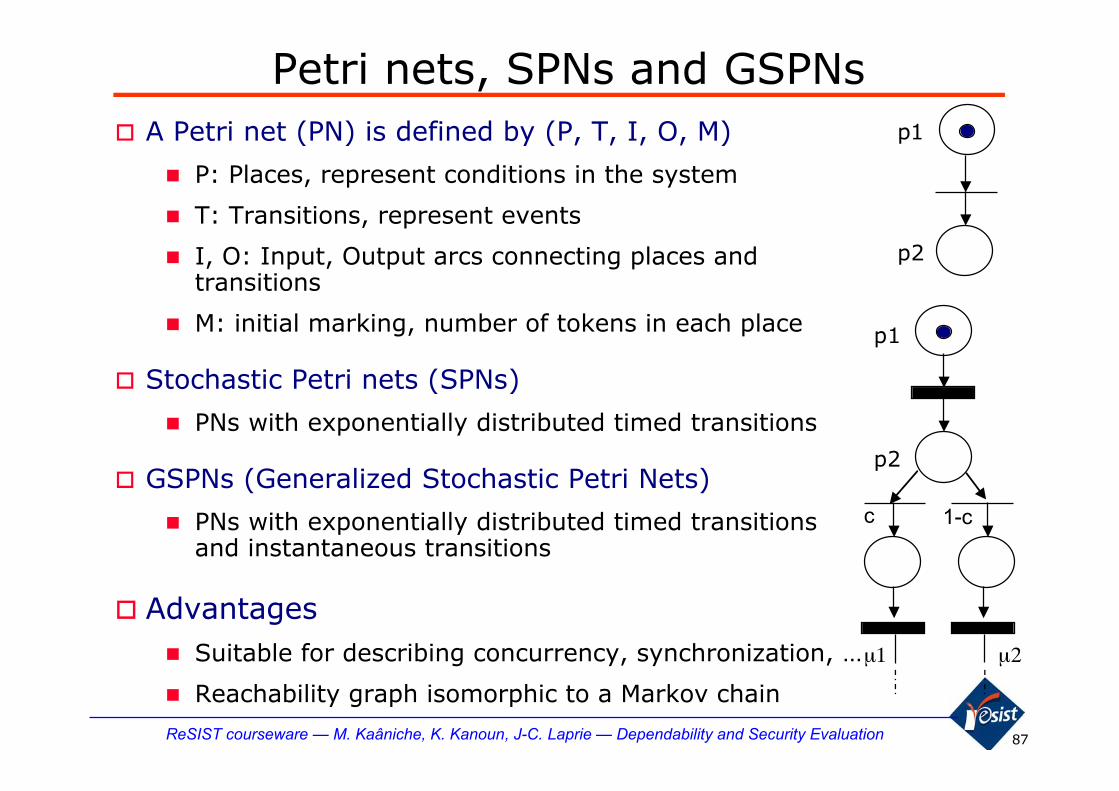
Petri nets, SPNs and GSPNs� A Petri net (PN) is defined by (P, T, I, O, M)
� P: Places, represent conditions in the system
� T: Transitions, represent events
� I, O: Input, Output arcs connecting places andtransitions
� M: initial marking, number of tokens in each place
� Stochastic Petri nets (SPNs)
� PNs with exponentially distributed timed transitions
� GSPNs (Generalized Stochastic Petri Nets)
� PNs with exponentially distributed timed transitionsand instantaneous transitions
� Advantages� Suitable for describing concurrency, synchronization, …
� Reachability graph isomorphic to a Markov chain
p1
p2
p2
c 1-c
μ1 μ2
p1
88ReSIST courseware — M. Kaâniche, K. Kanoun, J-C. Laprie — Dependability and Security Evaluation
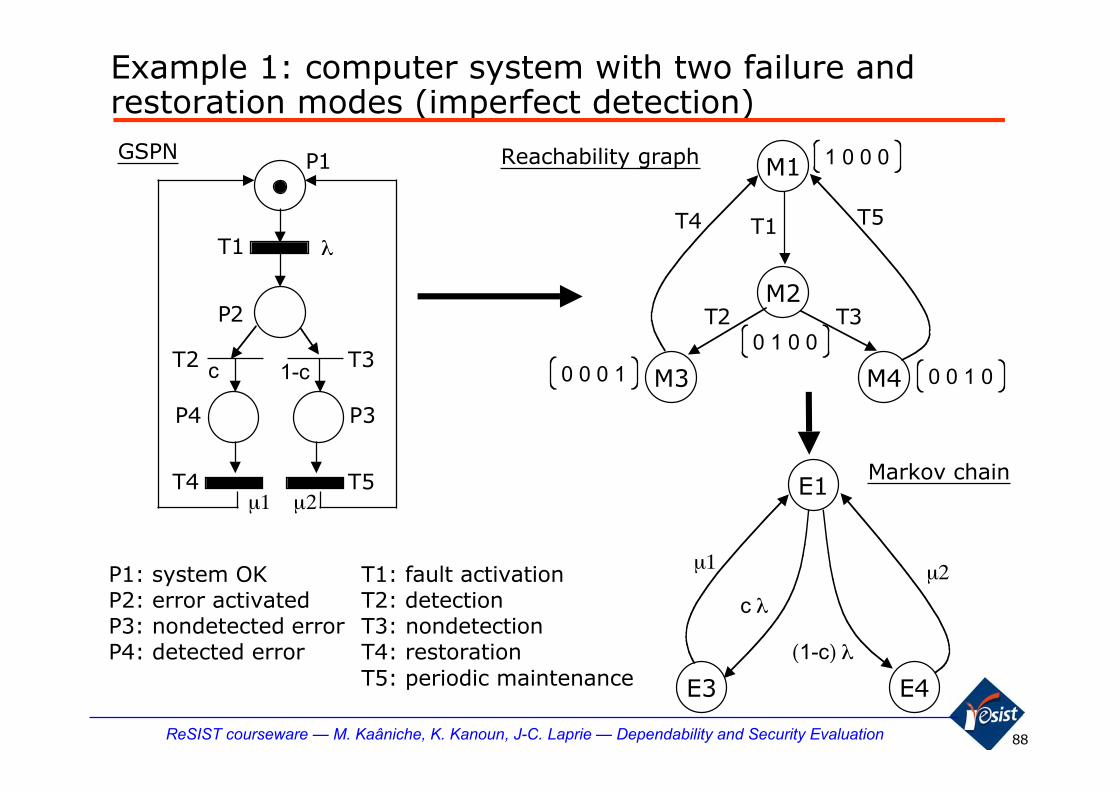
Example 1: computer system with two failure andrestoration modes (imperfect detection)
μ1 μ2
P1: system OKP2: error activatedP3: nondetected errorP4: detected error
T1: fault activationT2: detectionT3: nondetectionT4: restorationT5: periodic maintenance
P2
c 1-c
P1
λ
P3P4
T1
T3T2
T5T4
M2
M3
T2
T1
1 0 0 0M1
0 0 0 1 M4 0 0 1 0
T3
T5T4
0 1 0 0
c λ
(1-c) λ
μ1
E1
μ2
E3 E4
Reachability graphGSPN
Markov chain
89ReSIST courseware — M. Kaâniche, K. Kanoun, J-C. Laprie — Dependability and Security Evaluation
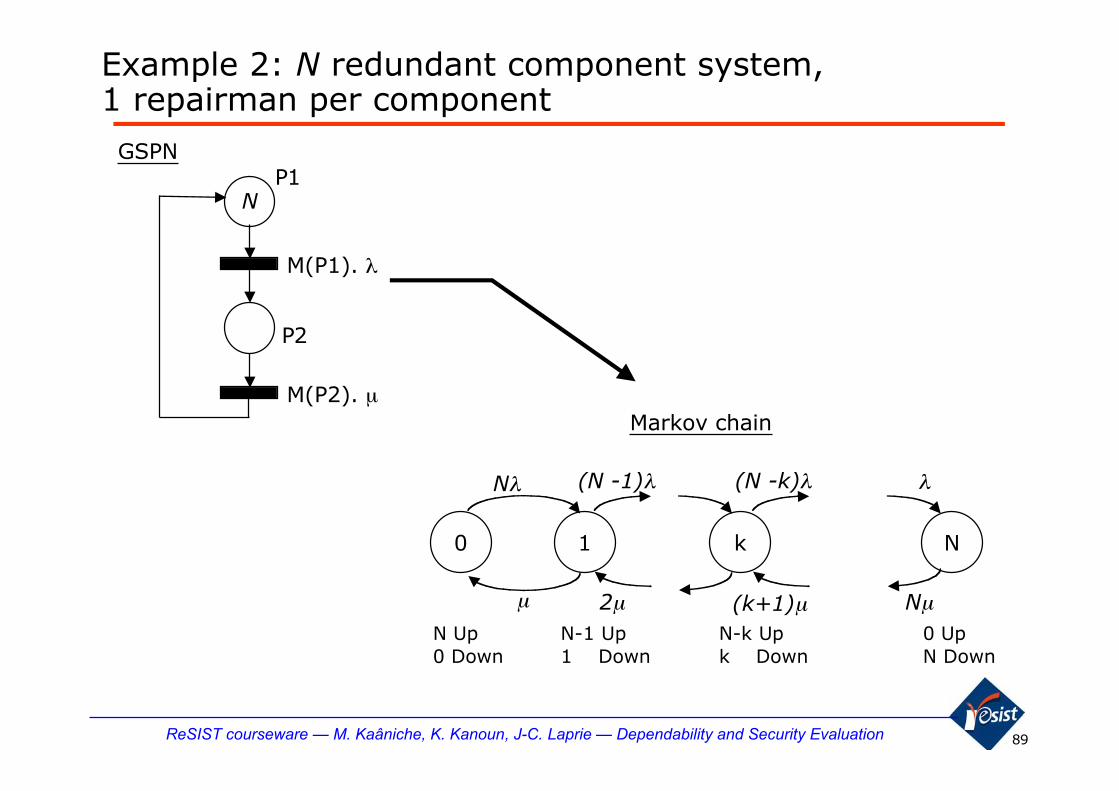
Example 2: N redundant component system,1 repairman per component
GSPN
0 1 k N
Nλ (N -1)λ λ
Nμμ
(N -k)λ
2μ (k+1)μN Up0 Down
N-1 Up1 Down
N-k Upk Down
0 UpN Down
Markov chain
P1
M(P1). λ
N
P2
M(P2). μ

90ReSIST courseware — M. Kaâniche, K. Kanoun, J-C. Laprie — Dependability and Security Evaluation
Hardware- software with error propagation
H-ok
λh δh
H-e
h1-pph
μ
H-t
ζh
H-nd
h1-d
H-p
dh
H-u
hτ
H-fd
Hardware model
λs
S-ok
δ sν
S-e
sτ
S-fd
ds
sd1-
sp1-
S-nd
ζ pss
S-u
S-d
π s
S-ft
Software model
pph
Prop
1-pph
tp
tnPs
Error propagation model

91ReSIST courseware — M. Kaâniche, K. Kanoun, J-C. Laprie — Dependability and Security Evaluation
Fault tolerant systems: coverageFault tolerant systems: coverage
� Fault tolerance efficiency
Coverage c = Prob.{ correct service delivery | active fault}
FunctionalProcessing
unit
Specified
Outputs
FP outputs
Accepted
Specified
FP outputs
Accepted
FaultTolerance
mechanisms
inputs
Detected errors
False alarms
Non detected errors
fault tolerancedeficiency

92ReSIST courseware — M. Kaâniche, K. Kanoun, J-C. Laprie — Dependability and Security Evaluation
Fault tolerant systems modelling
exhaustion ofredundant resourcesdue to consecutive(covered) failures
Fault tolerant system failure
non coveredcomponent failures

93ReSIST courseware — M. Kaâniche, K. Kanoun, J-C. Laprie — Dependability and Security Evaluation
Duplex system: Active dynamic redundancyDuplex system: Active dynamic redundancy
2 comp. non failed
1 comp. non failed 1 unit failed
2 comp. failed
1 2 3
Non covered failure
coveredfailure
r(t) : component reliabilityR(t) : system reliability
P1(t) = r2(t) P2(t) = 2. c. [ 1 - r(t)]. r(t)
R(t) = P1(t) + P2(t) = 2. c. r(t) - [ 2.c - 1].r2(t)
r(t)= exp(-λt) ➝ R(t) = 2. c. exp(-λt) - [ 2.c - 1].exp(-2λt)
MTTF = 2.c + 1
2λ<
32λ
1 2 32.λ.c
2.λ. (1-c)
λ
= λ.c+ λ.(1-c)

94ReSIST courseware — M. Kaâniche, K. Kanoun, J-C. Laprie — Dependability and Security Evaluation
Duplex system: Passive dynamic redundancyDuplex system: Passive dynamic redundancynon covered failure of active comp.
orfailure spare
comp.
comp.failure
covered failureactive comp.
ra(t) : active component reliabilityrs(t) : spare component reliability
P1(t) = ra(t) . rs(t)
ra(t)= exp(-λt)
rs(t)= exp(-kλt)
P2(t) = c . [ rs(τ). d [1 - ra(τ)] . ra(t - τ) + ra(t). [ 1 - rs(t)]∫0
t
0 ≤ k ≤ 1 MTTF = 1 + c + k
<2λ(1 + k). λ
R(t) = (1 + ). exp(-λt) - .exp(-(1+k)λt)ck
ck
R(t) = ra(t) + c . [rs(τ). d [1 - ra(τ)] . ra(t - τ)] ∫t
0
1 2 3
λa .(1-c)
λa λa.c + λs
2 comp. non failed
1 comp. non failed 1 unit failed
2 comp. failed
1 2 3

95ReSIST courseware — M. Kaâniche, K. Kanoun, J-C. Laprie — Dependability and Security Evaluation
Comparison Active - PassiveComparison Active - Passive
� short mission duration: λt « 1
� Active dynamic redundancy
R(t) ≈ 1 - 2.(1- c). λt - [ 1 - 3 (1- c)]. λ2 t2
� Passive dynamic redundancy
R(t) ≈ 1 - (1- c). λt + [ 1 - 2c - ck]. λ2 t2
� Reliability: passive redundancy > active redundancy
� Service interruption: active redundancy < passive redundancy
2
tradeoffs

96ReSIST courseware — M. Kaâniche, K. Kanoun, J-C. Laprie — Dependability and Security Evaluation
IllustrationIllustration
10-6
10-5
10-4
10-3
10-2
10-1
1
0.001 0.01 0.1 1
λλλλt
1- R(t)
non-redondant
1
4
5
2
6
3c Active Passive
k = 0.1
1 1 40.99 2 50.95 3 6

97ReSIST courseware — M. Kaâniche, K. Kanoun, J-C. Laprie — Dependability and Security Evaluation
Impact of coverage factor and repair rateImpact of coverage factor and repair rate
R(t) ≈ exp { -2 [ (1-c) + c λ/μ ] λ t }
λSYS = 2 [ (1-c) + c λ/μ ] λ
→
→
non covered failure
two consecutive failures,the first covered
: sensitive to (1- c) and λ/μ
2 c λ
λ
2 (1-c) λ
1 2 3μ
λ
μMTTR
MTTFCOMP
=
λ
λ MTTFSYS
=MTTF
COMPSYS
10-1
10-2
10-3
10-4
1
10-4
10-3
10-2
c = .95
c = .9
c = .99
c = .995
c = .999 c = 1
λ
λ
eq
2 c (λ/μ) λ
2 (1-c) λ
MTTF ≈2 [ (1-c) + c λ/μ ] λ
1
98ReSIST courseware — M. Kaâniche, K. Kanoun, J-C. Laprie — Dependability and Security Evaluation
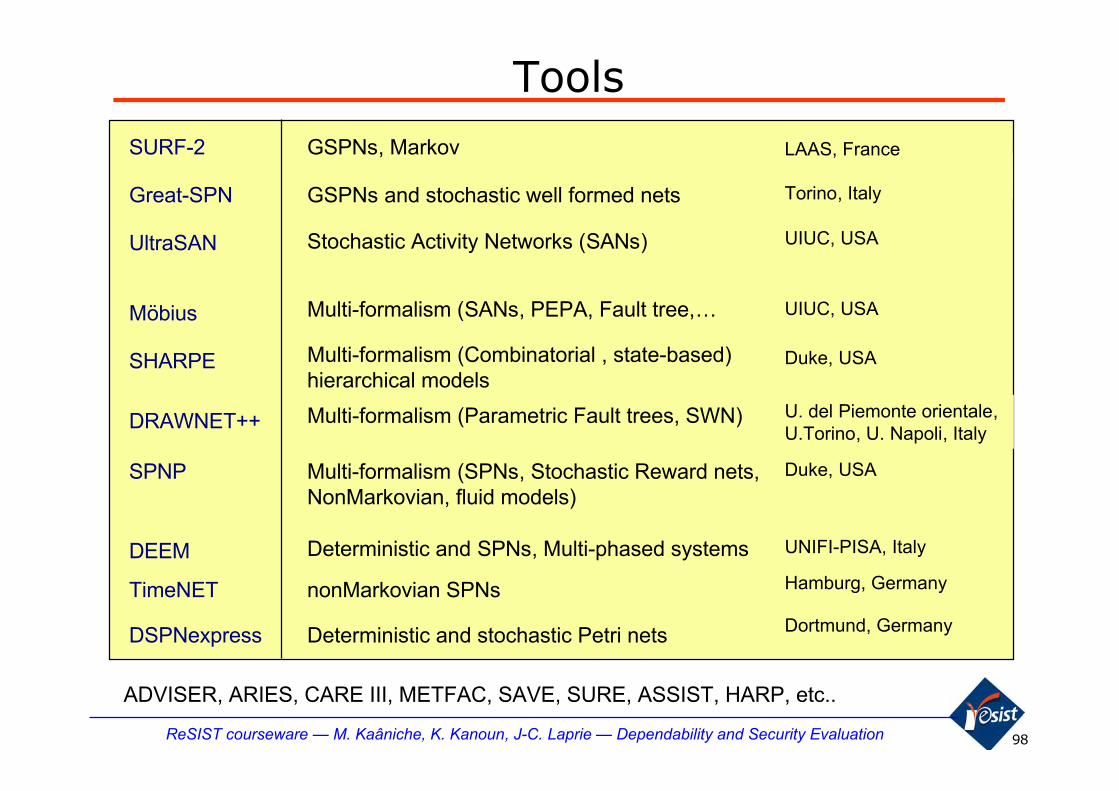
Tools
ADVISER, ARIES, CARE III, METFAC, SAVE, SURE, ASSIST, HARP, etc..
SURF-2
UltraSAN
SPNP Multi-formalism (SPNs, Stochastic Reward nets,NonMarkovian, fluid models)
Duke, USA
LAAS, France
UIUC, USAStochastic Activity Networks (SANs)
GSPNs, Markov
SHARPE Duke, USAMulti-formalism (Combinatorial , state-based)hierarchical models
Great-SPN GSPNs and stochastic well formed nets Torino, Italy
Möbius UIUC, USAMulti-formalism (SANs, PEPA, Fault tree,…
DSPNexpress Deterministic and stochastic Petri nets Dortmund, Germany
TimeNET Hamburg, GermanynonMarkovian SPNs
DEEM Deterministic and SPNs, Multi-phased systems UNIFI-PISA, Italy
DRAWNET++ Multi-formalism (Parametric Fault trees, SWN) U. del Piemonte orientale, U.Torino, U. Napoli, Italy
99ReSIST courseware — M. Kaâniche, K. Kanoun, J-C. Laprie — Dependability and Security Evaluation
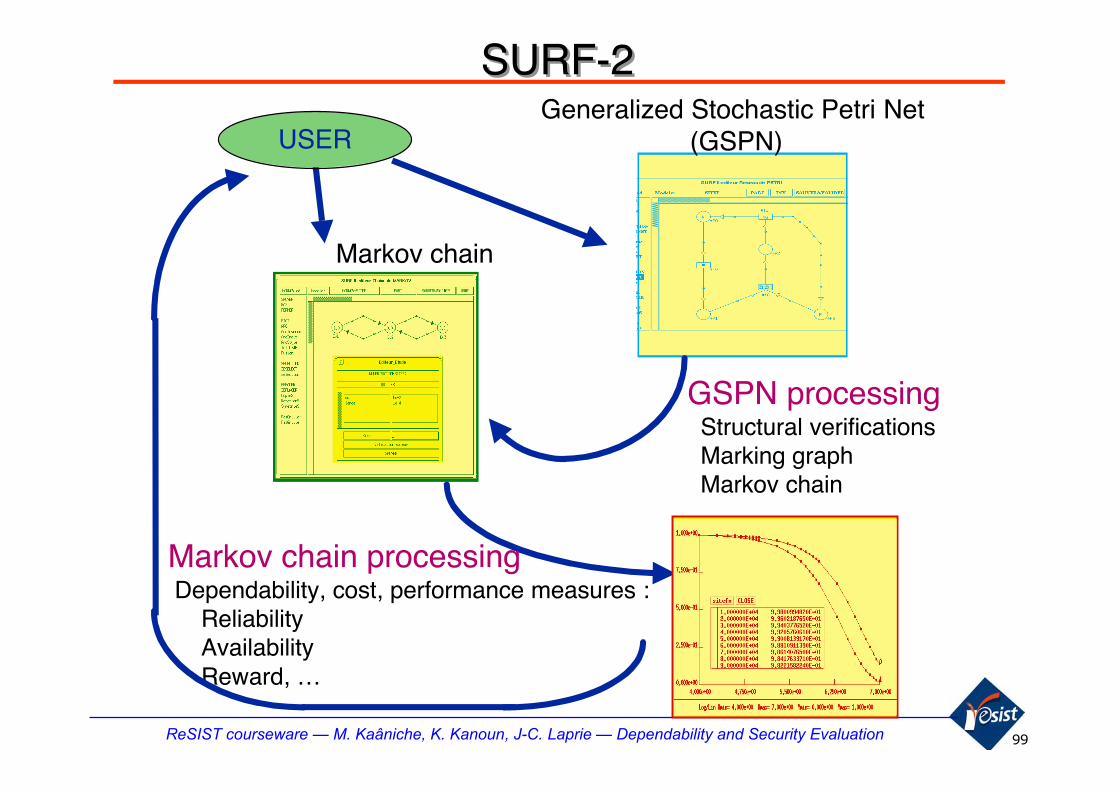
SURF-2SURF-2
GSPN processing Structural verifications Marking graph Markov chain
Generalized Stochastic Petri Net (GSPN)
Markov chain
USER
Markov chain processing Dependability, cost, performance measures : Reliability Availability Reward, …
100ReSIST courseware — M. Kaâniche, K. Kanoun, J-C. Laprie — Dependability and Security Evaluation
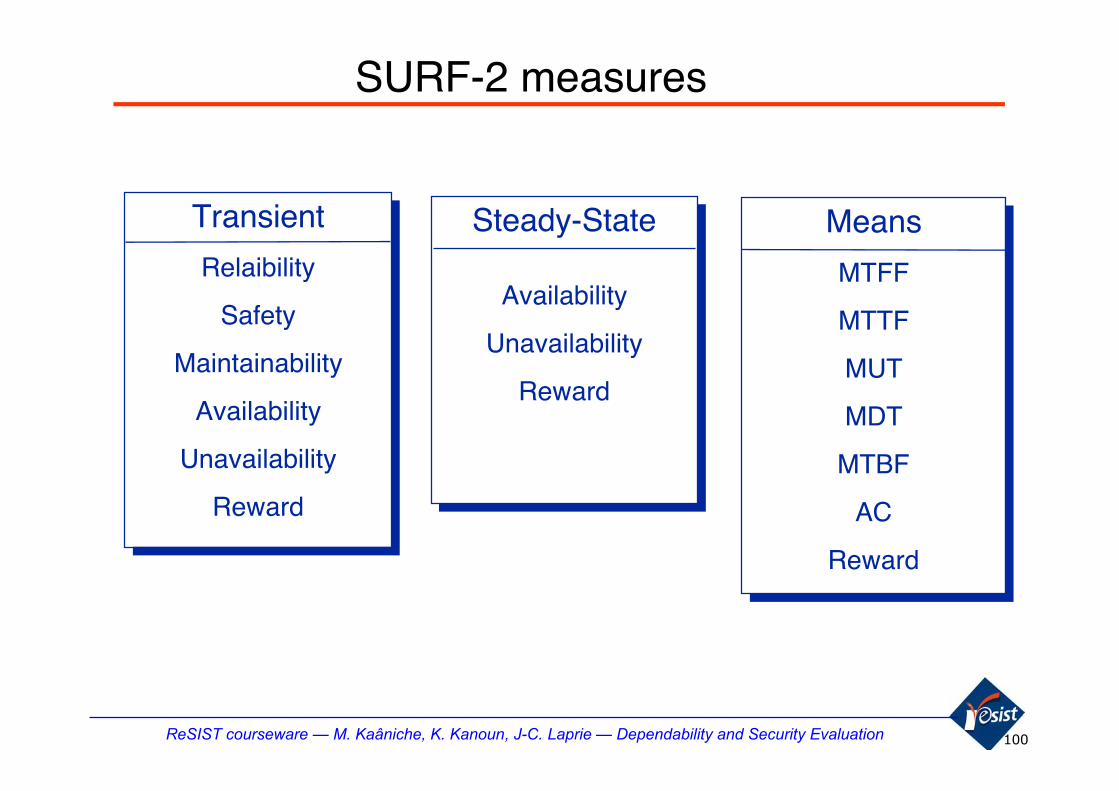
SURF-2 measures
Transient
Relaibility
Safety
Maintainability
Availability
Unavailability
Reward
Transient
Relaibility
Safety
Maintainability
Availability
Unavailability
Reward
Steady-State
Availability
Unavailability
Reward
Steady-State
Availability
Unavailability
Reward
Means
MTFF
MTTF
MUT
MDT
MTBF
AC
Reward
Means
MTFF
MTTF
MUT
MDT
MTBF
AC
Reward

101ReSIST courseware — M. Kaâniche, K. Kanoun, J-C. Laprie — Dependability and Security Evaluation
Models calibration and validation - data
� Estimation of model parameters based on data collected fromoperation, controlled experiments or using expert judgments
CentralSwitch
Controlled experiments
(testing, fault injection)data collection in operation
event logsfailure reports
(automatic/manual)
fault loadworkload
controllerlogfiles
Exp. measures
system under test with instrumentation
Failure modes
Fault coverageError detectionlatency
data processing and statistical analysis techniques
Failure rates,Repair rates, Failure modes
102ReSIST courseware — M. Kaâniche, K. Kanoun, J-C. Laprie — Dependability and Security Evaluation
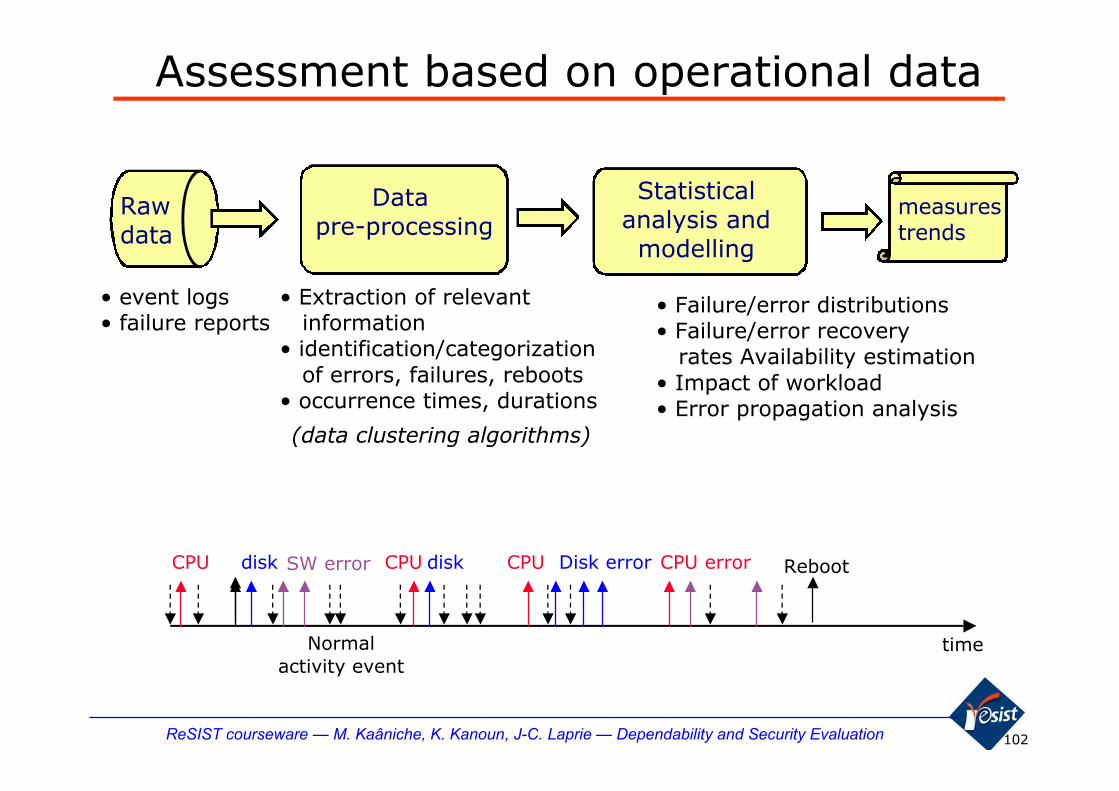
Assessment based on operational data
Raw data
Data pre-processing
Statisticalanalysis andmodelling
measurestrends
(data clustering algorithms)
• Failure/error distributions• Failure/error recovery rates Availability estimation• Impact of workload• Error propagation analysis
• Extraction of relevant information• identification/categorization of errors, failures, reboots• occurrence times, durations
• event logs• failure reports
time
CPU CPU CPU CPU errordisk disk Disk errorSW error
Normalactivity event
Reboot
103ReSIST courseware — M. Kaâniche, K. Kanoun, J-C. Laprie — Dependability and Security Evaluation
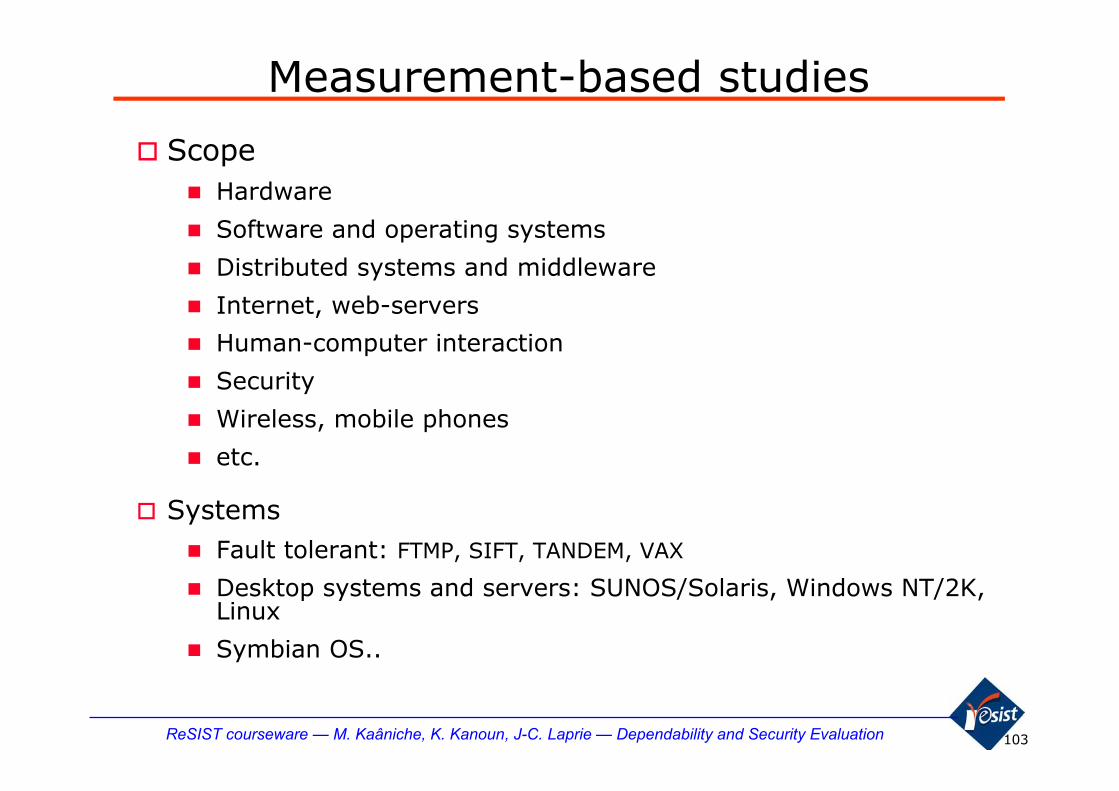
Measurement-based studies
� Scope� Hardware
� Software and operating systems
� Distributed systems and middleware
� Internet, web-servers
� Human-computer interaction
� Security
� Wireless, mobile phones
� etc.
� Systems� Fault tolerant: FTMP, SIFT, TANDEM, VAX
� Desktop systems and servers: SUNOS/Solaris, Windows NT/2K,Linux
� Symbian OS..
104ReSIST courseware — M. Kaâniche, K. Kanoun, J-C. Laprie — Dependability and Security Evaluation
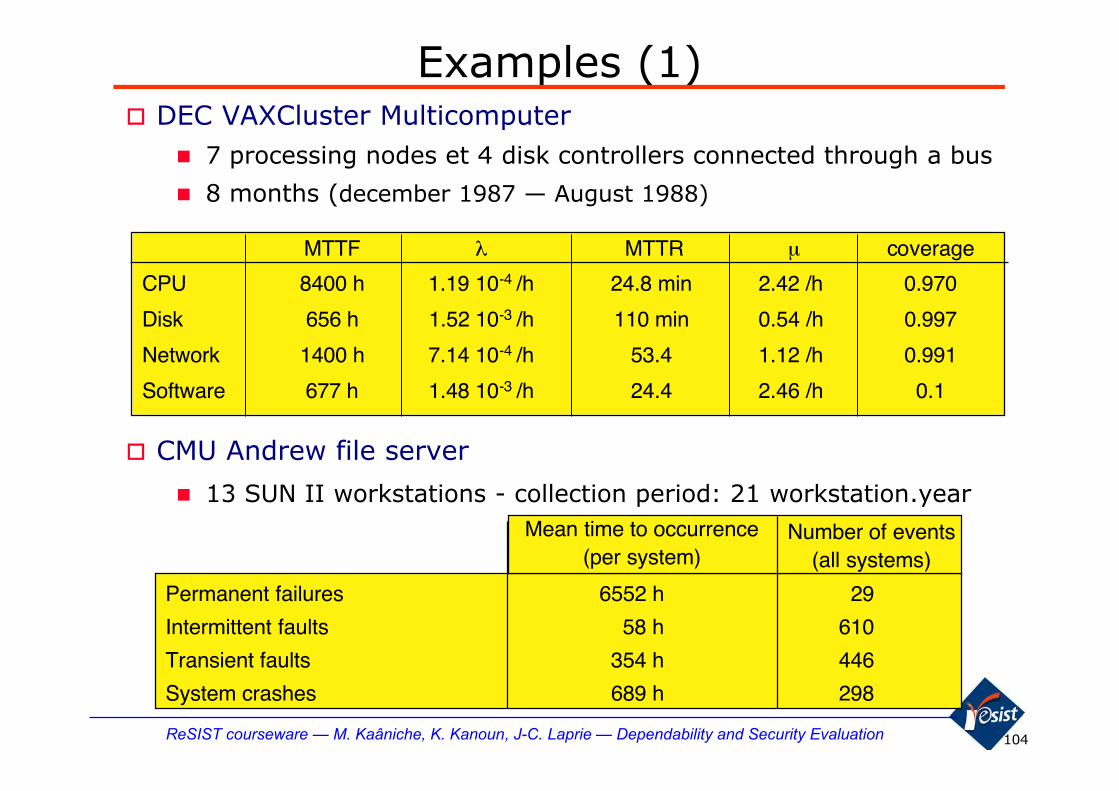
Examples (1)� DEC VAXCluster Multicomputer
� 7 processing nodes et 4 disk controllers connected through a bus
� 8 months (december 1987 — August 1988)
MTTF λ MTTR μ coverage
CPU 8400 h 1.19 10-4 /h 24.8 min 2.42 /h 0.970
Disk 656 h 1.52 10-3 /h 110 min 0.54 /h 0.997
Network 1400 h 7.14 10-4 /h 53.4 1.12 /h 0.991
Software 677 h 1.48 10-3 /h 24.4 2.46 /h 0.1
� CMU Andrew file server
� 13 SUN II workstations - collection period: 21 workstation.year
Permanent failures 6552 h 29
Intermittent faults 58 h 610
Transient faults 354 h 446
System crashes 689 h 298
Mean time to occurrence(per system)
Number of events(all systems)

105ReSIST courseware — M. Kaâniche, K. Kanoun, J-C. Laprie — Dependability and Security Evaluation
Assessment based on operational data (2)� LAAS-CNRS local area network
� 418 SunOS/Solaris, 78 Windows NT, 130 Windows 2K
� Jan. 1999-Oct. 2003: 1392 system.year - 50 000 reboots
Unix Windows NT Windows 2K
Reboot rate
10-3/hour
3.9 10-3/hour 5.3 10-3/hour
MeanUptime
12.8 day
1.5 day 1.08 day
MeanDowntime
180 min
30 min 35 min
AverageUnavailability
4.4 day/year
11.6 day/year
5.7 day/year

106ReSIST courseware — M. Kaâniche, K. Kanoun, J-C. Laprie — Dependability and Security Evaluation
Fault tolerance efficiency assessment
Fault tolerance coverageC = Prob.{correct service delivery/active fault}
Error and Faulthandling Coverage
AssumptionCoverage
Fault Error failure
Fault dormancy
error latency

107ReSIST courseware — M. Kaâniche, K. Kanoun, J-C. Laprie — Dependability and Security Evaluation
Experimental assessment
� Fault injection target
� HW, drivers, OS, API, middleware,application
� Fault model� Bit-flips (data, code segments, parameters)
� instruction mutation, dropping messages, …
fault loadworkload
controllerlogfiles
Exp. measures
FT system under test with instrumentation

108ReSIST courseware — M. Kaâniche, K. Kanoun, J-C. Laprie — Dependability and Security Evaluation
Fault injection techniques
Simulation Model Prototype/real system
Simulation based
Software implemented
Physical
Heavy ions (Chalmers U.)EM perturbations (TU Vienna)pins (MESSALINE)…
Node (ORCHESTRA)OS (Ballista, MAFALDA)Mem. (DITA)Instr. (FERRARI)Processor (Xception)…
System (DEPEND)RT Level (ASPHALT)Logical gate (Zycad)Circuit (FOCUS)...wide range (MEFISTO)

109ReSIST courseware — M. Kaâniche, K. Kanoun, J-C. Laprie — Dependability and Security Evaluation
Delta-4 projectSpare node
NAC : Network Attachment ControllerAMp : Atomic Multicast protocol
D Predicate:Auto-extraction of faulty node
T Predicate:Protocol Properties OKand errors confined
Target SystemTarget System
NAC/AMp
Host HostHost Host
NAC/AMp NAC/AMpNAC/AMp
1) Standard2) Duplex architecture1) Standard2) Duplex architecture
Successive versions of AMp
Successive versions of AMp
Physical injection
(MESSALINE)
0%
20%
40%
60%
80%
10ms 100ms 1s 10s 100s
NAC"duplex"
NACstandard
100%D Pred. T Pred.
nonsignificantexperiments
F E TD
Failure
94% 86% 99%
0.5%6% 1%
13.5%
Non detectedbut tolerated
detected butnot tolerated
J. Arlat, M. Aguera, Y. Crouzet, J-C. Fabre, E. Martins, D. Powell, Experimental Evaluation of the FaultTolerance of an Atomic Multicast Protocol”, IEEE Transactions on Reliability, vol. 39, n°4, 1990

110ReSIST courseware — M. Kaâniche, K. Kanoun, J-C. Laprie — Dependability and Security Evaluation
POSIX OS robustness testing (BALLISTA)
Normalized failure rate (%)
15 « (C)OTS » OSs[Koopman & DeVale 99 (FTCS-29)]
15 « (C)OTS » OSs[Koopman & DeVale 99 (FTCS-29)]
�
�
�
��
�
0% 10% 20% 30% 40% 50%
SunOS 5.5
SunOS 4.13
QNX 4.24
QNX 4.22
OSF-1 4.0
OSF-1 3.2
NetBSD
Lynx
Linux
Irix 6.2
Irix 5.3
HPUX 10.20
HPUX 9.05
FreeBSD
AIX
Abort % Silent % Restart %
�Catastrophic
AIX
FreeBSD
HP-UX B.10.20
Linux
LynxOS
QNX 4.24
SunOS 5.5
NetBSD
Irix 6.2
Irix 5.3
HP-UX B.9.05
OSF-1 3.2
OSF-1 4.0
QNX 4.22
SunOS 4.13
Abort
Silent
Restart
Catastrophic
0 10 20 30 40 50
9
POSIX System call parameter mutation (233 functions)
P. Koopman, J. DeVale, “The exception handling effectiveness of POSIX Operating Systems”, IEEETransactions On Software Engineering, vol. 26, n°9, 2000

111ReSIST courseware — M. Kaâniche, K. Kanoun, J-C. Laprie — Dependability and Security Evaluation
Dependability benchmarking� “Standardised” framework for evaluating dependability and
performance related measures experimentally or based onexperimentation and modeling
� Characterize objectively system behavior in presence of faults
� Non-ambiguous comparison of alternative solutions
� Non-ambiguity, confidence, acceptability ensured by a set ofproperties:
� Representativeness, Reproducibility, Repeatability, Portability,Non-intrusiveness, Scalability, Cost effectiveness
� Benchmark = specification of a set of elements (dimensions)and a set of procedures for running experiments on thebenchmark target to obtain dependability measures
� Dbench IST project (www.laas.fr/dbench)
� SIGDeb: Special Interest Group on DependabilityBenchmarking (IFIP 10.4 WG)
112ReSIST courseware — M. Kaâniche, K. Kanoun, J-C. Laprie — Dependability and Security Evaluation
Case StudiesApplication to real systems

113ReSIST courseware — M. Kaâniche, K. Kanoun, J-C. Laprie — Dependability and Security Evaluation
ExamplesSystem
CAUTRA: Air Traffic Control Computing system
Multiprocessor system with a distributed shared memory
Partners
Nuclear control command system
CENA, SRTI SystemCENA, Sofreavia
Bull
EDF
Automobile command control safety architectures:safety bag, electrical steering system
Siemens
Guards: Generic Upgradable architectures for real-timedependable systems: railways, space, nuclear
AnsaldoTrasportiAstrium,Technicatome
Control command system - Power station
TELECOM1 Satellite Control System CNES
EDF
Internet-based applications, mobile based architectures,interdependent critical infrastructures
DSoS, Hidenets, Crutialeuropean projects

114ReSIST courseware — M. Kaâniche, K. Kanoun, J-C. Laprie — Dependability and Security Evaluation
Case study:
Availability Modeling and Evaluation of Telecom1 Satellite Control System

115ReSIST courseware — M. Kaâniche, K. Kanoun, J-C. Laprie — Dependability and Security Evaluation
The results presented in these slides correspond to a preliminary (high-level) studyperformed for CNES, the French Space Agency.
They are intended to show the kind of results that can be obtained from modeling real-life systems.

116ReSIST courseware — M. Kaâniche, K. Kanoun, J-C. Laprie — Dependability and Security Evaluation
System functions
cannot be interrupted more
than 15 min
⎭⎬⎫
can be delayed
T 1 : Follow-up of operational satellite
C1, DS1, P1 , (+DA1, for system reconfiguration)
T 2 : Follow-up of spare satellite
C2, DS2, P2 , (+DA2, for system reconfiguration)
T3 : Data archiving (off-line)
CS, DSS, PS C1, C2 (computers 1 & 2)
CS (“Spare” computer)
DS1, DS2, DSS (system disks)
DA1, DA2 (archiving disks)
P1, P2, PS (external devices)
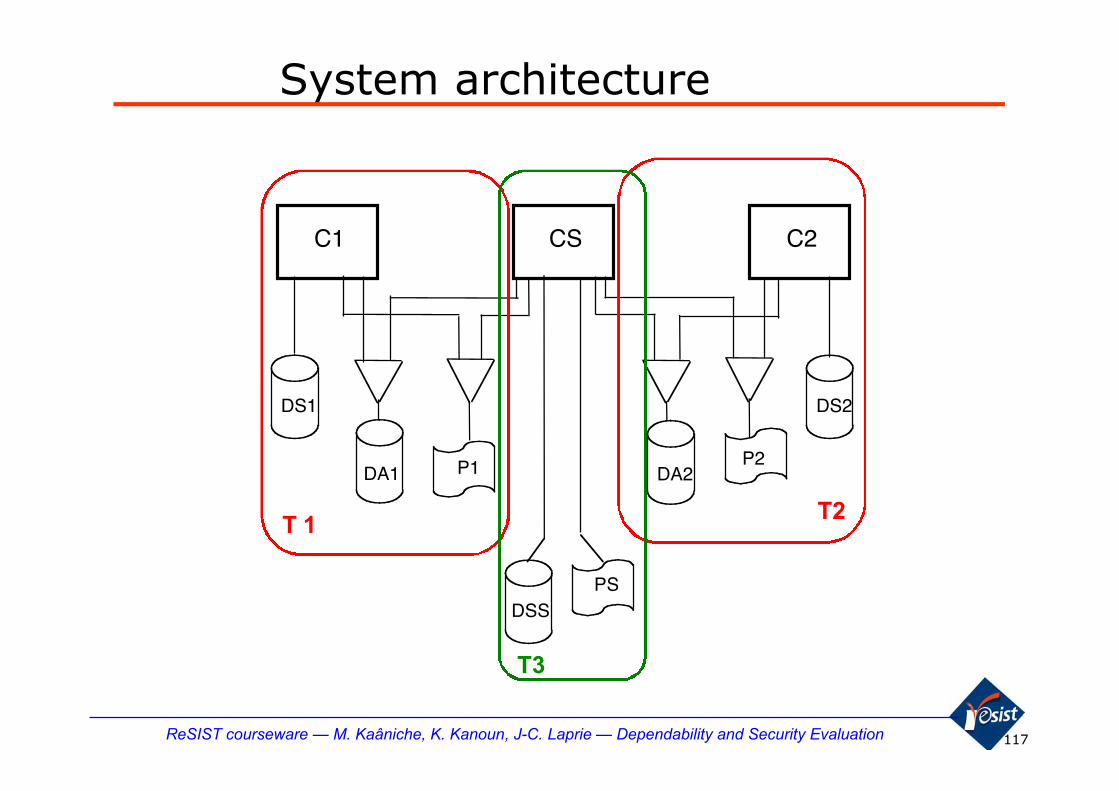
117ReSIST courseware — M. Kaâniche, K. Kanoun, J-C. Laprie — Dependability and Security Evaluation
System architecture
T 1
T3
T2
C1 CS C2
P1
DS1
DSS
DA2
DS2
DA1P2
PS

118ReSIST courseware — M. Kaâniche, K. Kanoun, J-C. Laprie — Dependability and Security Evaluation
C1 CS C2
P1
DS1
DSS
DA2
DS2
DA1P2
PS
Automatic reconfiguration
Failure of CS, DSS or PS: data archiving delayed
Failure of an archiving disk (DA1, DA2)
Or of a system disk (DS1, DS2): tolerated
Failure of C1 or P1: T1 transferred to CS,
T3 delayed → utilization of DA1
Failure C2 or P2: T2 transferred to CS,
T3 delayed → utilization of DA2

119ReSIST courseware — M. Kaâniche, K. Kanoun, J-C. Laprie — Dependability and Security Evaluation
Manual reconfiguration
System failure = loss of T1 or T2 or both
Failure of 2 elements : 2 computers, 2 external devices or 2 system disks
Failure of (DA1 followed by C1) / DS1 OK
or Failure (DA2 followed by C2) / DS2 OK
Failure of (DA1 followed by P1) / DS1 OK
or Failure of (DA2 followed by P2) / DS2 OK
transfer of DS1 on DA1 or DSS
(resp. DS2 on DA2 or DSS) by operator
maximum duration : 15 min
C1 CS C2
P1
DS1
DSS
DA2
DS2
DA1P2
PSOperator

120ReSIST courseware — M. Kaâniche, K. Kanoun, J-C. Laprie — Dependability and Security Evaluation
Partition of states:E1 : T1 et T2 executed
E11 : No failures
E12 : Faults have been tolerated automatically
E13 : Faults have been tolerated after intervention of the operator
E2 : T1 or T2 is interrupted
E21 : Temporary failure
Faults can be tolerated thanks to the operator
E22 : Lasting (permanent) failures
maintenance is required
System states

121ReSIST courseware — M. Kaâniche, K. Kanoun, J-C. Laprie — Dependability and Security Evaluation
Measures of dependabilityTwo dependability levels:
L1(t):
Probability of correct accomplishment of T1 and T2 without operator intervention
= P {e(τ) ∈ E11∪E12 ; τ ∈ [0, 1]}
L2(t):
Probability of correct accomplishment of T1 and T2 with or without operatorintervention
Availability:= P { e(τ) ∈ E1 }
E11∪E12 E13∪E2
E1 E21 E22
E1 E2
= P {e(τ) ∈ E11∪E12 ∪E13 | e(τ) ∈ E11∪E12 ∪E13 ∪E21; τ ∈ [0, 1]}

122ReSIST courseware — M. Kaâniche, K. Kanoun, J-C. Laprie — Dependability and Security Evaluation
Modeling assumptions
⎭⎪⎬⎪⎫
two types of repairman
Repair priority
C1, C2 (computers 1 & 2)
CS (“Spare” computer)
DS1, DS2, DSS (system disks)
DA1, DA2 (archiving disks)
P1, P2, PS (external devices)
Recovery factor: c = 1
Two types of disk failures:
• Electronic failures
• Electro-mechanic failures
123ReSIST courseware — M. Kaâniche, K. Kanoun, J-C. Laprie — Dependability and Security Evaluation
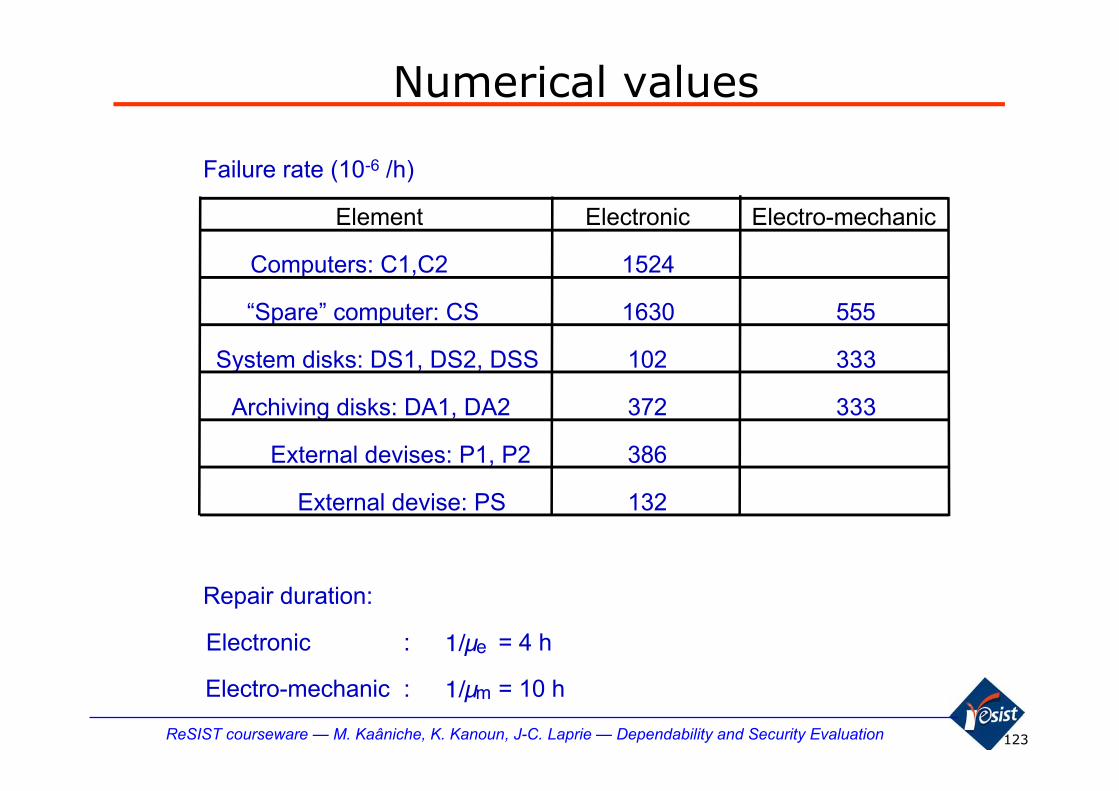
Numerical values
Failure rate (10-6 /h)
Element Electronic Electro-mechanic
Computers: C1,C2 1524
“Spare” computer: CS 1630 555
System disks: DS1, DS2, DSS 102 333
Archiving disks: DA1, DA2 372 333
External devises: P1, P2 386
External devise: PS 132
Repair duration:
Electronic : 1/μe = 4 h
Electro-mechanic : 1/μm = 10 h

124ReSIST courseware — M. Kaâniche, K. Kanoun, J-C. Laprie — Dependability and Security Evaluation
Markov Model (All transitions are not
displayed)
20
28
22
21
1
19
18
16
15
14
13
12
11
7
3
6
5
2
9
8
10
μop
(λDS1+ λDS2)m
(λDS1+ λDS2)e
(λDA1+ λDA2)m
(λDA1+ λDA2)e
λP1+ λP2
λPS
(λDSS+ λCS)m
(λDSS+ λCS)e
μm
μe
μop
μop
μop
μe
μm
μe
μe
27
26
25
29
24
23
λDAie
λDAim
λDAie
λDAim
λCi
λPi
μm
μe
μe
μe
λC1+ λC2
λC1+ λC2
λP1+ λP2
λC1+ λC2
λP1+ λP2
μm λDSim
μm λDSim
E11 U E12
E13
E21
E22
174
λCi

125ReSIST courseware — M. Kaâniche, K. Kanoun, J-C. Laprie — Dependability and Security Evaluation
Some results
1/μm (h) 10 10 10 10 5 5
1/μe (h) 4 4 2 2 4 4
(min) 15 5 15 5 15 5
Unavailability 6.34 10-4
6.32 10-4
2.97 10-4
2.95 10-4 4.70 10-4 4.6910-4
Unavailability(/year)
5h 33 min 5h 32 min 2h 36 min 2h 35 min 4h 07 min 4h 06 min
MDT (h) 4h 13 min 4h 12 min 2h 55 min 2h 53 min 3h 44 min 3h 43 min
MTBF (h) 6637 6637 9772 9772 7923 7923
1/μop

126ReSIST courseware — M. Kaâniche, K. Kanoun, J-C. Laprie — Dependability and Security Evaluation
Case study 2:
Dependability modelling of theCAUTRA
(French Air Traffic Control Computing System)
K. Kanoun, M. Borrel, T. Morteveille and A. Peytavin, “Modeling the Dependability ofCAUTRA, a Subset of the French Air Traffic Control System”, IEEE Transactions onComputers, 48 (5), pp.528-535, 1999

127ReSIST courseware — M. Kaâniche, K. Kanoun, J-C. Laprie — Dependability and Security Evaluation
Objective of the study
� Comparative analysis and evaluation from the dependabilitypoint of view of candidate architectures of the CAUTRA
� Hardware and software failures and their propagation
� Various fault tolerance and maintenance strategies
RENAR CCR(s)Regional Control Center
FPP
RDPRadar data
processing system
CAUTRA
STIP
Initial Flight Plans processing system
Flight Plansprocessing system
CESNACCentralizedexploitation
Center

128ReSIST courseware — M. Kaâniche, K. Kanoun, J-C. Laprie — Dependability and Security Evaluation
Reference system
� Distributed architecture
� Hardware fault tolerance basedon dynamic redundancy� Duplex, 2 computers DG1 &
DG2
� Software fault tolerance usingexcepting handling andreplication� 2 replicas for each
application: pal, sec
� Communication system
� Organization
� Each computer hosts 1 pal and1 sec replicas (differentapplications)
DG1
FPPsec
DG2
FPPpal
RDPsec
RDPpal

129ReSIST courseware — M. Kaâniche, K. Kanoun, J-C. Laprie — Dependability and Security Evaluation
Reconfiguration after a software failure
Failure of FPP pal
DG1
FPPsec
DG2
FPPpal
RDP RDPsec pal
DG1
FPPsec
DG2
FPPpal
RDP RDPsec pal
DG1
FPPpal
DG2
FPPsec
RDP RDPsec pal
DG1
FPPpal
DG2
FPPsec
RDP RDPsec pal
Switch forrecovery
Restart of FPP sec
Switch back forreconfiguration
O1
O2
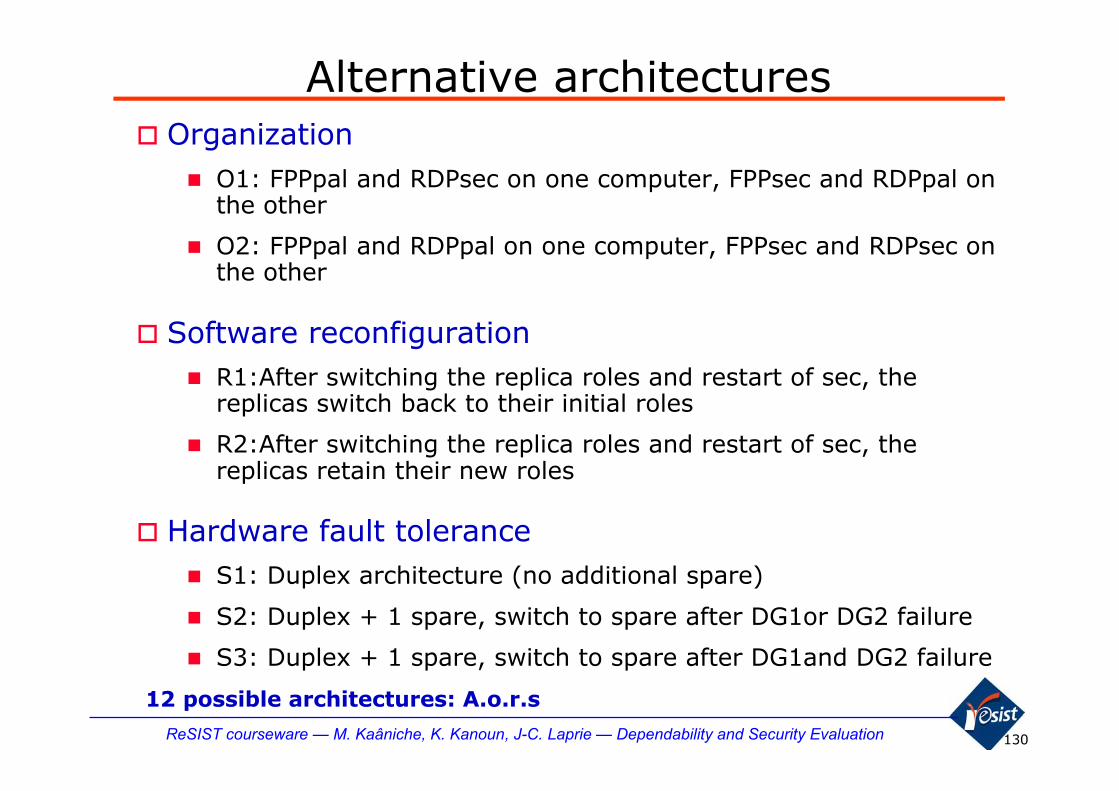
130ReSIST courseware — M. Kaâniche, K. Kanoun, J-C. Laprie — Dependability and Security Evaluation
Alternative architectures� Organization
� O1: FPPpal and RDPsec on one computer, FPPsec and RDPpal onthe other
� O2: FPPpal and RDPpal on one computer, FPPsec and RDPsec onthe other
� Software reconfiguration� R1:After switching the replica roles and restart of sec, the
replicas switch back to their initial roles
� R2:After switching the replica roles and restart of sec, thereplicas retain their new roles
� Hardware fault tolerance� S1: Duplex architecture (no additional spare)
� S2: Duplex + 1 spare, switch to spare after DG1or DG2 failure
� S3: Duplex + 1 spare, switch to spare after DG1and DG2 failure
12 possible architectures: A.o.r.s

131ReSIST courseware — M. Kaâniche, K. Kanoun, J-C. Laprie — Dependability and Security Evaluation
Modeling
� Constant transition rates - homogeneous Markov chains� Software and hardware failure rates
� Recovery, reconfiguration and maintenance rates
� Modeling of interactions and error propagations betweenhardware and software components
� Model construction
� Generalized Stochastic Petri Nets (GSPNs)� Modular and compositional approach with detailed
description of hardware and software components behaviors� Structural verification
� Model Validation
� Progressive approach to master complexity
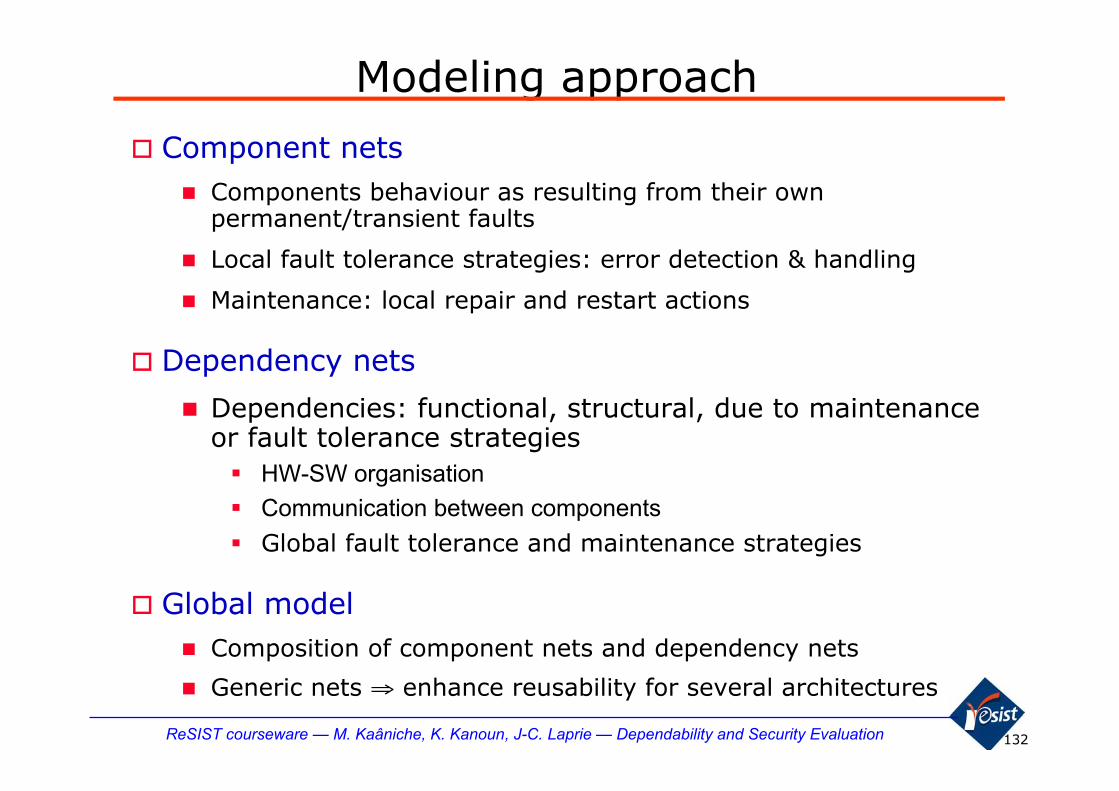
132ReSIST courseware — M. Kaâniche, K. Kanoun, J-C. Laprie — Dependability and Security Evaluation
Modeling approach
� Component nets� Components behaviour as resulting from their own
permanent/transient faults
� Local fault tolerance strategies: error detection & handling
� Maintenance: local repair and restart actions
� Dependency nets
� Dependencies: functional, structural, due to maintenanceor fault tolerance strategies� HW-SW organisation
� Communication between components
� Global fault tolerance and maintenance strategies
� Global model� Composition of component nets and dependency nets
� Generic nets ⇒ enhance reusability for several architectures
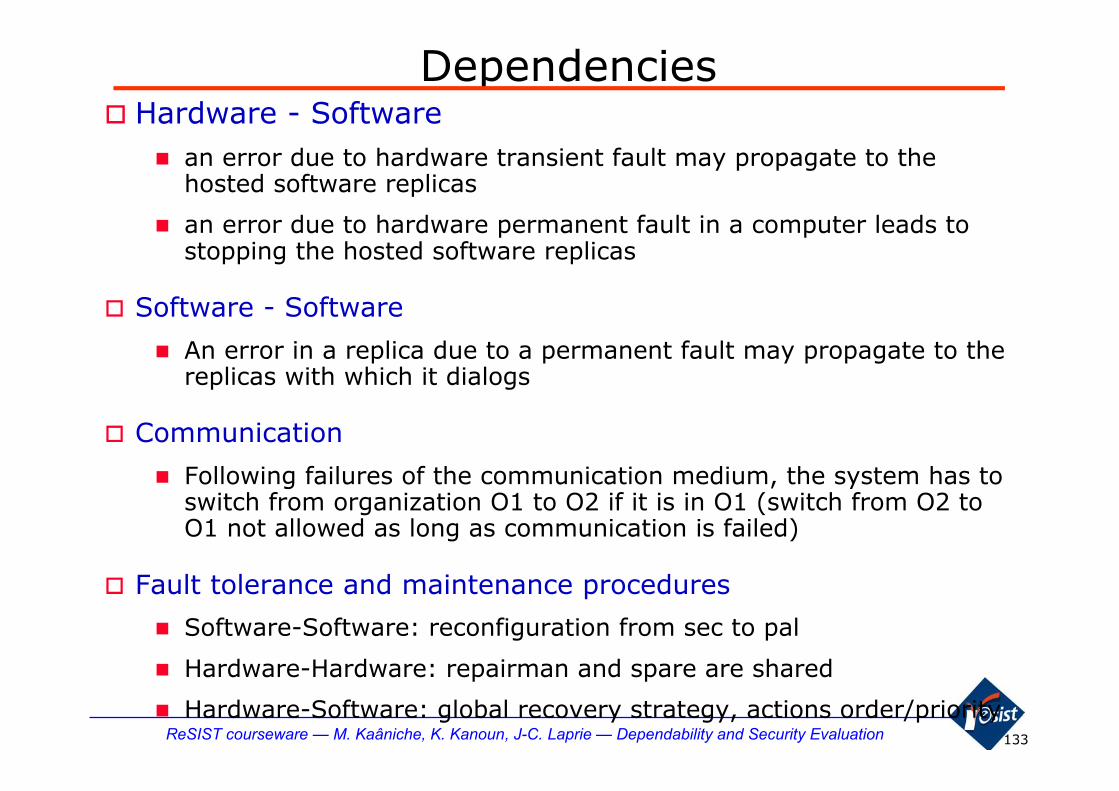
133ReSIST courseware — M. Kaâniche, K. Kanoun, J-C. Laprie — Dependability and Security Evaluation
Dependencies� Hardware - Software
� an error due to hardware transient fault may propagate to thehosted software replicas
� an error due to hardware permanent fault in a computer leads tostopping the hosted software replicas
� Software - Software
� An error in a replica due to a permanent fault may propagate to thereplicas with which it dialogs
� Communication
� Following failures of the communication medium, the system has toswitch from organization O1 to O2 if it is in O1 (switch from O2 toO1 not allowed as long as communication is failed)
� Fault tolerance and maintenance procedures
� Software-Software: reconfiguration from sec to pal
� Hardware-Hardware: repairman and spare are shared
� Hardware-Software: global recovery strategy, actions order/priority

134ReSIST courseware — M. Kaâniche, K. Kanoun, J-C. Laprie — Dependability and Security Evaluation
Component and dependency netsComponent nets
NDG1 NDG2 DG1 & DG2 computers
NFPP1 N FPP2 NRDP1 NRDP2 Software replicas
NC Communication medium
NProp Propagation of a HW error to the hosted replicas
N Stop Software stop after activation of a permanent HW fault
N' Prop propagation of a SW to a communicating SW replicas
NRecRDDNRecFPP RDP, FPP software reconfiguration from sec to pal
NRep HW repair
N Com Communication medium behaviour
NSynRDP NSynFPP Synchronization between HW and SW recovery actions
NStrat Global reconfiguration strategy
N R1 Switch back in the case of reconfiguration R1
Dependency nets

135ReSIST courseware — M. Kaâniche, K. Kanoun, J-C. Laprie — Dependability and Security Evaluation
RDP Model
NRDP1N RDP2
N DG1 DG2N
NSynRDP
N Rep
N RepMat
N RecRDP
N Stop PropN N Stop PropN
Hardware model
Software model
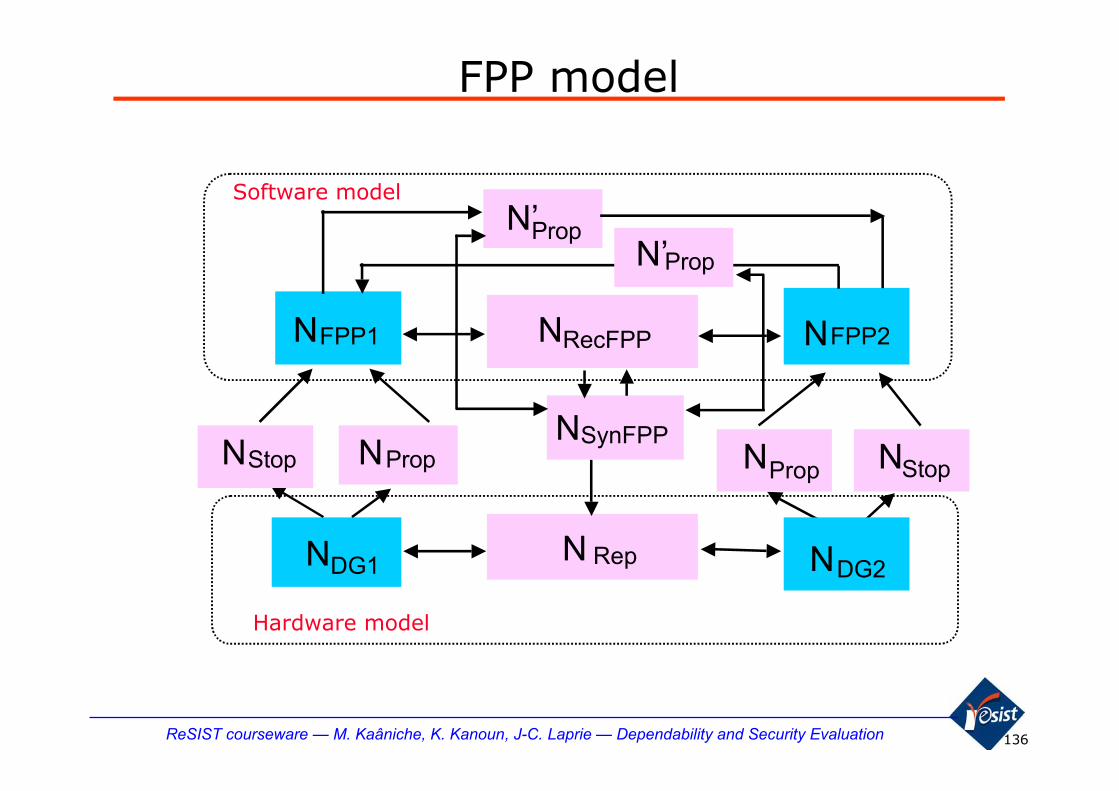
136ReSIST courseware — M. Kaâniche, K. Kanoun, J-C. Laprie — Dependability and Security Evaluation
FPP model
NDG1 NDG2N Rep
NStop NProp N NStopProp
N’PropN’Prop
NSynFPP
NRecFPPNFPP1 FPP2N
Software model
Hardware model

137ReSIST courseware — M. Kaâniche, K. Kanoun, J-C. Laprie — Dependability and Security Evaluation
Reference architecture Model: A.1.1.0
NFPP1
NpropNprop
NRecFPP
NSyncFPP
NRepNDG1
NPropNStop
NProp
NProp
NPropNStop
NRDP1
NSyncRDP
NRecFPP
NProp NStop
NFPP2
NDG2
NStopNProp
NRDP1
NCNReq NStrat NR1GlobalRecoveryStrategy
NProp
NProp
RDP model
FPP model

138ReSIST courseware — M. Kaâniche, K. Kanoun, J-C. Laprie — Dependability and Security Evaluation
Other architectures models� A.2.1.0
� adapt NR1 & NSynFPP for O2
� A.1.2.0 et A.2.2.0
� remove NR1 & adapt NSynFPP for A.2.2.0
� R1,S1 et R1,S2 : A.1.1.1 - A.2.1.1 - A.1.1.2 - A.2.1.2
� adapt NR1 & NSynFPP for O2
� adapt Nrep
� add NSpare related to Nrep
� R2,S1 et R2,S2 : A.1.2.1 - A.2.2.1 - A.1.2.2 - A.2.2.2
� remove NR1
� adapt NSynFPP for O2
� adapt Nrep
� add NSpare related to Nrep
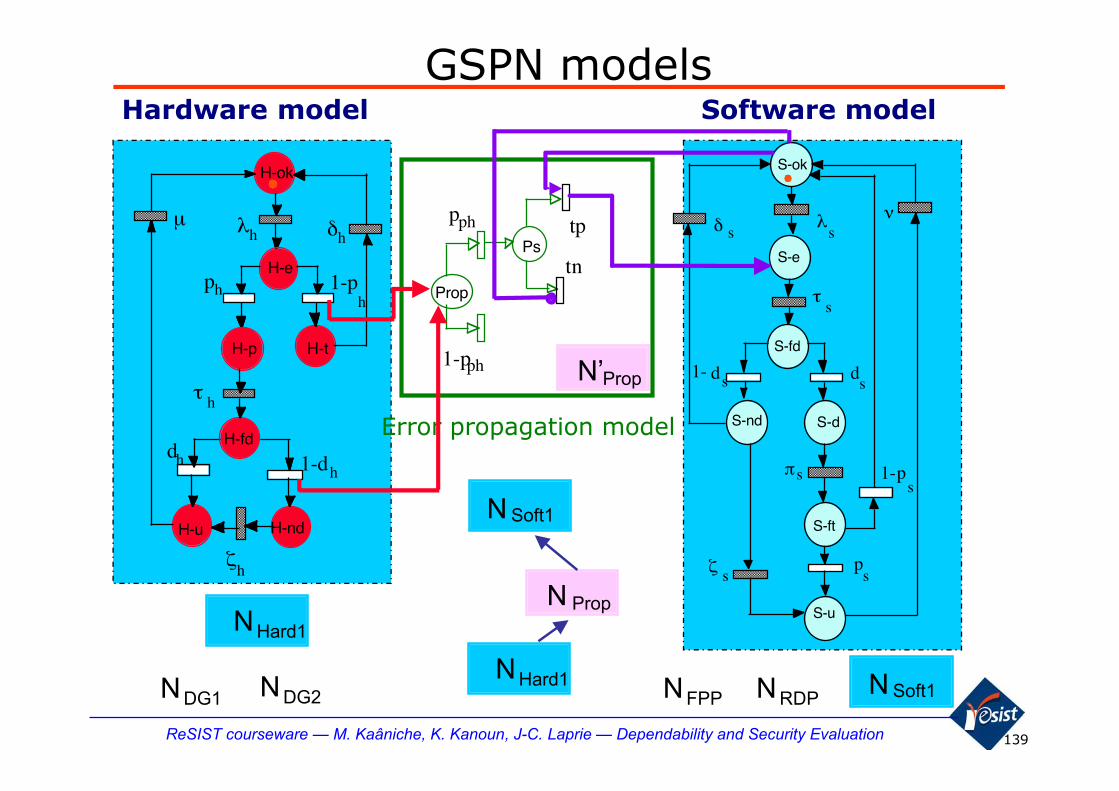
139ReSIST courseware — M. Kaâniche, K. Kanoun, J-C. Laprie — Dependability and Security Evaluation
GSPN models
pph
Prop
1-pph
tp
tnPs
Hardware model Software model
H-ok
λh δh
H-e
h1-pph
μ
H-t
ζh
H-nd
h1-d
H-p
dh
H-u
hτ
H-fd
λs
S-ok
δ sν
S-e
sτ
S-fd
ds
sd1-
sp1-
S-nd
ζ pss
S-u
S-d
πs
S-ft
Error propagation model
NHard1
N Soft1
PropN
N Soft1
NHard1
PropN’
NDG2NDG1 NFPP NRDP
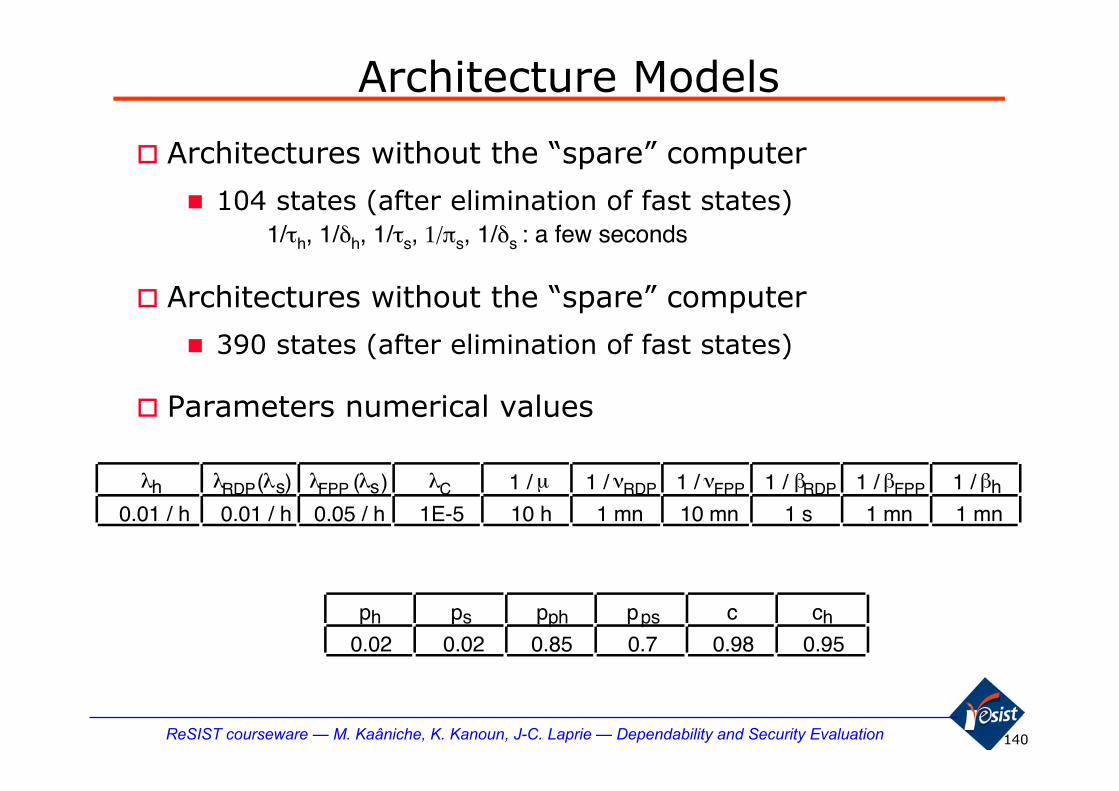
140ReSIST courseware — M. Kaâniche, K. Kanoun, J-C. Laprie — Dependability and Security Evaluation
Architecture Models
� Architectures without the “spare” computer
� 104 states (after elimination of fast states)1/τh, 1/δh, 1/τs, 1/πs, 1/δs : a few seconds
� Architectures without the “spare” computer
� 390 states (after elimination of fast states)
� Parameters numerical values
λh λRDP (λs) λFPP (λs) λC 1 / μ 1 / νRDP 1 / νFPP 1 / βRDP 1 / βFPP 1 / βh
0.01 / h 0.01 / h 0.05 / h 1E-5 10 h 1 mn 10 mn 1 s 1 mn 1 mn
ph ps pph pps c ch
0.02 0.02 0.85 0.7 0.98 0.95
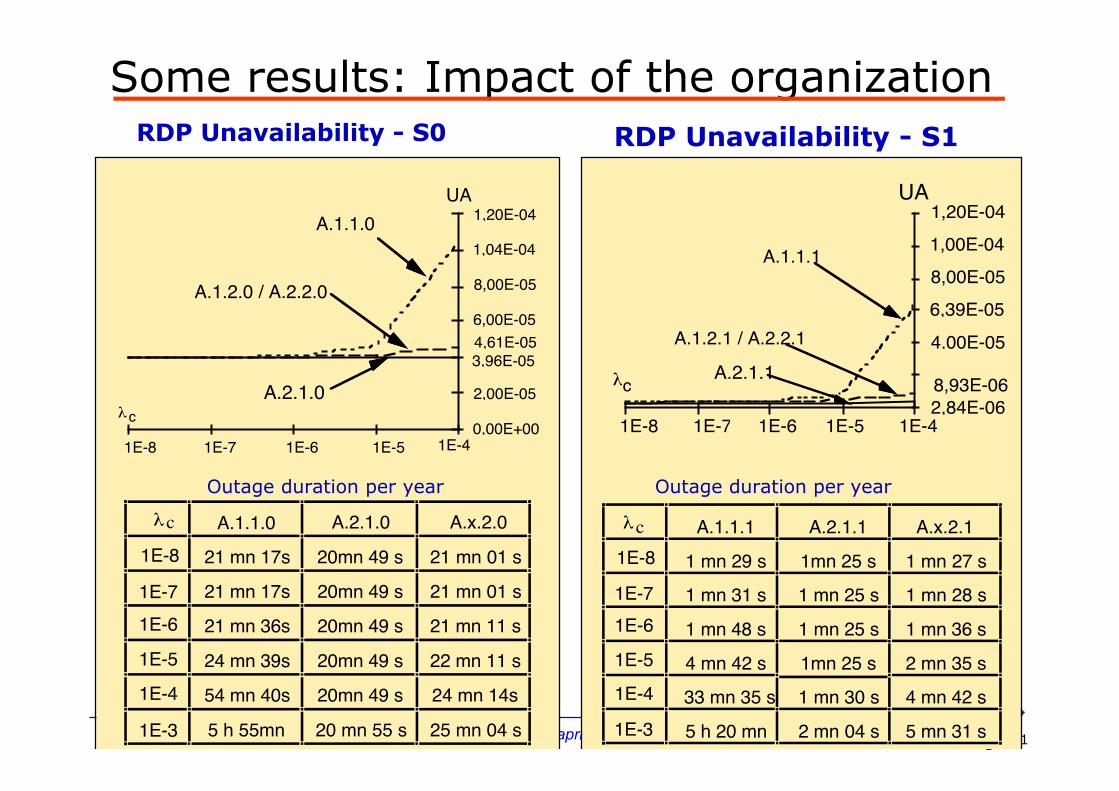
141ReSIST courseware — M. Kaâniche, K. Kanoun, J-C. Laprie — Dependability and Security Evaluation
Some results: Impact of the organizationRDP Unavailability - S0
λ c0,00E+00
2,00E-05
3,96E-05
6,00E-05
8,00E-05
1,04E-04
1,20E-04
1E-8
4,61E-05
A.1.1.0
A.1.2.0 / A.2.2.0
A.2.1.0
UA
1E-7 1E-6 1E-5 1E-4
A.x.2.0
21 mn 01 s
21 mn 01 s
21 mn 11 s
22 mn 11 s
24 mn 14s
25 mn 04 s
A.1.1.0 A.2.1.0
21 mn 17s 20mn 49 s
21 mn 17s 20mn 49 s
21 mn 36s 20mn 49 s
24 mn 39s 20mn 49 s
54 mn 40s 20mn 49 s
5 h 55mn 20 mn 55 s
cλ
1E-8
1E-7
1E-6
1E-5
1E-4
1E-3
2,84E-068,93E-06
4,00E-05
6,39E-05
8,00E-05
1,00E-04
1,20E-04
A.1.1.1
A.1.2.1 / A.2.2.1
A.2.1.1
UA
λc
1E-8 1E-7 1E-6 1E-5 1E-4
A.x.2.1
1 mn 27 s
1 mn 28 s
1 mn 36 s
2 mn 35 s
4 mn 42 s
5 mn 31 s
A.1.1.1 A.2.1.1
1 mn 29 s 1mn 25 s
1 mn 31 s 1 mn 25 s
1 mn 48 s 1 mn 25 s
4 mn 42 s 1mn 25 s
33 mn 35 s 1 mn 30 s
5 h 20 mn 2 mn 04 s
cλ
1E-8
1E-7
1E-6
1E-5
1E-4
1E-3
RDP Unavailability - S1
Outage duration per year Outage duration per year

142ReSIST courseware — M. Kaâniche, K. Kanoun, J-C. Laprie — Dependability and Security Evaluation
Impact of the organizationRDP Unavailability - S2
Outage duration per year
1E-4
1,20E-04
0,00E+00
2,00E-05
3,63E-05
6,00E-05
8,00E-05
1,00E-04
3,00E-05
A.1.1.2
A.1.2.2 / A.2.2.2
A.2.1.2
UA
λ c
1E-8 1E-7 1E-6 1E-5
1E-8
A.1.1.2 A.2.1.2
15 mn 59s 15 mn 40s
15 mn 59s 15 mn 40s
16mn 18s 15 mn 40s
19 mn 17s 15 mn 40s
49 mn06s 15 mn 46s
5 h 45mn 16 mn 21s
A.x.2.2
15 mn 46s
15 mn 46
15mn 56s
16mn 55s
18 mn 58s
19mn 49s
cλ
1E-7
1E-6
1E-5
1E-4
1E-3

143ReSIST courseware — M. Kaâniche, K. Kanoun, J-C. Laprie — Dependability and Security Evaluation
Reconfiguration impact
A.1.2.z A.2.2.z A.1.1.z A.2.1.z
z = 0 2 h 42 mn 2 h 42 mn 2 h 42 mn 2 h 41 mn
z = 2 2 h 36 mn 2 h 36 mn 2 h 36 mn 2 h 36 mn
z = 1 2 h 17 mn 2 h 17 mn 2 h 17 mn 2 h 17 mn
A.1.2.z A.2.2.z A.1.1.z A.2.1.z
z = 0 21 mn 11s 21 mn 11s 21 mn 36s 20 mn 49s
z = 2 15 mn 56s 15 mn 56s 16 mn 18s 15 mn 40s
z = 1 1 mn 36s 1 mn 36s 1 mn 48s 1 mn 25s
RDP unavailability, per year
FPP unavailability, per year

144ReSIST courseware — M. Kaâniche, K. Kanoun, J-C. Laprie — Dependability and Security Evaluation
Hardware coverage impact
RDP unavailability, per year — for S1 & S2
ch A.x.2.1 A.x.2.2 A.1.1.1 A.1.1.2 A.2.1.1 A.2.1.2
0.7 6 mn 7s 15 mn 49 s 6 mn 44 s 15 mn 59 s 6 mn 34 s 15 mn 37 s
0.9 2 mn 29 s 15 mn 49 s 2 mn 32s 15 mn 59 s 2 mn 27 s 15 mn 37 s
0.95 1 mn 27s 15 mn 46 s 1 mn 29 s 15 mn 59 s 1 mn 25 s 15 mn 37 s
1 25 s 15 mn 45 s 26 s 15 mn 59 s 23 s 15 mn 37 s
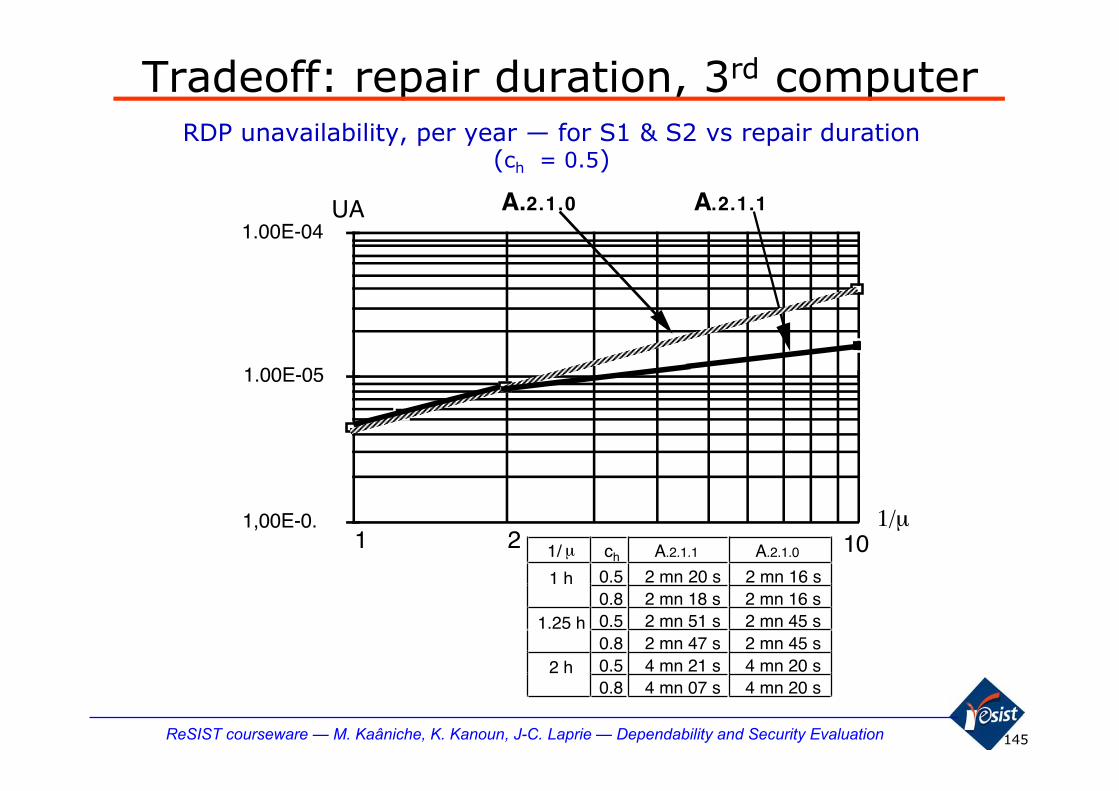
145ReSIST courseware — M. Kaâniche, K. Kanoun, J-C. Laprie — Dependability and Security Evaluation
Tradeoff: repair duration, 3rd computer
1,00E-0.
1.00E-05
1.00E-04UA A.2.1.0 A.2.1.1
1/μ21 101/ μ ch A.2.1.1 A.2.1.0
1 h 0.5 2 mn 20 s 2 mn 16 s0.8 2 mn 18 s 2 mn 16 s
1.25 h 0.5 2 mn 51 s 2 mn 45 s0.8 2 mn 47 s 2 mn 45 s
2 h 0.5 4 mn 21 s 4 mn 20 s0.8 4 mn 07 s 4 mn 20 s
RDP unavailability, per year — for S1 & S2 vs repair duration(ch = 0.5)

146ReSIST courseware — M. Kaâniche, K. Kanoun, J-C. Laprie — Dependability and Security Evaluation
Sensitivity analyses
Switching 1/β A.2.1.0 A.2.1.2 A.2.1.1
10 mn 18 h 39 mn 18 h 34 mn 18 h 02 mn
6 mn 11 h 33 mn 11 h 28 mn 11 h 02 mn
1 mn 2 h 41 mn 2 h 36 mn 2 h 17 mn
1 s 56 mn 46 s 50 mn 59 s 33 s
Restart 1/ ν A.2.1.0 A.2.1.1 A .2.1.2
1 h 6 h 20 mn 5 h 34 mn 6 h 10 mn
10 mn 2 h 41 mn 2 h17 mn 2 h 36 mn
6 mn 2 h 27 mn 2 h 05 mn 2 h 22 mn
1 mn 2 h 10 mn 1 h 50 mn 2 h 05 mn
FPP unavailability (per year) vs pal/sec switching duration
FPP unavailability (per year) vs replica restart duration
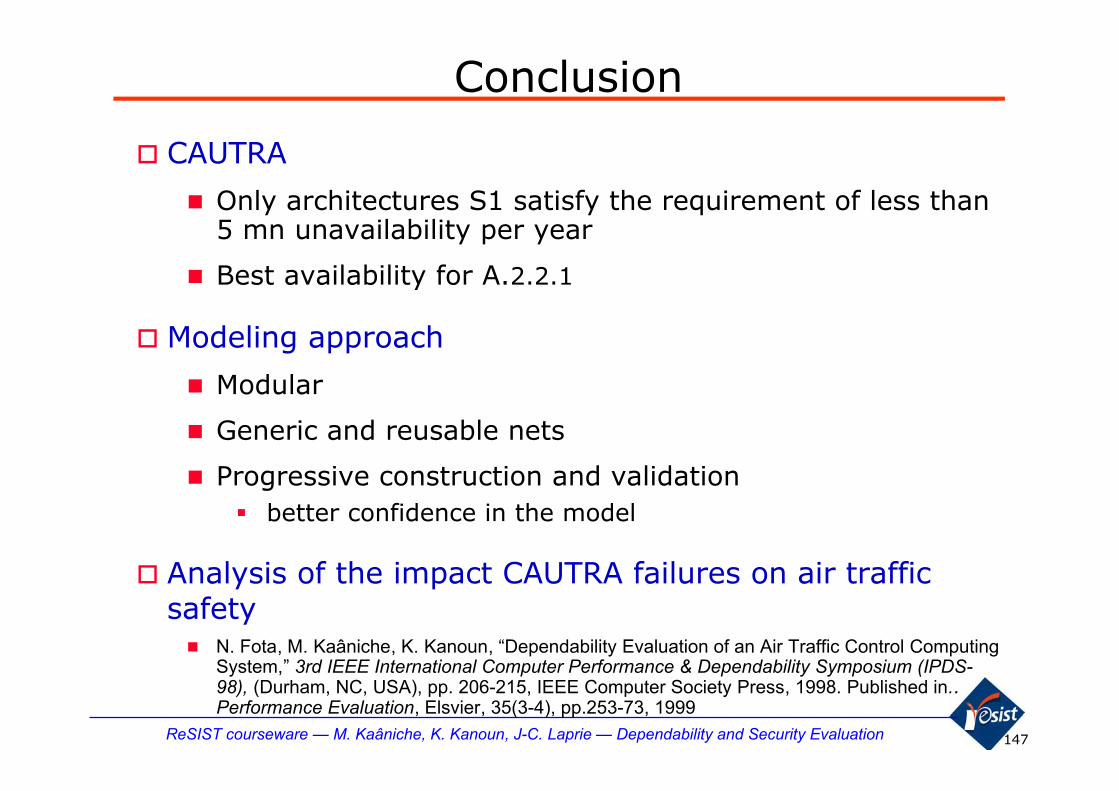
147ReSIST courseware — M. Kaâniche, K. Kanoun, J-C. Laprie — Dependability and Security Evaluation
Conclusion
� CAUTRA
� Only architectures S1 satisfy the requirement of less than5 mn unavailability per year
� Best availability for A.2.2.1
� Modeling approach
� Modular
� Generic and reusable nets
� Progressive construction and validation� better confidence in the model
� Analysis of the impact CAUTRA failures on air trafficsafety� N. Fota, M. Kaâniche, K. Kanoun, “Dependability Evaluation of an Air Traffic Control Computing
System,” 3rd IEEE International Computer Performance & Dependability Symposium (IPDS-98), (Durham, NC, USA), pp. 206-215, IEEE Computer Society Press, 1998. Published in..Performance Evaluation, Elsvier, 35(3-4), pp.253-73, 1999

148ReSIST courseware — M. Kaâniche, K. Kanoun, J-C. Laprie — Dependability and Security Evaluation
Evaluation with regard toMalicious Threats

149ReSIST courseware — M. Kaâniche, K. Kanoun, J-C. Laprie — Dependability and Security Evaluation
Security evaluation: Context
� Historically, attention has been mainly focused on preventionand protection approaches, and less on evaluation
� Traditional evaluation methods
� Qualitative assessment criteria (verification&evaluation)� TCSEC (USA), ITSEC (Europe), Common Criteria� Security levels based on functional and assurance criteria
� Risk assessment methods� Subjective evaluation of vulnerabilities, threats and
consequences
� Red teams: try to penetrate or compromise the system
� Not well suited to take into account the dynamic evolutionof systems, their environment and threats duringoperation, and to support objective design decisions
� Need for security quantification approaches similar to thoseused in dependability relative to accidental faults

150ReSIST courseware — M. Kaâniche, K. Kanoun, J-C. Laprie — Dependability and Security Evaluation
Security quantification challenges
� Defining representative measures
� Are new measures needed?
� Modeling attackers behaviors and system vulnerabilitiesand assessing their impact on security properties
� How different is it, compared to modeling accidental faultsand their consequences?
� Elaborating representative assumptions
� Continuous evolution of threats and attackers behaviors
� Need for unbiased and detailed data
Measures Models Data
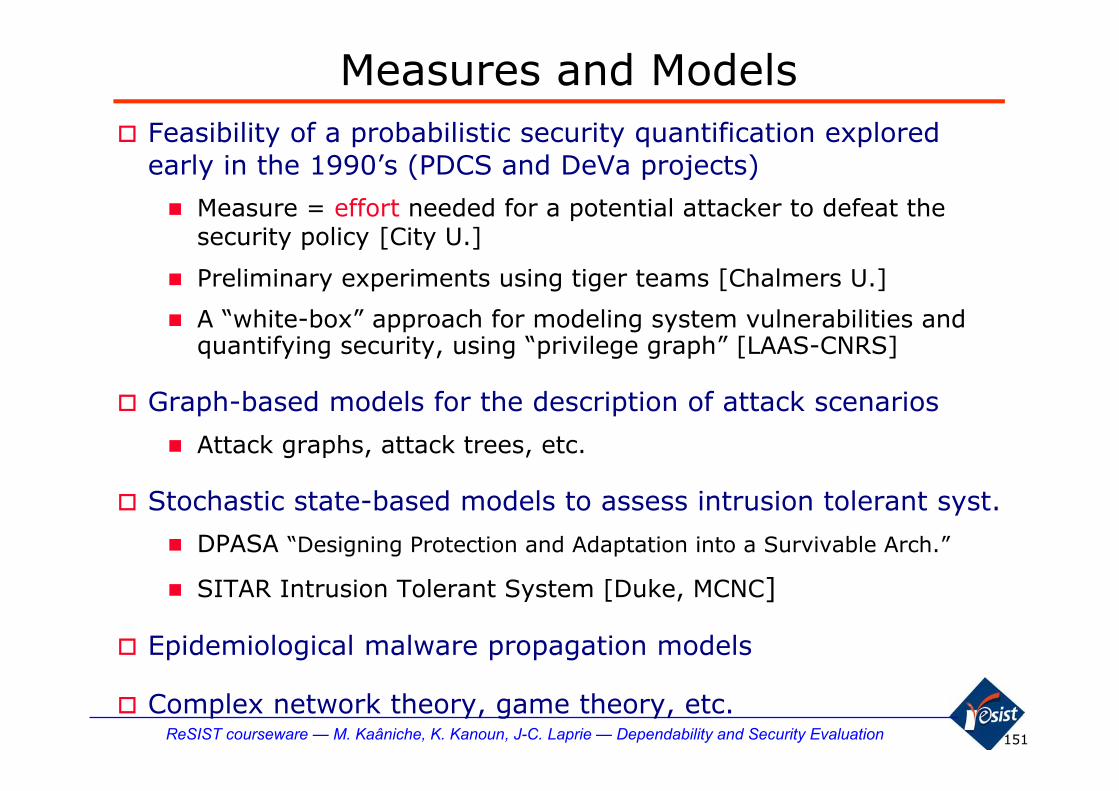
151ReSIST courseware — M. Kaâniche, K. Kanoun, J-C. Laprie — Dependability and Security Evaluation
Measures and Models� Feasibility of a probabilistic security quantification explored
early in the 1990’s (PDCS and DeVa projects)
� Measure = effort needed for a potential attacker to defeat thesecurity policy [City U.]
� Preliminary experiments using tiger teams [Chalmers U.]
� A “white-box” approach for modeling system vulnerabilities andquantifying security, using “privilege graph” [LAAS-CNRS]
� Graph-based models for the description of attack scenarios
� Attack graphs, attack trees, etc.
� Stochastic state-based models to assess intrusion tolerant syst.
� DPASA “Designing Protection and Adaptation into a Survivable Arch.”
� SITAR Intrusion Tolerant System [Duke, MCNC]
� Epidemiological malware propagation models
� Complex network theory, game theory, etc.

152ReSIST courseware — M. Kaâniche, K. Kanoun, J-C. Laprie — Dependability and Security Evaluation
LAAS quantitative evaluation approach� Motivation
� Take into account security/usability trade-offs
� Monitor security evolutions according to configuration anduse changes
� Identify the best security improvement for the leastusability change
� Probabilistic modeling framework
� Vulnerabilities
� Attackers
� Measure = effort needed for a potential attacker to defeat thesecurity policy
� Application to Unix-based systems
R. Ortalo, Y. Deswarte and M. Kaâniche, “Experimenting with Quantitative Evaluation Tools forMonitoring Operational Security”, IEEE Transactions on Software Engineering, 25 (5), pp.633-650, 1999
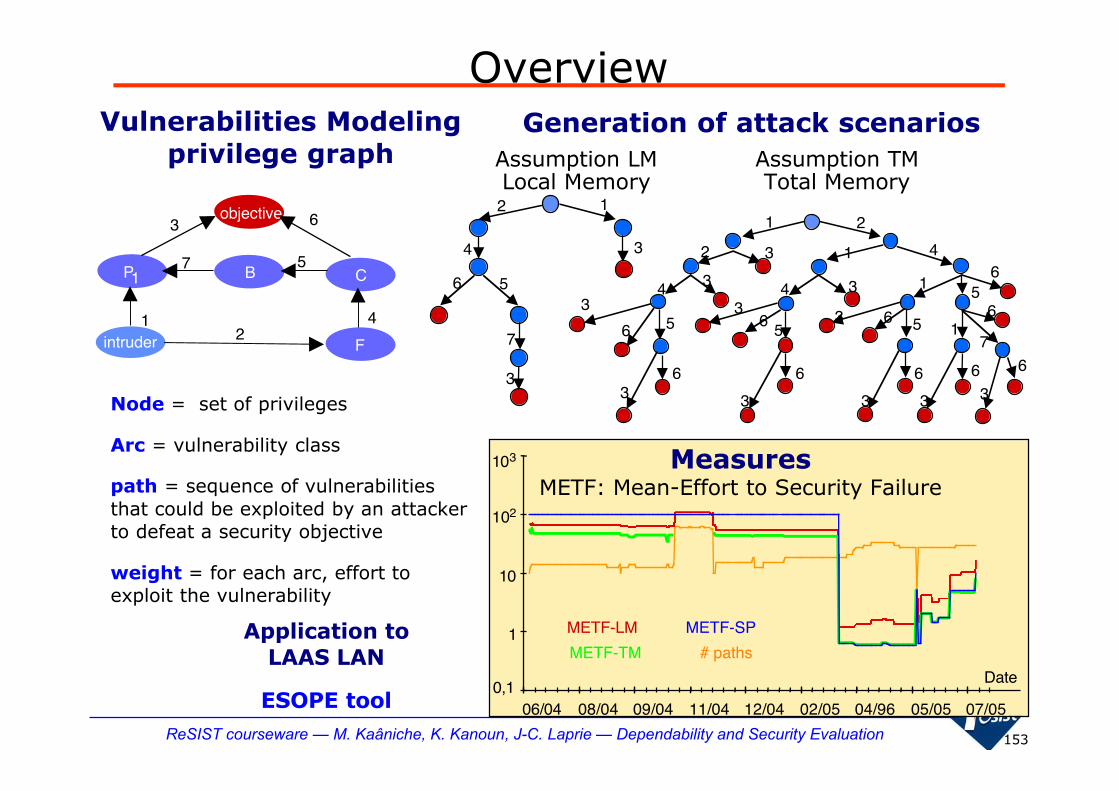
153ReSIST courseware — M. Kaâniche, K. Kanoun, J-C. Laprie — Dependability and Security Evaluation
Overview
Node = set of privileges
Arc = vulnerability class
path = sequence of vulnerabilitiesthat could be exploited by an attackerto defeat a security objective
weight = for each arc, effort toexploit the vulnerability
Vulnerabilities Modelingprivilege graph
Generation of attack scenarios
Measures
Assumption LMLocal Memory
METF: Mean-Effort to Security Failure
Application toLAAS LAN
ESOPE tool
Assumption TMTotal Memory
BP1
objective
C
F
12
4
5
6
7
3
intruder
3
3
6 5
7
4
12
1
1
1
1
33
2
2
33 3
3 3 3
3
3
3 6
6
66666
5
5557
6
4 4
4
6 6
0,1
1
10
102
103
06/04 08/04 09/04 11/04 12/04 02/05 04/96 05/05 07/05
Date
METF-SPMETF-LM
METF-TM # paths

154ReSIST courseware — M. Kaâniche, K. Kanoun, J-C. Laprie — Dependability and Security Evaluation
Open issues
� Is the model valid in the real world?
� TM and ML are two extreme behaviors, but what wouldbe a “real” attacker behavior?
�Weight parameters are assessed arbitrarily(subjective?)
� Tenacity? Collusion? Attack rates?
� Validation based on real data would be needed!!
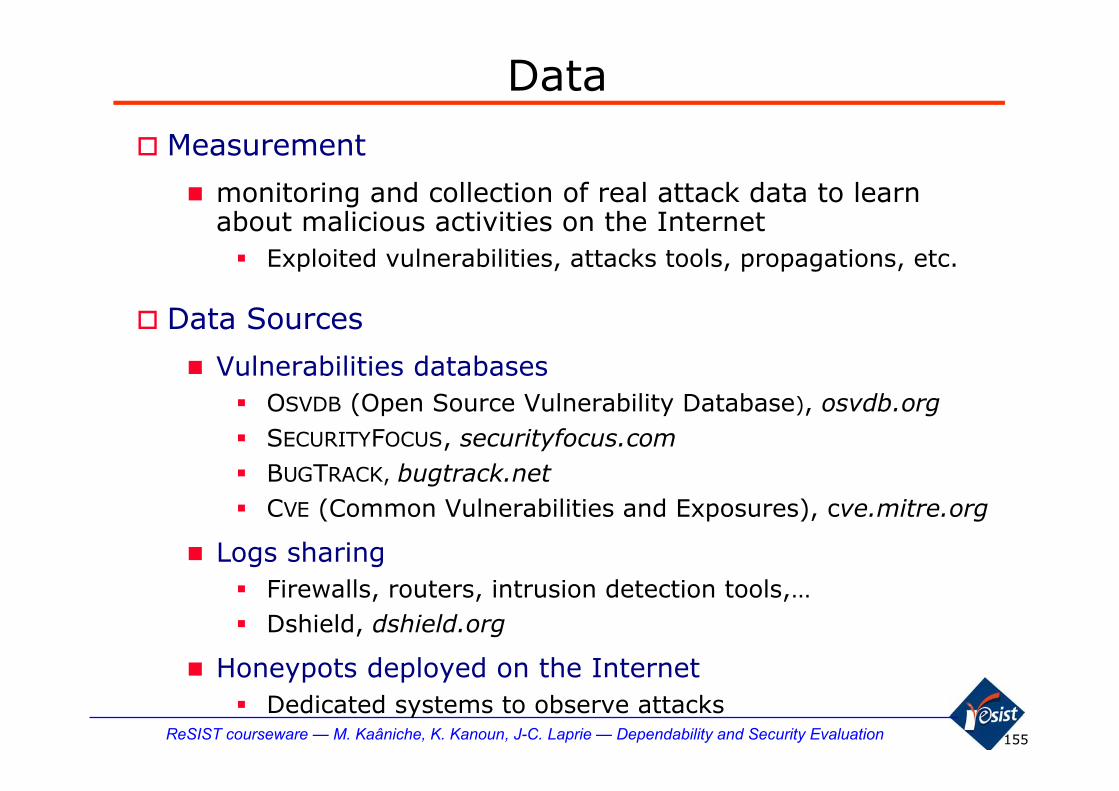
155ReSIST courseware — M. Kaâniche, K. Kanoun, J-C. Laprie — Dependability and Security Evaluation
Data
� Measurement
� monitoring and collection of real attack data to learnabout malicious activities on the Internet� Exploited vulnerabilities, attacks tools, propagations, etc.
� Data Sources
� Vulnerabilities databases� OSVDB (Open Source Vulnerability Database), osvdb.org� SECURITYFOCUS, securityfocus.com� BUGTRACK, bugtrack.net� CVE (Common Vulnerabilities and Exposures), cve.mitre.org
� Logs sharing� Firewalls, routers, intrusion detection tools,…� Dshield, dshield.org
� Honeypots deployed on the Internet� Dedicated systems to observe attacks
156ReSIST courseware — M. Kaâniche, K. Kanoun, J-C. Laprie — Dependability and Security Evaluation
Honeypots
� “an information system resource whose value lies inunauthorized or illicit use of that resource”
L. Spitzner, Honeypots: Tracking hackers, Addison-Wesley, 2002
� High-interaction honeypots� Emulate the existence of a target at different abstraction levels
(networks services, OS, application) without possibility to controlthe system
� Low risk, easy to implement
� High-interaction honeypots� A real or virtual system that can be compromised by the
attacker
� Higher risk, difficult to deploy

157ReSIST courseware — M. Kaâniche, K. Kanoun, J-C. Laprie — Dependability and Security Evaluation
Data collection platforms
� Honeynet project
� Architectures and data collection tools
� Use honeypots
� CAIDA, caida.org
� Use special probes to monitor unused address spaces:telescopes
� Leurré.com
� Deploy on the Internet a large number of identicallyconfigured low-interaction honeypots at diverse locations
� Carry out analyses based on collected data to betterunderstand threats and build models to characterizeattacks
� Set-up by Institut Eurecom, Sophia-Antipolis
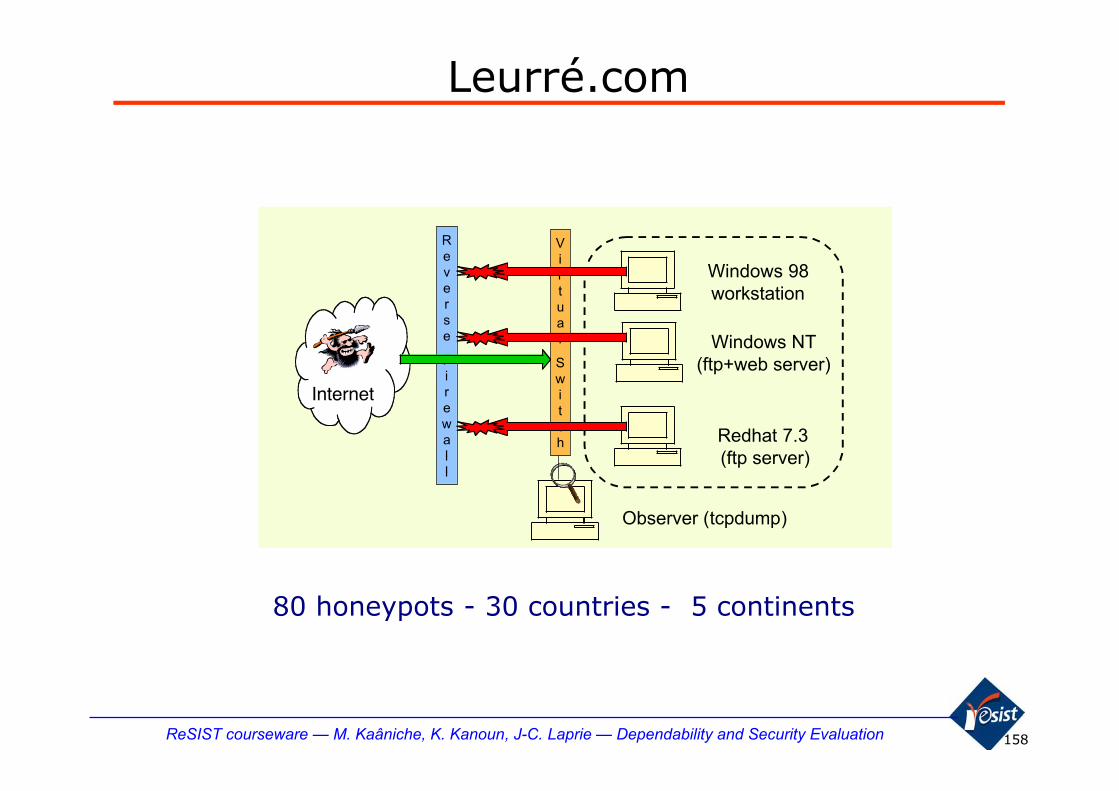
158ReSIST courseware — M. Kaâniche, K. Kanoun, J-C. Laprie — Dependability and Security Evaluation
Leurré.com
80 honeypots - 30 countries - 5 continents
Reverse
Firewall
Internet
Windows 98workstation
Windows NT(ftp+web server)
Redhat 7.3 (ftp server)
Observer (tcpdump)
Virtual
Switch
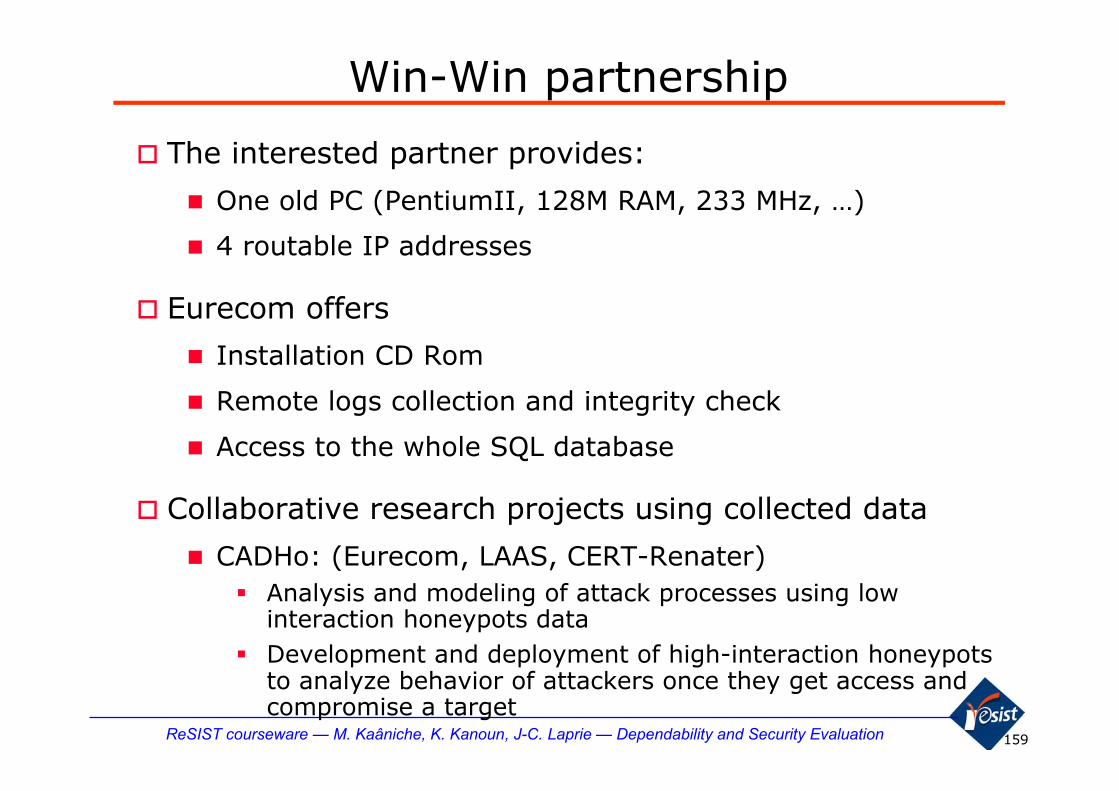
159ReSIST courseware — M. Kaâniche, K. Kanoun, J-C. Laprie — Dependability and Security Evaluation
Win-Win partnership
� The interested partner provides:
� One old PC (PentiumII, 128M RAM, 233 MHz, …)
� 4 routable IP addresses
� Eurecom offers
� Installation CD Rom
� Remote logs collection and integrity check
� Access to the whole SQL database
� Collaborative research projects using collected data
� CADHo: (Eurecom, LAAS, CERT-Renater)� Analysis and modeling of attack processes using low
interaction honeypots data� Development and deployment of high-interaction honeypots
to analyze behavior of attackers once they get access andcompromise a target

160ReSIST courseware — M. Kaâniche, K. Kanoun, J-C. Laprie — Dependability and Security Evaluation
Overview of collected data� Data collection since 2003
� 3026962 different IP addresses from more than 100 countries� 80 honeypot platforms deployed progressively
Hon
eypo
t pla
tform
date
� Information extracted from the logs� Raw packets (entire frames including payloads)� IP address of attacking machine� Time of the attack and duration� Targeted virtual machines and ports� Geographic location of attacking machine (Maxmind, NetGeo)� Os of the attacking machine (p0f, ettercap, disco)

161ReSIST courseware — M. Kaâniche, K. Kanoun, J-C. Laprie — Dependability and Security Evaluation
Analysis and modeling of attack processes
� Automatic data analyses to extract useful trends andidentify hidden phenomena from the data� Categorization of attacks according to their origin, attack tools,
target services and machines, etc.
� Analysis of similarities of attack patterns for different honeypotenvironments, etc.
� Publications available at: www.leurrecom.org/paper.htm
� Stochastic modeling of attack processes� Identify probability distributions that best characterize attack
occurrence and attack propagation processes
� Analyze whether data collected from different platforms exhibitsimilar or different malicious attack activities
� Predict occurrence of new attacks on a given platform based onpast observations on this platform and other platforms
� Publications available at: www.cadho.org

162ReSIST courseware — M. Kaâniche, K. Kanoun, J-C. Laprie — Dependability and Security Evaluation
“Times between attacks” distribution� An attack is associated to an IP address
� occurrence time associated to the first time a packet is receivedfrom the corresponding address
� Best fit provided by a mixture distribution
0.000
0.005
0.010
0.015
0.020
0.025
1 31 61 91 121 151 181 211 241 271Time between attacks
pd
f
Pa = 0.0115k = 0.1183λ = 0.1364/sec.
Mixture (Pareto, Exp.)
Data
ExponentialPlatform 6
pdf t Pk
tP ea k a
t( )( )
( )=+
+ −+−
111 λ λ

163ReSIST courseware — M. Kaâniche, K. Kanoun, J-C. Laprie — Dependability and Security Evaluation
“Times between attacks” distributions (2)
Platform 20 Platform 23
Platform 5 Platform 9
0.00
0.01
0.02
0.03
0.04
0.05
0.06
0.07
0.08
1 31 61 91 121 151 181 211 241 271Time between attacks
DataMixture (Pareto, Exp.)
Exponential
Pa = 0.0019k = 0.1668λ = 0.276/sec.p-value = 0.99
0.00
0.00
0.00
0.01
0.01
0.01
0.01
0.01
0.02
1 31 61 91 121 151 181 211 241 271
Time between attacks
Data
Mixture (Pareto, Exp.)
Exponential
Pa = 0.0144k = 0.0183λ = 0.0136/sec.p-value = 0.90
0.00
0.01
0.02
0.03
0.04
0.05
0.06
1 31 61 91 121 151 181 211 241 271
Time between attacks
pd
fData
Mixture (Pareto, Exp.)
Exponential
Pa = 0.0031k = 0.1240λ = 0.275/sec.p-value = 0.985
Time (sec.)0.00
0.01
0.01
0.02
0.02
0.03
0.03
1 31 61 91 121 151 181 211 241 271Time between attacks
Pa = 0.0051k = 0.173λ = 0.121/sec.p-value = 0.90
DataMixture (Pareto, Exp.)
Exponential

164ReSIST courseware — M. Kaâniche, K. Kanoun, J-C. Laprie — Dependability and Security Evaluation
Propagation of attacks� A Propagation is assumed to occur when an IP address of an
attacking machine observed at a given platform is observed atanother platform
P20
P6
P9
P5
P23
96.1%
0.9%
15.1%
43.2%
0.6%
2.7%
29%
4.1%
1.35%
8.1%
12.6%
54.1%
1.4%
1.37%
15.4%
95.5%
1%
0.6%
1.1%
11.3%
59%
3.7%
30.3%
4.3%
96.1%
95.5%
29%59%
15.1%
15.4%
11.3%

165ReSIST courseware — M. Kaâniche, K. Kanoun, J-C. Laprie — Dependability and Security Evaluation
Discussion� Preliminary models to characterize attack processes
observed on low-interaction honeypots
� Several open issues� Need for predictive models that can be used to support
decision making during design and operation� How to assess the impact of attacks on the security of
target systems?
� Honeypots with higher degree of interaction are needed toanalyse attacker behavior once they manage to compromiseand access to a target
� first results demonstrate their usefulness and complementaritywith low interaction honeypots [Alata et al. 2006]
E. Alata, V. Nicomette, M. Kaâniche, M. Dacier and M. Herrb, “Lessons Learned from theDeployment of a High-Interaction Honeypot”, in Sixth European Dependable Computing Conference(EDCC-6), (Coimbra, Portugal), pp.39-44, IEEE Computer Society, 2006

166ReSIST courseware — M. Kaâniche, K. Kanoun, J-C. Laprie — Dependability and Security Evaluation
High-interaction honeypot� analyze attackers behavior once they compromise and get
access to a target
Debian
Firewall
Internet
VMWare
Debian
Databasessh
Instrumentation and monitoring• modification of the virtual machines
�tty driver (Kernel space): read/write on the terminal� exec system call (Kernel space): program run by attacker� SSH modification (User space): login and passwords archival� new system call (Kernel space): backup information recorded from theuser into the kernel memory
• redirection mechanism at the firewall for output connections• tcpdump

167ReSIST courseware — M. Kaâniche, K. Kanoun, J-C. Laprie — Dependability and Security Evaluation
Experimentation� Deployment : 5 Janv. 2006— 20 mars 2007 (419 days)
� Creation of 21 user accounts (Login, passwd)
� 655 different source addresses observed on the honeypot
� 552 362 ssh connections
� 98347 tested accounts (Login, passwd)
rank Nb connections Login password

168ReSIST courseware — M. Kaâniche, K. Kanoun, J-C. Laprie — Dependability and Security Evaluation
Intrusion process
Account creation First password guessing First intrusion
timeΔ1 Δ2
4 days1 dayUA5
………
10 days5 daysUA4
1 day15 daysUA3
4 minutesHalf a dayUA2
4 days1 dayUA1
Δ2Δ1User account

169ReSIST courseware — M. Kaâniche, K. Kanoun, J-C. Laprie — Dependability and Security Evaluation
Analysis of SSH connexions/attack sessions
552362connectionattempts
1940 sessions
210 sessions withcommands : intrusions
104 intrusions withouttyping errors
(?)
104 intrusions withtyping errors
(humans)
1730 sessions without commands
57 intrusionswithout typing
errors:block by block
47 intrusions withouttyping errors :
Character by character(humans)
1391 dictionary attacks other
Different IPaddresses

170ReSIST courseware — M. Kaâniche, K. Kanoun, J-C. Laprie — Dependability and Security Evaluation
Dictionary attack - 1391
� A dictionary attack is a sequence of attempts to connect toservice by submitting login/password pair picked from adictionary
� Observed dictionary attacks:
� Dedicated IPs for dictionary attacks: never used for intrusionattacks
� Large dictionary
� Very short time intervals between successive connectionattempts
⇒ Automated scripts

171ReSIST courseware — M. Kaâniche, K. Kanoun, J-C. Laprie — Dependability and Security Evaluation
Intrusion - 210
� An intrusion attack is an illegal use of local services thanks tothe illegal use of a valid user identity
� Observed intrusion attacks:
� Half of these IPs came from the same country
� Use of ssh service
� Dedicated IPs to intrusion attacks: never used for dictionaryattacks
⇒ No intersection between IPs used to perform dictionary attackand IPs used for real intrusion
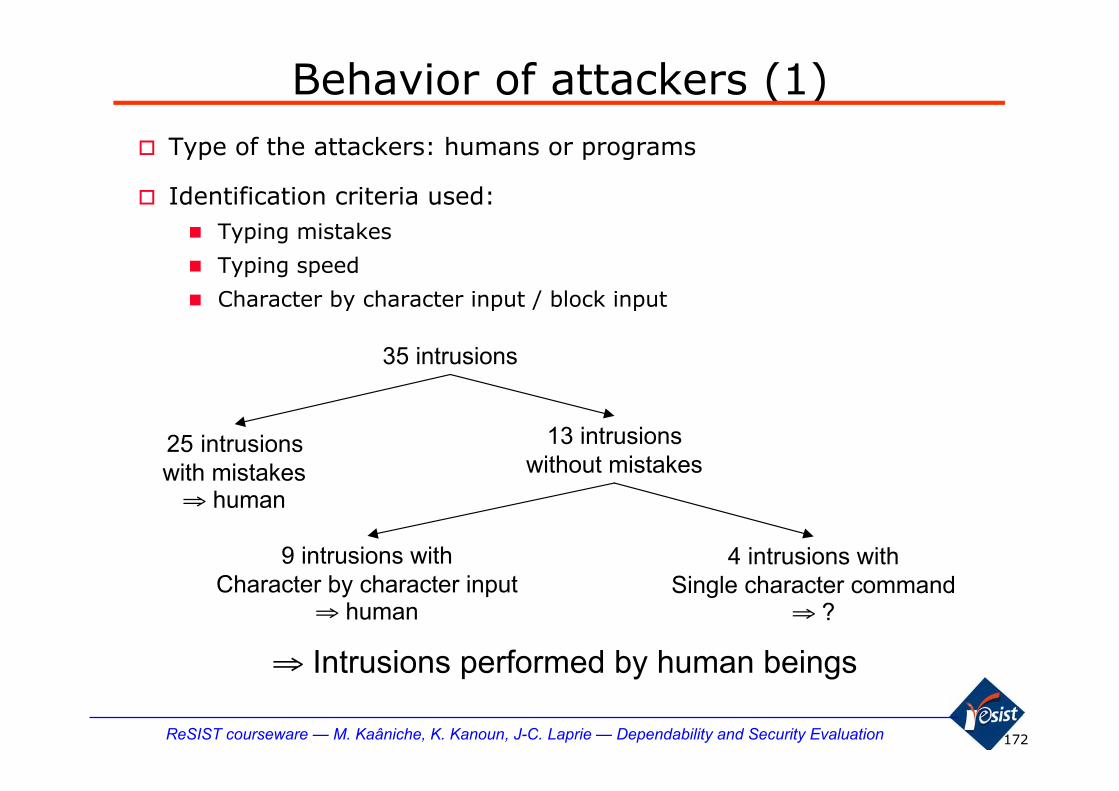
172ReSIST courseware — M. Kaâniche, K. Kanoun, J-C. Laprie — Dependability and Security Evaluation
Behavior of attackers (1)� Type of the attackers: humans or programs
� Identification criteria used:� Typing mistakes
� Typing speed
� Character by character input / block input
35 intrusions
25 intrusionswith mistakes
⇒ human
13 intrusionswithout mistakes
9 intrusions withCharacter by character input
⇒ human
4 intrusions withSingle character command
⇒ ?
⇒ Intrusions performed by human beings

173ReSIST courseware — M. Kaâniche, K. Kanoun, J-C. Laprie — Dependability and Security Evaluation
Behavior of attackers (2)1. They change the password of the hacked account
2. Try to hide their activities
3. Try to download malware, 70% of the attackers were unable todownload their malware
4. Four main activities:• Launching ssh scans on other networks
• Launching irc clients
• Trying to become root
• Phishing activity (1 attempt)
Well known attack method (cooking recipes)
⇒ Not experienced hackers

174ReSIST courseware — M. Kaâniche, K. Kanoun, J-C. Laprie — Dependability and Security Evaluation
Summary
knowledge baseof attacks?
IPs dedicated tointrusion attacks
High-interactionhoneypot
Internet
IPs dedicated todictionary attacks
1- Dictionary attackAutomated scripts
4- Intrusion attackHumans
2- Share information?3- Get information?
ssh + weakpasswords

175ReSIST courseware — M. Kaâniche, K. Kanoun, J-C. Laprie — Dependability and Security Evaluation
Dependability evaluation: challenges and gaps
Evaluation wrtmalicious faults
Evaluation wrtaccidental faults
Unified approaches for resilience evaluation andbenchmarking of large systems and critical
infrastructures, combining analytical, simulation andexperimental techniques
complexity evolution of threats
interdependencies
dynamicity
socio, technical and economic dimensions
runtime assessment

176ReSIST courseware — M. Kaâniche, K. Kanoun, J-C. Laprie — Dependability and Security Evaluation
References� General background
� K. Trivedi, Probability and Statistics with Reliability, Queuing, and Computer Science Applications », 2nd Edition, John Wiley and Sons, New York,(2001)
� R.W. Howard, Dynamic Probabilistic Systems, vol. I and vol. II John Wiley & Sons, 1971
� J.-C. Laprie, “Dependability Handbook“, CÉPADUES-ÉDITIONS, 1995 (in French)
� B. Haverkort, R. Marie, G. Rubino, K. Trivedi, Performability modeling: Techniques and tools”, John Wiley & Sons, ISBN 0-471-49195-0
� M. Ajmone Marsan, G. Balbo, G. Conte, S. Donatelli and G. Franceschinis, Modelling with Generalized Stochastic Petri Nets _Wiley Series inParallel Computing _John Wiley and Sons __ISBN: 0 471 93059 8 (http://www.di.unito.it/~greatspn/bookdownloadform.html)
� Dependability Modeling� J. Bechta-Dugan, S. J. Bavuso and M. A. Boyd, “Dynamic fault-tree models for fault-tolerant computer systems”, IEEE Transactions on Reliability,
41, pp.363-377, 1992
� C. Betous-Almeida and K. Kanoun, “Construction and Stepwise Refinement of Dependability Models”, Performance Evaluation, 56, pp.277-306,2004
� N. Fota, M. Kaâniche, K. Kanoun, “Dependability Evaluation of an Air Traffic Control Computing System,” 3rd IEEE International ComputerPerformance & Dependability Symposium (IPDS-98), (Durham, NC, USA), pp. 206-215, IEEE Computer Society Press, 1998. Published in..Performance Evaluation, Elsvier, 35(3-4), pp.253-73, 1999
� M. Kaâniche, K. Kanoun and M. Rabah, “Multi-level modelling approach for the availability assessment of e-business applications”, Software:Practice and Experience, 33 (14), pp.1323-1341, 2003
� K. Kanoun, M. Borrel, T. Morteveille and A. Peytavin, “Modeling the Dependability of CAUTRA, a Subset of the French Air Traffic ControlSystem”, IEEE Transactions on Computers, 48 (5), pp.528-535, 1999
� I. Mura and A. Bondavalli, “Markov Regenerative Stochastic Petri Nets to Model and Evaluate the Dependability of Phased Missions”, IEEETransactions on Computers, 50 (12), pp.1337-1351, 2001
� M. Rabah and K. Kanoun, “Performability evaluation of multipurpose multiprocessor systems: the "separation of concerns" approach”, IEEEtransactions on Computers, 52 (2), pp.223-236, 2003

177ReSIST courseware — M. Kaâniche, K. Kanoun, J-C. Laprie — Dependability and Security Evaluation
References� Dependability Modeling (cntd)
� W. H. Sanders and J. F. Meyer, “Stochastic activity networks: Formal definitions and concepts”, in Lectures on Formal Methodsand Performance Analysis. Lecture Notes in Computer Science 2090, pp.315-343, Springer-Verlag, 2001
� M. Kaaniche, K. Kanoun, M. Martinello, “User-Perceived Availability of a web-based Travel Agency”, in IEEE InternationalConference on Dependable Systems and Networks (DSN-2003), Performance and Dependability Symposium, (San Francisco,USA), 2003, pp. 709-718.
� A. E. Rugina, K. Kanoun, M. Kaâniche, "A System Dependabiliy Modeling Framework using AADL and GSPNs," inArchitecting Dependable Systems IV, vol. 4615, LNCS, R. de Lemos, C. Gacek, and A. Romanovsky, Eds.: Springer-Verlag,2007, pp. 14-38.
� Experimental measurements and Benchmarking� P. Koopman, J. DeVale, “The exception handling effectiveness of POSIX Operating Systems”, IEEE Trans. On Softwrae
Engineering, vol. 26, n°9, 2000
� J. Arlat et al., Fault Injection for Dependability Evaluation: A Methodology and some applications”, IEEE Transactions onSoftware Engineering, vol. 16, n°2, 1990
� J. Carreira, H. Madeira, , J. G. Silva, “Xception: A Technique for the Evaluation of Dependability in Modern Computers”, IEEETransactions on Software Engineering, vol.24, n°2, 1998
� Eric Marsden, Jean-Charles Fabre, Jean Arlat: Dependability of CORBA Systems: Service Characterization by Fault Injection,SRDS-2002, pp. 276-85, 2002
� R. Chillarege et al. , “Orthogonal Defect Classification — A Concept for In-process Measurements”, IEEE Transactions onSoftware Engineering, vol.18, n°11, 1992.
� R. Iyer, Z. Kalbarczyck, “Measurement-based Analysis of System Dependability using Fault Injection and Field Failure Data”,Performance 2002, LNCS 2459, pp.290-317, 2002
� D. P. Siewiorek et al. “Reflections on Industry Trends and Experimental Research in Dependability”, IEEE transactions onDependable and Secure Computing, vol.1, n°2, April-June 2004.
� K. Kanoun, L. Spainhower (Eds.), Dependability Benchmarking for Computer Systems, John Wiley & Sons, Inc., IEEE CSPress, 2008, ISBN 978-0470-23055-8

178ReSIST courseware — M. Kaâniche, K. Kanoun, J-C. Laprie — Dependability and Security Evaluation
References
� Security assessment� B. Littlewood, S. Brocklehurst, N. Fenton, P. Mellor, S. Page, D. Wright, J. Dobson, J. McDermid and D. Gollmann,
“Towards Operational Measures of Computer Security”, Journal of Computer Security, 2, pp.211-229, 1993
� M. Dacier, M. Kaâniche, Y. Deswarte, “A Framework for Security Assessment of Insecure Systems”, 1stYear Report of theESPRIT Basic Research Action 6362: Predictably Dependable Computing Systems (PDCS2), pp. 561-578 , September 1993,
� E. Jonsson and T. Olovsson, “A Quantitative Model of the Security Intrusion Process Based on Attacker Behavior”, IEEETransactions on Software Engineering, 23 (4), pp.235-245, April 1997
� M. Kaâniche, E. Alata, V. Nicomette, Y. Deswarte and M. Dacier, “Empirical Analysis and Statistical Modeling of AttackProcesses based on Honeypots”, in WEEDS 2006 - workshop on empirical evaluation of dependability and security (inconjunction with the international conference on dependable systems and networks, (DSN2006), pp.119-124, 2006.
� B. B. Madan, K. Goseva-Popstojanova, K. Vaidyanathan and K. Trivedi, “Modeling and Quantification of SecurityAttributes of Software Systems”, in IEEE International Conference on Dependable Systems and Networks (DSN 2002),(Washington, DC, USA), pp.505-514, IEEE computer Society, 2002
� D. M. Nicol, W. H. Sanders and K. S. Trivedi, “Model-based Evaluation: From Dependability to Security”, IEEETransactions on Dependable and Secure Computing,, 1 (1), pp.48-65, 2004.
� R. Ortalo, Y. Deswarte and M. Kaâniche, “Experimenting with Quantitative Evaluation Tools for Monitoring OperationalSecurity”, IEEE Transactions on Software Engineering, 25 (5), pp.633-650, 1999
� V. Gupta, V. V. Lam, H. V. Ramasamy, W. H. Sanders and S. Singh, “Dependability and Performance Evaluation ofIntrusion Tolerant-Server Architectures”, in First Latin-American Symposium on Dependable Computing (LADC 2003),(Sao-Paulo, Brazil), pp.81-101, IEEE Computer Society, 2003
� F. Pouget, M. Dacier, J. Zimmerman, A. Clark, G. Mohay, “Internet attack knowledge discovery via clusters and cliques ofattack traces”, Journal of Information Assurance and Security, Volume 1, Issue 1, March 2006 , pp 21-32
� E. Alata, V. Nicomette, M. Kaâniche, M. Dacier and M. Herrb, “Lessons Learned from the Deployment of a High-Interaction Honeypot”, in Sixth European Dependable Computing Conference (EDCC-6), (Coimbra, Portugal), pp.39-44,IEEE Computer Society, 2006