Embed Size (px)
Citation preview
1
MORAY
GREENER
The Gazetteer for Scotland, 1995-2007 Used with permission from The Gazetteer for Scotland at http://www.geo.ed.ac.uk/scotgaz/
STRATEGIC ASSESSMENT
2009/10
2
Contents
List of Tables ................................................................................................... 4
List of Maps...................................................................................................... 4
List of Figures .................................................................................................. 5
Acknowledgements......................................................................................... 7
1 Introduction ............................................................................................... 8
2 Methodology .............................................................................................. 9
3 Budget savings ....................................................................................... 10
4 A Profile of Moray ................................................................................... 11
4.1 Population ........................................................................................................... 11
4.2 Prosperity ............................................................................................................ 12 4.3 Health ................................................................................................................... 13 4.4 Education ............................................................................................................ 14
4.4.1 Young People ................................................................................................. 14 4.4.2 Adult Education .............................................................................................. 15
4.5 Housing ............................................................................................................... 15 4.6 Recorded crime in Moray ................................................................................... 16
5 Moray’s Environment ............................................................................. 17
5.1 Natural Environment .......................................................................................... 18
5.1.1 Landscape...................................................................................................... 18 5.1.2 Biodiversity ..................................................................................................... 20
5.1.3 Pollution ......................................................................................................... 25 5.1.4 Rural Development ........................................................................................ 41
5.2 Built Environment ............................................................................................... 47
5.2.1 Moray‘s Built Environment.............................................................................. 47
5.2.2 Design and Planning ...................................................................................... 48 5.2.3 Building Standards and Construction ............................................................. 50
5.2.4 Energy Efficiency of Buildings ........................................................................ 53 5.2.5 Industry .......................................................................................................... 57 5.2.6 Industry in Moray ............................................................................................ 59
5.3 Historic Built Environment................................................................................. 61
5.3.1 Moray‘s Historic Built Environment ................................................................. 62
6 People and the Environment ................................................................. 65
6.1 Public Opinion .................................................................................................... 65
6.1.1 Moray Citizen‘s Panel Survey 2007 ............................................................... 65 6.1.2 Scottish and UK surveys on environmental issues ......................................... 66
6.2 Ecotourism .......................................................................................................... 67
6.2.1 Economic Potential ........................................................................................ 68
6.2.2 Green Tourism ............................................................................................... 69 6.2.3 Scale of Tourism Enterprises ......................................................................... 70
6.2.4 Dolphins ......................................................................................................... 71 6.2.5 Moray Tourism Development ......................................................................... 71
6.3 Volunteering ........................................................................................................ 72
6.3.1 Organisation of Volunteering in Moray ........................................................... 72
6.3.2 Volunteer Centre Moray (VCM) survey of volunteering in Moray ................... 73 6.3.3 Volunteer numbers ......................................................................................... 74 6.3.4 Funding .......................................................................................................... 76
6.4 Education ............................................................................................................ 77
6.4.1 Media ............................................................................................................. 77
3
6.4.2 Eco-Schools ................................................................................................... 77
6.4.3 Moray Coast & Ranger Service ...................................................................... 78 6.4.4 Moray Council‘s Waste & Recycling Service .................................................. 79
6.4.5 Moray Community Planning Partnership ........................................................ 79 6.4.6 University of the Highlands and Islands (UHI) ................................................ 80
6.4.7 Other Organisations ....................................................................................... 81
7 Transportation ......................................................................................... 82
7.1 Roads and Rail .................................................................................................... 83
7.1.1 Road Network ................................................................................................ 83 7.1.2 Rail ................................................................................................................. 89
7.2 Sustainable Transport ........................................................................................ 89
7.2.1 Travel Planning .............................................................................................. 89
7.2.2 Workplace ...................................................................................................... 90 7.2.3 Schools .......................................................................................................... 91
7.2.4 Public ............................................................................................................. 93 7.2.5 Low Carbon Technology ................................................................................ 93
7.2.6 Travel Behaviour ............................................................................................ 94 7.3 Active Travel ....................................................................................................... 95
7.3.1 Urban Freedom Project .................................................................................. 95 7.3.2 Core Paths Plan ............................................................................................. 96
8 Waste ........................................................................................................ 98
8.1 Zero Waste Plan .................................................................................................. 98 8.2 Moray - Domestic and Commercial Waste........................................................ 99
8.2.1 Moray – Waste Performance .......................................................................... 99 8.2.2 Moray – Zero Waste ..................................................................................... 101
8.2.3 Construction Industry ................................................................................... 102 8.2.4 Local Community Groups and Campaigns ................................................... 103
9 Climate Change ..................................................................................... 104
9.1 International Agreements................................................................................. 105
9.1.1 United Nations Framework Convention on Climate Change ........................ 105
9.1.2 The Kyoto Protocol ....................................................................................... 105 9.1.3 European Union Policy ................................................................................. 105
9.2 Scottish Policy .................................................................................................. 106
9.2.1 Climate Change (Scotland) Act 2009 ........................................................... 106
9.2.2 Carbon Reduction Commitment Energy Efficiency Scheme ........................ 107 9.3 Climate Change in Moray ................................................................................. 109
9.3.1 Moray Climate Change Action Plan ............................................................. 109 9.3.2 Carbon Management ................................................................................... 111
9.3.3 Energy Efficiency ......................................................................................... 114 9.3.4 Renewable Energy ....................................................................................... 117
9.3.5 Flood Alleviation ........................................................................................... 125 9.3.6 Sustainable Procurement ............................................................................. 127
10 PESTELO Analysis ............................................................................ 129
11 Key Issues for consideration for future SOA inclusion ................ 148
11.1 Moray’s Environment .................................................................................... 148
11.1.1 Natural Environment ................................................................................. 148 11.2 People and the Environment ........................................................................ 148
11.2.1 Public Opinion ........................................................................................... 148
11.2.2 Ecotourism ................................................................................................ 148 11.3 Transportation ............................................................................................... 148
11.3.1 Sustainable Transport ............................................................................... 148
4
11.3.2 Active Travel ............................................................................................. 149 11.4 Waste .............................................................................................................. 149 11.5 Climate Change ............................................................................................. 149
11.5.1 Carbon Management and Energy Efficiency ............................................. 149 11.5.2 Renewable Energy .................................................................................... 149
11.5.3 Flood Alleviation........................................................................................ 150
12 Risk Analysis ...................................................................................... 151
13 References .......................................................................................... 152
14 Appendices ......................................................................................... 157
14.1 Appendix 1 - Scottish Government Strategic Approach ........................... 157
14.2 Appendix 2 – Protected Areas ...................................................................... 160
14.2.1 Sites .......................................................................................................... 160
14.2.2 Designation definitions .............................................................................. 161 14.3 Appendix 3 – Register of Protected Water areas ........................................ 164
14.4 Appendix 4 – Climate Change Policy / Legislation ..................................... 166
14.4.1 United Nations Framework Convention on Climate Change ..................... 166
14.4.2 The Kyoto Protocol ................................................................................... 166 14.4.3 European Union Policy ............................................................................. 167
14.5 Appendix 5 – 10 Energy Pledges ................................................................. 170 14.6 Appendix 6 - Targets ..................................................................................... 171
14.7 Appendix 7 – Social Events .......................................................................... 172
List of Tables
Table 1: Designated sites in Moray 19
Table 2: Summary of Scottish Biodiversity List 21 Table 3: Key Cairngorms LBAP Species 24
Table 4: Cairngorms LBAP Priority & other species 24 Table 5: Threats to soils and their potential impact on soil functions: a preliminary analysis 38 Table 6: Claims & Expenditure made through LFASS 45
Table 7: Number & Value of Applications for Land Managers' Options 46 Table 8: Building Standards activity 52
Table 9: Tourist expenditure in Scotland at 2005 prices (ignoring inflation) 69 Table 10: Waste Education promotion activity 79
Table 11: Topics of School visits 79 Table 12: Other Activities & Projects 79
Table 13: Condition of Moray's Roads 83 Table 14: HGV as percentage of traffic volume 86
Table 15: Means of travel to school 92 Table 16: Moray Waste Collection 100
Table 17: Changes in Greenhouse Gas concentrations 104 Table 18: Annual Emissions Targets for 2010 to 2022 (ktCO2e) 106
Table 19: Projected changes in North and East Scotland in the 2050s (under medium emissions scenario) (UKCP09) 109
Table 20: Community Planning Partners Climate Change Actions 110
List of Maps
Map 1: Areas of Great Landscape Value ........................................................................... 19
5
Map 2: Countryside Around Towns .................................................................................... 19
Map 3: Coastal Protection Zone ........................................................................................ 20 Map 4: North East Scotland Sub-Basin Area ..................................................................... 31
Map 5: North Highland Sub-Basin Area ............................................................................. 31 Map 6: Soil Types in Moray ............................................................................................... 37
Map 7: Land Cover across Moray ...................................................................................... 37 Map 8: NVZ ........................................................................................................................ 37
Map 9: Urban Rural Classification 2009/10 ........................................................................ 43 Map 10: WIAT Challenge Fund areas ................................................................................ 44
Map 11: Moray LEADER area ........................................................................................... 44 Map 12: Less Favoured Areas in NE Scotland .................................................................. 45
Map 13: Moray Local Development Plan area ................................................................... 49 Map 14: Dufftown Core Paths ............................................................................................ 68
Map 15: Moray's Transport Network .................................................................................. 82 Map 16: Scottish Climate Regions (UKCP09) .................................................................. 109
Map 17: Moray Offshore Renewables Wind Farm proposed site (Moray Offshore Renewables Information Leaflet) ..................................................................................... 123
Map 18: Beatrice Offshore Wind Farm (SSE information leaflet) ..................................... 124
List of Figures
Figure 1: Cairngorms LBAP area ....................................................................................... 22 Figure 2: Water Bodies assessed as good or better .......................................................... 33
Figure 3: Phased Improvements to Water Bodies ............................................................. 33 Figure 4: Water Bodies under specified pressures ............................................................ 34
Figure 5: Protected Area Water Bodies status ................................................................... 35 Figure 6: Scottish Parliament Building ............................................................................... 48
Figure 7: NHER Scores ..................................................................................................... 55 Figure 8: NHER by Tenure ................................................................................................ 56
Figure 9: Change in Mean NHER Scores .......................................................................... 56 Figure 10: Industrial & Commercial Energy Consumption by Fuel ..................................... 56
Figure 11: Energy Consumption per Employee ................................................................. 57 Figure 12: Wind Farms in Moray, September 2009 ........................................................... 59
Figure 13: Moray's Infrastructure ....................................................................................... 60 Figure 14: Edinburgh Castle .............................................................................................. 61
Figure 15: Pluscarden Abbey, Elgin ................................................................................... 62 Figure 16: Pluscarden Area of Special Control .................................................................. 62 Figure 17: Lossiemouth Harbour ....................................................................................... 62
Figure 18: Concern about Environmental Issues ............................................................... 65 Figure 19: Importance of key Environmental Issues .......................................................... 65
Figure 20: Net seriousness of Environmental Issues ......................................................... 66 Figure 21: Culbin Sands .................................................................................................... 67
Figure 22: Red Squirrel ...................................................................................................... 67 Figure 23: Light pollution in the UK (www.cpre.org.uk) ...................................................... 68
Figure 24: Tourist visits to Scotland ................................................................................... 69 Figure 25: Bottlenose Dolphins .......................................................................................... 71
Figure 26: Benefits of Volunteering .................................................................................... 73 Figure 27: Time spent Volunteering ................................................................................... 73
Figure 28: Moray Waste Busters van ................................................................................. 74 Figure 29: ReBOOT ........................................................................................................... 75
Figure 30: BCTV Volunteers .............................................................................................. 75 Figure 31: Voluntary Sector Funding ................................................................................. 77
6
Figure 32: Pupils at Inveravon Primary School .................................................................. 78
Figure 33: View of the River Spey from Ordiquish ............................................................. 78 Figure 34: Percentage increase in Road Traffic volume from 2000 levels (Scottish Transport Statistics 2009) .................................................................................................. 84 Figure 35: Percentage increase in Trunk Road Traffic Volume from 2000 (Scottish Transport Statistics 2009) .................................................................................................. 84 Figure 36: Percentage increase in Local Authority Road Traffic Volume from 2000 (Scottish Transport Statistics 2009) ................................................................................... 85 Figure 37: Means of travel to work/education .................................................................... 85
Figure 38: Travel to work/education by bus ....................................................................... 88 Figure 39: Hands-up Survey - Means of travel to school ................................................... 92
Figure 40: Cost of Refuse Collection ............................................................................... 100 Figure 41: Cost of Refuse Disposal ................................................................................. 101
Figure 42: Managed Waste Types ................................................................................... 102 Figure 43: Flooding in Elgin September 2009 (heraldscotland) ....................................... 104
Figure 44: Frozen Britain (BBC news) ............................................................................. 104 Figure 45: Potential CO2 Storage sites around Scotland ................................................. 108
Figure 46: CO2 Emission Estimates ................................................................................. 111 Figure 47: % Change in Energy Use 2005-2008 ............................................................. 115
Figure 48: % change in Total Energy ............................................................................... 115 Figure 49: Per Capita Domestic Energy Consumption..................................................... 116
Figure 50: Energy Consumption by Type......................................................................... 116 Figure 51: Energy Consumption by Fuel Type & Sector .................................................. 116
Figure 52: Sector Energy Consumption by type .............................................................. 117 Figure 53: Renewable Energy Source ............................................................................. 118
Figure 54: Fochabers bridge collapse, Floods 2009 www.geograph.org.uk/photo/1474087 ......................................................................................................................................... 125
7
Acknowledgements
The Greener Strategic Assessment has only been possible as a result of the time and effort of everyone that contributed. I would like to thank the input and advice given by the strategic partners and lead officers within the Greener subject area, which was essential in determining content, identifying PESTELO issues and demographic and social trends. I would also like to thank the officers and colleagues who have provided invaluable feedback on various sections of this strategic assessment, helping to ensure the accuracy and comprehensiveness of the content. Thank you too to the whole Research and Information Officer team for the help and support they gave me in numerous ways throughout the process. Anna Jermyn Research and Information Officer The Moray Council January 2011
8
1 Introduction
The 2007 concordat between the Scottish Government and local government changed the relationship between central and local government in Scotland by removing much of the control the Scottish Government had over service delivery at local level. Much of the ring-fencing around funding provided to local authorities has been removed enabling decisions on spending to be made at a local level based on local need and circumstances. The direction of policy and the over-arching outcomes expected of the public sector have been set by the Scottish Government based around a common Purpose ―To focus Government and public services on creating a more successful country, with opportunities for all of Scotland to flourish, through increasing sustainable economic growth.” The Purpose is underpinned by 5 Strategic Objectives: Safer & Stronger, Smarter, Wealthier & Fairer, Healthier and Greener. Progress towards the Purpose is tracked by 7 high level Purpose Targets and it is supported by 15 National Outcomes (see Appendix 1). Progress towards achievement of the National Outcomes and ultimately the Purpose is tracked by 45 national performance indicators. Central to the new regime are the Single Outcome Agreements (SOAs) reached between each of the 32 Community Planning Partnerships and the Scottish Government. In SOAs Community Planning Partnerships define and agree with the Scottish Government, Local Outcomes that contribute towards achievement of the National Outcomes and therefore the Purpose. The aim of this strategic assessment is to provide an evidence base that assists with strategic decision-making and identification of local priorities under the Greener theme, informing the setting of local outcomes for inclusion in the Single Outcome Agreement 2012-15. The Scottish Government's ‗Greener‘ strategic objective is to improve Scotland's natural and built environment and the sustainable use and enjoyment of it. Moray‘s contribution to the achievement of this objective is being progressed by the Greener Strategic Group in their responsibility for the following national outcomes:
12 – We value and enjoy our built and natural environment and protect it and enhance it for future generations
14 – We reduce the global environmental impact of our consumption and production.
In addition, although overall accountability sits with the Safer and Stronger Strategic Group, there are aspects of national outcome 7 – We have tackled the significant inequalities in Scottish Society that the Greener Strategic Group must consider. The information and analysis contained within this strategic assessment will be based on the two national outcomes for which the theme group has full responsibility and also those aspects of national outcome 7 (We have tackled the significant inequalities in Scottish Society) for which the theme group is responsible. The range of issues that could reasonably be included under these national outcomes is too extensive for individual inclusion in this document. Therefore priorities identified by partner organisations, legislative requirements, local factors such as the rural nature of Moray, and areas identified in previous strategic assessments have provided the focus for this assessment.
9
2 Methodology
A consultation exercise was carried out with the Greener strategic partners and lead officers in order to determine the topics to be included and ensure that the content took account of the issues mentioned above. Wherever possible, data and contextual information has been obtained from partners in order to ensure that the analysis is detailed and credible and accurately describes the local situation. However, in some cases it was necessary to expand this with publicly available material in order to build a more complete picture and ensure a more rounded and balanced portrayal. Additionally, as mentioned previously, the Scottish Government‘s National Outcomes provided the principal framework within which to develop the assessment. Input from the strategic partners and lead officers was also provided in relation to the identification of PESTELO issues (Political, Economic, Social, Technological, Environmental, Legal and Organisational). These are included in a table in section 5 and for ease of reference the specific issues relevant to each topic are cross-referenced at the beginning of each section. The PESTELO issues relevant to all areas are highlighted in pink in the table in section 5. Some of the recommendations put forward for consideration were identified by the author. However, it is anticipated that further inferences and recommendations will be pulled out from this research by strategic partners and other local experts who work in the Greener arena. The risk analysis was undertaken in consultation with strategic partners to ensure a balanced and comprehensive identification of risk factors.
10
3 Budget savings
The budget savings faced by the public sector over the next few years are unprecedented and will play a major role in the determination of priorities and present a significant challenge in relation to service delivery. Over the short, medium and longer terms the UK Government will need to significantly reduce public spending, increase taxes or a combination of both in order to reduce the national debt. This will have a significant impact on the amount of money available throughout the UK‘s public sector. The overall Scottish budget will be significantly lower in real terms by 2013/14 than it is currently (the UK Government's Comprehensive Spending Review (CSR) will see Scotland's overall budget fall by £1.3 billion in cash terms in 2011-12 compared to 2010-11 - including a fall of £800 million in the capital budget1), which will clearly impact on the Scottish public sector. The recommendation for Scottish local authorities is to assume a 12% reduction over the period 2011/12 to 2013/14, although it is likely that reductions will continue after this point and a figure of 20% in real terms by 2017 has been indicated. The Moray Council‘s budget allocation for 2011/12 is 3.7% lower than 2010/11 with the effect that the Council will be seeking to reduce its budget for 2011/12 by £9m with further reductions of £2.37 in 2012/13 and £3.65 in 2013/14. This would bring the total savings over the 3 year period to over £13.5m, which at around 5.5% is slightly lower than £18m level anticipated earlier this year. The next few years are likely to be very challenging making it even more imperative that funding decisions are based on sound evidence to ensure that essential services are provided and that those most in need receive the services they require.
1 http://www.scotland.gov.uk/News/Releases/2010/10/20083324
11
4 A Profile of Moray
Moray is the 8th largest Council area in Scotland, covering an area of 2,238 square kilometres [1], from the Cairngorm Mountains in the south to the coast of the Moray Firth in the north. However, in terms of its population, it ranks 26th out of 32 with a population of just 87,660 [1]. Over 27% of Moray is covered by woodland [2]. The average population density is low at just 39 people per square kilometre, compared with 67 people per square kilometre nationally [1]. However, approximately 57% of the population live in the 5 main towns of Elgin, Forres, Buckie, Lossiemouth and Keith [3], where the population density is approximately 2,500 people per square kilometre [4]. Overall, Moray is one of the least deprived areas in Scotland, as defined by the Scottish Index of Multiple Deprivation (SIMD), having just one data zone, in Elgin, in the 15% most deprived, representing 0.9% of Moray‘s datazones, the lowest proportion in Scotland with the exception of the islands. Only 3 of Moray‘s data zones are in the 20% most deprived, two of which are in Elgin, the other is in Buckie. This represents 2.6% of Moray‘s data zones, the 2nd lowest in Scotland with the exception of the three island groups and Aberdeenshire. However, the rural nature of Moray means that 27.6% of its data zones are within the 15% most access deprived in Scotland, due to the financial cost, time and inconvenience of travelling to basic services [5].
4.1 Population
(All figures in this sub section are sourced from the General Register Office for Scotland Mid-2009 population estimates)
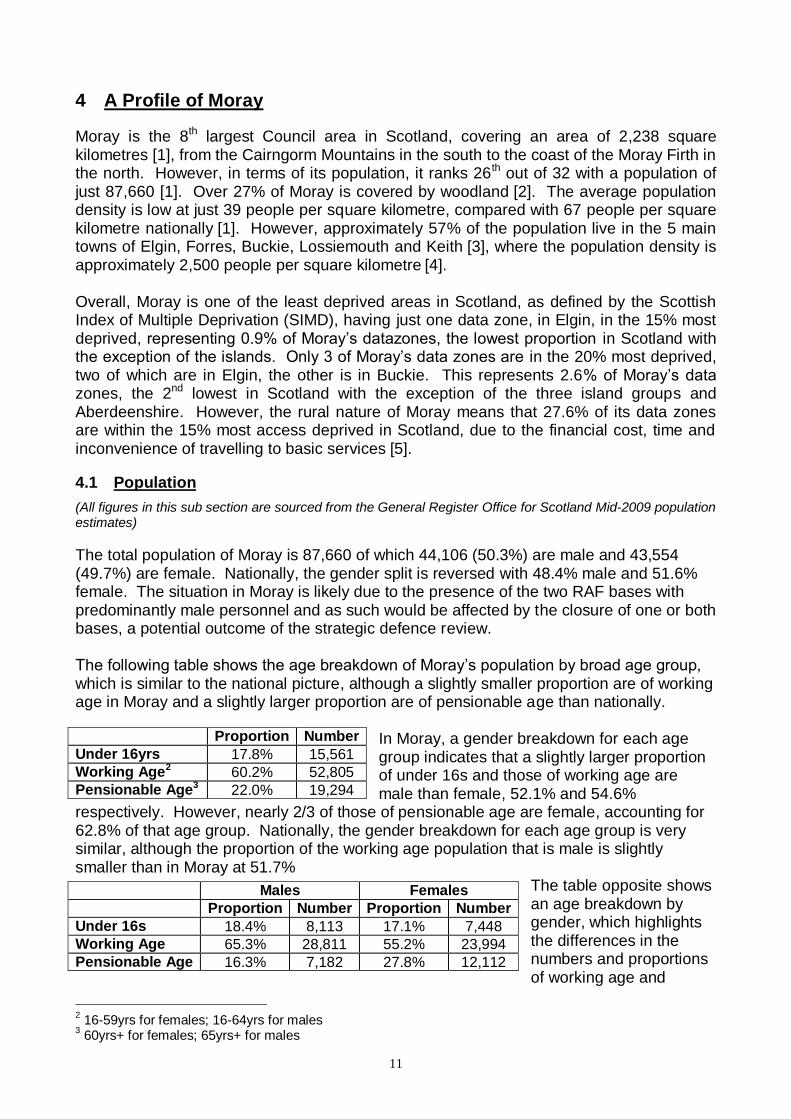
The total population of Moray is 87,660 of which 44,106 (50.3%) are male and 43,554 (49.7%) are female. Nationally, the gender split is reversed with 48.4% male and 51.6% female. The situation in Moray is likely due to the presence of the two RAF bases with predominantly male personnel and as such would be affected by the closure of one or both bases, a potential outcome of the strategic defence review. The following table shows the age breakdown of Moray‘s population by broad age group, which is similar to the national picture, although a slightly smaller proportion are of working age in Moray and a slightly larger proportion are of pensionable age than nationally.
In Moray, a gender breakdown for each age group indicates that a slightly larger proportion of under 16s and those of working age are male than female, 52.1% and 54.6%
respectively. However, nearly 2/3 of those of pensionable age are female, accounting for 62.8% of that age group. Nationally, the gender breakdown for each age group is very similar, although the proportion of the working age population that is male is slightly smaller than in Moray at 51.7%
The table opposite shows an age breakdown by gender, which highlights the differences in the numbers and proportions of working age and
2 16-59yrs for females; 16-64yrs for males
3 60yrs+ for females; 65yrs+ for males
Males Females
Proportion Number Proportion Number
Under 16s 18.4% 8,113 17.1% 7,448
Working Age 65.3% 28,811 55.2% 23,994
Pensionable Age 16.3% 7,182 27.8% 12,112
Proportion Number
Under 16yrs 17.8% 15,561
Working Age2 60.2% 52,805
Pensionable Age3 22.0% 19,294
12
pensionable age populations in Moray. The position closely resembles the national picture.
4.2 Prosperity
Although categorised as one of the least deprived local authority areas in Scotland, the median gross weekly wage of all full-time workers in Moray is the lowest in Scotland, at £407.50 compared with £472.20 nationally [6]. The SIMD 2009 states that 12.5% of Moray is income deprived, which accounts for 11,015 residents. However, the level of income deprivation in Moray varies greatly across the area, from 1% in East Kinloss to 32% in Buckie Millbank [5]. Around 82% of the working-age population (around 53% of the total population) is economically active, higher than the national figure of 77% (about 51% of total population). In Moray, 95% of the economically active population is in employment, around 13% of whom are self-employed, compared with 92% & 10% respectively for Scotland as a whole. Almost ¾ of employee jobs are in the service industry, a further 16% are in manufacturing and 6% are in construction. About 9% of employee jobs are tourism-related but this includes jobs that are also part of the service industry. Equivalent figures for Scotland show the main differences to be in the proportions of employees in manufacturing and the service industry (Finance, IT other business activities subgroup), which are approximately 8% lower and 11% higher respectively [6]. Of the working-age population that is economically inactive, approximately 62% report not wanting a job and about 81% of these are female. Nationally, around 75% of the economically inactive report not wanting a job, 64% of whom are female. Between April 2009 and March 2010, 4.8% (2,200) of the economically active population in Moray were unemployed, compared with 7.3% nationally. However, there were a further 3,900 people within the economically inactive (7.1% of the working age population) in Moray who wanted a job. They are not classed as unemployed because they have either not sought work in the last four weeks or are not available to start work. The equivalent figure for Scotland is 5.9% [6]. In February 2010, 12.5% of the working age population in Moray were key benefits claimants (claiming one or more key DWP benefits4), a 0.1% increase since February 2009 compared with 17.1% in Scotland (16.7% in February 2009). Claimants are categorised according to the main benefit they receive and the most common main benefit in Moray was Employment and Support Allowance / Incapacity Benefit, the main benefit claimed by 3,320 (48%) of key benefits claimants. A further 1,620, 23% of key benefits claimants‘ main benefit was job seekers allowance (JSA). The number of claimants of job seekers allowance has increased by 9% since February 2009 (54% since February 2008) due to the ongoing recession and resulting business closures and cutbacks. The split nationally was very similar to Moray [6]. In total there were 1,206 JSA claimants in September 2010, 69% of whom were male. Approximately ½ of all claimants were aged 25-49yrs and a further 30% were aged 18-24yrs, the same as in September 2009 although the total number of claimants has risen by about 4% in this time, from 1,157. The majority of claimants, 69%, had been claiming for 6
4 Key DWP (Department of Work & Pensions) benefits include: bereavement benefit, carer‘s allowance,
disability living allowance, incapacity benefit, severe disablement allowance, income support, jobseeker‘s allowance, and widow‘s benefit.
13
months or less, a further 19% between 6 and 12 months, and the remainder over 12 months [6]. The SIMD 2009 identifies 3 data zones in Moray that are in the 15% most employment deprived, compared with none in 2006. Two of the datazones are in Elgin and one is in Forres [5].
4.3 Health
General health in Moray is reported as being slightly better than nationally with nearly 93% of Moray‘s population reporting good or fairly good health and just 7% reporting not good health. This compares with 90% and 10% respectively for Scotland [7]. The percentage of the population that has a limiting long-term illness is approximately 3% lower in Moray than nationally, at 17% of the population compared with 20% [7]. The relationship between health and tenure indicates that a smaller proportion of occupants of social rented accommodation report good or fairly good health than occupants of owned or privately rented/rent free accommodation, at 88% compared with 94%. This is reflected in the incidence of limiting long-term illness, which is 10% higher for occupants of social rented accommodation, at 24%, than for occupants of owned or privately rented/rent free accommodation. The spread across age groups is comparable, with 65-84yr olds representing the largest proportion having a long-term illness for each tenure type. The national picture is similar with 82% of those in social rented accommodation reporting good or fairly good health, 93% of those in owned and 89% of those in private rented/rent free. The proportion of those living in social rented accommodation with a limiting long-term illness is twice that of those living in owned accommodation, at 31% compared with 15%. As with Moray, spread across age groups is comparable, with 65-84yr olds again representing the largest proportion of each tenure type having a limiting long-term illness [7]. In 2009 the standardised death rate in Moray was slightly lower than nationally at 9.4 per 1,000 population compared with 10.3 per 1,000 population. The main cause of death in Moray in 2009 in both females and males was diseases of the circulatory system, accounting for 32% of female and 34% of male deaths. This was closely followed by cancers, which accounted for a further 24% of all female deaths and a further 31% of male deaths. The picture is very similar nationally [8]. The SIMD identifies just 1 data zone, 0.9% of the total in Moray that is within the 15% most health deprived; this is in Elgin [5]. 2008-based population projections for Moray suggest that by 2013 the under 16 population will reduce by 7%, the working age population will increase by 2% and the population of pensionable age will increase by 7% [9]. This would mean 2013 population numbers of 14,600 under 16s, 54,300 of working age and 20,200 of pensionable age. These changes will mean that the proportion of the population that is of pensionable age will increase to about 22.7%. National figures suggest a much smaller reduction in under 16s of 1% and a slightly smaller rise in the number of pensionable age, of 4%. The proportion of the population of pensionable age nationally is projected to be about 20%, up marginally from 19.7%. Both in Moray and nationally, about 55% of the pensionable age group is female [9]. The growth in the pensionable aged population will place a greater demand on age-related health and social care services such as home care.
14
4.4 Education
4.4.1 Young People
There is a total of 54 schools in Moray – 46 primary and 8 secondary. Average occupancy for the 2008/09 session5 was 71% in primary schools and 89% in secondary schools. Provisional figures for 2009/10 based on the 2008/09 functional capacity and the September 2009 school roll, suggest an average occupancy of 68% in primary schools and 90% in secondary schools. The projected 7% reduction in the population aged under 16yrs by 2013 is likely to reduce the overall occupancy level of Moray‘s schools. In Moray in 20096 there were 6,530 primary school pupils and 5,801 secondary school pupils, an overall drop of around 10% since 2003 (comprising a 16% drop in primary pupils & a 2.5% drop in secondary pupils). Nationally, there has been a much smaller drop, of 8%, in the number of primary school pupils and a slightly larger reduction, of 4% in the number of secondary school pupils. In Moray between 2003 and 2009 the number of pupils over 16yrs has increased by 67%. The number of pupils from ethnic minority groups has increased from 171 in 2004 to 241 in 2009, a rise of 41%. Nationally the rise in pupils aged 16yrs+ is slightly lower than Moray at 62% and the 35% increase in the number of ethnic minority pupils is slightly smaller than in Moray [10]. There are 4 data zones in Moray, 3.4% of the total, that are within the 15% most education deprived in Scotland, two of which are in Elgin, the other two being in Buckie [5]. In primary schools, absence figures for 2004/05 to 2008/09 are very consistent, accounting for around 4.5% of half days, 17% of which was unauthorised in 2008/09. These figures are slightly lower than nationally [11]. In secondary schools the overall absence rate rose between 2004/05 and 2006/07 from 7.5% to 9.1%, but has since fallen to 7.4% in 2008/09. Of this, the proportion of unauthorised absence has increased from 24% to 35%. Nationally the overall absence rate has fallen steadily over this period from 9.6% in 2004/05 to 8.8% in 2008/09. The proportion of unauthorised absence nationally has remained fairly constant at around 21%, considerably lower than in Moray [11]. Further breakdown of absence figures is not possible as the Scottish Government national Statistics have amalgamated absence figures due to ongoing concerns over the quality and consistency in the recording of the reasons for absence. Between 2003/04 and 2008/09, the rate of exclusions in Moray‘s primary schools has remained fairly constant at about 12 per 1000 pupils. Since 2005/06 Moray‘s rate has been lower than the national rate, which rose between 2003/04 and 2006/07 from 11 to 16 since when it has fallen to 13 per 1,000 in 2008/09. In Moray‘s secondary schools, the rate increased from 59 per 1000 pupils in 2003/04 to 76 per 1000 pupils in 2007/08. However, in 2008/09, the rate had fallen to 49 per 1,000 pupils. Scotland‘s rate rose from 105 per 1000 pupils in 2003/04 to 120 per 1000 in 2006/07, falling back to 91 per 1000 in 2008/09. The vast majority of exclusions in both Moray and nationally are temporary. In Moray between 2003/04 and 2008/09 about 6 pupils were removed from the register each year – approximately 1% of total exclusions – with the exception of 2006/07 when 2 pupils were removed, and 2008/09 when there were 3 pupils removed. The level nationally was around 0.5% every year from 2003/04 to 2007/08 but fell to 0.25% of all exclusions in
5 Based on September 2008 school roll and functional capacity.
6 School roll figures from Moray Council website:
http://www.moray.gov.uk/moray_standard/page_58530.html
15
2008/09 [12]. Pupils removed from the register are then either educated at another school or some other provision is made for their education. Of 1,036 school leavers in Moray in 2008/09, 88.1% went on to positive destinations7, 10% were unemployed but seeking employment and the remainder were either unemployed and not seeking employment or their destination was unknown. The numbers going on to higher and further education have both risen by about 5.5% and 2% respectively since 2006/07, while the number going into employment has fallen by about 5%. The numbers in all other categories have either remained fairly consistent or fallen slightly over the same period. Nationally, a slightly smaller proportion, 85%, has gone on to a positive destination and the split within the positive destinations category was slightly different, with a higher proportion going into higher education and training, and less into employment. The proportion going into further education was about the same [13].
4.4.2 Adult Education
During 2007/08 there were about 7,000 enrolments at Moray College in Elgin, 56% of who were aged over 20. However, the proportion of students over 20 has reduced from 74% in 2005/06. This is due at least in part to the recruitment of school pupils into vocational programmes, which has led to an increase in the proportion of students aged under 14 from 2% to 22% over the same period. The mean age of students has fallen from 34 to 29. Results from the Scottish Survey of Adult Literacies (SSAL) published in 2009 indicate that more than 1/3 of Scotland‘s population may experience some challenges with some type of literacy. Applying this to Moray suggests that as many as 25,000 Moray residents may experience some challenges with some type of literacy. Over the last 3 years, the Essential Skills service in Moray has supported around 200 learners each year with an increase of 15% between 2007/08 and 2009/10. Approximately ⅔ of learners are new each year, the remainder continuing from the previous year.
4.5 Housing
The total number of dwellings in Moray in 2009 was 42,052, a rise of nearly 7% since 2003, slightly higher than the rise nationally of 5.5% [10]. In Moray, and nationally, approximately 64% of the population live in owner-occupied accommodation. However, Moray has a smaller proportion of people living in social rented accommodation, at 20% compared with 24%, but a higher percentage renting privately, 11% compared with 6%. A smaller proportion of Moray‘s population lives in lone parent families – 8% compared with 13% nationally, and a slightly smaller proportion of people living alone, at 12% compared with 14%. However, the same proportion of people aged 65yrs and over lives on their own, in both Moray and Scotland as a whole, at 5.7% [7]. Between 2001 and 2009, the mean house sale price rose by 140% in Moray, from £62,870 to £150,859. The equivalent national figure is 103% although the mean price is higher than in Moray at £159,075. Over the same period, the number of house sales in Moray fell by 25%, from 1,502 to 1,132. The number of house sales also fell nationally, by 45%. The median house sale price in Moray more than doubled, from £52,875 in 2001 to £132,750 in 2009 and a similar, though slightly smaller, increase was seen nationally although the
7 Positive: includes higher education, further education, training, voluntary work and employment. This is in
line with the definition of positive destinations set out in Indicator 10 of the Scottish Budget Spending Review 2007: http://www.scotland.gov.uk/Publications/2007/11/30090722/18
16
median price is slightly higher than in Moray at £134,000. The median price being lower than the mean price is reflective of the large proportion of band A-C dwellings in Moray, approximately 68%, slightly higher than Scotland as a whole at 62%. Correspondingly, the proportion of dwellings in bands F-H is small in Moray, at approximately 6%, half that of Scotland. Between 2003 and 2009 in both Moray and Scotland, the proportion of dwellings in bands A-C fell slightly, while the proportion of dwellings in bands F-H rose slightly [10]. The rise in house prices in conjunction with the low wages characteristic of Moray has impacted on the ability of newly forming households to buy a property, which has likely had a knock on effect on the demand for private rental properties and social housing. There are no data zones in Moray that are within the 15% most housing deprived in Scotland. However, 4 of Moray‘s data zones (3.4% of the total) are within the 20% most housing deprived in Scotland, 2 in Elgin, 1 in Forres and 1 in Lossiemouth [5].
4.6 Recorded crime in Moray
In Moray in 2009/10 the total number of crimes recorded reduced by 15% from 2008/09 compared with a 10% decrease nationally. The rate of crimes in Moray in 2009/10 was lower than nationally, at 468 per 10,000 population compared with 651 per 10,000 population. The total number of crimes recorded annually since 1997 shows a level trend in Moray, compared with a reducing trend for Scotland as a whole [14]. The percentage of crimes cleared up in Moray fell by 3% to 46% in 2009/10, compared with no change for Scotland as a whole. However, the trend in Moray since 1997 is marginally increasing although to a lesser extent than the increasing national trend [14]. Within Moray there are 13 data zones in the 15% most crime deprived, representing 11.2% of data zones in Moray [5]. Of the 13, eight are in Elgin, 2 are in Forres and 3 are in Buckie. Overall for 2008/09, Moray was ranked 22nd out of the 32 local authority areas in Scotland for total recorded crimes per 10,000 population (where 1 has the highest rate and 32 the lowest). Moray‘s highest ranking of 8th was for the crime category crimes of indecency, while their lowest ranking was for other crimes for which they ranked 26th out of 32. In all crime categories except crimes of indecency Moray‘s ranking was considerably better than Scotland‘s.
17
5 Moray’s Environment
Moray stretches from the Cairngorm Mountains in the south to the coast of the Moray Firth in the north, covering an area of approximately 2238km. It is bordered on the west by Highland and on the east by Aberdeenshire, with the cities of Inverness and Aberdeen 39 miles to the east and 65 miles to the west respectively. It is one of the three local authorities, the others being Aberdeenshire and Aberdeen City, that together form Grampian region, which was the local government administrative area prior to the restructuring that took place in 1996. Although Council business is now carried out at a unitary authority level, there are numerous organisations that still operate at least partially at a Grampian level. The landscape of Moray is predominantly open countryside and woodland with only a small proportion covered by urban and rural development. This is reflected in the population density of 39 people per square kilometre, compared with a national average of 67. This low level classifies Moray as a rural unitary authority according to the Randall definition8. The Scottish Government‘s more recent 6-fold Urban Rural Classification system categorises every datazone in Scotland according to the size of its population and its accessibility, as follows:
1. Large Urban Areas – settlements of over 125,000 people. 2. Other Urban Areas – settlements of 10,000 to 125,000 people. 3. Accessible Small Towns – settlements of between 3,000 and 10,000 people and within 20 minutes
drive of a settlement of 10,000 or more. 4. Remote Small Towns – settlements of between 3,000 and 10,000 people and with a drive time of
over 30 minutes to a settlement of 10,000 or more. 5. Accessible Rural Areas – of less than 3,000 people and within 30 minutes drive time of a settlement
of 10,000 or more. 6. Remote Rural Areas – of less than 3,000 people and with a drive time of over 30 minutes to a
settlement of 10,000 or more.
Moray is made up of 116 datazones, which according to this classification system are categorised as follows:
27 in category 2
24 in category 3
15 in category 4
30 in category 5
20 in category 6
Given that there are just 5 towns in Moray with a population of 3,000 or more (categories 2, 3 & 4) – Elgin, Forres, Buckie, Lossiemouth and Keith – the vast majority of Moray is categorised as accessible rural or remote rural. The importance of some parts of Moray‘s natural environment is recognised at a European level, including the Cairngorms National Park (part of which is in Moray), the River Spey and the Moray Firth. There are also many other locations across Moray that are valued for their scenery, habitats or ecological importance and that have been given a protective designation at international, national or local level.
8 Randall definition (Scottish Government) – Where a unitary authority has a population density of less than
one person per hectare it is considered Rural.
18
In addition, a recent survey by National Geographic Traveller magazine judged the Moray Firth coastline as one of the world‘s most scenic, rated a mark above the Cook Island‘s sun-kissed sands and on a par with Italy‘s Cinque Terre.9
“A popular vacation spot for more than a century, this coast offers "outstanding cliff scenery" and maintains "a strong community feeling." Seasonal and year-round residents appear to live in relative harmony. Tourism keeps "pretty coastal villages" economically afloat as Scotland's fishing industry declines”.
5.1 Natural Environment
Political 2. Climate Change Adaptation Framework 4. UK Shared Framework for Sustainable Development 5. Choosing our future: Scotland's Sustainable Development Strategy 6a. Scotland's Biodiversity: It's in Your Hands Scotland's biodiversity strategy. 6b. North East Scotland Biodiversity Action Plans 14a. Scottish Forestry Strategy 2006 14b. Scottish Forestry Strategy Implementation Plan 2010-13
Environmental 9. European Landscape Convention (a.k.a. the Florence Convention)
Legal 1. Environmental Protection Act 1990 2. Environment Act 1995 5. Environmental Assessment (Scotland) Act 2005 10. The Environmental Impact Assessment (Scotland) Regulations 1999 14. Water Framework Directive (WFD) 15. Marine (Scotland) Act 2010 17. The Bathing Waters (Scotland) Regulations 2008
Moray‘s natural environment is predominantly open countryside, accounting for about 71% of the total area with a further 26% covered by woodland. The area contains a diverse range of environments including coastline, farmland, woodland, moorland, mountains and river valleys, which form a rich variety of landscapes and natural habitats throughout Moray. Moray includes part of the Cairngorms National Park and the Moray Firth‘s rich marine ecosystem. There is an impressive diversity of often iconic species, such as capercaillie and wildcat, and habitats such as threatened peat bog. Although the lowlands are dominated by intensive farming and forestry, they are also the location of much nature-based recreation, renowned geological sites and the largely undeveloped coast. Further inland there is a mix of moorland, river valleys, farming, forestry and tourism. This variety makes Moray‘s natural environment vital to the economy of the area [15]. Sporting estates carry challenges such as managing for red deer and birds of prey, and the benefits of diversified native woodland and plantation management are increasing. Moray provides locals and visitors exceptional opportunities to enjoy the natural heritage. However, there is great potential for increasing countryside access and education, especially in the less-frequented uplands [15].
5.1.1 Landscape
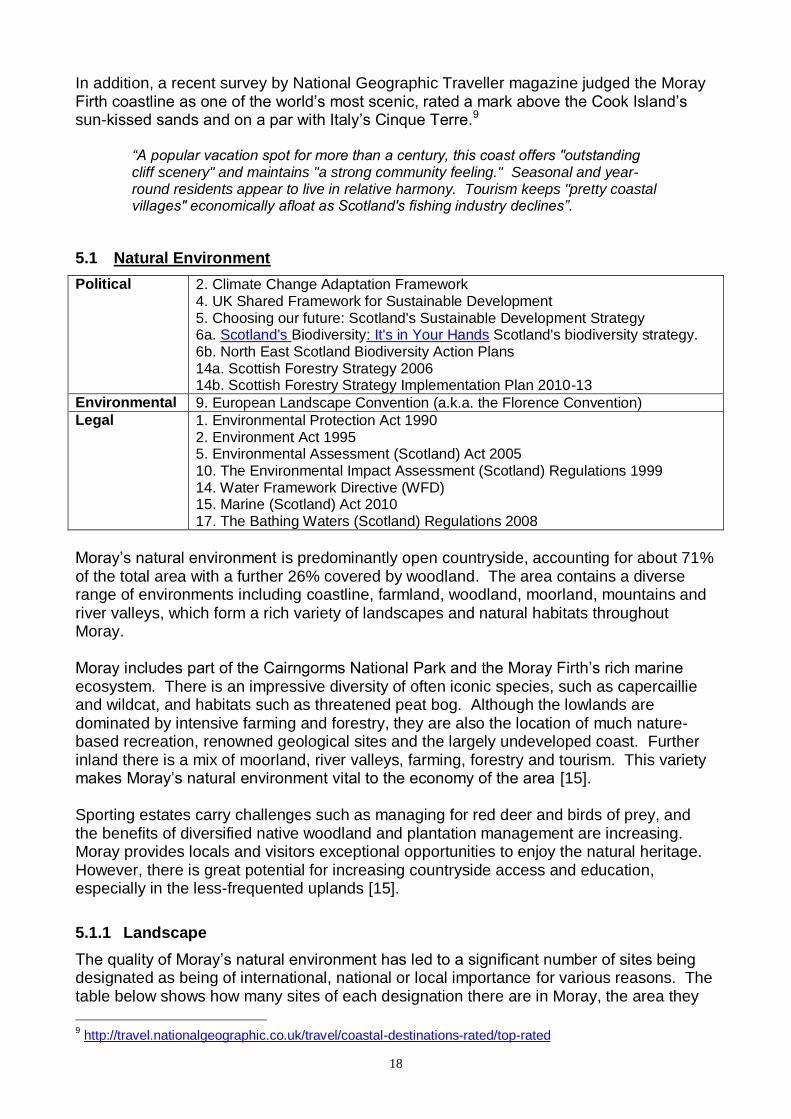
The quality of Moray‘s natural environment has led to a significant number of sites being designated as being of international, national or local importance for various reasons. The table below shows how many sites of each designation there are in Moray, the area they
9 http://travel.nationalgeographic.co.uk/travel/coastal-destinations-rated/top-rated
19
cover and the percentage of land in Moray that they cover10 [16]. For a list of the sites and definitions of the designations see appendix 2. Table 1: Designated sites in Moray
*A site lying within more than one LA area is assigned to the Authority with the greatest area of the site.
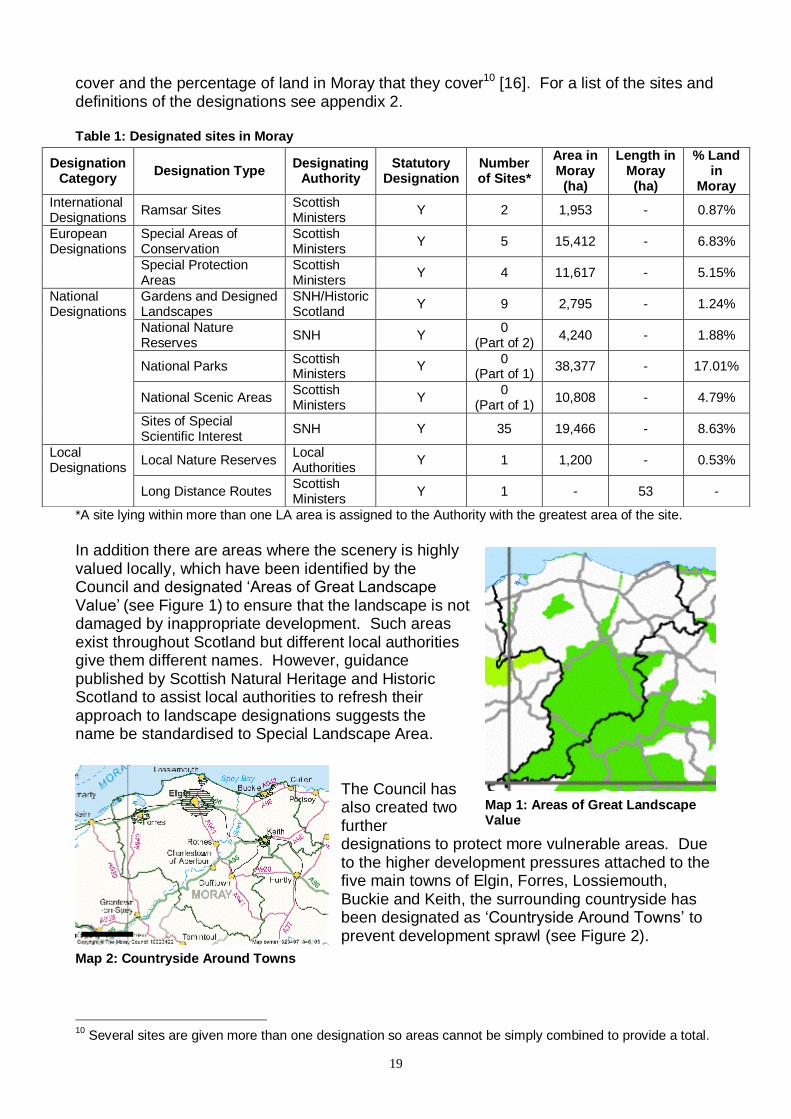
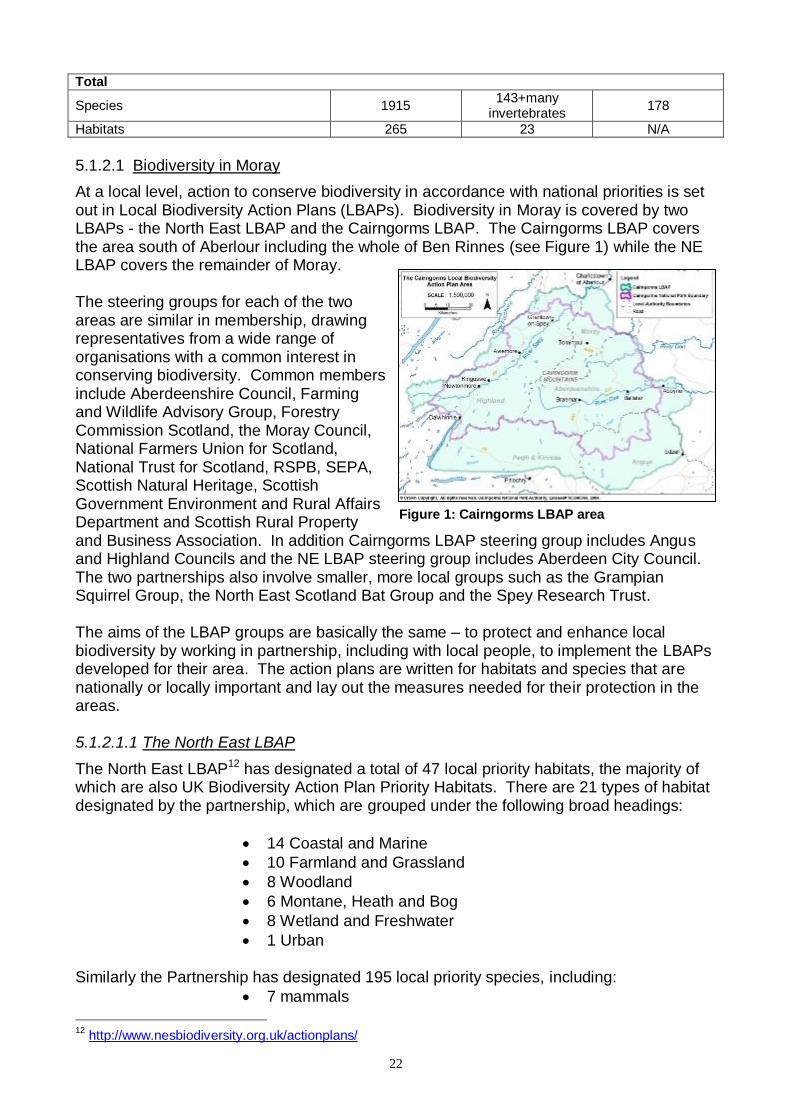
In addition there are areas where the scenery is highly valued locally, which have been identified by the Council and designated ‗Areas of Great Landscape Value‘ (see Figure 1) to ensure that the landscape is not damaged by inappropriate development. Such areas exist throughout Scotland but different local authorities give them different names. However, guidance published by Scottish Natural Heritage and Historic Scotland to assist local authorities to refresh their approach to landscape designations suggests the name be standardised to Special Landscape Area.
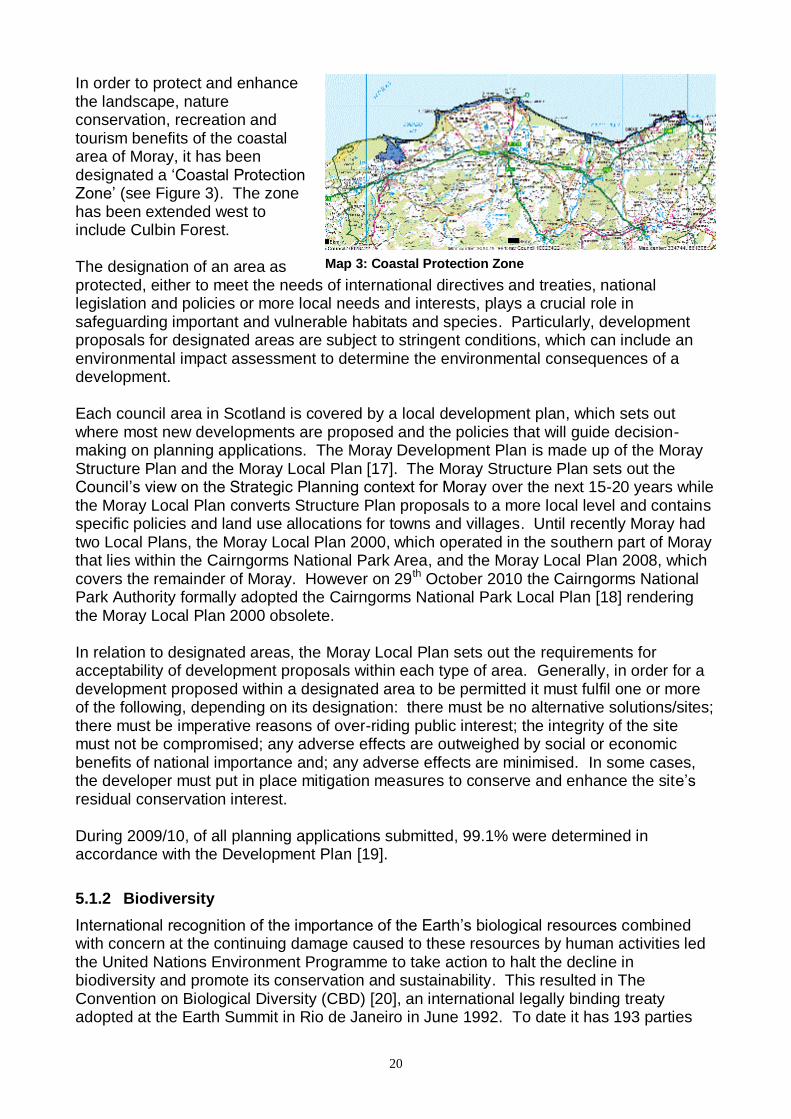
The Council has also created two further designations to protect more vulnerable areas. Due to the higher development pressures attached to the five main towns of Elgin, Forres, Lossiemouth, Buckie and Keith, the surrounding countryside has been designated as ‗Countryside Around Towns‘ to prevent development sprawl (see Figure 2).
10
Several sites are given more than one designation so areas cannot be simply combined to provide a total.
Designation Category
Designation Type Designating
Authority Statutory
Designation Number of Sites*
Area in Moray
(ha)
Length in Moray (ha)
% Land in
Moray
International Designations
Ramsar Sites Scottish Ministers
Y 2 1,953 - 0.87%
European Designations
Special Areas of Conservation
Scottish Ministers
Y 5 15,412 - 6.83%
Special Protection Areas
Scottish Ministers
Y 4 11,617 - 5.15%
National Designations
Gardens and Designed Landscapes
SNH/Historic Scotland
Y 9 2,795 - 1.24%
National Nature Reserves
SNH Y 0
(Part of 2) 4,240 - 1.88%
National Parks Scottish Ministers
Y 0
(Part of 1) 38,377 - 17.01%
National Scenic Areas Scottish Ministers
Y 0
(Part of 1) 10,808 - 4.79%
Sites of Special Scientific Interest
SNH Y 35 19,466 - 8.63%
Local Designations
Local Nature Reserves Local Authorities
Y 1 1,200 - 0.53%
Long Distance Routes Scottish Ministers
Y 1 - 53 -
Map 1: Areas of Great Landscape Value
Map 2: Countryside Around Towns
20
In order to protect and enhance the landscape, nature conservation, recreation and tourism benefits of the coastal area of Moray, it has been designated a ‗Coastal Protection Zone‘ (see Figure 3). The zone has been extended west to include Culbin Forest. The designation of an area as protected, either to meet the needs of international directives and treaties, national legislation and policies or more local needs and interests, plays a crucial role in safeguarding important and vulnerable habitats and species. Particularly, development proposals for designated areas are subject to stringent conditions, which can include an environmental impact assessment to determine the environmental consequences of a development. Each council area in Scotland is covered by a local development plan, which sets out where most new developments are proposed and the policies that will guide decision-making on planning applications. The Moray Development Plan is made up of the Moray Structure Plan and the Moray Local Plan [17]. The Moray Structure Plan sets out the Council‘s view on the Strategic Planning context for Moray over the next 15-20 years while the Moray Local Plan converts Structure Plan proposals to a more local level and contains specific policies and land use allocations for towns and villages. Until recently Moray had two Local Plans, the Moray Local Plan 2000, which operated in the southern part of Moray that lies within the Cairngorms National Park Area, and the Moray Local Plan 2008, which covers the remainder of Moray. However on 29th October 2010 the Cairngorms National Park Authority formally adopted the Cairngorms National Park Local Plan [18] rendering the Moray Local Plan 2000 obsolete. In relation to designated areas, the Moray Local Plan sets out the requirements for acceptability of development proposals within each type of area. Generally, in order for a development proposed within a designated area to be permitted it must fulfil one or more of the following, depending on its designation: there must be no alternative solutions/sites; there must be imperative reasons of over-riding public interest; the integrity of the site must not be compromised; any adverse effects are outweighed by social or economic benefits of national importance and; any adverse effects are minimised. In some cases, the developer must put in place mitigation measures to conserve and enhance the site‘s residual conservation interest. During 2009/10, of all planning applications submitted, 99.1% were determined in accordance with the Development Plan [19].
5.1.2 Biodiversity
International recognition of the importance of the Earth‘s biological resources combined with concern at the continuing damage caused to these resources by human activities led the United Nations Environment Programme to take action to halt the decline in biodiversity and promote its conservation and sustainability. This resulted in The Convention on Biological Diversity (CBD) [20], an international legally binding treaty adopted at the Earth Summit in Rio de Janeiro in June 1992. To date it has 193 parties
Map 3: Coastal Protection Zone
21
including the European Union. Scotland as part of the UK has an international obligation to conserve and protect biodiversity. The Convention provides the following definition of biodiversity: ―…the variability among living organisms from all sources including, inter alia, terrestrial, marine and other aquatic ecosystems and the ecological complexes of which they are part; this includes diversity within species, between species and of ecosystems‖. Put simply, biodiversity is the variety of life on Earth. It is essential for sustaining the natural living systems or ecosystems that provide us with food, fuel, health, wealth, and other vital services. It is vital to humanity's economic and social development. Scotland is no different – biodiversity is important to both its economy and its culture and enterprise. For example, species such as the eagle, deer, salmon, grouse, grey seal, capercaillie, Scots Pine, red squirrel, heather and thistle, are all enduring symbols of Scottish culture and enterprise. Some of the key industries that contributed to the development of Scotland‘s economy were based on its biodiversity, including fishing, shipbuilding and farming. Furthermore, the economy of huge swathes of the uplands is underpinned by deer and grouse. Scotland‘s biodiversity is also essential to the tourism industry, which employs more than 9% of the Scottish workforce and contributes more than 4.5 billion to our national economy. The green spaces found in urban areas are also important, adding texture to life, providing opportunities for outdoor activity and healthy living as well as a platform for learning [21]. In Scotland the process of conserving and protecting its biodiversity is supported by the Scottish Biodiversity Forum, a working partnership of Government, its agencies, sponsored bodies, non-government organisations, businesses, private organisations and individuals11. In May 2004, the Scottish Government published Scotland‘s Biodiversity Strategy: It‘s in your hands, which is Scotland‘s response to its obligations under the Convention on Biological Diversity (CBD) and also to the UK Biodiversity Action Plan, the UK Government‘s response to the CBD. In addition, the Nature Conservation (Scotland) Act 2004, which came into force on the 29 November 2004, gives all public bodies a duty to further the conservation of biodiversity. A significant contribution to fulfilling this duty can be made by helping to implement the Scottish Biodiversity Strategy. The List of Species and Habitats considered to be of ―Principal Importance for the purpose of Biodiversity Conservation in Scotland under the Nature Conservation (Scotland) Act 2004‖ can be used to assist Public Bodies in doing their Biodiversity Duty. The following table summarises the species and habitats in Scotland that are included in the Scottish Biodiversity List and serves to highlight the number and range for which action is required.
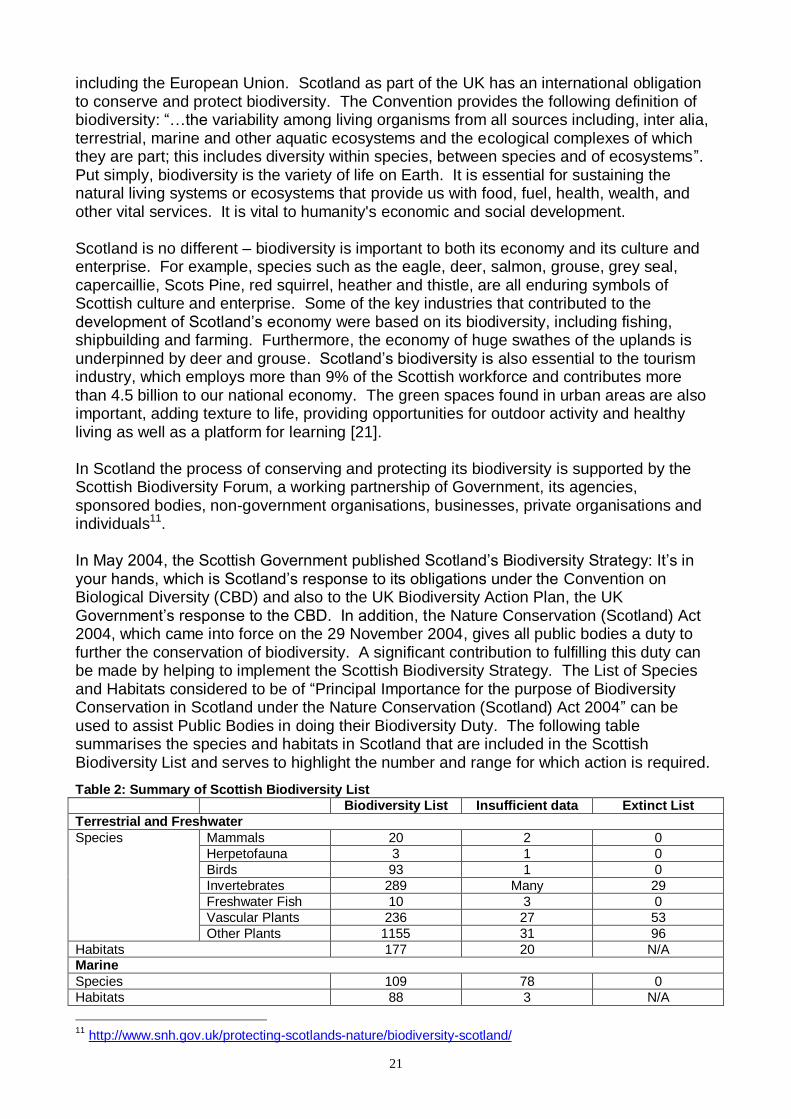
Table 2: Summary of Scottish Biodiversity List
Biodiversity List Insufficient data Extinct List
Terrestrial and Freshwater
Species Mammals 20 2 0
Herpetofauna 3 1 0
Birds 93 1 0
Invertebrates 289 Many 29
Freshwater Fish 10 3 0
Vascular Plants 236 27 53
Other Plants 1155 31 96
Habitats 177 20 N/A Marine
Species 109 78 0
Habitats 88 3 N/A
11
http://www.snh.gov.uk/protecting-scotlands-nature/biodiversity-scotland/
22
Total
Species 1915 143+many
invertebrates 178
Habitats 265 23 N/A
5.1.2.1 Biodiversity in Moray
At a local level, action to conserve biodiversity in accordance with national priorities is set out in Local Biodiversity Action Plans (LBAPs). Biodiversity in Moray is covered by two LBAPs - the North East LBAP and the Cairngorms LBAP. The Cairngorms LBAP covers the area south of Aberlour including the whole of Ben Rinnes (see Figure 1) while the NE LBAP covers the remainder of Moray. The steering groups for each of the two areas are similar in membership, drawing representatives from a wide range of organisations with a common interest in conserving biodiversity. Common members include Aberdeenshire Council, Farming and Wildlife Advisory Group, Forestry Commission Scotland, the Moray Council, National Farmers Union for Scotland, National Trust for Scotland, RSPB, SEPA, Scottish Natural Heritage, Scottish Government Environment and Rural Affairs Department and Scottish Rural Property and Business Association. In addition Cairngorms LBAP steering group includes Angus and Highland Councils and the NE LBAP steering group includes Aberdeen City Council. The two partnerships also involve smaller, more local groups such as the Grampian Squirrel Group, the North East Scotland Bat Group and the Spey Research Trust. The aims of the LBAP groups are basically the same – to protect and enhance local biodiversity by working in partnership, including with local people, to implement the LBAPs developed for their area. The action plans are written for habitats and species that are nationally or locally important and lay out the measures needed for their protection in the areas. 5.1.2.1.1 The North East LBAP
The North East LBAP12 has designated a total of 47 local priority habitats, the majority of which are also UK Biodiversity Action Plan Priority Habitats. There are 21 types of habitat designated by the partnership, which are grouped under the following broad headings:
14 Coastal and Marine
10 Farmland and Grassland
8 Woodland
6 Montane, Heath and Bog
8 Wetland and Freshwater
1 Urban Similarly the Partnership has designated 195 local priority species, including:
7 mammals
12
http://www.nesbiodiversity.org.uk/actionplans/
Figure 1: Cairngorms LBAP area
23
5 herpetofauna (reptiles & amphibians)
32 birds
37 invertebrates
4 freshwater fish
32 vascular plants
44 other plants and
34 marine species. 80 of these species are also UK Biodiversity Action Plan Priority Species and a further 60 are UK Species of Conservation Concern. The remainder are locally important. Most of the North East Action for Biodiversity is addressed through the Habitat Action Plans (HAPs), which incorporate action for associated priority species. However, specific Species Action Plans are being implemented for 5 species where habitat action alone will not fully address the needs of that particular species. They are:
Aspen Hoverfly
Daubentons Bat
Red Squirrel
Water Vole
Wych Elm Many of the Local Biodiversity Action Plans (LBAPs) are relevant to Moray but there are three that relate specifically to areas of Moray:
Moray Coast LBAP
Moray Moorlands LBAP
The Wards LBAP Although these areas are covered in a general way by other Grampian-wide LBAPs, their value in terms of biodiversity is such that individual plans were deemed necessary in order to ensure appropriate protection. 5.1.2.1.2 The Cairngorms LBAP
The Cairngorms LBAP13 contains almost 400 species and 25 habitats but attention is currently focused on the priority list, which contains 33 species most in need of help. The Cairngorms LBAP adopts a combined habitat/species approach to biodiversity action in the area, providing a series of Habitat Action Plans (HAPs) grouped together under the broad heading of either: (1) Farmland and grassland; (2) Montane, heath and bog, (3) Wetlands and water, and; (4) Woodland. Each broad HAP includes wherever possible, a full list of UK Priority species, UK Species of Conservation Concern and locally important species known to regularly use the habitat in the Cairngorms. The 25 habitat types identified in the LBAP identifies are grouped under the following broad headings:
6 Farmland and Grassland
9 Woodland
4 Montane, Heath and Bog
6 Wetland and Water
13
http://www.cairngorms.co.uk/learning/LBAP/action-plan/
24
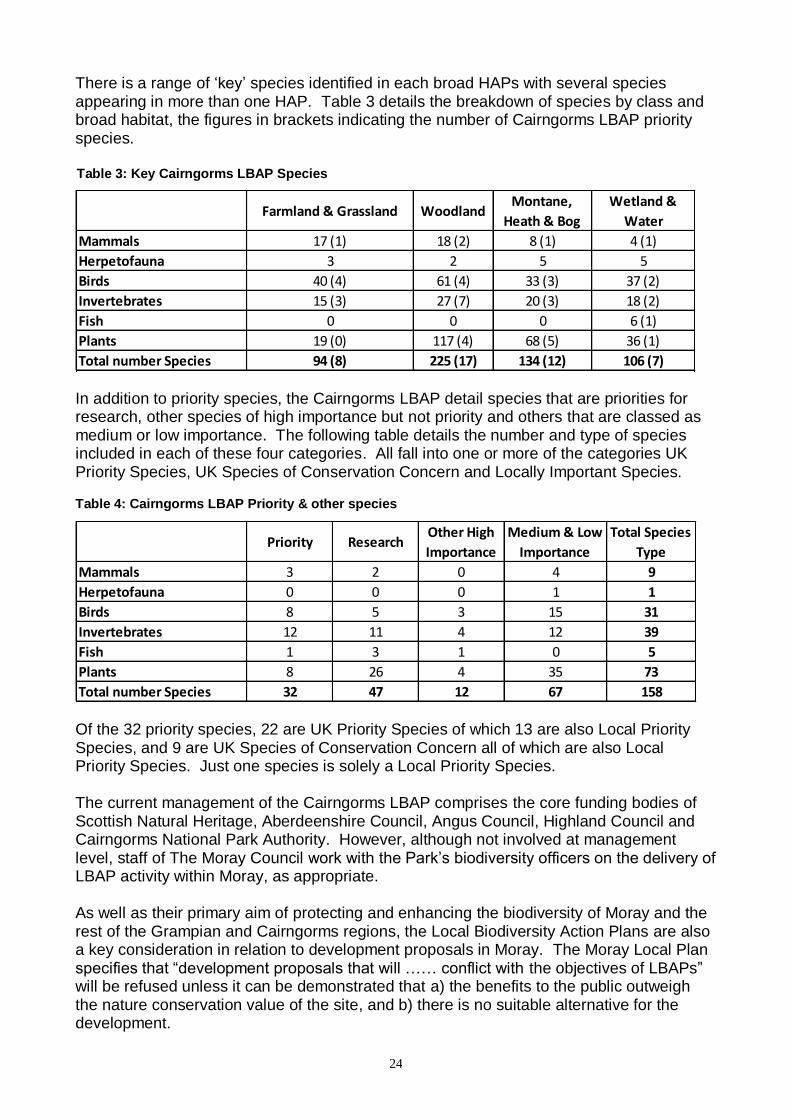
There is a range of ‗key‘ species identified in each broad HAPs with several species appearing in more than one HAP. Table 3 details the breakdown of species by class and broad habitat, the figures in brackets indicating the number of Cairngorms LBAP priority species.
In addition to priority species, the Cairngorms LBAP detail species that are priorities for research, other species of high importance but not priority and others that are classed as medium or low importance. The following table details the number and type of species included in each of these four categories. All fall into one or more of the categories UK Priority Species, UK Species of Conservation Concern and Locally Important Species.
Of the 32 priority species, 22 are UK Priority Species of which 13 are also Local Priority Species, and 9 are UK Species of Conservation Concern all of which are also Local Priority Species. Just one species is solely a Local Priority Species. The current management of the Cairngorms LBAP comprises the core funding bodies of Scottish Natural Heritage, Aberdeenshire Council, Angus Council, Highland Council and Cairngorms National Park Authority. However, although not involved at management level, staff of The Moray Council work with the Park‘s biodiversity officers on the delivery of LBAP activity within Moray, as appropriate. As well as their primary aim of protecting and enhancing the biodiversity of Moray and the rest of the Grampian and Cairngorms regions, the Local Biodiversity Action Plans are also a key consideration in relation to development proposals in Moray. The Moray Local Plan specifies that ―development proposals that will …… conflict with the objectives of LBAPs‖ will be refused unless it can be demonstrated that a) the benefits to the public outweigh the nature conservation value of the site, and b) there is no suitable alternative for the development.
Farmland & Grassland WoodlandMontane,
Heath & Bog
Wetland &
Water
Mammals 17 (1) 18 (2) 8 (1) 4 (1)
Herpetofauna 3 2 5 5
Birds 40 (4) 61 (4) 33 (3) 37 (2)
Invertebrates 15 (3) 27 (7) 20 (3) 18 (2)
Fish 0 0 0 6 (1)
Plants 19 (0) 117 (4) 68 (5) 36 (1)
Total number Species 94 (8) 225 (17) 134 (12) 106 (7)
Table 3: Key Cairngorms LBAP Species
Priority ResearchOther High
Importance
Medium & Low
Importance
Total Species
Type
Mammals 3 2 0 4 9
Herpetofauna 0 0 0 1 1
Birds 8 5 3 15 31
Invertebrates 12 11 4 12 39
Fish 1 3 1 0 5
Plants 8 26 4 35 73
Total number Species 32 47 12 67 158
Table 4: Cairngorms LBAP Priority & other species
25
Biodiversity issues are also included in other organisations plans, such as the Forestry Commission‘s draft implementation plan for 2011/12, which includes three actions relating to biodiversity. Scottish Natural Heritage has produced a Species Action Framework, which incorporates a Species Action List. The list includes species targeted for conservation action, invasive non-native species that threaten biodiversity aims, native species whose behaviour brings it into conflict with other interests and species that are a resource of social or economic benefit. In addition to the official action proposed in relation to biodiversity many organisations provide information regarding action that individuals and local groups can take to help protect and conserve the biodiversity of the area. For example, the Moray Sustainability Handbook published by REAP (Rural Environmental Action Project) in 2005 suggests various activities as valid now as then, such as getting involved in a local environment group; putting up bird or bat boxes, planting trees or cleaning up rivers; supporting garden wildlife with wildlife friendly practices; use peat-free products and minimise chemicals used; help with local wildlife surveys, in your garden or in the park. Both the North East Local Biodiversity Partnership and the Cairngorms LBAP provide similar information for individuals and community organisation including schools, and the North East Local Biodiversity Partnership has also produced Biodiversity Advice Notes for Businesses, funded by Scottish Enterprise Grampian, to help businesses get started. The notes highlight several ways every business, large or small, can take action for local wildlife as part of the biodiversity process14. Data on habitats and species for each area are coordinated and managed by Local Record Centres (LRCs). The North East Scotland Biological Records Centre (NESBReC) is located in Aberdeen. Since 2000, it has maintained records for Moray, Aberdeenshire, Aberdeen City and, since 2009, the Cairngorms National Park area. The data are frequently used by partners, decision makers, education and conservation bodies, national recording schemes and the wider community to assist with land use planning, conservation, site management and research.
5.1.3 Pollution
Pollution to land, air and water can have serious health and environmental implications unless strictly controlled. There is a range of regulations and strategies in place to control environmental pollution and emissions from most major industries. Implementation of these is primarily the responsibility of the Scottish Environment Protection Agency (SEPA) and local authorities. SEPAs main role is ―to protect the environment and human health by regulating activities that can cause pollution and my monitoring the quality of Scotland‘s air, land and water‖. SEPA is responsible for a range of activities to ensure emissions are prevented, minimised or rendered harmless and work with local authorities who also have responsibility for addressing a number of local environmental issues. SEPA's main responsibilities in relation to pollution are:
Regulating emissions from industrial installations, including power stations, foundries, incinerators and chemical works and other activities such as intensive pig and poultry farming, via the Pollution Prevention and Control (Scotland) Regulations (PPC).
14
http://www.nesbiodiversity.org.uk/business.htm
26
Controlling pollution from waste management activities, including licensing storage and disposal of waste and regulating landfill sites. The Scottish Government works in partnership with SEPA and local authorities on strategies for minimising waste and promoting recycling.
Regulating installations using radioactive materials, e.g. nuclear power stations, oil rigs, hospitals and universities to prevent harm to the environment and human health.
Regulating discharges to rivers, lochs, estuaries and coastal waters from sewage works, fish farms, septic tanks etc. SEPA also has broad duties for protecting and improving the water environment, including River Basin Management Planning under the Water Environment and Water Services Act.
SEPA also plays a major role in advising the Scottish Government on the development of new policies for protecting Scotland's environment. It also provides advice to industry and the public on pollution control and other environmental issues.
Moray is covered by SEPA‘s North Region, the head office of which is in Dingwall. However, there is a local office in Elgin. The main roles of Local Authorities in relation to pollution are:
Ensuring local air quality meets national standards and taking action to improve air quality where standards are not met. This may involve addressing pollution from transport sources, as well as working in partnership with SEPA to address relevant industrial emissions.
Inspecting their areas to identify areas of contaminated land and making sure sites that are causing health or environmental risks are cleaned up. Cleaning up some types of site is the responsibility of SEPA.
Collecting and disposing of household waste. Implementing measures to reduce waste and increase recycling, in partnership with the Scottish Government and SEPA.
Dealing with complaints related to statutory nuisance issues such as noise and odour.
Taking action to control litter, clean up graffiti and address dog fouling.
Controlling development through the land use planning system. This often involves assessment of environment and pollution control issues.
Regulatory action for identifying and remediating contaminated land. The Environmental Protection Act 1990 sets out the fundamental structure for the control of waste management and air pollution and introduced an integrated scheme for the environmental regulation of air, water and land pollution. 5.1.3.1 Air
Air quality directly affects human health and the natural environment. Even moderate levels of air pollution can aggravate respiratory diseases, such as asthma, or worsen the condition of individuals with heart or lung disease. Atmospheric pollution can adversely affect the natural environment, particularly through the deposition of acidifying pollutants and nitrogen compounds. This can result in damage to crops, forests, and aquatic organisms, and an overall reduction in biodiversity. Some of the main sources of air pollution in Scotland are road traffic, industry and power generation. The long-range transport of pollutants means that pollutants which have been
27
released in other countries can also have an impact on Scotland‘s air quality. Similarly, air pollution generated in Scotland can have effects beyond our borders. Scotland‘s industrial emissions to air represent about 10% of the total UK emissions for most pollutants, and most of these emissions come from central Scotland. The UK Government‘s and devolved administrations‘ primary objective is to ensure that all citizens should have access to outdoor air without significant risk to their health, where this is economically and technically feasible. The Environment Act 1995 requires the UK Government and the devolved administrations for Scotland and Wales to produce a national air quality strategy containing standards, objectives and measures for improving ambient air quality and to keep these policies under review. There is equivalent legislation in Northern Ireland. The trans-boundary nature of air pollutants makes it appropriate to have an Air Quality Strategy covering all parts of the UK. In addition, as a Member of the European Union, the UK is required to achieve its obligations under European legislation. Outdoor ambient air quality policy in the EU is primarily governed by the ambient air quality directive (2008/50/EC), which consolidates most of the previous EU air quality legislation and sets binding limits for concentrations of air pollutants. Some of the national air quality objectives set out in the National Air Quality Strategy 2007 (NAQS) therefore reflect EU target values, where these exist, and as such they are legally binding. Both SEPA and local authorities are involved in the regulation and management of air quality. SEPA regulates industrial and agricultural installations that are covered by the EU Integrated Pollution Prevention and Control Directive. This requires such activities with a high pollution potential to have a permit, which can only be issued if certain environmental conditions are met, so that the companies themselves bear responsibility for preventing and reducing any pollution they may cause. Under the Environment Act 1995, SEPA are required to ―have regard to the Air Quality Strategy in exercising their pollution control functions‖. The Environment Act 1995 introduced the system of Local Air Quality Management (LAQM), which places a statutory duty on local authorities to periodically review and assess the current and likely future air quality in their areas against national air quality objectives for seven air pollutants15 included in regulations for that purpose16. Where any objective is unlikely to be met by the relevant deadline, local authorities must designate those areas as air quality management areas (AQMAs) and take action, along with others, to work towards meeting the objectives. 5.1.3.1.1 Air Quality in Moray
Since 1999, Moray Council has monitored levels of Nitrogen Dioxide (NO2) at a number of locations across Moray. Measurements were taken at 13 sites until 2009 when 4 further sites were added17. Between 1999 and 2003 monitoring of Sulphur Dioxide (SO2) was also carried out by Moray Council. However, monitoring ceased in 2004 because annual
15
Carbon Monoxide; Benzene; 1,3-Butadiene; Lead; Nitrogen Dioxide; Sulphur Dioxide; Particles (PM10). 16
The Air Quality (Scotland) Regulations 2000 (Scottish SI 2000 No 97); The Air Quality (Scotland) (Amendment) Regulations 2002 (Scottish SI 2002 No 297). 17
List of monitoring NO2 locationshttp://www.moray.gov.uk/downloads/file62274.pdf
28
mean concentrations had been continuously low over the five year period and the monitoring technique was not suitable for the assessment of 24-hour, 1-hour or 15-minute mean concentrations required for NAQS objectives. None of the other pollutants is monitored by Moray Council so background concentrations are estimated using monitoring data from the closest national network monitoring site. Emissions at possible pollutant hotspots, such as industrial installations and busy roads or junctions, are also considered to determine whether there are likely to be any exceedences of the NAQS objectives. Updating and Screening Assessments have been carried out in accordance with regulations in 2003, 2006 and 2009 with Progress Reports being produced in the intervening years. With the exception of the 2003 Assessment, none of the reports has identified any potential exceedences of NAQS objectives for any of the seven pollutants. Although the 2003 Assessment predicted that NAQS 2010 objectives for Particulate Matter10 (PM10) may be exceeded at some busy road junctions, the subsequent Detailed Assessment indicated that there were unlikely to be any exceedences of the NAQS 2010 objectives. The findings of the 2009 Updating and Screening Assessment resulted in four additional NO2 monitoring sites, 2 in Elgin and 2 in Rothes. In Rothes, intended industrial developments will lead to increased emissions of NO2, which although deemed unlikely to result in an exceedence of the NAQS objectives, are to be monitored to confirm these predictions. In Elgin, high levels of NO2 measured at previously existing sites, combined with an increasing regional trend led to the Moray Council installing the 2 additional sites at areas of relevant exposure along busy roads. Since 2003, figures indicate a definite increase in NO2 concentrations at monitoring sites within the Moray Council area. Since ten of the 13 original sites are situated at kerbside or roadside locations, it is suggested that this increase is likely to be due to increases in road traffic emissions. 5.1.3.1.1.1 RAF bases Air Quality
In 2003, in response to complaints regarding the potential risks to human health and odour nuisance due to emissions from aircraft and other in-site activities, The Moray Council commissioned a study to assess air quality in the areas surrounding RAF Lossiemouth and RAF Kinloss [107]. The pollutants investigated were nitrogen dioxide (NO2), fine particulate matter (PM10) and volatile organic compounds (VOCs). Monitoring took place at six sites around the bases over a six month period to determine the ambient concentrations of NO2 and total VOCs. In addition the different types of VOCs present were identified and the quantity compared with established environmental assessment levels (EAL) and odour assessment criteria in order to examine the potential impact on human health and the potential odour nuisance respectively. The likelihood of dust nuisance in the vicinity was also examined. The results show the following:
NO2 – no recorded exceedences of the NAQS annual mean concentration level in any month or as a 6-month average concentration at any of the monitoring sites. NO2 levels recorded during a no-fly period at RAF Lossiemouth indicated that at two monitoring sites in Lossiemouth, road traffic emissions may have a greater influence than RAF base activities, while at the other two monitoring sites in Lossiemouth the reverse is true.
29
Dust nuisance – the monitored values at all sites were below the typical levels that result in dust nuisance complaints.
VOCs – the recorded concentrations of two substances exceeded the EAL and/or odour threshold values (OTV), but each was only evident during one month at one site. The six month mean concentrations at all sites were significantly below relevant human and EALs. Total VOCs recorded at each monitoring site during the no-fly period were below the six month mean concentration recorded at each respective site.
The level of benzene assessed using the Design Manual for Roads and Bridges screening model at one site in Lossiemouth indicated that activities at RAF Lossiemouth may be contributing to the ambient concentration.
The study concluded that:
The ambient concentrations of NO2 do not appear to be influenced by variations in aircraft flight movements at either base. The highest readings were at locations most influenced by road traffic in Lossiemouth. The 6-month mean concentration at the other sites was typical of background concentrations across the Moray area.
There does not appear to be a clear link between the number of aircraft movements and the total VOCs measured on a monthly basis. The presence and concentrations of specific VOCs may be influenced more by changes in ground level activities or types of aircraft movements as well as agricultural and traffic sources.
Monitored levels of benzene are below relevant EALs indicating that there is NO significant impact to human health from benzene in the vicinity of RAF Lossiemouth.
5.1.3.2 Water
Water is an essential resource for Scotland‘s people, its economy and its environment, the high quality of which is world renowned. Its rivers, lochs, estuaries and seas are key to the country's welfare, providing resources for water supply and hydropower generation. They are also very important for the economy, supporting successful industries such as salmon farming, shellfish farming, distilleries and tourism, attracting visitors from all round the world. The Scottish Government has policy responsibility for maintaining and improving the quality of Scotland‘s water environment and works closely with a number of partners, including Scottish Water, the Scottish Environment Protection Agency (SEPA) and water users, to ensure that our water is kept clean and free of pollution. Increasing pressure on Europe‘s water resources from the continuous growth in demand for sufficient quantities of good quality water for all purposes, led in 2000 to the EU introducing the Water Framework Directive (WFD), which established a framework for the protection of EU member states‘ water resources in qualitative as well as in quantitative terms. It requires the introduction of a holistic source-to-sea approach for the management of our water environment. The WFD was transposed into Scots law in 2003 by the Water Environment and Water Services (Scotland) Act (WEWS) 2003. The Act provided for regulations to control the adverse impacts of all activities likely to have an impact on the water environment and it sets out clear roles for the Scottish Ministers and the Scottish Environment Protection Agency (SEPA), identified as the competent Authority for Scotland empowered to implement the WFD.
30
The overarching aim of the Scottish Government in implementing the WFD is to establish a framework that allows for a balance to be struck between the protection of the water environment and its use for the purposes of sustainable social and economic development. Central to this is the adoption of an integrated approach whereby WFD principles are embedded in all relevant policy and regulatory areas. There are two key elements to achieving an integrated approach: the Designation of a piece of legislation as a WEWS Relevant Enactment, and the designation of public bodies as Responsible Authorities.
Designating a piece of legislation as a WEWS Relevant Enactment places the Scottish Ministers and SEPA under an explicit duty to exercise their functions or powers under that legislation in a way that promotes the successful implementation of the WFD in Scotland, taking into consideration the social and economic impacts and the sustainability of any action and also ensuring the coordination of all parties in the exercise of their functions.
The designation of a public body as a Responsible Authority imposes a duty upon them to take the WFD into consideration when carrying out their statutory functions, where these duties have an impact on the water environment. They are also required to work co-operatively and to take an active part in the river basin management planning process.
The Water Environment (Relevant Enactments and Designation of Responsible Authorities and Functions) Order 2008 details the legislation18 and public bodies19 designated by Scottish Ministers. 5.1.3.2.1 River Basin Management
Management of the water environment is based on natural river basins, including areas of land from which water flows towards the sea and enters it at a single point. These river basins are the building blocks of the WFD, and are managed individually or combined together to form river basin districts. In accordance with the WFD, the WEWS created a River Basin Management Planning (RBMP) process to achieve the environmental improvements required to protect and improve our water environment in a sustainable way. There are two River Basin Districts covering Scotland, the Scotland River Basin District and the cross-border Solway Tweed River Basin District. The vast majority of the country, from Shetland in the north to Glasgow, Ayr and Edinburgh in the south, is covered by the Scotland River Basin District. In December 2009, SEPA published River Basin Management Plans (RBMPs) for the two districts and is responsible for their implementation in co-ordination with a wide range of organisations with interests in the water environment. In the past the management of Scotland‘s water environment has focused almost exclusively on reducing and preventing pollution. The objective of the new River Basin Management Plans is to protect and improve the ecological quality of the water environment. In addition to reducing pollution, action is also required to reduce the adverse impacts of a wide range of other pressures that can affect ecological quality.
18
http://www.legislation.gov.uk/ssi/2008/263/schedule/1/made 19
http://www.legislation.gov.uk/ssi/2008/263/schedule/2/made
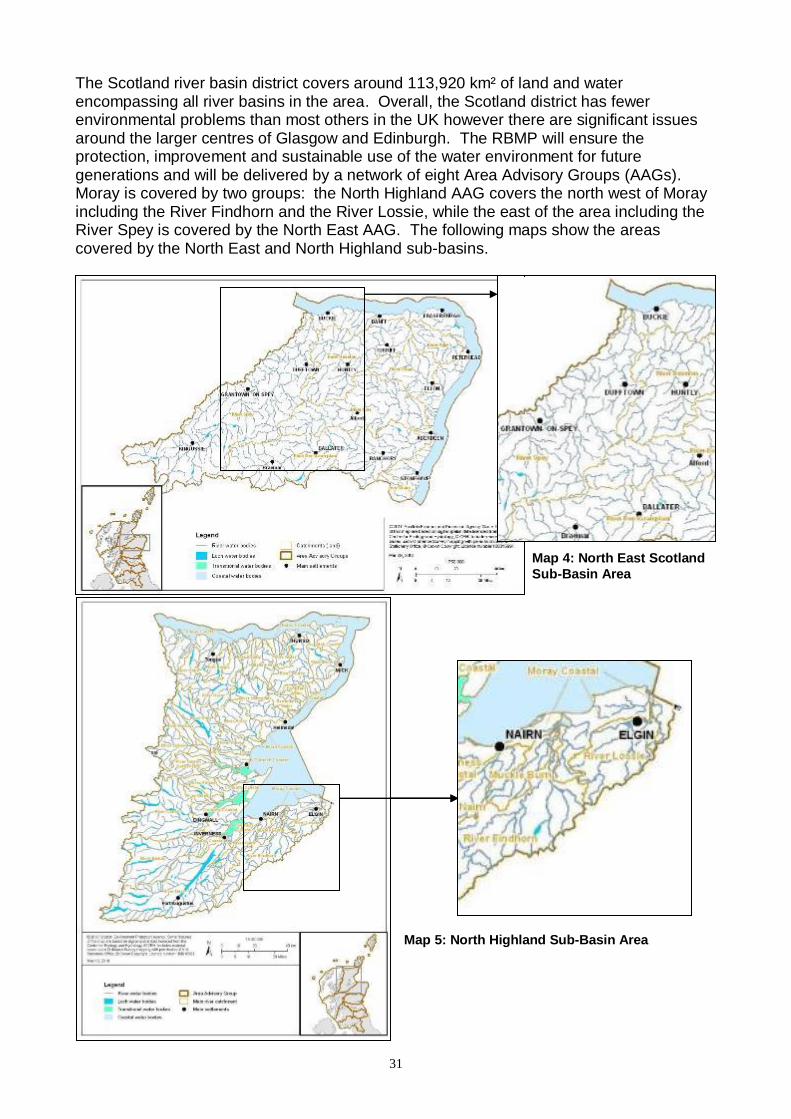
31
The Scotland river basin district covers around 113,920 km² of land and water encompassing all river basins in the area. Overall, the Scotland district has fewer environmental problems than most others in the UK however there are significant issues around the larger centres of Glasgow and Edinburgh. The RBMP will ensure the protection, improvement and sustainable use of the water environment for future generations and will be delivered by a network of eight Area Advisory Groups (AAGs). Moray is covered by two groups: the North Highland AAG covers the north west of Moray including the River Findhorn and the River Lossie, while the east of the area including the River Spey is covered by the North East AAG. The following maps show the areas covered by the North East and North Highland sub-basins.
Map 4: North East Scotland
Sub-Basin Area
Map 5: North Highland Sub-Basin Area
32
At the end of 2006, SEPA established a revised classification system for assessing the quality of Scotland‘s water environment. Unlike previous schemes, which were designed to describe the cleanliness of waters based on chemical and biological assessments, the new scheme describes the impacts of a wide range of human activities not just pollution pressures. To reflect the wide variation in the environmental quality and natural characteristics of surface waters and groundwater SEPA subdivided Scotland‘s water environment into 3,000 water bodies. In order to allow for flood protection, hydropower generation, navigation, land drainage or water storage for drinking water supply some water bodies have been changed in character and are known as heavily modified water bodies (HMWBs). They are assessed and classified according to the extent to which their ecological quality has been maximised given the limits imposed by the changes made. Water bodies created where no water body previously existed are called artificial water bodies (AWBs) and their ecological quality is assessed in the same way as for HMWBs. In total, Scotland has 2,013 rivers, 309 lochs, 40 estuaries, 449 coastal water bodies and 284 groundwater bodies. The results show that overall 65% of water bodies in the Scotland river basin district are in a good or better condition, although the condition varies with type: 56% of rivers, 66% of lochs, 85% of estuaries, 94% of coastal waters and 76% of groundwater bodies being in good or better condition at the time of assessment in 2008. However, this means that around 35% of Scotland‘s water bodies are under significant pressure from human activity and are not in good condition. The Scotland River Basin Management Plan outlines the actions that will be taken to improve such waters whilst protecting those that are already in good condition. The overall aim is for 98% of Scotland‘s water bodies to be in good or better condition by 2027. The WEWS also required SEPA to establish a register of protected waters, categorised as follows:
Shellfish waters
Freshwater fish waters
Bathing waters
Drinking water protected areas
Nutrient sensitive areas such as Nitrate Vulnerable Zones (NVZs) and Urban Waste Water Treatment (UWWT) sites
Nature conservation sites for the protection of habitats and birds The identification of protected areas for shellfish, freshwater fish, bathing and drinking water is partly to safeguard human health as the environmental conditions required for this are different to those needed to protect the ecological quality of water bodies. Some of the habitats and species protected by the designation of nature conservation sites also have very particular environmental requirements. The identification of NVZs and UWWT sites as protected areas aims to ensure that action is taken to reduce the amount of pollution caused by nitrates from agricultural sources and protect the environment from waste water discharges from domestic and industrial sources. The register will help to ensure that these water bodies achieve the objectives required by the Water Framework Directive (WFD) and the Water Environment (Register of Protected Areas) (Scotland) Regulations 2004.
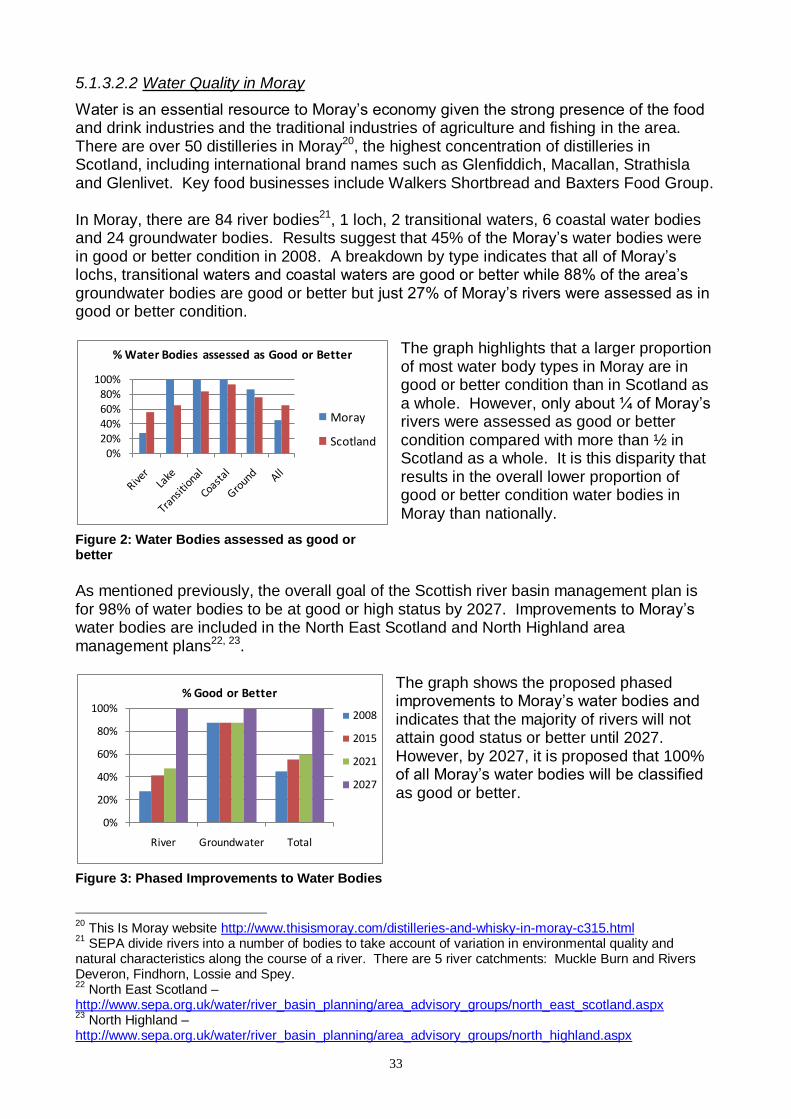
33
5.1.3.2.2 Water Quality in Moray
Water is an essential resource to Moray‘s economy given the strong presence of the food and drink industries and the traditional industries of agriculture and fishing in the area. There are over 50 distilleries in Moray20, the highest concentration of distilleries in Scotland, including international brand names such as Glenfiddich, Macallan, Strathisla and Glenlivet. Key food businesses include Walkers Shortbread and Baxters Food Group. In Moray, there are 84 river bodies21, 1 loch, 2 transitional waters, 6 coastal water bodies and 24 groundwater bodies. Results suggest that 45% of the Moray‘s water bodies were in good or better condition in 2008. A breakdown by type indicates that all of Moray‘s lochs, transitional waters and coastal waters are good or better while 88% of the area‘s groundwater bodies are good or better but just 27% of Moray‘s rivers were assessed as in good or better condition.
The graph highlights that a larger proportion of most water body types in Moray are in good or better condition than in Scotland as a whole. However, only about ¼ of Moray‘s rivers were assessed as good or better condition compared with more than ½ in Scotland as a whole. It is this disparity that results in the overall lower proportion of good or better condition water bodies in Moray than nationally.
As mentioned previously, the overall goal of the Scottish river basin management plan is for 98% of water bodies to be at good or high status by 2027. Improvements to Moray‘s water bodies are included in the North East Scotland and North Highland area management plans22, 23.
The graph shows the proposed phased improvements to Moray‘s water bodies and indicates that the majority of rivers will not attain good status or better until 2027. However, by 2027, it is proposed that 100% of all Moray‘s water bodies will be classified as good or better.
20
This Is Moray website http://www.thisismoray.com/distilleries-and-whisky-in-moray-c315.html 21
SEPA divide rivers into a number of bodies to take account of variation in environmental quality and natural characteristics along the course of a river. There are 5 river catchments: Muckle Burn and Rivers Deveron, Findhorn, Lossie and Spey. 22
North East Scotland – http://www.sepa.org.uk/water/river_basin_planning/area_advisory_groups/north_east_scotland.aspx 23
North Highland –http://www.sepa.org.uk/water/river_basin_planning/area_advisory_groups/north_highland.aspx
0%20%40%60%80%
100%
% Water Bodies assessed as Good or Better
Moray
Scotland
0%
20%
40%
60%
80%
100%
River Groundwater Total
% Good or Better
2008
2015
2021
2027
Figure 2: Water Bodies assessed as good or better
Figure 3: Phased Improvements to Water Bodies
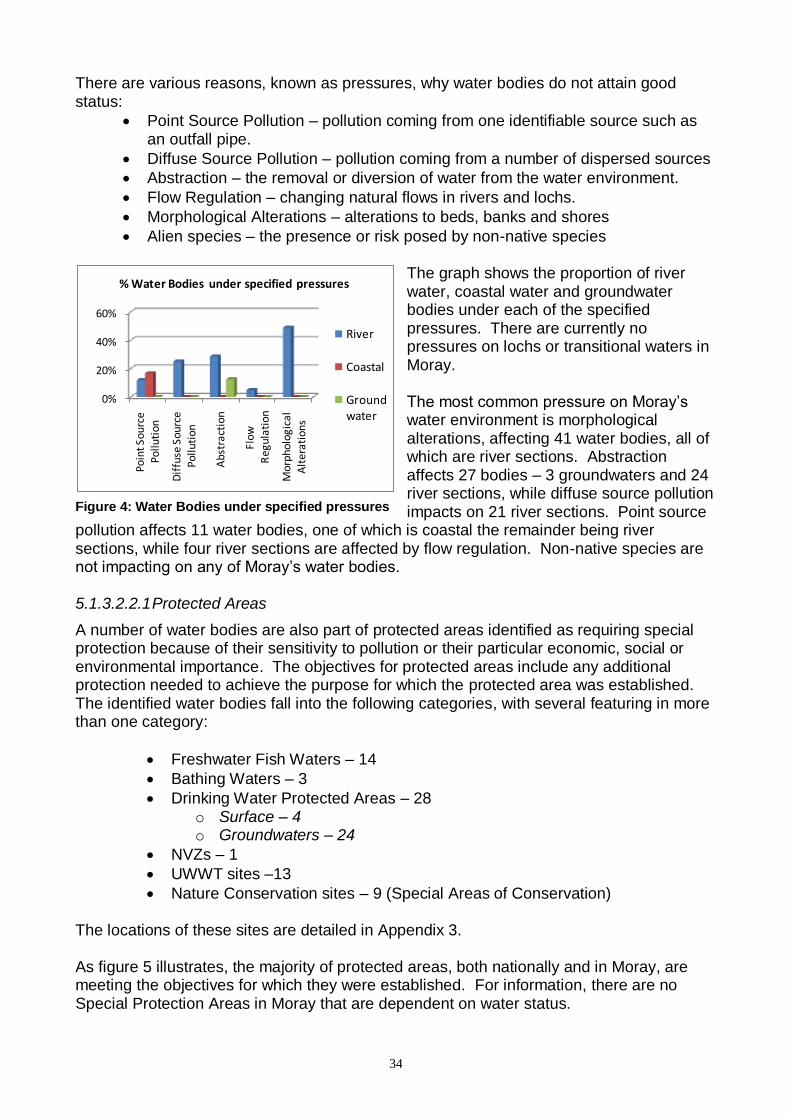
34
There are various reasons, known as pressures, why water bodies do not attain good status:
Point Source Pollution – pollution coming from one identifiable source such as an outfall pipe.
Diffuse Source Pollution – pollution coming from a number of dispersed sources
Abstraction – the removal or diversion of water from the water environment.
Flow Regulation – changing natural flows in rivers and lochs.
Morphological Alterations – alterations to beds, banks and shores
Alien species – the presence or risk posed by non-native species
The graph shows the proportion of river water, coastal water and groundwater bodies under each of the specified pressures. There are currently no pressures on lochs or transitional waters in Moray. The most common pressure on Moray‘s water environment is morphological alterations, affecting 41 water bodies, all of which are river sections. Abstraction affects 27 bodies – 3 groundwaters and 24 river sections, while diffuse source pollution impacts on 21 river sections. Point source
pollution affects 11 water bodies, one of which is coastal the remainder being river sections, while four river sections are affected by flow regulation. Non-native species are not impacting on any of Moray‘s water bodies. 5.1.3.2.2.1 Protected Areas
A number of water bodies are also part of protected areas identified as requiring special protection because of their sensitivity to pollution or their particular economic, social or environmental importance. The objectives for protected areas include any additional protection needed to achieve the purpose for which the protected area was established. The identified water bodies fall into the following categories, with several featuring in more than one category:
Freshwater Fish Waters – 14
Bathing Waters – 3
Drinking Water Protected Areas – 28 o Surface – 4 o Groundwaters – 24
NVZs – 1
UWWT sites –13
Nature Conservation sites – 9 (Special Areas of Conservation) The locations of these sites are detailed in Appendix 3. As figure 5 illustrates, the majority of protected areas, both nationally and in Moray, are meeting the objectives for which they were established. For information, there are no Special Protection Areas in Moray that are dependent on water status.
0%
20%
40%
60%
Po
int
Sou
rce
Po
llu
tio
n
Dif
fuse
So
urc
e P
oll
uti
on
Ab
stra
ctio
n
Flo
w
Reg
ula
tio
n
Mor
phol
ogic
al
Alt
erat
ions
% Water Bodies under specified pressures
River
Coastal
Groundwater
Figure 4: Water Bodies under specified pressures
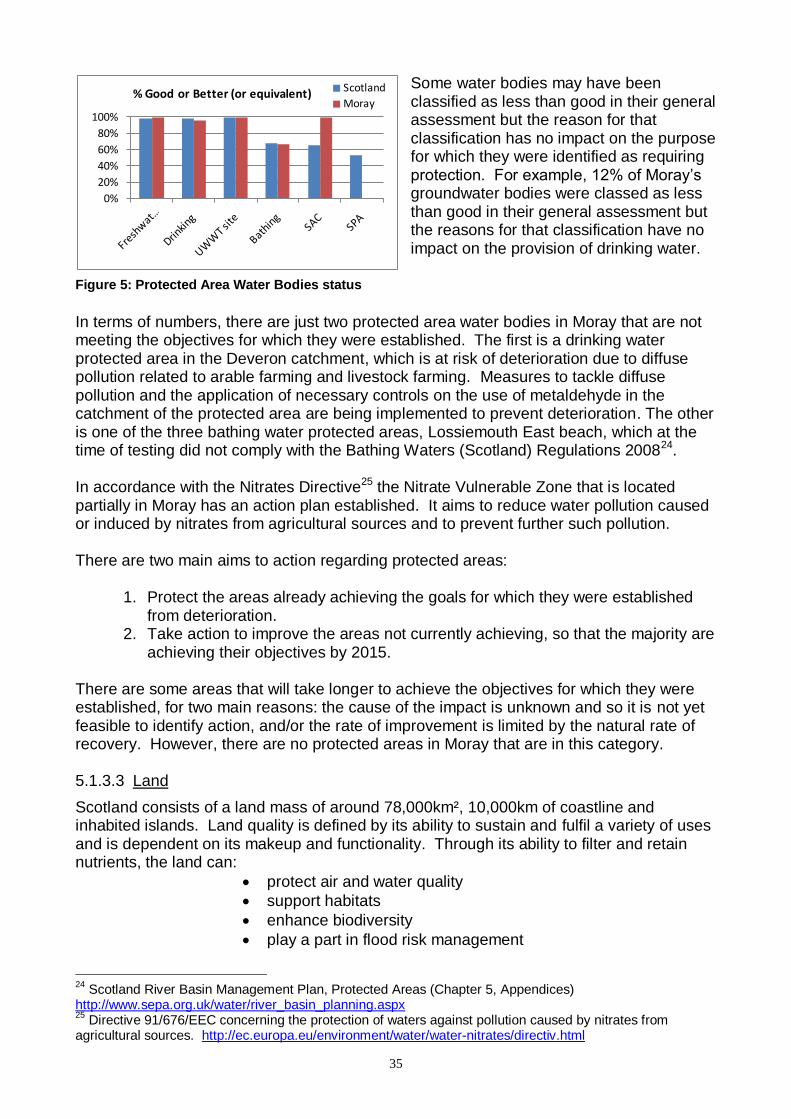
35
Some water bodies may have been classified as less than good in their general assessment but the reason for that classification has no impact on the purpose for which they were identified as requiring protection. For example, 12% of Moray‘s groundwater bodies were classed as less than good in their general assessment but the reasons for that classification have no impact on the provision of drinking water.
In terms of numbers, there are just two protected area water bodies in Moray that are not meeting the objectives for which they were established. The first is a drinking water protected area in the Deveron catchment, which is at risk of deterioration due to diffuse pollution related to arable farming and livestock farming. Measures to tackle diffuse pollution and the application of necessary controls on the use of metaldehyde in the catchment of the protected area are being implemented to prevent deterioration. The other is one of the three bathing water protected areas, Lossiemouth East beach, which at the time of testing did not comply with the Bathing Waters (Scotland) Regulations 200824. In accordance with the Nitrates Directive25 the Nitrate Vulnerable Zone that is located partially in Moray has an action plan established. It aims to reduce water pollution caused or induced by nitrates from agricultural sources and to prevent further such pollution. There are two main aims to action regarding protected areas:
1. Protect the areas already achieving the goals for which they were established from deterioration.
2. Take action to improve the areas not currently achieving, so that the majority are achieving their objectives by 2015.
There are some areas that will take longer to achieve the objectives for which they were established, for two main reasons: the cause of the impact is unknown and so it is not yet feasible to identify action, and/or the rate of improvement is limited by the natural rate of recovery. However, there are no protected areas in Moray that are in this category. 5.1.3.3 Land
Scotland consists of a land mass of around 78,000km², 10,000km of coastline and inhabited islands. Land quality is defined by its ability to sustain and fulfil a variety of uses and is dependent on its makeup and functionality. Through its ability to filter and retain nutrients, the land can:
protect air and water quality
support habitats
enhance biodiversity
play a part in flood risk management
24
Scotland River Basin Management Plan, Protected Areas (Chapter 5, Appendices) http://www.sepa.org.uk/water/river_basin_planning.aspx 25
Directive 91/676/EEC concerning the protection of waters against pollution caused by nitrates from agricultural sources. http://ec.europa.eu/environment/water/water-nitrates/directiv.html
0%
20%
40%
60%
80%
100%
% Good or Better (or equivalent) Scotland
Moray
Figure 5: Protected Area Water Bodies status
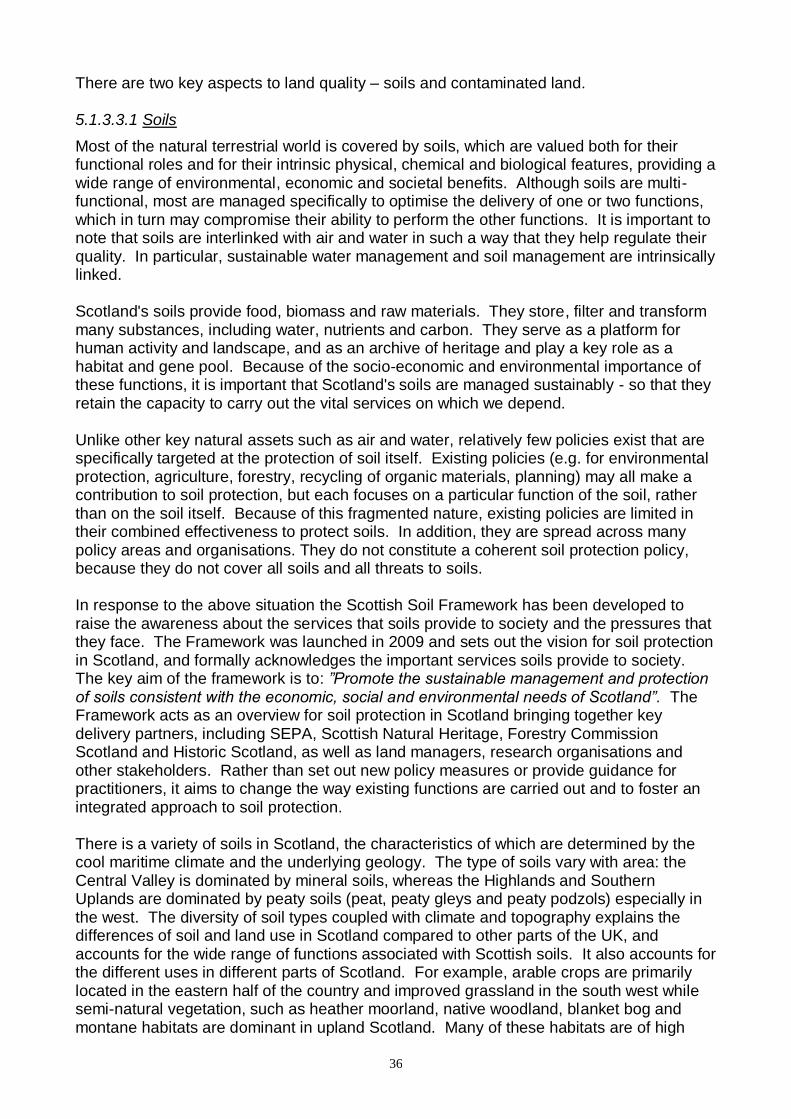
36
There are two key aspects to land quality – soils and contaminated land. 5.1.3.3.1 Soils
Most of the natural terrestrial world is covered by soils, which are valued both for their functional roles and for their intrinsic physical, chemical and biological features, providing a wide range of environmental, economic and societal benefits. Although soils are multi-functional, most are managed specifically to optimise the delivery of one or two functions, which in turn may compromise their ability to perform the other functions. It is important to note that soils are interlinked with air and water in such a way that they help regulate their quality. In particular, sustainable water management and soil management are intrinsically linked. Scotland's soils provide food, biomass and raw materials. They store, filter and transform many substances, including water, nutrients and carbon. They serve as a platform for human activity and landscape, and as an archive of heritage and play a key role as a habitat and gene pool. Because of the socio-economic and environmental importance of these functions, it is important that Scotland's soils are managed sustainably - so that they retain the capacity to carry out the vital services on which we depend. Unlike other key natural assets such as air and water, relatively few policies exist that are specifically targeted at the protection of soil itself. Existing policies (e.g. for environmental protection, agriculture, forestry, recycling of organic materials, planning) may all make a contribution to soil protection, but each focuses on a particular function of the soil, rather than on the soil itself. Because of this fragmented nature, existing policies are limited in their combined effectiveness to protect soils. In addition, they are spread across many policy areas and organisations. They do not constitute a coherent soil protection policy, because they do not cover all soils and all threats to soils. In response to the above situation the Scottish Soil Framework has been developed to raise the awareness about the services that soils provide to society and the pressures that they face. The Framework was launched in 2009 and sets out the vision for soil protection in Scotland, and formally acknowledges the important services soils provide to society. The key aim of the framework is to: ”Promote the sustainable management and protection of soils consistent with the economic, social and environmental needs of Scotland”. The Framework acts as an overview for soil protection in Scotland bringing together key delivery partners, including SEPA, Scottish Natural Heritage, Forestry Commission Scotland and Historic Scotland, as well as land managers, research organisations and other stakeholders. Rather than set out new policy measures or provide guidance for practitioners, it aims to change the way existing functions are carried out and to foster an integrated approach to soil protection. There is a variety of soils in Scotland, the characteristics of which are determined by the cool maritime climate and the underlying geology. The type of soils vary with area: the Central Valley is dominated by mineral soils, whereas the Highlands and Southern Uplands are dominated by peaty soils (peat, peaty gleys and peaty podzols) especially in the west. The diversity of soil types coupled with climate and topography explains the differences of soil and land use in Scotland compared to other parts of the UK, and accounts for the wide range of functions associated with Scottish soils. It also accounts for the different uses in different parts of Scotland. For example, arable crops are primarily located in the eastern half of the country and improved grassland in the south west while semi-natural vegetation, such as heather moorland, native woodland, blanket bog and montane habitats are dominant in upland Scotland. Many of these habitats are of high
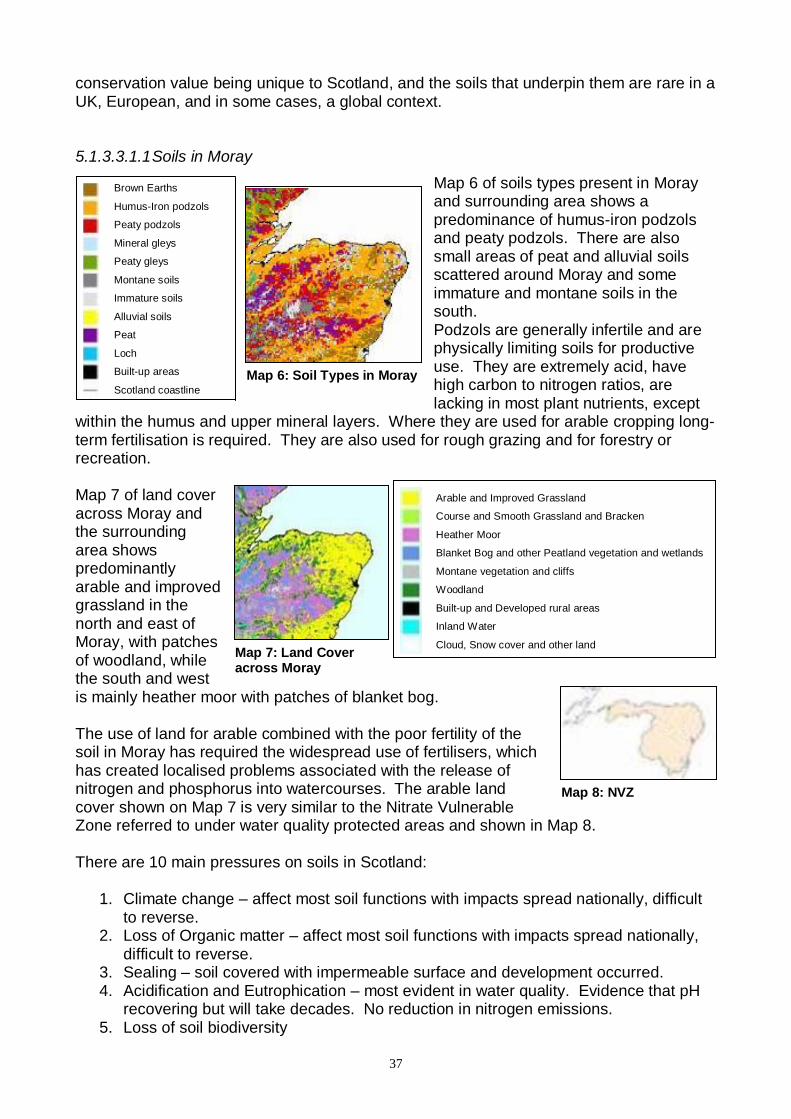
37
conservation value being unique to Scotland, and the soils that underpin them are rare in a UK, European, and in some cases, a global context. 5.1.3.3.1.1 Soils in Moray
Map 6 of soils types present in Moray and surrounding area shows a predominance of humus-iron podzols and peaty podzols. There are also small areas of peat and alluvial soils scattered around Moray and some immature and montane soils in the south. Podzols are generally infertile and are physically limiting soils for productive use. They are extremely acid, have high carbon to nitrogen ratios, are lacking in most plant nutrients, except
within the humus and upper mineral layers. Where they are used for arable cropping long-term fertilisation is required. They are also used for rough grazing and for forestry or recreation. Map 7 of land cover across Moray and the surrounding area shows predominantly arable and improved grassland in the north and east of Moray, with patches of woodland, while the south and west is mainly heather moor with patches of blanket bog. The use of land for arable combined with the poor fertility of the soil in Moray has required the widespread use of fertilisers, which has created localised problems associated with the release of nitrogen and phosphorus into watercourses. The arable land cover shown on Map 7 is very similar to the Nitrate Vulnerable Zone referred to under water quality protected areas and shown in Map 8. There are 10 main pressures on soils in Scotland:
1. Climate change – affect most soil functions with impacts spread nationally, difficult to reverse.
2. Loss of Organic matter – affect most soil functions with impacts spread nationally, difficult to reverse.
3. Sealing – soil covered with impermeable surface and development occurred. 4. Acidification and Eutrophication – most evident in water quality. Evidence that pH
recovering but will take decades. No reduction in nitrogen emissions. 5. Loss of soil biodiversity
Brown Earths
Humus-Iron podzols
Peaty podzols
Mineral gleys
Peaty gleys
Montane soils
Immature soils
Alluvial soils
Peat
Loch
Built-up areas
Scotland coastline
Map 6: Soil Types in Moray
Arable and Improved Grassland
Course and Smooth Grassland and Bracken
Heather Moor
Blanket Bog and other Peatland vegetation and wetlands
Montane vegetation and cliffs
Woodland
Built-up and Developed rural areas
Inland Water
Cloud, Snow cover and other land Map 7: Land Cover across Moray
Map 8: NVZ
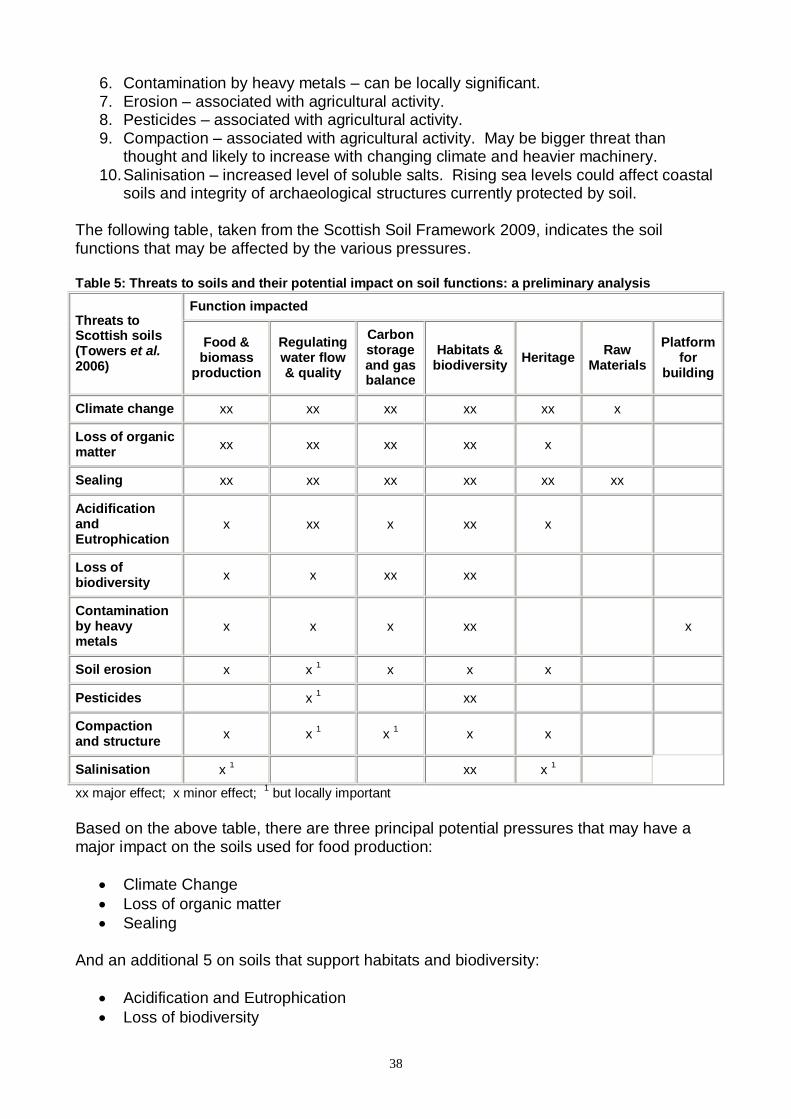
38
6. Contamination by heavy metals – can be locally significant. 7. Erosion – associated with agricultural activity. 8. Pesticides – associated with agricultural activity. 9. Compaction – associated with agricultural activity. May be bigger threat than
thought and likely to increase with changing climate and heavier machinery. 10. Salinisation – increased level of soluble salts. Rising sea levels could affect coastal
soils and integrity of archaeological structures currently protected by soil. The following table, taken from the Scottish Soil Framework 2009, indicates the soil functions that may be affected by the various pressures. Table 5: Threats to soils and their potential impact on soil functions: a preliminary analysis
Threats to Scottish soils (Towers et al. 2006)
Function impacted
Food & biomass
production
Regulating water flow & quality
Carbon storage and gas balance
Habitats & biodiversity
Heritage Raw
Materials
Platform for
building
Climate change xx xx xx xx xx x
Loss of organic matter
xx xx xx xx x
Sealing xx xx xx xx xx xx
Acidification and Eutrophication
x xx x xx x
Loss of biodiversity
x x xx xx
Contamination by heavy metals
x x x xx
x
Soil erosion x x 1 x x x
Pesticides
x 1
xx
Compaction and structure
x x 1 x
1 x x
Salinisation x 1
xx x
1
xx major effect; x minor effect;
1 but locally important
Based on the above table, there are three principal potential pressures that may have a major impact on the soils used for food production:
Climate Change
Loss of organic matter
Sealing And an additional 5 on soils that support habitats and biodiversity:
Acidification and Eutrophication
Loss of biodiversity
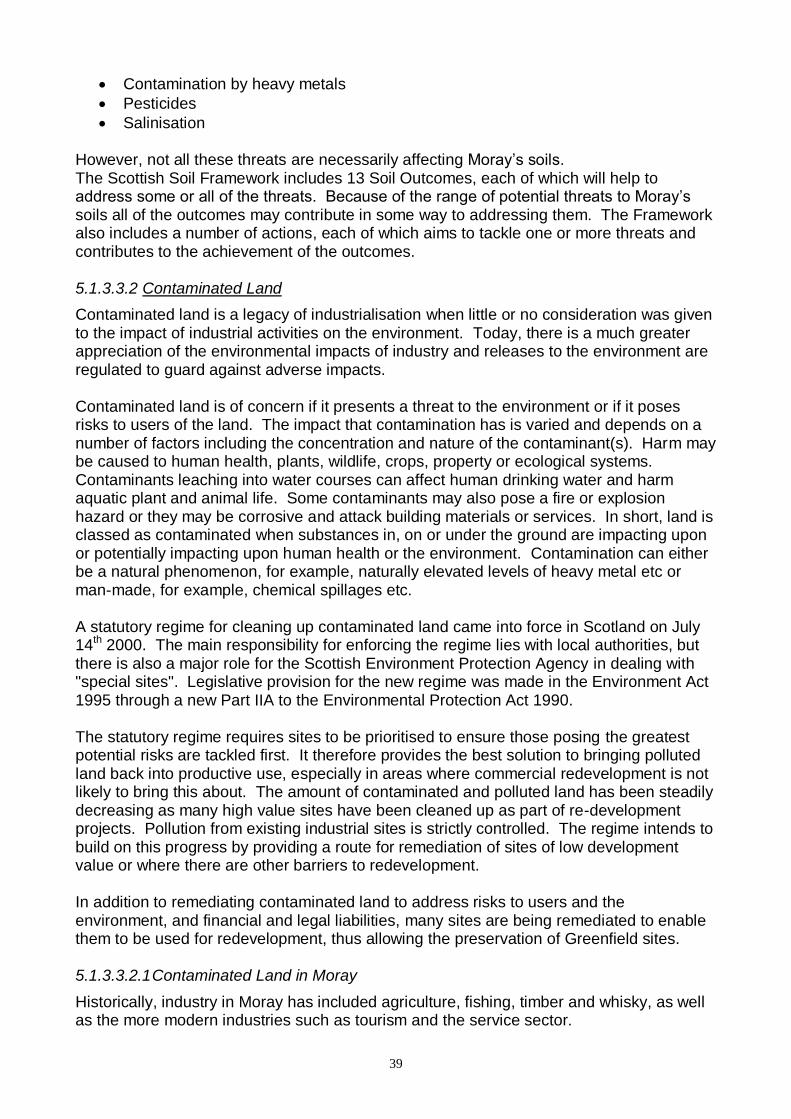
39
Contamination by heavy metals
Pesticides
Salinisation However, not all these threats are necessarily affecting Moray‘s soils. The Scottish Soil Framework includes 13 Soil Outcomes, each of which will help to address some or all of the threats. Because of the range of potential threats to Moray‘s soils all of the outcomes may contribute in some way to addressing them. The Framework also includes a number of actions, each of which aims to tackle one or more threats and contributes to the achievement of the outcomes. 5.1.3.3.2 Contaminated Land
Contaminated land is a legacy of industrialisation when little or no consideration was given to the impact of industrial activities on the environment. Today, there is a much greater appreciation of the environmental impacts of industry and releases to the environment are regulated to guard against adverse impacts. Contaminated land is of concern if it presents a threat to the environment or if it poses risks to users of the land. The impact that contamination has is varied and depends on a number of factors including the concentration and nature of the contaminant(s). Harm may be caused to human health, plants, wildlife, crops, property or ecological systems. Contaminants leaching into water courses can affect human drinking water and harm aquatic plant and animal life. Some contaminants may also pose a fire or explosion hazard or they may be corrosive and attack building materials or services. In short, land is classed as contaminated when substances in, on or under the ground are impacting upon or potentially impacting upon human health or the environment. Contamination can either be a natural phenomenon, for example, naturally elevated levels of heavy metal etc or man-made, for example, chemical spillages etc. A statutory regime for cleaning up contaminated land came into force in Scotland on July 14th 2000. The main responsibility for enforcing the regime lies with local authorities, but there is also a major role for the Scottish Environment Protection Agency in dealing with "special sites". Legislative provision for the new regime was made in the Environment Act 1995 through a new Part IIA to the Environmental Protection Act 1990. The statutory regime requires sites to be prioritised to ensure those posing the greatest potential risks are tackled first. It therefore provides the best solution to bringing polluted land back into productive use, especially in areas where commercial redevelopment is not likely to bring this about. The amount of contaminated and polluted land has been steadily decreasing as many high value sites have been cleaned up as part of re-development projects. Pollution from existing industrial sites is strictly controlled. The regime intends to build on this progress by providing a route for remediation of sites of low development value or where there are other barriers to redevelopment. In addition to remediating contaminated land to address risks to users and the environment, and financial and legal liabilities, many sites are being remediated to enable them to be used for redevelopment, thus allowing the preservation of Greenfield sites. 5.1.3.3.2.1 Contaminated Land in Moray
Historically, industry in Moray has included agriculture, fishing, timber and whisky, as well as the more modern industries such as tourism and the service sector.
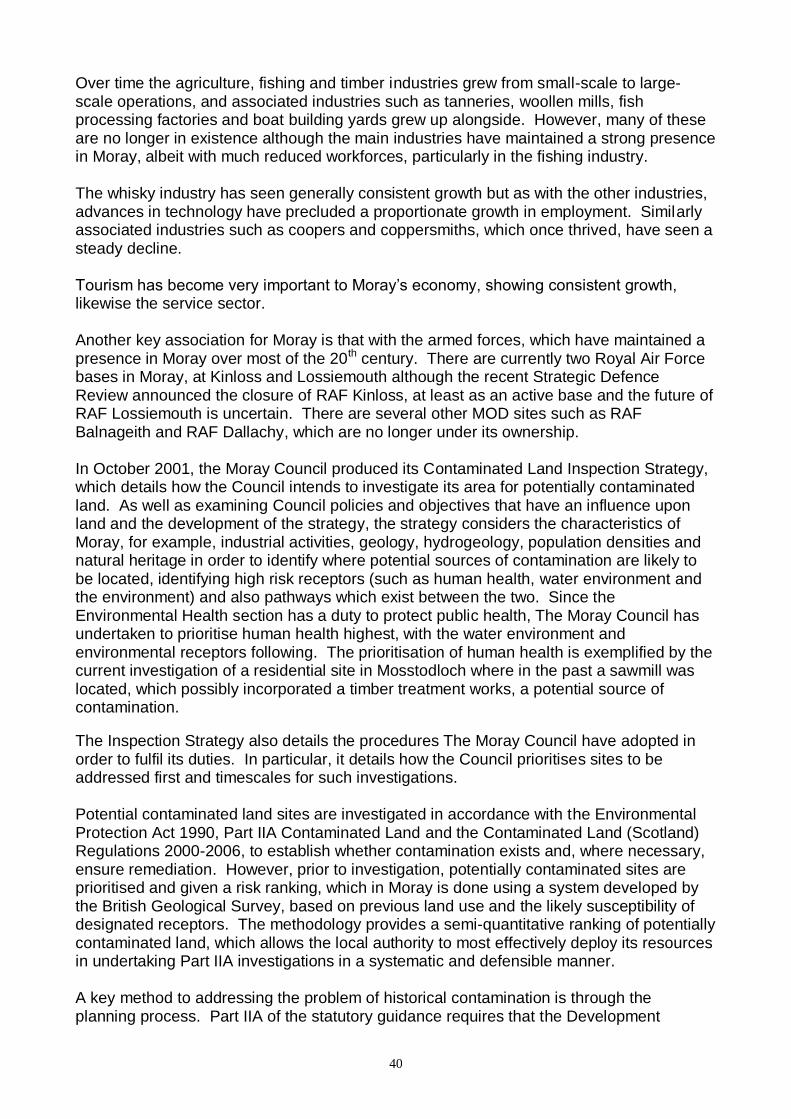
40
Over time the agriculture, fishing and timber industries grew from small-scale to large-scale operations, and associated industries such as tanneries, woollen mills, fish processing factories and boat building yards grew up alongside. However, many of these are no longer in existence although the main industries have maintained a strong presence in Moray, albeit with much reduced workforces, particularly in the fishing industry. The whisky industry has seen generally consistent growth but as with the other industries, advances in technology have precluded a proportionate growth in employment. Similarly associated industries such as coopers and coppersmiths, which once thrived, have seen a steady decline. Tourism has become very important to Moray‘s economy, showing consistent growth, likewise the service sector. Another key association for Moray is that with the armed forces, which have maintained a presence in Moray over most of the 20th century. There are currently two Royal Air Force bases in Moray, at Kinloss and Lossiemouth although the recent Strategic Defence Review announced the closure of RAF Kinloss, at least as an active base and the future of RAF Lossiemouth is uncertain. There are several other MOD sites such as RAF Balnageith and RAF Dallachy, which are no longer under its ownership. In October 2001, the Moray Council produced its Contaminated Land Inspection Strategy, which details how the Council intends to investigate its area for potentially contaminated land. As well as examining Council policies and objectives that have an influence upon land and the development of the strategy, the strategy considers the characteristics of Moray, for example, industrial activities, geology, hydrogeology, population densities and natural heritage in order to identify where potential sources of contamination are likely to be located, identifying high risk receptors (such as human health, water environment and the environment) and also pathways which exist between the two. Since the Environmental Health section has a duty to protect public health, The Moray Council has undertaken to prioritise human health highest, with the water environment and environmental receptors following. The prioritisation of human health is exemplified by the current investigation of a residential site in Mosstodloch where in the past a sawmill was located, which possibly incorporated a timber treatment works, a potential source of contamination.
The Inspection Strategy also details the procedures The Moray Council have adopted in order to fulfil its duties. In particular, it details how the Council prioritises sites to be addressed first and timescales for such investigations. Potential contaminated land sites are investigated in accordance with the Environmental Protection Act 1990, Part IIA Contaminated Land and the Contaminated Land (Scotland) Regulations 2000-2006, to establish whether contamination exists and, where necessary, ensure remediation. However, prior to investigation, potentially contaminated sites are prioritised and given a risk ranking, which in Moray is done using a system developed by the British Geological Survey, based on previous land use and the likely susceptibility of designated receptors. The methodology provides a semi-quantitative ranking of potentially contaminated land, which allows the local authority to most effectively deploy its resources
in undertaking Part IIA investigations in a systematic and defensible manner. A key method to addressing the problem of historical contamination is through the planning process. Part IIA of the statutory guidance requires that the Development
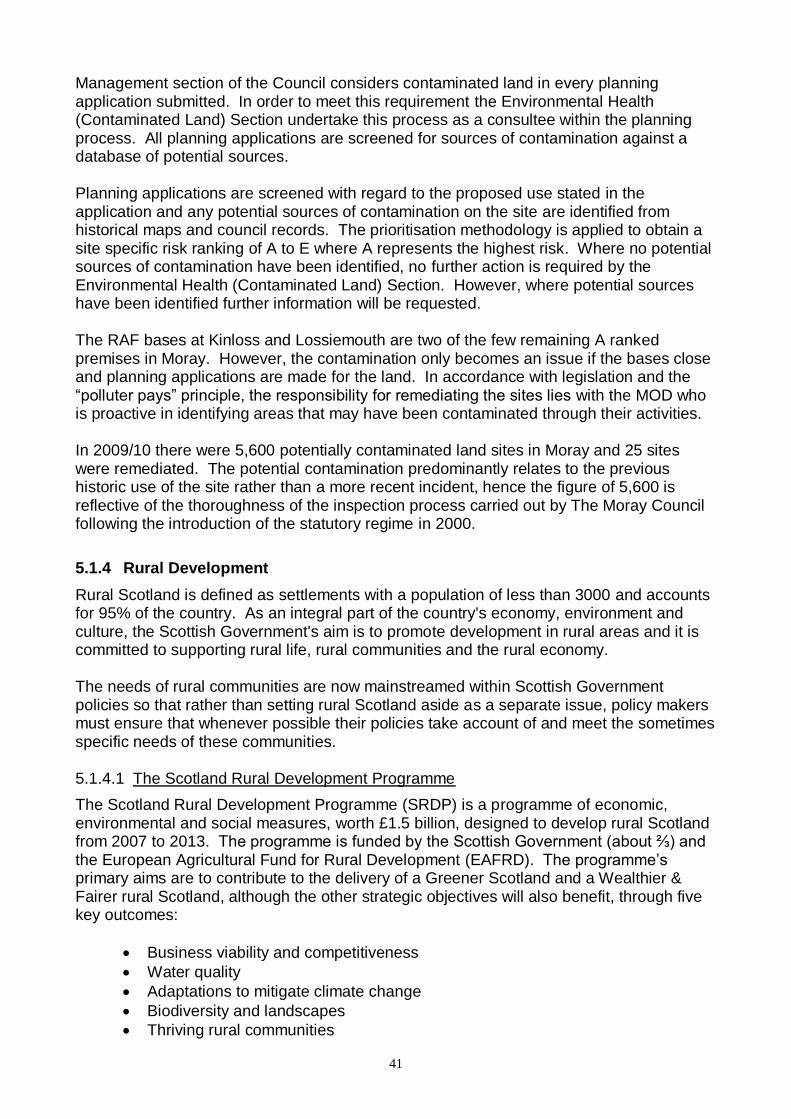
41
Management section of the Council considers contaminated land in every planning application submitted. In order to meet this requirement the Environmental Health (Contaminated Land) Section undertake this process as a consultee within the planning process. All planning applications are screened for sources of contamination against a database of potential sources. Planning applications are screened with regard to the proposed use stated in the application and any potential sources of contamination on the site are identified from historical maps and council records. The prioritisation methodology is applied to obtain a site specific risk ranking of A to E where A represents the highest risk. Where no potential sources of contamination have been identified, no further action is required by the Environmental Health (Contaminated Land) Section. However, where potential sources have been identified further information will be requested. The RAF bases at Kinloss and Lossiemouth are two of the few remaining A ranked premises in Moray. However, the contamination only becomes an issue if the bases close and planning applications are made for the land. In accordance with legislation and the ―polluter pays‖ principle, the responsibility for remediating the sites lies with the MOD who is proactive in identifying areas that may have been contaminated through their activities. In 2009/10 there were 5,600 potentially contaminated land sites in Moray and 25 sites were remediated. The potential contamination predominantly relates to the previous historic use of the site rather than a more recent incident, hence the figure of 5,600 is reflective of the thoroughness of the inspection process carried out by The Moray Council following the introduction of the statutory regime in 2000.
5.1.4 Rural Development
Rural Scotland is defined as settlements with a population of less than 3000 and accounts for 95% of the country. As an integral part of the country's economy, environment and culture, the Scottish Government's aim is to promote development in rural areas and it is committed to supporting rural life, rural communities and the rural economy. The needs of rural communities are now mainstreamed within Scottish Government policies so that rather than setting rural Scotland aside as a separate issue, policy makers must ensure that whenever possible their policies take account of and meet the sometimes specific needs of these communities. 5.1.4.1 The Scotland Rural Development Programme
The Scotland Rural Development Programme (SRDP) is a programme of economic, environmental and social measures, worth £1.5 billion, designed to develop rural Scotland from 2007 to 2013. The programme is funded by the Scottish Government (about ⅔) and the European Agricultural Fund for Rural Development (EAFRD). The programme‘s primary aims are to contribute to the delivery of a Greener Scotland and a Wealthier & Fairer rural Scotland, although the other strategic objectives will also benefit, through five key outcomes:
Business viability and competitiveness
Water quality
Adaptations to mitigate climate change
Biodiversity and landscapes
Thriving rural communities
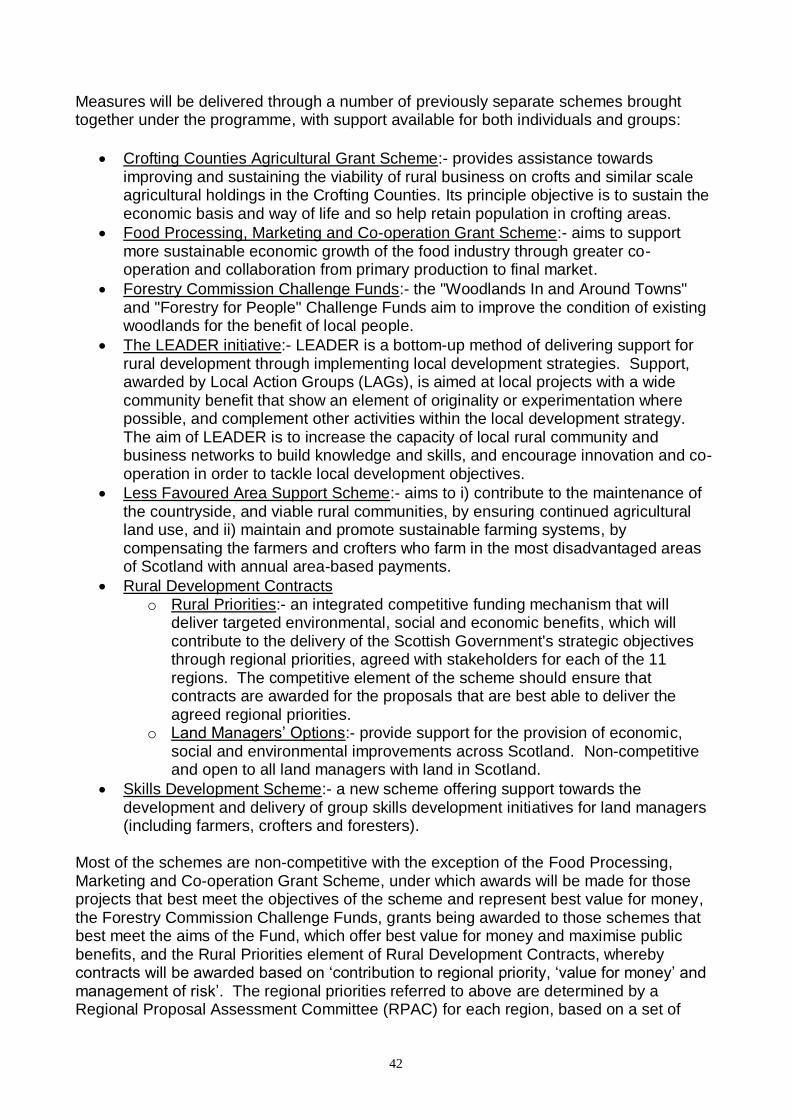
42
Measures will be delivered through a number of previously separate schemes brought together under the programme, with support available for both individuals and groups:
Crofting Counties Agricultural Grant Scheme:- provides assistance towards improving and sustaining the viability of rural business on crofts and similar scale agricultural holdings in the Crofting Counties. Its principle objective is to sustain the economic basis and way of life and so help retain population in crofting areas.
Food Processing, Marketing and Co-operation Grant Scheme:- aims to support more sustainable economic growth of the food industry through greater co-operation and collaboration from primary production to final market.
Forestry Commission Challenge Funds:- the "Woodlands In and Around Towns" and "Forestry for People" Challenge Funds aim to improve the condition of existing woodlands for the benefit of local people.
The LEADER initiative:- LEADER is a bottom-up method of delivering support for rural development through implementing local development strategies. Support, awarded by Local Action Groups (LAGs), is aimed at local projects with a wide community benefit that show an element of originality or experimentation where possible, and complement other activities within the local development strategy. The aim of LEADER is to increase the capacity of local rural community and business networks to build knowledge and skills, and encourage innovation and co-operation in order to tackle local development objectives.
Less Favoured Area Support Scheme:- aims to i) contribute to the maintenance of the countryside, and viable rural communities, by ensuring continued agricultural land use, and ii) maintain and promote sustainable farming systems, by compensating the farmers and crofters who farm in the most disadvantaged areas of Scotland with annual area-based payments.
Rural Development Contracts o Rural Priorities:- an integrated competitive funding mechanism that will
deliver targeted environmental, social and economic benefits, which will contribute to the delivery of the Scottish Government's strategic objectives through regional priorities, agreed with stakeholders for each of the 11 regions. The competitive element of the scheme should ensure that contracts are awarded for the proposals that are best able to deliver the agreed regional priorities.
o Land Managers‘ Options:- provide support for the provision of economic, social and environmental improvements across Scotland. Non-competitive and open to all land managers with land in Scotland.
Skills Development Scheme:- a new scheme offering support towards the development and delivery of group skills development initiatives for land managers (including farmers, crofters and foresters).
Most of the schemes are non-competitive with the exception of the Food Processing, Marketing and Co-operation Grant Scheme, under which awards will be made for those projects that best meet the objectives of the scheme and represent best value for money, the Forestry Commission Challenge Funds, grants being awarded to those schemes that best meet the aims of the Fund, which offer best value for money and maximise public benefits, and the Rural Priorities element of Rural Development Contracts, whereby contracts will be awarded based on ‗contribution to regional priority, ‗value for money‘ and management of risk‘. The regional priorities referred to above are determined by a Regional Proposal Assessment Committee (RPAC) for each region, based on a set of
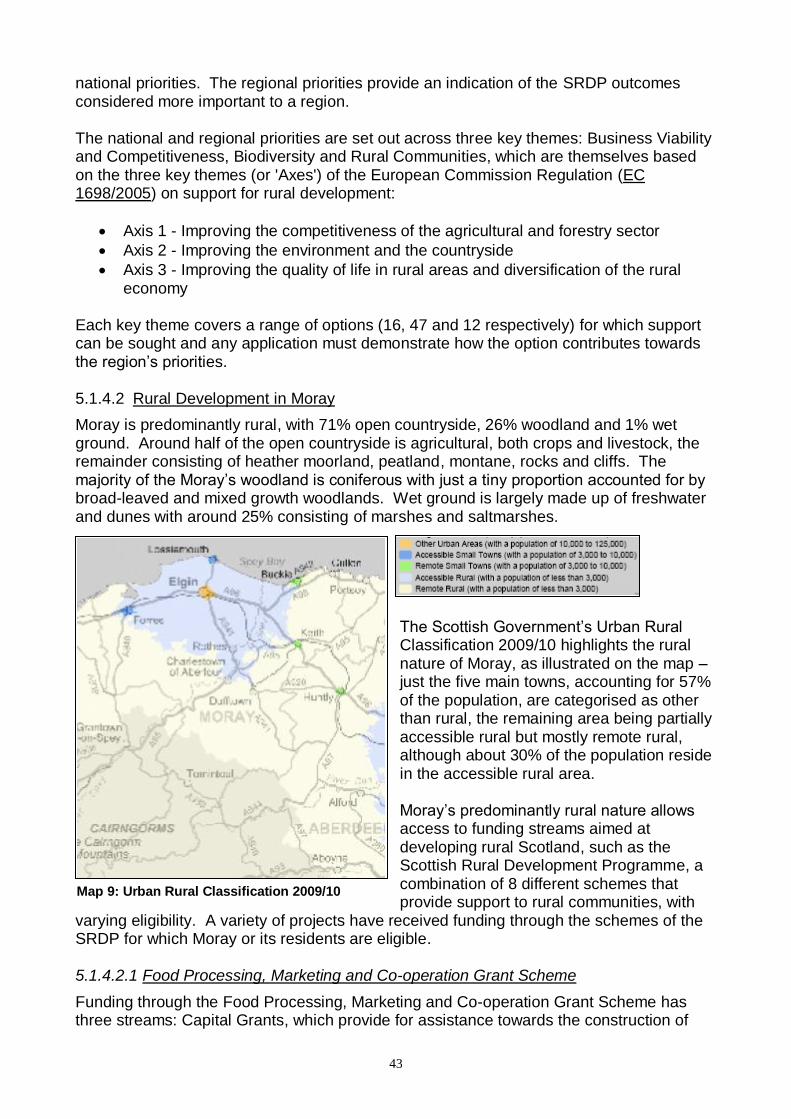
43
national priorities. The regional priorities provide an indication of the SRDP outcomes considered more important to a region. The national and regional priorities are set out across three key themes: Business Viability and Competitiveness, Biodiversity and Rural Communities, which are themselves based on the three key themes (or 'Axes') of the European Commission Regulation (EC 1698/2005) on support for rural development:
Axis 1 - Improving the competitiveness of the agricultural and forestry sector
Axis 2 - Improving the environment and the countryside
Axis 3 - Improving the quality of life in rural areas and diversification of the rural economy
Each key theme covers a range of options (16, 47 and 12 respectively) for which support can be sought and any application must demonstrate how the option contributes towards the region‘s priorities. 5.1.4.2 Rural Development in Moray
Moray is predominantly rural, with 71% open countryside, 26% woodland and 1% wet ground. Around half of the open countryside is agricultural, both crops and livestock, the remainder consisting of heather moorland, peatland, montane, rocks and cliffs. The majority of the Moray‘s woodland is coniferous with just a tiny proportion accounted for by broad-leaved and mixed growth woodlands. Wet ground is largely made up of freshwater and dunes with around 25% consisting of marshes and saltmarshes.
The Scottish Government‘s Urban Rural Classification 2009/10 highlights the rural nature of Moray, as illustrated on the map – just the five main towns, accounting for 57% of the population, are categorised as other than rural, the remaining area being partially accessible rural but mostly remote rural, although about 30% of the population reside in the accessible rural area. Moray‘s predominantly rural nature allows access to funding streams aimed at developing rural Scotland, such as the Scottish Rural Development Programme, a combination of 8 different schemes that provide support to rural communities, with
varying eligibility. A variety of projects have received funding through the schemes of the SRDP for which Moray or its residents are eligible. 5.1.4.2.1 Food Processing, Marketing and Co-operation Grant Scheme
Funding through the Food Processing, Marketing and Co-operation Grant Scheme has three streams: Capital Grants, which provide for assistance towards the construction of
Map 9: Urban Rural Classification 2009/10
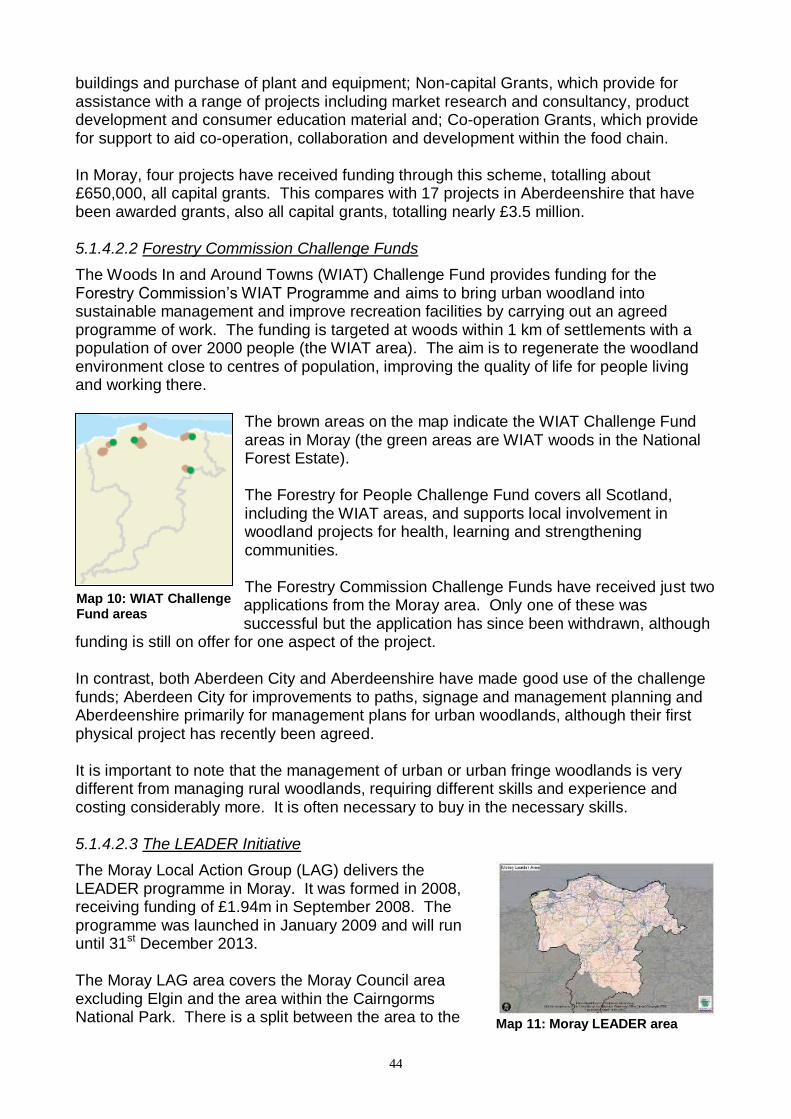
44
buildings and purchase of plant and equipment; Non-capital Grants, which provide for assistance with a range of projects including market research and consultancy, product development and consumer education material and; Co-operation Grants, which provide for support to aid co-operation, collaboration and development within the food chain. In Moray, four projects have received funding through this scheme, totalling about £650,000, all capital grants. This compares with 17 projects in Aberdeenshire that have been awarded grants, also all capital grants, totalling nearly £3.5 million. 5.1.4.2.2 Forestry Commission Challenge Funds
The Woods In and Around Towns (WIAT) Challenge Fund provides funding for the Forestry Commission‘s WIAT Programme and aims to bring urban woodland into sustainable management and improve recreation facilities by carrying out an agreed programme of work. The funding is targeted at woods within 1 km of settlements with a population of over 2000 people (the WIAT area). The aim is to regenerate the woodland environment close to centres of population, improving the quality of life for people living and working there.
The brown areas on the map indicate the WIAT Challenge Fund areas in Moray (the green areas are WIAT woods in the National Forest Estate). The Forestry for People Challenge Fund covers all Scotland, including the WIAT areas, and supports local involvement in woodland projects for health, learning and strengthening communities. The Forestry Commission Challenge Funds have received just two applications from the Moray area. Only one of these was successful but the application has since been withdrawn, although
funding is still on offer for one aspect of the project. In contrast, both Aberdeen City and Aberdeenshire have made good use of the challenge funds; Aberdeen City for improvements to paths, signage and management planning and Aberdeenshire primarily for management plans for urban woodlands, although their first physical project has recently been agreed. It is important to note that the management of urban or urban fringe woodlands is very different from managing rural woodlands, requiring different skills and experience and costing considerably more. It is often necessary to buy in the necessary skills. 5.1.4.2.3 The LEADER Initiative
The Moray Local Action Group (LAG) delivers the LEADER programme in Moray. It was formed in 2008, receiving funding of £1.94m in September 2008. The programme was launched in January 2009 and will run until 31st December 2013. The Moray LAG area covers the Moray Council area excluding Elgin and the area within the Cairngorms National Park. There is a split between the area to the
Map 10: WIAT Challenge Fund areas
Map 11: Moray LEADER area
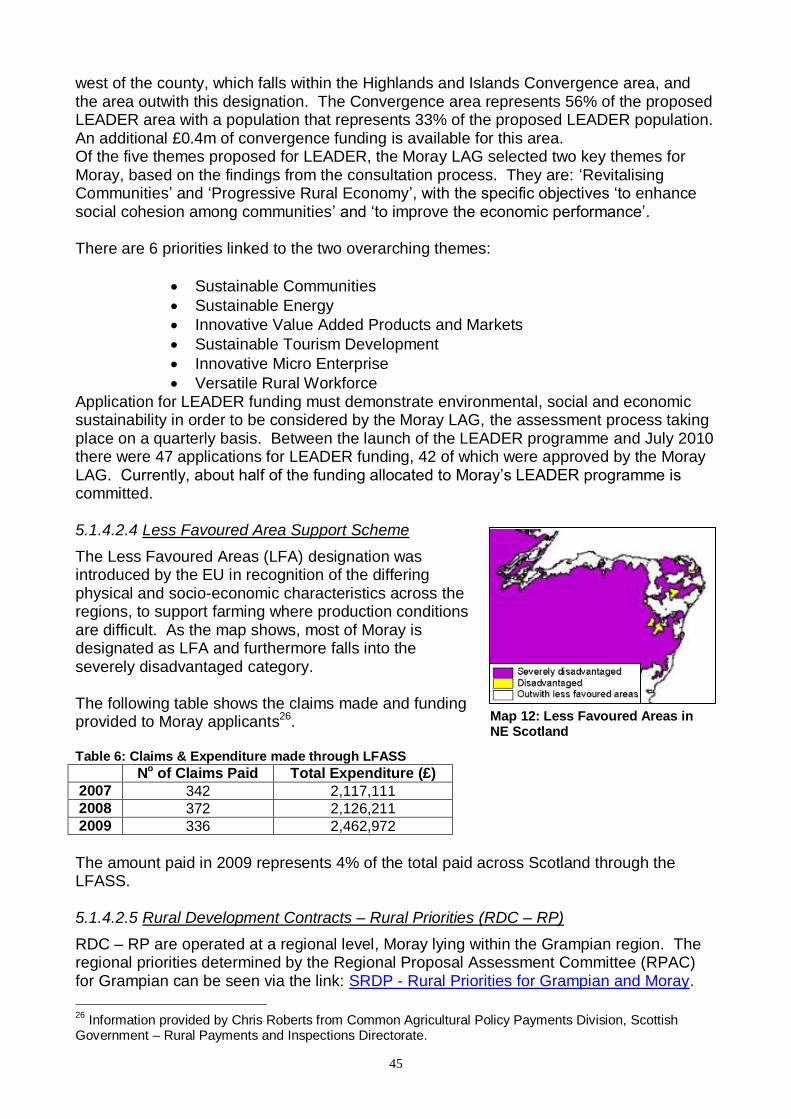
45
west of the county, which falls within the Highlands and Islands Convergence area, and the area outwith this designation. The Convergence area represents 56% of the proposed LEADER area with a population that represents 33% of the proposed LEADER population. An additional £0.4m of convergence funding is available for this area. Of the five themes proposed for LEADER, the Moray LAG selected two key themes for Moray, based on the findings from the consultation process. They are: ‗Revitalising Communities‘ and ‗Progressive Rural Economy‘, with the specific objectives ‗to enhance social cohesion among communities‘ and ‗to improve the economic performance‘. There are 6 priorities linked to the two overarching themes:
Sustainable Communities
Sustainable Energy
Innovative Value Added Products and Markets
Sustainable Tourism Development
Innovative Micro Enterprise
Versatile Rural Workforce Application for LEADER funding must demonstrate environmental, social and economic sustainability in order to be considered by the Moray LAG, the assessment process taking place on a quarterly basis. Between the launch of the LEADER programme and July 2010 there were 47 applications for LEADER funding, 42 of which were approved by the Moray LAG. Currently, about half of the funding allocated to Moray‘s LEADER programme is committed. 5.1.4.2.4 Less Favoured Area Support Scheme
The Less Favoured Areas (LFA) designation was introduced by the EU in recognition of the differing physical and socio-economic characteristics across the regions, to support farming where production conditions are difficult. As the map shows, most of Moray is designated as LFA and furthermore falls into the severely disadvantaged category. The following table shows the claims made and funding provided to Moray applicants26. Table 6: Claims & Expenditure made through LFASS
No of Claims Paid Total Expenditure (£)
2007 342 2,117,111
2008 372 2,126,211
2009 336 2,462,972
The amount paid in 2009 represents 4% of the total paid across Scotland through the LFASS. 5.1.4.2.5 Rural Development Contracts – Rural Priorities (RDC – RP)
RDC – RP are operated at a regional level, Moray lying within the Grampian region. The regional priorities determined by the Regional Proposal Assessment Committee (RPAC) for Grampian can be seen via the link: SRDP - Rural Priorities for Grampian and Moray.
26
Information provided by Chris Roberts from Common Agricultural Policy Payments Division, Scottish Government – Rural Payments and Inspections Directorate.
Map 12: Less Favoured Areas in NE Scotland
46
The total funding for finalised contracts in the Grampian region to 30th August 2010 amounts to nearly £64m. In Moray, £12,607,318 of funding (20% of the Grampian total) has been approved since 2008, providing support for 216 projects27. The following is an example project approved under Rural Priorities for Moray:
―An agricultural partnership in Fochabers, which specialises in organic produce, will receive £97,903 to maintain organic production on the farm. Plans include planting over 4,000 metres of hedgerows on the land to protect vital local biodiversity and enhance biosecurity between neighbouring farms, helping to prevent the outbreak of disease. As well as maximising business viability the funding will protect the welfare of animals on the farm and enhances the environment, providing significant pollution control, energy efficiency and soil protection benefits. In addition it will contribute to the overall aim to develop the organic production sector in Scotland and meet the increasing consumer demand for organic products‖.
5.1.4.2.6 Rural Development Contracts – Land Managers Options (RDC – LMO)
Land Managers Options (LMO) provide support for the provision of economic, social and environmental improvements across Scotland. Land managers can apply for funding for a range of options under LMO up to a maximum allowance for the business. Some options require a five year commitment and compliance with Good Agricultural and Environmental Conditions and Statutory Management Requirements while others are for one year. As with RDC – RP, there are a number of options available through the scheme, divided between the three axes: Improving the competitiveness of the agricultural and forestry sector; Improving the environment and the countryside; Improving the quality of life in rural areas and diversification of the rural economy. In total there are 21 options for which support can be applied. It is possible to apply for support for two or more options for land management of the same piece of land as long as the options are compatible. All the schemes joined can run alongside each other, but payment cannot be made under more than one scheme for the same land if the Options are not compatible. The following table shows the number of applications made for Moray and the total value of those applications. Table 7: Number & Value of Applications for Land Managers' Options
Applications Value of Applications
2008 162 £180,000
2009 377 £302,000
2010 430 £676,000
5.1.4.2.7 Skills Development Scheme
This scheme provides an opportunity to secure a contribution towards the funding of new initiatives aimed at improving land managers' business or countryside management skills. It is aimed at bodies that represent farming, forestry and other land management industries, or are closely involved with promoting the development of land and business management skills within these industries. There have been 28 awards made under the scheme to October 2010, sixteen of which are national schemes. The only Moray-specific SDS project is a 3yr project begun in November 2009 by Quality Meat Scotland (QMS) to establish a new Monitor Farm in the Moray and Nairn area. The total value of the awards made to national schemes is £1.7m,
27
Ibid
47
representing 62% of the eligible costs for the schemes. The Moray-specific scheme received £58,900 representing 69% of the total eligible costs.
5.2 Built Environment
“The term built environment refers to the human-made surroundings that provide the setting for human activity, ranging in scale from personal shelter and buildings to neighbourhoods and cities that can often include their supporting infrastructure, such as water supply or energy networks. The built environment is a material, spatial and cultural product of human labor that combines physical elements and energy in forms necessary for living, working and playing.” [23]
It encompasses various disciplines including the design, construction, management and use of these man-made surroundings. Urban areas occupy less than 6% of the land area of Scotland but accommodate more than 80% of the population [24]. However there have been considerable changes in Scotland‘s built environment over the last 50 years. In the main population centres contributory factors include the demise of heavy industry, the reclamation of derelict industrial infrastructure, the expansion of the road network, the rapid growth of suburban housing development, the establishment of new towns and the expansion of small villages and scattered housing in the city hinterlands. In more rural areas, the main causes of changes in the built environment include the upgrading of roads, the development of large-scale hydro-electricity schemes, the trend towards ―kit‖ houses and in coastal areas, the development of fish farming. The outskirts of settlements have seen the replacement of agricultural land with housing and business park developments with the result that the area around many towns and cities is becoming similar in character. With the establishment of tourism as a major industry, the development of recreation and leisure facilities has increased, for example in relation to the skiing industry, visitor centres, waymarked walking routes and golf courses. More recently the expansion of the communications industry has led to developments, which by necessity, are prominently sited, and the continuing growth of the renewable energy industry is having a dramatic effect on some of Scotland‘s landscapes. According to mid-year population estimates 2008, Scotland has 494 settlements with a population of 500 or more. The most populous centre is Glasgow, which has a population of over 1 million. There are three centres with a population of between 100,000 and 999,999, namely Edinburgh, Aberdeen and Dundee, and 53 with a population of between 10,000 and 99,999. 303 centres have a population of between 1,000 and 9,999 while the remainder have populations of between 500 and 999.
5.2.1 Moray’s Built Environment
Moray is primarily a rural authority, developed land accounting for just 2% of its area. More than half of the overall development is urban and the majority of both urban and rural development is residential. However along river routes distilleries are a prominent feature as is industrial and commercial development within the main towns of Elgin, Forres, Buckie, Keith and Lossiemouth [22]. Moray‘s primary centre is Elgin with a population of about 21,000. It is the main centre for retail, commercial and leisure provision. There are four secondary centres of Forres, population 9,500, Buckie, population 8,000, Lossiemouth, population 6,500, and Keith, population 4,500. There are 28 smaller towns and villages, 10 of which have a population
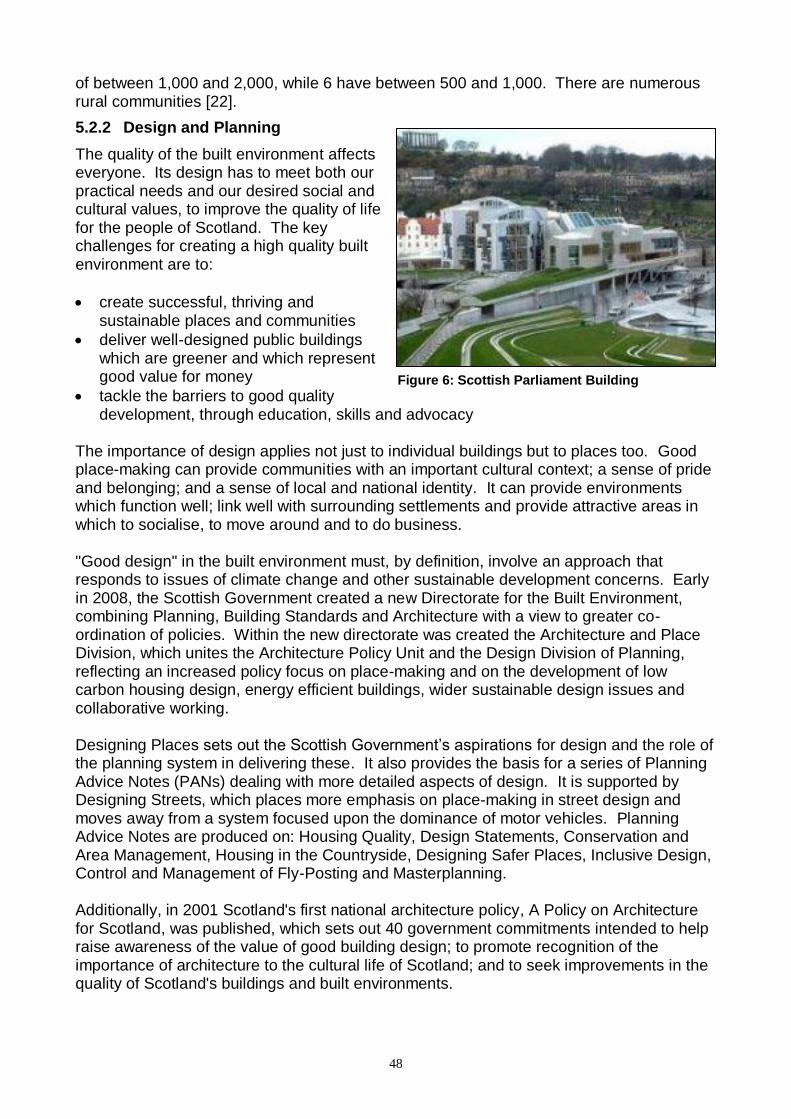
48
of between 1,000 and 2,000, while 6 have between 500 and 1,000. There are numerous rural communities [22].
5.2.2 Design and Planning
The quality of the built environment affects everyone. Its design has to meet both our practical needs and our desired social and cultural values, to improve the quality of life for the people of Scotland. The key challenges for creating a high quality built environment are to:
create successful, thriving and sustainable places and communities
deliver well-designed public buildings which are greener and which represent good value for money
tackle the barriers to good quality development, through education, skills and advocacy
The importance of design applies not just to individual buildings but to places too. Good place-making can provide communities with an important cultural context; a sense of pride and belonging; and a sense of local and national identity. It can provide environments which function well; link well with surrounding settlements and provide attractive areas in which to socialise, to move around and to do business. "Good design" in the built environment must, by definition, involve an approach that responds to issues of climate change and other sustainable development concerns. Early in 2008, the Scottish Government created a new Directorate for the Built Environment, combining Planning, Building Standards and Architecture with a view to greater co-ordination of policies. Within the new directorate was created the Architecture and Place Division, which unites the Architecture Policy Unit and the Design Division of Planning, reflecting an increased policy focus on place-making and on the development of low carbon housing design, energy efficient buildings, wider sustainable design issues and collaborative working. Designing Places sets out the Scottish Government‘s aspirations for design and the role of the planning system in delivering these. It also provides the basis for a series of Planning Advice Notes (PANs) dealing with more detailed aspects of design. It is supported by Designing Streets, which places more emphasis on place-making in street design and moves away from a system focused upon the dominance of motor vehicles. Planning Advice Notes are produced on: Housing Quality, Design Statements, Conservation and Area Management, Housing in the Countryside, Designing Safer Places, Inclusive Design, Control and Management of Fly-Posting and Masterplanning. Additionally, in 2001 Scotland's first national architecture policy, A Policy on Architecture for Scotland, was published, which sets out 40 government commitments intended to help raise awareness of the value of good building design; to promote recognition of the importance of architecture to the cultural life of Scotland; and to seek improvements in the quality of Scotland's buildings and built environments.
Figure 6: Scottish Parliament Building
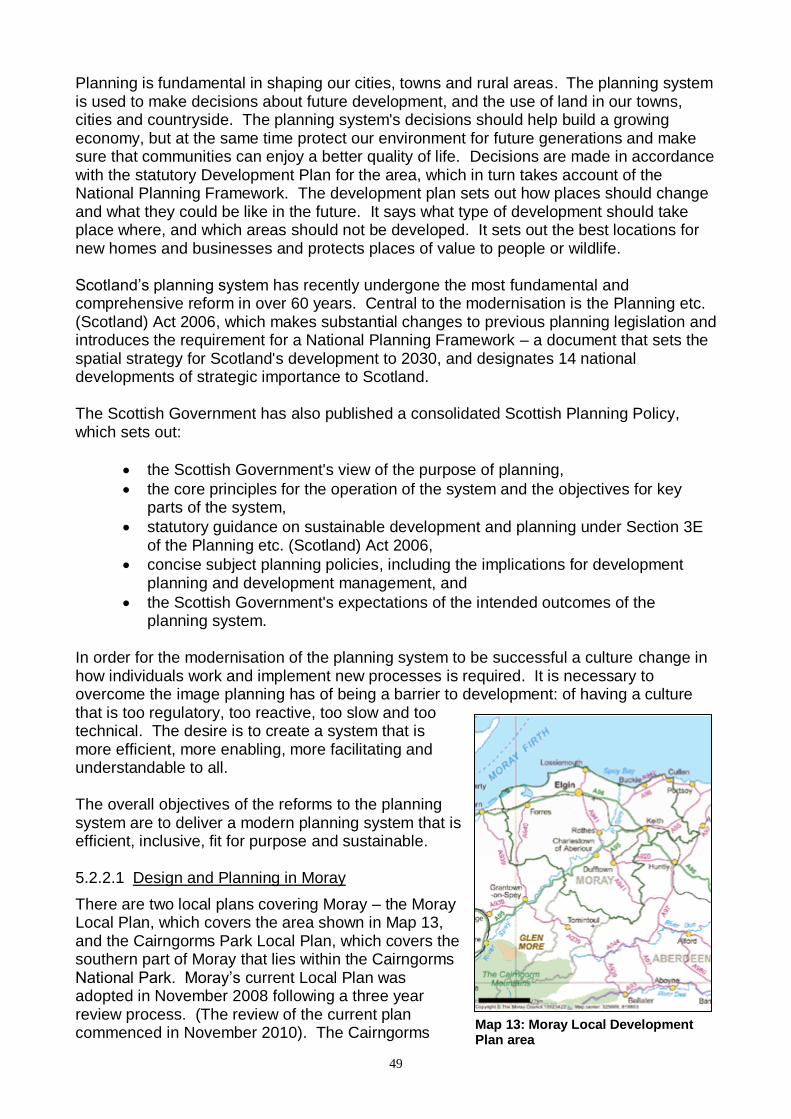
49
Planning is fundamental in shaping our cities, towns and rural areas. The planning system is used to make decisions about future development, and the use of land in our towns, cities and countryside. The planning system's decisions should help build a growing economy, but at the same time protect our environment for future generations and make sure that communities can enjoy a better quality of life. Decisions are made in accordance with the statutory Development Plan for the area, which in turn takes account of the National Planning Framework. The development plan sets out how places should change and what they could be like in the future. It says what type of development should take place where, and which areas should not be developed. It sets out the best locations for new homes and businesses and protects places of value to people or wildlife. Scotland‘s planning system has recently undergone the most fundamental and comprehensive reform in over 60 years. Central to the modernisation is the Planning etc. (Scotland) Act 2006, which makes substantial changes to previous planning legislation and introduces the requirement for a National Planning Framework – a document that sets the spatial strategy for Scotland's development to 2030, and designates 14 national developments of strategic importance to Scotland. The Scottish Government has also published a consolidated Scottish Planning Policy, which sets out:
the Scottish Government's view of the purpose of planning,
the core principles for the operation of the system and the objectives for key parts of the system,
statutory guidance on sustainable development and planning under Section 3E of the Planning etc. (Scotland) Act 2006,
concise subject planning policies, including the implications for development planning and development management, and
the Scottish Government's expectations of the intended outcomes of the planning system.
In order for the modernisation of the planning system to be successful a culture change in how individuals work and implement new processes is required. It is necessary to overcome the image planning has of being a barrier to development: of having a culture that is too regulatory, too reactive, too slow and too technical. The desire is to create a system that is more efficient, more enabling, more facilitating and understandable to all. The overall objectives of the reforms to the planning system are to deliver a modern planning system that is efficient, inclusive, fit for purpose and sustainable. 5.2.2.1 Design and Planning in Moray
There are two local plans covering Moray – the Moray Local Plan, which covers the area shown in Map 13, and the Cairngorms Park Local Plan, which covers the southern part of Moray that lies within the Cairngorms National Park. Moray‘s current Local Plan was adopted in November 2008 following a three year review process. (The review of the current plan commenced in November 2010). The Cairngorms
Map 13: Moray Local Development Plan area
50
Park Local Plan was adopted in October 2010 and is the first Local Plan for a National Park. Supplementary guidance has been produced to provide support for some of the policies in the Moray Local Plan:
Developer Requirements for Housing: Advises applicants, developers, landowners what will be required of them in terms of the layouts and designs they submit applications for housing developments (over 5 units).
Burghead Conservation Area: Designated in February 2010, now subject to greater planning controls to protect its character.
Housing in the Countryside: Provides guidance on the relevant Moray Local Plan policies and the siting, location and design of housing in a rural environment.
Urban Design Guide: Aims to encourage good design principles to ensure that new developments are successful places to live, work and relax.
Development Briefs: For sites in Cullen, Findochty and Portknockie designated for residential use in the Moray Local Plan 2008. Provide details of how the site should be developed.
Open Spaces: The Moray Council is currently working with partners to develop an Open Space Strategy.
Trees and Development: Guides developers and members of the public as to how to fulfil the requirements for a tree survey, advises as to the Council‘s tree replacement planting requirements for protected trees or trees identified for removal/replacement in a planting scheme.
Renewable Energy Strategies: Action Plan proposed – awaiting information.
Affordable Housing: Sets out the Council's procedures for providing affordable housing and the mechanisms for securing such housing.
Forestry Strategy: Identifies preferred search areas within which forestry may be suitable subject to the detailed consideration.
Wind Energy: Identifies preferred search areas within which wind farm developments may be suitable subject to the detailed criteria set out in the Guidance and the policies of the Moray Development Plan.
Environmental Charter: Adopted in 1996. There is a great variety in the townscapes and buildings of Moray and each location has its own character and appearance, which help provide a sense of place. The planning system is used to help safeguard and enhance these attributes by making decisions about future development, and the use of land in our towns, cities and countryside, in accordance with the Moray Development Plan. The Moray Council received over 1,000 planning applications during 2009/10, 99.1% of which were determined in accordance with the Development Plan.
5.2.3 Building Standards and Construction
The purpose of Building Standards is to protect the public interest, create Building Regulations and prepare technical guidance to ensure buildings are safe, efficient and sustainable for all. The system does not so much control building as set out the essential standards to be met when building work or a conversion takes place, and only to the extent necessary to meet the building regulations. The key functions of the Building Standards system in Scotland are as follows:
51
prepare the building regulations and write guidance on how to meet the regulations; provide views on compliance to help verifiers (currently local authorities) make
decisions; grant relaxations of the regulations in exceptional cases; maintain a register of Approved Certifiers; monitor and audit the certification system; monitor and audit the performance of verifiers; to verify Crown building work.
Building Standards are also responsible for ensuring that all new and altered buildings are energy efficient and that buildings are accessible and suitable for use by disabled people. These responsibilities are achieved in a number of ways, namely by:
Ensuring that new building proposals meet with the requirements of the Building Regulations. This is achieved by the need to obtain a Building Warrant prior to undertaking building proposals.
Visiting building sites and inspecting work that is in progress.
Ensuring that dangerous buildings are made safe.
Taking action where work is unauthorised. The Building (Scotland) Act 2003 came into force on May 1, 2005 and is the primary legislation under which the Building Standards system operates. This is supported by secondary legislation including building, procedural, fees and forms regulations. The framework set out in the Building (Scotland) Act 2003 replaces the Building (Scotland) Act 1959, which deals in the main with the setting of building standards, compliance with and enforcement of those standards and powers in relation to dangerous buildings. The standards themselves are prescribed in regulations, supported by technical standards for compliance with these regulations. The Building (Scotland) Amendment Regulations 2010 amends the Building (Scotland) Regulations 2004, which prescribe the functional standards to apply to the design, construction or demolition of a building, the provision of services, fittings or equipment in or in connection with a building, and the conversion of a building. A key aspect of the changes to the building regulations is the focus on sustainability. Scotland‘s Sustainable Development Strategy [25] highlights the need to find alternative uses for construction and demolition waste and alternative sources for construction materials. In addition the strategy emphasizes the importance of improving the condition and energy efficiency of existing housing stock in both the private and public sectors, and exploiting the significant opportunities to further sustainable development, energy and resource efficiency and design excellence in new-build housing. The Construction Products Directive (Council Directive 89/106/EEC) [26] lays down the essential requirements for construction products, which include the following in relation to energy economy and heat retention.
―The construction works and its heating, cooling and ventilation installations must be designed and built in such a way that the amount of energy required in use shall be low, having regard to the climatic conditions of the location and the occupants.‖
There is as yet no requirement for the construction products themselves to be low energy in terms of the natural resources consumed during their production, although in line with
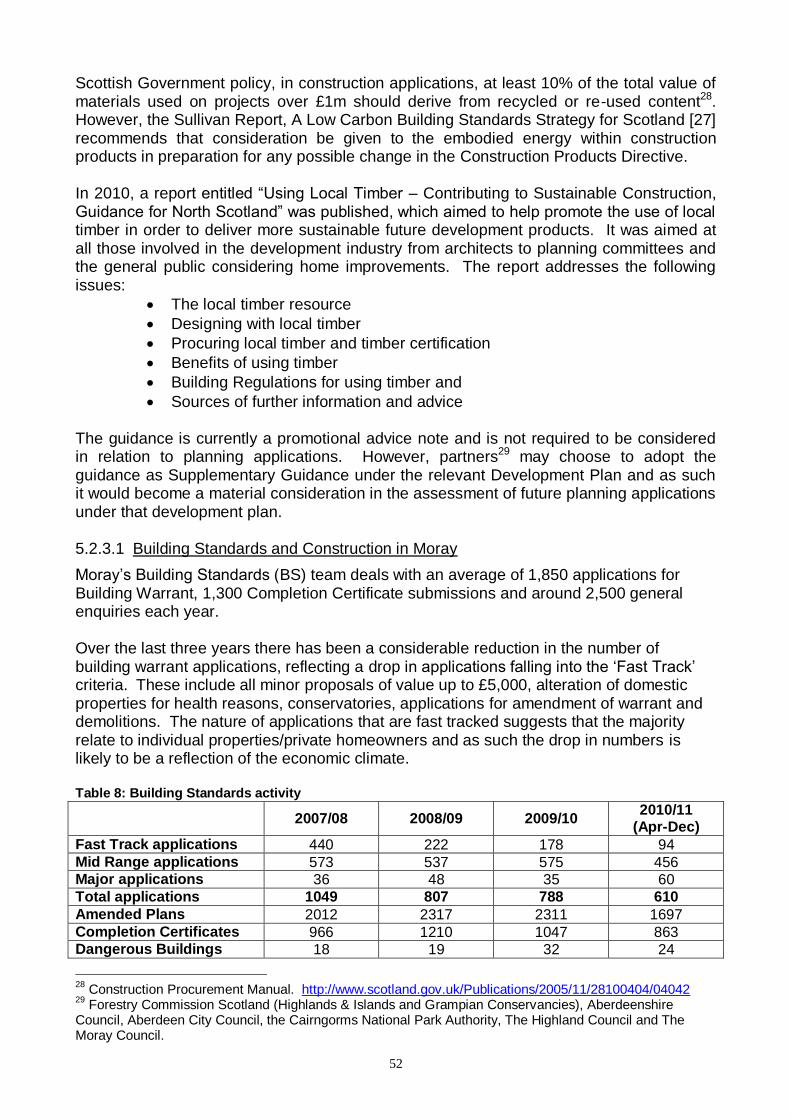
52
Scottish Government policy, in construction applications, at least 10% of the total value of materials used on projects over £1m should derive from recycled or re-used content28. However, the Sullivan Report, A Low Carbon Building Standards Strategy for Scotland [27] recommends that consideration be given to the embodied energy within construction products in preparation for any possible change in the Construction Products Directive. In 2010, a report entitled ―Using Local Timber – Contributing to Sustainable Construction, Guidance for North Scotland‖ was published, which aimed to help promote the use of local timber in order to deliver more sustainable future development products. It was aimed at all those involved in the development industry from architects to planning committees and the general public considering home improvements. The report addresses the following issues:
The local timber resource
Designing with local timber
Procuring local timber and timber certification
Benefits of using timber
Building Regulations for using timber and
Sources of further information and advice The guidance is currently a promotional advice note and is not required to be considered in relation to planning applications. However, partners29 may choose to adopt the guidance as Supplementary Guidance under the relevant Development Plan and as such it would become a material consideration in the assessment of future planning applications under that development plan. 5.2.3.1 Building Standards and Construction in Moray
Moray‘s Building Standards (BS) team deals with an average of 1,850 applications for Building Warrant, 1,300 Completion Certificate submissions and around 2,500 general enquiries each year. Over the last three years there has been a considerable reduction in the number of building warrant applications, reflecting a drop in applications falling into the ‗Fast Track‘ criteria. These include all minor proposals of value up to £5,000, alteration of domestic properties for health reasons, conservatories, applications for amendment of warrant and demolitions. The nature of applications that are fast tracked suggests that the majority relate to individual properties/private homeowners and as such the drop in numbers is likely to be a reflection of the economic climate. Table 8: Building Standards activity
2007/08 2008/09 2009/10
2010/11 (Apr-Dec)
Fast Track applications 440 222 178 94
Mid Range applications 573 537 575 456 Major applications 36 48 35 60
Total applications 1049 807 788 610
Amended Plans 2012 2317 2311 1697
Completion Certificates 966 1210 1047 863 Dangerous Buildings 18 19 32 24
28
Construction Procurement Manual. http://www.scotland.gov.uk/Publications/2005/11/28100404/04042 29
Forestry Commission Scotland (Highlands & Islands and Grampian Conservancies), Aberdeenshire Council, Aberdeen City Council, the Cairngorms National Park Authority, The Highland Council and The Moray Council.
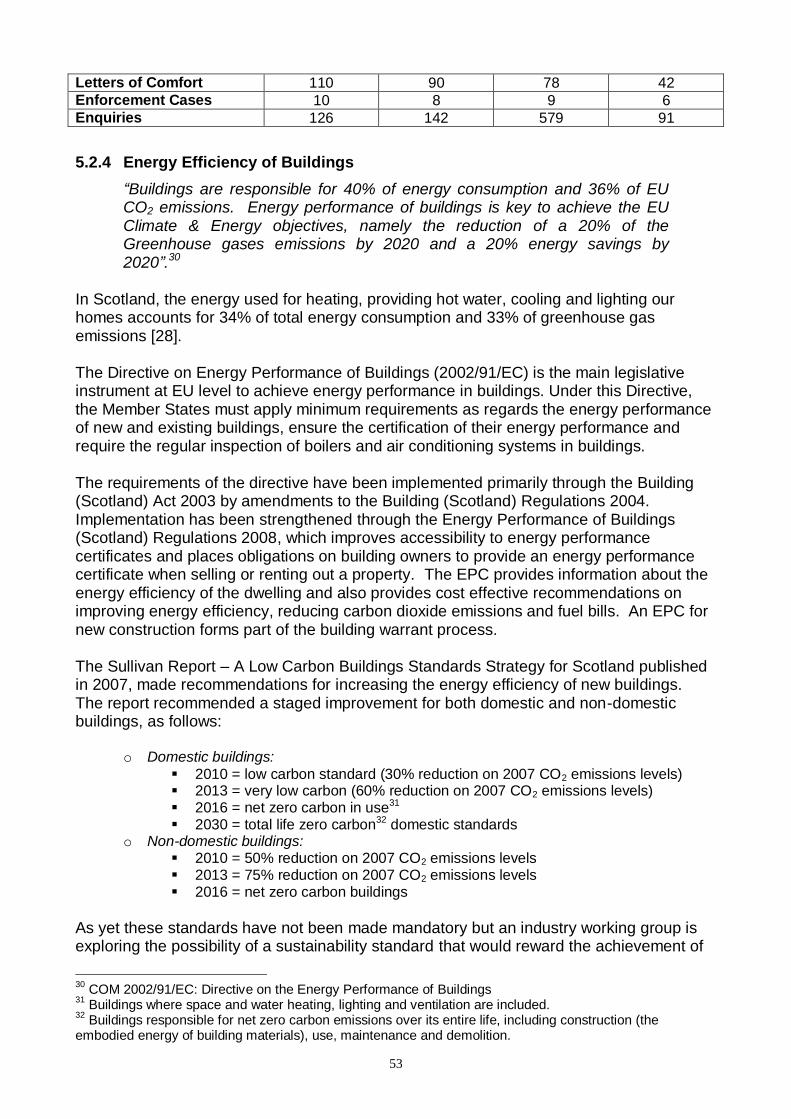
53
Letters of Comfort 110 90 78 42
Enforcement Cases 10 8 9 6
Enquiries 126 142 579 91
5.2.4 Energy Efficiency of Buildings
“Buildings are responsible for 40% of energy consumption and 36% of EU CO2 emissions. Energy performance of buildings is key to achieve the EU Climate & Energy objectives, namely the reduction of a 20% of the Greenhouse gases emissions by 2020 and a 20% energy savings by 2020”.30
In Scotland, the energy used for heating, providing hot water, cooling and lighting our homes accounts for 34% of total energy consumption and 33% of greenhouse gas emissions [28].
The Directive on Energy Performance of Buildings (2002/91/EC) is the main legislative instrument at EU level to achieve energy performance in buildings. Under this Directive, the Member States must apply minimum requirements as regards the energy performance of new and existing buildings, ensure the certification of their energy performance and require the regular inspection of boilers and air conditioning systems in buildings. The requirements of the directive have been implemented primarily through the Building (Scotland) Act 2003 by amendments to the Building (Scotland) Regulations 2004. Implementation has been strengthened through the Energy Performance of Buildings (Scotland) Regulations 2008, which improves accessibility to energy performance certificates and places obligations on building owners to provide an energy performance certificate when selling or renting out a property. The EPC provides information about the energy efficiency of the dwelling and also provides cost effective recommendations on improving energy efficiency, reducing carbon dioxide emissions and fuel bills. An EPC for new construction forms part of the building warrant process. The Sullivan Report – A Low Carbon Buildings Standards Strategy for Scotland published in 2007, made recommendations for increasing the energy efficiency of new buildings. The report recommended a staged improvement for both domestic and non-domestic buildings, as follows:
o Domestic buildings:
2010 = low carbon standard (30% reduction on 2007 CO2 emissions levels) 2013 = very low carbon (60% reduction on 2007 CO2 emissions levels) 2016 = net zero carbon in use31 2030 = total life zero carbon32 domestic standards
o Non-domestic buildings: 2010 = 50% reduction on 2007 CO2 emissions levels 2013 = 75% reduction on 2007 CO2 emissions levels 2016 = net zero carbon buildings
As yet these standards have not been made mandatory but an industry working group is exploring the possibility of a sustainability standard that would reward the achievement of
30
COM 2002/91/EC: Directive on the Energy Performance of Buildings 31
Buildings where space and water heating, lighting and ventilation are included. 32
Buildings responsible for net zero carbon emissions over its entire life, including construction (the embodied energy of building materials), use, maintenance and demolition.

54
optional higher levels of energy and carbon emissions targets. The group is currently determining the details that each upper level for domestic buildings may contain, including links between proposed upper levels and the recommended staged reductions of carbon emissions for buildings contained in the Sullivan Report. 5.2.4.1 Energy Efficiency in Buildings in Moray
The Moray Council has undertaken various projects to improve the energy efficiency of its buildings, primarily the school estate, which account for 70% to 75% of the Council‘s energy consumption. Projects include:
Draughtproofing all suitable primary and secondary schools
Increasing loft insulation where possible to 300mm, 10% above the recommended depth of 270mm.
Upgrading heating control systems.
Upgrading lights and lighting controls at several sites
Renewing old swimming pool covers to help retain the pools‘ heat overnight.
Contributing to the upgrading of the heating in the Council Chambers. In addition to these projects there are three buildings that are looking to install biomass heating systems. Speyside High School, Newmill Village Hall and Lossiemouth Town Hall. The Speyside High system would provide heat to the school, the Sports and Community Centre including the swimming pool. The Newmill Village Hall boiler would also provide heat to Newmill Primary School while the Lossiemouth Town Hall system would also heat the library. The Moray Council is currently converting the old Safeway supermarket building in the High Street, Elgin, to office space and are having the building assessed in line with BREEAM - BRE Environmental Assessment Method. BREEAM is the leading and most widely used environmental assessment method for buildings. It sets the standard for best practice in sustainable design and has become the de facto measure used to describe a building's environmental performance. A building undergoes an initial assessment based on plans for the building and a final assessment following completion. The BREEAM assessment process incorporates:
market recognition for low environmental impact buildings
assurance that best environmental practice is incorporated into a building
inspiration to find innovative solutions that minimise the environmental impact
a benchmark that is higher than regulation
a tool to help reduce running costs, improve working and living environments
a standard that demonstrates progress towards corporate and organisational environmental objectives
Items covered in the initial assessment, the design standards & in the final assessment are or will be:
Management – commissioning, considerate constructors, construction site impacts, building user guide, security
Health & Well being – day lighting, view out, glare control, lighting, controls, natural ventilation, indoor air quality, thermal comfort & zoning, acoustics, reduction of CO2 emissions, energy use, low carbon technologies
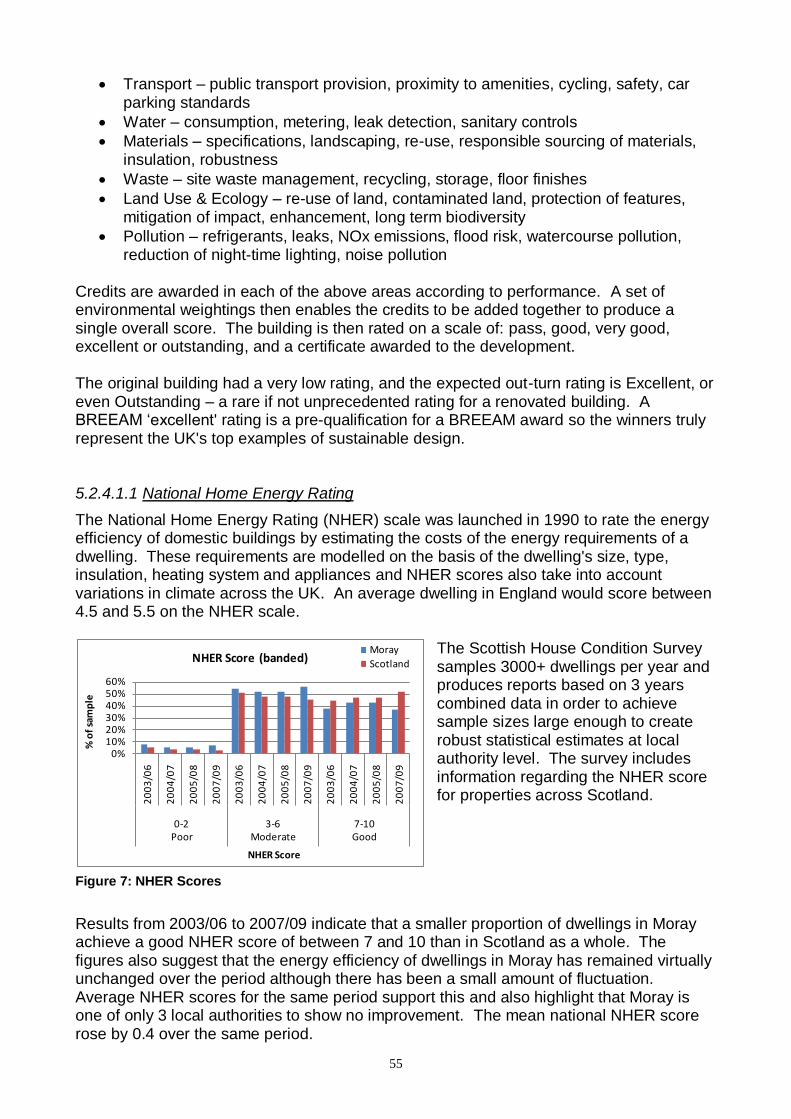
55
Transport – public transport provision, proximity to amenities, cycling, safety, car parking standards
Water – consumption, metering, leak detection, sanitary controls
Materials – specifications, landscaping, re-use, responsible sourcing of materials, insulation, robustness
Waste – site waste management, recycling, storage, floor finishes
Land Use & Ecology – re-use of land, contaminated land, protection of features, mitigation of impact, enhancement, long term biodiversity
Pollution – refrigerants, leaks, NOx emissions, flood risk, watercourse pollution, reduction of night-time lighting, noise pollution
Credits are awarded in each of the above areas according to performance. A set of environmental weightings then enables the credits to be added together to produce a single overall score. The building is then rated on a scale of: pass, good, very good, excellent or outstanding, and a certificate awarded to the development. The original building had a very low rating, and the expected out-turn rating is Excellent, or even Outstanding – a rare if not unprecedented rating for a renovated building. A BREEAM ‗excellent' rating is a pre-qualification for a BREEAM award so the winners truly represent the UK's top examples of sustainable design. 5.2.4.1.1 National Home Energy Rating
The National Home Energy Rating (NHER) scale was launched in 1990 to rate the energy efficiency of domestic buildings by estimating the costs of the energy requirements of a dwelling. These requirements are modelled on the basis of the dwelling's size, type, insulation, heating system and appliances and NHER scores also take into account variations in climate across the UK. An average dwelling in England would score between 4.5 and 5.5 on the NHER scale.
The Scottish House Condition Survey samples 3000+ dwellings per year and produces reports based on 3 years combined data in order to achieve sample sizes large enough to create robust statistical estimates at local authority level. The survey includes information regarding the NHER score for properties across Scotland.
Results from 2003/06 to 2007/09 indicate that a smaller proportion of dwellings in Moray achieve a good NHER score of between 7 and 10 than in Scotland as a whole. The figures also suggest that the energy efficiency of dwellings in Moray has remained virtually unchanged over the period although there has been a small amount of fluctuation. Average NHER scores for the same period support this and also highlight that Moray is one of only 3 local authorities to show no improvement. The mean national NHER score rose by 0.4 over the same period.
0%10%20%30%40%50%60%
20
03
/06
20
04
/07
20
05
/08
20
07
/09
20
03
/06
20
04
/07
20
05
/08
20
07
/09
20
03
/06
20
04
/07
20
05
/08
20
07
/09
0-2Poor
3-6Moderate
7-10Good
% o
f sa
mp
le
NHER Score
NHER Score (banded)Moray
Scotland
Figure 7: NHER Scores
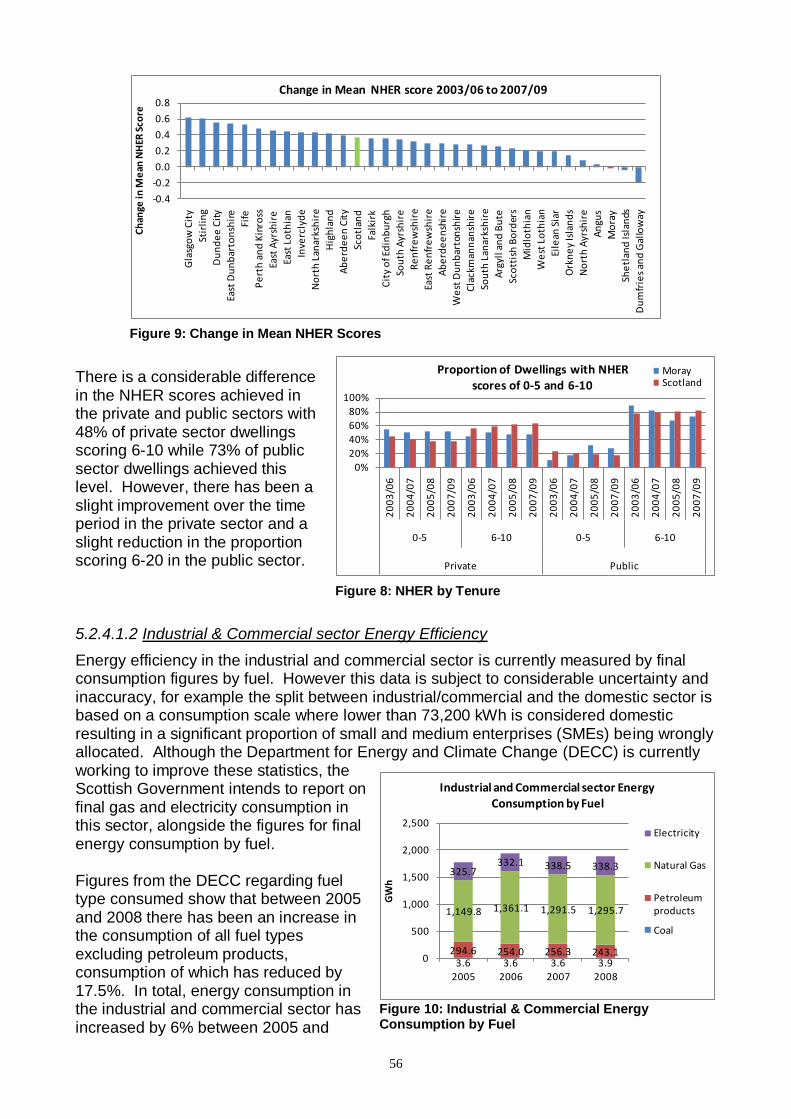
56
There is a considerable difference in the NHER scores achieved in the private and public sectors with 48% of private sector dwellings scoring 6-10 while 73% of public sector dwellings achieved this level. However, there has been a slight improvement over the time period in the private sector and a slight reduction in the proportion scoring 6-20 in the public sector. 5.2.4.1.2 Industrial & Commercial sector Energy Efficiency
Energy efficiency in the industrial and commercial sector is currently measured by final consumption figures by fuel. However this data is subject to considerable uncertainty and inaccuracy, for example the split between industrial/commercial and the domestic sector is based on a consumption scale where lower than 73,200 kWh is considered domestic resulting in a significant proportion of small and medium enterprises (SMEs) being wrongly allocated. Although the Department for Energy and Climate Change (DECC) is currently working to improve these statistics, the Scottish Government intends to report on final gas and electricity consumption in this sector, alongside the figures for final energy consumption by fuel. Figures from the DECC regarding fuel type consumed show that between 2005 and 2008 there has been an increase in the consumption of all fuel types excluding petroleum products, consumption of which has reduced by 17.5%. In total, energy consumption in the industrial and commercial sector has increased by 6% between 2005 and
0%
20%
40%
60%
80%
100%2
00
3/0
6
20
04
/07
20
05
/08
20
07
/09
20
03
/06
20
04
/07
20
05
/08
20
07
/09
20
03
/06
20
04
/07
20
05
/08
20
07
/09
20
03
/06
20
04
/07
20
05
/08
20
07
/09
0-5 6-10 0-5 6-10
Private Public
Proportion of Dwellings with NHER scores of 0-5 and 6-10
MorayScotland
Figure 8: NHER by Tenure
3.6 3.6 3.6 3.9294.6 254.0 256.3 243.1
1,149.8 1,361.1 1,291.5 1,295.7
325.7332.1 338.5 338.3
0
500
1,000
1,500
2,000
2,500
2005 2006 2007 2008
GW
h
Industrial and Commercial sector Energy Consumption by Fuel
Electricity
Natural Gas
Petroleum products
Coal
Figure 10: Industrial & Commercial Energy Consumption by Fuel
-0.4
-0.2
0.0
0.2
0.4
0.6
0.8
Gla
sgo
w C
ity
Stir
lin
g
Du
nd
ee
Cit
y
East
Du
nb
arto
nsh
ire
Fife
Pe
rth
an
d K
inro
ss
East
Ayr
shir
e
East
Lo
thia
n
Inve
rcly
de
No
rth
Lan
arks
hir
e
Hig
hla
nd
Ab
erd
ee
n C
ity
Sco
tlan
d
Falk
irk
Cit
y o
f Ed
inb
urg
h
Sou
th A
yrsh
ire
Re
nfr
ew
shir
e
East
Re
nfr
ew
shir
e
Ab
erd
ee
nsh
ire
We
st D
un
bar
ton
shir
e
Cla
ckm
ann
ansh
ire
Sou
th L
anar
ksh
ire
Arg
yll a
nd
Bu
te
Sco
ttis
h B
ord
ers
Mid
loth
ian
We
st L
oth
ian
Eile
an S
iar
Ork
ne
y Is
lan
ds
No
rth
Ayr
shir
e
An
gus
Mo
ray
She
tlan
d Is
lan
ds
Du
mfr
ies
and
Gal
low
ay
Ch
ange
in M
ean
NH
ER S
core
Change in Mean NHER score 2003/06 to 2007/09
Figure 9: Change in Mean NHER Scores
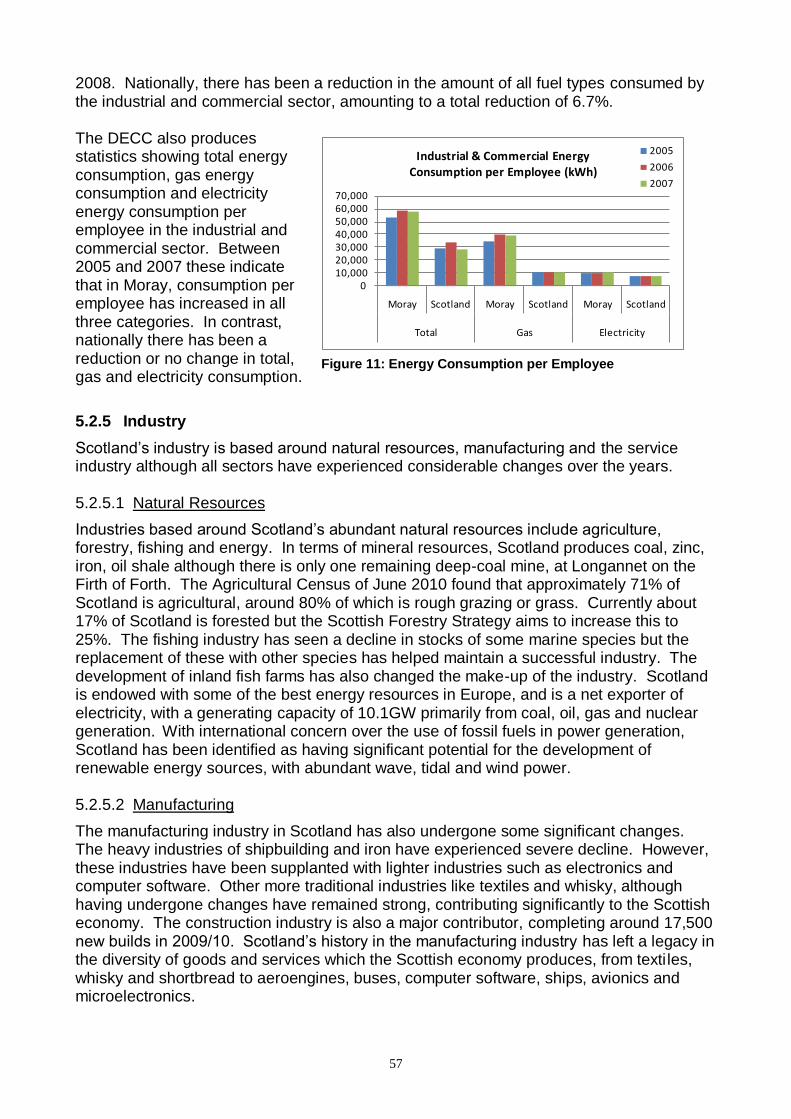
57
2008. Nationally, there has been a reduction in the amount of all fuel types consumed by the industrial and commercial sector, amounting to a total reduction of 6.7%. The DECC also produces statistics showing total energy consumption, gas energy consumption and electricity energy consumption per employee in the industrial and commercial sector. Between 2005 and 2007 these indicate that in Moray, consumption per employee has increased in all three categories. In contrast, nationally there has been a reduction or no change in total, gas and electricity consumption.
5.2.5 Industry
Scotland‘s industry is based around natural resources, manufacturing and the service industry although all sectors have experienced considerable changes over the years. 5.2.5.1 Natural Resources
Industries based around Scotland‘s abundant natural resources include agriculture, forestry, fishing and energy. In terms of mineral resources, Scotland produces coal, zinc, iron, oil shale although there is only one remaining deep-coal mine, at Longannet on the Firth of Forth. The Agricultural Census of June 2010 found that approximately 71% of Scotland is agricultural, around 80% of which is rough grazing or grass. Currently about 17% of Scotland is forested but the Scottish Forestry Strategy aims to increase this to 25%. The fishing industry has seen a decline in stocks of some marine species but the replacement of these with other species has helped maintain a successful industry. The development of inland fish farms has also changed the make-up of the industry. Scotland is endowed with some of the best energy resources in Europe, and is a net exporter of electricity, with a generating capacity of 10.1GW primarily from coal, oil, gas and nuclear generation. With international concern over the use of fossil fuels in power generation, Scotland has been identified as having significant potential for the development of renewable energy sources, with abundant wave, tidal and wind power. 5.2.5.2 Manufacturing
The manufacturing industry in Scotland has also undergone some significant changes. The heavy industries of shipbuilding and iron have experienced severe decline. However, these industries have been supplanted with lighter industries such as electronics and computer software. Other more traditional industries like textiles and whisky, although having undergone changes have remained strong, contributing significantly to the Scottish economy. The construction industry is also a major contributor, completing around 17,500 new builds in 2009/10. Scotland‘s history in the manufacturing industry has left a legacy in the diversity of goods and services which the Scottish economy produces, from textiles, whisky and shortbread to aeroengines, buses, computer software, ships, avionics and microelectronics.
010,00020,00030,00040,00050,00060,00070,000
Moray Scotland Moray Scotland Moray Scotland
Total Gas Electricity
Industrial & Commercial EnergyConsumption per Employee (kWh)
2005
2006
2007
Figure 11: Energy Consumption per Employee
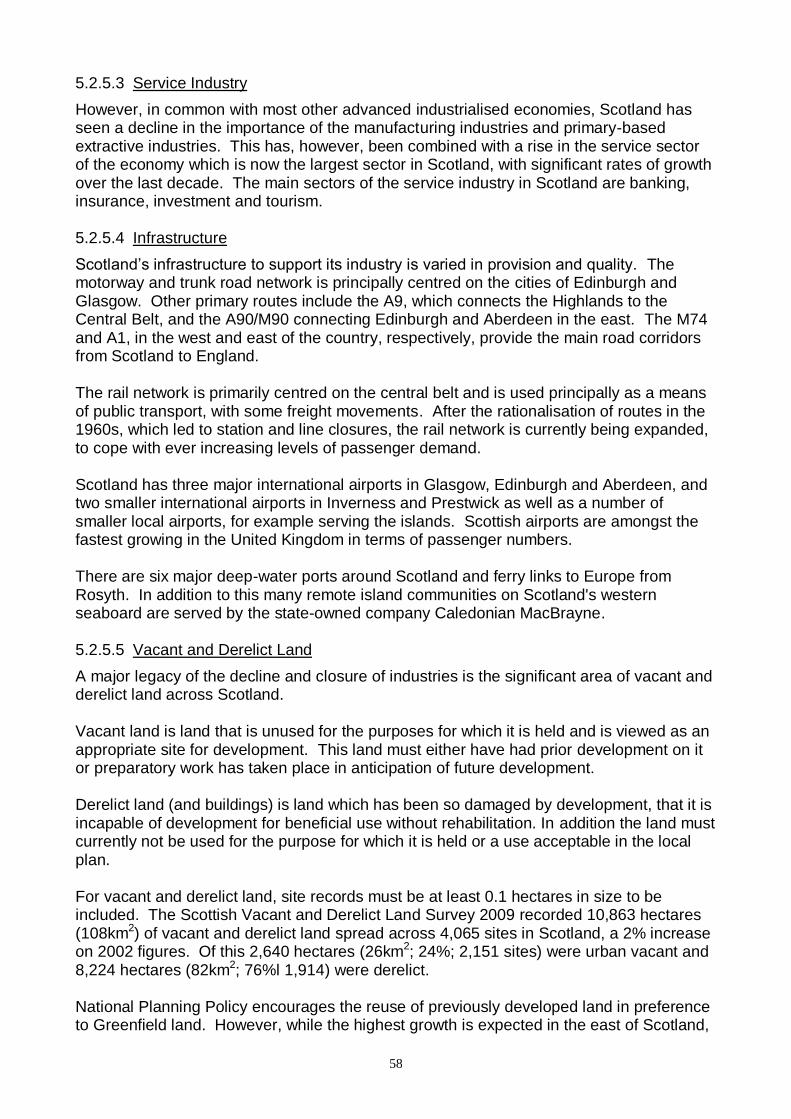
58
5.2.5.3 Service Industry
However, in common with most other advanced industrialised economies, Scotland has seen a decline in the importance of the manufacturing industries and primary-based extractive industries. This has, however, been combined with a rise in the service sector of the economy which is now the largest sector in Scotland, with significant rates of growth over the last decade. The main sectors of the service industry in Scotland are banking, insurance, investment and tourism. 5.2.5.4 Infrastructure
Scotland‘s infrastructure to support its industry is varied in provision and quality. The motorway and trunk road network is principally centred on the cities of Edinburgh and Glasgow. Other primary routes include the A9, which connects the Highlands to the Central Belt, and the A90/M90 connecting Edinburgh and Aberdeen in the east. The M74 and A1, in the west and east of the country, respectively, provide the main road corridors from Scotland to England. The rail network is primarily centred on the central belt and is used principally as a means of public transport, with some freight movements. After the rationalisation of routes in the 1960s, which led to station and line closures, the rail network is currently being expanded, to cope with ever increasing levels of passenger demand. Scotland has three major international airports in Glasgow, Edinburgh and Aberdeen, and two smaller international airports in Inverness and Prestwick as well as a number of smaller local airports, for example serving the islands. Scottish airports are amongst the fastest growing in the United Kingdom in terms of passenger numbers. There are six major deep-water ports around Scotland and ferry links to Europe from Rosyth. In addition to this many remote island communities on Scotland's western seaboard are served by the state-owned company Caledonian MacBrayne. 5.2.5.5 Vacant and Derelict Land
A major legacy of the decline and closure of industries is the significant area of vacant and derelict land across Scotland. Vacant land is land that is unused for the purposes for which it is held and is viewed as an appropriate site for development. This land must either have had prior development on it or preparatory work has taken place in anticipation of future development. Derelict land (and buildings) is land which has been so damaged by development, that it is incapable of development for beneficial use without rehabilitation. In addition the land must currently not be used for the purpose for which it is held or a use acceptable in the local plan. For vacant and derelict land, site records must be at least 0.1 hectares in size to be included. The Scottish Vacant and Derelict Land Survey 2009 recorded 10,863 hectares (108km2) of vacant and derelict land spread across 4,065 sites in Scotland, a 2% increase on 2002 figures. Of this 2,640 hectares (26km2; 24%; 2,151 sites) were urban vacant and 8,224 hectares (82km2; 76%l 1,914) were derelict. National Planning Policy encourages the reuse of previously developed land in preference to Greenfield land. However, while the highest growth is expected in the east of Scotland,
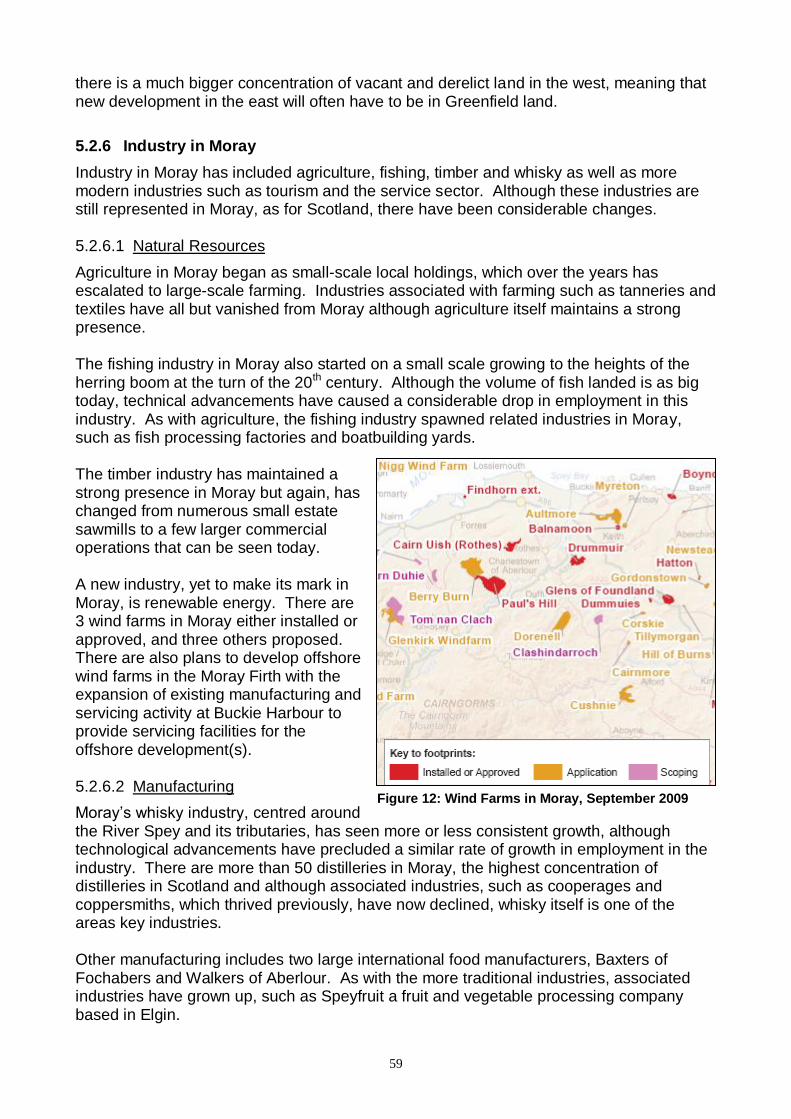
59
there is a much bigger concentration of vacant and derelict land in the west, meaning that new development in the east will often have to be in Greenfield land.
5.2.6 Industry in Moray
Industry in Moray has included agriculture, fishing, timber and whisky as well as more modern industries such as tourism and the service sector. Although these industries are still represented in Moray, as for Scotland, there have been considerable changes. 5.2.6.1 Natural Resources
Agriculture in Moray began as small-scale local holdings, which over the years has escalated to large-scale farming. Industries associated with farming such as tanneries and textiles have all but vanished from Moray although agriculture itself maintains a strong presence. The fishing industry in Moray also started on a small scale growing to the heights of the herring boom at the turn of the 20th century. Although the volume of fish landed is as big today, technical advancements have caused a considerable drop in employment in this industry. As with agriculture, the fishing industry spawned related industries in Moray, such as fish processing factories and boatbuilding yards. The timber industry has maintained a strong presence in Moray but again, has changed from numerous small estate sawmills to a few larger commercial operations that can be seen today. A new industry, yet to make its mark in Moray, is renewable energy. There are 3 wind farms in Moray either installed or approved, and three others proposed. There are also plans to develop offshore wind farms in the Moray Firth with the expansion of existing manufacturing and servicing activity at Buckie Harbour to provide servicing facilities for the offshore development(s). 5.2.6.2 Manufacturing
Moray‘s whisky industry, centred around the River Spey and its tributaries, has seen more or less consistent growth, although technological advancements have precluded a similar rate of growth in employment in the industry. There are more than 50 distilleries in Moray, the highest concentration of distilleries in Scotland and although associated industries, such as cooperages and coppersmiths, which thrived previously, have now declined, whisky itself is one of the areas key industries. Other manufacturing includes two large international food manufacturers, Baxters of Fochabers and Walkers of Aberlour. As with the more traditional industries, associated industries have grown up, such as Speyfruit a fruit and vegetable processing company based in Elgin.
Figure 12: Wind Farms in Moray, September 2009
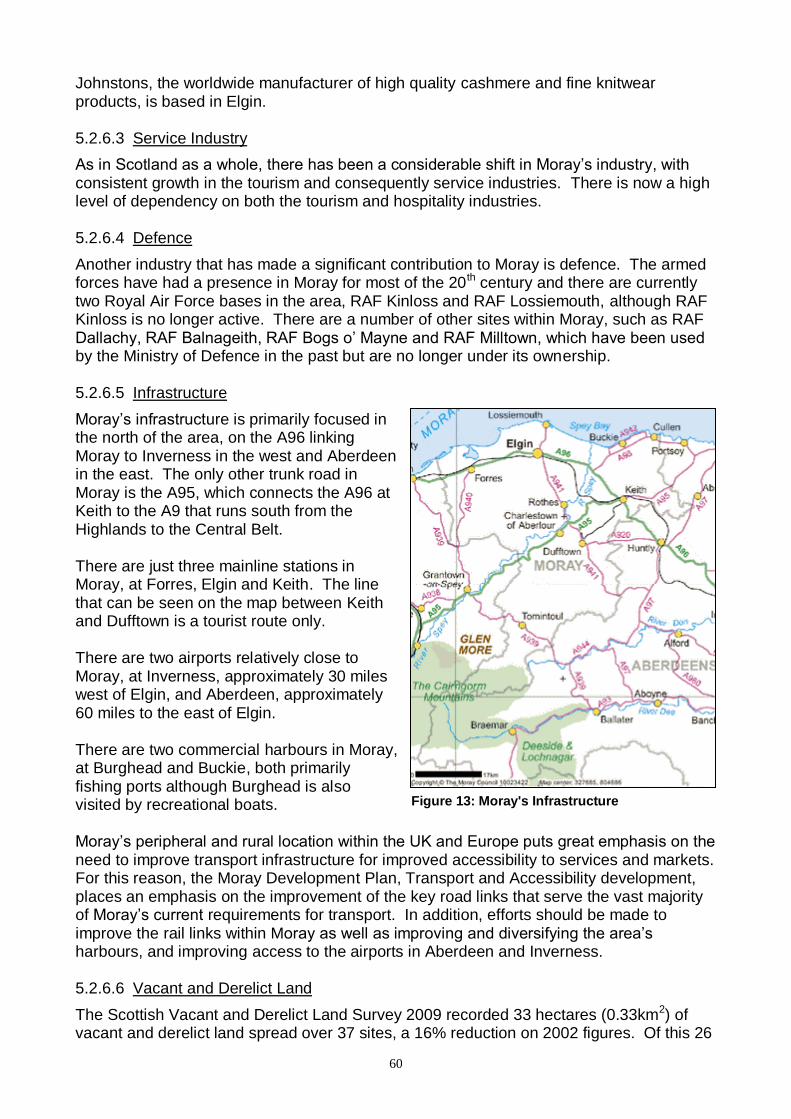
60
Johnstons, the worldwide manufacturer of high quality cashmere and fine knitwear products, is based in Elgin. 5.2.6.3 Service Industry
As in Scotland as a whole, there has been a considerable shift in Moray‘s industry, with consistent growth in the tourism and consequently service industries. There is now a high level of dependency on both the tourism and hospitality industries. 5.2.6.4 Defence
Another industry that has made a significant contribution to Moray is defence. The armed forces have had a presence in Moray for most of the 20th century and there are currently two Royal Air Force bases in the area, RAF Kinloss and RAF Lossiemouth, although RAF Kinloss is no longer active. There are a number of other sites within Moray, such as RAF Dallachy, RAF Balnageith, RAF Bogs o‘ Mayne and RAF Milltown, which have been used by the Ministry of Defence in the past but are no longer under its ownership. 5.2.6.5 Infrastructure
Moray‘s infrastructure is primarily focused in the north of the area, on the A96 linking Moray to Inverness in the west and Aberdeen in the east. The only other trunk road in Moray is the A95, which connects the A96 at Keith to the A9 that runs south from the Highlands to the Central Belt. There are just three mainline stations in Moray, at Forres, Elgin and Keith. The line that can be seen on the map between Keith and Dufftown is a tourist route only. There are two airports relatively close to Moray, at Inverness, approximately 30 miles west of Elgin, and Aberdeen, approximately 60 miles to the east of Elgin. There are two commercial harbours in Moray, at Burghead and Buckie, both primarily fishing ports although Burghead is also visited by recreational boats. Moray‘s peripheral and rural location within the UK and Europe puts great emphasis on the need to improve transport infrastructure for improved accessibility to services and markets. For this reason, the Moray Development Plan, Transport and Accessibility development, places an emphasis on the improvement of the key road links that serve the vast majority of Moray‘s current requirements for transport. In addition, efforts should be made to improve the rail links within Moray as well as improving and diversifying the area‘s harbours, and improving access to the airports in Aberdeen and Inverness. 5.2.6.6 Vacant and Derelict Land
The Scottish Vacant and Derelict Land Survey 2009 recorded 33 hectares (0.33km2) of vacant and derelict land spread over 37 sites, a 16% reduction on 2002 figures. Of this 26
Figure 13: Moray's Infrastructure
61
hectares (0.26km2; 79%; 31 sites) were urban vacant and 7 hectares (0.07km2; 21%; 6 sites) were derelict. In accordance with Scottish Government planning policy, the Moray Development Plan 2008 promotes the use of brownfield land for residential developments to reduce the need to use Greenfield land. It sets standards for housing development to help reduce the impact on the area‘s environment and maintain the quality of the environment. In relation to economic, retail and commercial development, the promotion of town centres is a key aspect provided the design of the development is sensitive to its location. Requirements are made for the provision within development proposals of protective measures for the natural environment and landscaping arrangements, such as screening, sound barriers and the general visual appearance of the site. Developments must contribute positively to the built environment of the area by having a high standard of design.
5.3 Historic Built Environment
Most local environments have an historic dimension that contributes to its quality and character. The historic built environment covers scheduled monuments, archaeological sites, historic (listed) buildings, townscapes, parks, gardens and designed landscapes and conservation areas. All these assets are recognised as having particular value, and the planning system seeks to manage these elements in a sustainable way. The Scottish Government's policy and advice on planning for
the historic environment is set out in Scottish Planning Policy, supported by two Planning Advice Notes, and the Scottish Historic Environment Policy. The key elements are:
Encouraging a positive and proactive approach to managing change in the historic environment, enabling development and securing best viable use;
Ensuring the special qualities of the historic environment are protected, conserved and enhanced. This should cover statutory and non-statutory designations, while recognising that the latter, such as archaeological remains, can be material consideration in the planning process.
The historic built environment is particularly important for supporting the growth of tourism and leisure. The unique quality of historic environments provides a sense of place and continuity for communities. In most cases the historic environment can accommodate change as long as it is informed and sensitively managed and ensures that the area in question retains its special character. However, sometimes change will not be possible. Scottish Planning Policy states that ―Development Plans should provide the framework for the protection, conservation and enhancement of all elements of the historic environment to allow the assessment of the impact of proposed development on the historic environment and its setting‖. The setting is more than just the immediate surroundings and may relate to the function or use of a place, how it was intended to fit into the landscape or townscape, the view from it or how it is seen from around or areas that are important to the protection of the place, site or building.
Figure 14: Edinburgh Castle
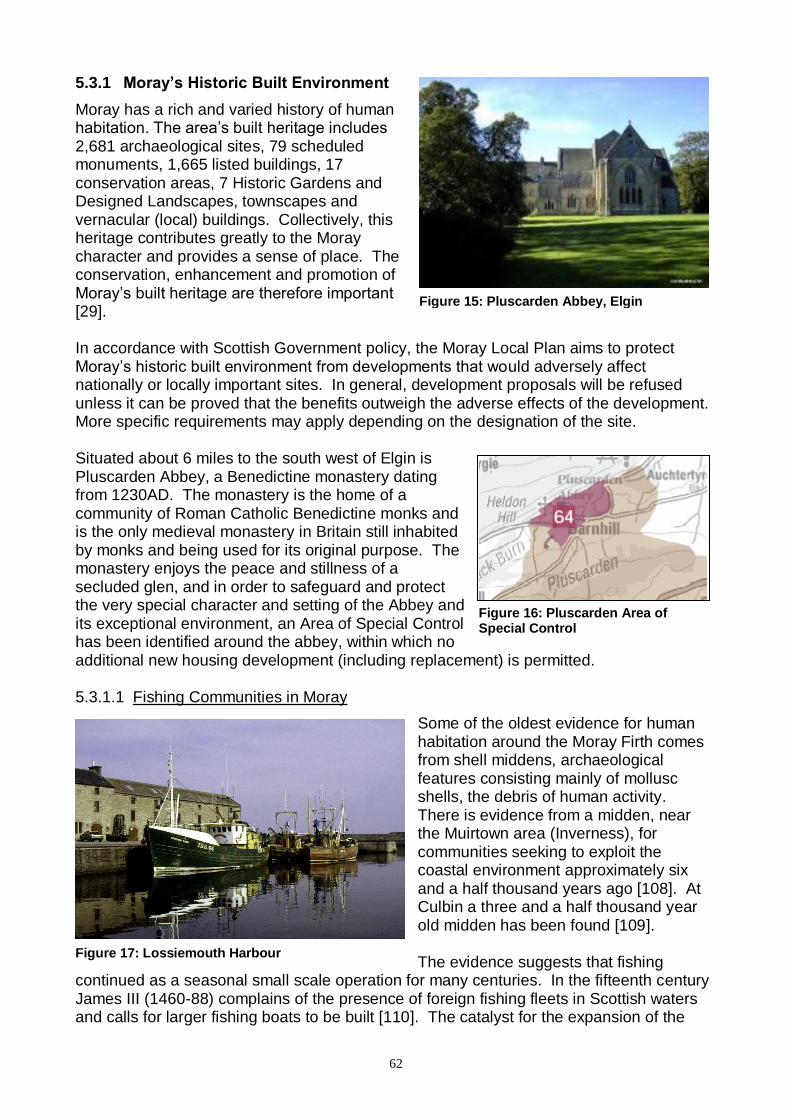
62
5.3.1 Moray’s Historic Built Environment
Moray has a rich and varied history of human habitation. The area‘s built heritage includes 2,681 archaeological sites, 79 scheduled monuments, 1,665 listed buildings, 17 conservation areas, 7 Historic Gardens and Designed Landscapes, townscapes and vernacular (local) buildings. Collectively, this heritage contributes greatly to the Moray character and provides a sense of place. The conservation, enhancement and promotion of Moray‘s built heritage are therefore important [29]. In accordance with Scottish Government policy, the Moray Local Plan aims to protect Moray‘s historic built environment from developments that would adversely affect nationally or locally important sites. In general, development proposals will be refused unless it can be proved that the benefits outweigh the adverse effects of the development. More specific requirements may apply depending on the designation of the site. Situated about 6 miles to the south west of Elgin is Pluscarden Abbey, a Benedictine monastery dating from 1230AD. The monastery is the home of a community of Roman Catholic Benedictine monks and is the only medieval monastery in Britain still inhabited by monks and being used for its original purpose. The monastery enjoys the peace and stillness of a secluded glen, and in order to safeguard and protect the very special character and setting of the Abbey and its exceptional environment, an Area of Special Control has been identified around the abbey, within which no additional new housing development (including replacement) is permitted. 5.3.1.1 Fishing Communities in Moray
Some of the oldest evidence for human habitation around the Moray Firth comes from shell middens, archaeological features consisting mainly of mollusc shells, the debris of human activity. There is evidence from a midden, near the Muirtown area (Inverness), for communities seeking to exploit the coastal environment approximately six and a half thousand years ago [108]. At Culbin a three and a half thousand year old midden has been found [109]. The evidence suggests that fishing
continued as a seasonal small scale operation for many centuries. In the fifteenth century James III (1460-88) complains of the presence of foreign fishing fleets in Scottish waters and calls for larger fishing boats to be built [110]. The catalyst for the expansion of the
Figure 16: Pluscarden Area of Special Control
Figure 15: Pluscarden Abbey, Elgin
Figure 17: Lossiemouth Harbour
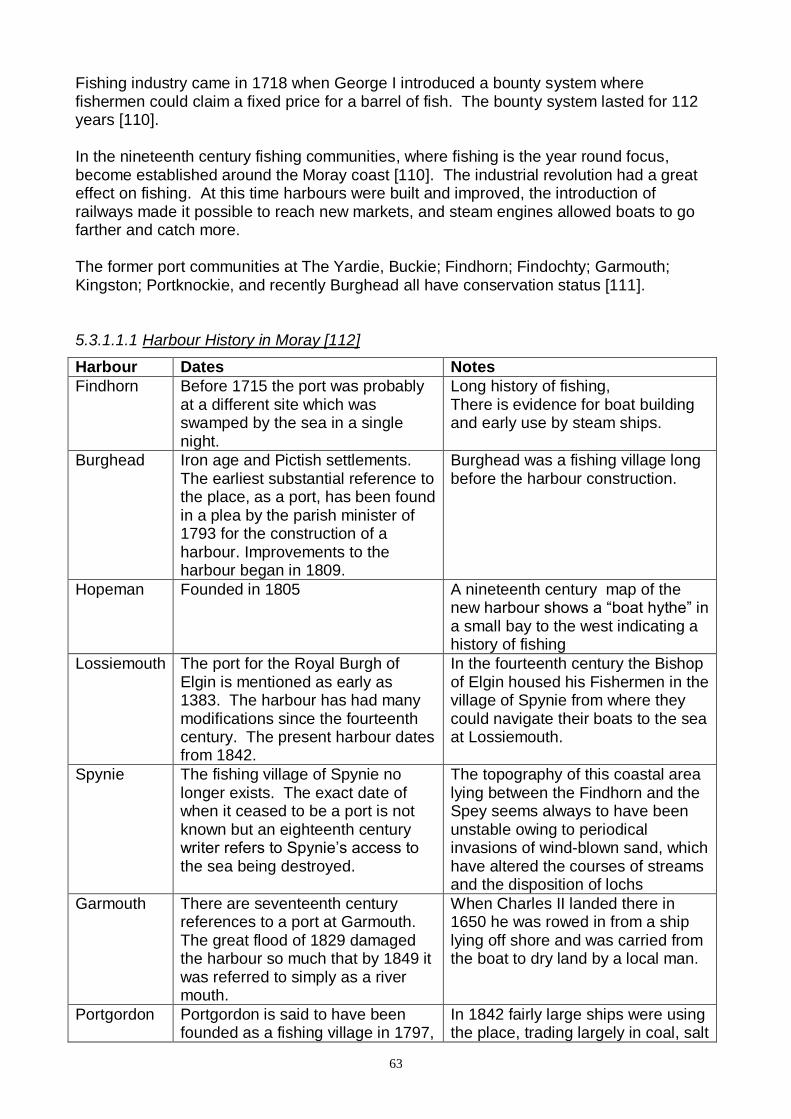
63
Fishing industry came in 1718 when George I introduced a bounty system where fishermen could claim a fixed price for a barrel of fish. The bounty system lasted for 112 years [110]. In the nineteenth century fishing communities, where fishing is the year round focus, become established around the Moray coast [110]. The industrial revolution had a great effect on fishing. At this time harbours were built and improved, the introduction of railways made it possible to reach new markets, and steam engines allowed boats to go farther and catch more. The former port communities at The Yardie, Buckie; Findhorn; Findochty; Garmouth; Kingston; Portknockie, and recently Burghead all have conservation status [111]. 5.3.1.1.1 Harbour History in Moray [112]
Harbour Dates Notes
Findhorn Before 1715 the port was probably at a different site which was swamped by the sea in a single night.
Long history of fishing, There is evidence for boat building and early use by steam ships.
Burghead Iron age and Pictish settlements. The earliest substantial reference to the place, as a port, has been found in a plea by the parish minister of 1793 for the construction of a harbour. Improvements to the harbour began in 1809.
Burghead was a fishing village long before the harbour construction.
Hopeman Founded in 1805 A nineteenth century map of the new harbour shows a ―boat hythe‖ in a small bay to the west indicating a history of fishing
Lossiemouth The port for the Royal Burgh of Elgin is mentioned as early as 1383. The harbour has had many modifications since the fourteenth century. The present harbour dates from 1842.
In the fourteenth century the Bishop of Elgin housed his Fishermen in the village of Spynie from where they could navigate their boats to the sea at Lossiemouth.
Spynie The fishing village of Spynie no longer exists. The exact date of when it ceased to be a port is not known but an eighteenth century writer refers to Spynie‘s access to the sea being destroyed.
The topography of this coastal area lying between the Findhorn and the Spey seems always to have been unstable owing to periodical invasions of wind-blown sand, which have altered the courses of streams and the disposition of lochs
Garmouth There are seventeenth century references to a port at Garmouth. The great flood of 1829 damaged the harbour so much that by 1849 it was referred to simply as a river mouth.
When Charles II landed there in 1650 he was rowed in from a ship lying off shore and was carried from the boat to dry land by a local man.
Portgordon Portgordon is said to have been founded as a fishing village in 1797,
In 1842 fairly large ships were using the place, trading largely in coal, salt

64
by the Duke of Gordon. His harbour of 1804 was replaced by the present structure in 1874.
and grain. Seven large and ten small fishing-boats were at that time owned in the village.
Buckpool The earliest site of a harbour in Buckie. The present structure dates from 1857 [6]
In 1842 Buckie had 117 large fishing-boats and 28 small ones.
Buckie The present (Cluny) harbour was built by the Cluny family at a cost of £60,000 in 1878
In recent years the number of boats landing catches in Buckie has been greatly reduced.
Findochty A harbour for Findochty was discussed from, at least, 1602. The present harbour dates from the late nineteenth century. Before this there was no harbour and boats must have worked off the open beach,
In 1794 the parish of Rathven contained four 'fisher-towns' -Buckie, Findochty, Portnockie, and Portessie
Portnockie The existing harbour dates from the 1880s. In 1794 seven boats were owned there, and in 1847 it still possessed no harbour
Examples of vernacular building can be seen in some old fishermen's houses beside the harbour.
Cullen The first small harbour was built in 1817. The harbour was expanded and an additional pier added. The present construction dates from 1887.
Interestingly in 1699 a grant of £500 Scots was authorised for the repair of a ―pier, the harbour and a bridge‖ but there was no record of a harbour existing. In 1794 the parish minister noted the lack of a harbour and remarked that ―one was badly needed to serve for the import of coal‖.
Moray‘s built heritage – the archaeological sites, listed buildings, scheduled monuments, traditional fishing villages, gardens and designed landscapes – provide the historical background of Moray and contribute to the special and unique characteristics of the area. They also foster a sense of human attachment and belonging. However, the regulations that are in place to protect and conserve these sites and monuments place strict controls on the style and extent of development that can take place, sometimes creating conflict between planning authorities and those wishing to develop. However, the Local Development Plan helps to minimise any discord by setting out what type of development should take place where, and which areas should not be developed. The supplementary guidance issued alongside the Local Plan provides more detailed information about specific areas or types of development.
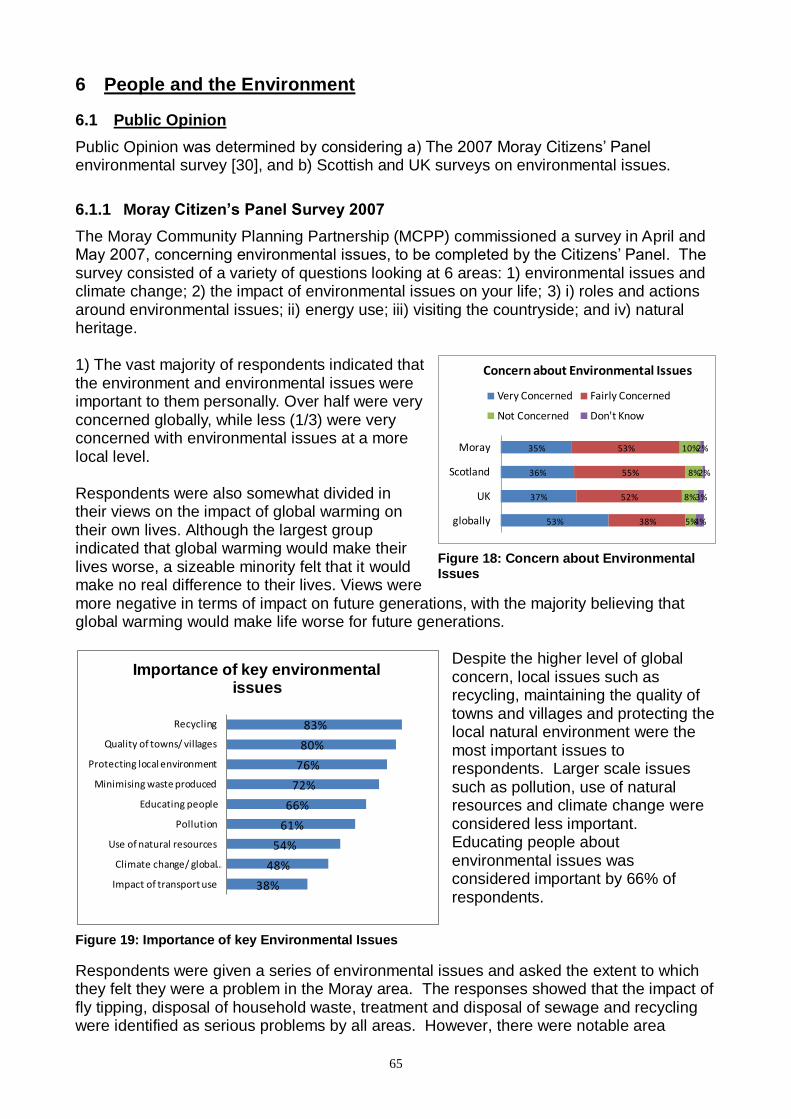
65
6 People and the Environment
6.1 Public Opinion
Public Opinion was determined by considering a) The 2007 Moray Citizens‘ Panel environmental survey [30], and b) Scottish and UK surveys on environmental issues.
6.1.1 Moray Citizen’s Panel Survey 2007
The Moray Community Planning Partnership (MCPP) commissioned a survey in April and May 2007, concerning environmental issues, to be completed by the Citizens‘ Panel. The survey consisted of a variety of questions looking at 6 areas: 1) environmental issues and climate change; 2) the impact of environmental issues on your life; 3) i) roles and actions around environmental issues; ii) energy use; iii) visiting the countryside; and iv) natural heritage. 1) The vast majority of respondents indicated that the environment and environmental issues were important to them personally. Over half were very concerned globally, while less (1/3) were very concerned with environmental issues at a more local level. Respondents were also somewhat divided in their views on the impact of global warming on their own lives. Although the largest group indicated that global warming would make their lives worse, a sizeable minority felt that it would make no real difference to their lives. Views were more negative in terms of impact on future generations, with the majority believing that global warming would make life worse for future generations.
Despite the higher level of global concern, local issues such as recycling, maintaining the quality of towns and villages and protecting the local natural environment were the most important issues to respondents. Larger scale issues such as pollution, use of natural resources and climate change were considered less important. Educating people about environmental issues was considered important by 66% of respondents.
Respondents were given a series of environmental issues and asked the extent to which they felt they were a problem in the Moray area. The responses showed that the impact of fly tipping, disposal of household waste, treatment and disposal of sewage and recycling were identified as serious problems by all areas. However, there were notable area
53%
37%
36%
35%
38%
52%
55%
53%
5%
8%
8%
10%
4%
3%
2%
2%
globally
UK
Scotland
Moray
Concern about Environmental Issues
Very Concerned Fairly Concerned
Not Concerned Don't Know
Figure 18: Concern about Environmental Issues
38%
48%
54%
61%
66%
72%
76%
80%
83%
Impact of transport use
Climate change/ global …
Use of natural resources
Pollution
Educating people
Minimising waste produced
Protecting local environment
Quality of towns/ villages
Recycling
Importance of key environmental issues
Figure 19: Importance of key Environmental Issues
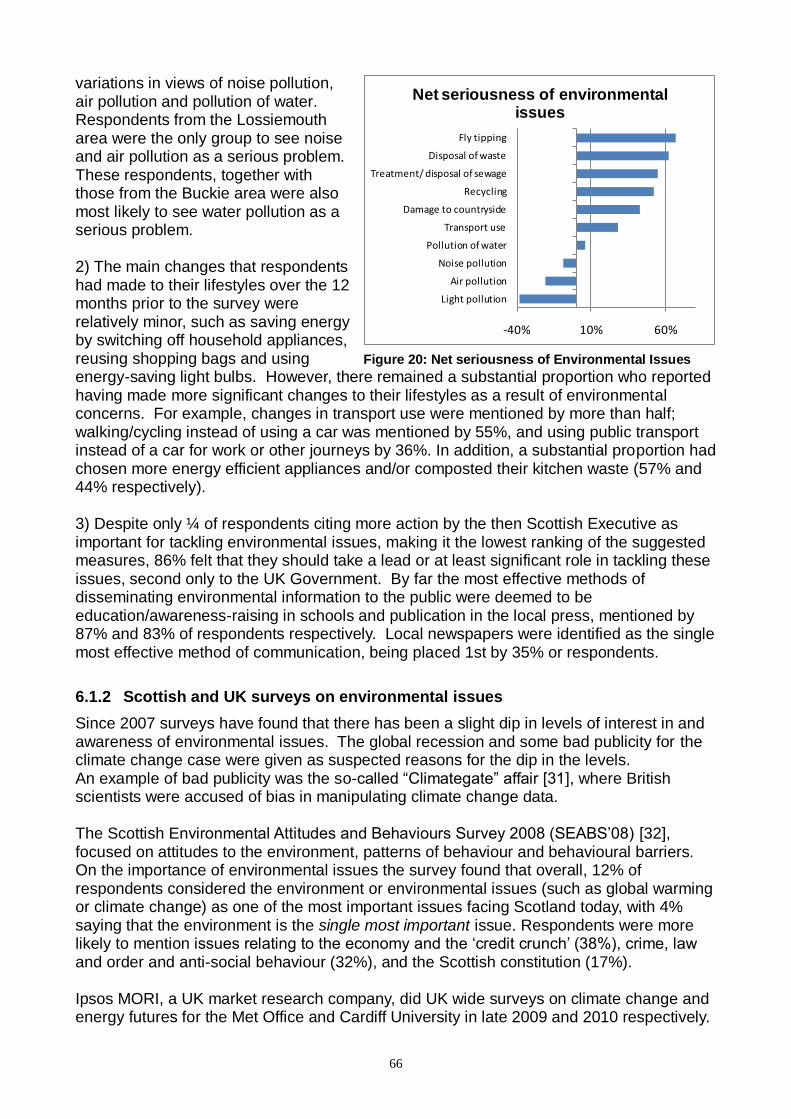
66
variations in views of noise pollution, air pollution and pollution of water. Respondents from the Lossiemouth area were the only group to see noise and air pollution as a serious problem. These respondents, together with those from the Buckie area were also most likely to see water pollution as a serious problem. 2) The main changes that respondents had made to their lifestyles over the 12 months prior to the survey were relatively minor, such as saving energy by switching off household appliances, reusing shopping bags and using energy-saving light bulbs. However, there remained a substantial proportion who reported having made more significant changes to their lifestyles as a result of environmental concerns. For example, changes in transport use were mentioned by more than half; walking/cycling instead of using a car was mentioned by 55%, and using public transport instead of a car for work or other journeys by 36%. In addition, a substantial proportion had chosen more energy efficient appliances and/or composted their kitchen waste (57% and 44% respectively). 3) Despite only ¼ of respondents citing more action by the then Scottish Executive as important for tackling environmental issues, making it the lowest ranking of the suggested measures, 86% felt that they should take a lead or at least significant role in tackling these issues, second only to the UK Government. By far the most effective methods of disseminating environmental information to the public were deemed to be education/awareness-raising in schools and publication in the local press, mentioned by 87% and 83% of respondents respectively. Local newspapers were identified as the single most effective method of communication, being placed 1st by 35% or respondents.
6.1.2 Scottish and UK surveys on environmental issues
Since 2007 surveys have found that there has been a slight dip in levels of interest in and awareness of environmental issues. The global recession and some bad publicity for the climate change case were given as suspected reasons for the dip in the levels. An example of bad publicity was the so-called ―Climategate‖ affair [31], where British scientists were accused of bias in manipulating climate change data. The Scottish Environmental Attitudes and Behaviours Survey 2008 (SEABS‘08) [32], focused on attitudes to the environment, patterns of behaviour and behavioural barriers. On the importance of environmental issues the survey found that overall, 12% of respondents considered the environment or environmental issues (such as global warming or climate change) as one of the most important issues facing Scotland today, with 4% saying that the environment is the single most important issue. Respondents were more likely to mention issues relating to the economy and the ‗credit crunch‘ (38%), crime, law and order and anti-social behaviour (32%), and the Scottish constitution (17%).
Ipsos MORI, a UK market research company, did UK wide surveys on climate change and energy futures for the Met Office and Cardiff University in late 2009 and 2010 respectively.
-40% 10% 60%
Light pollution
Air pollution
Noise pollution
Pollution of water
Transport use
Damage to countryside
Recycling
Treatment/ disposal of sewage
Disposal of waste
Fly tipping
Net seriousness of environmental issues
Figure 20: Net seriousness of Environmental Issues
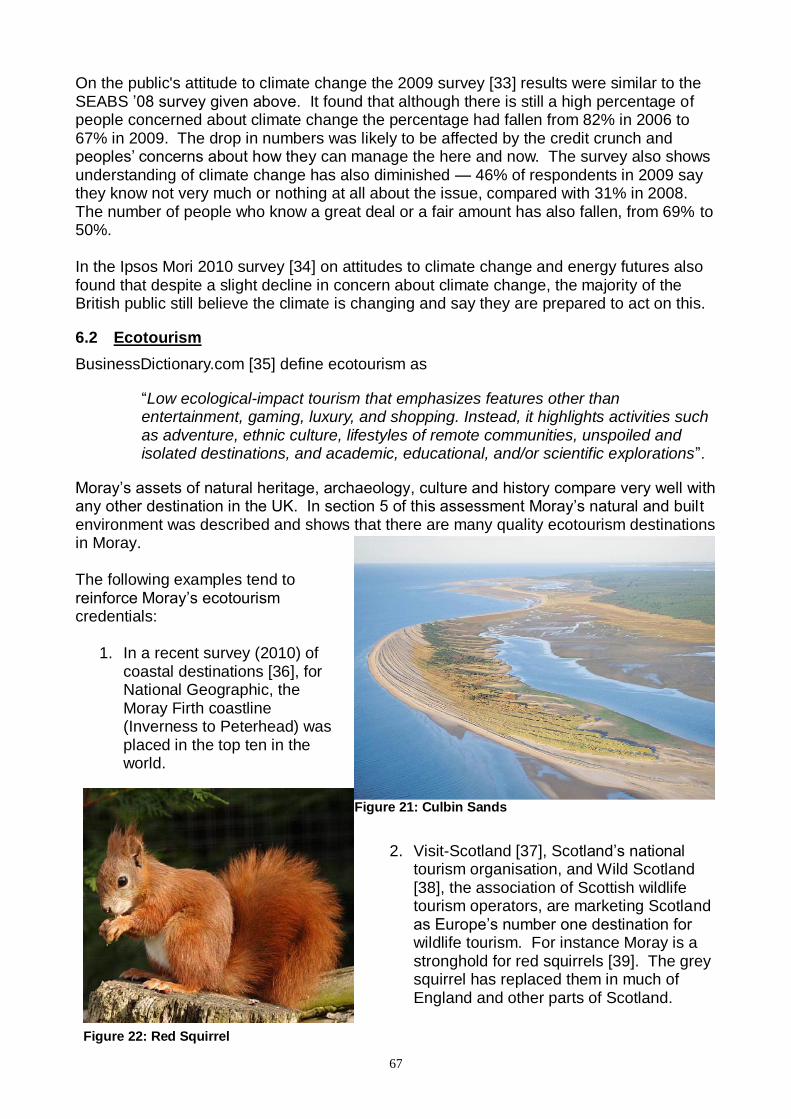
67
On the public's attitude to climate change the 2009 survey [33] results were similar to the SEABS ‘08 survey given above. It found that although there is still a high percentage of people concerned about climate change the percentage had fallen from 82% in 2006 to 67% in 2009. The drop in numbers was likely to be affected by the credit crunch and peoples‘ concerns about how they can manage the here and now. The survey also shows understanding of climate change has also diminished — 46% of respondents in 2009 say they know not very much or nothing at all about the issue, compared with 31% in 2008. The number of people who know a great deal or a fair amount has also fallen, from 69% to 50%.
In the Ipsos Mori 2010 survey [34] on attitudes to climate change and energy futures also found that despite a slight decline in concern about climate change, the majority of the British public still believe the climate is changing and say they are prepared to act on this.
6.2 Ecotourism
BusinessDictionary.com [35] define ecotourism as
―Low ecological-impact tourism that emphasizes features other than entertainment, gaming, luxury, and shopping. Instead, it highlights activities such as adventure, ethnic culture, lifestyles of remote communities, unspoiled and isolated destinations, and academic, educational, and/or scientific explorations‖.
Moray‘s assets of natural heritage, archaeology, culture and history compare very well with any other destination in the UK. In section 5 of this assessment Moray‘s natural and built environment was described and shows that there are many quality ecotourism destinations in Moray. The following examples tend to reinforce Moray‘s ecotourism credentials:
1. In a recent survey (2010) of coastal destinations [36], for National Geographic, the Moray Firth coastline (Inverness to Peterhead) was placed in the top ten in the world.
2. Visit-Scotland [37], Scotland‘s national tourism organisation, and Wild Scotland [38], the association of Scottish wildlife tourism operators, are marketing Scotland as Europe‘s number one destination for wildlife tourism. For instance Moray is a stronghold for red squirrels [39]. The grey squirrel has replaced them in much of England and other parts of Scotland.
Figure 21: Culbin Sands
Figure 22: Red Squirrel
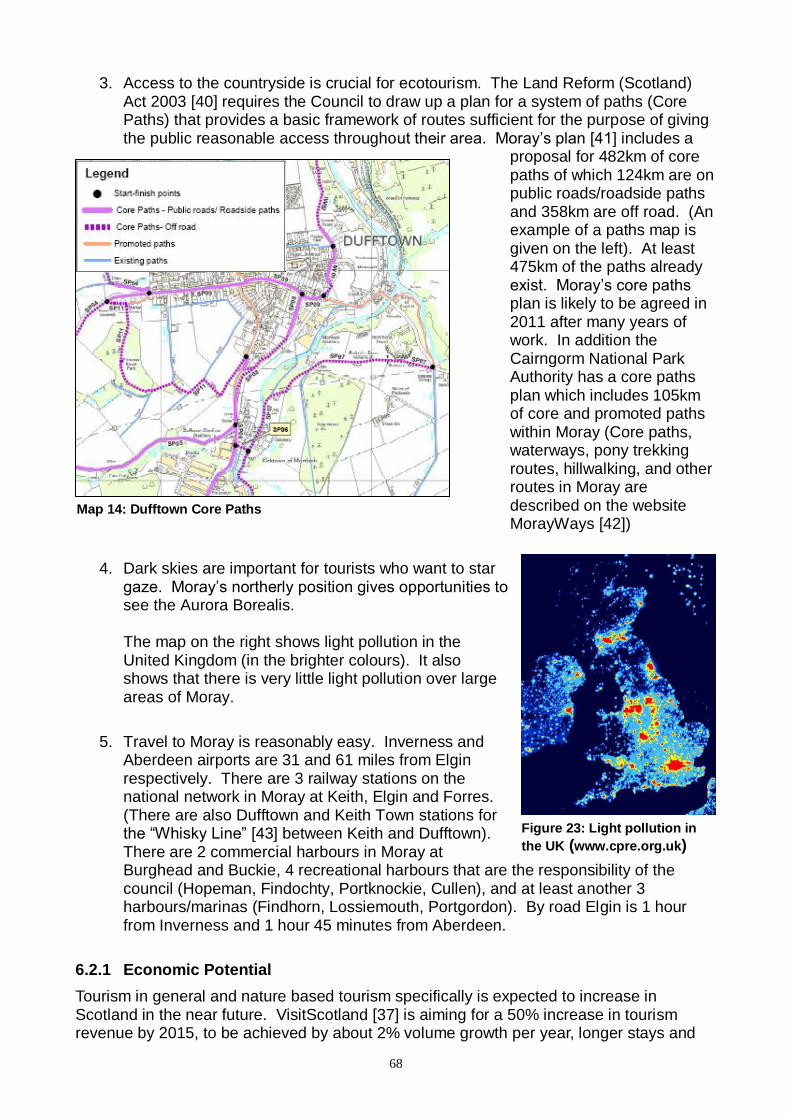
68
3. Access to the countryside is crucial for ecotourism. The Land Reform (Scotland) Act 2003 [40] requires the Council to draw up a plan for a system of paths (Core Paths) that provides a basic framework of routes sufficient for the purpose of giving the public reasonable access throughout their area. Moray‘s plan [41] includes a
proposal for 482km of core paths of which 124km are on public roads/roadside paths and 358km are off road. (An example of a paths map is given on the left). At least 475km of the paths already exist. Moray‘s core paths plan is likely to be agreed in 2011 after many years of work. In addition the Cairngorm National Park Authority has a core paths plan which includes 105km of core and promoted paths within Moray (Core paths, waterways, pony trekking routes, hillwalking, and other routes in Moray are described on the website MorayWays [42])
4. Dark skies are important for tourists who want to star gaze. Moray‘s northerly position gives opportunities to see the Aurora Borealis. The map on the right shows light pollution in the United Kingdom (in the brighter colours). It also shows that there is very little light pollution over large areas of Moray.
5. Travel to Moray is reasonably easy. Inverness and Aberdeen airports are 31 and 61 miles from Elgin respectively. There are 3 railway stations on the national network in Moray at Keith, Elgin and Forres. (There are also Dufftown and Keith Town stations for the ―Whisky Line‖ [43] between Keith and Dufftown). There are 2 commercial harbours in Moray at Burghead and Buckie, 4 recreational harbours that are the responsibility of the council (Hopeman, Findochty, Portknockie, Cullen), and at least another 3 harbours/marinas (Findhorn, Lossiemouth, Portgordon). By road Elgin is 1 hour from Inverness and 1 hour 45 minutes from Aberdeen.
6.2.1 Economic Potential
Tourism in general and nature based tourism specifically is expected to increase in Scotland in the near future. VisitScotland [37] is aiming for a 50% increase in tourism revenue by 2015, to be achieved by about 2% volume growth per year, longer stays and
Figure 23: Light pollution in
the UK (www.cpre.org.uk)
Map 14: Dufftown Core Paths
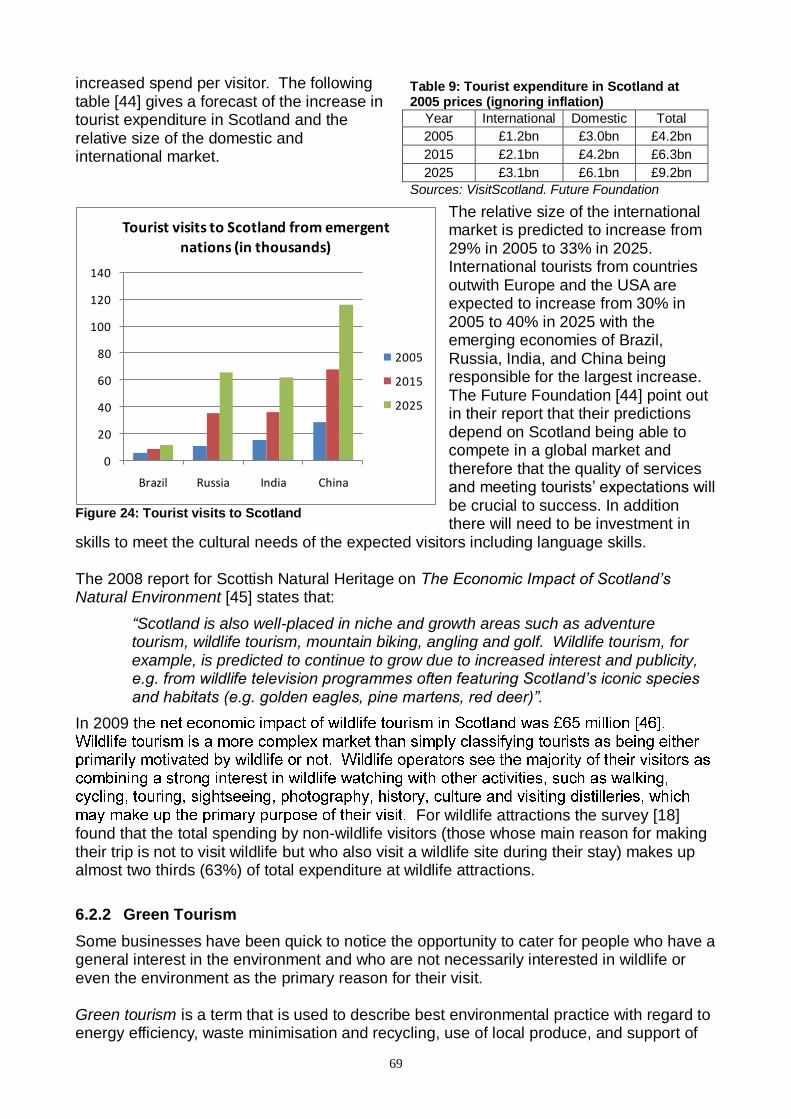
69
increased spend per visitor. The following table [44] gives a forecast of the increase in tourist expenditure in Scotland and the relative size of the domestic and international market.
The relative size of the international market is predicted to increase from 29% in 2005 to 33% in 2025. International tourists from countries outwith Europe and the USA are expected to increase from 30% in 2005 to 40% in 2025 with the emerging economies of Brazil, Russia, India, and China being responsible for the largest increase. The Future Foundation [44] point out in their report that their predictions depend on Scotland being able to compete in a global market and therefore that the quality of services and meeting tourists‘ expectations will be crucial to success. In addition there will need to be investment in
skills to meet the cultural needs of the expected visitors including language skills. The 2008 report for Scottish Natural Heritage on The Economic Impact of Scotland’s Natural Environment [45] states that:
“Scotland is also well-placed in niche and growth areas such as adventure tourism, wildlife tourism, mountain biking, angling and golf. Wildlife tourism, for example, is predicted to continue to grow due to increased interest and publicity, e.g. from wildlife television programmes often featuring Scotland’s iconic species and habitats (e.g. golden eagles, pine martens, red deer)”.
In 2009 t
For wildlife attractions the survey [18] found that the total spending by non-wildlife visitors (those whose main reason for making their trip is not to visit wildlife but who also visit a wildlife site during their stay) makes up almost two thirds (63%) of total expenditure at wildlife attractions.
6.2.2 Green Tourism
Some businesses have been quick to notice the opportunity to cater for people who have a general interest in the environment and who are not necessarily interested in wildlife or even the environment as the primary reason for their visit. Green tourism is a term that is used to describe best environmental practice with regard to energy efficiency, waste minimisation and recycling, use of local produce, and support of
Table 9: Tourist expenditure in Scotland at 2005 prices (ignoring inflation)
Year International Domestic Total
2005 £1.2bn £3.0bn £4.2bn
2015 £2.1bn £4.2bn £6.3bn
2025 £3.1bn £6.1bn £9.2bn
Sources: VisitScotland, Future Foundation
Figure 24: Tourist visits to Scotland
0
20
40
60
80
100
120
140
Brazil Russia India China
Tourist visits to Scotland from emergent nations (in thousands)
2005
2015
2025
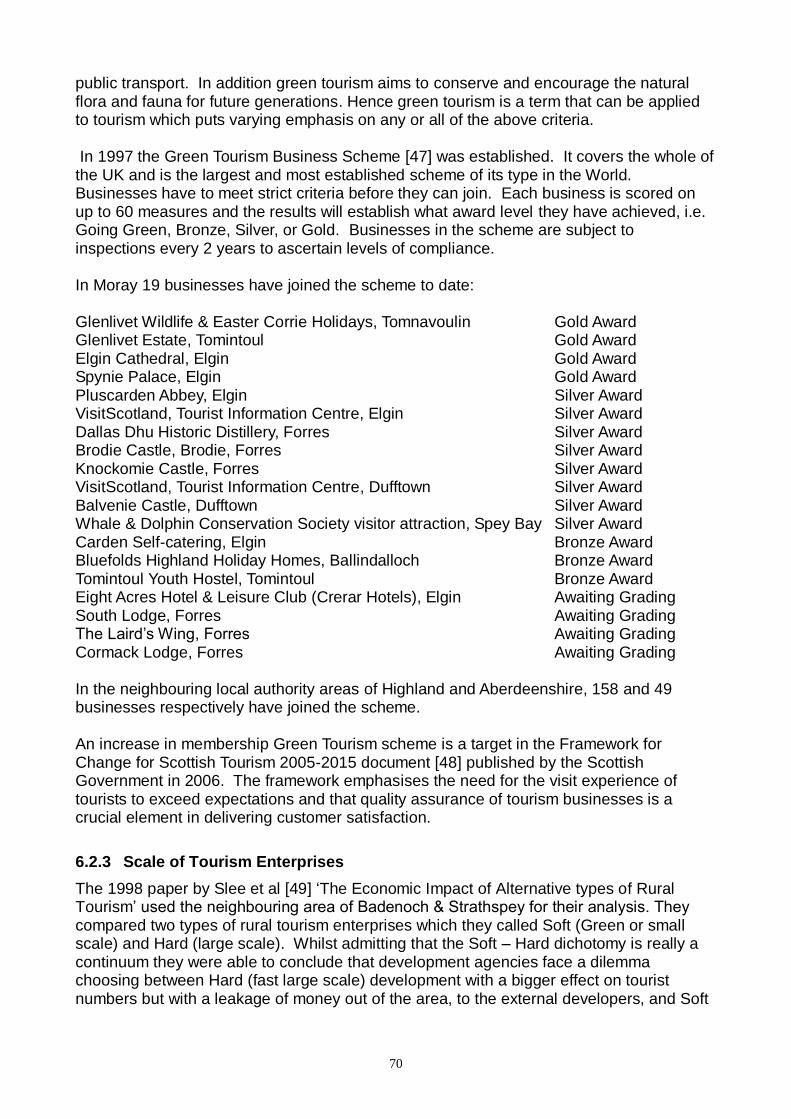
70
public transport. In addition green tourism aims to conserve and encourage the natural flora and fauna for future generations. Hence green tourism is a term that can be applied to tourism which puts varying emphasis on any or all of the above criteria. In 1997 the Green Tourism Business Scheme [47] was established. It covers the whole of the UK and is the largest and most established scheme of its type in the World. Businesses have to meet strict criteria before they can join. Each business is scored on up to 60 measures and the results will establish what award level they have achieved, i.e. Going Green, Bronze, Silver, or Gold. Businesses in the scheme are subject to inspections every 2 years to ascertain levels of compliance. In Moray 19 businesses have joined the scheme to date: Glenlivet Wildlife & Easter Corrie Holidays, Tomnavoulin Gold Award Glenlivet Estate, Tomintoul Gold Award Elgin Cathedral, Elgin Gold Award Spynie Palace, Elgin Gold Award Pluscarden Abbey, Elgin Silver Award VisitScotland, Tourist Information Centre, Elgin Silver Award Dallas Dhu Historic Distillery, Forres Silver Award Brodie Castle, Brodie, Forres Silver Award Knockomie Castle, Forres Silver Award VisitScotland, Tourist Information Centre, Dufftown Silver Award Balvenie Castle, Dufftown Silver Award Whale & Dolphin Conservation Society visitor attraction, Spey Bay Silver Award Carden Self-catering, Elgin Bronze Award Bluefolds Highland Holiday Homes, Ballindalloch Bronze Award Tomintoul Youth Hostel, Tomintoul Bronze Award Eight Acres Hotel & Leisure Club (Crerar Hotels), Elgin Awaiting Grading South Lodge, Forres Awaiting Grading The Laird‘s Wing, Forres Awaiting Grading Cormack Lodge, Forres Awaiting Grading In the neighbouring local authority areas of Highland and Aberdeenshire, 158 and 49 businesses respectively have joined the scheme. An increase in membership Green Tourism scheme is a target in the Framework for Change for Scottish Tourism 2005-2015 document [48] published by the Scottish Government in 2006. The framework emphasises the need for the visit experience of tourists to exceed expectations and that quality assurance of tourism businesses is a crucial element in delivering customer satisfaction.
6.2.3 Scale of Tourism Enterprises
The 1998 paper by Slee et al [49] ‗The Economic Impact of Alternative types of Rural Tourism‘ used the neighbouring area of Badenoch & Strathspey for their analysis. They compared two types of rural tourism enterprises which they called Soft (Green or small scale) and Hard (large scale). Whilst admitting that the Soft – Hard dichotomy is really a continuum they were able to conclude that development agencies face a dilemma choosing between Hard (fast large scale) development with a bigger effect on tourist numbers but with a leakage of money out of the area, to the external developers, and Soft
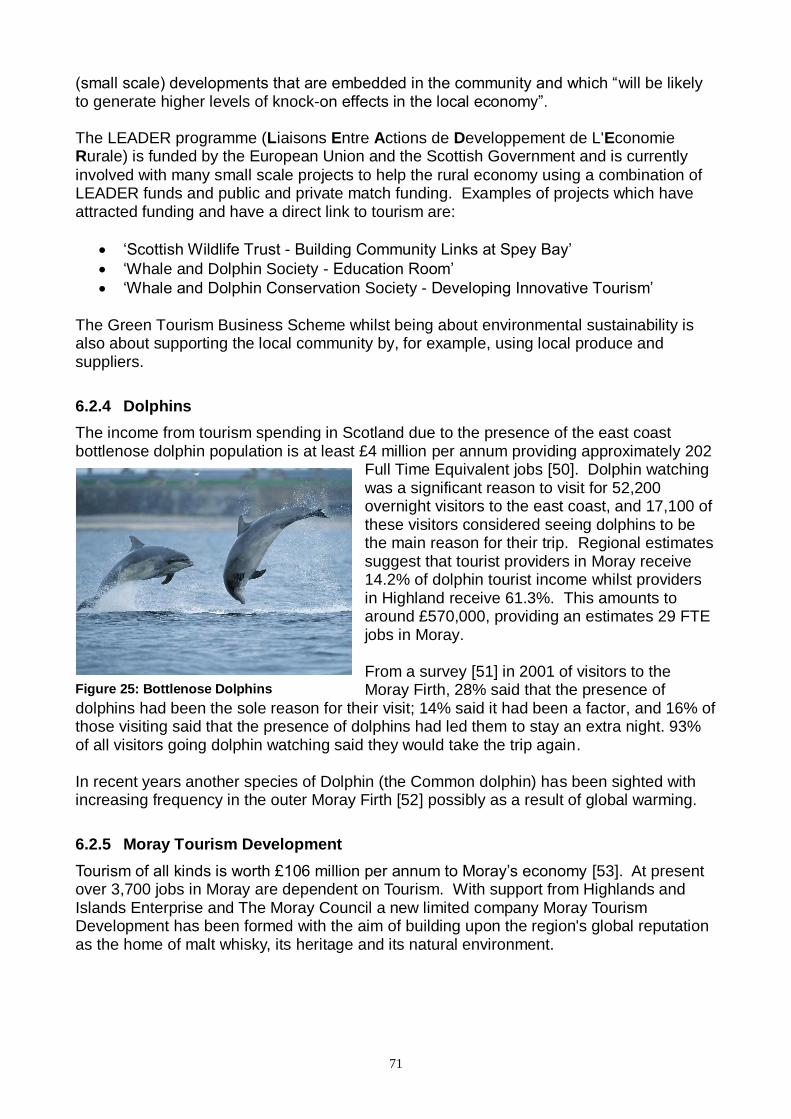
71
(small scale) developments that are embedded in the community and which ―will be likely to generate higher levels of knock-on effects in the local economy‖. The LEADER programme (Liaisons Entre Actions de Developpement de L'Economie Rurale) is funded by the European Union and the Scottish Government and is currently
involved with many small scale projects to help the rural economy using a combination of LEADER funds and public and private match funding. Examples of projects which have attracted funding and have a direct link to tourism are:
‗Scottish Wildlife Trust - Building Community Links at Spey Bay‘
‗Whale and Dolphin Society - Education Room‘
‗Whale and Dolphin Conservation Society - Developing Innovative Tourism‘ The Green Tourism Business Scheme whilst being about environmental sustainability is also about supporting the local community by, for example, using local produce and suppliers.
6.2.4 Dolphins
The income from tourism spending in Scotland due to the presence of the east coast bottlenose dolphin population is at least £4 million per annum providing approximately 202
Full Time Equivalent jobs [50]. Dolphin watching was a significant reason to visit for 52,200 overnight visitors to the east coast, and 17,100 of these visitors considered seeing dolphins to be the main reason for their trip. Regional estimates suggest that tourist providers in Moray receive 14.2% of dolphin tourist income whilst providers in Highland receive 61.3%. This amounts to around £570,000, providing an estimates 29 FTE jobs in Moray. From a survey [51] in 2001 of visitors to the Moray Firth, 28% said that the presence of
dolphins had been the sole reason for their visit; 14% said it had been a factor, and 16% of those visiting said that the presence of dolphins had led them to stay an extra night. 93% of all visitors going dolphin watching said they would take the trip again. In recent years another species of Dolphin (the Common dolphin) has been sighted with increasing frequency in the outer Moray Firth [52] possibly as a result of global warming.
6.2.5 Moray Tourism Development
Tourism of all kinds is worth £106 million per annum to Moray‘s economy [53]. At present over 3,700 jobs in Moray are dependent on Tourism. With support from Highlands and Islands Enterprise and The Moray Council a new limited company Moray Tourism Development has been formed with the aim of building upon the region's global reputation as the home of malt whisky, its heritage and its natural environment.
Figure 25: Bottlenose Dolphins
72
6.3 Volunteering
6.3.1 Organisation of Volunteering in Moray
Across Scotland the Councils for Voluntary Service (CVS) Network, consisting of 56 independent organisations provide a range of development and support services to voluntary organisations. CVS activity is supported by the Scottish Executive and local authorities.
In Moray, Voluntary Action Moray (VAM) is the only organisation in the CVS network. VAM provide all kinds of information, from coordination, insurance, basic book-keeping advice, to administration, legal and funding advice to volunteer groups. In addition they also can provide office services, such as low-price photocopying, laminating, and scanning and help with advertising leaflets and posters.
The Volunteer Centre Moray (VCM) also supports voluntary groups. Its main role is to match volunteers to groups and groups to volunteers. They advertise volunteer opportunities and advise on the role of volunteers within organisations. There are volunteer organisations working in Moray which are not registered with VCM or VAM including the Royal Society for the Protection of Birds who sometimes have volunteers working at Culbin Sands and the Moray Firth Partnership who are involved in many projects to do with the environmental sustainability in the whole of the Moray Firth area including producing a survey of the impact of the presence of Bottlenose Dolphin on tourism [50]. Also volunteers give their time on single projects. For example 123 people have recently volunteered for the Green Dog Walkers initiative [54]. Moray residents also volunteer their time doing environmental tasks without being part of any group or organisation. All sorts of voluntary actions are done from spending a minute or two picking up litter to spending many months tidying up the bed and the banks of the Buckie Burn and planting flowers on the slopes as was done by the Buckie Citizen of the Year 2004 [55]. Voluntary environmental groups including The Rural Environmental Action Project (REAP)33 and Moray Waste Busters34 are members of the Moray Social Enterprise Network. 6.3.1.1 Organisational Changes
In recent months there have been significant changes in the organisation of the voluntary sector in Moray. Voluntary Action Moray (VAM) have taken over the role of Moray Voluntary Service Organisation (MVSO) and have agreed a much closer working model with the Volunteer Centre Moray (VCM) as an interim measure until 1 April 2011. From this date the newly established Voluntary Sector Partnership Moray (VSPM) will be the interface between government and the voluntary sector in Moray.
33
http://www.reapscotland.org.uk/ 34
http://www.moraywastebusters.org/
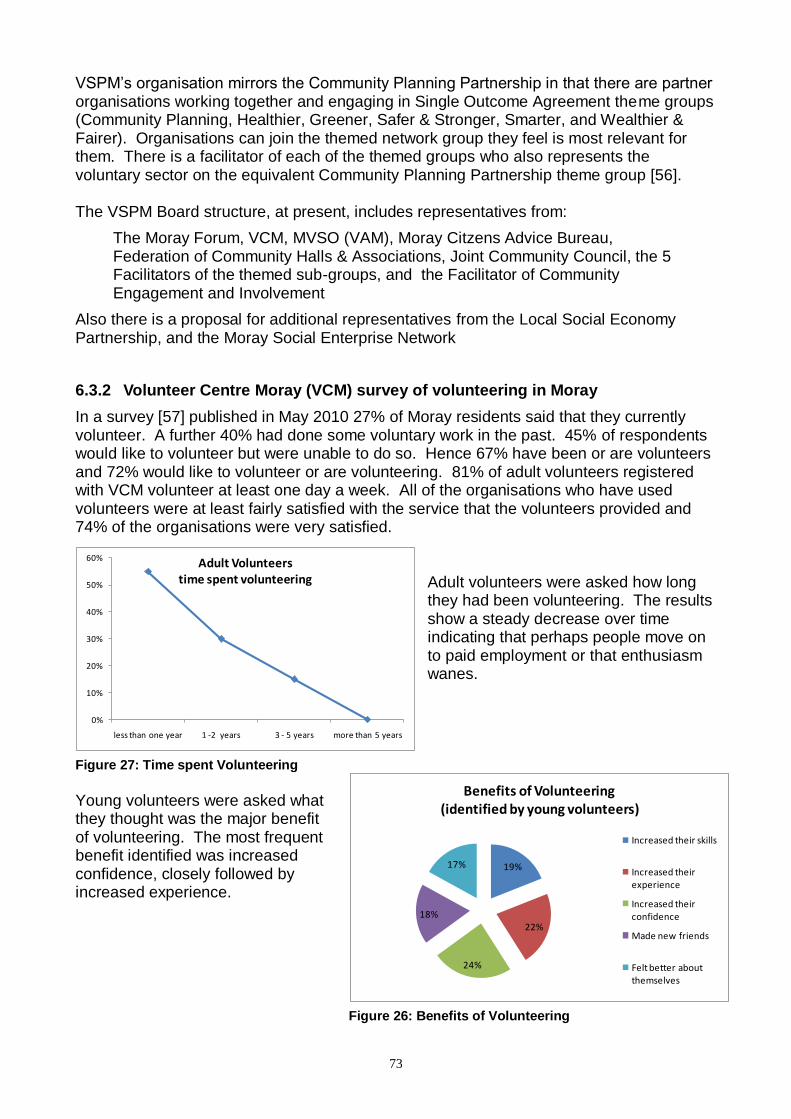
73
VSPM‘s organisation mirrors the Community Planning Partnership in that there are partner organisations working together and engaging in Single Outcome Agreement theme groups (Community Planning, Healthier, Greener, Safer & Stronger, Smarter, and Wealthier & Fairer). Organisations can join the themed network group they feel is most relevant for them. There is a facilitator of each of the themed groups who also represents the voluntary sector on the equivalent Community Planning Partnership theme group [56]. The VSPM Board structure, at present, includes representatives from:
The Moray Forum, VCM, MVSO (VAM), Moray Citzens Advice Bureau, Federation of Community Halls & Associations, Joint Community Council, the 5 Facilitators of the themed sub-groups, and the Facilitator of Community Engagement and Involvement
Also there is a proposal for additional representatives from the Local Social Economy Partnership, and the Moray Social Enterprise Network
6.3.2 Volunteer Centre Moray (VCM) survey of volunteering in Moray
In a survey [57] published in May 2010 27% of Moray residents said that they currently volunteer. A further 40% had done some voluntary work in the past. 45% of respondents would like to volunteer but were unable to do so. Hence 67% have been or are volunteers and 72% would like to volunteer or are volunteering. 81% of adult volunteers registered with VCM volunteer at least one day a week. All of the organisations who have used volunteers were at least fairly satisfied with the service that the volunteers provided and 74% of the organisations were very satisfied.
Adult volunteers were asked how long they had been volunteering. The results show a steady decrease over time indicating that perhaps people move on to paid employment or that enthusiasm wanes.
Young volunteers were asked what they thought was the major benefit of volunteering. The most frequent benefit identified was increased confidence, closely followed by increased experience.
19%
22%
24%
18%
17%
Benefits of Volunteering (identified by young volunteers)
Increased their skills
Increased their experience
Increased their confidence
Made new friends
Felt better about themselves
Figure 26: Benefits of Volunteering
0%
10%
20%
30%
40%
50%
60%
less than one year 1 -2 years 3 - 5 years more than 5 years
Adult Volunteers time spent volunteering
Figure 27: Time spent Volunteering
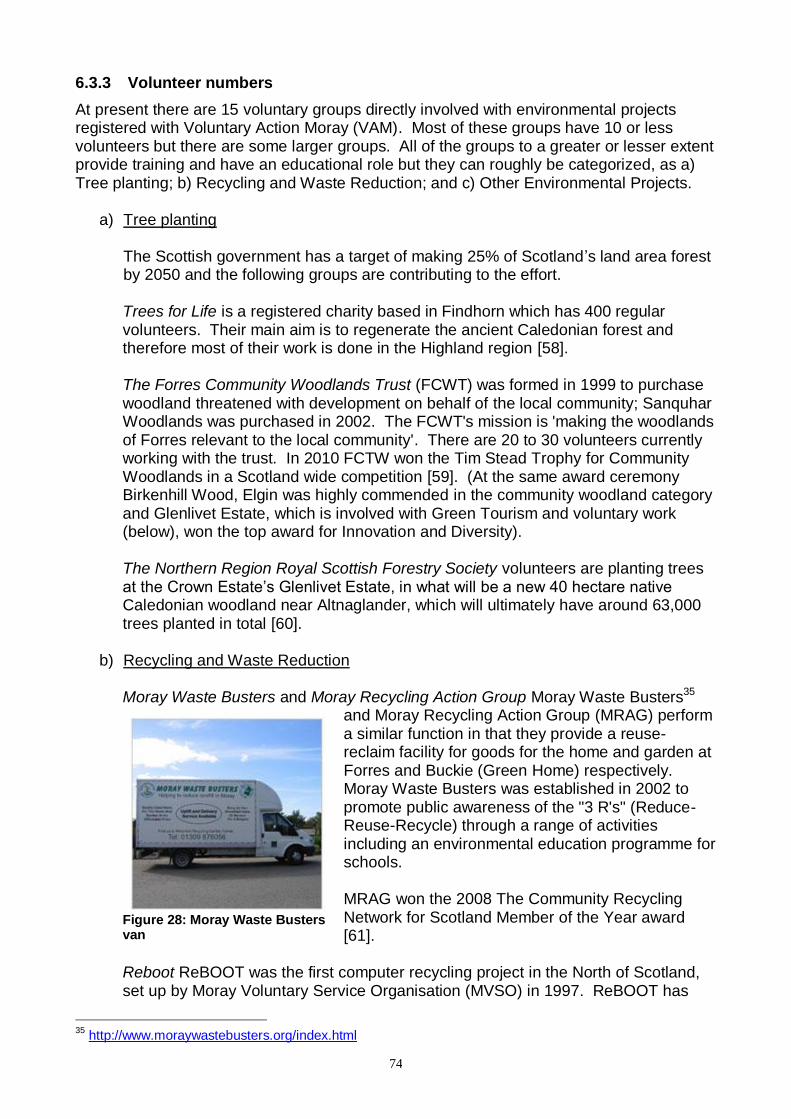
74
6.3.3 Volunteer numbers
At present there are 15 voluntary groups directly involved with environmental projects registered with Voluntary Action Moray (VAM). Most of these groups have 10 or less volunteers but there are some larger groups. All of the groups to a greater or lesser extent provide training and have an educational role but they can roughly be categorized, as a) Tree planting; b) Recycling and Waste Reduction; and c) Other Environmental Projects.
a) Tree planting The Scottish government has a target of making 25% of Scotland‘s land area forest by 2050 and the following groups are contributing to the effort. Trees for Life is a registered charity based in Findhorn which has 400 regular volunteers. Their main aim is to regenerate the ancient Caledonian forest and therefore most of their work is done in the Highland region [58]. The Forres Community Woodlands Trust (FCWT) was formed in 1999 to purchase woodland threatened with development on behalf of the local community; Sanquhar Woodlands was purchased in 2002. The FCWT's mission is 'making the woodlands of Forres relevant to the local community'. There are 20 to 30 volunteers currently working with the trust. In 2010 FCTW won the Tim Stead Trophy for Community Woodlands in a Scotland wide competition [59]. (At the same award ceremony Birkenhill Wood, Elgin was highly commended in the community woodland category and Glenlivet Estate, which is involved with Green Tourism and voluntary work (below), won the top award for Innovation and Diversity). The Northern Region Royal Scottish Forestry Society volunteers are planting trees at the Crown Estate‘s Glenlivet Estate, in what will be a new 40 hectare native Caledonian woodland near Altnaglander, which will ultimately have around 63,000 trees planted in total [60].
b) Recycling and Waste Reduction Moray Waste Busters and Moray Recycling Action Group Moray Waste Busters35
and Moray Recycling Action Group (MRAG) perform a similar function in that they provide a reuse-reclaim facility for goods for the home and garden at Forres and Buckie (Green Home) respectively. Moray Waste Busters was established in 2002 to promote public awareness of the "3 R's" (Reduce-Reuse-Recycle) through a range of activities including an environmental education programme for schools.
MRAG won the 2008 The Community Recycling Network for Scotland Member of the Year award [61].
Reboot ReBOOT was the first computer recycling project in the North of Scotland, set up by Moray Voluntary Service Organisation (MVSO) in 1997. ReBOOT has
35
http://www.moraywastebusters.org/index.html
Figure 28: Moray Waste Busters van
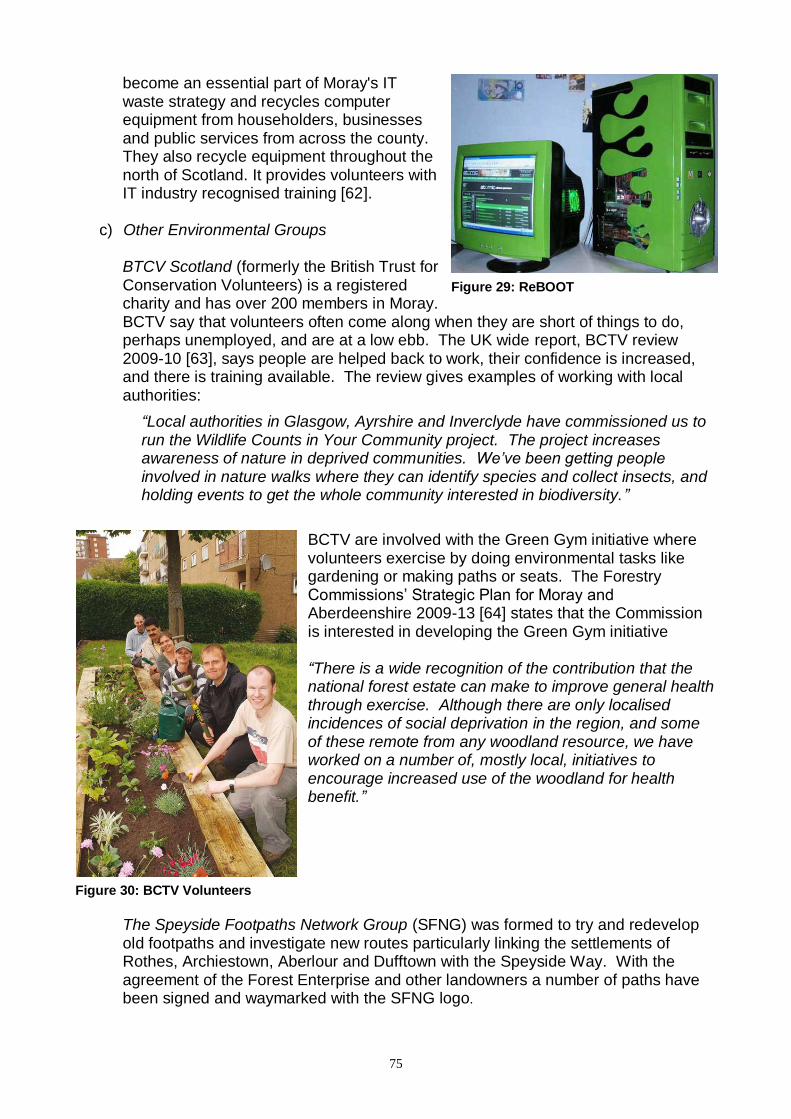
75
become an essential part of Moray's IT waste strategy and recycles computer equipment from householders, businesses and public services from across the county. They also recycle equipment throughout the north of Scotland. It provides volunteers with IT industry recognised training [62].
c) Other Environmental Groups
BTCV Scotland (formerly the British Trust for Conservation Volunteers) is a registered charity and has over 200 members in Moray. BCTV say that volunteers often come along when they are short of things to do, perhaps unemployed, and are at a low ebb. The UK wide report, BCTV review 2009-10 [63], says people are helped back to work, their confidence is increased, and there is training available. The review gives examples of working with local authorities:
“Local authorities in Glasgow, Ayrshire and Inverclyde have commissioned us to run the Wildlife Counts in Your Community project. The project increases awareness of nature in deprived communities. We’ve been getting people involved in nature walks where they can identify species and collect insects, and holding events to get the whole community interested in biodiversity.”
BCTV are involved with the Green Gym initiative where volunteers exercise by doing environmental tasks like gardening or making paths or seats. The Forestry Commissions‘ Strategic Plan for Moray and Aberdeenshire 2009-13 [64] states that the Commission is interested in developing the Green Gym initiative “There is a wide recognition of the contribution that the national forest estate can make to improve general health through exercise. Although there are only localised incidences of social deprivation in the region, and some of these remote from any woodland resource, we have worked on a number of, mostly local, initiatives to encourage increased use of the woodland for health benefit.”
The Speyside Footpaths Network Group (SFNG) was formed to try and redevelop old footpaths and investigate new routes particularly linking the settlements of Rothes, Archiestown, Aberlour and Dufftown with the Speyside Way. With the agreement of the Forest Enterprise and other landowners a number of paths have been signed and waymarked with the SFNG logo.
Figure 29: ReBOOT
Figure 30: BCTV Volunteers
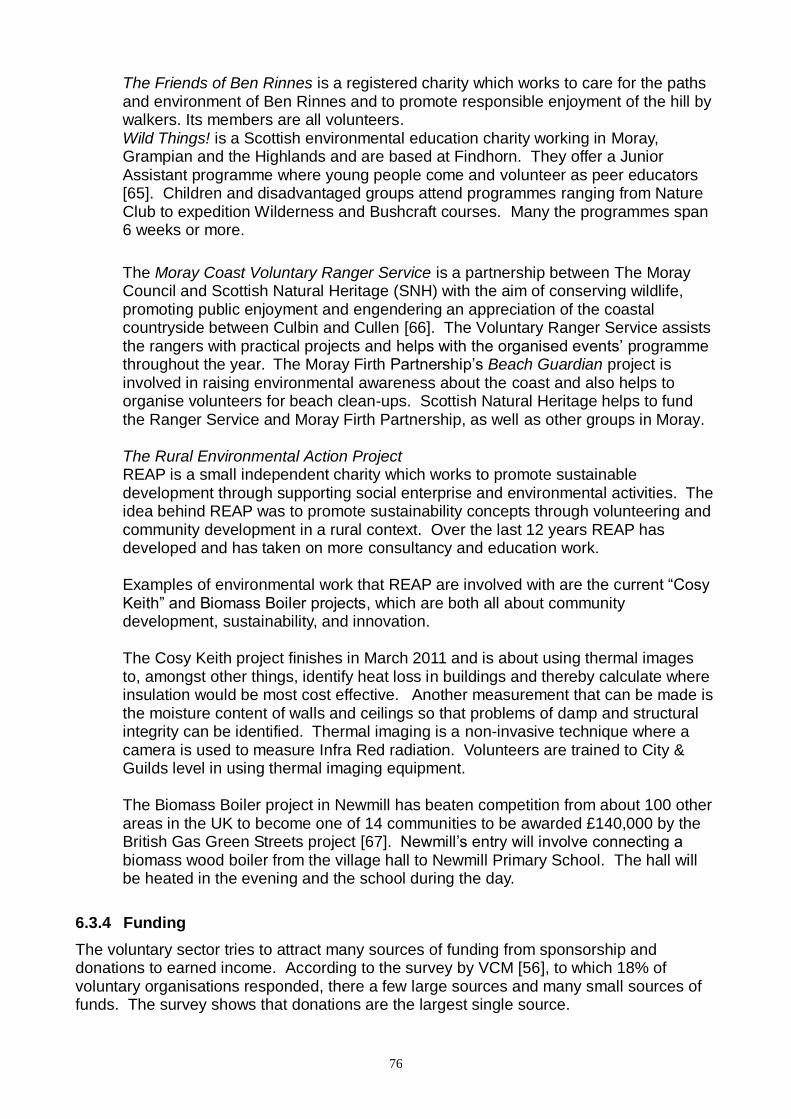
76
The Friends of Ben Rinnes is a registered charity which works to care for the paths and environment of Ben Rinnes and to promote responsible enjoyment of the hill by walkers. Its members are all volunteers. Wild Things! is a Scottish environmental education charity working in Moray, Grampian and the Highlands and are based at Findhorn. They offer a Junior Assistant programme where young people come and volunteer as peer educators [65]. Children and disadvantaged groups attend programmes ranging from Nature Club to expedition Wilderness and Bushcraft courses. Many the programmes span 6 weeks or more.
The Moray Coast Voluntary Ranger Service is a partnership between The Moray Council and Scottish Natural Heritage (SNH) with the aim of conserving wildlife, promoting public enjoyment and engendering an appreciation of the coastal countryside between Culbin and Cullen [66]. The Voluntary Ranger Service assists the rangers with practical projects and helps with the organised events‘ programme throughout the year. The Moray Firth Partnership‘s Beach Guardian project is involved in raising environmental awareness about the coast and also helps to organise volunteers for beach clean-ups. Scottish Natural Heritage helps to fund the Ranger Service and Moray Firth Partnership, as well as other groups in Moray. The Rural Environmental Action Project REAP is a small independent charity which works to promote sustainable development through supporting social enterprise and environmental activities. The idea behind REAP was to promote sustainability concepts through volunteering and community development in a rural context. Over the last 12 years REAP has developed and has taken on more consultancy and education work. Examples of environmental work that REAP are involved with are the current ―Cosy Keith‖ and Biomass Boiler projects, which are both all about community development, sustainability, and innovation. The Cosy Keith project finishes in March 2011 and is about using thermal images to, amongst other things, identify heat loss in buildings and thereby calculate where insulation would be most cost effective. Another measurement that can be made is the moisture content of walls and ceilings so that problems of damp and structural integrity can be identified. Thermal imaging is a non-invasive technique where a camera is used to measure Infra Red radiation. Volunteers are trained to City & Guilds level in using thermal imaging equipment. The Biomass Boiler project in Newmill has beaten competition from about 100 other areas in the UK to become one of 14 communities to be awarded £140,000 by the British Gas Green Streets project [67]. Newmill‘s entry will involve connecting a biomass wood boiler from the village hall to Newmill Primary School. The hall will be heated in the evening and the school during the day.
6.3.4 Funding
The voluntary sector tries to attract many sources of funding from sponsorship and donations to earned income. According to the survey by VCM [56], to which 18% of voluntary organisations responded, there a few large sources and many small sources of funds. The survey shows that donations are the largest single source.
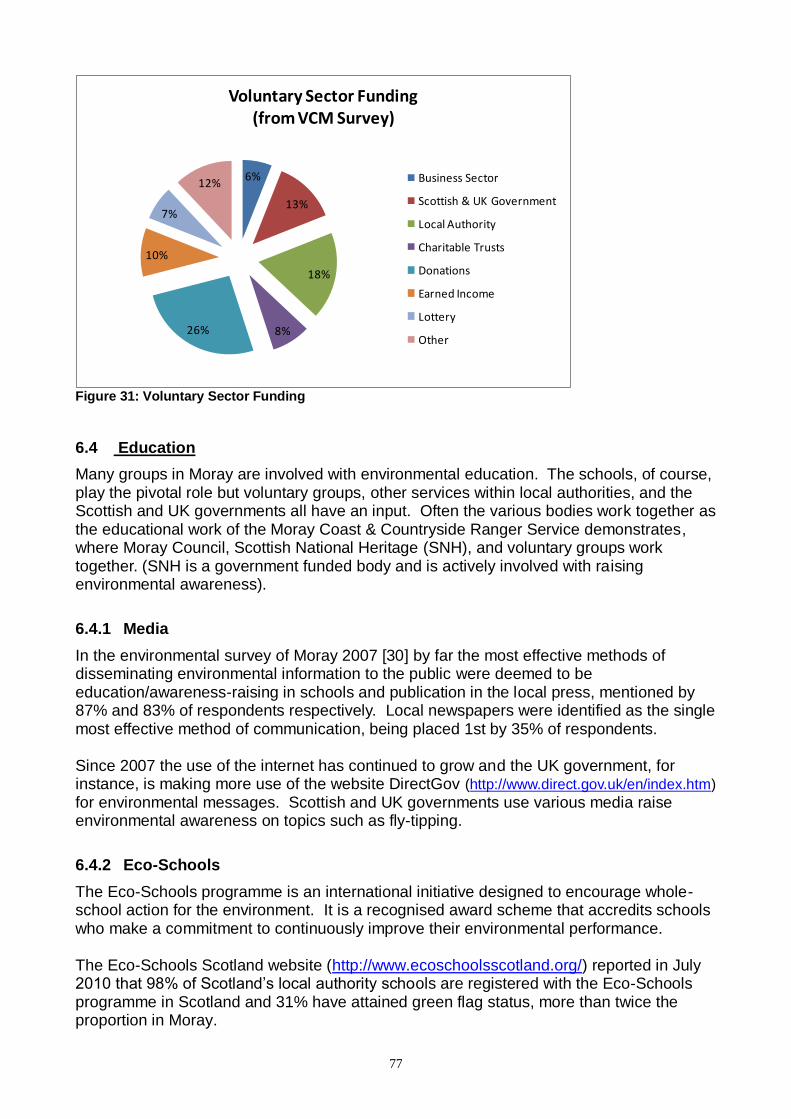
77
6%
13%
18%
8%26%
10%
7%
12%
Voluntary Sector Funding(from VCM Survey)
Business Sector
Scottish & UK Government
Local Authority
Charitable Trusts
Donations
Earned Income
Lottery
Other
Figure 31: Voluntary Sector Funding
6.4 Education
Many groups in Moray are involved with environmental education. The schools, of course, play the pivotal role but voluntary groups, other services within local authorities, and the Scottish and UK governments all have an input. Often the various bodies work together as the educational work of the Moray Coast & Countryside Ranger Service demonstrates, where Moray Council, Scottish National Heritage (SNH), and voluntary groups work together. (SNH is a government funded body and is actively involved with raising environmental awareness).
6.4.1 Media
In the environmental survey of Moray 2007 [30] by far the most effective methods of disseminating environmental information to the public were deemed to be education/awareness-raising in schools and publication in the local press, mentioned by 87% and 83% of respondents respectively. Local newspapers were identified as the single most effective method of communication, being placed 1st by 35% of respondents. Since 2007 the use of the internet has continued to grow and the UK government, for instance, is making more use of the website DirectGov (http://www.direct.gov.uk/en/index.htm) for environmental messages. Scottish and UK governments use various media raise environmental awareness on topics such as fly-tipping.
6.4.2 Eco-Schools
The Eco-Schools programme is an international initiative designed to encourage whole-school action for the environment. It is a recognised award scheme that accredits schools who make a commitment to continuously improve their environmental performance. The Eco-Schools Scotland website (http://www.ecoschoolsscotland.org/) reported in July 2010 that 98% of Scotland‘s local authority schools are registered with the Eco-Schools programme in Scotland and 31% have attained green flag status, more than twice the proportion in Moray.
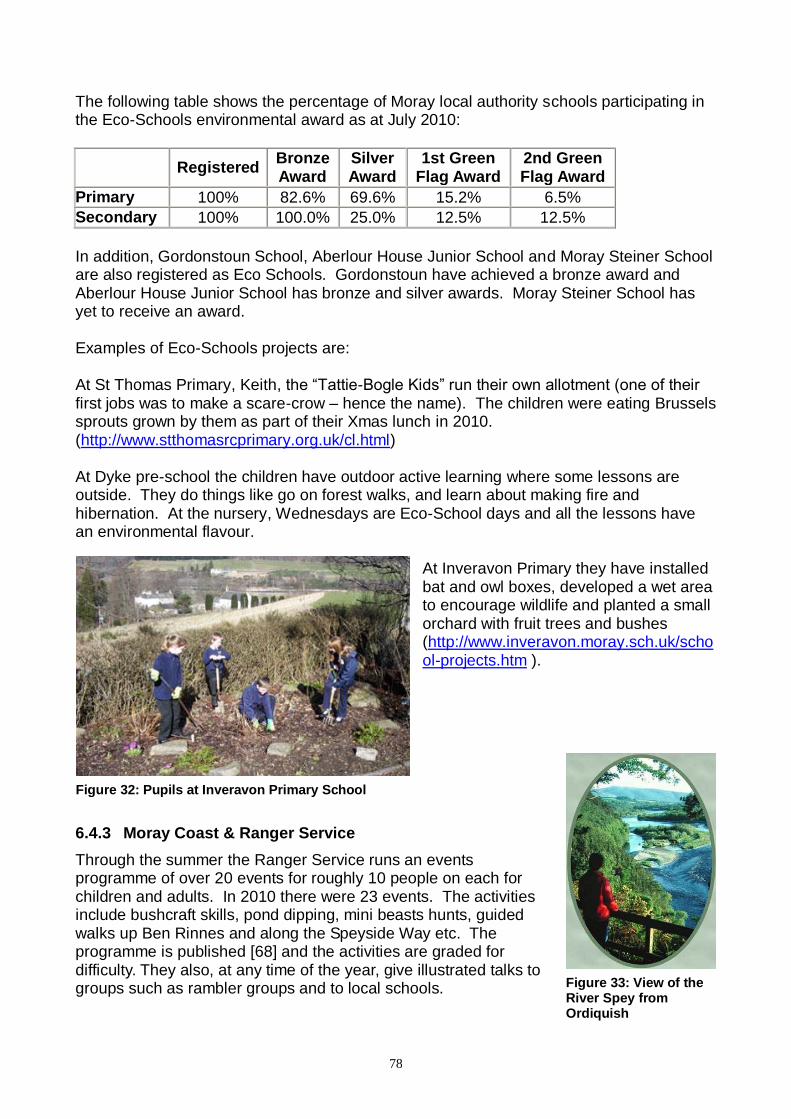
78
The following table shows the percentage of Moray local authority schools participating in the Eco-Schools environmental award as at July 2010:
Registered
Bronze Award
Silver Award
1st Green Flag Award
2nd Green Flag Award
Primary 100% 82.6% 69.6% 15.2% 6.5%
Secondary 100% 100.0% 25.0% 12.5% 12.5%
In addition, Gordonstoun School, Aberlour House Junior School and Moray Steiner School are also registered as Eco Schools. Gordonstoun have achieved a bronze award and Aberlour House Junior School has bronze and silver awards. Moray Steiner School has yet to receive an award. Examples of Eco-Schools projects are: At St Thomas Primary, Keith, the ―Tattie-Bogle Kids‖ run their own allotment (one of their first jobs was to make a scare-crow – hence the name). The children were eating Brussels sprouts grown by them as part of their Xmas lunch in 2010. (http://www.stthomasrcprimary.org.uk/cl.html) At Dyke pre-school the children have outdoor active learning where some lessons are outside. They do things like go on forest walks, and learn about making fire and hibernation. At the nursery, Wednesdays are Eco-School days and all the lessons have an environmental flavour.
At Inveravon Primary they have installed bat and owl boxes, developed a wet area to encourage wildlife and planted a small orchard with fruit trees and bushes (http://www.inveravon.moray.sch.uk/school-projects.htm ).
6.4.3 Moray Coast & Ranger Service
Through the summer the Ranger Service runs an events programme of over 20 events for roughly 10 people on each for children and adults. In 2010 there were 23 events. The activities include bushcraft skills, pond dipping, mini beasts hunts, guided walks up Ben Rinnes and along the Speyside Way etc. The programme is published [68] and the activities are graded for difficulty. They also, at any time of the year, give illustrated talks to groups such as rambler groups and to local schools.
Figure 32: Pupils at Inveravon Primary School
Figure 33: View of the River Spey from Ordiquish
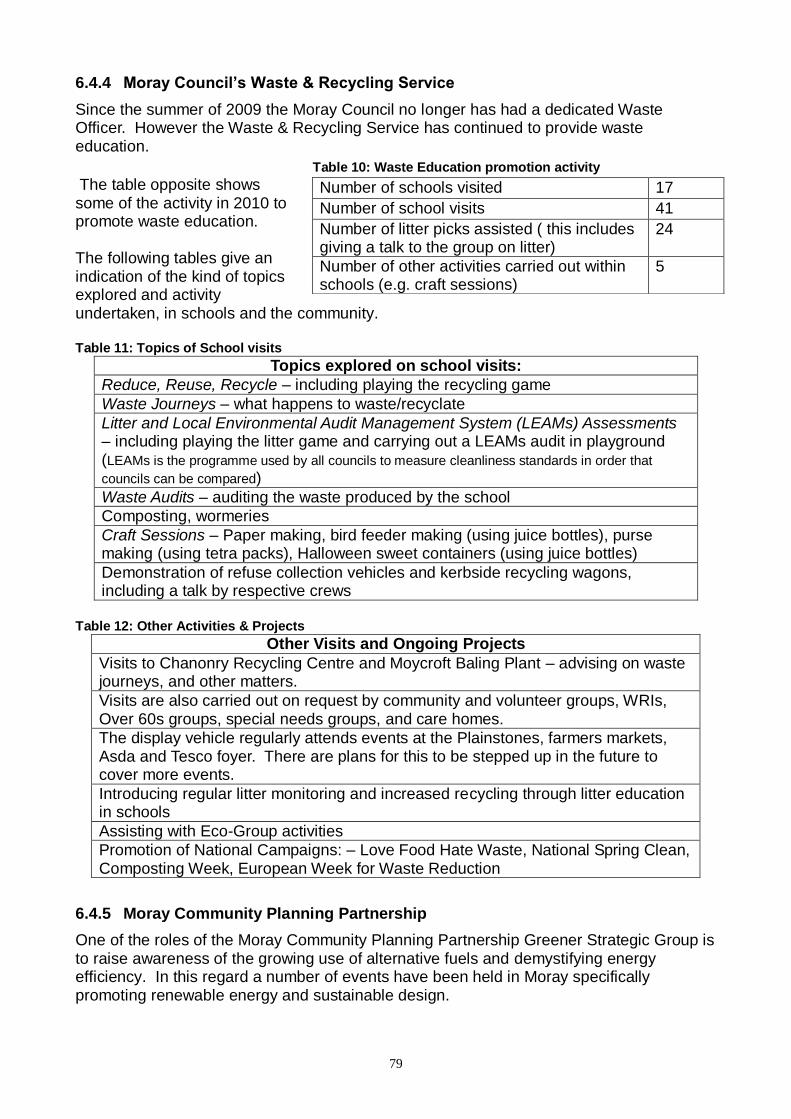
79
6.4.4 Moray Council’s Waste & Recycling Service
Since the summer of 2009 the Moray Council no longer has had a dedicated Waste Officer. However the Waste & Recycling Service has continued to provide waste education.
The table opposite shows some of the activity in 2010 to promote waste education. The following tables give an indication of the kind of topics explored and activity undertaken, in schools and the community. Table 11: Topics of School visits
Topics explored on school visits:
Reduce, Reuse, Recycle – including playing the recycling game
Waste Journeys – what happens to waste/recyclate
Litter and Local Environmental Audit Management System (LEAMs) Assessments – including playing the litter game and carrying out a LEAMs audit in playground (LEAMs is the programme used by all councils to measure cleanliness standards in order that
councils can be compared)
Waste Audits – auditing the waste produced by the school
Composting, wormeries
Craft Sessions – Paper making, bird feeder making (using juice bottles), purse making (using tetra packs), Halloween sweet containers (using juice bottles)
Demonstration of refuse collection vehicles and kerbside recycling wagons, including a talk by respective crews
Table 12: Other Activities & Projects
Other Visits and Ongoing Projects
Visits to Chanonry Recycling Centre and Moycroft Baling Plant – advising on waste journeys, and other matters.
Visits are also carried out on request by community and volunteer groups, WRIs, Over 60s groups, special needs groups, and care homes.
The display vehicle regularly attends events at the Plainstones, farmers markets, Asda and Tesco foyer. There are plans for this to be stepped up in the future to cover more events.
Introducing regular litter monitoring and increased recycling through litter education in schools
Assisting with Eco-Group activities
Promotion of National Campaigns: – Love Food Hate Waste, National Spring Clean, Composting Week, European Week for Waste Reduction
6.4.5 Moray Community Planning Partnership
One of the roles of the Moray Community Planning Partnership Greener Strategic Group is to raise awareness of the growing use of alternative fuels and demystifying energy efficiency. In this regard a number of events have been held in Moray specifically promoting renewable energy and sustainable design.
Table 10: Waste Education promotion activity
Number of schools visited 17
Number of school visits 41
Number of litter picks assisted ( this includes giving a talk to the group on litter)
24
Number of other activities carried out within schools (e.g. craft sessions)
5
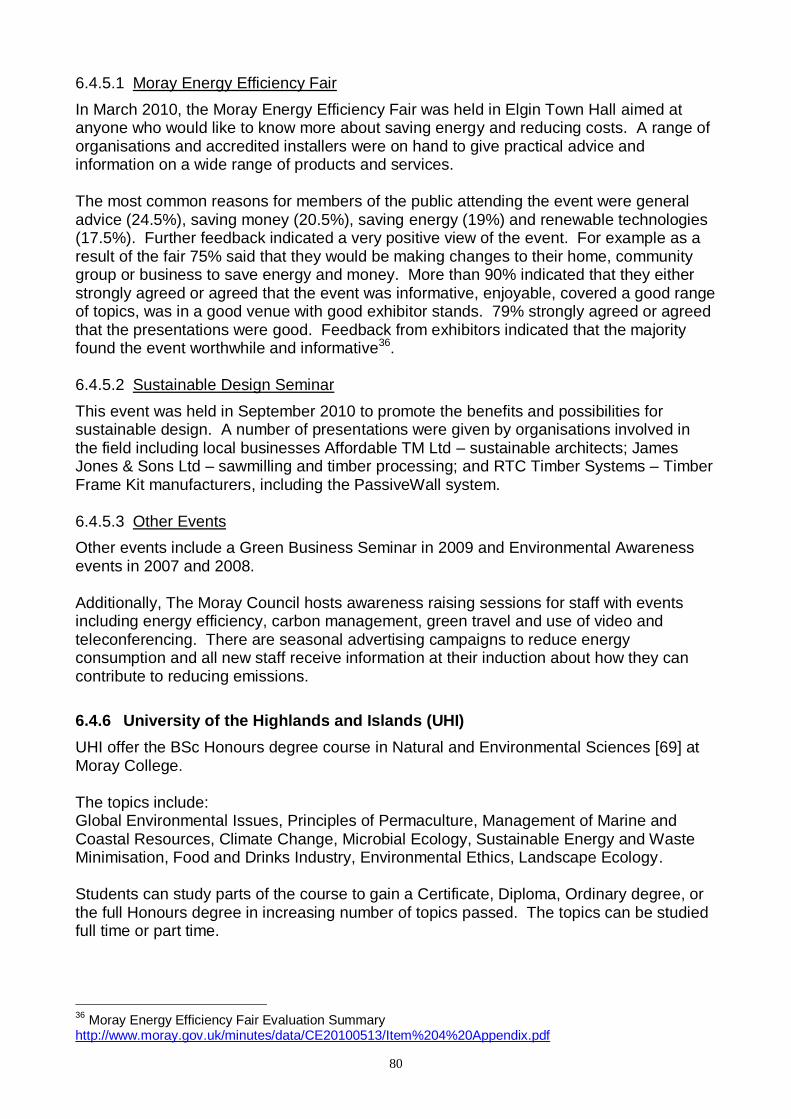
80
6.4.5.1 Moray Energy Efficiency Fair
In March 2010, the Moray Energy Efficiency Fair was held in Elgin Town Hall aimed at anyone who would like to know more about saving energy and reducing costs. A range of organisations and accredited installers were on hand to give practical advice and information on a wide range of products and services. The most common reasons for members of the public attending the event were general advice (24.5%), saving money (20.5%), saving energy (19%) and renewable technologies (17.5%). Further feedback indicated a very positive view of the event. For example as a result of the fair 75% said that they would be making changes to their home, community group or business to save energy and money. More than 90% indicated that they either strongly agreed or agreed that the event was informative, enjoyable, covered a good range of topics, was in a good venue with good exhibitor stands. 79% strongly agreed or agreed that the presentations were good. Feedback from exhibitors indicated that the majority found the event worthwhile and informative36. 6.4.5.2 Sustainable Design Seminar
This event was held in September 2010 to promote the benefits and possibilities for sustainable design. A number of presentations were given by organisations involved in the field including local businesses Affordable TM Ltd – sustainable architects; James Jones & Sons Ltd – sawmilling and timber processing; and RTC Timber Systems – Timber Frame Kit manufacturers, including the PassiveWall system. 6.4.5.3 Other Events
Other events include a Green Business Seminar in 2009 and Environmental Awareness events in 2007 and 2008. Additionally, The Moray Council hosts awareness raising sessions for staff with events including energy efficiency, carbon management, green travel and use of video and teleconferencing. There are seasonal advertising campaigns to reduce energy consumption and all new staff receive information at their induction about how they can contribute to reducing emissions.
6.4.6 University of the Highlands and Islands (UHI)
UHI offer the BSc Honours degree course in Natural and Environmental Sciences [69] at Moray College. The topics include: Global Environmental Issues, Principles of Permaculture, Management of Marine and Coastal Resources, Climate Change, Microbial Ecology, Sustainable Energy and Waste Minimisation, Food and Drinks Industry, Environmental Ethics, Landscape Ecology. Students can study parts of the course to gain a Certificate, Diploma, Ordinary degree, or the full Honours degree in increasing number of topics passed. The topics can be studied full time or part time.
36
Moray Energy Efficiency Fair Evaluation Summary http://www.moray.gov.uk/minutes/data/CE20100513/Item%204%20Appendix.pdf
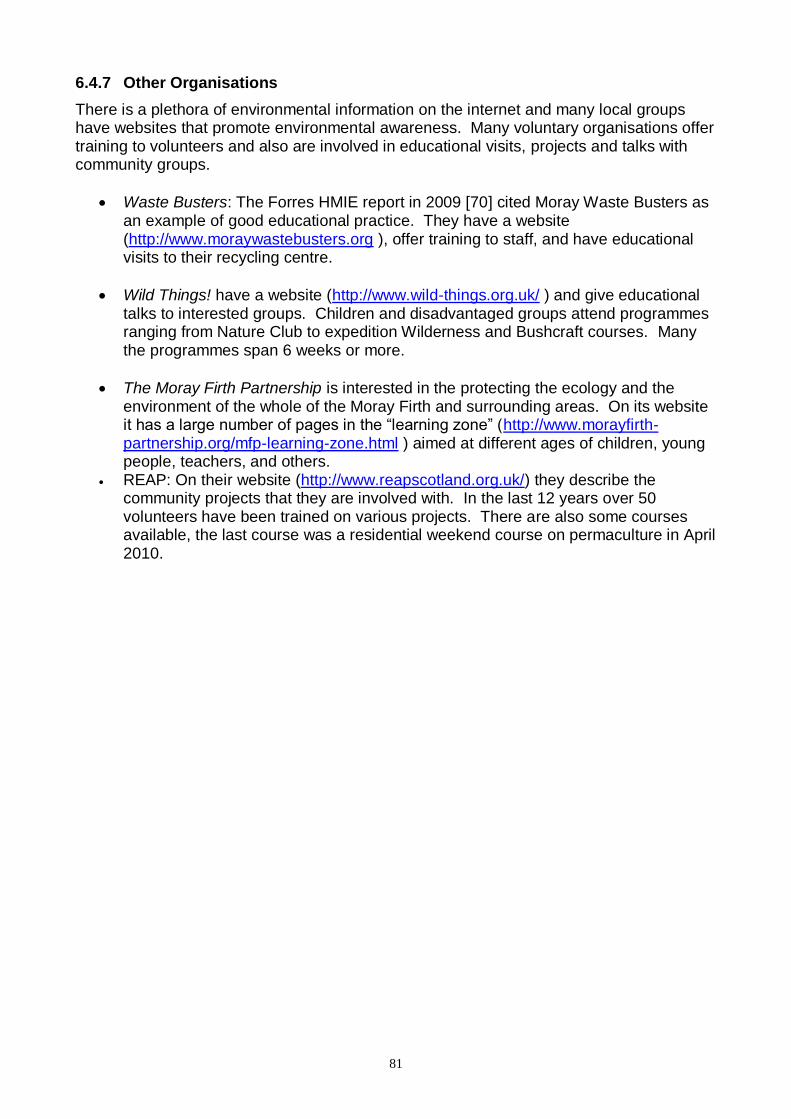
81
6.4.7 Other Organisations
There is a plethora of environmental information on the internet and many local groups have websites that promote environmental awareness. Many voluntary organisations offer training to volunteers and also are involved in educational visits, projects and talks with community groups.
Waste Busters: The Forres HMIE report in 2009 [70] cited Moray Waste Busters as an example of good educational practice. They have a website (http://www.moraywastebusters.org ), offer training to staff, and have educational visits to their recycling centre.
Wild Things! have a website (http://www.wild-things.org.uk/ ) and give educational talks to interested groups. Children and disadvantaged groups attend programmes ranging from Nature Club to expedition Wilderness and Bushcraft courses. Many the programmes span 6 weeks or more.
The Moray Firth Partnership is interested in the protecting the ecology and the environment of the whole of the Moray Firth and surrounding areas. On its website it has a large number of pages in the ―learning zone‖ (http://www.morayfirth-partnership.org/mfp-learning-zone.html ) aimed at different ages of children, young people, teachers, and others.
REAP: On their website (http://www.reapscotland.org.uk/) they describe the community projects that they are involved with. In the last 12 years over 50 volunteers have been trained on various projects. There are also some courses available, the last course was a residential weekend course on permaculture in April 2010.
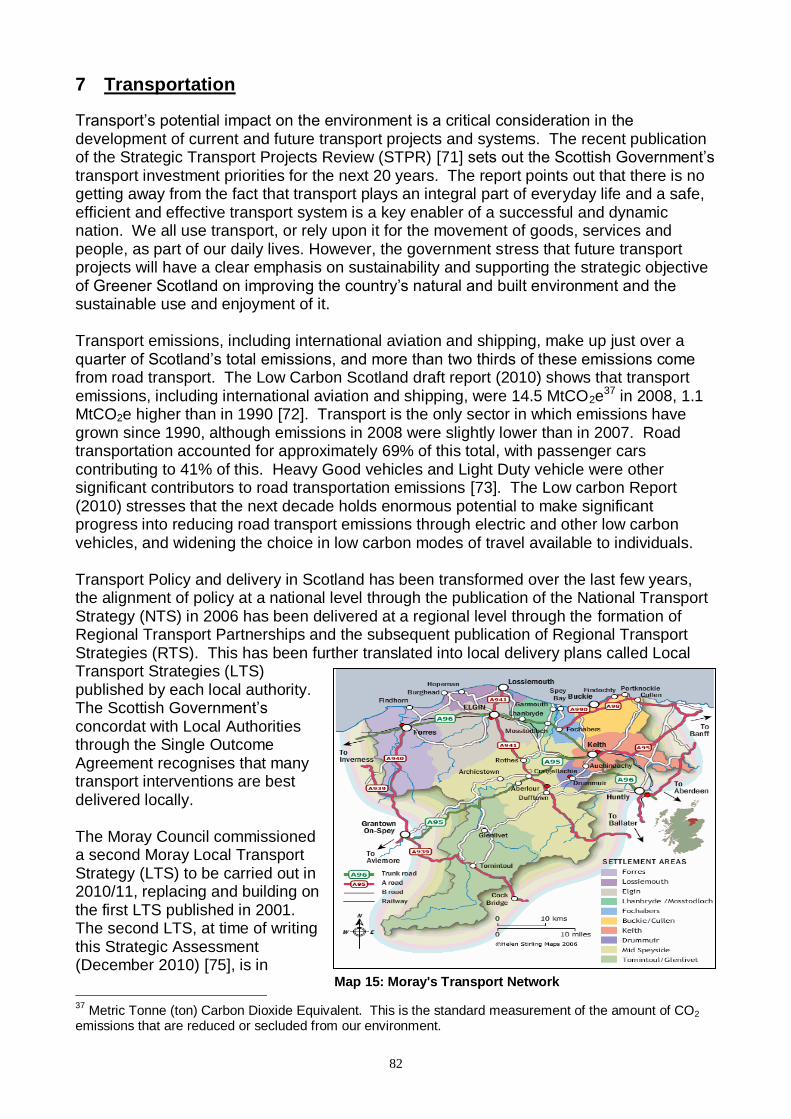
82
7 Transportation
Transport‘s potential impact on the environment is a critical consideration in the development of current and future transport projects and systems. The recent publication of the Strategic Transport Projects Review (STPR) [71] sets out the Scottish Government‘s transport investment priorities for the next 20 years. The report points out that there is no getting away from the fact that transport plays an integral part of everyday life and a safe, efficient and effective transport system is a key enabler of a successful and dynamic nation. We all use transport, or rely upon it for the movement of goods, services and people, as part of our daily lives. However, the government stress that future transport projects will have a clear emphasis on sustainability and supporting the strategic objective of Greener Scotland on improving the country‘s natural and built environment and the sustainable use and enjoyment of it. Transport emissions, including international aviation and shipping, make up just over a quarter of Scotland‘s total emissions, and more than two thirds of these emissions come from road transport. The Low Carbon Scotland draft report (2010) shows that transport emissions, including international aviation and shipping, were 14.5 MtCO2e
37 in 2008, 1.1 MtCO2e higher than in 1990 [72]. Transport is the only sector in which emissions have grown since 1990, although emissions in 2008 were slightly lower than in 2007. Road transportation accounted for approximately 69% of this total, with passenger cars contributing to 41% of this. Heavy Good vehicles and Light Duty vehicle were other significant contributors to road transportation emissions [73]. The Low carbon Report (2010) stresses that the next decade holds enormous potential to make significant progress into reducing road transport emissions through electric and other low carbon vehicles, and widening the choice in low carbon modes of travel available to individuals. Transport Policy and delivery in Scotland has been transformed over the last few years, the alignment of policy at a national level through the publication of the National Transport Strategy (NTS) in 2006 has been delivered at a regional level through the formation of Regional Transport Partnerships and the subsequent publication of Regional Transport Strategies (RTS). This has been further translated into local delivery plans called Local Transport Strategies (LTS) published by each local authority. The Scottish Government‘s concordat with Local Authorities through the Single Outcome Agreement recognises that many transport interventions are best delivered locally. The Moray Council commissioned a second Moray Local Transport Strategy (LTS) to be carried out in 2010/11, replacing and building on the first LTS published in 2001. The second LTS, at time of writing this Strategic Assessment (December 2010) [75], is in
37
Metric Tonne (ton) Carbon Dioxide Equivalent. This is the standard measurement of the amount of CO2 emissions that are reduced or secluded from our environment.
Map 15: Moray's Transport Network
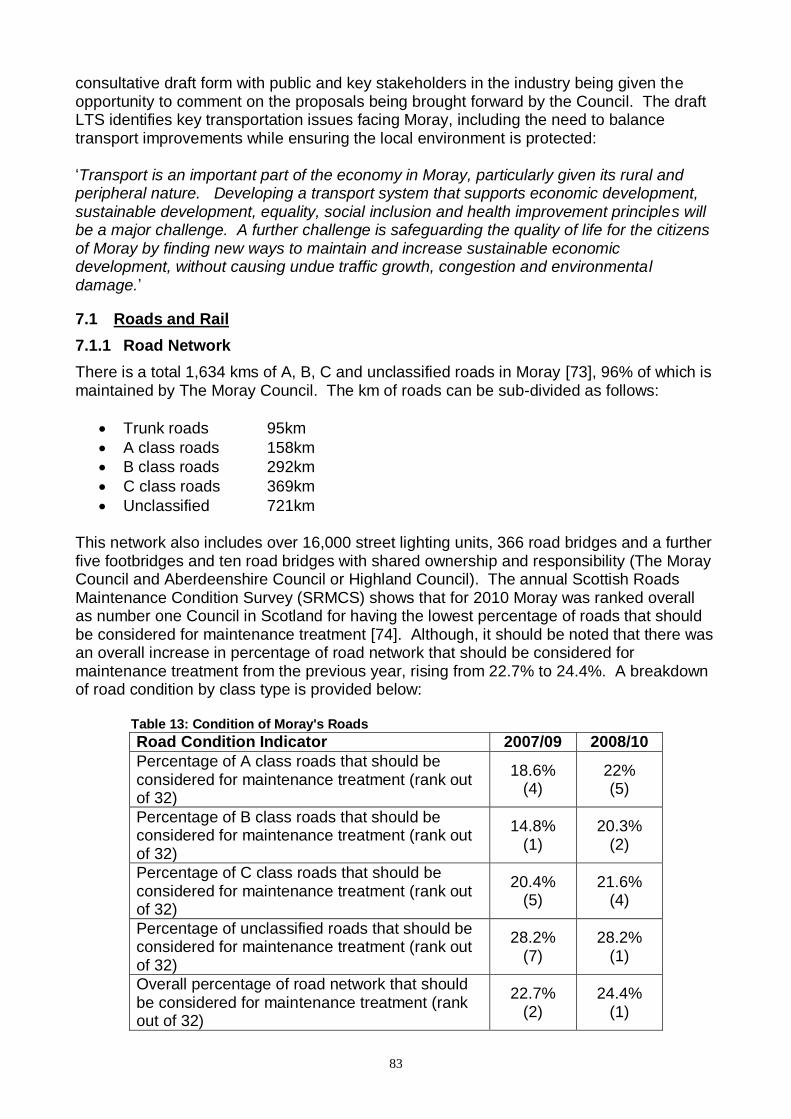
83
consultative draft form with public and key stakeholders in the industry being given the opportunity to comment on the proposals being brought forward by the Council. The draft LTS identifies key transportation issues facing Moray, including the need to balance transport improvements while ensuring the local environment is protected: ‗Transport is an important part of the economy in Moray, particularly given its rural and peripheral nature. Developing a transport system that supports economic development, sustainable development, equality, social inclusion and health improvement principles will be a major challenge. A further challenge is safeguarding the quality of life for the citizens of Moray by finding new ways to maintain and increase sustainable economic development, without causing undue traffic growth, congestion and environmental damage.‘
7.1 Roads and Rail
7.1.1 Road Network
There is a total 1,634 kms of A, B, C and unclassified roads in Moray [73], 96% of which is maintained by The Moray Council. The km of roads can be sub-divided as follows:
Trunk roads 95km
A class roads 158km
B class roads 292km
C class roads 369km
Unclassified 721km
This network also includes over 16,000 street lighting units, 366 road bridges and a further five footbridges and ten road bridges with shared ownership and responsibility (The Moray Council and Aberdeenshire Council or Highland Council). The annual Scottish Roads Maintenance Condition Survey (SRMCS) shows that for 2010 Moray was ranked overall as number one Council in Scotland for having the lowest percentage of roads that should be considered for maintenance treatment [74]. Although, it should be noted that there was an overall increase in percentage of road network that should be considered for maintenance treatment from the previous year, rising from 22.7% to 24.4%. A breakdown of road condition by class type is provided below: Table 13: Condition of Moray's Roads
Road Condition Indicator 2007/09 2008/10
Percentage of A class roads that should be considered for maintenance treatment (rank out of 32)
18.6% (4)
22% (5)
Percentage of B class roads that should be considered for maintenance treatment (rank out of 32)
14.8% (1)
20.3% (2)
Percentage of C class roads that should be considered for maintenance treatment (rank out of 32)
20.4% (5)
21.6% (4)
Percentage of unclassified roads that should be considered for maintenance treatment (rank out of 32)
28.2% (7)
28.2% (1)
Overall percentage of road network that should be considered for maintenance treatment (rank out of 32)
22.7% (2)
24.4% (1)
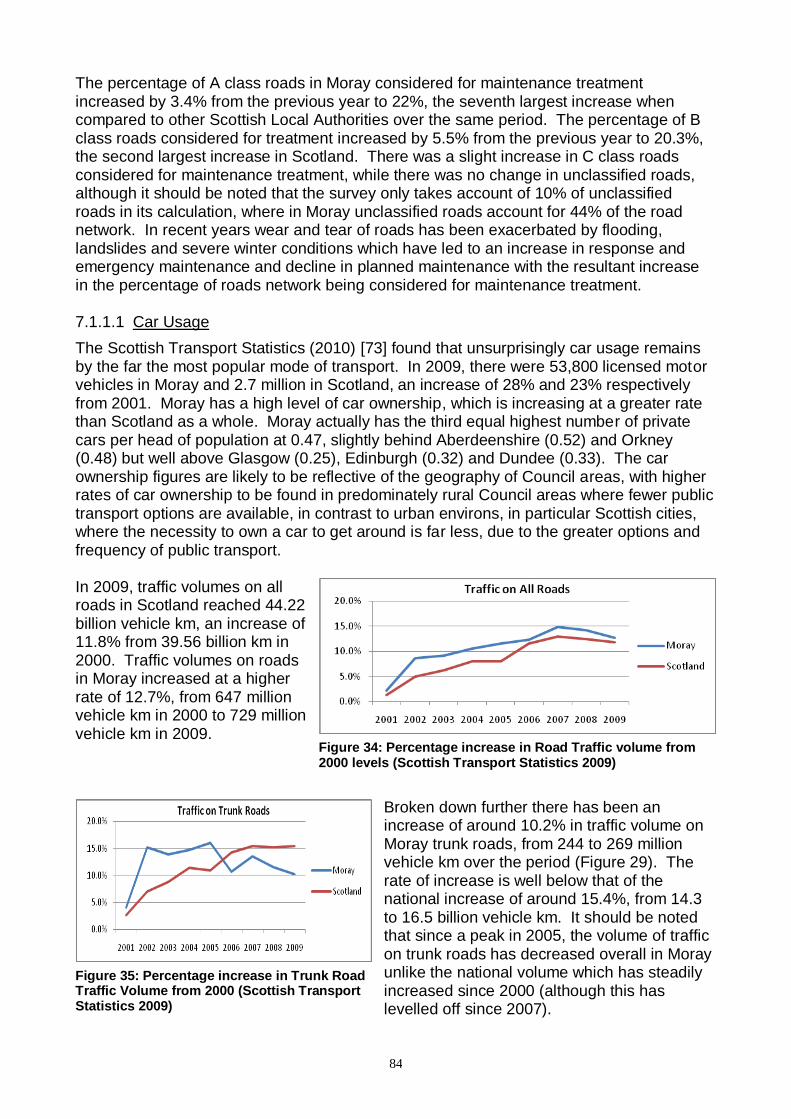
84
The percentage of A class roads in Moray considered for maintenance treatment increased by 3.4% from the previous year to 22%, the seventh largest increase when compared to other Scottish Local Authorities over the same period. The percentage of B class roads considered for treatment increased by 5.5% from the previous year to 20.3%, the second largest increase in Scotland. There was a slight increase in C class roads considered for maintenance treatment, while there was no change in unclassified roads, although it should be noted that the survey only takes account of 10% of unclassified roads in its calculation, where in Moray unclassified roads account for 44% of the road network. In recent years wear and tear of roads has been exacerbated by flooding, landslides and severe winter conditions which have led to an increase in response and emergency maintenance and decline in planned maintenance with the resultant increase in the percentage of roads network being considered for maintenance treatment. 7.1.1.1 Car Usage
The Scottish Transport Statistics (2010) [73] found that unsurprisingly car usage remains by the far the most popular mode of transport. In 2009, there were 53,800 licensed motor vehicles in Moray and 2.7 million in Scotland, an increase of 28% and 23% respectively from 2001. Moray has a high level of car ownership, which is increasing at a greater rate than Scotland as a whole. Moray actually has the third equal highest number of private cars per head of population at 0.47, slightly behind Aberdeenshire (0.52) and Orkney (0.48) but well above Glasgow (0.25), Edinburgh (0.32) and Dundee (0.33). The car ownership figures are likely to be reflective of the geography of Council areas, with higher rates of car ownership to be found in predominately rural Council areas where fewer public transport options are available, in contrast to urban environs, in particular Scottish cities, where the necessity to own a car to get around is far less, due to the greater options and frequency of public transport. In 2009, traffic volumes on all roads in Scotland reached 44.22 billion vehicle km, an increase of 11.8% from 39.56 billion km in 2000. Traffic volumes on roads in Moray increased at a higher rate of 12.7%, from 647 million vehicle km in 2000 to 729 million vehicle km in 2009.
Broken down further there has been an increase of around 10.2% in traffic volume on Moray trunk roads, from 244 to 269 million vehicle km over the period (Figure 29). The rate of increase is well below that of the national increase of around 15.4%, from 14.3 to 16.5 billion vehicle km. It should be noted that since a peak in 2005, the volume of traffic on trunk roads has decreased overall in Moray unlike the national volume which has steadily increased since 2000 (although this has levelled off since 2007).
Figure 34: Percentage increase in Road Traffic volume from 2000 levels (Scottish Transport Statistics 2009)
Figure 35: Percentage increase in Trunk Road Traffic Volume from 2000 (Scottish Transport Statistics 2009)
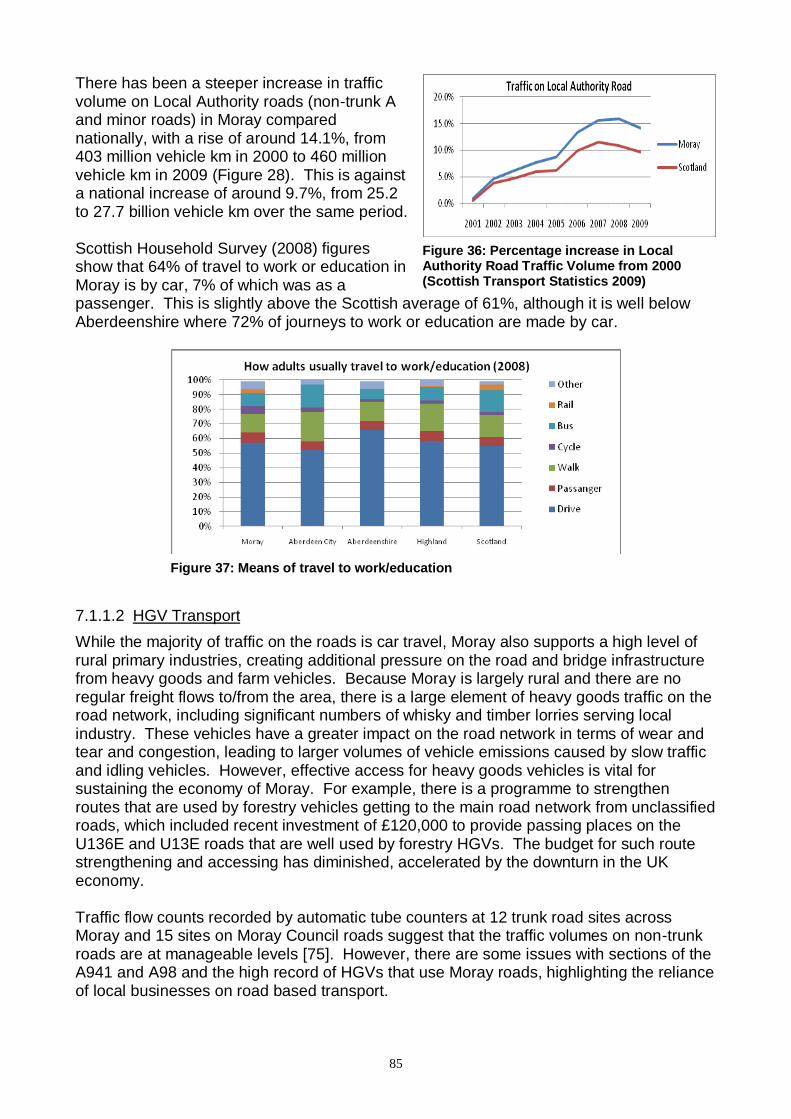
85
There has been a steeper increase in traffic volume on Local Authority roads (non-trunk A and minor roads) in Moray compared nationally, with a rise of around 14.1%, from 403 million vehicle km in 2000 to 460 million vehicle km in 2009 (Figure 28). This is against a national increase of around 9.7%, from 25.2 to 27.7 billion vehicle km over the same period. Scottish Household Survey (2008) figures show that 64% of travel to work or education in Moray is by car, 7% of which was as a passenger. This is slightly above the Scottish average of 61%, although it is well below Aberdeenshire where 72% of journeys to work or education are made by car.
7.1.1.2 HGV Transport
While the majority of traffic on the roads is car travel, Moray also supports a high level of rural primary industries, creating additional pressure on the road and bridge infrastructure from heavy goods and farm vehicles. Because Moray is largely rural and there are no regular freight flows to/from the area, there is a large element of heavy goods traffic on the road network, including significant numbers of whisky and timber lorries serving local industry. These vehicles have a greater impact on the road network in terms of wear and tear and congestion, leading to larger volumes of vehicle emissions caused by slow traffic and idling vehicles. However, effective access for heavy goods vehicles is vital for sustaining the economy of Moray. For example, there is a programme to strengthen routes that are used by forestry vehicles getting to the main road network from unclassified roads, which included recent investment of £120,000 to provide passing places on the U136E and U13E roads that are well used by forestry HGVs. The budget for such route strengthening and accessing has diminished, accelerated by the downturn in the UK economy. Traffic flow counts recorded by automatic tube counters at 12 trunk road sites across Moray and 15 sites on Moray Council roads suggest that the traffic volumes on non-trunk roads are at manageable levels [75]. However, there are some issues with sections of the A941 and A98 and the high record of HGVs that use Moray roads, highlighting the reliance of local businesses on road based transport.
Figure 37: Means of travel to work/education
Figure 36: Percentage increase in Local Authority Road Traffic Volume from 2000 (Scottish Transport Statistics 2009)
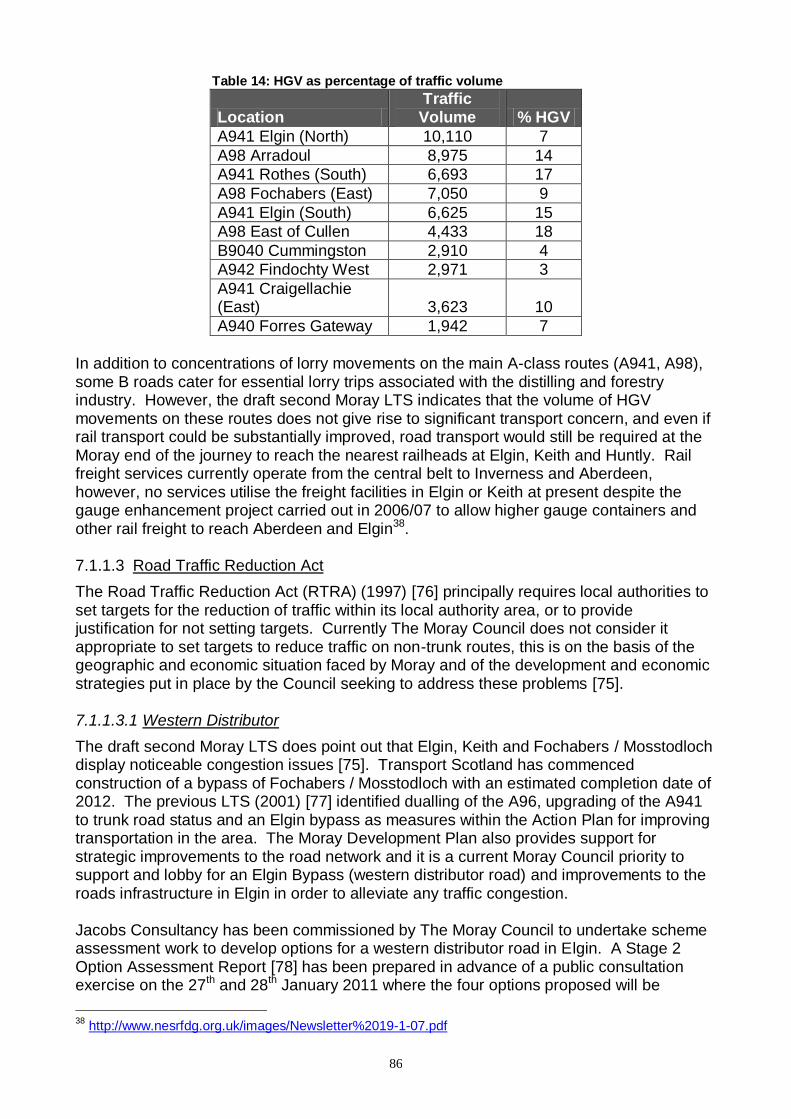
86
Table 14: HGV as percentage of traffic volume
Location Traffic Volume % HGV
A941 Elgin (North) 10,110 7
A98 Arradoul 8,975 14
A941 Rothes (South) 6,693 17
A98 Fochabers (East) 7,050 9
A941 Elgin (South) 6,625 15
A98 East of Cullen 4,433 18
B9040 Cummingston 2,910 4
A942 Findochty West 2,971 3
A941 Craigellachie (East) 3,623 10
A940 Forres Gateway 1,942 7
In addition to concentrations of lorry movements on the main A-class routes (A941, A98), some B roads cater for essential lorry trips associated with the distilling and forestry industry. However, the draft second Moray LTS indicates that the volume of HGV movements on these routes does not give rise to significant transport concern, and even if rail transport could be substantially improved, road transport would still be required at the Moray end of the journey to reach the nearest railheads at Elgin, Keith and Huntly. Rail freight services currently operate from the central belt to Inverness and Aberdeen, however, no services utilise the freight facilities in Elgin or Keith at present despite the gauge enhancement project carried out in 2006/07 to allow higher gauge containers and other rail freight to reach Aberdeen and Elgin38. 7.1.1.3 Road Traffic Reduction Act
The Road Traffic Reduction Act (RTRA) (1997) [76] principally requires local authorities to set targets for the reduction of traffic within its local authority area, or to provide justification for not setting targets. Currently The Moray Council does not consider it appropriate to set targets to reduce traffic on non-trunk routes, this is on the basis of the geographic and economic situation faced by Moray and of the development and economic strategies put in place by the Council seeking to address these problems [75]. 7.1.1.3.1 Western Distributor
The draft second Moray LTS does point out that Elgin, Keith and Fochabers / Mosstodloch display noticeable congestion issues [75]. Transport Scotland has commenced construction of a bypass of Fochabers / Mosstodloch with an estimated completion date of 2012. The previous LTS (2001) [77] identified dualling of the A96, upgrading of the A941 to trunk road status and an Elgin bypass as measures within the Action Plan for improving transportation in the area. The Moray Development Plan also provides support for strategic improvements to the road network and it is a current Moray Council priority to support and lobby for an Elgin Bypass (western distributor road) and improvements to the roads infrastructure in Elgin in order to alleviate any traffic congestion. Jacobs Consultancy has been commissioned by The Moray Council to undertake scheme assessment work to develop options for a western distributor road in Elgin. A Stage 2 Option Assessment Report [78] has been prepared in advance of a public consultation exercise on the 27th and 28th January 2011 where the four options proposed will be
38
http://www.nesrfdg.org.uk/images/Newsletter%2019-1-07.pdf
87
available for scrutiny and comment. The options vary from a number of smaller improvements to Existing Road Network; re-routing of traffic through Elgin involving some major engineering works (Urban Inner Route); or the construction of Rural Routes (outer or inner) around the south side of Elgin which would be significantly more expensive and involve greater engineering complexities to be overcome. Environmental impact assessments have been carried out on the Urban (Inner) Route and the Existing Network Enhancement options only, as it became apparent during Stage 2 development work that the Rural Routes (outer and inner) achieved limited operation benefits, involved significant engineering complexities and introduced adverse environmental impacts to a settled landscape. The two options that were assessed showed there would be negligible impact to air quality, which is generally good in and around Elgin. There would be no significant habitat loss from improvements to Existing Road Network, while it is predicted that there will be largely minor impacts with the Urban (Inner) Route option. For the Existing Network Enhancements option, moderate adverse noise impacts are predicted for a number of residential properties, however, certain properties are expected to experience a substantial reduction in noise. For the Urban (Inner) Route substantial adverse noise impacts are predicted for 56 residential properties and three other sensitive receptors. In addition a further 250 residential properties and 3 other sensitive receptors are anticipated to experience perceptible increases in noise levels. However, several properties are predicted to experience substantial benefits. 7.1.1.4 Public Transport
Buses, coaches and dial-a-bus services provide the principal public transport capacity within Moray. Services are generally focussed on the main settlements and on the A96 corridor and are generally not viable outside these areas unless subsidised by the public sector. In Scotland there were 515 million passenger journeys made on local bus services in 2008/09 against 458 million in 2001, an increase of around 12.5% [73]. Within Moray passenger journeys increased by around 8%. In Moray, Stagecoach operate both a local network service (Services 323, 328/9, 331, 336) and trunk route service (Services 10, 11, 305, 315) through Moray, while further rural routes are provided by a number of local bus companies servicing the majority of smaller communities in Moray. A number of the Stagecoach local network services and all the rural route bus services are subsidised through The Moray Council. A door to door accessible bus service Dial a Bus, is also operated by the Moray Council for those who, because of age or disability, find public transport difficult to use and who live in the Cullen/Buckie, Forres and Speyside areas. Budget savings for 2011/12 have impacted on these services. From April 2011, the following changes will be implemented39:
The Forres Town service, route 314, will cease.
The Cullen/Buckie/Keith service, route 309, will be reduced.
Charges for the Dial-a-Bus service in Forres and Speyside will be increased.
The BABS Dial-a-Bus service will be redesigned. Stagecoach have seen a yearly increase in the number of journeys by bus in Moray since 2001, however between 2008/09 and 2009/10 there was a sharp drop of 5.5% in Stagecoach passenger numbers on the local network and a 7.3% fall on trunk route
39
Full Council Special meeting, 10/02/11, Financial Plan Review, Appendix 6http://www.moray.gov.uk/minutes/data/XC20110210/Item%203%20Appendix%206.pdf
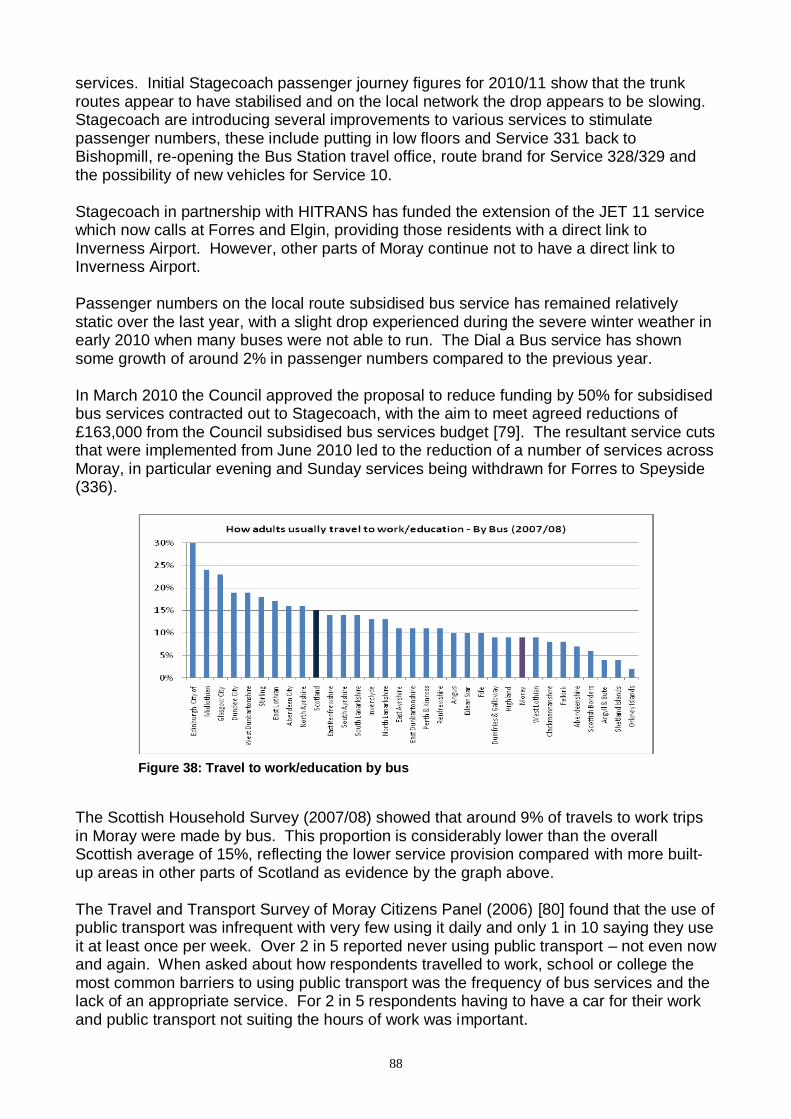
88
services. Initial Stagecoach passenger journey figures for 2010/11 show that the trunk routes appear to have stabilised and on the local network the drop appears to be slowing. Stagecoach are introducing several improvements to various services to stimulate passenger numbers, these include putting in low floors and Service 331 back to Bishopmill, re-opening the Bus Station travel office, route brand for Service 328/329 and the possibility of new vehicles for Service 10. Stagecoach in partnership with HITRANS has funded the extension of the JET 11 service which now calls at Forres and Elgin, providing those residents with a direct link to Inverness Airport. However, other parts of Moray continue not to have a direct link to Inverness Airport. Passenger numbers on the local route subsidised bus service has remained relatively static over the last year, with a slight drop experienced during the severe winter weather in early 2010 when many buses were not able to run. The Dial a Bus service has shown some growth of around 2% in passenger numbers compared to the previous year. In March 2010 the Council approved the proposal to reduce funding by 50% for subsidised bus services contracted out to Stagecoach, with the aim to meet agreed reductions of £163,000 from the Council subsidised bus services budget [79]. The resultant service cuts that were implemented from June 2010 led to the reduction of a number of services across Moray, in particular evening and Sunday services being withdrawn for Forres to Speyside (336).
The Scottish Household Survey (2007/08) showed that around 9% of travels to work trips in Moray were made by bus. This proportion is considerably lower than the overall Scottish average of 15%, reflecting the lower service provision compared with more built-up areas in other parts of Scotland as evidence by the graph above. The Travel and Transport Survey of Moray Citizens Panel (2006) [80] found that the use of public transport was infrequent with very few using it daily and only 1 in 10 saying they use it at least once per week. Over 2 in 5 reported never using public transport – not even now and again. When asked about how respondents travelled to work, school or college the most common barriers to using public transport was the frequency of bus services and the lack of an appropriate service. For 2 in 5 respondents having to have a car for their work and public transport not suiting the hours of work was important.
Figure 38: Travel to work/education by bus
89
7.1.2 Rail
The other main form of public transport in Moray is rail, with 11 through trains in each direction on weekdays between Inverness and Aberdeen. Passenger journeys in Scotland on Scotrail services increased by just over 22% between 2004/05 and 2008/09, from 68.7 million to 83.9 million [73]. Rail travel from the three stations in Moray increased by an overall 12.9% over the same period, from 194,115 to 219,083 journeys. This represented a lower increase than at neighbouring Council stations with Aberdeenshire passenger journey numbers increasing by 43%, Highland 28% and Aberdeen City 37.2%. Of the three stations within Moray, Keith saw the largest increase in passenger numbers at 19.7%, followed by Elgin (14%) and Forres (5.4%) [85]. The limited number of trains and the relatively long journey times between Aberdeen and Inverness are perceived as barrier to rail travel, and have contributed to the lower than average increase in passenger numbers. Also rail fares are seen to be higher in the North East than the rest of the country. The Strategic Transport Projects Review (STPR) includes the upgrading and development of the rail route between Aberdeen and Inverness as one of the future priorities that Transport Scotland will consider. Upgrading of the line and level of service will likely lead to a modal shift, with more freight and rail passengers and subsequent reduction in car journeys easing the pressure on roads and volume of vehicle emissions.
7.2 Sustainable Transport
Sustainable transport includes walking, cycling, public transport, car clubs, car-sharing, eco-driving and low carbon vehicles. Transport Scotland, as an agency of the Scottish Government, is responsible for sustainable transport policy in Scotland. The agency highlight that ‗the purpose of promoting more sustainable transport is to minimise any negative environmental and social impacts of travel, whilst maintaining an efficient and effective transport system that supports sustainable economic growth‘. Increased proportions of sustainable transport will reduce transport emissions that contribute to local pollution problems and climate change. The Scottish Government, COSLA and participating Local Authorities and Regional Transport Partnerships have committed £15 million to the Smarter Choices, Smarter Places programme. Sustainable travel projects in seven communities across Scotland are currently demonstrating ways of increasing active travel and public transport use. The current programme will run until March 2011, with final evaluation taking place early 2012. These findings will influence the way forward in identifying best practice to achieving greater use of sustainable transport. In Moray, the Council and Community Planning Partners are taking forward a number of sustainable transport initiatives to address Moray‘s apparent reliance on car travel, see following sub sections.
7.2.1 Travel Planning
The Scottish Government have highlighted the importance of promoting personal travel planning in the drive to make access to public transport and active travel easier and reduce travel demand and transport emissions. Scottish Planning Policy specifies that opportunities for personal travel should be prioritised in the following order – walking, cycling, public transport, car and other motorised vehicles. Buildings and facilities should be accessible on foot and by cycle. Improvements to active transport networks, such as
90
paths and cycle routes, should make these more attractive and safer for pedestrians and cyclists. Personal travel planning focuses on delivering targeted information direct to travellers to help people make informed and sustainable travel choices, this can be delivered through workplaces, schools or to households. The Scottish Government aim is to achieve:
personalised travel planning advice to all households in Scotland (each contacted once) by 2022, bringing reductions in non-work or –school escort trips;
all workplaces with more than 30 employees to have an effective travel plan by 2022, bringing reductions in commuter trips by single occupant car.
7.2.2 Workplace
Advice to organisations on travel planning to encourage increased levels of active travel and public transport use is delivered by the Energy Saving Trust. This will enable and assist in achieving long term changes in travel behaviour, not just for the journey to and from work premises but for all journeys undertaken for business and hopefully, pleasure. In Moray a multi-disciplinary group including Moray Council, NHS Grampian, Moray College, Asda and B&Q has been established to push forward and develop workplace travel planning activity in Elgin. Key partners have been participating in travel planning exercises and have or are in the process of developing travel plans for their employees. Such travel plans incorporate a package of measures tailored to the needs of the organisation and aimed at promoting travel choice and reducing reliance on the car [81]. Travel planning in the workplaces can have a number of benefits to the individual, organisation and the wider community, such as:
Facilitating a healthier workforce (increased exercise)
Creating a healthier environment (reduced traffic = less car emissions)
Increase accessibility of work premises
Greater use of public transport
Improving road safety
Demonstrating social and environmental responsibility The Moray Council, as the largest employer in Moray, have implemented a number of travel planning initiatives and schemes to encourage use of more sustainable transport modes. As part of the Government‘s National Transport Strategy the Moray Council produced an operational travel plan for the Head Quarters in 2008, setting out actions that the Council would take forward to minimise the use of private transport to and from work premises and for business related trips. The aim was to not just ‗promote‘ the use of sustainable modes of transport, but to help facilitate the opportunities to walk, cycle and travel by public transport to and from work. So as to assess the impact on introducing travel planning measures the Council undertook staff surveys on travel behaviour in 2007 and 2008 across various Council premises, with follow-up surveys to be undertaken annually to measure any modal shift in staff travel to work, although none was carried out in 2009 or 2010. The initial survey results flagged up that around 80% of staff travelled to work by car and of those 64% travelled to work as the lone occupant [81]. This compared with 9% of staff who normally walked to work, 6% who cycled and only 1% who travelled by public transport. The survey also found that 35% of

91
staff travelled less than 3 miles to work, however only 16% of all staff said they walked, cycled or took the bus. The Council has subsequently implemented and reinforced a number of schemes and initiatives to address the high car usage of employees, these include:
Increase and upgrading of cycle parking and lockers
Cycle to Work Scheme (Tax free initiative for staff purchasing cycles through Halfords) – 237 participants to date.
Pool bike scheme (travel between town offices)
Pool Car Scheme (low emission, fuel efficient vehicles)
Lift-Sharing Scheme
Video conferencing where available (instead of office meetings)
Upgrading and increase in showering facilities within headquarters
Flexible Working Scheme / Working from Home Policy
Hot-desking for visiting staff
Briefing to all new staff on all Travel Plan actions as part of staff induction process The design and development of the new Council headquarters supports a modal shift in staff transport use and is aimed to serve as a template for future development plans in Moray. As part of the design work consideration has been given to incorporating incentives for sustainable transport use, such as a reduction in the number of standard car parking spaces; increased cycle storage; showering facilities; electric car recharging facilities and so on. In addition, the refurbished building will also enable the new ways of working – mobile, flexible, fixed and home working. Staff will be able to log in at any workstation and receive phone calls at any phone (password enabled). Touch-down desks will be available for mobile workers where they will be able to plug- in their laptop and access the Council‘s network. The success of these measures for the new headquarters and those which are or have been implemented through the Council (as noted above) will need to be tracked and analysed through annual staff surveys to identify best practice.
7.2.3 Schools
The Moray Council has a dedicated team working with schools and relevant partners to develop and implement school travel plans as part of the Safer Routes to School campaign. Developing a school travel plan provides a planned approach to the hundreds of school journeys made each day and can lead to real benefits for pupils and the school, while having a dramatic effect on the local environment. These plans aim to stem the decline in the number of children walking and cycling to school and encourage more children to develop active and healthy travel habits. Currently 49 of the 54 Moray schools are engaged in the travel planning process, developing travel plans for the school and highlighting to children and parents the benefits of leaving the car at home and encouraging more active travel. Since 2001 cycle storage has been provided at 27 schools. Additional schemes funded through the Scottish Governments‘ Safer Routes to Schools (2000-2002), Cycling, Walking and Safer Streets (2001-present), 20 mph limits and Safer Routes to Schools (2004-2008) have led to the school related transport improvements, including:
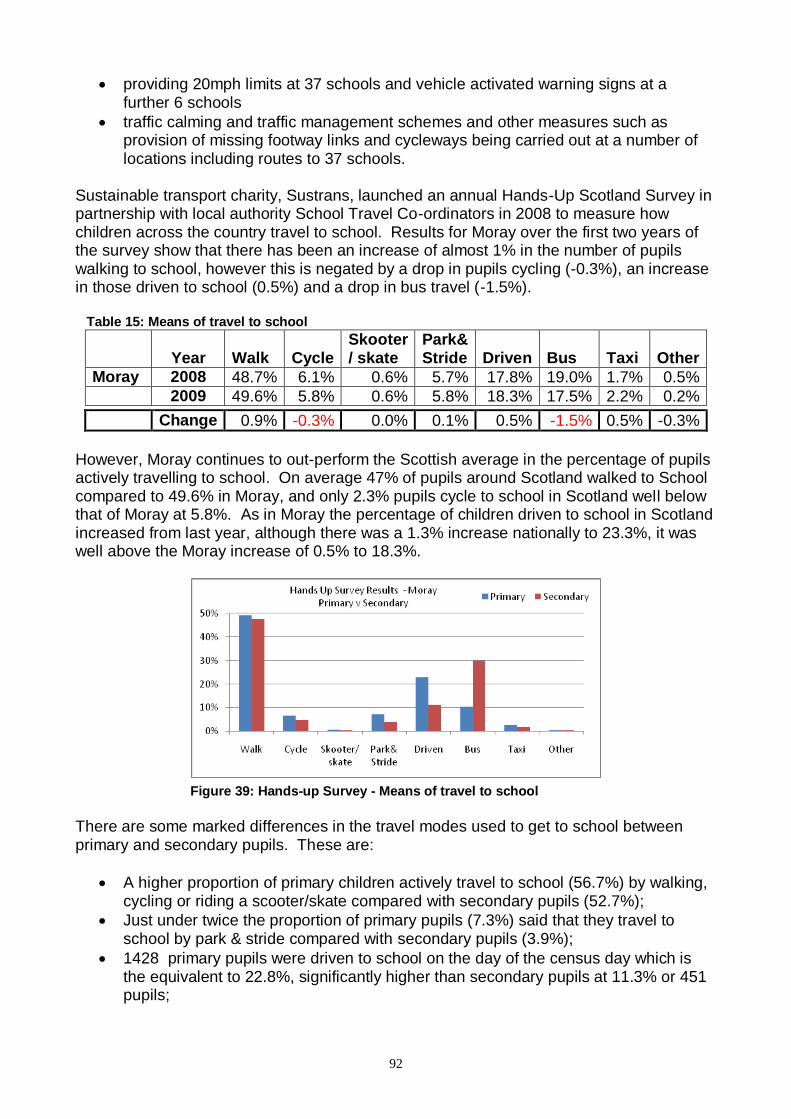
92
providing 20mph limits at 37 schools and vehicle activated warning signs at a further 6 schools
traffic calming and traffic management schemes and other measures such as provision of missing footway links and cycleways being carried out at a number of locations including routes to 37 schools.
Sustainable transport charity, Sustrans, launched an annual Hands-Up Scotland Survey in partnership with local authority School Travel Co-ordinators in 2008 to measure how children across the country travel to school. Results for Moray over the first two years of the survey show that there has been an increase of almost 1% in the number of pupils walking to school, however this is negated by a drop in pupils cycling (-0.3%), an increase in those driven to school (0.5%) and a drop in bus travel (-1.5%). Table 15: Means of travel to school
Year Walk Cycle
Skooter / skate
Park& Stride Driven Bus Taxi Other
Moray 2008 48.7% 6.1% 0.6% 5.7% 17.8% 19.0% 1.7% 0.5%
2009 49.6% 5.8% 0.6% 5.8% 18.3% 17.5% 2.2% 0.2%
Change 0.9% -0.3% 0.0% 0.1% 0.5% -1.5% 0.5% -0.3%
However, Moray continues to out-perform the Scottish average in the percentage of pupils actively travelling to school. On average 47% of pupils around Scotland walked to School compared to 49.6% in Moray, and only 2.3% pupils cycle to school in Scotland well below that of Moray at 5.8%. As in Moray the percentage of children driven to school in Scotland increased from last year, although there was a 1.3% increase nationally to 23.3%, it was well above the Moray increase of 0.5% to 18.3%.
There are some marked differences in the travel modes used to get to school between primary and secondary pupils. These are:
A higher proportion of primary children actively travel to school (56.7%) by walking, cycling or riding a scooter/skate compared with secondary pupils (52.7%);
Just under twice the proportion of primary pupils (7.3%) said that they travel to school by park & stride compared with secondary pupils (3.9%);
1428 primary pupils were driven to school on the day of the census day which is the equivalent to 22.8%, significantly higher than secondary pupils at 11.3% or 451 pupils;
Figure 39: Hands-up Survey - Means of travel to school
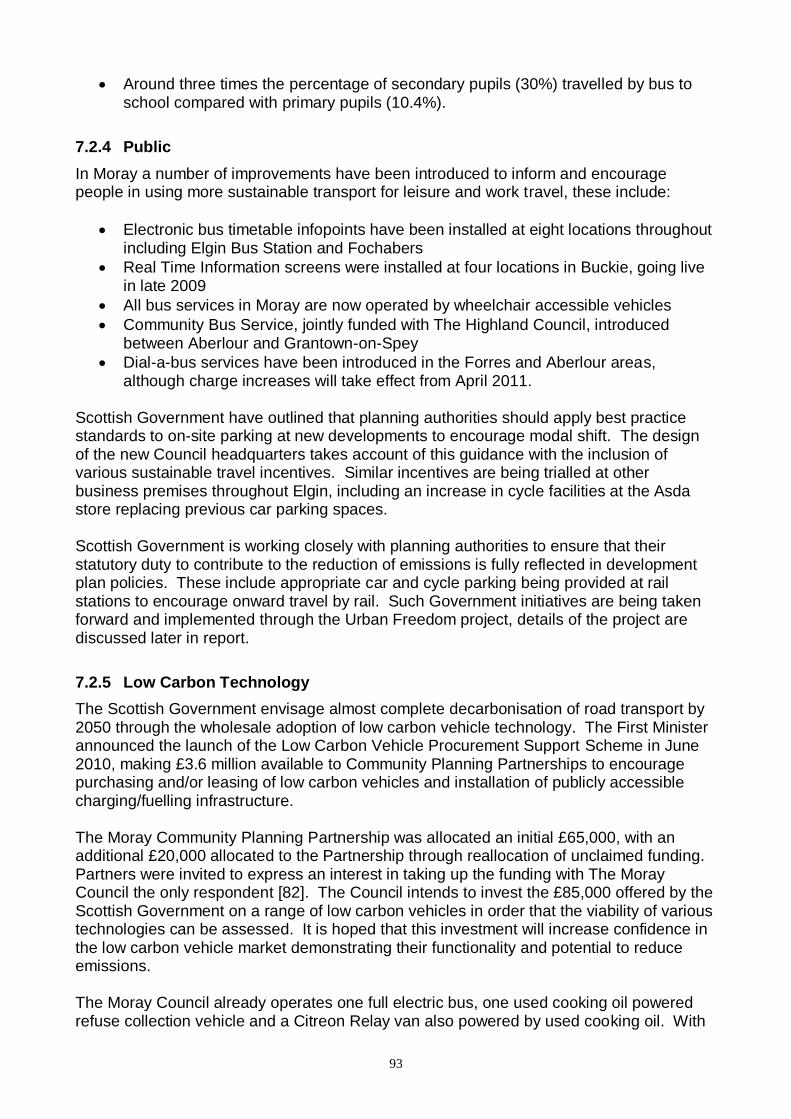
93
Around three times the percentage of secondary pupils (30%) travelled by bus to school compared with primary pupils (10.4%).
7.2.4 Public
In Moray a number of improvements have been introduced to inform and encourage people in using more sustainable transport for leisure and work travel, these include:
Electronic bus timetable infopoints have been installed at eight locations throughout including Elgin Bus Station and Fochabers
Real Time Information screens were installed at four locations in Buckie, going live in late 2009
All bus services in Moray are now operated by wheelchair accessible vehicles
Community Bus Service, jointly funded with The Highland Council, introduced between Aberlour and Grantown-on-Spey
Dial-a-bus services have been introduced in the Forres and Aberlour areas, although charge increases will take effect from April 2011.
Scottish Government have outlined that planning authorities should apply best practice standards to on-site parking at new developments to encourage modal shift. The design of the new Council headquarters takes account of this guidance with the inclusion of various sustainable travel incentives. Similar incentives are being trialled at other business premises throughout Elgin, including an increase in cycle facilities at the Asda store replacing previous car parking spaces. Scottish Government is working closely with planning authorities to ensure that their statutory duty to contribute to the reduction of emissions is fully reflected in development plan policies. These include appropriate car and cycle parking being provided at rail stations to encourage onward travel by rail. Such Government initiatives are being taken forward and implemented through the Urban Freedom project, details of the project are discussed later in report.
7.2.5 Low Carbon Technology
The Scottish Government envisage almost complete decarbonisation of road transport by 2050 through the wholesale adoption of low carbon vehicle technology. The First Minister announced the launch of the Low Carbon Vehicle Procurement Support Scheme in June 2010, making £3.6 million available to Community Planning Partnerships to encourage purchasing and/or leasing of low carbon vehicles and installation of publicly accessible charging/fuelling infrastructure. The Moray Community Planning Partnership was allocated an initial £65,000, with an additional £20,000 allocated to the Partnership through reallocation of unclaimed funding. Partners were invited to express an interest in taking up the funding with The Moray Council the only respondent [82]. The Council intends to invest the £85,000 offered by the Scottish Government on a range of low carbon vehicles in order that the viability of various technologies can be assessed. It is hoped that this investment will increase confidence in the low carbon vehicle market demonstrating their functionality and potential to reduce emissions. The Moray Council already operates one full electric bus, one used cooking oil powered refuse collection vehicle and a Citreon Relay van also powered by used cooking oil. With
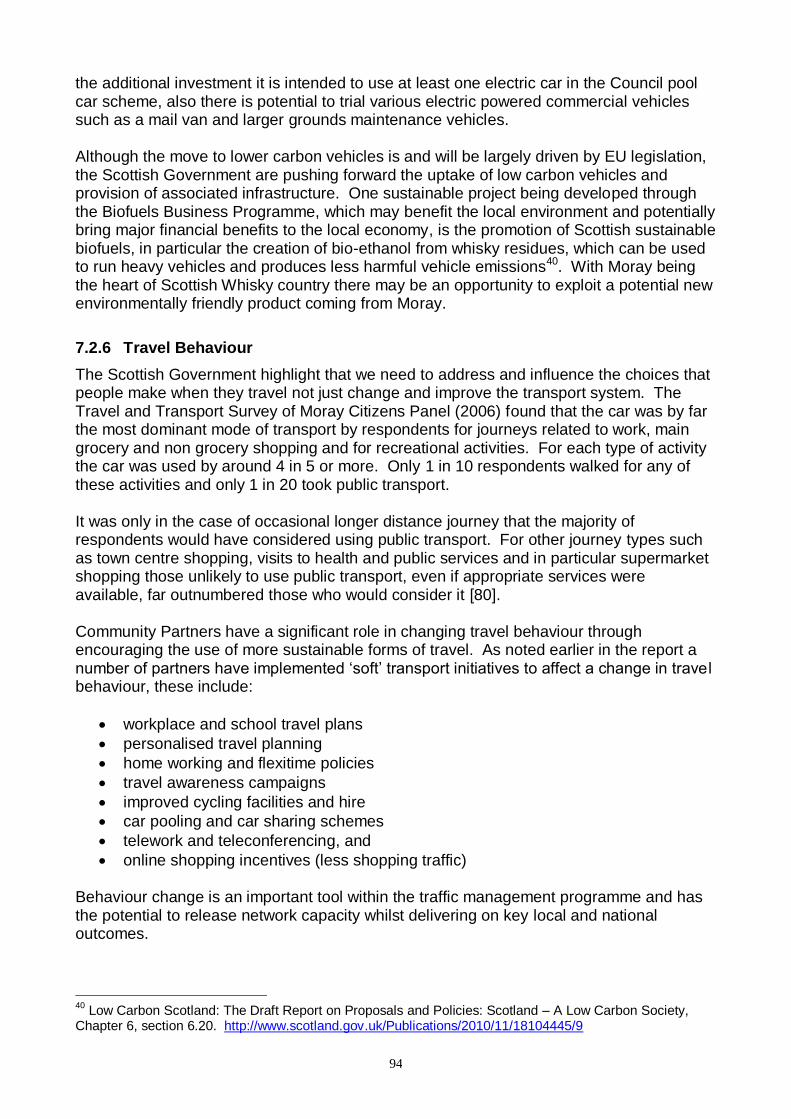
94
the additional investment it is intended to use at least one electric car in the Council pool car scheme, also there is potential to trial various electric powered commercial vehicles such as a mail van and larger grounds maintenance vehicles. Although the move to lower carbon vehicles is and will be largely driven by EU legislation, the Scottish Government are pushing forward the uptake of low carbon vehicles and provision of associated infrastructure. One sustainable project being developed through the Biofuels Business Programme, which may benefit the local environment and potentially bring major financial benefits to the local economy, is the promotion of Scottish sustainable biofuels, in particular the creation of bio-ethanol from whisky residues, which can be used to run heavy vehicles and produces less harmful vehicle emissions40. With Moray being the heart of Scottish Whisky country there may be an opportunity to exploit a potential new environmentally friendly product coming from Moray.
7.2.6 Travel Behaviour
The Scottish Government highlight that we need to address and influence the choices that people make when they travel not just change and improve the transport system. The Travel and Transport Survey of Moray Citizens Panel (2006) found that the car was by far the most dominant mode of transport by respondents for journeys related to work, main grocery and non grocery shopping and for recreational activities. For each type of activity the car was used by around 4 in 5 or more. Only 1 in 10 respondents walked for any of these activities and only 1 in 20 took public transport. It was only in the case of occasional longer distance journey that the majority of respondents would have considered using public transport. For other journey types such as town centre shopping, visits to health and public services and in particular supermarket shopping those unlikely to use public transport, even if appropriate services were available, far outnumbered those who would consider it [80]. Community Partners have a significant role in changing travel behaviour through encouraging the use of more sustainable forms of travel. As noted earlier in the report a number of partners have implemented ‗soft‘ transport initiatives to affect a change in trave l behaviour, these include:
workplace and school travel plans
personalised travel planning
home working and flexitime policies
travel awareness campaigns
improved cycling facilities and hire
car pooling and car sharing schemes
telework and teleconferencing, and
online shopping incentives (less shopping traffic) Behaviour change is an important tool within the traffic management programme and has the potential to release network capacity whilst delivering on key local and national outcomes.
40
Low Carbon Scotland: The Draft Report on Proposals and Policies: Scotland – A Low Carbon Society, Chapter 6, section 6.20. http://www.scotland.gov.uk/Publications/2010/11/18104445/9
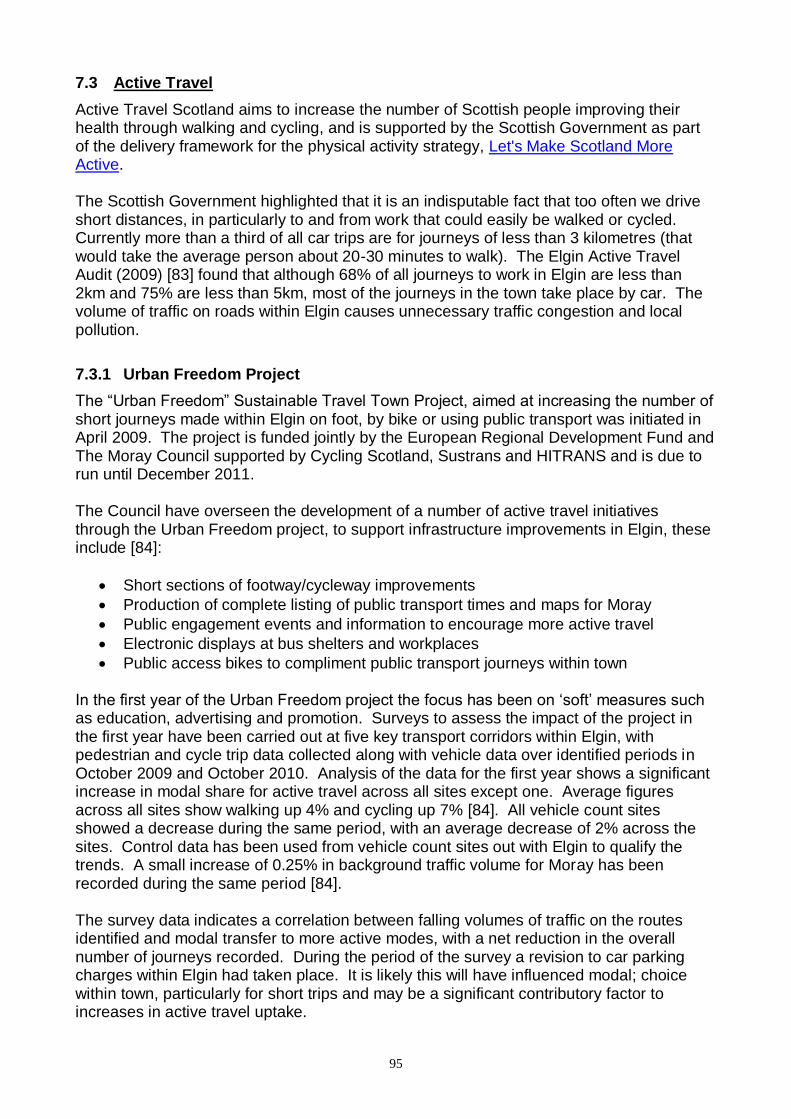
95
7.3 Active Travel
Active Travel Scotland aims to increase the number of Scottish people improving their health through walking and cycling, and is supported by the Scottish Government as part of the delivery framework for the physical activity strategy, Let's Make Scotland More Active. The Scottish Government highlighted that it is an indisputable fact that too often we drive short distances, in particularly to and from work that could easily be walked or cycled. Currently more than a third of all car trips are for journeys of less than 3 kilometres (that would take the average person about 20-30 minutes to walk). The Elgin Active Travel Audit (2009) [83] found that although 68% of all journeys to work in Elgin are less than 2km and 75% are less than 5km, most of the journeys in the town take place by car. The volume of traffic on roads within Elgin causes unnecessary traffic congestion and local pollution.
7.3.1 Urban Freedom Project
The ―Urban Freedom‖ Sustainable Travel Town Project, aimed at increasing the number of short journeys made within Elgin on foot, by bike or using public transport was initiated in April 2009. The project is funded jointly by the European Regional Development Fund and The Moray Council supported by Cycling Scotland, Sustrans and HITRANS and is due to run until December 2011. The Council have overseen the development of a number of active travel initiatives through the Urban Freedom project, to support infrastructure improvements in Elgin, these include [84]:
Short sections of footway/cycleway improvements
Production of complete listing of public transport times and maps for Moray
Public engagement events and information to encourage more active travel
Electronic displays at bus shelters and workplaces
Public access bikes to compliment public transport journeys within town In the first year of the Urban Freedom project the focus has been on ‗soft‘ measures such as education, advertising and promotion. Surveys to assess the impact of the project in the first year have been carried out at five key transport corridors within Elgin, with pedestrian and cycle trip data collected along with vehicle data over identified periods in October 2009 and October 2010. Analysis of the data for the first year shows a significant increase in modal share for active travel across all sites except one. Average figures across all sites show walking up 4% and cycling up 7% [84]. All vehicle count sites showed a decrease during the same period, with an average decrease of 2% across the sites. Control data has been used from vehicle count sites out with Elgin to qualify the trends. A small increase of 0.25% in background traffic volume for Moray has been recorded during the same period [84]. The survey data indicates a correlation between falling volumes of traffic on the routes identified and modal transfer to more active modes, with a net reduction in the overall number of journeys recorded. During the period of the survey a revision to car parking charges within Elgin had taken place. It is likely this will have influenced modal; choice within town, particularly for short trips and may be a significant contributory factor to increases in active travel uptake.
96
Proposals for active travel infrastructure improvements in Elgin as part of the Urban Freedom project were approved by The Moray Council in October 2010, subject to the outcome of a public consultation exercise and exhibition being undertaken in January 2011. Proposals to revise traffic management within Elgin town centre which largely overlap with the active travel proposals are also being put forward for public consultation. Funding for the active travel infrastructure improvements is being provided through the ‗Urban Freedom‘ project and Sustrans. In addition to the initiatives being led by The Moray Council three further initiatives are being progressed by partner organisations to support the objectives of the Urban Freedom project:
BIDs Elgin and Stagecoach supporting the trial of free circular bus service operating between Retail Park, Rail Station and Town Centre over the Christmas period
Investigating plans for a new rail crossing for pedestrians and cyclists to link with North – South active travel route supported by Transport Scotland, First Group and Network Rail
Proposal for Sustrans to fund a ‗Liveable Neighbourhoods‘ officer to work alongside Moray Council staff in Transportation section for two years to help deliver soft measures and inform the infrastructure changes for the Urban Freedom project.
Progress of the Urban Freedom projects and partner initiatives on the impact made to increasing active and sustainable travel in Moray, in particular Elgin, will be tracked and reported back to the Moray Council and partners over the course of the project and in future years. Active Travel Plans were also carried out in Keith and Buckie for HITRANS and the Moray Council in 2009 to identify a strategic approach for improving active infrastructure within the settlements. These Active Travel plans and the results of the Elgin ‗Urban Freedom‘ project will be considered to determine similar projects in other settlements in Moray in the future. Potential funding for such projects will possibly be sought through match funding between the Moray Council, European Regional Development Fund and LEADER.
7.3.2 Core Paths Plan
The Core Paths Plan was published in 2009, as a statutory requirement of the introduction of the Land Reform (Scotland) Act (2003). It provided a timely update to Moray Council‘s pre-existing Access Strategy. It sets out a framework of objectives with the purpose of giving the public ‘reasonable access throughout the local authority area‘. At present the Moray Council are awaiting a report from the Scottish Government Reporters Unit on the 16 outstanding objections on the Core Paths Plan. Once received, the report will be submitted to the Council for approval for the adoption of the Plan sometime during 2011. The Core paths should be considered as part of wider Moray Paths Network and not just paths in isolation. A comprehensive network could help realise many benefits for Moray including a reduction in car usage, better health, improvements in public safety, and more visitors to the area. The Core Paths Plan once adopted, will provide for this ‗Plan of Action‘ and is the best way to focus resources to improve things on the ground. As noted earlier in the report the Core Path Plan will incorporate 482kms of paths, 124kms of which will be on public roads. While the Plan will be approved in 2011, Council Budget savings are likely to have a major impact on the progress of carrying out works on the

97
paths to link up the network and upgrade and maintain them. The paths will need to be safe and usable particularly where they are on public roads, or cyclist and walkers will be reluctant to use them and continue to travel by motorised vehicles.
98
8 Waste
Scotland produces large quantities of waste – almost 20 million tonnes in 2008. This comes from a range of sources, with household waste accounting for 2.9 million tonnes, compared with 8.6 million tonnes from the construction industry, and 7.9 million tonnes from the rest of the commercial and industrial sector [86]. While Scotland continues to produce significant levels of waste, considerable progress has been made over the last decade to reduce the level of waste we produce. The Scottish Government has supported local authorities in driving up recycling rates and achieving the European target to cut the amount of biodegradable waste sent to landfill more than 4 years earlier than the EU legislative deadline of 2013. In compliance with the EC landfill directive (1999), Scotland produced its National Waste Strategy Scotland (1999) followed by the 11 Area Waste Plans, which were then integrated into the National Waste Plan (2003). The Scottish Government has recently reviewed the 2003 National Waste Plan for Scotland and produced Scotland's Zero Waste Plan in June 2010. Consultation on the regulatory framework to support the Zero Waste Plan began on the 1st December with responses due by 28th February 2011.
8.1 Zero Waste Plan
Scotland‘s Zero Waste Plan sets out the Scottish Government‘s vision for a zero waste society. This vision describes a Scotland where all waste is seen as a resource; waste is minimised; valuable resources are not disposed of in landfills, and most waste is sorted, leaving only limited amounts to be treated [86]. The Plan and proposed measures present a step change in how Scotland deals with waste, shifting the emphasis away from the disposal of waste to ensuring the prevention and reuse of waste. It is envisaged that a zero waste Scotland will play an important role in helping to achieve the targets set in the Climate Change (Scotland) Act 2009 to reduce Scotland‘s harmful emissions. The extraction, processing, use and disposal of all materials produces environmental impacts, and contributes directly to climate change through the energy used. Waste disposal also has major climate impacts, particularly the emission of the greenhouse gas methane from landfill sites. The Zero Waste Plan will also progress some of the key measures and provisions set out in the Scottish Government‘s Climate Change Delivery Plan (2009) and the Climate Change (Scotland) Act 2009, and build on the progress that has already been achieved in reducing the climate impacts of waste management in Scotland. The Plan focuses on the use of the ‗waste hierarchy‘ – a series of options for managing waste – to help us achieve a reduction in the amount of waste produced and recovering maximum value from waste that is produced. The hierarchy identifies the prevention of waste as the highest priority, followed by reuse, recycling/composting, recovery of other value (eg, energy), with disposal as the least desirable option. The Scottish Environment Protection Agency (SEPA), Scotland‘s environmental regulator, provides the following description for each option [87]:
1. Prevention – strict avoidance of waste, reduction at source and product reuse. 2. Reuse – the multiple use of a product in its original form, for its original purpose or
for an alternative, with or without reconditioning.
99
3. Recycling – using waste materials in manufacturing other products of an identical
or similar nature. 4. Composting – a natural process that breaks down materials such as garden and
kitchen waste. 5. Energy Recovery – energy from waste is the recovery of energy value from waste
by burning the waste directly or burning a fuel produced from the waste. 6. Disposal – generally involves burying the waste in a landfill or burning it at high
temperatures in an incinerator to destroy it.
8.2 Moray - Domestic and Commercial Waste
In Moray the Council operate a household refuse and kerbside recycling service along with the provision of recycling points and centres throughout the area. Over twenty recycling and refuse collection vehicles collect household waste from around 34,000 domestic properties in urban areas out of a total of around 44,000. Green (garden) waste is collected fortnightly alternatively with residual waste, and a weekly collection for dry recyclates of paper/glass bottles/ cans is provided. A segregated collection system has also been introduced to business sector to remove as much recyclate from their residual waste as possible. In addition there are 9 recycling centres (5 of which are attended) where a wide range of recyclates can be taken and over 60 recycling points where specific recyclates can be deposited. Recycling centres across Moray collect some or all of:
Food and drinks cans Rubble End of life vehicles
Car batteries Scrap metal Household batteries
Garden waste
Glass bottles and jars
Textiles
Used engine oil
Waste Electrical & Electronic Equipment
Plastic bottles White goods
Paper & cardboard Wood
As part of the Council‘s duty to collect household waste they are also required to pick up bulky household waste where item(s) are in excess or too large for the wheeled bin. A charge of £17.14 per uplift will be applied for the service. The only exception to this is for white goods which the Council has agreed to uplift free of charge. The Council has no duty to be involved in the collection of Waste Electronic and Electrical Equipment (WEEE), however to continue to accept WEEE from households it has required the Council to have at least one Designated Collection Facility under the WEEE regulations. WEEE is transferred from the Council‘s facilities for recycling/reprocessing and disposal in accordance with the Code of Practice. No cost is incurred by the Council for transfer of WEEE items, although there is an initial cost in collecting items from householders [88].
8.2.1 Moray – Waste Performance
During 2009/10 a total of 64,531 tonnes of combined household and commercial waste (municipal solid waste) was collected and dealt with in Moray. Of the waste produced 41.5% was recycled, leaving 58.5% or 37,738 tonnes being sent to landfill at the Nether Dallachy site which is the only operational landfill facility located in Moray. 22,730 tonnes of the waste that went to landfill was biodegradable municipal waste (BMW), representing 35.2% of the total waste collected. It is estimated that the impact of landfilling at the current level of municipal solid waste is around 16,000t of CO2 each year [89].
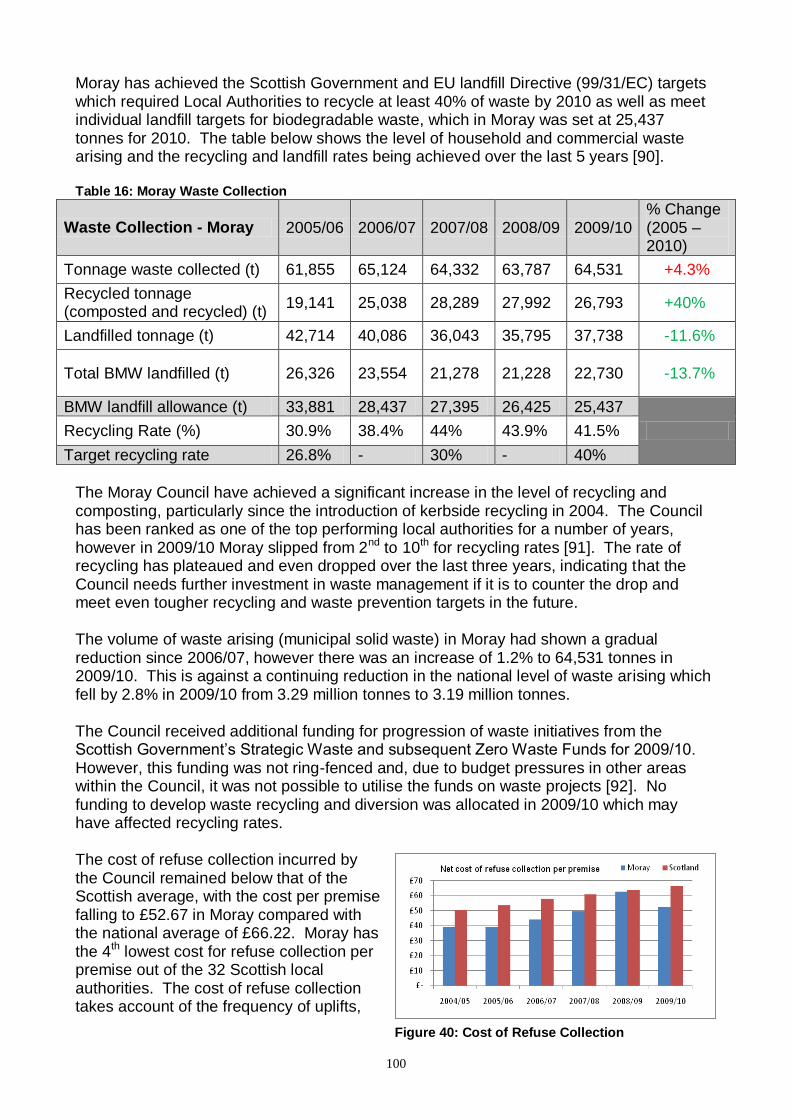
100
Moray has achieved the Scottish Government and EU landfill Directive (99/31/EC) targets which required Local Authorities to recycle at least 40% of waste by 2010 as well as meet individual landfill targets for biodegradable waste, which in Moray was set at 25,437 tonnes for 2010. The table below shows the level of household and commercial waste arising and the recycling and landfill rates being achieved over the last 5 years [90]. Table 16: Moray Waste Collection
Waste Collection - Moray 2005/06 2006/07 2007/08 2008/09 2009/10 % Change (2005 – 2010)
Tonnage waste collected (t) 61,855 65,124 64,332 63,787 64,531 +4.3%
Recycled tonnage (composted and recycled) (t)
19,141 25,038 28,289 27,992 26,793 +40%
Landfilled tonnage (t) 42,714 40,086 36,043 35,795 37,738 -11.6%
Total BMW landfilled (t) 26,326 23,554 21,278 21,228 22,730 -13.7%
BMW landfill allowance (t) 33,881 28,437 27,395 26,425 25,437
Recycling Rate (%) 30.9% 38.4% 44% 43.9% 41.5%
Target recycling rate 26.8% - 30% - 40%
The Moray Council have achieved a significant increase in the level of recycling and composting, particularly since the introduction of kerbside recycling in 2004. The Council has been ranked as one of the top performing local authorities for a number of years, however in 2009/10 Moray slipped from 2nd to 10th for recycling rates [91]. The rate of recycling has plateaued and even dropped over the last three years, indicating that the Council needs further investment in waste management if it is to counter the drop and meet even tougher recycling and waste prevention targets in the future. The volume of waste arising (municipal solid waste) in Moray had shown a gradual reduction since 2006/07, however there was an increase of 1.2% to 64,531 tonnes in 2009/10. This is against a continuing reduction in the national level of waste arising which fell by 2.8% in 2009/10 from 3.29 million tonnes to 3.19 million tonnes. The Council received additional funding for progression of waste initiatives from the Scottish Government‘s Strategic Waste and subsequent Zero Waste Funds for 2009/10. However, this funding was not ring-fenced and, due to budget pressures in other areas within the Council, it was not possible to utilise the funds on waste projects [92]. No funding to develop waste recycling and diversion was allocated in 2009/10 which may have affected recycling rates. The cost of refuse collection incurred by the Council remained below that of the Scottish average, with the cost per premise falling to £52.67 in Moray compared with the national average of £66.22. Moray has the 4th lowest cost for refuse collection per premise out of the 32 Scottish local authorities. The cost of refuse collection takes account of the frequency of uplifts,
Figure 40: Cost of Refuse Collection
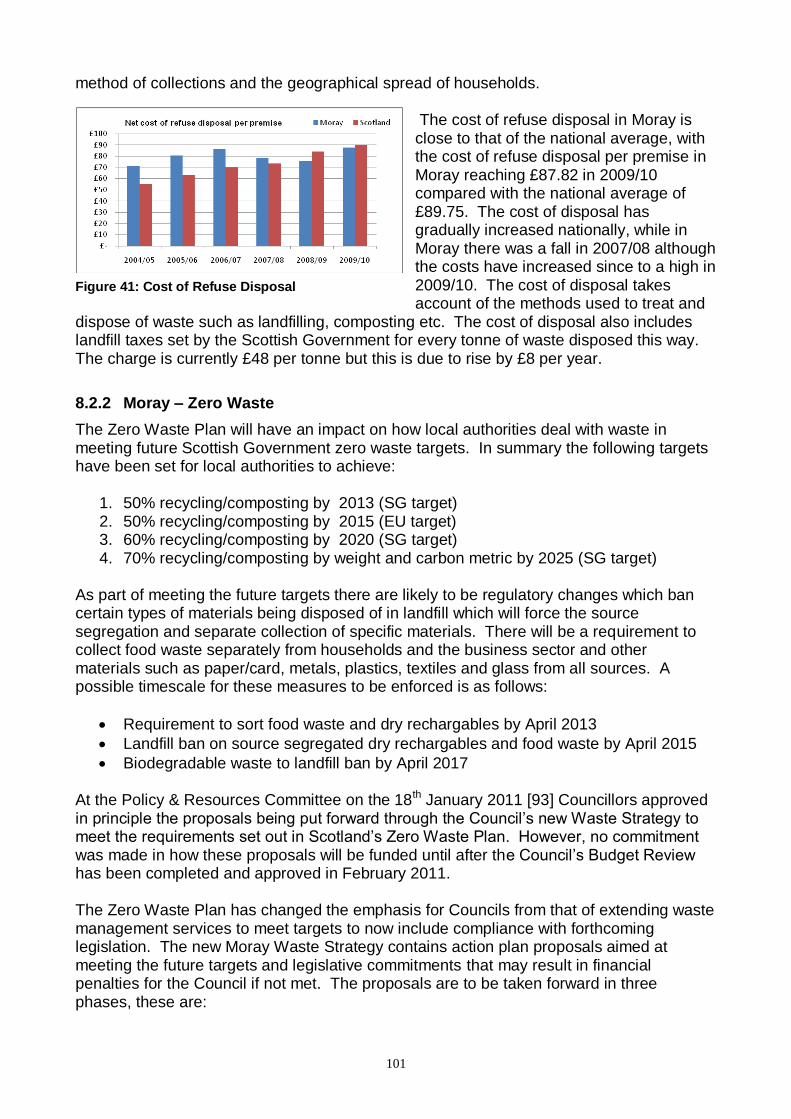
101
method of collections and the geographical spread of households. The cost of refuse disposal in Moray is close to that of the national average, with the cost of refuse disposal per premise in Moray reaching £87.82 in 2009/10 compared with the national average of £89.75. The cost of disposal has gradually increased nationally, while in Moray there was a fall in 2007/08 although the costs have increased since to a high in 2009/10. The cost of disposal takes account of the methods used to treat and
dispose of waste such as landfilling, composting etc. The cost of disposal also includes landfill taxes set by the Scottish Government for every tonne of waste disposed this way. The charge is currently £48 per tonne but this is due to rise by £8 per year.
8.2.2 Moray – Zero Waste
The Zero Waste Plan will have an impact on how local authorities deal with waste in meeting future Scottish Government zero waste targets. In summary the following targets have been set for local authorities to achieve:
1. 50% recycling/composting by 2013 (SG target) 2. 50% recycling/composting by 2015 (EU target) 3. 60% recycling/composting by 2020 (SG target) 4. 70% recycling/composting by weight and carbon metric by 2025 (SG target)
As part of meeting the future targets there are likely to be regulatory changes which ban certain types of materials being disposed of in landfill which will force the source segregation and separate collection of specific materials. There will be a requirement to collect food waste separately from households and the business sector and other materials such as paper/card, metals, plastics, textiles and glass from all sources. A possible timescale for these measures to be enforced is as follows:
Requirement to sort food waste and dry rechargables by April 2013
Landfill ban on source segregated dry rechargables and food waste by April 2015
Biodegradable waste to landfill ban by April 2017 At the Policy & Resources Committee on the 18th January 2011 [93] Councillors approved in principle the proposals being put forward through the Council‘s new Waste Strategy to meet the requirements set out in Scotland‘s Zero Waste Plan. However, no commitment was made in how these proposals will be funded until after the Council‘s Budget Review has been completed and approved in February 2011. The Zero Waste Plan has changed the emphasis for Councils from that of extending waste management services to meet targets to now include compliance with forthcoming legislation. The new Moray Waste Strategy contains action plan proposals aimed at meeting the future targets and legislative commitments that may result in financial penalties for the Council if not met. The proposals are to be taken forward in three phases, these are:
Figure 41: Cost of Refuse Disposal
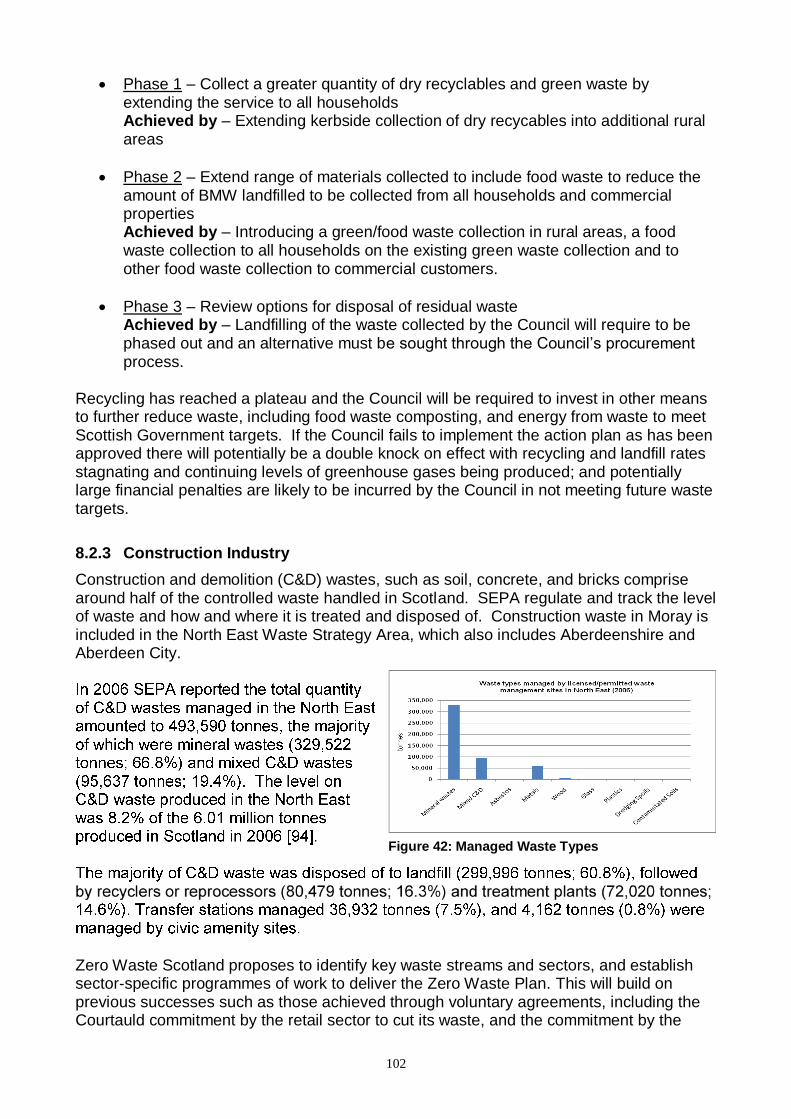
102
Phase 1 – Collect a greater quantity of dry recyclables and green waste by extending the service to all households Achieved by – Extending kerbside collection of dry recycables into additional rural areas
Phase 2 – Extend range of materials collected to include food waste to reduce the amount of BMW landfilled to be collected from all households and commercial properties Achieved by – Introducing a green/food waste collection in rural areas, a food waste collection to all households on the existing green waste collection and to other food waste collection to commercial customers.
Phase 3 – Review options for disposal of residual waste Achieved by – Landfilling of the waste collected by the Council will require to be phased out and an alternative must be sought through the Council‘s procurement process.
Recycling has reached a plateau and the Council will be required to invest in other means to further reduce waste, including food waste composting, and energy from waste to meet Scottish Government targets. If the Council fails to implement the action plan as has been approved there will potentially be a double knock on effect with recycling and landfill rates stagnating and continuing levels of greenhouse gases being produced; and potentially large financial penalties are likely to be incurred by the Council in not meeting future waste targets.
8.2.3 Construction Industry
Construction and demolition (C&D) wastes, such as soil, concrete, and bricks comprise around half of the controlled waste handled in Scotland. SEPA regulate and track the level of waste and how and where it is treated and disposed of. Construction waste in Moray is included in the North East Waste Strategy Area, which also includes Aberdeenshire and Aberdeen City.
Zero Waste Scotland proposes to identify key waste streams and sectors, and establish sector-specific programmes of work to deliver the Zero Waste Plan. This will build on previous successes such as those achieved through voluntary agreements, including the Courtauld commitment by the retail sector to cut its waste, and the commitment by the
Figure 42: Managed Waste Types
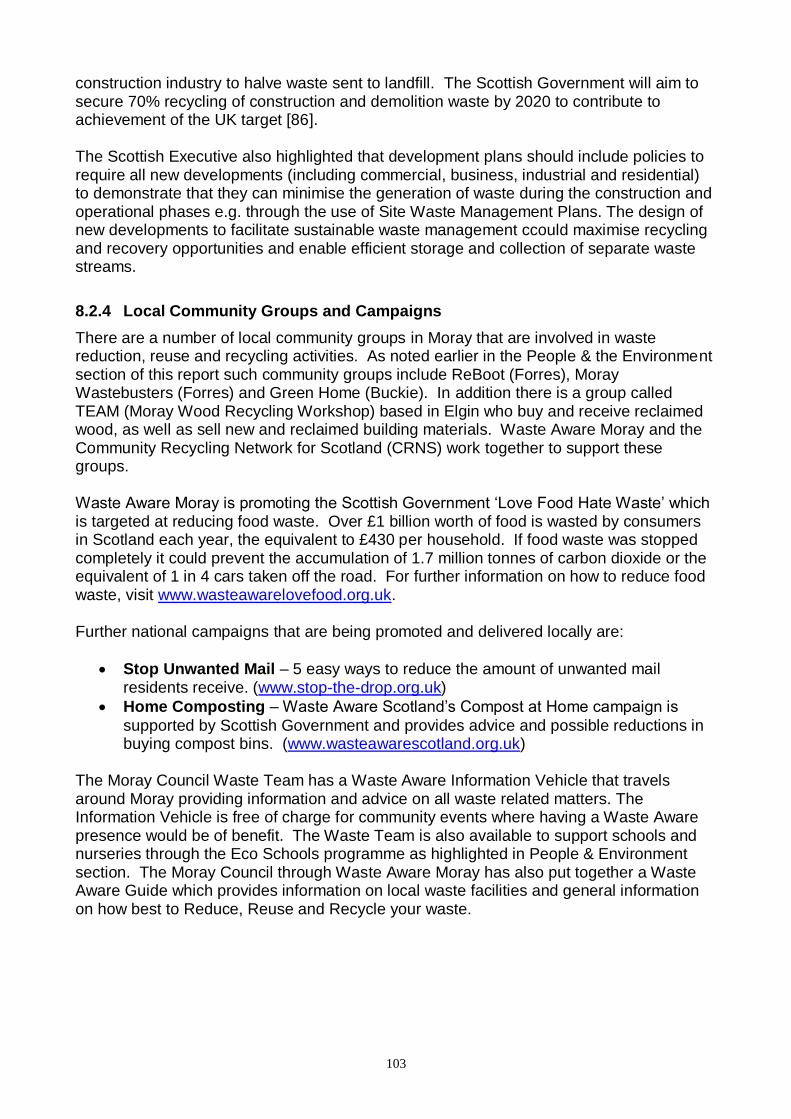
103
construction industry to halve waste sent to landfill. The Scottish Government will aim to secure 70% recycling of construction and demolition waste by 2020 to contribute to achievement of the UK target [86]. The Scottish Executive also highlighted that development plans should include policies to require all new developments (including commercial, business, industrial and residential) to demonstrate that they can minimise the generation of waste during the construction and operational phases e.g. through the use of Site Waste Management Plans. The design of new developments to facilitate sustainable waste management ccould maximise recycling and recovery opportunities and enable efficient storage and collection of separate waste streams.
8.2.4 Local Community Groups and Campaigns
There are a number of local community groups in Moray that are involved in waste reduction, reuse and recycling activities. As noted earlier in the People & the Environment section of this report such community groups include ReBoot (Forres), Moray Wastebusters (Forres) and Green Home (Buckie). In addition there is a group called TEAM (Moray Wood Recycling Workshop) based in Elgin who buy and receive reclaimed wood, as well as sell new and reclaimed building materials. Waste Aware Moray and the Community Recycling Network for Scotland (CRNS) work together to support these groups. Waste Aware Moray is promoting the Scottish Government ‗Love Food Hate Waste‘ which is targeted at reducing food waste. Over £1 billion worth of food is wasted by consumers in Scotland each year, the equivalent to £430 per household. If food waste was stopped completely it could prevent the accumulation of 1.7 million tonnes of carbon dioxide or the equivalent of 1 in 4 cars taken off the road. For further information on how to reduce food waste, visit www.wasteawarelovefood.org.uk. Further national campaigns that are being promoted and delivered locally are:
Stop Unwanted Mail – 5 easy ways to reduce the amount of unwanted mail residents receive. (www.stop-the-drop.org.uk)
Home Composting – Waste Aware Scotland‘s Compost at Home campaign is
supported by Scottish Government and provides advice and possible reductions in buying compost bins. (www.wasteawarescotland.org.uk)
The Moray Council Waste Team has a Waste Aware Information Vehicle that travels around Moray providing information and advice on all waste related matters. The Information Vehicle is free of charge for community events where having a Waste Aware presence would be of benefit. The Waste Team is also available to support schools and nurseries through the Eco Schools programme as highlighted in People & Environment section. The Moray Council through Waste Aware Moray has also put together a Waste Aware Guide which provides information on local waste facilities and general information on how best to Reduce, Reuse and Recycle your waste.
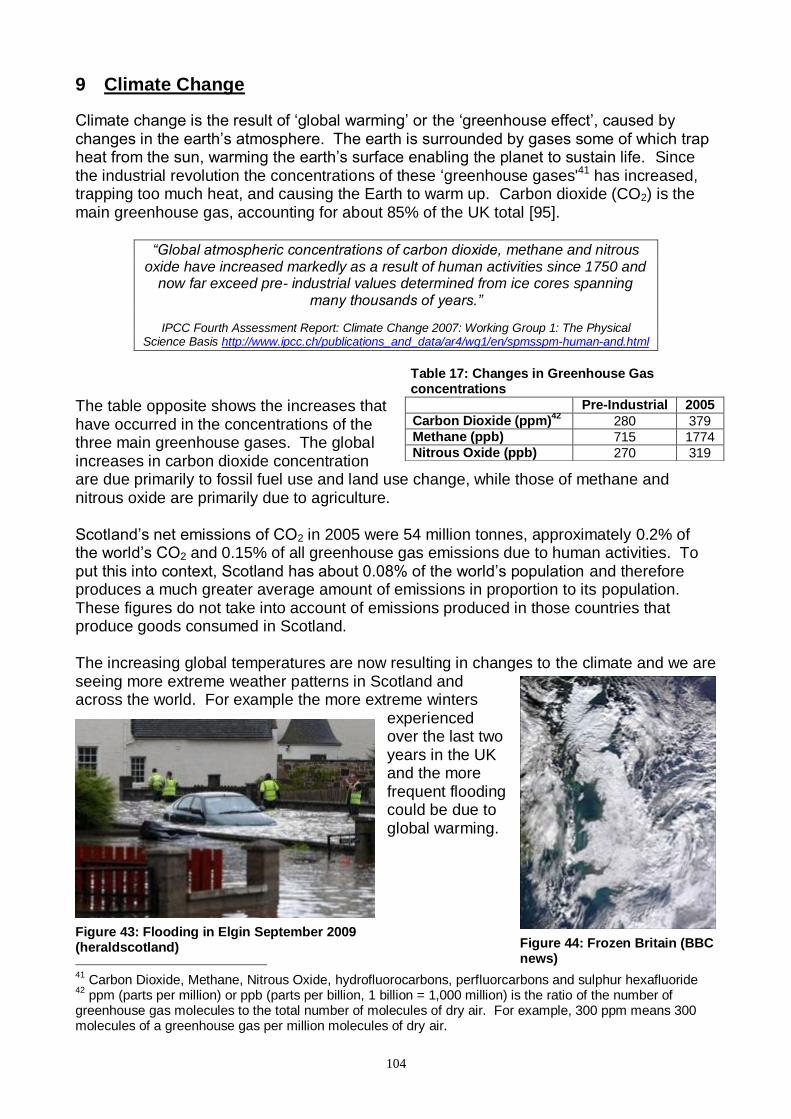
104
9 Climate Change
Climate change is the result of ‗global warming‘ or the ‗greenhouse effect‘, caused by changes in the earth‘s atmosphere. The earth is surrounded by gases some of which trap heat from the sun, warming the earth‘s surface enabling the planet to sustain life. Since the industrial revolution the concentrations of these ‗greenhouse gases'41 has increased, trapping too much heat, and causing the Earth to warm up. Carbon dioxide (CO2) is the main greenhouse gas, accounting for about 85% of the UK total [95].
“Global atmospheric concentrations of carbon dioxide, methane and nitrous oxide have increased markedly as a result of human activities since 1750 and
now far exceed pre- industrial values determined from ice cores spanning many thousands of years.”
IPCC Fourth Assessment Report: Climate Change 2007: Working Group 1: The Physical Science Basis http://www.ipcc.ch/publications_and_data/ar4/wg1/en/spmsspm-human-and.html
Table 17: Changes in Greenhouse Gas concentrations
The table opposite shows the increases that have occurred in the concentrations of the three main greenhouse gases. The global increases in carbon dioxide concentration are due primarily to fossil fuel use and land use change, while those of methane and nitrous oxide are primarily due to agriculture. Scotland‘s net emissions of CO2 in 2005 were 54 million tonnes, approximately 0.2% of the world‘s CO2 and 0.15% of all greenhouse gas emissions due to human activities. To put this into context, Scotland has about 0.08% of the world‘s population and therefore produces a much greater average amount of emissions in proportion to its population. These figures do not take into account of emissions produced in those countries that produce goods consumed in Scotland. The increasing global temperatures are now resulting in changes to the climate and we are seeing more extreme weather patterns in Scotland and across the world. For example the more extreme winters
experienced over the last two years in the UK and the more frequent flooding could be due to global warming.
41
Carbon Dioxide, Methane, Nitrous Oxide, hydrofluorocarbons, perfluorcarbons and sulphur hexafluoride 42
ppm (parts per million) or ppb (parts per billion, 1 billion = 1,000 million) is the ratio of the number of greenhouse gas molecules to the total number of molecules of dry air. For example, 300 ppm means 300 molecules of a greenhouse gas per million molecules of dry air.
Pre-Industrial 2005
Carbon Dioxide (ppm)42
280 379 Methane (ppb) 715 1774 Nitrous Oxide (ppb) 270 319
Figure 44: Frozen Britain (BBC news)
Figure 43: Flooding in Elgin September 2009 (heraldscotland)
105
“Climate change is not just a threat for the future, it is a reality now”.43
The Intergovernmental Panel on Climate Change (IPCC), which assesses the literature on climate change, reported in 2007 [96] that ―humans are almost certainly influencing the climate and highlights the need for urgent action to avoid dangerous climate change”.
9.1 International Agreements
There are numerous international agreements, conventions, directives etc that set out requirements for action in relation to climate change, some compulsory, some optional. The following provides a brief description of the main documents, with more detail available in Appendix 4.
9.1.1 United Nations Framework Convention on Climate Change
The United Nations Framework Convention on Climate Change (UNFCCC) was opened for signature in the Rio de Janeiro Summit in 1992 and entered into force in 1994. It recognises that greenhouse gas emissions can adversely impact upon our climate. It aims to encourage international governments to work together to achieve a stable and non-dangerous level of greenhouse gas concentrations.
9.1.2 The Kyoto Protocol
The Kyoto Protocol set legally-binding targets for developed countries to reduce greenhouse gas (GHG) emissions. It also provided flexible mechanisms to stimulate investment in developing countries. The Protocol‘s targets for reducing greenhouse gas (GHG) emissions in developed countries amount to a 5% reduction from 1990 levels, to be met over the five-year period 2008-2012. It became legally-binding on 16 February 2005, after more than 55 Parties to the Convention had ratified the Protocol (including countries responsible for at least 55% of industrialised countries CO2 emissions in 1990). 184 Parties of the Convention have ratified the Kyoto Protocol to date.
9.1.3 European Union Policy
The European Union has set targets and policies that extend beyond the original ambition of the Kyoto Protocol. 9.1.3.1 The European Climate Change Programme
The European Climate Change Programme (ECCP) outlines a climate change strategy to help prevent temperatures from increasing to more than 2°C above pre-industrial levels. 9.1.3.2 EU Emissions Trading Scheme
The EU Emissions Trading Scheme (EU ETS) puts a cap on the carbon dioxide (CO2) emitted by business and creates a market and price for carbon allowances. It covers 45% of EU emissions, including energy intensive sectors and approximately 12,000 installations. The scheme started in 2005.
43
http://www.scotland.gov.uk/Topics/Environment/climatechange/what-is
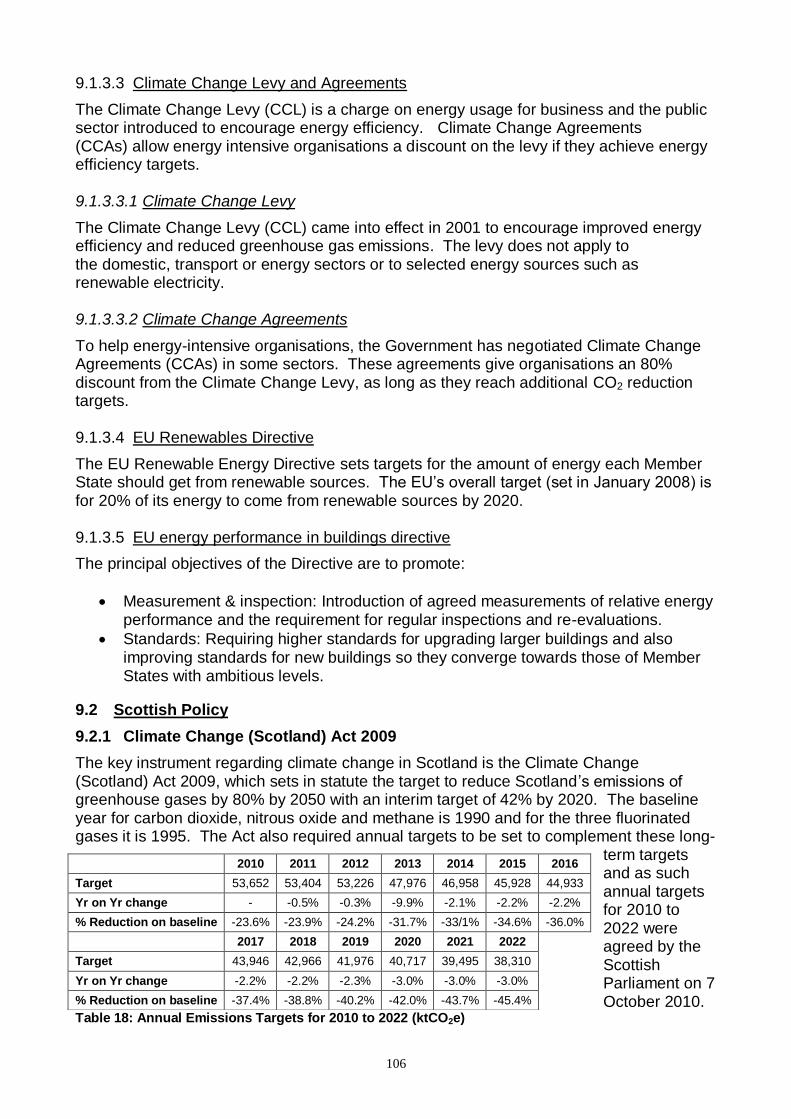
106
9.1.3.3 Climate Change Levy and Agreements
The Climate Change Levy (CCL) is a charge on energy usage for business and the public sector introduced to encourage energy efficiency. Climate Change Agreements (CCAs) allow energy intensive organisations a discount on the levy if they achieve energy efficiency targets. 9.1.3.3.1 Climate Change Levy
The Climate Change Levy (CCL) came into effect in 2001 to encourage improved energy efficiency and reduced greenhouse gas emissions. The levy does not apply to the domestic, transport or energy sectors or to selected energy sources such as renewable electricity. 9.1.3.3.2 Climate Change Agreements
To help energy-intensive organisations, the Government has negotiated Climate Change Agreements (CCAs) in some sectors. These agreements give organisations an 80% discount from the Climate Change Levy, as long as they reach additional CO2 reduction targets. 9.1.3.4 EU Renewables Directive
The EU Renewable Energy Directive sets targets for the amount of energy each Member State should get from renewable sources. The EU‘s overall target (set in January 2008) is for 20% of its energy to come from renewable sources by 2020. 9.1.3.5 EU energy performance in buildings directive
The principal objectives of the Directive are to promote:
Measurement & inspection: Introduction of agreed measurements of relative energy performance and the requirement for regular inspections and re-evaluations.
Standards: Requiring higher standards for upgrading larger buildings and also improving standards for new buildings so they converge towards those of Member States with ambitious levels.
9.2 Scottish Policy
9.2.1 Climate Change (Scotland) Act 2009
The key instrument regarding climate change in Scotland is the Climate Change (Scotland) Act 2009, which sets in statute the target to reduce Scotland‘s emissions of greenhouse gases by 80% by 2050 with an interim target of 42% by 2020. The baseline year for carbon dioxide, nitrous oxide and methane is 1990 and for the three fluorinated gases it is 1995. The Act also required annual targets to be set to complement these long-
term targets and as such annual targets for 2010 to 2022 were agreed by the Scottish Parliament on 7 October 2010.
Table 18: Annual Emissions Targets for 2010 to 2022 (ktCO2e)
2010 2011 2012 2013 2014 2015 2016
Target 53,652 53,404 53,226 47,976 46,958 45,928 44,933
Yr on Yr change - -0.5% -0.3% -9.9% -2.1% -2.2% -2.2%
% Reduction on baseline -23.6% -23.9% -24.2% -31.7% -33/1% -34.6% -36.0%
2017 2018 2019 2020 2021 2022
Target 43,946 42,966 41,976 40,717 39,495 38,310
Yr on Yr change -2.2% -2.2% -2.3% -3.0% -3.0% -3.0%
% Reduction on baseline -37.4% -38.8% -40.2% -42.0% -43.7% -45.4%
107
Part 4 of the Act, which came into force in 1st January 2011, places duties on public bodies regarding climate change that require a public body in the exercising its functions to act:
in the way best calculated to contribute to delivery of the Act's emissions reduction targets;
in the way best calculated to deliver the Climate Change Adaptation Programme;
in a way that it considers most sustainable. Key public bodies include Local Authorities, SNH, SEPA, NHS Boards, Police Forces, Universities and Colleges, Regional Transport Partnerships and other public bodies with large annual budgets. These major players are expected to take a lead in contributing to the achievement of Scotland‘s emissions reduction targets, being well placed to encourage wider action. In accordance with the Act the Scottish Government has produced advisory guidance to public bodies in relation to their climate change duties, which is currently in working form and will be further augmented in response to consultation feedback.
9.2.2 Carbon Reduction Commitment Energy Efficiency Scheme
The Carbon Reduction Commitment Energy Efficiency Scheme (CRC) is a mandatory carbon emissions reporting and pricing scheme to cover all organisations using more than 6,000MWh per year of electricity. The CRC comprises three primary elements:
1. Emissions reporting requirement: Participants need to measure and report their carbon emissions annually. The first annual report of emissions is due in July 2011.
2. A new carbon price: Starting in 2012, participants will buy allowances from Government each year to cover their emissions in the previous year. This means that organisations that decrease their emissions can lower their costs under the CRC. The price of allowances has not yet been determined but the intent prior to the Spending Review in October 2010 was to sell allowances at a fixed price of £12 per tonne CO2 through fiscal year 2012/13, with a floating market price after that.
3. Ranking of participants in a performance league table: A publicly available CRC performance league table will show how each participant is performing compared with others in the scheme. Rankings will be based upon three measures:
50% on percentage electricity and gas covered by voluntary automatic meter readings in 2010/2011. Other 50% on proportion of CRC emissions certified under Carbon Trust Standard.
% change in emissions, compared with average of previous 5yrs (or no available until 2014/15).
% change in emissions per unit turnover compared with average of previous 5yrs (or no available until 2014/15).
The Comprehensive Spending Review brought about a significant change. The Carbon Reduction Commitment Energy Efficiency Scheme will now be revenue-raising, for the Government, instead of revenue-neutral; this policy will have a major impact on all organisations covered by the scheme. The Carbon Reduction Commitment Energy Efficiency Scheme is a legal requirement with significant financial penalties for non-compliance.
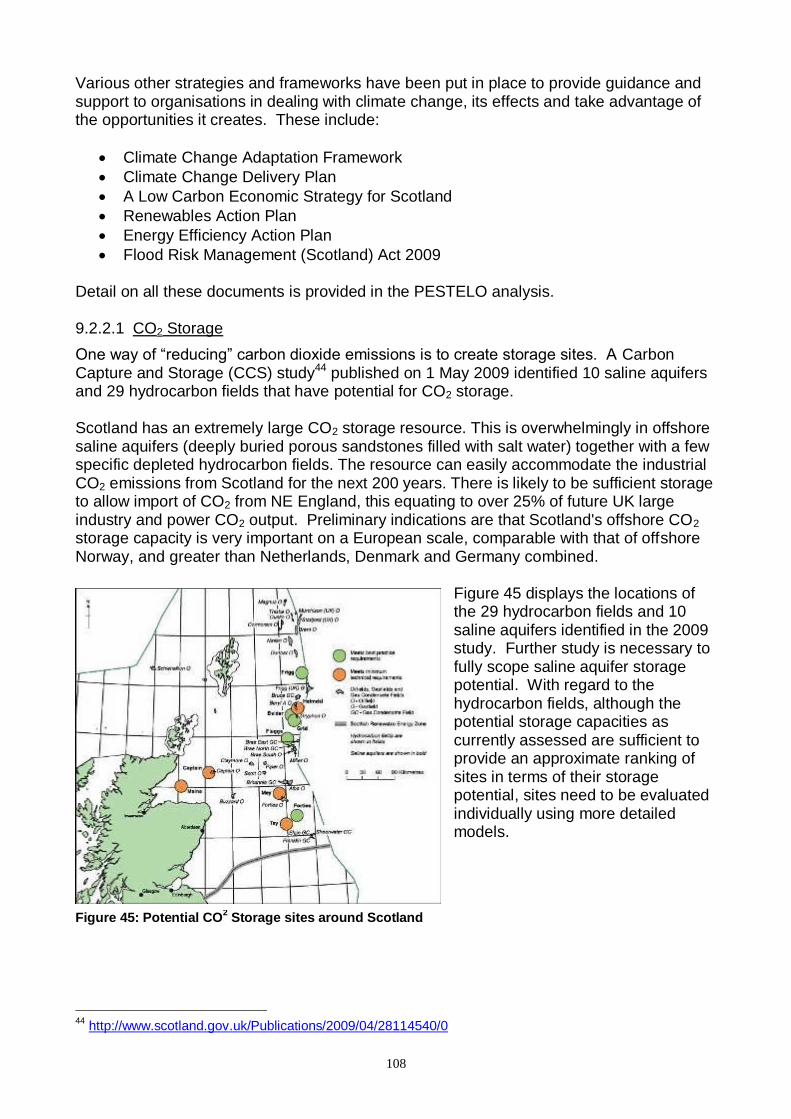
108
Various other strategies and frameworks have been put in place to provide guidance and support to organisations in dealing with climate change, its effects and take advantage of the opportunities it creates. These include:
Climate Change Adaptation Framework
Climate Change Delivery Plan
A Low Carbon Economic Strategy for Scotland
Renewables Action Plan
Energy Efficiency Action Plan
Flood Risk Management (Scotland) Act 2009 Detail on all these documents is provided in the PESTELO analysis. 9.2.2.1 CO2 Storage
One way of ―reducing‖ carbon dioxide emissions is to create storage sites. A Carbon Capture and Storage (CCS) study44 published on 1 May 2009 identified 10 saline aquifers and 29 hydrocarbon fields that have potential for CO2 storage. Scotland has an extremely large CO2 storage resource. This is overwhelmingly in offshore saline aquifers (deeply buried porous sandstones filled with salt water) together with a few specific depleted hydrocarbon fields. The resource can easily accommodate the industrial CO2 emissions from Scotland for the next 200 years. There is likely to be sufficient storage to allow import of CO2 from NE England, this equating to over 25% of future UK large industry and power CO2 output. Preliminary indications are that Scotland's offshore CO2 storage capacity is very important on a European scale, comparable with that of offshore Norway, and greater than Netherlands, Denmark and Germany combined.
Figure 45 displays the locations of the 29 hydrocarbon fields and 10 saline aquifers identified in the 2009 study. Further study is necessary to fully scope saline aquifer storage potential. With regard to the hydrocarbon fields, although the potential storage capacities as currently assessed are sufficient to provide an approximate ranking of sites in terms of their storage potential, sites need to be evaluated individually using more detailed models.
44
http://www.scotland.gov.uk/Publications/2009/04/28114540/0
Figure 45: Potential CO2 Storage sites around Scotland
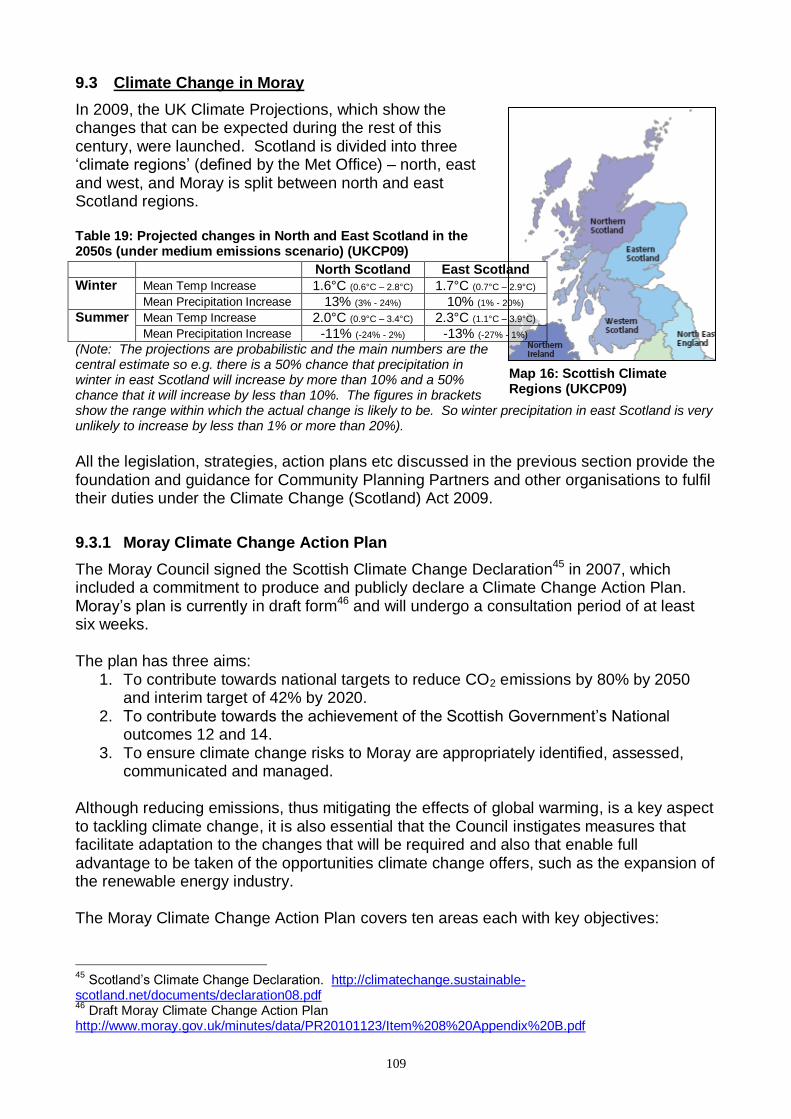
109
Map 16: Scottish Climate Regions (UKCP09)
9.3 Climate Change in Moray
In 2009, the UK Climate Projections, which show the changes that can be expected during the rest of this century, were launched. Scotland is divided into three ‗climate regions‘ (defined by the Met Office) – north, east and west, and Moray is split between north and east Scotland regions. Table 19: Projected changes in North and East Scotland in the 2050s (under medium emissions scenario) (UKCP09)
(Note: The projections are probabilistic and the main numbers are the central estimate so e.g. there is a 50% chance that precipitation in winter in east Scotland will increase by more than 10% and a 50% chance that it will increase by less than 10%. The figures in brackets show the range within which the actual change is likely to be. So winter precipitation in east Scotland is very unlikely to increase by less than 1% or more than 20%). All the legislation, strategies, action plans etc discussed in the previous section provide the foundation and guidance for Community Planning Partners and other organisations to fulfil their duties under the Climate Change (Scotland) Act 2009.
9.3.1 Moray Climate Change Action Plan
The Moray Council signed the Scottish Climate Change Declaration45 in 2007, which included a commitment to produce and publicly declare a Climate Change Action Plan. Moray‘s plan is currently in draft form46 and will undergo a consultation period of at least six weeks. The plan has three aims:
1. To contribute towards national targets to reduce CO2 emissions by 80% by 2050 and interim target of 42% by 2020.
2. To contribute towards the achievement of the Scottish Government‘s National outcomes 12 and 14.
3. To ensure climate change risks to Moray are appropriately identified, assessed, communicated and managed.
Although reducing emissions, thus mitigating the effects of global warming, is a key aspect to tackling climate change, it is also essential that the Council instigates measures that facilitate adaptation to the changes that will be required and also that enable full advantage to be taken of the opportunities climate change offers, such as the expansion of the renewable energy industry. The Moray Climate Change Action Plan covers ten areas each with key objectives:
45
Scotland‘s Climate Change Declaration. http://climatechange.sustainable-scotland.net/documents/declaration08.pdf 46
Draft Moray Climate Change Action Plan http://www.moray.gov.uk/minutes/data/PR20101123/Item%208%20Appendix%20B.pdf
North Scotland East Scotland
Winter Mean Temp Increase 1.6°C (0.6°C – 2.8°C) 1.7°C (0.7°C – 2.9°C) Mean Precipitation Increase 13% (3% - 24%) 10% (1% - 20%)
Summer Mean Temp Increase 2.0°C (0.9°C – 3.4°C) 2.3°C (1.1°C – 3.9°C) Mean Precipitation Increase -11% (-24% - 2%) -13% (-27% - 1%)
110
Carbon Management / Energy Efficiency and the Promotion of Renewable Energy o To reduce CO2 emissions across Council operations by 30% by 2013 o Prepare a Renewable Action Plan for Moray
Active Travel / Sustainable Transport o Widening travel choice
Waste Minimisation o Development of Waste Recycling and Diversion to reach Scottish
Government targets
Alternative Fuels and Vehicle Utilisation o Promote Low Carbon vehicles and reduce emissions associated with staff
travel and fleet journeys
Sustainable Procurement o Produce a Green Procurement Strategy by 2011
Sustainable Construction Techniques and Low Carbon Buildings o The development of a Sustainable Design Guidance o Adoption of BREEAM standards for all Council new builds and refurbishment
projects
Natural Environment o Improvement, Promotion and Management of Moray‘s Core Path Network
and Development of an Open Space Strategy
Awareness Raising and Environmental Education o Provide simple, constructive and practical advice as to what individuals can
do to reduce emissions and manage the changes as a result of climate change
Local Development Plan o Production of a Moray Local Development Plan in 2013
Climate Change Adaptation o Ensure climate change risks to Moray are appropriately identified, assessed,
communicated and managed The achievement of the aims and objectives outlined in the plan to effectively tackle climate change in Moray will require a high level of partnership working – with Community Planning partners, the wider community and the business and voluntary sectors. The plan includes an overview of Community Planning partners‘ actions on climate change, summarised here to show which partners are taking action in each of eight areas. For more detail please follow the link to the draft Action Plan on the previous page. The table illustrates, that those partners included are taking some form of action in relation to virtually all areas. This may comprise the development of systems or policies, or be more established activity. Table 20: Community Planning Partners Climate Change Actions
Moray Council
SNH GFRS FCS NHS HIE
Moray SEPA
Carbon Management Programme
Climate Change Action Plan
Waste Minimisation / Recycling
Environmental Awareness
Energy Efficiency Measures
Sustainable Construction Techniques
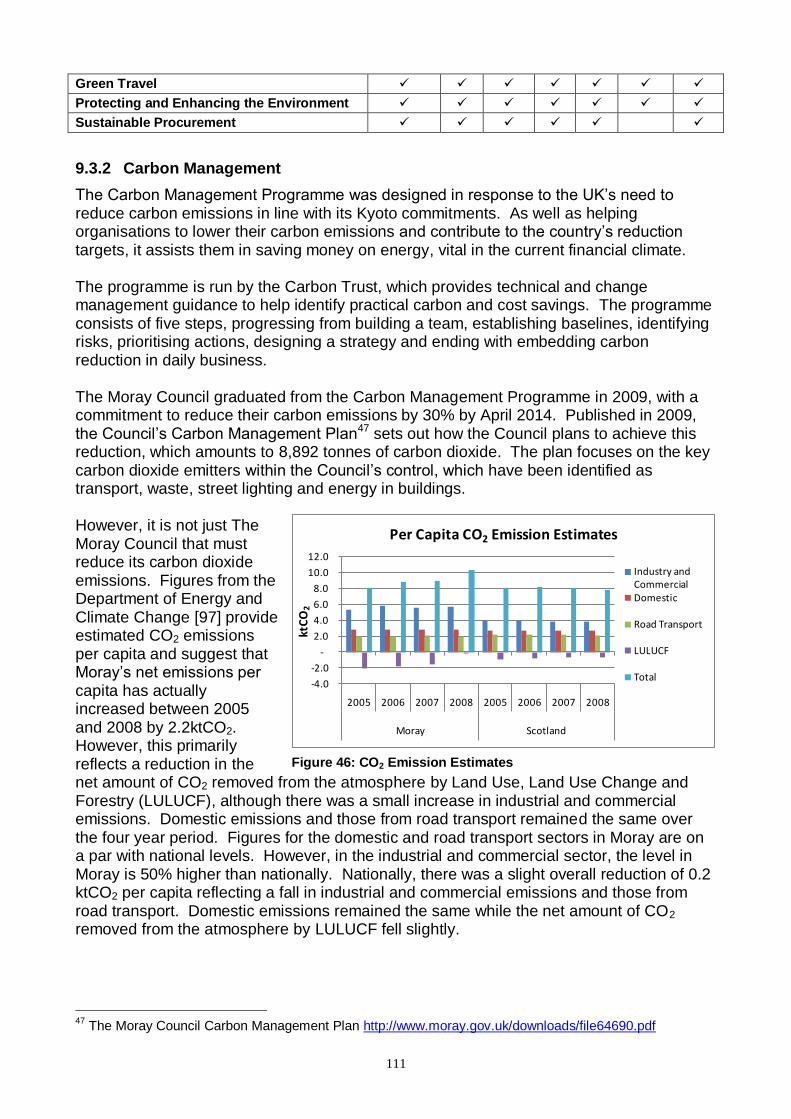
111
Green Travel
Protecting and Enhancing the Environment
Sustainable Procurement
9.3.2 Carbon Management
The Carbon Management Programme was designed in response to the UK‘s need to reduce carbon emissions in line with its Kyoto commitments. As well as helping organisations to lower their carbon emissions and contribute to the country‘s reduction targets, it assists them in saving money on energy, vital in the current financial climate. The programme is run by the Carbon Trust, which provides technical and change management guidance to help identify practical carbon and cost savings. The programme consists of five steps, progressing from building a team, establishing baselines, identifying risks, prioritising actions, designing a strategy and ending with embedding carbon reduction in daily business. The Moray Council graduated from the Carbon Management Programme in 2009, with a commitment to reduce their carbon emissions by 30% by April 2014. Published in 2009, the Council‘s Carbon Management Plan47 sets out how the Council plans to achieve this reduction, which amounts to 8,892 tonnes of carbon dioxide. The plan focuses on the key carbon dioxide emitters within the Council‘s control, which have been identified as transport, waste, street lighting and energy in buildings. However, it is not just The Moray Council that must reduce its carbon dioxide emissions. Figures from the Department of Energy and Climate Change [97] provide estimated CO2 emissions per capita and suggest that Moray‘s net emissions per capita has actually increased between 2005 and 2008 by 2.2ktCO2. However, this primarily reflects a reduction in the net amount of CO2 removed from the atmosphere by Land Use, Land Use Change and Forestry (LULUCF), although there was a small increase in industrial and commercial emissions. Domestic emissions and those from road transport remained the same over the four year period. Figures for the domestic and road transport sectors in Moray are on a par with national levels. However, in the industrial and commercial sector, the level in Moray is 50% higher than nationally. Nationally, there was a slight overall reduction of 0.2 ktCO2 per capita reflecting a fall in industrial and commercial emissions and those from road transport. Domestic emissions remained the same while the net amount of CO2 removed from the atmosphere by LULUCF fell slightly.
47
The Moray Council Carbon Management Plan http://www.moray.gov.uk/downloads/file64690.pdf
-4.0
-2.0
-
2.0
4.0
6.0
8.0
10.0
12.0
2005 2006 2007 2008 2005 2006 2007 2008
Moray Scotland
ktC
O2
Per Capita CO2 Emission Estimates
Industry and CommercialDomestic
Road Transport
LULUCF
Total
Figure 46: CO2 Emission Estimates
112
There is a lot of information and support available for individuals/families, communities and businesses on how they can reduce their carbon emissions, save money and contribute to the achievement of the Scottish Government‘s target of 80% reduction by 2050.
Individuals and Families o Saving energy – turning lights of, turning the heating down, boiling only the
amount of water required, powering down (not leaving equipment on standby).
o Tackling Waste/Recycling – recycling as much waste as possible, reducing what goes to landfill, composting.
o Transport/Travel – avoiding unnecessary travel, using sustainable/active travel options where possible, eco-driving, lift-sharing, carbon-offsetting for air travel.
o Greener shopping – buying local produce or at least British, minimising packaging if possible (leaving the shoe box in the shop), reusing bags.
Communities o Climate Challenge Fund48 supports communities to tackle climate change.
To date £22 million has been provided for 284 projects across Scotland. So far 6 Moray projects have received a total of £713,000: REAP (Rural
Environmental Action Project); Transition Town Forres Ltd; Knockando Woolmill Trust; Margach Hall Management Committee; Park Ecovillage Trust; Moray Art Centre.
o There are a number of other funding streams and organisations that provide support to communities for environmental projects, including:
Community and Renewable Energy Scheme (CARES) Scotland Rural Development Programme (SRDP) INCREASE Forestry Commission Scotland – Forestry Challenge Funds Historic Scotland Scottish Natural Heritage Cycling Scotland – Community Cycling Innovation Fund Scottish Environmental Protection Agency Landfill Communities Fund
Details of these funds can be found at the following links: http://www.scotland.gov.uk/Topics/Environment/funding-and-grants http://www.scotland.gov.uk/Topics/Environment/SustainableDevelopment/funding/7410
Business o Climate Change Business Delivery Group49 – encouraging business to share
best practice, identify opportunities and challenge each other to do more. o Prince of Wales‘ Mayday Network50 – the UK's largest group of businesses
and organisations dedicated to reducing their carbon emissions. Free to join and offering free, continuous support the Mayday Network helps businesses to lower their carbon footprint while maintaining, and more often than not, maximising their profits.
o 2020 Group51 – remit is: To build on the work of the Climate Change Business Delivery Group and
other climate change alliances to provide strong, visible leadership to
48
£27.4 million for 2008-11, £10.3 million for 2011-12 49
http://www.sbcscot.com/programmes/climate-change/climage-change-business-delivery-group 50
http://www.sbcscot.com/programmes/climate-change 51
http://www.scotland.gov.uk/Topics/Environment/climatechange/howyoucanhelp/Business/2020group
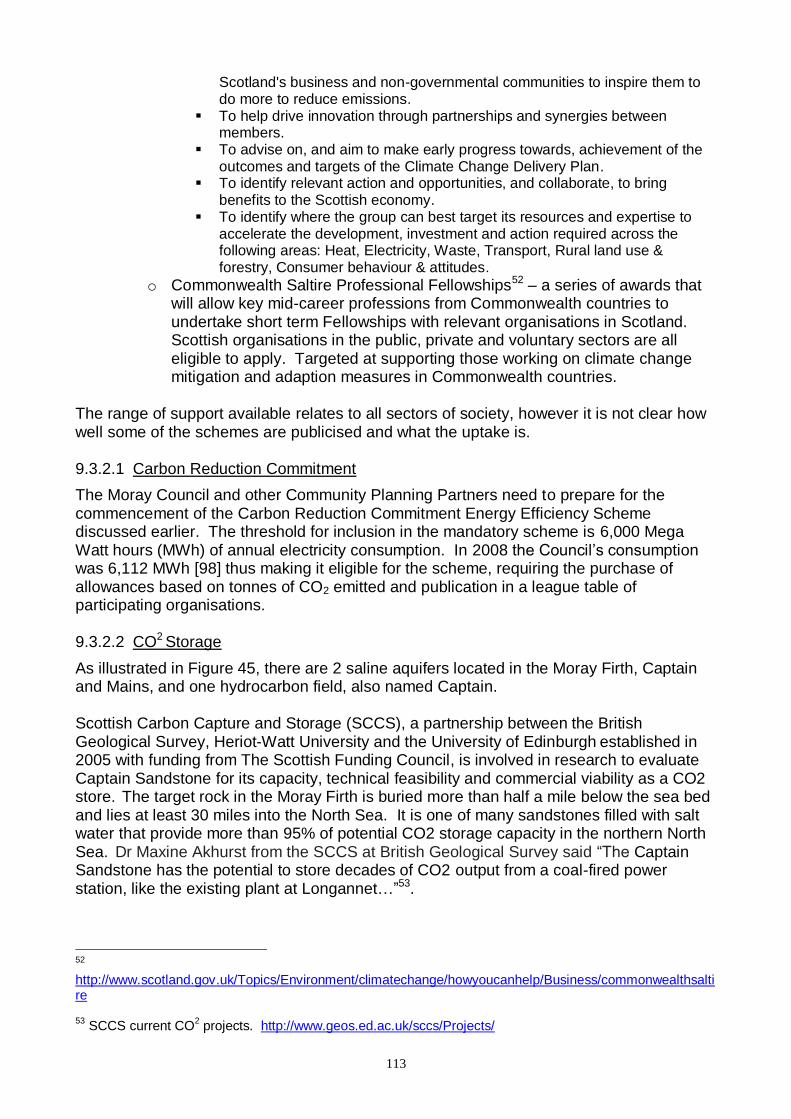
113
Scotland's business and non-governmental communities to inspire them to do more to reduce emissions.
To help drive innovation through partnerships and synergies between members.
To advise on, and aim to make early progress towards, achievement of the outcomes and targets of the Climate Change Delivery Plan.
To identify relevant action and opportunities, and collaborate, to bring benefits to the Scottish economy.
To identify where the group can best target its resources and expertise to accelerate the development, investment and action required across the following areas: Heat, Electricity, Waste, Transport, Rural land use & forestry, Consumer behaviour & attitudes.
o Commonwealth Saltire Professional Fellowships52 – a series of awards that will allow key mid-career professions from Commonwealth countries to undertake short term Fellowships with relevant organisations in Scotland. Scottish organisations in the public, private and voluntary sectors are all eligible to apply. Targeted at supporting those working on climate change mitigation and adaption measures in Commonwealth countries.
The range of support available relates to all sectors of society, however it is not clear how well some of the schemes are publicised and what the uptake is. 9.3.2.1 Carbon Reduction Commitment
The Moray Council and other Community Planning Partners need to prepare for the commencement of the Carbon Reduction Commitment Energy Efficiency Scheme discussed earlier. The threshold for inclusion in the mandatory scheme is 6,000 Mega Watt hours (MWh) of annual electricity consumption. In 2008 the Council‘s consumption was 6,112 MWh [98] thus making it eligible for the scheme, requiring the purchase of allowances based on tonnes of CO2 emitted and publication in a league table of participating organisations. 9.3.2.2 CO2 Storage
As illustrated in Figure 45, there are 2 saline aquifers located in the Moray Firth, Captain and Mains, and one hydrocarbon field, also named Captain. Scottish Carbon Capture and Storage (SCCS), a partnership between the British Geological Survey, Heriot-Watt University and the University of Edinburgh established in 2005 with funding from The Scottish Funding Council, is involved in research to evaluate Captain Sandstone for its capacity, technical feasibility and commercial viability as a CO2 store. The target rock in the Moray Firth is buried more than half a mile below the sea bed and lies at least 30 miles into the North Sea. It is one of many sandstones filled with salt water that provide more than 95% of potential CO2 storage capacity in the northern North Sea. Dr Maxine Akhurst from the SCCS at British Geological Survey said ―The Captain Sandstone has the potential to store decades of CO2 output from a coal-fired power station, like the existing plant at Longannet…‖53.
52
http://www.scotland.gov.uk/Topics/Environment/climatechange/howyoucanhelp/Business/commonwealthsaltire 53
SCCS current CO2 projects. http://www.geos.ed.ac.uk/sccs/Projects/
114
9.3.3 Energy Efficiency
Energy is needed to keep businesses, hospitals and schools running, to heat our homes and to transport goods and people. But the way that we use energy is an important aspect of tackling climate change. Improving energy efficiency is widely recognised as the easiest and most cost-effective means of reducing carbon emissions. By providing advice and financial incentives to improve energy efficiency, the Scottish Government is striving to change behaviour and fulfil its own responsibilities to promote a more energy efficient way of life to the people of Scotland. In February 2009, the Scottish Government announced 10 Energy Pledges (see Appendix 5) that are focused on addressing both short and longer term opportunities for Scotland to benefit from competitive advantage. They are aimed at creating new jobs, reducing emissions and saving households and businesses money, thereby contributing to economic recovery and growth and to addressing climate change. Conserve and Save: Energy Efficiency Action Plan, published in October 2010, sets out a wide-ranging programme of activity on ten priority areas:
1. Encouraging Behaviour Change 2. Domestic Energy Efficiency 3. Energy Efficiency for Business 4. Energy Efficiency across the Public Sector 5. Achieving energy efficiency through Building Standards 6. Infrastructure for the Built Environment 7. Changing how we use our Transport Systems 8. Developing the Skills for Energy Efficiency 9. Financing Energy Efficiency 10. Taking Energy Efficiency Forward
The Moray Council‘s policy on energy includes the objectives:
To reduce the Council‘s energy consumption by 2% per annum on a year to year basis.
Ensure that the Council‘s position in respect of the Carbon Reduction Commitment Energy Efficiency Scheme and the Carbon Management Programme are optimised.
In order to achieve this, the Council will ensure that:
Energy management is fully integrated across all relevant decision making to reduce energy consumption, costs and carbon emissions in all buildings it occupies or operates.
Sufficient resources are in place to meet the objectives of the policy.
Energy awareness of all staff is raised and maintained within the Council. The Council‘s strategy has four specific objectives:
1. To record energy and carbon consumption by using monitoring and targeting processes
2. To increase awareness of energy efficiency measures 3. Promote and develop new and innovative ways of saving energy/water 4. To reduce water consumption and costs and use water efficiently
In addition to the measures taken by the Council, other Community Planning partners have also taken measures to improve energy efficiency.
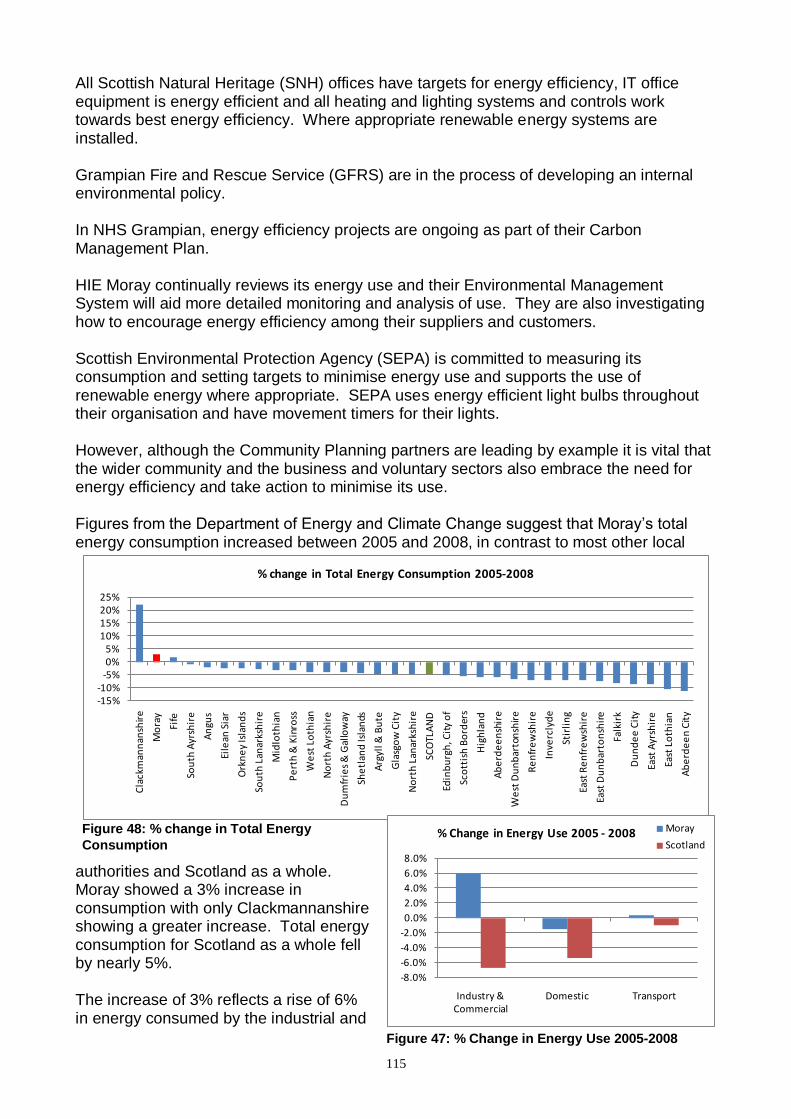
115
All Scottish Natural Heritage (SNH) offices have targets for energy efficiency, IT office equipment is energy efficient and all heating and lighting systems and controls work towards best energy efficiency. Where appropriate renewable energy systems are installed. Grampian Fire and Rescue Service (GFRS) are in the process of developing an internal environmental policy. In NHS Grampian, energy efficiency projects are ongoing as part of their Carbon Management Plan. HIE Moray continually reviews its energy use and their Environmental Management System will aid more detailed monitoring and analysis of use. They are also investigating how to encourage energy efficiency among their suppliers and customers. Scottish Environmental Protection Agency (SEPA) is committed to measuring its consumption and setting targets to minimise energy use and supports the use of renewable energy where appropriate. SEPA uses energy efficient light bulbs throughout their organisation and have movement timers for their lights. However, although the Community Planning partners are leading by example it is vital that the wider community and the business and voluntary sectors also embrace the need for energy efficiency and take action to minimise its use. Figures from the Department of Energy and Climate Change suggest that Moray‘s total energy consumption increased between 2005 and 2008, in contrast to most other local
authorities and Scotland as a whole. Moray showed a 3% increase in consumption with only Clackmannanshire showing a greater increase. Total energy consumption for Scotland as a whole fell by nearly 5%. The increase of 3% reflects a rise of 6% in energy consumed by the industrial and
-15%-10%
-5%0%5%
10%15%20%25%
Cla
ckm
ann
ansh
ire
Mo
ray
Fife
Sou
th A
yrsh
ire
An
gus
Eile
an S
iar
Ork
ne
y Is
lan
ds
Sou
th L
anar
ksh
ire
Mid
loth
ian
Pe
rth
& K
inro
ss
We
st L
oth
ian
No
rth
Ayr
shir
e
Du
mfr
ies
& G
allo
way
She
tlan
d Is
lan
ds
Arg
yll &
Bu
te
Gla
sgo
w C
ity
No
rth
Lan
arks
hir
e
SCO
TLA
ND
Edin
bu
rgh
, Cit
y o
f
Sco
ttis
h B
ord
ers
Hig
hla
nd
Ab
erd
ee
nsh
ire
We
st D
un
bar
ton
shir
e
Re
nfr
ew
shir
e
Inve
rcly
de
Stir
lin
g
East
Re
nfr
ew
shir
e
East
Du
nb
arto
nsh
ire
Falk
irk
Du
nd
ee
Cit
y
East
Ayr
shir
e
East
Lo
thia
n
Ab
erd
ee
n C
ity
% change in Total Energy Consumption 2005-2008
Figure 48: % change in Total Energy
Consumption
-8.0%
-6.0%
-4.0%
-2.0%
0.0%
2.0%
4.0%
6.0%
8.0%
Industry & Commercial
Domestic Transport
% Change in Energy Use 2005 - 2008 Moray
Scotland
Figure 47: % Change in Energy Use 2005-2008
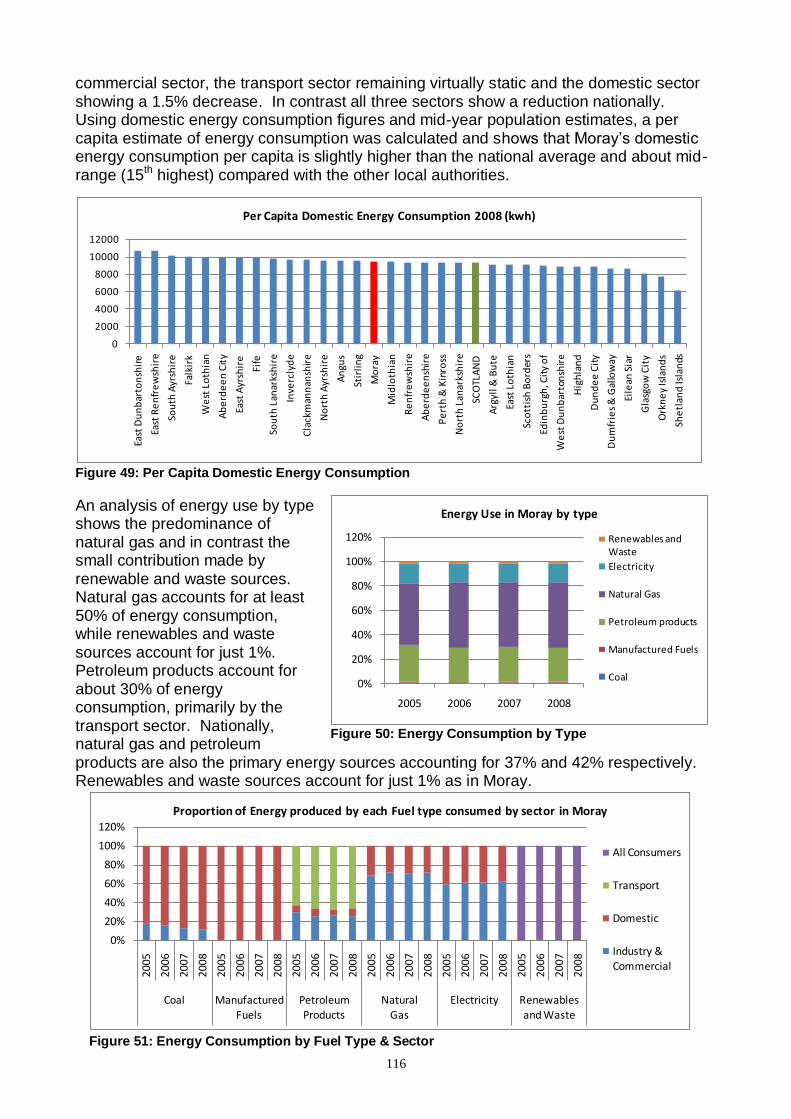
116
commercial sector, the transport sector remaining virtually static and the domestic sector showing a 1.5% decrease. In contrast all three sectors show a reduction nationally. Using domestic energy consumption figures and mid-year population estimates, a per capita estimate of energy consumption was calculated and shows that Moray‘s domestic energy consumption per capita is slightly higher than the national average and about mid-range (15th highest) compared with the other local authorities. An analysis of energy use by type shows the predominance of natural gas and in contrast the small contribution made by renewable and waste sources. Natural gas accounts for at least 50% of energy consumption, while renewables and waste sources account for just 1%. Petroleum products account for about 30% of energy consumption, primarily by the transport sector. Nationally, natural gas and petroleum products are also the primary energy sources accounting for 37% and 42% respectively. Renewables and waste sources account for just 1% as in Moray.
0%
20%
40%
60%
80%
100%
120%
2005 2006 2007 2008
Energy Use in Moray by type
Renewables and Waste
Electricity
Natural Gas
Petroleum products
Manufactured Fuels
Coal
Figure 50: Energy Consumption by Type
0%
20%
40%
60%
80%
100%
120%
2005
2006
2007
2008
2005
2006
2007
2008
2005
2006
2007
2008
2005
2006
2007
2008
2005
2006
2007
2008
2005
2006
2007
2008
Coal Manufactured
Fuels
Petroleum
Products
Natural
Gas
Electricity Renewables
and Waste
Proportion of Energy produced by each Fuel type consumed by sector in Moray
All Consumers
Transport
Domestic
Industry &
Commercial
Figure 51: Energy Consumption by Fuel Type & Sector
Figure 49: Per Capita Domestic Energy Consumption
0
2000
4000
6000
8000
10000
12000
East
Du
nb
arto
nsh
ire
East
Re
nfr
ew
shir
e
Sou
th A
yrsh
ire
Falk
irk
We
st L
oth
ian
Ab
erd
ee
n C
ity
East
Ayr
shir
e
Fife
Sou
th L
anar
ksh
ire
Inve
rcly
de
Cla
ckm
ann
ansh
ire
No
rth
Ayr
shir
e
An
gus
Stir
lin
g
Mo
ray
Mid
loth
ian
Re
nfr
ew
shir
e
Ab
erd
ee
nsh
ire
Pe
rth
& K
inro
ss
No
rth
Lan
arks
hir
e
SCO
TLA
ND
Arg
yll &
Bu
te
East
Lo
thia
n
Sco
ttis
h B
ord
ers
Edin
bu
rgh
, Cit
y o
f
We
st D
un
bar
ton
shir
e
Hig
hla
nd
Du
nd
ee
Cit
y
Du
mfr
ies
& G
allo
way
Eile
an S
iar
Gla
sgo
w C
ity
Ork
ne
y Is
lan
ds
She
tlan
d Is
lan
ds
Per Capita Domestic Energy Consumption 2008 (kwh)
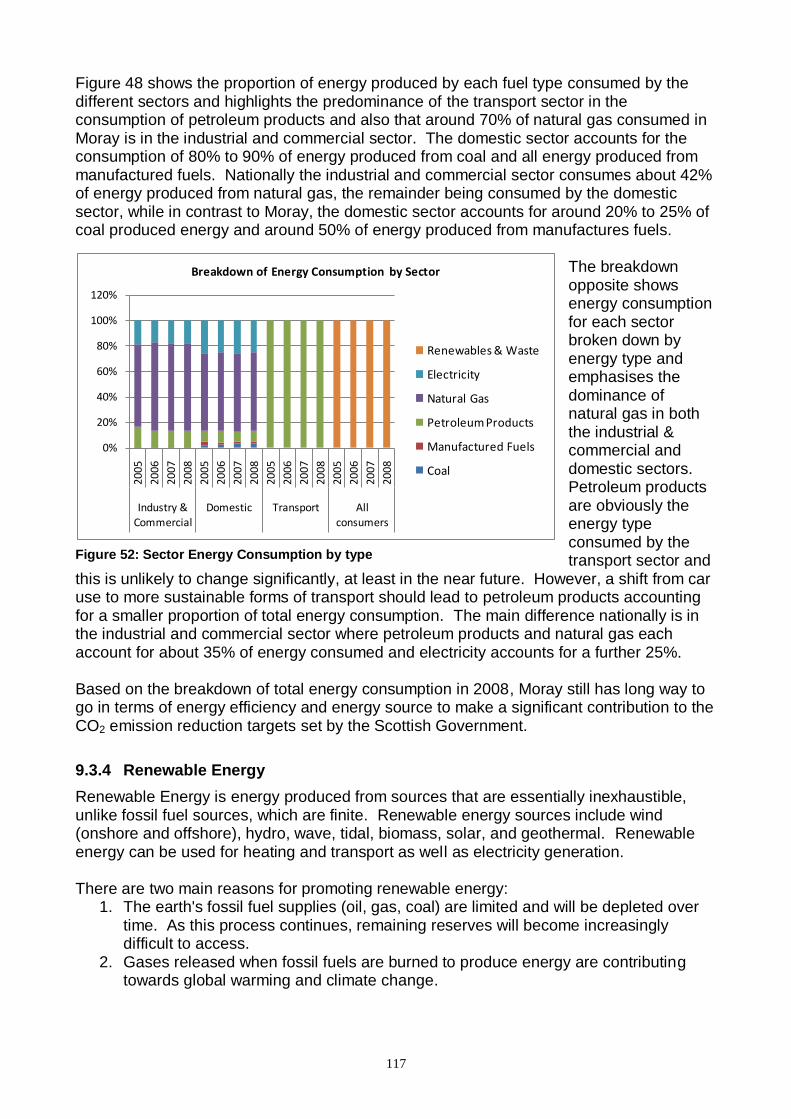
117
Figure 48 shows the proportion of energy produced by each fuel type consumed by the different sectors and highlights the predominance of the transport sector in the consumption of petroleum products and also that around 70% of natural gas consumed in Moray is in the industrial and commercial sector. The domestic sector accounts for the consumption of 80% to 90% of energy produced from coal and all energy produced from manufactured fuels. Nationally the industrial and commercial sector consumes about 42% of energy produced from natural gas, the remainder being consumed by the domestic sector, while in contrast to Moray, the domestic sector accounts for around 20% to 25% of coal produced energy and around 50% of energy produced from manufactures fuels.
The breakdown opposite shows energy consumption for each sector broken down by energy type and emphasises the dominance of natural gas in both the industrial & commercial and domestic sectors. Petroleum products are obviously the energy type consumed by the transport sector and
this is unlikely to change significantly, at least in the near future. However, a shift from car use to more sustainable forms of transport should lead to petroleum products accounting for a smaller proportion of total energy consumption. The main difference nationally is in the industrial and commercial sector where petroleum products and natural gas each account for about 35% of energy consumed and electricity accounts for a further 25%. Based on the breakdown of total energy consumption in 2008, Moray still has long way to go in terms of energy efficiency and energy source to make a significant contribution to the CO2 emission reduction targets set by the Scottish Government.
9.3.4 Renewable Energy
Renewable Energy is energy produced from sources that are essentially inexhaustible, unlike fossil fuel sources, which are finite. Renewable energy sources include wind (onshore and offshore), hydro, wave, tidal, biomass, solar, and geothermal. Renewable energy can be used for heating and transport as well as electricity generation. There are two main reasons for promoting renewable energy:
1. The earth's fossil fuel supplies (oil, gas, coal) are limited and will be depleted over time. As this process continues, remaining reserves will become increasingly difficult to access.
2. Gases released when fossil fuels are burned to produce energy are contributing towards global warming and climate change.
0%
20%
40%
60%
80%
100%
120%
20
05
20
06
20
07
20
08
20
05
20
06
20
07
20
08
20
05
20
06
20
07
20
08
20
05
20
06
20
07
20
08
Industry & Commercial
Domestic Transport All consumers
Breakdown of Energy Consumption by Sector
Renewables & Waste
Electricity
Natural Gas
Petroleum Products
Manufactured Fuels
Coal
Figure 52: Sector Energy Consumption by type
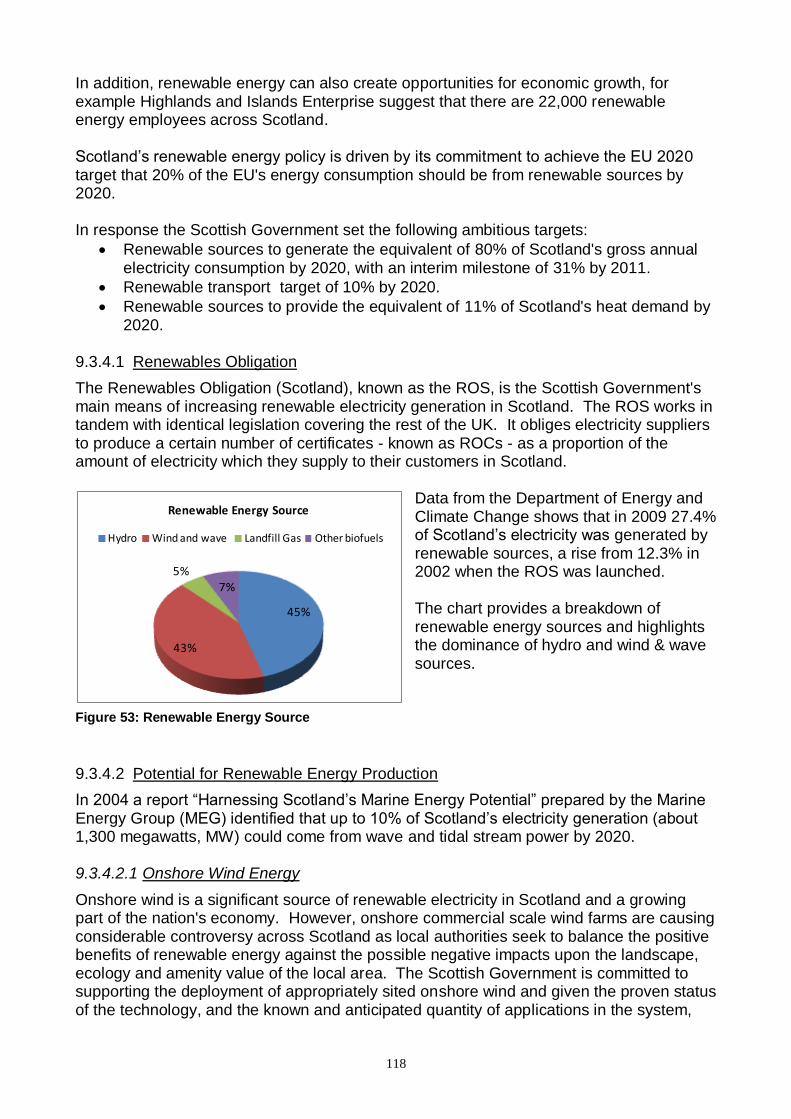
118
In addition, renewable energy can also create opportunities for economic growth, for example Highlands and Islands Enterprise suggest that there are 22,000 renewable energy employees across Scotland. Scotland‘s renewable energy policy is driven by its commitment to achieve the EU 2020 target that 20% of the EU's energy consumption should be from renewable sources by 2020. In response the Scottish Government set the following ambitious targets:
Renewable sources to generate the equivalent of 80% of Scotland's gross annual electricity consumption by 2020, with an interim milestone of 31% by 2011.
Renewable transport target of 10% by 2020.
Renewable sources to provide the equivalent of 11% of Scotland's heat demand by 2020.
9.3.4.1 Renewables Obligation
The Renewables Obligation (Scotland), known as the ROS, is the Scottish Government's main means of increasing renewable electricity generation in Scotland. The ROS works in tandem with identical legislation covering the rest of the UK. It obliges electricity suppliers to produce a certain number of certificates - known as ROCs - as a proportion of the amount of electricity which they supply to their customers in Scotland.
Data from the Department of Energy and Climate Change shows that in 2009 27.4% of Scotland‘s electricity was generated by renewable sources, a rise from 12.3% in 2002 when the ROS was launched. The chart provides a breakdown of renewable energy sources and highlights the dominance of hydro and wind & wave sources.
9.3.4.2 Potential for Renewable Energy Production
In 2004 a report ―Harnessing Scotland‘s Marine Energy Potential‖ prepared by the Marine Energy Group (MEG) identified that up to 10% of Scotland‘s electricity generation (about 1,300 megawatts, MW) could come from wave and tidal stream power by 2020. 9.3.4.2.1 Onshore Wind Energy
Onshore wind is a significant source of renewable electricity in Scotland and a growing part of the nation's economy. However, onshore commercial scale wind farms are causing considerable controversy across Scotland as local authorities seek to balance the positive benefits of renewable energy against the possible negative impacts upon the landscape, ecology and amenity value of the local area. The Scottish Government is committed to supporting the deployment of appropriately sited onshore wind and given the proven status of the technology, and the known and anticipated quantity of applications in the system,
45%
43%
5%7%
Renewable Energy Source
Hydro Wind and wave Landfill Gas Other biofuels
Figure 53: Renewable Energy Source
119
onshore wind is expected to provide the majority of capacity in the timeframe of our interim and 2020 renewable electricity targets. The Renewables Planning policy looks for each local authority to adopt a spatial planning approach to renewable development, identifying key search areas suitable for development while still offering protection to more sensitive areas not best suited for a renewable project. 9.3.4.2.2 Offshore Wind Energy
It has been estimated that Scotland has 25% of Europe's offshore wind resource. The Draft Plan for Offshore Wind Energy in Scottish Territorial Waters makes proposals for offshore wind energy developments in the short (2010 to 2020), medium (2020 to 2030) and long term (beyond 2030). Ten areas are proposed for development in the short term, one in the northern Moray Firth (Beatrice) and progression of all ten is proposed. A further 30 areas are proposed for development in the medium term, 2 in the Moray Firth and it is proposed that 25 are given further consideration. In addition to maximising the harnessing of offshore wind energy – more than 7,000 offshore wind turbines are expected to be constructed off the UK‘s coast over the next decade – it is essential that facilities are able to provide the support required by developers. As such, the Scottish Government has created the National Renewables Infrastructure Fund to support the strengthening of port and manufacturing facilities and supply chain provision for manufacturing offshore wind turbines. The fund is being delivered through a partnership of Scottish Enterprise and Highlands and Islands Enterprise. 9.3.4.2.3 Wood Energy
It is estimated that schools account for 70%-75% of a council‘s energy consumption. A study commissioned by Scottish enterprise, the Scottish Government and Forestry Commission Scotland investigated how wood energy investment in Scottish Council building stock could help meet carbon reduction and renewable energy commitments. The study assumed that parts of the Council building stocks are well-suited to retro-fit of wood fuelled boilers, estimating that there are about 128 suitable existing buildings comprising a mix of large older buildings such as leisure centres, office headquarters and secondary schools. Although this group of buildings represents only about 2.5% of the total Council owned building stock, it accounts for around 14% of total spend on gas heating. The study found that, ―with the advent of the Renewable Heat Incentive, a small but strategically significant number of very large council buildings could form a planned programme of wood energy investment for heating, delivered through prudential borrowing powers‖ [99]. 9.3.4.2.4 Other National Developments
Offshore Grid The creation of an offshore grid is a European priority project and Scotland is working with the UK and nine other countries to create a North Sea grid to interconnect European electricity networks. The University of Aberdeen is involved in investigating new technology to support the development of the North Sea grid and has been awarded European Research Council funding of more than £600,000 for the work.
120
At the beginning of February 2011 SSE Interconnector, a subsidiary of Scottish and Southern Energy, signed an agreement with 4 leading Norwegian and Swedish energy companies to examine the feasibility of building an interconnector between the UK and Norway that will allow electricity to flow in both directions. Although a number of options are being considered, the shortest route is the preferred one, which would mean a landing point in North East Scotland. European Offshore Wind Deployment Centre The European Offshore Wind Deployment Centre to be developed off the coast of Aberdeen is a ground breaking new facility that will enable the accelerated development of offshore wind power in Scotland, the UK and Europe. The project has received significant support from the Scottish European Green Energy Centre and was awarded a grant by the European Commission of up to forty million Euros in December 2010. The project takes advantage of Aberdeen‘s significant depth of experience in the international offshore energy industry and its huge base of marine engineering expertise. The Deployment Centre will allow offshore wind farm developers and associated supply chain companies to test new designs, prove existing products and receive independent validation and accreditation before commercial deployment. This will reduce development risks and capital costs and provide an opportunity to test reliability and capacity in a real time, offshore environment, significantly improving the efficiency and profitability of future offshore wind developments. The Hydrogen Office Opened in Fife in January 2011, The Hydrogen Office is a state-of-the-art demonstration and research facility powered by hydrogen fuel cell technology. It is playing a leading role in the development of a range of carbon-cutting technologies – from the provision of clean energy for electricity, heat and transport to storing renewable power from other sources such as wind, as demonstrated at the site. Since commissioning in September 2010l the novel hydrogen production system at the facility has exported over 350,000 kWh to the National Grid and on an annual basis is expected to be able to produce enough electricity and heating to meet its own needs and also to export enough electricity to meet the needs of the Methil Docks Business Park where it is located. Scottish Energy Laboratory The Scottish Energy Laboratory (SEL) was launched in February 2011 strengthen collaboration across 50 energy research, test and demonstration facilities. The SEL will be a ‗virtual‘ hub for national and international companies to identify and access the most appropriate of Scotland‘s test and demonstration assets for their technologies. These assets include the European Offshore wind Deployment Centre in Aberdeen and The Hydrogen Office in Fife. The SEL will also work with individual centres to help co-ordinate activities, utilise assets more efficiently, help reduce risks in new product development and encourage future investment in energy technologies. Additionally, it will help firms seeking services, resources and partners for the subsequent development and commercialisation of their technology.
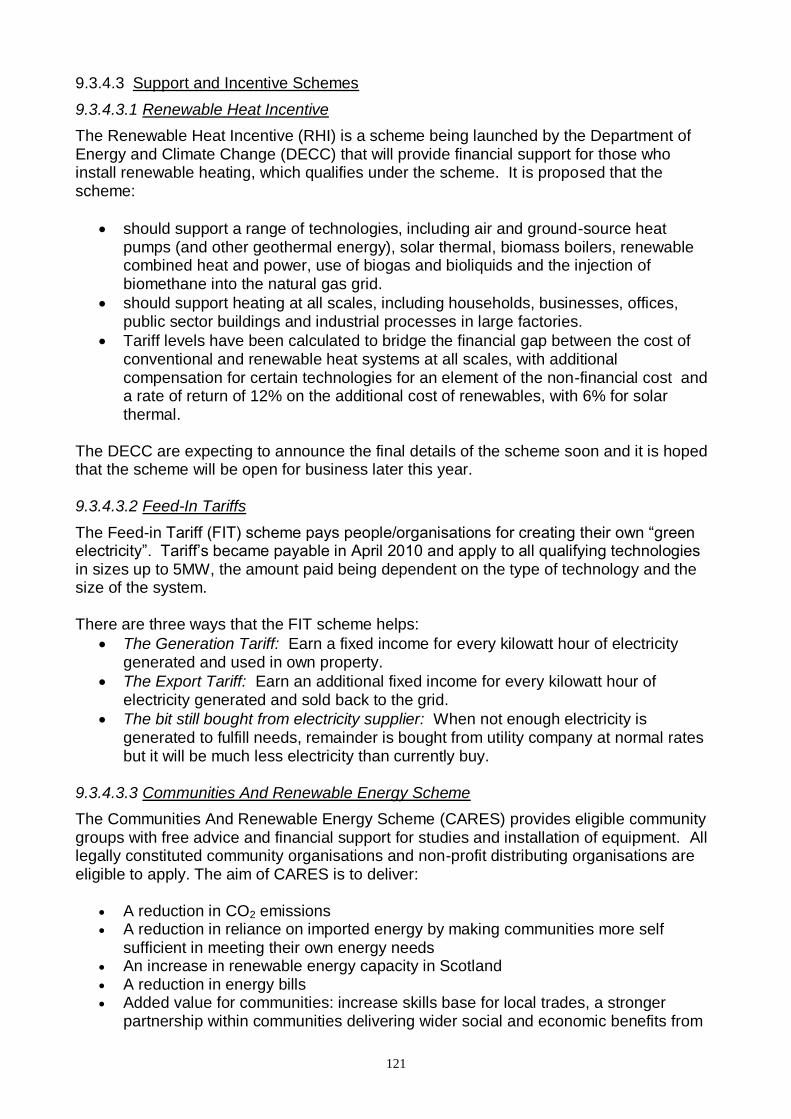
121
9.3.4.3 Support and Incentive Schemes
9.3.4.3.1 Renewable Heat Incentive
The Renewable Heat Incentive (RHI) is a scheme being launched by the Department of Energy and Climate Change (DECC) that will provide financial support for those who install renewable heating, which qualifies under the scheme. It is proposed that the scheme:
should support a range of technologies, including air and ground-source heat pumps (and other geothermal energy), solar thermal, biomass boilers, renewable combined heat and power, use of biogas and bioliquids and the injection of biomethane into the natural gas grid.
should support heating at all scales, including households, businesses, offices, public sector buildings and industrial processes in large factories.
Tariff levels have been calculated to bridge the financial gap between the cost of conventional and renewable heat systems at all scales, with additional compensation for certain technologies for an element of the non-financial cost and a rate of return of 12% on the additional cost of renewables, with 6% for solar thermal.
The DECC are expecting to announce the final details of the scheme soon and it is hoped that the scheme will be open for business later this year. 9.3.4.3.2 Feed-In Tariffs
The Feed-in Tariff (FIT) scheme pays people/organisations for creating their own ―green electricity‖. Tariff‘s became payable in April 2010 and apply to all qualifying technologies in sizes up to 5MW, the amount paid being dependent on the type of technology and the size of the system. There are three ways that the FIT scheme helps:
The Generation Tariff: Earn a fixed income for every kilowatt hour of electricity generated and used in own property.
The Export Tariff: Earn an additional fixed income for every kilowatt hour of electricity generated and sold back to the grid.
The bit still bought from electricity supplier: When not enough electricity is generated to fulfill needs, remainder is bought from utility company at normal rates but it will be much less electricity than currently buy.
9.3.4.3.3 Communities And Renewable Energy Scheme
The Communities And Renewable Energy Scheme (CARES) provides eligible community groups with free advice and financial support for studies and installation of equipment. All legally constituted community organisations and non-profit distributing organisations are eligible to apply. The aim of CARES is to deliver:
A reduction in CO2 emissions A reduction in reliance on imported energy by making communities more self
sufficient in meeting their own energy needs An increase in renewable energy capacity in Scotland A reduction in energy bills Added value for communities: increase skills base for local trades, a stronger
partnership within communities delivering wider social and economic benefits from
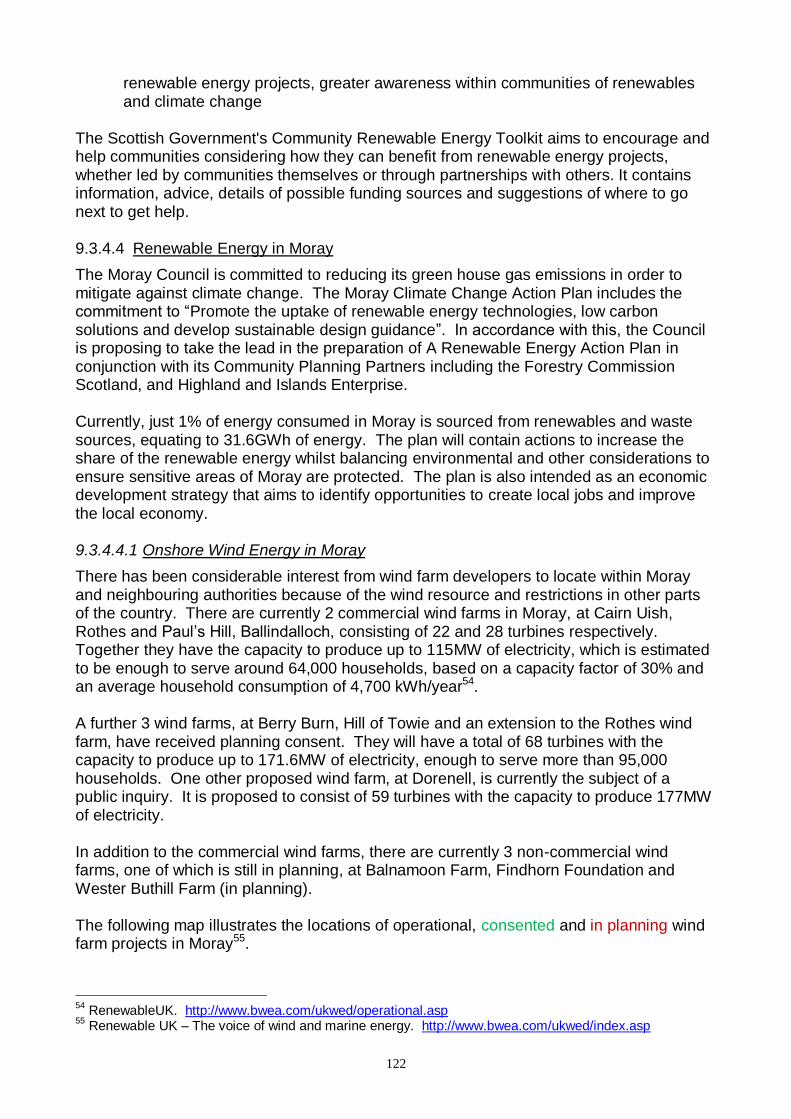
122
renewable energy projects, greater awareness within communities of renewables and climate change
The Scottish Government's Community Renewable Energy Toolkit aims to encourage and help communities considering how they can benefit from renewable energy projects, whether led by communities themselves or through partnerships with others. It contains information, advice, details of possible funding sources and suggestions of where to go next to get help. 9.3.4.4 Renewable Energy in Moray
The Moray Council is committed to reducing its green house gas emissions in order to mitigate against climate change. The Moray Climate Change Action Plan includes the commitment to ―Promote the uptake of renewable energy technologies, low carbon solutions and develop sustainable design guidance‖. In accordance with this, the Council is proposing to take the lead in the preparation of A Renewable Energy Action Plan in conjunction with its Community Planning Partners including the Forestry Commission Scotland, and Highland and Islands Enterprise. Currently, just 1% of energy consumed in Moray is sourced from renewables and waste sources, equating to 31.6GWh of energy. The plan will contain actions to increase the share of the renewable energy whilst balancing environmental and other considerations to ensure sensitive areas of Moray are protected. The plan is also intended as an economic development strategy that aims to identify opportunities to create local jobs and improve the local economy. 9.3.4.4.1 Onshore Wind Energy in Moray
There has been considerable interest from wind farm developers to locate within Moray and neighbouring authorities because of the wind resource and restrictions in other parts of the country. There are currently 2 commercial wind farms in Moray, at Cairn Uish, Rothes and Paul‘s Hill, Ballindalloch, consisting of 22 and 28 turbines respectively. Together they have the capacity to produce up to 115MW of electricity, which is estimated to be enough to serve around 64,000 households, based on a capacity factor of 30% and an average household consumption of 4,700 kWh/year54. A further 3 wind farms, at Berry Burn, Hill of Towie and an extension to the Rothes wind farm, have received planning consent. They will have a total of 68 turbines with the capacity to produce up to 171.6MW of electricity, enough to serve more than 95,000 households. One other proposed wind farm, at Dorenell, is currently the subject of a public inquiry. It is proposed to consist of 59 turbines with the capacity to produce 177MW of electricity. In addition to the commercial wind farms, there are currently 3 non-commercial wind farms, one of which is still in planning, at Balnamoon Farm, Findhorn Foundation and Wester Buthill Farm (in planning). The following map illustrates the locations of operational, consented and in planning wind farm projects in Moray55.
54
RenewableUK. http://www.bwea.com/ukwed/operational.asp 55
Renewable UK – The voice of wind and marine energy. http://www.bwea.com/ukwed/index.asp
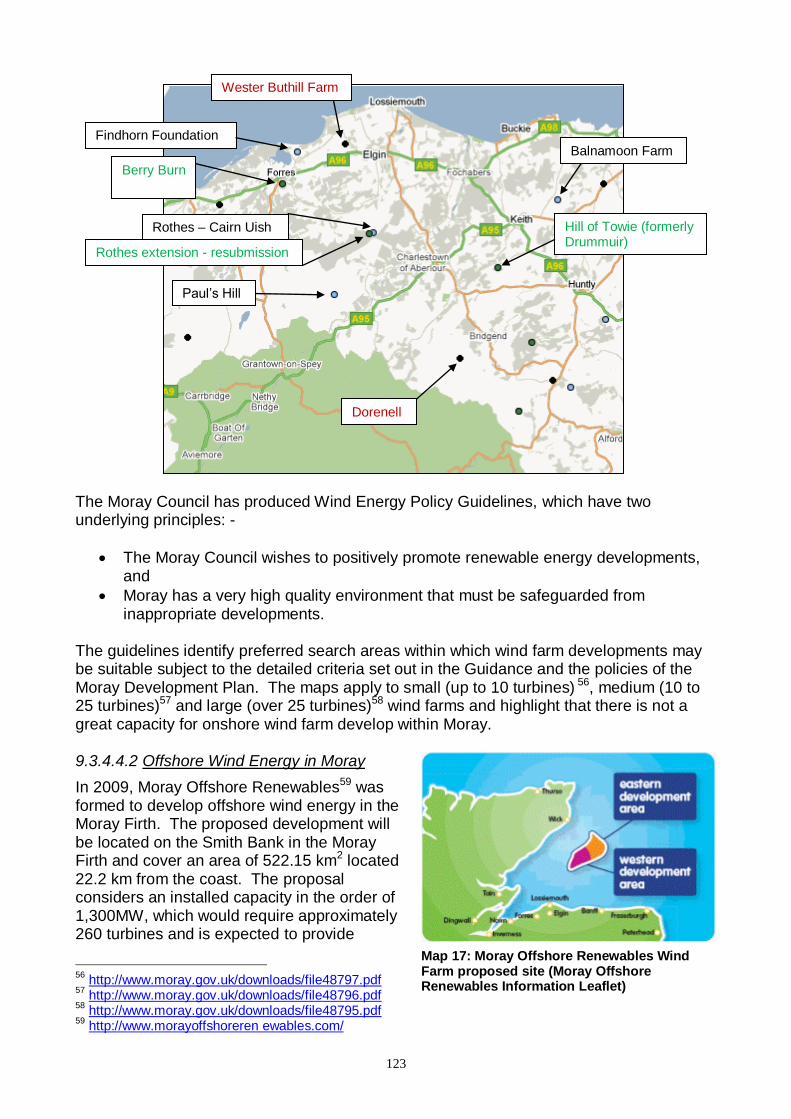
123
The Moray Council has produced Wind Energy Policy Guidelines, which have two underlying principles: -
The Moray Council wishes to positively promote renewable energy developments, and
Moray has a very high quality environment that must be safeguarded from inappropriate developments.
The guidelines identify preferred search areas within which wind farm developments may be suitable subject to the detailed criteria set out in the Guidance and the policies of the Moray Development Plan. The maps apply to small (up to 10 turbines) 56, medium (10 to 25 turbines)57 and large (over 25 turbines)58 wind farms and highlight that there is not a great capacity for onshore wind farm develop within Moray. 9.3.4.4.2 Offshore Wind Energy in Moray
In 2009, Moray Offshore Renewables59 was formed to develop offshore wind energy in the Moray Firth. The proposed development will be located on the Smith Bank in the Moray Firth and cover an area of 522.15 km2 located 22.2 km from the coast. The proposal considers an installed capacity in the order of 1,300MW, which would require approximately 260 turbines and is expected to provide
56
http://www.moray.gov.uk/downloads/file48797.pdf 57
http://www.moray.gov.uk/downloads/file48796.pdf 58
http://www.moray.gov.uk/downloads/file48795.pdf 59
http://www.morayoffshoreren ewables.com/
Wester Buthill Farm
Balnamoon Farm
Hill of Towie (formerly Drummuir)
Findhorn Foundation
Berry Burn
Rothes – Cairn Uish
Rothes extension - resubmission
Paul‘s Hill
Dorenell
Map 17: Moray Offshore Renewables Wind Farm proposed site (Moray Offshore Renewables Information Leaflet)
124
enough clean electricity to supply upwards of 1 million homes. It is anticipated that construction will commence in 2014 with first generation in 2016. Also in 2009 the partnership of SSE Renewables (75%) and SeaEnergy
Renewables (25%), was awarded exclusivity by The Crown Estate to develop the Beatrice offshore wind farm in Scottish Territorial waters. The development site will cover an approximate area of 131.5km2 and is located, at its closest point, approximately 13.5km off the Caithness coast, in the Outer Moray Firth, to the north of the two existing Beatrice demonstrator turbines. The proposed wind farm would have an anticipated capacity of approximately 920MW from power generated by around 184 turbines60. In relation to the provision of support for the offshore renewables industry, it was reported to
the Wealthier and Fairer Strategic Group on 14th October 201061 that HIE are engaged in an assessment of the construction/servicing and employment potential from the proposed Moray Firth offshore wind farms. There is an existing manufacturing and servicing industry at Buckie Harbour, which could be expanded to service offshore wind farms – the two existing Beatrice demonstration turbines are currently serviced by vessels using Buckie Harbour. Buckie Shipyard Ltd and South Boats Special Projects Ltd have been commissioned to build catamarans to service offshore wind farms and Buckie Shipyard Ltd has already launched two 50ft boats in 2010 for the offshore wind energy sector62. 9.3.4.4.3 Wood Energy in Moray
As mentioned earlier in this assessment, there are three buildings in Moray that are looking to install biomass heating systems: Speyside High School, Newmill Village Hall and Lossiemouth Town Hall. The Speyside High system would provide heat to the school and the Sports and Community Centre including the swimming pool. The Newmill Village Hall boiler would also provide heat to Newmill Primary School while the Lossiemouth Town Hall system would also heat the library. The report ―Wood energy deployment in Scottish Councils‖ [99] suggests that based on current market prices (at the time of the report) and taking into account the Renewable Heat Incentive from 2011 (likely implementation), wood heat would result in an effective income of £35MWh after taking into account fuel costs. They also provided a breakdown of the typical capital cost of a 500KW wood fuel boiler system that could be retrofitted in a large Council building like a secondary school or leisure centre, which totalled £256,000 ex VAT. Given the savings that would result from no longer paying for gas for heating, the wood fuel income after fuel costs and taking the RHI into account, inflation and servicing costs, the report estimated that the capital cost of installing the wood fuel boiler system would be repaid within 2yrs.
60
http://www.sse.com/SSEInternet/index.aspx?rightColHeader=30&id=17204 61
http://www.moray.gov.uk/minutes/data/WFS20101014/Item%2010-Offshore%20Wind%20Energy.pdf 62
http://www.pressandjournal.co.uk/Article.aspx/1857085?UserKey&UserKey&UserKey=#ixzz1CL8MeJev
Map 18: Beatrice Offshore Wind Farm (SSE information leaflet)
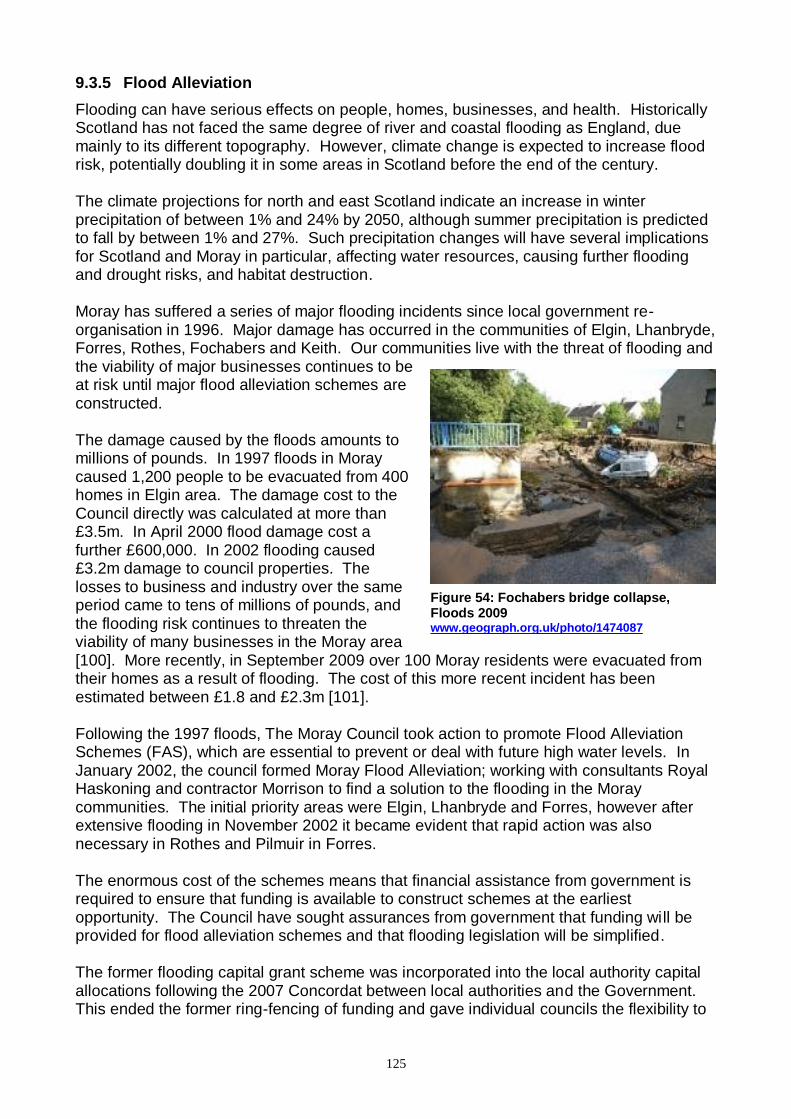
125
9.3.5 Flood Alleviation
Flooding can have serious effects on people, homes, businesses, and health. Historically Scotland has not faced the same degree of river and coastal flooding as England, due mainly to its different topography. However, climate change is expected to increase flood risk, potentially doubling it in some areas in Scotland before the end of the century. The climate projections for north and east Scotland indicate an increase in winter precipitation of between 1% and 24% by 2050, although summer precipitation is predicted to fall by between 1% and 27%. Such precipitation changes will have several implications for Scotland and Moray in particular, affecting water resources, causing further flooding and drought risks, and habitat destruction. Moray has suffered a series of major flooding incidents since local government re-organisation in 1996. Major damage has occurred in the communities of Elgin, Lhanbryde, Forres, Rothes, Fochabers and Keith. Our communities live with the threat of flooding and the viability of major businesses continues to be at risk until major flood alleviation schemes are constructed. The damage caused by the floods amounts to millions of pounds. In 1997 floods in Moray caused 1,200 people to be evacuated from 400 homes in Elgin area. The damage cost to the Council directly was calculated at more than £3.5m. In April 2000 flood damage cost a further £600,000. In 2002 flooding caused £3.2m damage to council properties. The losses to business and industry over the same period came to tens of millions of pounds, and the flooding risk continues to threaten the viability of many businesses in the Moray area [100]. More recently, in September 2009 over 100 Moray residents were evacuated from their homes as a result of flooding. The cost of this more recent incident has been estimated between £1.8 and £2.3m [101]. Following the 1997 floods, The Moray Council took action to promote Flood Alleviation Schemes (FAS), which are essential to prevent or deal with future high water levels. In January 2002, the council formed Moray Flood Alleviation; working with consultants Royal Haskoning and contractor Morrison to find a solution to the flooding in the Moray communities. The initial priority areas were Elgin, Lhanbryde and Forres, however after extensive flooding in November 2002 it became evident that rapid action was also necessary in Rothes and Pilmuir in Forres. The enormous cost of the schemes means that financial assistance from government is required to ensure that funding is available to construct schemes at the earliest opportunity. The Council have sought assurances from government that funding will be provided for flood alleviation schemes and that flooding legislation will be simplified. The former flooding capital grant scheme was incorporated into the local authority capital allocations following the 2007 Concordat between local authorities and the Government. This ended the former ring-fencing of funding and gave individual councils the flexibility to
Figure 54: Fochabers bridge collapse, Floods 2009 www.geograph.org.uk/photo/1474087
126
manage their budgets to meet local priorities. Funding for Moray‘s schemes was included in Moray's financial allocation. Much progress has been made in relation to the schemes in Moray.
Lhanbryde FAS – completed and operational.
Forres (Burn of Mosset) FAS – completed and operational.
Rothes FAS – due to be complete in March 2011.
Forres(Findhorn & Pilmuir) FAS – pre-construction work is ongoing, construction due to commence in September 2011 with an earliest completion date of December 2013.
Elgin FAS – pre-construction work is ongoing. The go-ahead for the Elgin FAS was given by the Scottish Government on 17th December 2010 and although there remain uncertainties regarding the level of Scottish Government Capital Grant support, it was agreed at a special meeting of Full Council on 10th February 2011 that construction work on the scheme could commence from 4th April 2011, with some activities being carried out in advance of this date. The estimated completion date for the scheme is Spring 2015. There is also uncertainty surrounding the funding for the Forres (Findhorn & Pilmuir) FAS, which may result in the scheme being scrapped. 9.3.5.1 The Flood Risk Management (Scotland) Act 2009
The Flood Risk Management (Scotland) Act 2009 introduced a more sustainable and modern approach to flood risk management, suited to the needs of the 21st century and to the impact of climate change. It also created a more joined up and coordinated process to manage flood risk at a national and local level. Guidance produced by the Scottish Government to assist in the implementation of the Act provides the following information. More detail is available at: http://www.scotland.gov.uk/Topics/Environment/Water/Flooding/resources/localauthorities/LAinfo/LAresponsibilities All bodies responsible for managing flood risk, including local authorities, SEPA, Scottish Ministers and Scottish Water, are placed under a set of general duties in section 1 of the Act. These general duties provide the basic framework in which all work under the Act must be progressed and all flood management decisions must be taken. In summary, the key requirements which these bodies must take into consideration when carrying out their functions are to:
act with a view to reducing overall flood risk;
act to secure compliance with the Directive;
act with a view to achieving the objectives set out in the flood risk management plans;
have regard to the social, environmental and economic impact of carrying out those functions
So far as is consistent with flood risk functions, they must also:
act in the way best calculated to manage flood risk in a sustainable way;
127
promote sustainable flood risk management;
act with a view to raising public awareness of flood risk; and
act in the way best calculated to contribute to the achievement of sustainable development,
These bodies also have a legal requirement upon them to adopt, wherever practicable, an integrated approach through co-operating with each other. Adopting a fully coordinated approach to implementation, both between local authorities and with SEPA, Scottish Water and other bodies is widely viewed as being central to the delivery of improved flood risk management. An important new element of flood risk management established under the Act is a requirement to prepare plans to manage flood risk. These plans will provide a framework for coordinating actions across catchments to deal with all forms of flooding and its impacts. They will also help ensure flood management decisions balance local and national priorities and provide a basis for long-term planning. 9.3.5.2 Floodline
SEPA operate a flood warning system that provides information on river and coastal flood risk. From March 2011, the system will enable residents and organisations to sign up to receive a text or voice message when there‘s a flood update for their area. They have also produced a Flood Map that shows an estimate of the areas of Scotland with a 0.5% (1:200) or greater probability of being flooded in any given year.
9.3.6 Sustainable Procurement
Sustainable procurement can be defined as:
"A process whereby organisations meet their needs for goods, services, works and utilities in a way that achieves value for money on a whole life basis and generates benefits not only to the organisation, but also to society, the economy and the environment" [102].
One of the major challenges facing Scotland is how to incorporate sustainability into our every day activity to benefit society, the economy and the environment. The latest estimates suggest that the public sector (Central Government, Local Authorities, Police Services, Fire & Rescue Services, Health Boards, Universities and Colleges) in Scotland spends some £9bn on goods and services each year; this equates to 25% of public sector spend and 7% of Scottish economy spend [103]. This spending power gives the opportunity to achieve sustainable growth objectives through making sustainable choices and encouraging sustainable products and services which will bring environmental benefits. The public procurement of goods and services in Scotland has been organised into three categories, A (national), B (sectoral), and C (local), depending on the nature of the goods being bought and the procurement agency.
Procurement Scotland is the centre responsible for developing and implementing
procurement strategies for national Category A commodities. These are commodities that are common to all public sector bodies (e.g. utilities, office
128
supplies) and Procurement Scotland is using the buying power of all bodies to drive costs down.
Scotland Excel is the centre responsible for developing and implementing
procurement strategies for the local authority Category B commodities. These are commodities that are common to all local authorities and Scotland Excel is using the buying power of all local authorities to drive costs down whilst improving efficiency. All joining authorities pay an annual fee dependant upon the population, which covers the operating costs of Scotland Excel.
Local commodities which are outwith Categories A and B, department specific contracts will be developed by public sector organisation [104]
The Scottish Government has produced a Scottish Sustainable Procurement Action Plan to assist the public sector to build sustainable procurement into their corporate culture, take proper account of sustainability in procurement activity and to be able to demonstrate how this is being achieved. It was published by Scottish Government in October 2009 and sets out actions to be taken by December 2010. 9.3.6.1 Public Sector
It is the Moray Council‘s policy that value for Moray through competition should be at the heart of public procurement. The Corporate Procurement Team was established in May 2007 to take forward recommendations from the McClelland Report on Public Sector Procurement in Scotland [105]. The Corporate Team in combination with the Designing Better Services (DBS) Programme has set about improving efficiency and effectiveness in collaborative buying with other public sector bodies (through Scottish Excel and Procurement Scotland) and changing the internal purchasing processes. The Council has recently published its Procurement Strategy 2010-14 as well as drafting a Sustainable Procurement Action Plan. The Action Plan is to be used as an assessment tool to measure the environmental consideration and impact in procuring commodities. The Moray Council‘s procurement strategy and action plan places focus on the consideration of the environmental impact of purchasing decisions to minimise adverse impacts through buying products, wherever possible, which have least impact on the environment. Full cycle costs, including disposal, are to be taken into account and the choice should favour the option which minimises any adverse environmental effect. In addition, Procurers will also encourage suppliers to minimise any adverse environmental effects of their activities [106]. The Council sustainable procurement process will ensure that they:
Conserve resources
Reduce waste
Phase out ozone depleting substances
Ensure that any products derived from wildlife are from sustainable sources
Encourage manufacturers to provide environmentally friendly products
Initiating environmental impact assessments As well as the cost savings it is envisaged that sustainable procurement practices will contribute to meeting future Scottish Government emission and waste targets.
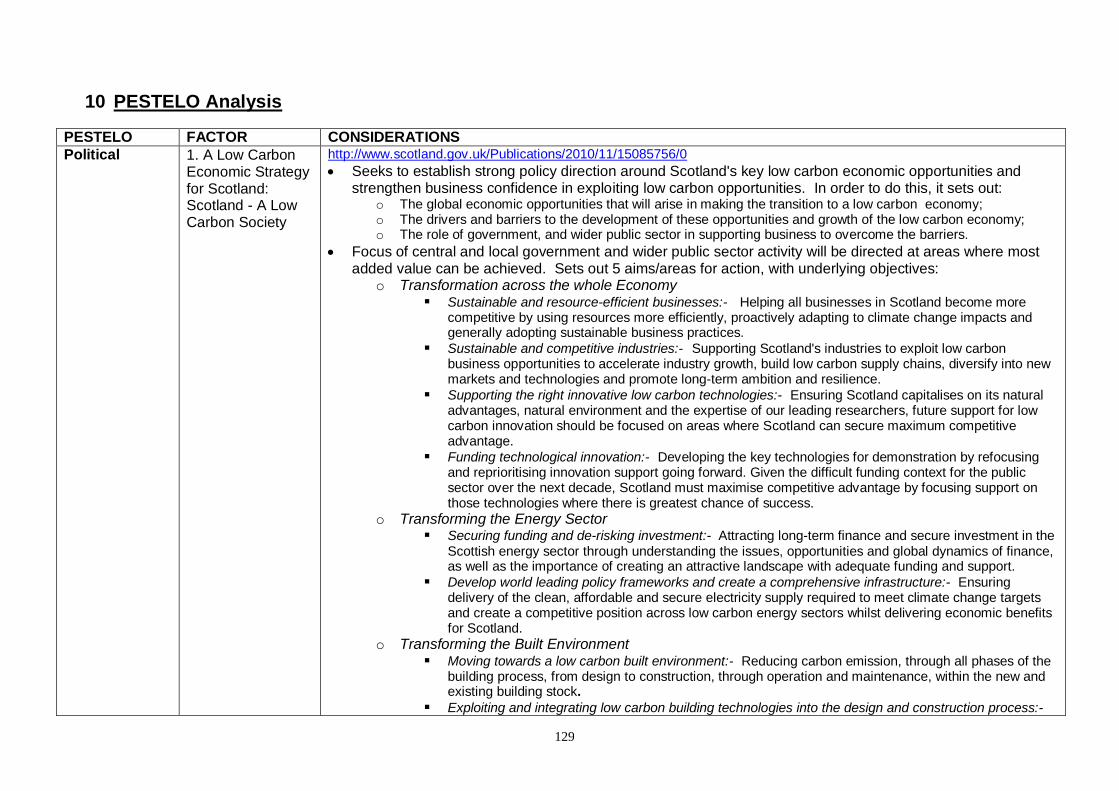
129
10 PESTELO Analysis
PESTELO FACTOR CONSIDERATIONS
Political 1. A Low Carbon Economic Strategy for Scotland: Scotland - A Low Carbon Society
http://www.scotland.gov.uk/Publications/2010/11/15085756/0
Seeks to establish strong policy direction around Scotland's key low carbon economic opportunities and strengthen business confidence in exploiting low carbon opportunities. In order to do this, it sets out:
o The global economic opportunities that will arise in making the transition to a low carbon economy; o The drivers and barriers to the development of these opportunities and growth of the low carbon economy; o The role of government, and wider public sector in supporting business to overcome the barriers.
Focus of central and local government and wider public sector activity will be directed at areas where most added value can be achieved. Sets out 5 aims/areas for action, with underlying objectives:
o Transformation across the whole Economy Sustainable and resource-efficient businesses:- Helping all businesses in Scotland become more
competitive by using resources more efficiently, proactively adapting to climate change impacts and generally adopting sustainable business practices.
Sustainable and competitive industries:- Supporting Scotland's industries to exploit low carbon business opportunities to accelerate industry growth, build low carbon supply chains, diversify into new markets and technologies and promote long-term ambition and resilience.
Supporting the right innovative low carbon technologies:- Ensuring Scotland capitalises on its natural advantages, natural environment and the expertise of our leading researchers, future support for low carbon innovation should be focused on areas where Scotland can secure maximum competitive advantage.
Funding technological innovation:- Developing the key technologies for demonstration by refocusing and reprioritising innovation support going forward. Given the difficult funding context for the public sector over the next decade, Scotland must maximise competitive advantage by focusing support on those technologies where there is greatest chance of success.
o Transforming the Energy Sector Securing funding and de-risking investment:- Attracting long-term finance and secure investment in the
Scottish energy sector through understanding the issues, opportunities and global dynamics of finance, as well as the importance of creating an attractive landscape with adequate funding and support.
Develop world leading policy frameworks and create a comprehensive infrastructure:- Ensuring delivery of the clean, affordable and secure electricity supply required to meet climate change targets and create a competitive position across low carbon energy sectors whilst delivering economic benefits for Scotland.
o Transforming the Built Environment Moving towards a low carbon built environment:- Reducing carbon emission, through all phases of the
building process, from design to construction, through operation and maintenance, within the new and existing building stock.
Exploiting and integrating low carbon building technologies into the design and construction process:-
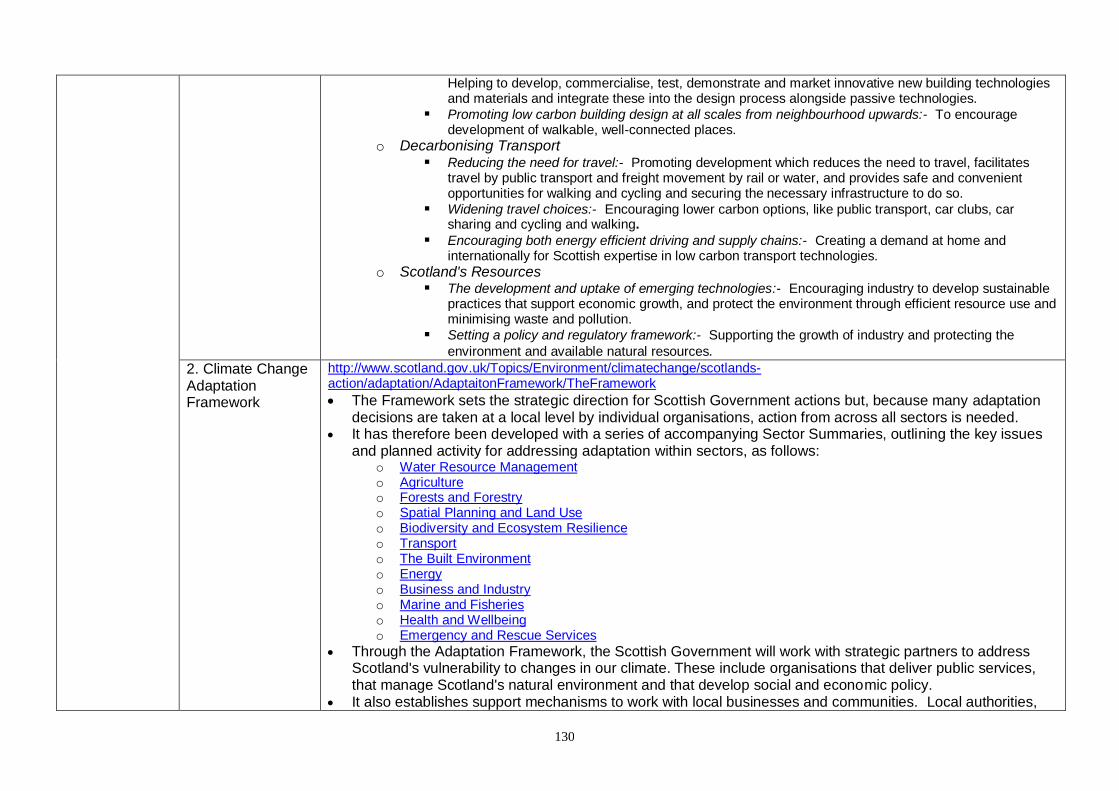
130
Helping to develop, commercialise, test, demonstrate and market innovative new building technologies and materials and integrate these into the design process alongside passive technologies.
Promoting low carbon building design at all scales from neighbourhood upwards:- To encourage development of walkable, well-connected places.
o Decarbonising Transport Reducing the need for travel:- Promoting development which reduces the need to travel, facilitates
travel by public transport and freight movement by rail or water, and provides safe and convenient opportunities for walking and cycling and securing the necessary infrastructure to do so.
Widening travel choices:- Encouraging lower carbon options, like public transport, car clubs, car sharing and cycling and walking.
Encouraging both energy efficient driving and supply chains:- Creating a demand at home and internationally for Scottish expertise in low carbon transport technologies.
o Scotland's Resources The development and uptake of emerging technologies:- Encouraging industry to develop sustainable
practices that support economic growth, and protect the environment through efficient resource use and minimising waste and pollution.
Setting a policy and regulatory framework:- Supporting the growth of industry and protecting the
environment and available natural resources.
2. Climate Change Adaptation Framework
http://www.scotland.gov.uk/Topics/Environment/climatechange/scotlands-action/adaptation/AdaptaitonFramework/TheFramework
The Framework sets the strategic direction for Scottish Government actions but, because many adaptation decisions are taken at a local level by individual organisations, action from across all sectors is needed.
It has therefore been developed with a series of accompanying Sector Summaries, outlining the key issues and planned activity for addressing adaptation within sectors, as follows:
o Water Resource Management o Agriculture o Forests and Forestry o Spatial Planning and Land Use o Biodiversity and Ecosystem Resilience o Transport o The Built Environment o Energy o Business and Industry o Marine and Fisheries o Health and Wellbeing o Emergency and Rescue Services
Through the Adaptation Framework, the Scottish Government will work with strategic partners to address Scotland's vulnerability to changes in our climate. These include organisations that deliver public services, that manage Scotland's natural environment and that develop social and economic policy.
It also establishes support mechanisms to work with local businesses and communities. Local authorities,
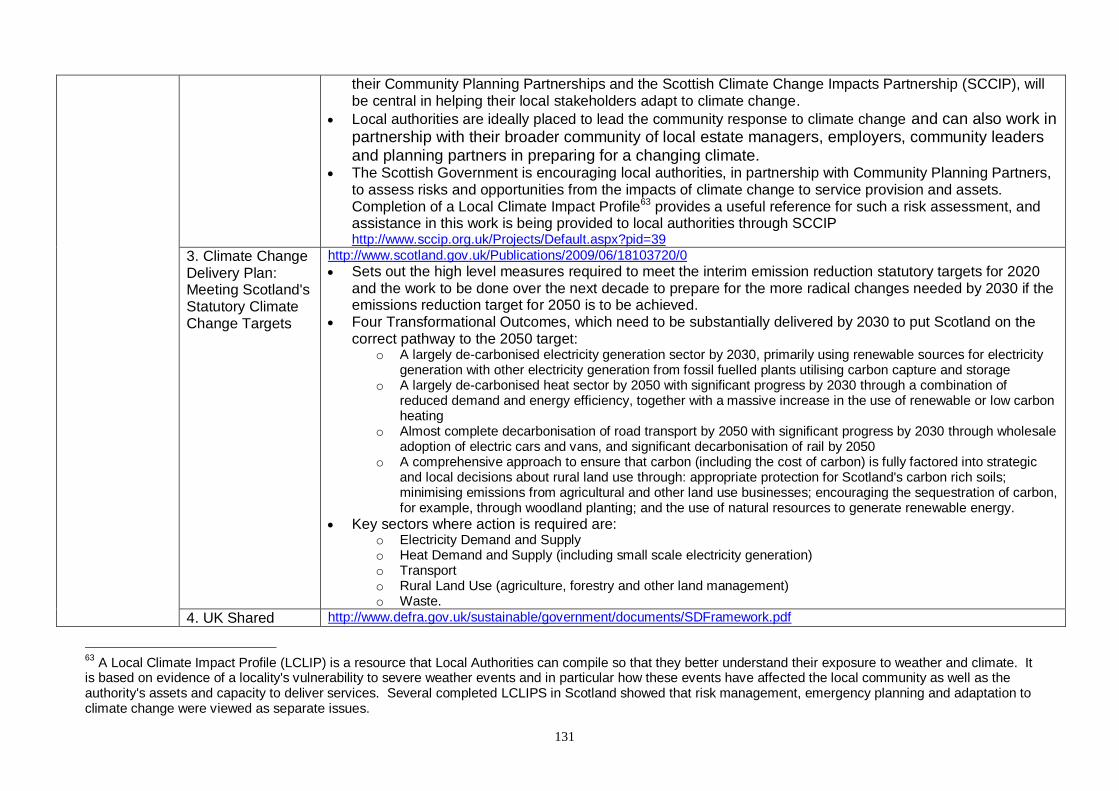
131
their Community Planning Partnerships and the Scottish Climate Change Impacts Partnership (SCCIP), will be central in helping their local stakeholders adapt to climate change.
Local authorities are ideally placed to lead the community response to climate change and can also work in partnership with their broader community of local estate managers, employers, community leaders and planning partners in preparing for a changing climate.
The Scottish Government is encouraging local authorities, in partnership with Community Planning Partners, to assess risks and opportunities from the impacts of climate change to service provision and assets. Completion of a Local Climate Impact Profile63 provides a useful reference for such a risk assessment, and assistance in this work is being provided to local authorities through SCCIP http://www.sccip.org.uk/Projects/Default.aspx?pid=39
3. Climate Change Delivery Plan: Meeting Scotland's Statutory Climate Change Targets
http://www.scotland.gov.uk/Publications/2009/06/18103720/0
Sets out the high level measures required to meet the interim emission reduction statutory targets for 2020 and the work to be done over the next decade to prepare for the more radical changes needed by 2030 if the emissions reduction target for 2050 is to be achieved.
Four Transformational Outcomes, which need to be substantially delivered by 2030 to put Scotland on the correct pathway to the 2050 target:
o A largely de-carbonised electricity generation sector by 2030, primarily using renewable sources for electricity generation with other electricity generation from fossil fuelled plants utilising carbon capture and storage
o A largely de-carbonised heat sector by 2050 with significant progress by 2030 through a combination of reduced demand and energy efficiency, together with a massive increase in the use of renewable or low carbon heating
o Almost complete decarbonisation of road transport by 2050 with significant progress by 2030 through wholesale adoption of electric cars and vans, and significant decarbonisation of rail by 2050
o A comprehensive approach to ensure that carbon (including the cost of carbon) is fully factored into strategic and local decisions about rural land use through: appropriate protection for Scotland's carbon rich soils; minimising emissions from agricultural and other land use businesses; encouraging the sequestration of carbon, for example, through woodland planting; and the use of natural resources to generate renewable energy.
Key sectors where action is required are: o Electricity Demand and Supply o Heat Demand and Supply (including small scale electricity generation) o Transport o Rural Land Use (agriculture, forestry and other land management) o Waste.
4. UK Shared http://www.defra.gov.uk/sustainable/government/documents/SDFramework.pdf
63
A Local Climate Impact Profile (LCLIP) is a resource that Local Authorities can compile so that they better understand their exposure to weather and climate. It is based on evidence of a locality's vulnerability to severe weather events and in particular how these events have affected the local community as well as the authority's assets and capacity to deliver services. Several completed LCLIPS in Scotland showed that risk management, emergency planning and adaptation to climate change were viewed as separate issues.
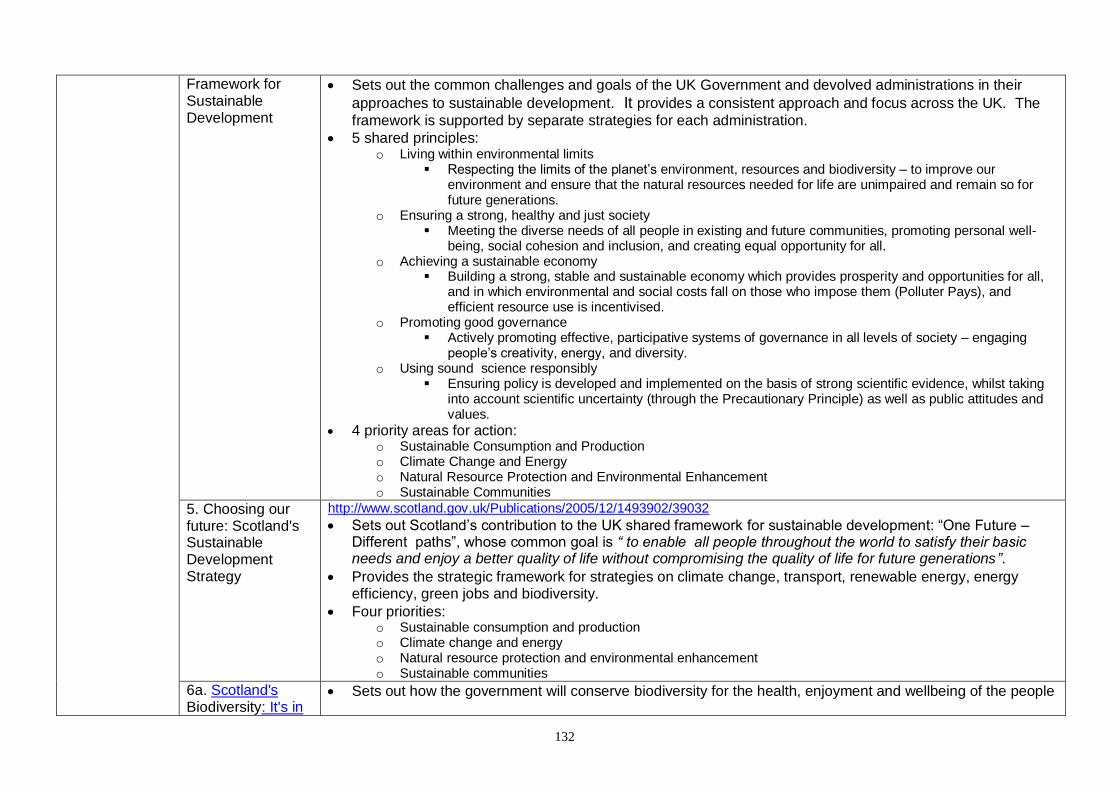
132
Framework for Sustainable Development
Sets out the common challenges and goals of the UK Government and devolved administrations in their
approaches to sustainable development. It provides a consistent approach and focus across the UK. The
framework is supported by separate strategies for each administration.
5 shared principles: o Living within environmental limits
Respecting the limits of the planet‘s environment, resources and biodiversity – to improve our environment and ensure that the natural resources needed for life are unimpaired and remain so for future generations.
o Ensuring a strong, healthy and just society Meeting the diverse needs of all people in existing and future communities, promoting personal well-
being, social cohesion and inclusion, and creating equal opportunity for all. o Achieving a sustainable economy
Building a strong, stable and sustainable economy which provides prosperity and opportunities for all, and in which environmental and social costs fall on those who impose them (Polluter Pays), and efficient resource use is incentivised.
o Promoting good governance Actively promoting effective, participative systems of governance in all levels of society – engaging
people‘s creativity, energy, and diversity. o Using sound science responsibly
Ensuring policy is developed and implemented on the basis of strong scientific evidence, whilst taking into account scientific uncertainty (through the Precautionary Principle) as well as public attitudes and values.
4 priority areas for action: o Sustainable Consumption and Production o Climate Change and Energy o Natural Resource Protection and Environmental Enhancement o Sustainable Communities
5. Choosing our future: Scotland's Sustainable Development Strategy
http://www.scotland.gov.uk/Publications/2005/12/1493902/39032
Sets out Scotland‘s contribution to the UK shared framework for sustainable development: ―One Future – Different paths‖, whose common goal is “ to enable all people throughout the world to satisfy their basic needs and enjoy a better quality of life without compromising the quality of life for future generations”.
Provides the strategic framework for strategies on climate change, transport, renewable energy, energy efficiency, green jobs and biodiversity.
Four priorities: o Sustainable consumption and production o Climate change and energy o Natural resource protection and environmental enhancement o Sustainable communities
6a. Scotland's Biodiversity: It's in
Sets out how the government will conserve biodiversity for the health, enjoyment and wellbeing of the people
133
Your Hands Scotland's biodiversity strategy.
6b. North East Scotland Biodiversity Action Plans
of Scotland now and in the future. The strategy sets out the aim of halting biodiversity loss by this year, 2010, and of Scotland being recognised as a world leader in biodiversity by 2030.
The Strategy provides a foundation for Scotland's contribution to the United Kingdom's obligations under the international Convention on Biological Diversity (CBD), ii as well as the SG‘s commitment to sustainable development, and the statutory duty on public bodies in Scotland to conserve biodiversity under the Nature Conservation (Scotland) Act 2004. iii
It contains five objectives: o Species & Habitats: To halt the loss of biodiversity and continue to reverse previous losses through targeted
action for species and habitats o People: To increase awareness, understanding and enjoyment of biodiversity, and engage many more people
in conservation and enhancement o Landscapes & Ecosystems: To restore and enhance biodiversity in all our urban, rural and marine environments
through better planning, design and practice o Integration & Co-ordination: To develop an effective management framework that ensures biodiversity is taken
into account in all decision making o Knowledge: To ensure that the best new and existing knowledge on biodiversity is available to all policy makers
and practitioners.
The Scottish Biodiversity List is a list of flora, fauna and habitats considered of principal importance for the conservation of biodiversity.
A suite of indicators has been developed describing trends in the state of Scotland's biodiversity, and in the engagement of Scotland's people with its conservation and enhancement. http://www.scotland.gov.uk/Publications/2007/10/08091435/0
http://www.nesbiodiversity.org.uk/actionplans/
A series of action plans laying out the measures needed for the protection and enhancement of habitats, species or areas in the North East area, which are nationally or locally important.
Most of the North East Action for Biodiversity is addressed through the Habitat Action Plans (HAPs), which incorporate action for associated priority species. HAPs are grouped under the following headings:
o Coastal & Marine o Farmland & Grassland o Woodland o Montane, Heath & Bog o Wetland & Freshwater o Urban
Although action for most species is carried out through the relevant Habitat Action Plans, specific Species Action Plans are being implemented for those species where habitat action alone will not fully address the needs of that particular species.
o Aspen Hoverfly o Daubentons Bat
134
o Red Squirrel o Water Vole o Wych Elm
7. Renewables Action Plan
http://www.scotland.gov.uk/Publications/2009/07/06095830/0
An Action Plan that sets out what needs to happen and by when to meet the Scottish Government's Renewable Energy targets, with a focus on the next 24-36 months.
Scotland is currently committed to achieve a headline target of 20% of total Scottish energy use coming from renewable sources by 2020 as follows:
o Electricity - 50% of gross electricity consumption from renewable sources by 2020, with an interim target of 31% by 2011.
o Transport - 10% target for renewable transport by 2020. Set to be consistent with overall EU approach. o Heat - 11% target of heat demand to be met from renewable sources by 2020.
Annex A of the Action Plan comprises routemaps for each of the technologies that will contribute to the 2020 electricity and heat targets, including Bioenergy, Hydro, Hydrogen, Onshore Wind, Offshore Wind and Marine Energy
8. Conserve and Save: Energy Efficiency Action Plan
http://www.scotland.gov.uk/Publications/2010/10/07142301/0
Sets out the Scottish Government‘s wide-ranging programme of activity on behaviour change, household, business and public sector energy efficiency, infrastructure, skills, and finance.
9. Scotland's Offshore Wind Route Map: Developing Scotland's Offshore Wind Industry to 2020
http://www.scotland.gov.uk/Publications/2010/09/28115850/0
Produced by the Offshore Wind Energy Group (OWIG), which comprises all offshore wind developers active in Scotland, grid companies, manufacturing firms, academia, other relevant parties and key public sector bodies
Sets out the opportunities, challenges and the priority recommendations for action for the sector to realise Scotland's full potential in offshore wind.
10. Draft Plan for Offshore Wind Energy in Scottish Territorial Waters
http://www.scotland.gov.uk/Publications/2010/05/14155221/0
In order to meet the targets set for renewable energy contribution Scotland needs to double its current output from 4Gigawatts (GW) to 8GW.
This Plan considers the potential of Scottish Territorial Waters (STW) (i.e. between 0-12 nautical miles offshore) to accommodate offshore wind energy developments from a national perspective, making proposals for the short, medium and long term. For the purposes of the Plan, the short term means 2010-2010, medium term is 2020-2030 and long term extends beyond 2030.
Short-term – 10 areas (1 in the northern Moray Firth). Plan proposed progression of all 10.
Medium-term – 30 areas (2 in the Moray Firth). Further consideration to be given to 25 of the 30 areas, including the 2 in the Moray Firth.
Long-term – the remainder of STW outwith the exclusion areas and short and medium term options. Scope for development in these remaining areas (including the 5 medium-term areas currently rejected) should be

135
explored further.
11. Article 29 of the revised Waste Framework Directive (WFD) and Scotland‘s Zero Waste Plan
http://eur-lex.europa.eu/LexUriServ/LexUriServ.do?uri=OJ:L:2008:312:0003:0003:EN:PDF
Article 29 lays down that Member States of the EU must establish, by 12 December 2013, waste prevention programmes, for all wastes. It defines waste prevention as follows: " ' prevention' means measures taken before a substance, material or product has become waste, that reduce:
o the quantity of waste, including through the re-use of products or the extension of the life span of products; o the adverse impacts of the generated waste and on the environment and human health; or o the content of harmful substances in materials and products."
http://www.scotland.gov.uk/Publications/2010/06/08092645/0
Zero Waste means eliminating the unnecessary use of raw materials; sustainable design; resource efficiency and waste prevention; re-using products where possible; and recovering value from products when they reach the end of their lives either through recycling, composting or energy recovery, in accordance with the waste hierarchy. The Zero Waste Plan sets the strategic direction for waste policy for Scotland, informed by improved understanding of the environmental consequences of how we use and dispose of resources, and by the requirements of European legislation. The Zero Waste Plan is underpinned by a determination to make best practical use of the approach in the waste management hierarchy: waste prevention, reuse, recycling and recovery.
Zero Waste Plan targets encompassing both domestic and EU targets: o By 2010:
40% recycling/composting and preparing for re-use of waste from households (SG)
No more than 2.7 million tonnes of biodegradable municipal waste to be sent to landfill (EU)
o By 2013: 50% recycling/composting and preparing for re-use of waste from households (SG)
No more than 1.8 million tonnes of biodegradable municipal waste to be sent to landfill (EU)
o By 2020: 60% recycling/composting and preparing for re-use of waste from households (SG)
No more than 1.26 million tonnes of biodegradable municipal waste to be sent to landfill (EU)
The preparing for re-use and the recycling of 50% by weight of waste materials such as paper, metal, plastic and glass from household waste and similar (EU)
70% recycling and preparing for re-use of construction and demolition waste (EU)
o By 2025: 70% recycling/composting and preparing for re-use of waste from households (SG)
No more than 5% of all waste to go to landfill (SG)
12. Scottish Planning Policy (SPP)
http://www.scotland.gov.uk/Publications/2010/02/03132605/0
SPP is a statement of Scottish Government policy on land use planning and contains: o The Scottish Government's view of the purpose of planning, o The core principles for the operation of the system and the objectives for key parts of the system, o Statutory guidance on sustainable development and planning under Section 3E of the Planning etc. (Scotland)
136
Act 2006, o Concise subject planning policies, including the implications for development planning and development
management, and o The Scottish Government's expectations of the intended outcomes of the planning system.
Includes policies on: o Economic Development o Town Centres and Retailing o Housing o Rural Development o Coastal Planning o Fish Farming o Historic Environment o Landscape and Natural Heritage o Open Space and Physical Activity o Green Belts o Transport o Renewable Energy o Flooding and Drainage o Waste Management o Minerals o Onshore Oil and Gas Operations o Surface Coal Mining o Communications Infrastructure
13a. Designing Places 13b. Designing Streets
http://www.scotland.gov.uk/Topics/Built-Environment/planning/National-Planning-Policy/Designing http://www.scotland.gov.uk/Publications/2010/03/22120652/0
The Scottish Government's two key policy statements on design and place-making. Both documents are national planning policy and aim to raise the quality of design in urban and rural development.
o Sets out government aspirations for design and the role of the planning system in delivering these. o Good street design should derive from an intelligent response to location, rather than the rigid application of
standards, regardless of context. Provides policy that should be followed in designing and approving all streets, aiming to raise the quality of design in urban and rural development.
14. The Scottish Government‘s Policy on Control of Woodland Removal
http://www.forestry.gov.uk/pdf/fcfc125.pdf/$FILE/fcfc125.pdf
Principles of the policy are: o To provide a strategic framework for appropriate woodland removal. o To support the maintenance and expansion of forest cover in Scotland. o To contribute towards achieving an appropriate balance between forested and non-forested land in Scotland. o To support climate change mitigation and adaptation in Scotland. o To provide a sound basis for Scotland‘s participation in the global debate and actions on deforestation. o To develop a clear understanding of the nature and extent of future woodland removal in Scotland.
‗Woodland removal‘ is defined as the permanent removal of woodland for the purposes of conversion to
137
another type of land use.
Outlines the criteria for determining the acceptability of woodland removal, both with and without compensatory planting.
15a. Scottish Forestry Strategy 2006
15b. Scottish Forestry Strategy Implementation Plan 2010-13
http://www.forestry.gov.uk/pdf/SFS2006fcfc101.pdf/$FILE/SFS2006fcfc101.pdf
Strategic framework that sets out long-term directions for the future of forestry in Scotland.
Would like to see Scotland‘s woodlands increase from 17.1% of our land area to about 25%.
Four principles: o Sustainable development – underpinned by sustainable forest management. o Social inclusion - through helping to provide opportunities for all, and helping to build stronger communities. o Forestry for and with people. o Integration with other land uses and businesses.
Key themes: o Climate Change – Using forestry, and adapting forestry practices, to help reduce the impact of climate change
and help Scotland adapt to its changing climate. o Timber – Getting the most from Scotland‘s increasing and sustainable timber resource. o Business development – Strengthening forestry through business development to underpin sustainable forest
management and support economic growth and employment across Scotland. o Community Development – Improving the quality of life and well-being of people by supporting community
development across Scotland. o Access & Health – Making access to, and enjoyment of, woodlands easier for everyone - to help improve
physical and mental health in Scotland. o Environmental quality – Protecting the environmental quality of our natural resources (water, soil and air),
contributing to and improving our scenery, and helping to make the most of our unique historic environment. o Biodiversity – Helping to restore, maintain and enhance Scotland‘s biodiversity, and increasing awareness and
enjoyment of it. http://www.forestry.gov.uk/pdf/SFSIMPLEMENTATIONPLAN20102011.pdf/$FILE/SFSIMPLEMENTATIONPLAN20102011.pdf
Outlines the priorities for action in 2010/11 in relation to each of the seven themes across five regions, one of which is Grampian.
Actions relevant to Moray Community Planning Partnership: o Climate Change:
Approve 1,000 hectares of woodland expansion through SRDP Rural Development Contracts (FCS)
Work with renewable energy developers to ensure sustainable forestry practices are adopted
138
o Timber: Encourage the adoption of guidelines on the use of timber in sustainable construction to support the
planning process in each council area o Community Development:
Promote the uptake of Forestry for People grants (FCS) Share knowledge and awareness of woodland related policy and best practice among council
development control officers (FCS) o Access & Health:
Work with NHS Grampian to promote the health benefits of walking in woodlands, focusing on the most deprived wards identifies in the Scottish Index of Multiple Deprivation (FCS, NHS)
o Environmental Quality: Ensure woodlands contribute to a good quality freshwater environment (SEPA) Scoping opportunities for research into the positive effects of woodland on watercourses (FCS)
o Biodiversity: Conserve and protect the north east red squirrel population (NELBAP) Promulgate the benefits of management plans for designated sites in order to progress towards
favourable condition (SNH) Review and prioritise actions for the forestry related Habitat Action Plans (NELBAP)
16. National Transport Strategy 2006
http://www.scotland.gov.uk/Publications/2006/12/04104414/0
Addresses the challenges facing transport in Scotland through 3 key strategic outcomes: o Improve journey times and connections between our cities and towns and our global markets to tackle
congestion and provide access to key markets. o Reduce emissions to tackle climate change. o Improve quality, accessibility and affordability of transport, to give people the choice of public transport and real
alternatives to the car.
Supported by : o Scotland‘s Railways – sets out the vision for rail services in Scotland, including the contribution to
environmental targets o Bus Action Plan – aims to improve bus services across Scotland, which will contribute to reducing congestion
and emissions. o Freight Action Plan – sets out the vision for freight movement in Scotland including minimising the adverse
impact of freight movements on the Environment, in particular through the reduction in emissions and noise.
17. Sustainable Procurement Action Plan
http://www.scotland.gov.uk/Publications/2009/10/sspap
Defines Sustainable Procurement as "A process whereby organisations meet their needs for goods, services, works and utilities in a way that achieves value for money on a whole life basis and generates benefits not only to the organisation, but also to society, the economy and the environment".
This Action Plan outlines a whole organisation approach to successful sustainable procurement.
The approach here outlines 10 steps, which each organisation must go through to successfully deliver sustainable procurement.
139
o Commitment within the organisation o Making the commitment public o Organisational buy-in o Benchmarking and progression o Prioritising o Specifying sustainably o Sustainability in the procurement process o Working with suppliers o Measuring performance o Publicising your successes
The Action Plan calls on organisations to produce their own Delivery Plans to set out how, and by when, improvements in sustainable procurement will be made.
18. Scottish Historic Environment Policy (SHEP) July 2009
http://www.historic-scotland.gov.uk/index/heritage/policy/shep.htm
Sets out Scottish Ministers‘ policies for the historic environment, provides greater policy direction for Historic Scotland and provides a framework that informs the day-to-day work of a range of organisations that have a role and interest in managing the historic environment.
Individual departments, directorates, agencies and other bodies which are accountable to Scottish Ministers are expected to adopt and implement the polices set out in the SHEP and to build the protection, management, maintenance or repair of historic assets into their operational and budgetary plans.
Three key outcomes: 1. That the historic environment is cared for, protected and enhanced for the benefit of our own and future
generations. 2. To secure greater economic benefits from the historic environment. 3. The people of Scotland and visitors to our country value, understand and enjoy the historic environment.
19. Change in UK Gov‘t and potential change in Scottish Gov‘t
Potential changes to relationship between UK and Scottish governments, e.g. devolved powers
Potential changes to relationship between Scottish and Local Government, e.g. abolition of SOA
Economic 1. Budget savings, both local and national
The UK Government's Comprehensive Spending Review (CSR) will see Scotland's overall budget fall by £1.3 billion in cash terms in 2011-12 compared to 2010-11, including a fall of £800 million in the capital budget.
Reduced funding for non-statutory services.
Social 1. Changing population
Change in amount of waste
Reducing school roll
2. Closure of RAF Kinloss and potential closure of RAF Lossiemouth
Would result in reduction in population of approximately 7.5%
Significant number of privately owned properties would be vacated in addition to DHE properties.
140
Technological 1. Recycling facilities
Capability to recycle many substances. Recycling Centres across Moray collect some or all of: o Food and drinks cans o Car batteries o Garden waste o Glass bottles and jars o Plastic bottles o Paper and cardboard o Rubble o Scrap metal o Textiles o Used engine oil o White goods o Wood o WEEE (waste electrical and electronic equipment) o End of Life Vehicles
2. Renewable energy technologies
Wind turbines
Wave & tidal energy capture methods
Biomass
Solar PV(electricity) / Solar Thermal (hot water)
Micro-Hydro
Anaerobic Digestion
3. Alternative fuel transport
Low carbon vehicles including hybrids and those powered by electricity, biomethane, biodiesel, bioethanol or hydrogen
Cooking oil waste trucks
Environmental 1. Climate change The UK Climate Projections were launched on June 18, 2009.
They show the changes that can be expected during the rest of this century. Broadly, Scotland will get warmer, wetter winters and hotter, drier summers.
As the climate changes, Scotland will see more extreme weather events. There will be more extended hot periods; major increases in maximum temperatures nationwide, and fewer days of snow and frost. There will be longer periods of dry weather in the summer and the wettest days of the year are likely to be considerably wetter than at present.
Projections for Scotland east can be seen at http://ukclimateprojections.defra.gov.uk/content/view/375/499/
2. Rurality Access issues (e.g. for larger item recycling)
Cost of kerbside collection – different levels provided across Moray
More space to enable composting that may not be the case in urban areas
Rural communities tend to be more aware of and value more highly their environment and are less concerned about the cost of ―green‖ measures.
141
3. Scottish Climate Change Declaration
http://climatechange.sustainable-scotland.net/
Signatories to Scotland's Climate Change Declaration acknowledge the reality and importance of climate change and are committed to:
o Mitigating their impact on climate change through reducing greenhouse gas emissions o Taking steps to adapt to the unavoidable impacts of a changing climate o Working in partnership with their communities to respond to climate change
4. Carbon Management Plan
http://www.moray.gov.uk/downloads/file64690.pdf
Produced as part of the Carbon Trust‘s ―Carbon Management Programme‖
Provides a robust 5-year framework for the delivery of a variety of projects to achieve a 30% reduction in carbon dioxide emissions.
It concentrates on key emitters within the council‘s services which include energy consumption in council-owned non-domestic buildings and schools, energy consumption in street lighting, fuel consumption within the council‘s fleet and business miles travelled. The baseline figures also include municipal waste for the whole of Moray.
5. Wood Energy deployment in Scottish Councils
http://www.yourmoray.org.uk/DocumentLibrary/ThemeDocs/Greener/WoodEnergyDeploymentInScottishCouncilsFeb09.pdf
Report commissioned by Scottish Enterprise, Scottish Government and Forestry Commission Scotland examining how wood energy investment in Scottish Council building stock could help meet commitments on carbon reductions and renewable energy.
6. Feed-in Tariffs The Feed-in Tariff (FIT) scheme pays people/organisations for creating their own "green electricity".
Tariffs became payable in April 2010. All qualifying systems installed now are eligible.
Tariffs apply to all qualifying technologies in sizes up to 5 megawatts. The amount paid is dependent on the type of technology and the size of the system.
There are 3 separate ways that the Tariffs help make money from generating own energy: o The Generation Tariff: Earn a fixed income for every kilowatt hour of electricity generated and used in own
property. o The Export Tariff: Earn an additional fixed income for every kilowatt hour of electricity generated and sold
back to the grid. o The bit still bought from electricity supplier: When not enough electricity is generated to fulfill needs,
remainder is bought from utility company at normal rates but it will be much less electricity than currently buy.
7. Renewable Heat Incentive (RHI)
www.decc.gov.uk/en/content/cms/what_we_do/uk_supply/energy_mix/renewable/policy/renewable_heat/incentive/incentive.aspx
The Renewable Heat Incentive (RHI) will provide financial support for those who install renewable heating, which qualifies for support under the scheme. Proposals are that :
o The scheme should support a range of technologies, including air and ground-source heat pumps (and other geothermal energy), solar thermal, biomass boilers, renewable combined heat and power, use of biogas and bioliquids and the injection of biomethane into the natural gas grid.
o The scheme should support heating at all scales, including households, businesses, offices, public sector buildings and industrial processes in large factories.
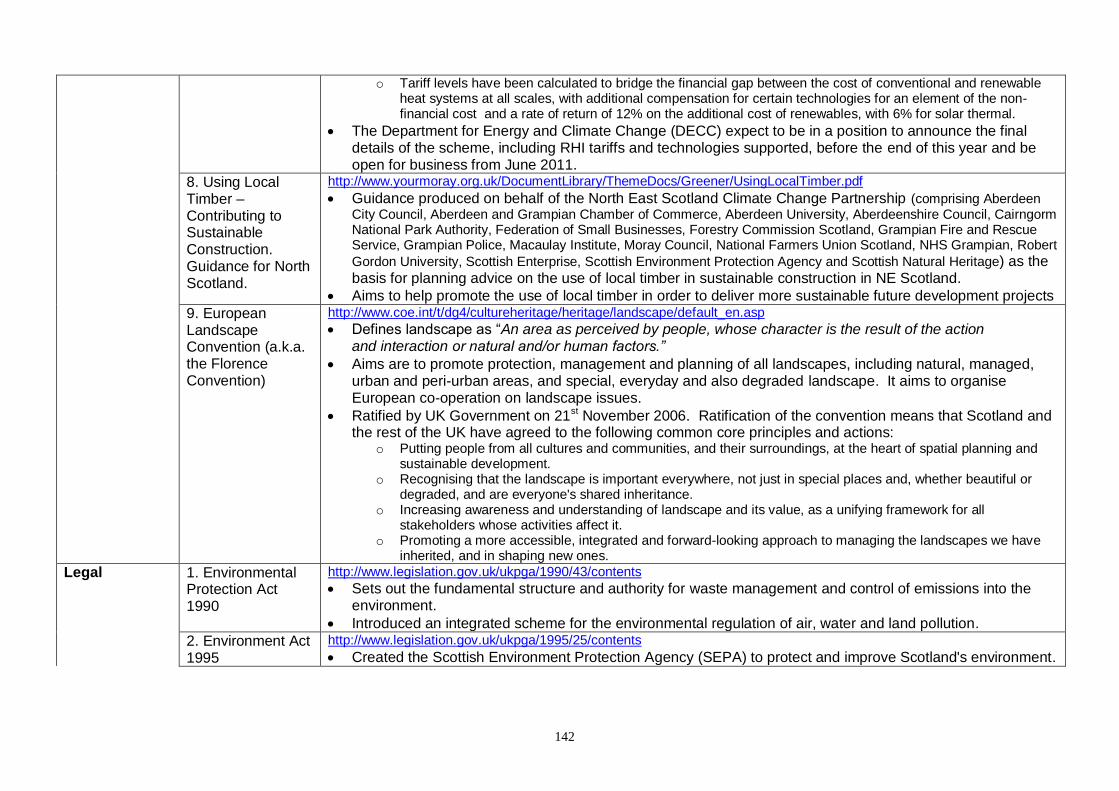
142
o Tariff levels have been calculated to bridge the financial gap between the cost of conventional and renewable heat systems at all scales, with additional compensation for certain technologies for an element of the non-financial cost and a rate of return of 12% on the additional cost of renewables, with 6% for solar thermal.
The Department for Energy and Climate Change (DECC) expect to be in a position to announce the final details of the scheme, including RHI tariffs and technologies supported, before the end of this year and be open for business from June 2011.
8. Using Local Timber – Contributing to Sustainable Construction. Guidance for North Scotland.
http://www.yourmoray.org.uk/DocumentLibrary/ThemeDocs/Greener/UsingLocalTimber.pdf
Guidance produced on behalf of the North East Scotland Climate Change Partnership (comprising Aberdeen City Council, Aberdeen and Grampian Chamber of Commerce, Aberdeen University, Aberdeenshire Council, Cairngorm National Park Authority, Federation of Small Businesses, Forestry Commission Scotland, Grampian Fire and Rescue Service, Grampian Police, Macaulay Institute, Moray Council, National Farmers Union Scotland, NHS Grampian, Robert
Gordon University, Scottish Enterprise, Scottish Environment Protection Agency and Scottish Natural Heritage) as the basis for planning advice on the use of local timber in sustainable construction in NE Scotland.
Aims to help promote the use of local timber in order to deliver more sustainable future development projects
9. European Landscape Convention (a.k.a. the Florence Convention)
http://www.coe.int/t/dg4/cultureheritage/heritage/landscape/default_en.asp
Defines landscape as ―An area as perceived by people, whose character is the result of the action and interaction or natural and/or human factors.”
Aims are to promote protection, management and planning of all landscapes, including natural, managed, urban and peri-urban areas, and special, everyday and also degraded landscape. It aims to organise European co-operation on landscape issues.
Ratified by UK Government on 21st November 2006. Ratification of the convention means that Scotland and the rest of the UK have agreed to the following common core principles and actions:
o Putting people from all cultures and communities, and their surroundings, at the heart of spatial planning and sustainable development.
o Recognising that the landscape is important everywhere, not just in special places and, whether beautiful or degraded, and are everyone's shared inheritance.
o Increasing awareness and understanding of landscape and its value, as a unifying framework for all stakeholders whose activities affect it.
o Promoting a more accessible, integrated and forward-looking approach to managing the landscapes we have inherited, and in shaping new ones.
Legal 1. Environmental Protection Act 1990
http://www.legislation.gov.uk/ukpga/1990/43/contents
Sets out the fundamental structure and authority for waste management and control of emissions into the environment.
Introduced an integrated scheme for the environmental regulation of air, water and land pollution.
2. Environment Act 1995
http://www.legislation.gov.uk/ukpga/1995/25/contents
Created the Scottish Environment Protection Agency (SEPA) to protect and improve Scotland's environment.
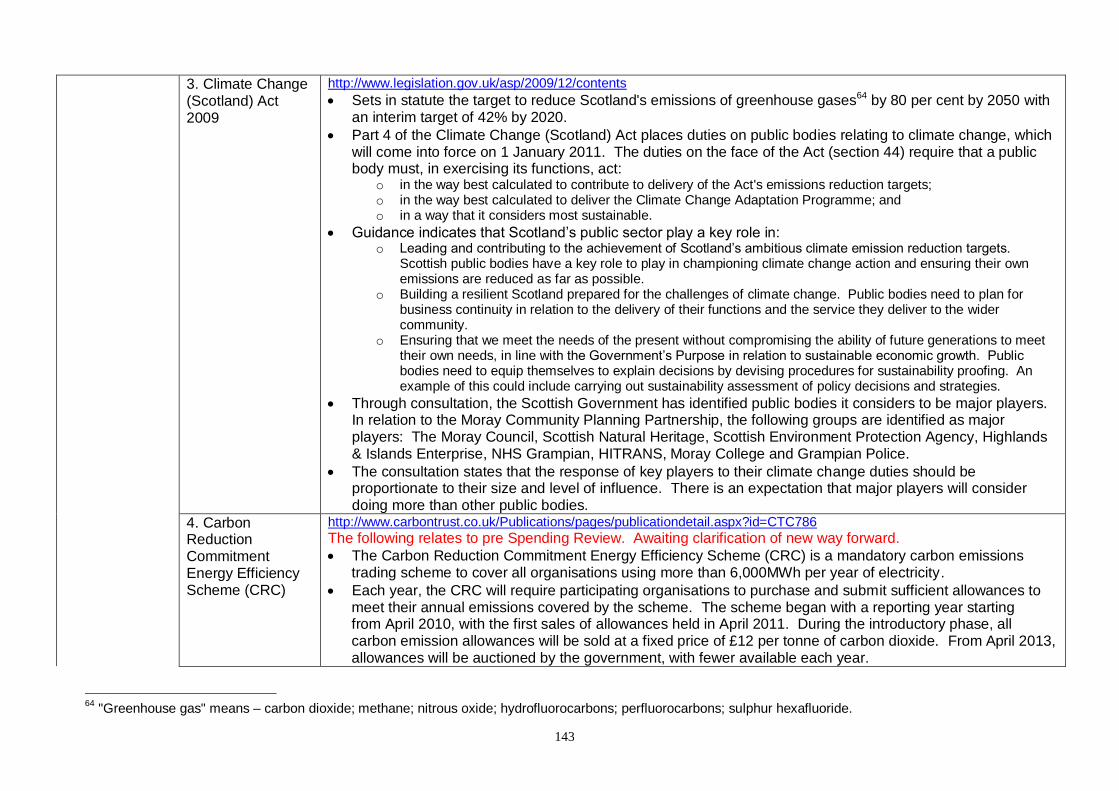
143
3. Climate Change (Scotland) Act 2009
http://www.legislation.gov.uk/asp/2009/12/contents
Sets in statute the target to reduce Scotland's emissions of greenhouse gases64 by 80 per cent by 2050 with an interim target of 42% by 2020.
Part 4 of the Climate Change (Scotland) Act places duties on public bodies relating to climate change, which will come into force on 1 January 2011. The duties on the face of the Act (section 44) require that a public body must, in exercising its functions, act:
o in the way best calculated to contribute to delivery of the Act's emissions reduction targets; o in the way best calculated to deliver the Climate Change Adaptation Programme; and o in a way that it considers most sustainable.
Guidance indicates that Scotland‘s public sector play a key role in: o Leading and contributing to the achievement of Scotland‘s ambitious climate emission reduction targets.
Scottish public bodies have a key role to play in championing climate change action and ensuring their own emissions are reduced as far as possible.
o Building a resilient Scotland prepared for the challenges of climate change. Public bodies need to plan for business continuity in relation to the delivery of their functions and the service they deliver to the wider community.
o Ensuring that we meet the needs of the present without compromising the ability of future generations to meet their own needs, in line with the Government‘s Purpose in relation to sustainable economic growth. Public bodies need to equip themselves to explain decisions by devising procedures for sustainability proofing. An example of this could include carrying out sustainability assessment of policy decisions and strategies.
Through consultation, the Scottish Government has identified public bodies it considers to be major players. In relation to the Moray Community Planning Partnership, the following groups are identified as major players: The Moray Council, Scottish Natural Heritage, Scottish Environment Protection Agency, Highlands & Islands Enterprise, NHS Grampian, HITRANS, Moray College and Grampian Police.
The consultation states that the response of key players to their climate change duties should be proportionate to their size and level of influence. There is an expectation that major players will consider doing more than other public bodies.
4. Carbon Reduction Commitment Energy Efficiency Scheme (CRC)
http://www.carbontrust.co.uk/Publications/pages/publicationdetail.aspx?id=CTC786 The following relates to pre Spending Review. Awaiting clarification of new way forward.
The Carbon Reduction Commitment Energy Efficiency Scheme (CRC) is a mandatory carbon emissions trading scheme to cover all organisations using more than 6,000MWh per year of electricity.
Each year, the CRC will require participating organisations to purchase and submit sufficient allowances to meet their annual emissions covered by the scheme. The scheme began with a reporting year starting from April 2010, with the first sales of allowances held in April 2011. During the introductory phase, all carbon emission allowances will be sold at a fixed price of £12 per tonne of carbon dioxide. From April 2013, allowances will be auctioned by the government, with fewer available each year.
64
"Greenhouse gas" means – carbon dioxide; methane; nitrous oxide; hydrofluorocarbons; perfluorocarbons; sulphur hexafluoride.
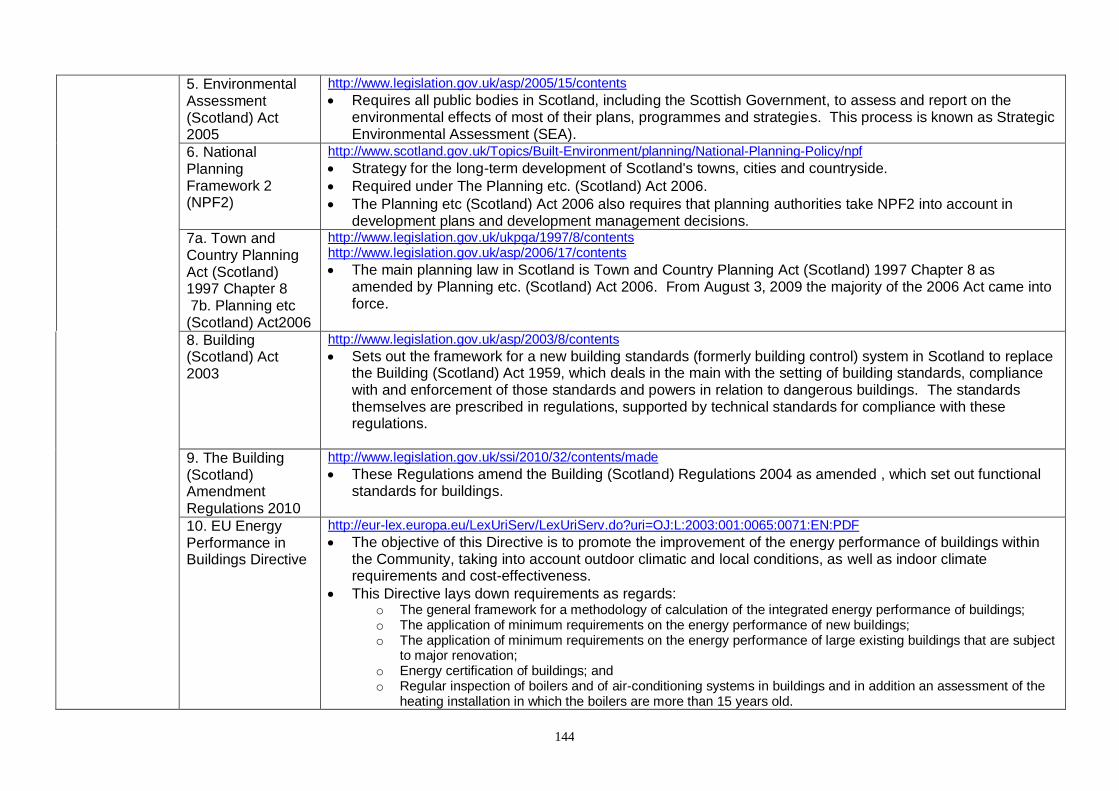
144
5. Environmental Assessment (Scotland) Act 2005
http://www.legislation.gov.uk/asp/2005/15/contents
Requires all public bodies in Scotland, including the Scottish Government, to assess and report on the environmental effects of most of their plans, programmes and strategies. This process is known as Strategic Environmental Assessment (SEA).
6. National Planning Framework 2 (NPF2)
http://www.scotland.gov.uk/Topics/Built-Environment/planning/National-Planning-Policy/npf
Strategy for the long-term development of Scotland's towns, cities and countryside.
Required under The Planning etc. (Scotland) Act 2006.
The Planning etc (Scotland) Act 2006 also requires that planning authorities take NPF2 into account in development plans and development management decisions.
7a. Town and Country Planning Act (Scotland) 1997 Chapter 8 7b. Planning etc (Scotland) Act2006
http://www.legislation.gov.uk/ukpga/1997/8/contents http://www.legislation.gov.uk/asp/2006/17/contents
The main planning law in Scotland is Town and Country Planning Act (Scotland) 1997 Chapter 8 as amended by Planning etc. (Scotland) Act 2006. From August 3, 2009 the majority of the 2006 Act came into force.
8. Building (Scotland) Act 2003
http://www.legislation.gov.uk/asp/2003/8/contents
Sets out the framework for a new building standards (formerly building control) system in Scotland to replace the Building (Scotland) Act 1959, which deals in the main with the setting of building standards, compliance with and enforcement of those standards and powers in relation to dangerous buildings. The standards themselves are prescribed in regulations, supported by technical standards for compliance with these regulations.
9. The Building (Scotland) Amendment Regulations 2010
http://www.legislation.gov.uk/ssi/2010/32/contents/made
These Regulations amend the Building (Scotland) Regulations 2004 as amended , which set out functional standards for buildings.
10. EU Energy Performance in Buildings Directive
http://eur-lex.europa.eu/LexUriServ/LexUriServ.do?uri=OJ:L:2003:001:0065:0071:EN:PDF
The objective of this Directive is to promote the improvement of the energy performance of buildings within the Community, taking into account outdoor climatic and local conditions, as well as indoor climate requirements and cost-effectiveness.
This Directive lays down requirements as regards: o The general framework for a methodology of calculation of the integrated energy performance of buildings; o The application of minimum requirements on the energy performance of new buildings; o The application of minimum requirements on the energy performance of large existing buildings that are subject
to major renovation; o Energy certification of buildings; and o Regular inspection of boilers and of air-conditioning systems in buildings and in addition an assessment of the
heating installation in which the boilers are more than 15 years old.
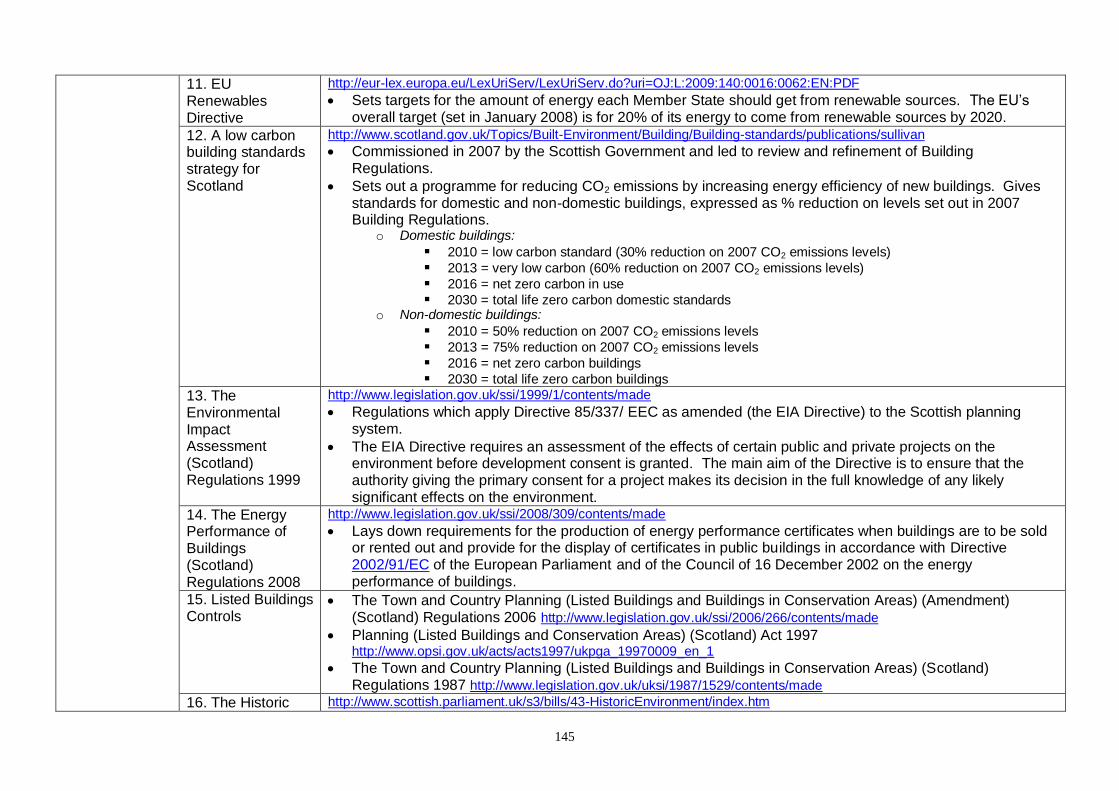
145
11. EU Renewables Directive
http://eur-lex.europa.eu/LexUriServ/LexUriServ.do?uri=OJ:L:2009:140:0016:0062:EN:PDF
Sets targets for the amount of energy each Member State should get from renewable sources. The EU‘s overall target (set in January 2008) is for 20% of its energy to come from renewable sources by 2020.
12. A low carbon building standards strategy for Scotland
http://www.scotland.gov.uk/Topics/Built-Environment/Building/Building-standards/publications/sullivan
Commissioned in 2007 by the Scottish Government and led to review and refinement of Building Regulations.
Sets out a programme for reducing CO2 emissions by increasing energy efficiency of new buildings. Gives standards for domestic and non-domestic buildings, expressed as % reduction on levels set out in 2007 Building Regulations.
o Domestic buildings:
2010 = low carbon standard (30% reduction on 2007 CO2 emissions levels) 2013 = very low carbon (60% reduction on 2007 CO2 emissions levels) 2016 = net zero carbon in use 2030 = total life zero carbon domestic standards
o Non-domestic buildings:
2010 = 50% reduction on 2007 CO2 emissions levels 2013 = 75% reduction on 2007 CO2 emissions levels 2016 = net zero carbon buildings 2030 = total life zero carbon buildings
13. The Environmental Impact Assessment (Scotland) Regulations 1999
http://www.legislation.gov.uk/ssi/1999/1/contents/made
Regulations which apply Directive 85/337/ EEC as amended (the EIA Directive) to the Scottish planning system.
The EIA Directive requires an assessment of the effects of certain public and private projects on the environment before development consent is granted. The main aim of the Directive is to ensure that the authority giving the primary consent for a project makes its decision in the full knowledge of any likely significant effects on the environment.
14. The Energy Performance of Buildings (Scotland) Regulations 2008
http://www.legislation.gov.uk/ssi/2008/309/contents/made
Lays down requirements for the production of energy performance certificates when buildings are to be sold or rented out and provide for the display of certificates in public buildings in accordance with Directive 2002/91/EC of the European Parliament and of the Council of 16 December 2002 on the energy performance of buildings.
15. Listed Buildings Controls
The Town and Country Planning (Listed Buildings and Buildings in Conservation Areas) (Amendment) (Scotland) Regulations 2006 http://www.legislation.gov.uk/ssi/2006/266/contents/made
Planning (Listed Buildings and Conservation Areas) (Scotland) Act 1997 http://www.opsi.gov.uk/acts/acts1997/ukpga_19970009_en_1
The Town and Country Planning (Listed Buildings and Buildings in Conservation Areas) (Scotland) Regulations 1987 http://www.legislation.gov.uk/uksi/1987/1529/contents/made
16. The Historic http://www.scottish.parliament.uk/s3/bills/43-HistoricEnvironment/index.htm
146
Environment (Amendment) Scotland Bill
Amends some parts of current legislation in order to allow for an enhanced level of protection for the historic environment and provide an improved service to stakeholders by addressing the gaps and weaknesses identified during the stakeholder engagement process. There are three acts that are directly affected:
o The Historic Buildings and Ancient Monuments Act 1953, http://www.opsi.gov.uk/acts/acts1953/pdf/ukpga_19530049_en.pdf
o The Ancient Monuments and Archaeological Areas Act 1979 http://www.opsi.gov.uk/acts/acts1979/pdf/ukpga_19790046_en.pdf
o The Planning (listed Buildings and Conservation Areas)(Scotland) Act 1997. http://www.opsi.gov.uk/acts/acts1997/ukpga_19970009_en_1
17. Water Framework Directive (WFD)
http://eur-lex.europa.eu/LexUriServ/LexUriServ.do?uri=OJ:L:2000:327:0001:0072:EN:PDF
Purpose of this Directive is to establish a framework for the protection of inland surface waters, transitional waters, coastal waters and groundwater.
The Water Framework Directive was introduced in 2000 and was transposed into Scots Law in 2003 (Water Environment and Water Services (Scotland) Act 2003. http://www.legislation.gov.uk/asp/2003/3/contents
The WFD applies to all water in the natural environment - rivers, lochs, estuaries, coastal and underground water. The objectives of the WFD are to:
o Prevent deterioration in the status of surface water bodies o Protect, enhance, and restore all bodies of surface water with the aim of achieving good surface water status by
2015 o Prevent deterioration of the status of groundwater bodies o Protect, enhance, and restore all bodies of groundwater with the aim of achieving good groundwater status by
2015 o Prevent or limit the input of pollutants to groundwater and reverse any significant and sustained upward trend
pollutant concentration in groundwater o Comply on European measures against priority/priority hazardous substances o Comply with any relevant standards and objectives for protected areas
The two key components of the WFD are: o The introduction of River Basin Management Planning to manage the water environment, covering all rivers,
loch, estuaries, coastal waters and underground waters. A River Basin Management Plan for each River Basin District sets out the environmental pressures and what can be done to address them.
o Control of all impacts - physical, polluting and otherwise - on the water environment with the aim of achieving "good" ecological status for water bodies by 2015. Status is determined on the basis of ecology as the WFD requires water quality to be determined not just by the chemical composition of waters, but by the fish, plant and other life that inhabits it.
Drinking Water Protected Areas – Scotland River Basin District – Surface Water: http://www.scotland.gov.uk/Topics/Environment/Water/WFD/WEWSAct/maps/map9 Drinking Water Protected Areas – Scotland River Basin District – Groundwater: http://www.scotland.gov.uk/Topics/Environment/Water/WFD/WEWSAct/maps/map20
18. Marine (Scotland) Act
http://www.scotland.gov.uk/Topics/marine/seamanagement/marineact
147
2010 Provides a framework that will help balance competing demands on Scotland's seas. It introduces a duty to protect and enhance the marine environment and includes measures to help boost economic investment and growth in areas such as marine renewables.
The main measures include: o Marine planning: a new statutory marine planning system to sustainably manage the increasing, and often
conflicting, demands on our seas o Marine licensing: a simpler licensing system, minimising the number of licences required for development in the
marine environment to cut bureaucracy and encourage economic investment o Marine conservation: improved marine nature and historic conservation with new powers to protect and manage
areas of importance for marine wildlife, habitats and historic monuments o Seal conservation: much improved protection for seals and a new comprehensive licence system to ensure
appropriate management when necessary o Enforcement: a range of enhanced powers of marine conservation and licensing
19. Flood Risk Management (Scotland) Act 2009
http://www.legislation.gov.uk/asp/2009/6/contents
Includes the duty paced upon Scottish Ministers, SEPA, local authorities, Scottish Water and other responsible authorities to exercise their functions with a view to managing and reducing flood risk and to promote sustainable flood risk management.
20. The Bathing Waters (Scotland) Regulations 2008
http://www.legislation.gov.uk/ssi/2008/170/contents/made
Sets out the requirements for bathing waters in Scotland in accordance with the Revised Bathing Water Directive 2006/7/EC, which in turn sets out a range of parameters, microbiological, chemical and physical, by which compliance is to be measured.
All Scottish bathing waters must comply with the Directive's standard by 2015.
The Scottish Government is responsible for administering the requirements of the Bathing Water Directive in Scotland
SEPA is required by legislation to monitor and report on the water quality at each bathing water.
21. Equality Bill http://www.scotland.gov.uk/Publications/2009/09/28154835/10 The Equality Bill, introduced at Westminster in April 2009, will replace the 3 existing duties relating to race,
disability and gender with a single Equality Duty. This new duty will also extend to age, religion and belief, sexual orientation, gender reassignment and pregnancy and maternity. The new single Equality Duty is in 2 parts - a general duty, which is set out in the Equality Bill; and specific duties, which can be placed on
certain public authorities to ensure the better performance of the general duty. The specific duties are to be determined by Scottish ministers through consultation. The new general Equality Duty is expected to come into force around April 2011.
148
11 Key Issues for consideration for future SOA inclusion
Below are the issues that have been identified from the analysis for further discussion and possible inclusion in the next Single Outcome Agreement. Recommendations for action can be developed by partners depending on the outcome of discussions.
11.1 Moray’s Environment
11.1.1 Natural Environment
Apparent low uptake of some Rural Development funding streams o Food processing, Marketing and Co-operation Grant Scheme: Moray, 4
projects, £650,000; Aberdeenshire, 17 projects, £3.5 million. o Forestry Commission Challenge Funds: Moray, 2 applications, 1 successful
since withdrawn; Aberdeen City & Aberdeenshire made good use of funds for variety of projects.
o Rural Development Contracts: Rural Priorities – Moray‘s uptake approx 20% of Grampian. By area Moray accounts for about 26%, by population about 16%.
11.2 People and the Environment
11.2.1 Public Opinion
Reduction in concern for and understanding of Climate Change o % concerned about Climate Change (nationally) reduced from 82% in 2006
to 67% in 2009. o Understanding of Climate Change (nationally) reduced – % that know little or
nothing risen from 31% to 46%; % know fair amount or a lot fallen from 69% to 50%.
11.2.2 Ecotourism
Moray‘s potential as a tourist destination is not being maximised o Dolphin-watching – Tourist providers in Moray receive 14.2% of dolphin
tourist expenditure, compared with 61.3% in Highland.
Green Tourism Business Scheme membership lower per capita than other areas. o Moray – number of businesses per 10,000 population is 2.2%. o Highland – number of businesses per 10,000 population is 7.2%.
11.3 Transportation
11.3.1 Sustainable Transport
Development of bio-ethanol from whisky residue for greener fuel for heavy vehicles. o Project being developed through the Biofuels Business Programme o Being the heart of Scottish Whisky country, the development provides Moray
with a great opportunity to capitalize on a potential new environmentally-friendly product.
o From table 14 on p.86, the average percentage HGV traffic volume on the ten roads listed is about 11%.
149
11.3.2 Active Travel
A high proportion of short journeys to work are by car. o 68% of all journeys to work in Elgin are less than 2km and 75% are less than
5km. o More than 1/3 of all car trips are for journeys of less than 3km.
Implementation of Moray Core Paths Plan following approval by committee. o Council Budget savings are likely to have a major impact on the progress of
carrying out works on the paths to link up the network and upgrade and maintain them.
o The safety and usability of the Core Paths Network is therefore likely to be compromised by budget savings.
11.4 Waste
Waste Disposal Reduction Targets in accordance with the Zero Waste Plan o 50% recycling/composting by 2013 (SG target)
50% recycling/composting by 2015 (EU target) 60% recycling/composting by 2020 (SG target) 70% recycling/composting by weight and carbon metric by 2025 (SG target)
o Potential financial penalties for non-achievement – still awaiting confirmation o Landfill Tax, currently £48 per tonne, to rise by £8 per year.
11.5 Climate Change
11.5.1 Carbon Management and Energy Efficiency
Carbon Reduction Commitment requirements o Requires the purchase of allowances based on tonnes of CO2 emitted, price
per tonne CO2 still to be confirmed (intent prior to Spending Review in Oct 2010 was a fixed price of £12 per tonne).
o Scheme is a legal requirement with significant financial penalties for non-compliance.
Uptake of funding, support and advice available to individuals, communities and businesses regarding carbon emission reduction.
Increased energy consumption in industrial and commercial sector o Per capita CO2 emission estimates for industrial & commercial sector
50% higher than nationally (5.7kt compared with 3.8kt) Risen by 0.3kt 2005 to 2008.
o Energy consumption in industrial & commercial sector risen by 6% from 2005 to 2008, compared with a 6.7% reduction nationally.
o Energy consumption in domestic sector fallen by 1.5% compared with 5.4% nationally.
Lower energy efficiency in private sector dwellings o 63% of dwellings in Moray rated poor (0-2) or moderate (3-6) on National
Home Energy Rating scale, compare with 48% nationally. o 52% of private sector dwellings in Moray rated 0-5 compared with 27% of
public sector dwellings. National equivalents are 37% and 18% respectively.
11.5.2 Renewable Energy
Opportunities related to Offshore Wind developments

150
o Moray Offshore Renewables development – 260 turbines o Beatrice Offshore Wind Farm Ltd – 184 turbines o Expansion of Buckie Harbour to enable support and servicing of offshore
energy sector
Exploration of potential for biomass heating systems o Renewable Heat Incentive means biomass heating results in income,
repaying capital cost of boiler system in about 2yrs.
11.5.3 Flood Alleviation
Maintain momentum for the Forres (Findhorn & Pilmuir) FAS due to funding uncertainties
o £6 million spent to date on Forres (Findhorn & Pilmuir) FAS o Government grant funding uncertain at this time, under review.
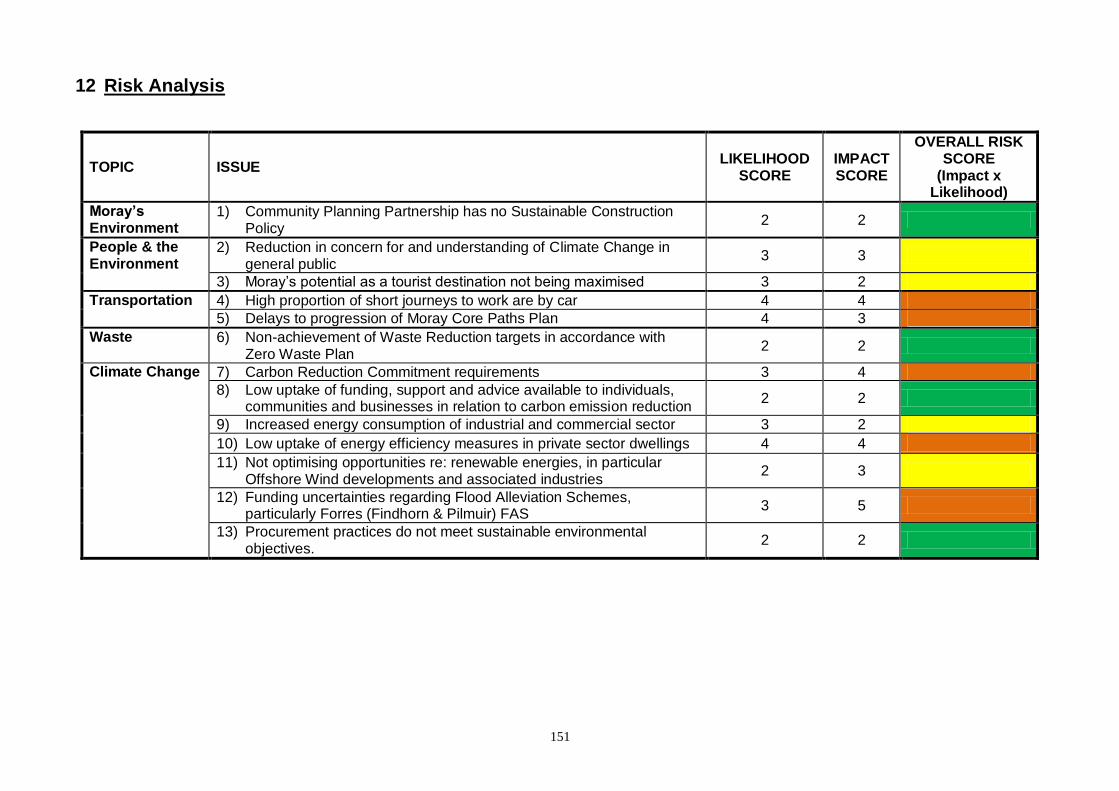
151
12 Risk Analysis
TOPIC ISSUE LIKELIHOOD
SCORE IMPACT SCORE
OVERALL RISK SCORE
(Impact x Likelihood)
Moray’s Environment
1) Community Planning Partnership has no Sustainable Construction Policy
2 2
People & the Environment
2) Reduction in concern for and understanding of Climate Change in general public
3 3
3) Moray‘s potential as a tourist destination not being maximised 3 2
Transportation 4) High proportion of short journeys to work are by car 4 4
5) Delays to progression of Moray Core Paths Plan 4 3
Waste 6) Non-achievement of Waste Reduction targets in accordance with Zero Waste Plan
2 2
Climate Change 7) Carbon Reduction Commitment requirements 3 4
8) Low uptake of funding, support and advice available to individuals, communities and businesses in relation to carbon emission reduction
2 2
9) Increased energy consumption of industrial and commercial sector 3 2
10) Low uptake of energy efficiency measures in private sector dwellings 4 4
11) Not optimising opportunities re: renewable energies, in particular Offshore Wind developments and associated industries
2 3
12) Funding uncertainties regarding Flood Alleviation Schemes, particularly Forres (Findhorn & Pilmuir) FAS
3 5
13) Procurement practices do not meet sustainable environmental objectives.
2 2
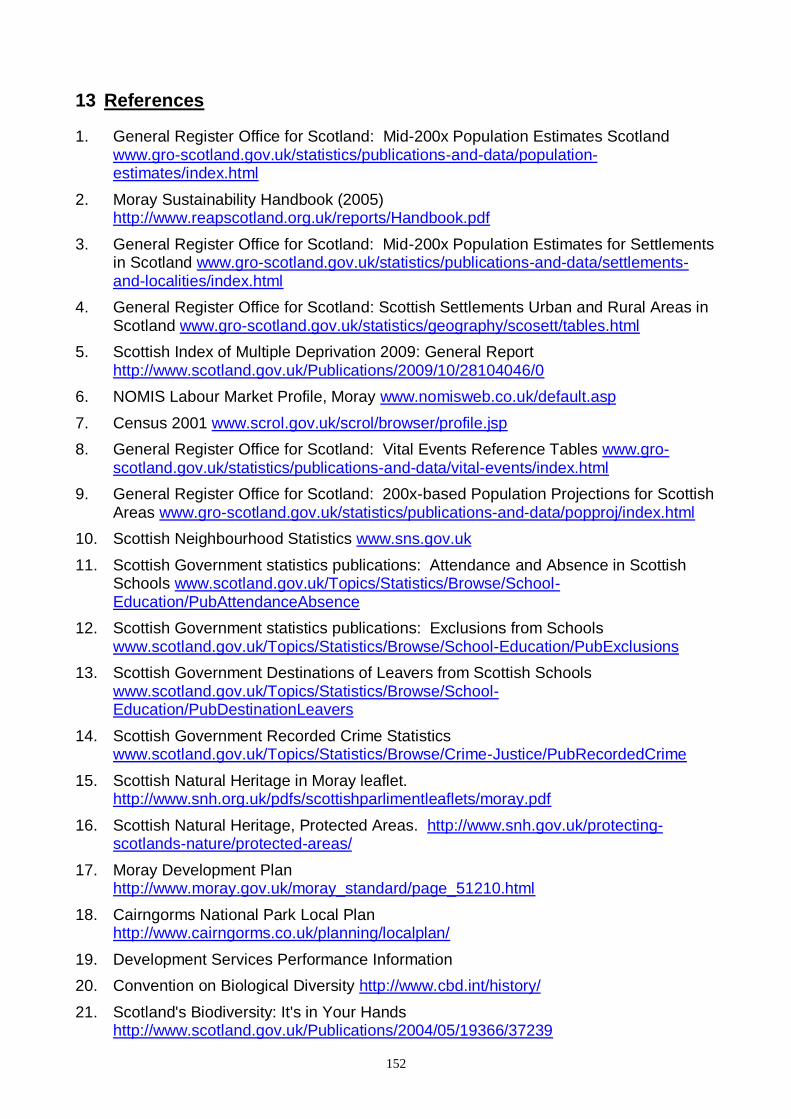
152
13 References
1. General Register Office for Scotland: Mid-200x Population Estimates Scotland www.gro-scotland.gov.uk/statistics/publications-and-data/population-estimates/index.html
2. Moray Sustainability Handbook (2005) http://www.reapscotland.org.uk/reports/Handbook.pdf
3. General Register Office for Scotland: Mid-200x Population Estimates for Settlements in Scotland www.gro-scotland.gov.uk/statistics/publications-and-data/settlements-and-localities/index.html
4. General Register Office for Scotland: Scottish Settlements Urban and Rural Areas in Scotland www.gro-scotland.gov.uk/statistics/geography/scosett/tables.html
5. Scottish Index of Multiple Deprivation 2009: General Report http://www.scotland.gov.uk/Publications/2009/10/28104046/0
6. NOMIS Labour Market Profile, Moray www.nomisweb.co.uk/default.asp
7. Census 2001 www.scrol.gov.uk/scrol/browser/profile.jsp
8. General Register Office for Scotland: Vital Events Reference Tables www.gro-scotland.gov.uk/statistics/publications-and-data/vital-events/index.html
9. General Register Office for Scotland: 200x-based Population Projections for Scottish Areas www.gro-scotland.gov.uk/statistics/publications-and-data/popproj/index.html
10. Scottish Neighbourhood Statistics www.sns.gov.uk
11. Scottish Government statistics publications: Attendance and Absence in Scottish Schools www.scotland.gov.uk/Topics/Statistics/Browse/School-Education/PubAttendanceAbsence
12. Scottish Government statistics publications: Exclusions from Schools www.scotland.gov.uk/Topics/Statistics/Browse/School-Education/PubExclusions
13. Scottish Government Destinations of Leavers from Scottish Schools www.scotland.gov.uk/Topics/Statistics/Browse/School-Education/PubDestinationLeavers
14. Scottish Government Recorded Crime Statistics www.scotland.gov.uk/Topics/Statistics/Browse/Crime-Justice/PubRecordedCrime
15. Scottish Natural Heritage in Moray leaflet. http://www.snh.org.uk/pdfs/scottishparlimentleaflets/moray.pdf
16. Scottish Natural Heritage, Protected Areas. http://www.snh.gov.uk/protecting-scotlands-nature/protected-areas/
17. Moray Development Plan http://www.moray.gov.uk/moray_standard/page_51210.html
18. Cairngorms National Park Local Plan http://www.cairngorms.co.uk/planning/localplan/
19. Development Services Performance Information
20. Convention on Biological Diversity http://www.cbd.int/history/
21. Scotland's Biodiversity: It's in Your Hands http://www.scotland.gov.uk/Publications/2004/05/19366/37239
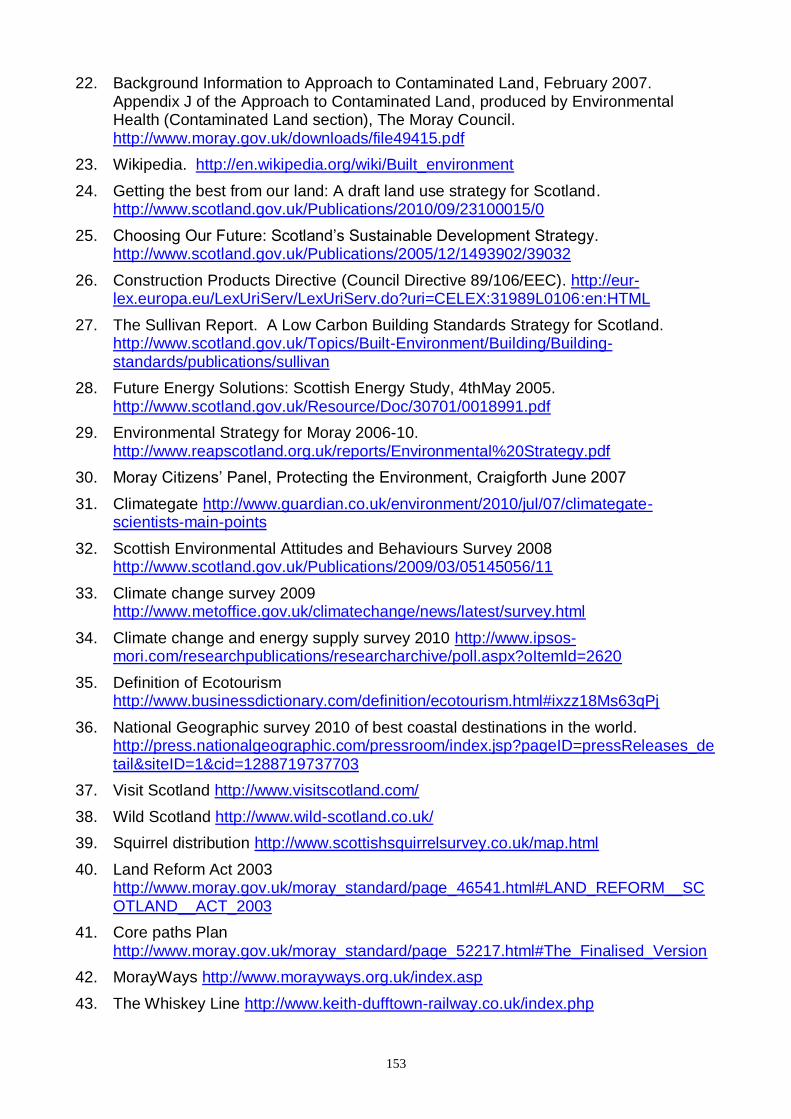
153
22. Background Information to Approach to Contaminated Land, February 2007. Appendix J of the Approach to Contaminated Land, produced by Environmental Health (Contaminated Land section), The Moray Council. http://www.moray.gov.uk/downloads/file49415.pdf
23. Wikipedia. http://en.wikipedia.org/wiki/Built_environment
24. Getting the best from our land: A draft land use strategy for Scotland. http://www.scotland.gov.uk/Publications/2010/09/23100015/0
25. Choosing Our Future: Scotland‘s Sustainable Development Strategy. http://www.scotland.gov.uk/Publications/2005/12/1493902/39032
26. Construction Products Directive (Council Directive 89/106/EEC). http://eur-lex.europa.eu/LexUriServ/LexUriServ.do?uri=CELEX:31989L0106:en:HTML
27. The Sullivan Report. A Low Carbon Building Standards Strategy for Scotland. http://www.scotland.gov.uk/Topics/Built-Environment/Building/Building-standards/publications/sullivan
28. Future Energy Solutions: Scottish Energy Study, 4thMay 2005. http://www.scotland.gov.uk/Resource/Doc/30701/0018991.pdf
29. Environmental Strategy for Moray 2006-10. http://www.reapscotland.org.uk/reports/Environmental%20Strategy.pdf
30. Moray Citizens‘ Panel, Protecting the Environment, Craigforth June 2007
31. Climategate http://www.guardian.co.uk/environment/2010/jul/07/climategate-scientists-main-points
32. Scottish Environmental Attitudes and Behaviours Survey 2008 http://www.scotland.gov.uk/Publications/2009/03/05145056/11
33. Climate change survey 2009 http://www.metoffice.gov.uk/climatechange/news/latest/survey.html
34. Climate change and energy supply survey 2010 http://www.ipsos-mori.com/researchpublications/researcharchive/poll.aspx?oItemId=2620
35. Definition of Ecotourism http://www.businessdictionary.com/definition/ecotourism.html#ixzz18Ms63qPj
36. National Geographic survey 2010 of best coastal destinations in the world. http://press.nationalgeographic.com/pressroom/index.jsp?pageID=pressReleases_detail&siteID=1&cid=1288719737703
37. Visit Scotland http://www.visitscotland.com/
38. Wild Scotland http://www.wild-scotland.co.uk/
39. Squirrel distribution http://www.scottishsquirrelsurvey.co.uk/map.html
40. Land Reform Act 2003 http://www.moray.gov.uk/moray_standard/page_46541.html#LAND_REFORM__SCOTLAND__ACT_2003
41. Core paths Plan http://www.moray.gov.uk/moray_standard/page_52217.html#The_Finalised_Version
42. MorayWays http://www.morayways.org.uk/index.asp
43. The Whiskey Line http://www.keith-dufftown-railway.co.uk/index.php
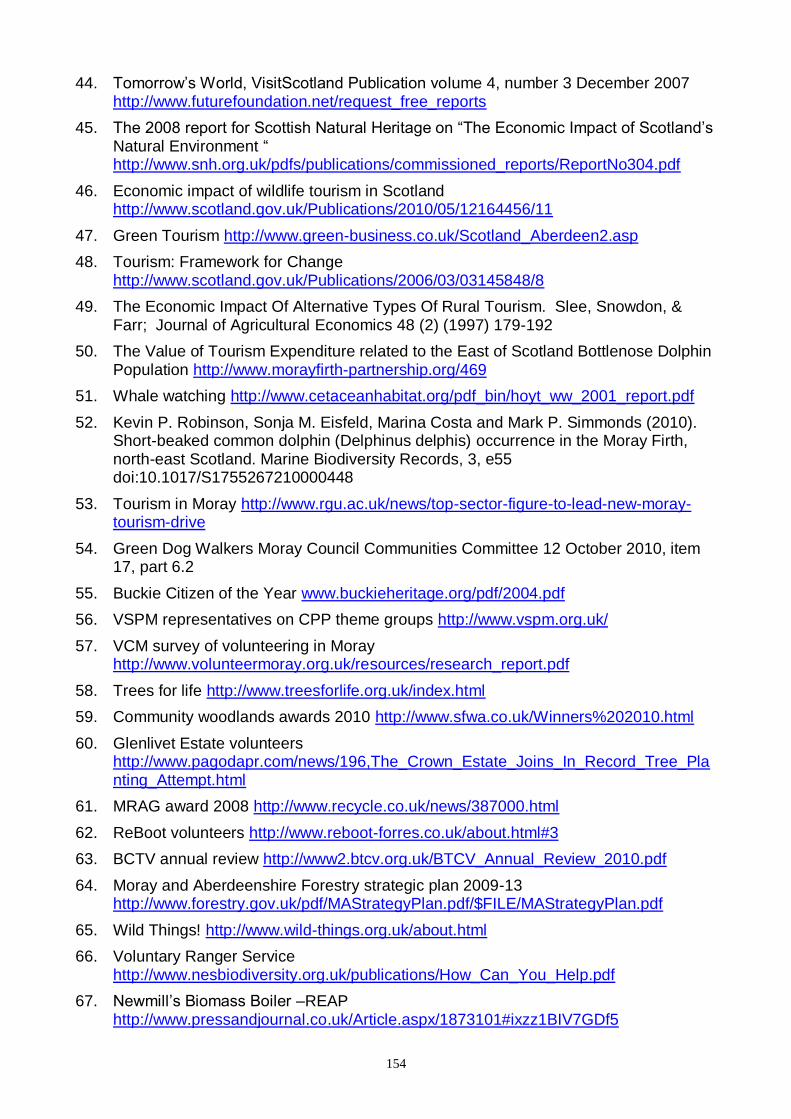
154
44. Tomorrow‘s World, VisitScotland Publication volume 4, number 3 December 2007 http://www.futurefoundation.net/request_free_reports
45. The 2008 report for Scottish Natural Heritage on ―The Economic Impact of Scotland‘s Natural Environment ― http://www.snh.org.uk/pdfs/publications/commissioned_reports/ReportNo304.pdf
46. Economic impact of wildlife tourism in Scotland http://www.scotland.gov.uk/Publications/2010/05/12164456/11
47. Green Tourism http://www.green-business.co.uk/Scotland_Aberdeen2.asp
48. Tourism: Framework for Change http://www.scotland.gov.uk/Publications/2006/03/03145848/8
49. The Economic Impact Of Alternative Types Of Rural Tourism. Slee, Snowdon, & Farr; Journal of Agricultural Economics 48 (2) (1997) 179-192
50. The Value of Tourism Expenditure related to the East of Scotland Bottlenose Dolphin Population http://www.morayfirth-partnership.org/469
51. Whale watching http://www.cetaceanhabitat.org/pdf_bin/hoyt_ww_2001_report.pdf
52. Kevin P. Robinson, Sonja M. Eisfeld, Marina Costa and Mark P. Simmonds (2010). Short-beaked common dolphin (Delphinus delphis) occurrence in the Moray Firth, north-east Scotland. Marine Biodiversity Records, 3, e55 doi:10.1017/S1755267210000448
53. Tourism in Moray http://www.rgu.ac.uk/news/top-sector-figure-to-lead-new-moray-tourism-drive
54. Green Dog Walkers Moray Council Communities Committee 12 October 2010, item 17, part 6.2
55. Buckie Citizen of the Year www.buckieheritage.org/pdf/2004.pdf
56. VSPM representatives on CPP theme groups http://www.vspm.org.uk/
57. VCM survey of volunteering in Moray http://www.volunteermoray.org.uk/resources/research_report.pdf
58. Trees for life http://www.treesforlife.org.uk/index.html
59. Community woodlands awards 2010 http://www.sfwa.co.uk/Winners%202010.html
60. Glenlivet Estate volunteers http://www.pagodapr.com/news/196,The_Crown_Estate_Joins_In_Record_Tree_Planting_Attempt.html
61. MRAG award 2008 http://www.recycle.co.uk/news/387000.html
62. ReBoot volunteers http://www.reboot-forres.co.uk/about.html#3
63. BCTV annual review http://www2.btcv.org.uk/BTCV_Annual_Review_2010.pdf
64. Moray and Aberdeenshire Forestry strategic plan 2009-13 http://www.forestry.gov.uk/pdf/MAStrategyPlan.pdf/$FILE/MAStrategyPlan.pdf
65. Wild Things! http://www.wild-things.org.uk/about.html
66. Voluntary Ranger Service http://www.nesbiodiversity.org.uk/publications/How_Can_You_Help.pdf
67. Newmill‘s Biomass Boiler –REAP http://www.pressandjournal.co.uk/Article.aspx/1873101#ixzz1BIV7GDf5
155
68. Ranger Events 2010 http://www.moray.gov.uk/area/speyway/webpages/rangerevents2010.pdf
69. BSc Honours degree course in Natural and Environmental http://www.moray.ac.uk/moray-college/what/course-detail.php?course=117
70. Forres HMIE report 2009 http://www.hmie.gov.uk/documents/inspection/ForresAcademyLC.pdf
71. Strategic Transport Projects Review, The Scottish Government (November 2009)
72. Low Carbon Scotland: The Draft report on Proposals and Policies: Scotland – A Low Carbon Society
73. Scottish Transport Statistics (2009)
74. Audit Scotland
75. The Moray Council: Draft Local Transport Strategy (April 2010). http://www.moray.gov.uk/downloads/file64607.pdf
76. Road Traffic Reduction Act (1997)
77. The Moray Council: Local Transport Strategy (2001)
78. Interim Stage 2 Report: Western Distributor Road (December 2010) www.moray.gov.uk/downloads/file69333.pdf
79. Economic Development and Infrastructure Services Committee 20th April 2010 Public Transport – Subsidised Bus Services
80. Travel and Transport Survey of Moray Moray Citizens Panel (2006)
81. The Moray Council Corporate Travel Plan, March 2009
82. Community Planning Board 9th December 2010 – Low Carbon Vehicle Procurement Support Scheme
83. Elgin Active Travel Audit (2009)
84. Economic Development and Infrastructure Services Committee, 14th December 2010. Elgin Town Centre Traffic Management Proposals and Urban Freedom Active Travel Infrastructure Improvements
85. LENNON data (www.rail-reg.gov.uk)
86. Scotland‘s zero waste plan, The Scottish Government 2010
87. The Waste Hierarchy, SEPA 2006
88. Waste Management – Relationship between Bulky Household Waste Collection and the Waste Electrical and Electronic Equipment regulations, Moray Council Economic Development & Infrastructure Services Committee 20th April 2010
89. Moray Council Draft Climate Change Action plan 2010
90. Landfill Allowance Scheme WasteDataFlow, SEPA www.sepa.org.uk/waste/waste_data/waste_data_reports/landfill_allowance_scheme.aspx
91. Audit Scotland 2009/10 Performance Results http://www.audit-scotland.gov.uk/performance/service/
92. Waste Management, Greener Strategic Group 15th April 2010
156
93. Waste Management – Progression of the Council‘s Waste Strategy, Moray Council Policy & Resources Committee 18th January 2011
94. Construction and demolition wastes in Scotland (2006) An estimation of the quantities and management of construction and demolition wastes managed across Scotland in 2006, SEPA (2008)
95. Local Authority CO2 emissions estimates 2008, Statistical Summary, 16 September 2010. http://www.decc.gov.uk/assets/decc/Statistics/climate_change/localAuthorityCO2/465-local-authority-co2-2008-stat-summary.pdf
96. IPCC Fourth Assessment Report: Climate Change 2007: Working Group 1: The Physical Science Basis
http://www.ipcc.ch/publications_and_data/ar4/wg1/en/contents.html
97. Local and regional CO2 emissions estimates for 2005-2008 – Full dataset. http://www.decc.gov.uk/Media/viewfile.ashx?FilePath=Statistics/climate_change/localAuthorityCO2/457-local-regional-co2-2005-2008-full-data.xls&filetype=4&minwidth=true
98. Carbon Reduction Commitment report, Policy and Resources Committee, 30th June 2009.
99. Wood Energy Deployment in Scottish Councils http://www.yourmoray.org.uk/DocumentLibrary/ThemeDocs/Greener/WoodEnergyDeploymentInScottishCouncilsFeb09.pdf
100. Flood Damage 1997 and 2002 http://www.morayperforms.org.uk/moray_standard/page_59135.html
101. Flood Damage 2009 http://www.pressandjournal.co.uk/Article.aspx/1383495
102. Scottish Sustainable Procurement Action Plan, Scottish Government 2009
103. Procurement of Sustainability, Sustainable Scotland Network http://www.sustainable-scotland.net/page.asp?pg=26
104. http://www.moray.gov.uk/moray_standard/page_52186.html
105. Green Procurement, Greener Strategic Group 21st January 2010
106. The Moray Council Procurement Strategy 2010-14
107. Air Quality Study in the Vicinity of RAF Lossiemouth and RAF Kinloss. A Report for Moray Council, Nov 2004. http://www.moray.gov.uk/moray_standard/page_42141.html
108. http://ads.ahds.ac.uk/catalogue/adsdata/PSAS_2002/pdf/vol_121/121_017_025.pdf
109. http://www.forestry.gov.uk/forestry/INFD-77FDDT
110. Fishing Boats and Fisher Folk of the North East of Scotland Peter. F. Anson 1930, 3rd edition J.M Dent & Sons 1974
111. http://www.moray.gov.uk/downloads/file61319.pdf
112. http://ads.ahds.ac.uk/catalogue/adsdata/PSAS_2002/pdf/vol_108/108_332_365.pdf
113. http://www.visitoruk.com/timeline.php?id=532&f=Buckie

157
14 Appendices
14.1 Appendix 1 - Scottish Government Strategic Approach
Purpose targets
Economic Growth (GDP)
To raise the GDP growth rate to the UK level by 2011 To match the GDP growth rate of the small independent EU countries by 2017
Productivity To rank in the top quartile for productivity against our key trading partners in the OECD by 2017
Participation To maintain our position on labour market participation as the top performing country in the UK To close the gap with the top five OECD economies by 2017
Population To match average European (EU15) population growth over the period from 2007 to 2017 Supported by increased healthy life expectancy in Scotland over the period from 2007 to 2017
Solidarity To increase overall income and the proportion of income earned by the three lowest income deciles as a group by 2017
Cohesion To narrow the gap in participation between Scotland's best and worst performing regions by 2017
Sustainability To reduce emissions over the period to 2011 To reduce emissions by 80 percent by 2050
Strategic Objectives
Wealthier and Fairer Enable businesses and people to increase their wealth and more people to share fairly in that wealth. Safer and Stronger Help local communities to flourish, becoming stronger, safer place to live, offering improved opportunities and a better quality of life.

158
Smarter Expand opportunities for Scots to succeed from nurture through to life long learning ensuring higher and more widely shared achievements.
Greener Improve Scotland's natural and built environment and the sustainable use and enjoyment of it. Healthier Help people to sustain and improve their health, especially in disadvantaged communities, ensuring better, local and faster access to health care.
National Outcomes
1
We live in a Scotland that is the most attractive place for doing business in Europe.
2
We realise our full economic potential with more and better employment opportunities for our people.
3
We are better educated, more skilled and more successful, renowned for our research and innovation.
4
Our young people are successful learners, confident individuals, effective contributors and responsible citizens.
5
Our children have the best start in life and are ready to succeed.
6
We live longer, healthier lives.
7
We have tackled the significant inequalities in Scottish society.
8
We have improved the life chances for children, young people and families at risk.
9
We live our lives safe from crime, disorder and danger.
10
We live in well-designed, sustainable places where we are able to access the amenities and services we need.
11
We have strong, resilient and supportive communities where people take responsibility for their own actions and how they affect others.

159
12
We value and enjoy our built and natural environment and protect it and enhance it for future generations.
13
We take pride in a strong, fair and inclusive national identity.
14
We reduce the local and global environmental impact of our consumption and production.
15
Our public services are high quality, continually improving, efficient and responsive to local people‘s needs.
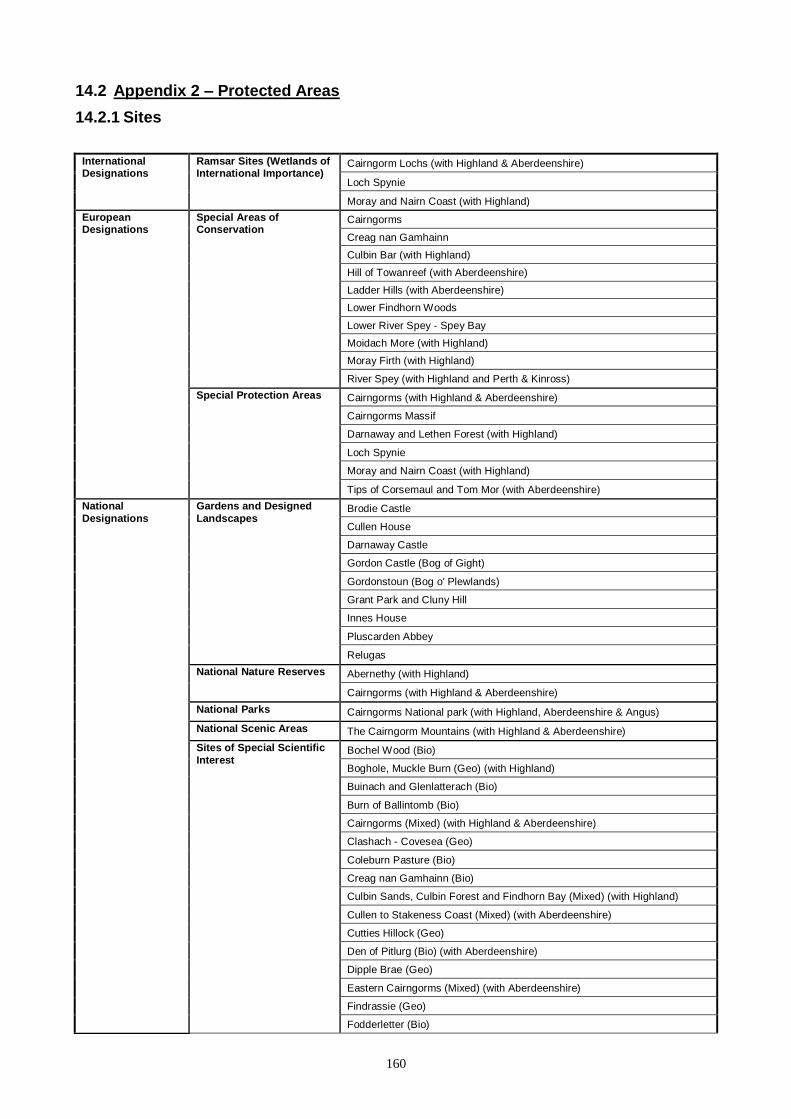
160
14.2 Appendix 2 – Protected Areas
14.2.1 Sites
International Designations
Ramsar Sites (Wetlands of International Importance)
Cairngorm Lochs (with Highland & Aberdeenshire)
Loch Spynie
Moray and Nairn Coast (with Highland)
European Designations
Special Areas of Conservation
Cairngorms
Creag nan Gamhainn
Culbin Bar (with Highland)
Hill of Towanreef (with Aberdeenshire)
Ladder Hills (with Aberdeenshire)
Lower Findhorn Woods
Lower River Spey - Spey Bay
Moidach More (with Highland)
Moray Firth (with Highland)
River Spey (with Highland and Perth & Kinross)
Special Protection Areas Cairngorms (with Highland & Aberdeenshire)
Cairngorms Massif
Darnaway and Lethen Forest (with Highland)
Loch Spynie
Moray and Nairn Coast (with Highland)
Tips of Corsemaul and Tom Mor (with Aberdeenshire)
National
Designations
Gardens and Designed
Landscapes Brodie Castle
Cullen House
Darnaway Castle
Gordon Castle (Bog of Gight)
Gordonstoun (Bog o' Plewlands)
Grant Park and Cluny Hill
Innes House
Pluscarden Abbey
Relugas
National Nature Reserves Abernethy (with Highland)
Cairngorms (with Highland & Aberdeenshire)
National Parks Cairngorms National park (with Highland, Aberdeenshire & Angus)
National Scenic Areas The Cairngorm Mountains (with Highland & Aberdeenshire)
Sites of Special Scientific
Interest Bochel Wood (Bio)
Boghole, Muckle Burn (Geo) (with Highland)
Buinach and Glenlatterach (Bio)
Burn of Ballintomb (Bio)
Cairngorms (Mixed) (with Highland & Aberdeenshire)
Clashach - Covesea (Geo)
Coleburn Pasture (Bio)
Creag nan Gamhainn (Bio)
Culbin Sands, Culbin Forest and Findhorn Bay (Mixed) (with Highland)
Cullen to Stakeness Coast (Mixed) (with Aberdeenshire)
Cutties Hillock (Geo)
Den of Pitlurg (Bio) (with Aberdeenshire)
Dipple Brae (Geo)
Eastern Cairngorms (Mixed) (with Aberdeenshire)
Findrassie (Geo)
Fodderletter (Bio)
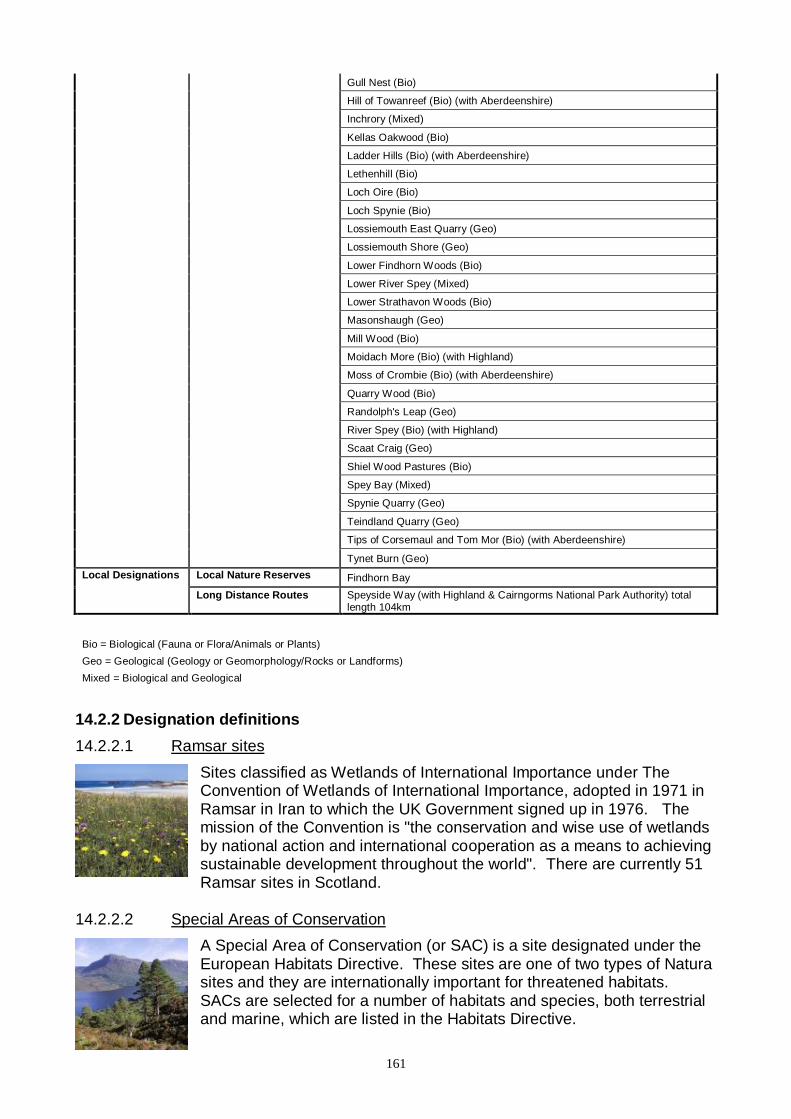
161
Gull Nest (Bio)
Hill of Towanreef (Bio) (with Aberdeenshire)
Inchrory (Mixed)
Kellas Oakwood (Bio)
Ladder Hills (Bio) (with Aberdeenshire)
Lethenhill (Bio)
Loch Oire (Bio)
Loch Spynie (Bio)
Lossiemouth East Quarry (Geo)
Lossiemouth Shore (Geo)
Lower Findhorn Woods (Bio)
Lower River Spey (Mixed)
Lower Strathavon Woods (Bio)
Masonshaugh (Geo)
Mill Wood (Bio)
Moidach More (Bio) (with Highland)
Moss of Crombie (Bio) (with Aberdeenshire)
Quarry Wood (Bio)
Randolph's Leap (Geo)
River Spey (Bio) (with Highland)
Scaat Craig (Geo)
Shiel Wood Pastures (Bio)
Spey Bay (Mixed)
Spynie Quarry (Geo)
Teindland Quarry (Geo)
Tips of Corsemaul and Tom Mor (Bio) (with Aberdeenshire)
Tynet Burn (Geo)
Local Designations Local Nature Reserves Findhorn Bay
Long Distance Routes Speyside Way (with Highland & Cairngorms National Park Authority) total length 104km
Bio = Biological (Fauna or Flora/Animals or Plants) Geo = Geological (Geology or Geomorphology/Rocks or Landforms)
Mixed = Biological and Geological
14.2.2 Designation definitions
14.2.2.1 Ramsar sites
Sites classified as Wetlands of International Importance under The Convention of Wetlands of International Importance, adopted in 1971 in Ramsar in Iran to which the UK Government signed up in 1976. The mission of the Convention is "the conservation and wise use of wetlands by national action and international cooperation as a means to achieving sustainable development throughout the world". There are currently 51 Ramsar sites in Scotland.
14.2.2.2 Special Areas of Conservation
A Special Area of Conservation (or SAC) is a site designated under the European Habitats Directive. These sites are one of two types of Natura sites and they are internationally important for threatened habitats. SACs are selected for a number of habitats and species, both terrestrial and marine, which are listed in the Habitats Directive.
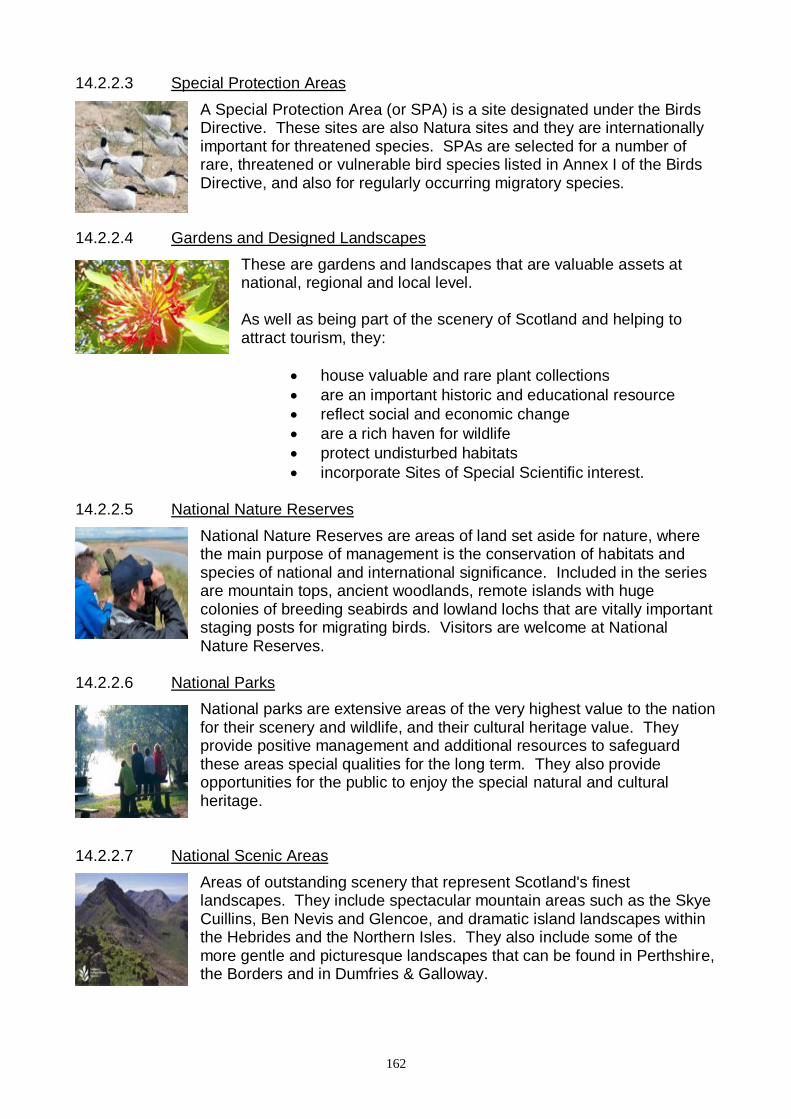
162
14.2.2.3 Special Protection Areas
A Special Protection Area (or SPA) is a site designated under the Birds Directive. These sites are also Natura sites and they are internationally important for threatened species. SPAs are selected for a number of rare, threatened or vulnerable bird species listed in Annex I of the Birds Directive, and also for regularly occurring migratory species.
14.2.2.4 Gardens and Designed Landscapes
These are gardens and landscapes that are valuable assets at national, regional and local level. As well as being part of the scenery of Scotland and helping to attract tourism, they:
house valuable and rare plant collections
are an important historic and educational resource
reflect social and economic change
are a rich haven for wildlife
protect undisturbed habitats
incorporate Sites of Special Scientific interest. 14.2.2.5 National Nature Reserves
National Nature Reserves are areas of land set aside for nature, where the main purpose of management is the conservation of habitats and species of national and international significance. Included in the series are mountain tops, ancient woodlands, remote islands with huge colonies of breeding seabirds and lowland lochs that are vitally important staging posts for migrating birds. Visitors are welcome at National Nature Reserves.
14.2.2.6 National Parks
National parks are extensive areas of the very highest value to the nation for their scenery and wildlife, and their cultural heritage value. They provide positive management and additional resources to safeguard these areas special qualities for the long term. They also provide opportunities for the public to enjoy the special natural and cultural heritage.
14.2.2.7 National Scenic Areas
Areas of outstanding scenery that represent Scotland's finest landscapes. They include spectacular mountain areas such as the Skye Cuillins, Ben Nevis and Glencoe, and dramatic island landscapes within the Hebrides and the Northern Isles. They also include some of the more gentle and picturesque landscapes that can be found in Perthshire, the Borders and in Dumfries & Galloway.
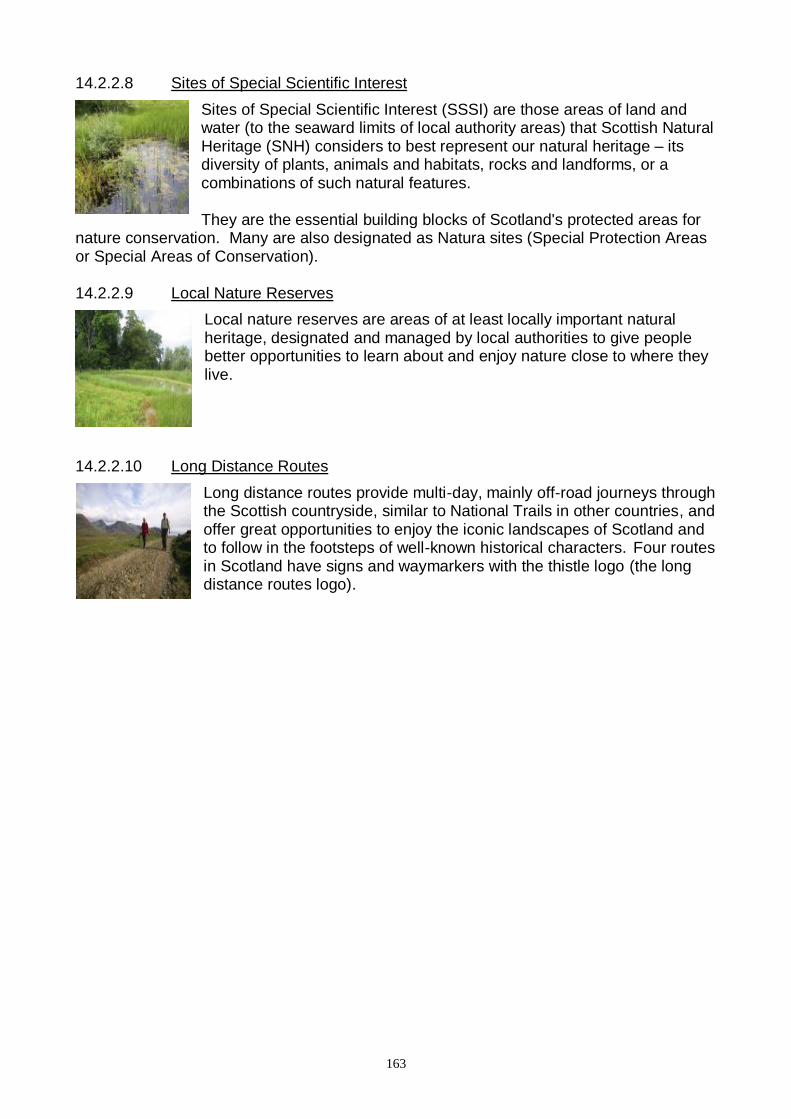
163
14.2.2.8 Sites of Special Scientific Interest
Sites of Special Scientific Interest (SSSI) are those areas of land and water (to the seaward limits of local authority areas) that Scottish Natural Heritage (SNH) considers to best represent our natural heritage – its diversity of plants, animals and habitats, rocks and landforms, or a combinations of such natural features. They are the essential building blocks of Scotland's protected areas for
nature conservation. Many are also designated as Natura sites (Special Protection Areas or Special Areas of Conservation). 14.2.2.9 Local Nature Reserves
Local nature reserves are areas of at least locally important natural heritage, designated and managed by local authorities to give people better opportunities to learn about and enjoy nature close to where they live.
14.2.2.10 Long Distance Routes
Long distance routes provide multi-day, mainly off-road journeys through the Scottish countryside, similar to National Trails in other countries, and offer great opportunities to enjoy the iconic landscapes of Scotland and to follow in the footsteps of well-known historical characters. Four routes in Scotland have signs and waymarkers with the thistle logo (the long distance routes logo).

164
14.3 Appendix 3 – Register of Protected Water areas
Category Sub-Category Protected Area
Freshwater Fish Waters River Deveron o Source to Black Water confl o Black Water to Huntly o Huntly to Turriff
River Findhorn o Tomatin to Dorback Burn o Dorback Burn to sea
River Lossie o Upper catchment o Leanoch Burn to Mosstowie Canal o Mosstowie Canal to Waukmill o Waukmill to Arthurs Bridge
River Spey o R. Nethy to R. Avon o R. Avon to R. Fiddich o R. Fiddich to tidal limit
Muckle Burn o Lethen to Speedie burn o D/s Speedie Burn
Bathing Waters Cullen Bay
Findhorn
Lossiemouth (East)
Drinking Water Surface Water Leanoch Burn o Upper catchment
River Isla o Source to Keith
River Deveron o Black Water to Huntly o Huntly to Turriff
Groundwater Buchie bedrock and localised sand and gravel aquifers
Dorback Valley Sand & Gravel
Dufftown
Elgin bedrock and localised sand and gravel aquifers
Findhorn bedrock and localised sand and gravel aquifers
Fochabers bedrock and localised sand and gravel aquifers
Forres bedrock and localised sand and gravel aquifers
Glenlivet
Huntly Sand & Gravel
Inverharroch
Isla Valley Sand & Gravel
Keith
Lower Spey Valley Sand & Gravel
Macduff
Middle Deveron Valley Sand & Gravel
Newlands of Fleenas Sand & Gravel
Rhynie
Strathdon
Tomintoul
Upper Black Burn Sand & Gravel
Upper Dee bedrock and localised sand and gravel aquifers
Upper Lossie Valley Sand & Gravel

165
Upper Spey bedrock and localised sand and gravel aquifers
Upper Spey Valley Sand & Gravel
Nutrient Sensitive Areas Nitrate Vulnerable Zones Moray Coast stretching about 20km inland
Urban Waste Water Treatment sites
Black Water
Boyne Burn (including Burn of Corncairn)
Fordyce burn
River Deveron o Source to Black Water confl. o Black Water to Huntly o Huntly to Turriff
River Isla o Source to Keith o Keith to Shiel Burn o D/s Shiel Burn
River Lossie o Upper catchment o Leanoch Burn to Mosstowie Canal o Mosstowie Canal to Waukmill o Waukmill to Arthurs Bridge
Nature Conservation Sites
Special Areas of Conservation Cairngorms
Creag nan Gamhainn
Culbin Bar
Ladder Hills
Lower Findhorn Woods
Lower River Spey - Spey Bay
Moidach More
Moray Firth
River Spey
166
14.4 Appendix 4 – Climate Change Policy / Legislation
14.4.1 United Nations Framework Convention on Climate Change
The United Nations Framework Convention on Climate Change (UNFCCC) was opened for signature in the Rio de Janeiro Summit in 1992 and entered into force in 1994. It was heavily influenced by the findings of the first IPCC Assessment Report of 1990. The Convention recognises that greenhouse gas emissions can adversely impact upon our climate. It aims to encourage international governments to work together to achieve a stable and non-dangerous level of greenhouse gas concentrations. Industrialised nations are given most of the responsibility for cutting greenhouse gas emissions and for funding efforts in less industrialised nations. This is because they have been – and continue to be – the source of most greenhouse gas emissions. The Convention enjoys near universal membership – 192 countries have ratified it.
Under the Convention, governments are expected to:
Share information: About emissions levels, national policies and best practices.
Reduce emissions: Developing national strategies, including support for developing countries.
Prepare for climate change: Governments should co-operate to deal with the impacts of climate change.
The Convention is a "framework" document, and can be amended or augmented over time. The first addition to the treaty, the Kyoto Protocol, was adopted in 1997.
14.4.2 The Kyoto Protocol
The Kyoto Protocol set legally-binding targets for developed countries to reduce greenhouse gas (GHG) emissions. It also provided flexible mechanisms to stimulate investment in developing countries. The Protocol‘s targets for reducing greenhouse gas (GHG) emissions in developed countries amount to a 5% reduction from 1990 levels, to be met over the five-year period 2008-2012. They place a higher burden on developed countries because they have historically been responsible for most of the greenhouse gas (GHG) emissions in the atmosphere. Developed countries must meet their targets primarily through national measures although there are three market-based mechanisms that can be used:
Emissions Trading
Clean Development Mechanism
Joint Implementation (For more detail see http://www.carbontrust.co.uk/policy-legislation/international-
frameworks/pages/kyoto-protocol.aspx). Under the Kyoto Protocol, countries‘ actual emissions have to be monitored and precise records have to be kept of any trades using the mechanisms above. There is also an Adaptation Fund to help developing countries (that are Parties to the Protocol) to adapt to the adverse effects of climate change.
167
By the end of 2012, a new international ratified framework is needed to deliver the large emission reductions that the IPCC says are necessary. The Kyoto Protocol is linked to the UNFCCC, the major difference is that the Protocol commits countries to action, where the Convention did not. It became legally-binding on 16 February 2005, after more than 55 Parties to the Convention had ratified the Protocol (including countries responsible for at least 55% of industrialised countries CO2 emissions in 1990). 184 Parties of the Convention have ratified the Kyoto Protocol to date.
14.4.3 European Union Policy
The European Union has set targets and policies that extend beyond the original ambition of the Kyoto Protocol. 14.4.3.1 The European Climate Change Programme
The European Climate change Programme (ECCP) outlines a climate change strategy to help prevent temperatures from increasing to more than 2°C above pre-industrial levels. The ECCP‘s strategy – agreed by the Council of Ministers in Spring 2007 – sets three targets to be reached by 2020:
Greenhouse gas emissions: Cut by 20% from 1990 levels (or by 30% in the event of an adequate international agreement).
Energy efficiency: Improve by 20%.
Energy from renewable sources: Increase to 20% of all energy. To achieve these targets, different policy measures have been adopted, in particular the EU Emissions Trading Scheme and various regulations and standards, including the Renewables Directive and Energy Performance in Buildings Directive. 14.4.3.2 EU Emissions Trading Scheme
The EU Emissions Trading Scheme (EU ETS) puts a cap on the carbon dioxide (CO2) emitted by business and creates a market and price for carbon allowances. It covers 45% of EU emissions, including energy intensive sectors and approximately 12,000 installations. The scheme started in 2005 in order to help the EU meet its targets under the Kyoto Protocol. It is the world's largest carbon-trading scheme. It provides an incentive for installations to reduce their carbon emissions, because they can then sell their surplus allowances. Installations are included in the scheme on the basis of their Carbon Dioxide (CO2) emitting activities. Industries that are covered include:
Electricity generation
Iron & steel
Mineral processing (for example: cement manufacture)
Pulp and paper processing The scheme is currently in Phase II, which runs from 2008-2012 (the commitment period of the Kyoto Protocol). During this phase, every EU member state:
168
1. Developed a National Allocation Plan: proposed a cap on total emissions from eligible installations and had it agreed by European Commission
2. Distributes allocations: cap converted to allowances (EUAs) (1 tonne of CO2 = 1 EUA) and distributed according to plan. Up to 10% of EUAs may be auctioned.
3. Operates the scheme: installations monitor and report verified carbon emissions, surrendering sufficient EUAs at end of year to cover emissions. Can buy extra or sell surplus. Joint Implementation (JI) and Clean Development Mechanism (CDM) credits can be used within the scheme,
Phase III will start in 2013 and run until 2020. The biggest changes in Phase III will be:
Design: Scheme will be designed at a European level, rather than by each country individually.
‗Cap‘ will reduce over time: By at least 1.74% a year, so that emissions in 2020 will be at least 21% below their level in 2005
More will be covered: Scheme will include the production of all metals (including Aluminium) and potentially aviation. For some sectors, it will include the emission of other greenhouse gases in addition to carbon dioxide.
Allowances: Much greater proportion of allowances will be auctioned (rather than given to installations). Use of Clean Development Mechanism (CDM) allowances will be more tightly restricted
14.4.3.3 Climate Change Levy and Agreements
The Climate Change Levy (CCL) is a charge on energy usage for business and the public sector introduced to encourage energy efficiency. Climate Change Agreements (CCAs) allow energy intensive organisations a discount on the levy if they achieve energy efficiency targets. 14.4.3.3.1 Climate Change Levy
The Climate Change Levy (CCL) came into effect in 2001 to encourage improved energy efficiency and reduced greenhouse gas emissions. The levy does not apply to the domestic, transport or energy sectors or to selected energy sources such as renewable electricity. 14.4.3.3.2 Climate Change Agreements
To help energy-intensive organisations, the Government has negotiated Climate Change Agreements (CCAs) in some sectors. These agreements give organisations an 80% discount from the Climate Change Levy, as long as they reach additional CO2 reduction targets. There are currently ten major energy intensive sectors and over thirty smaller sectors with agreements. The major sectors are:
Aluminium Cement Ceramics Chemicals Food & drink Foundries Glass Non-ferrous metals Paper Steel

169
14.4.3.4 EU Renewables Directive
The EU Renewable Energy Directive sets targets for the amount of energy each Member State should get from renewable sources. The EU‘s overall target (set in January 2008) is for 20% of its energy to come from renewable sources by 2020. 14.4.3.5 EU energy performance in buildings directive
The principal objectives of the Directive are to promote:
Measurement & inspection: Introduction of agreed measurements of relative energy performance and the requirement for regular inspections and re-evaluations.
Standards: Requiring higher standards for upgrading larger buildings and also improving standards for new buildings so they converge towards those of Member States with ambitious levels.

170
14.5 Appendix 5 – 10 Energy Pledges
PLEDGE 1: We will support and accelerate the implementation of renewable energy, through our Renewable Energy Action Plan, in a way which promotes large scale, community based, decentralised and sustainable generation.
PLEDGE 2: We will aim to build a commercially viable, diverse renewable heat industry in
Scotland to deliver benefits to the wider public, through the implementation of our Renewable Heat Action Plan
PLEDGE 3: We will work with the oil and gas sector to maintain its competitiveness, facilitate the transfer of skills and knowledge to other sectors and utilise Scottish based skills in world markets.
PLEDGE 4: We will enhance our capability to undertake energy and environmental
foresight, and develop our preparedness to anticipate and respond to threats and take advantage of opportunities.
PLEDGE 5: We will support development and implementation of clean fossil fuel technologies in Scotland, through collaboration with academia, industry and other interested parties.
PLEDGE 6: We will support the development of sub-sea grids, alongside improvements in
the onshore grids, and press the UK Government for fairer charging structures.
PLEDGE 7: We will implement measures to improve Scotland's energy use through the
Energy Efficiency Action Plan, which is a key part of the Scottish Government's Climate Change Bill.
PLEDGE 8: We will develop and deliver more sustainable transport to improve efficiency and reduce transport emissions in the longer term.
PLEDGE 9: We will promote the development, uptake and use of electric and other low carbon vehicles, in addition to using improvements in vehicle engineering which are already available.
PLEDGE 10: We will work to develop international partnerships through the Saltire Prize
and the Scottish European Green Energy Centre to make Scotland a leader in the development and deployment of green energy.
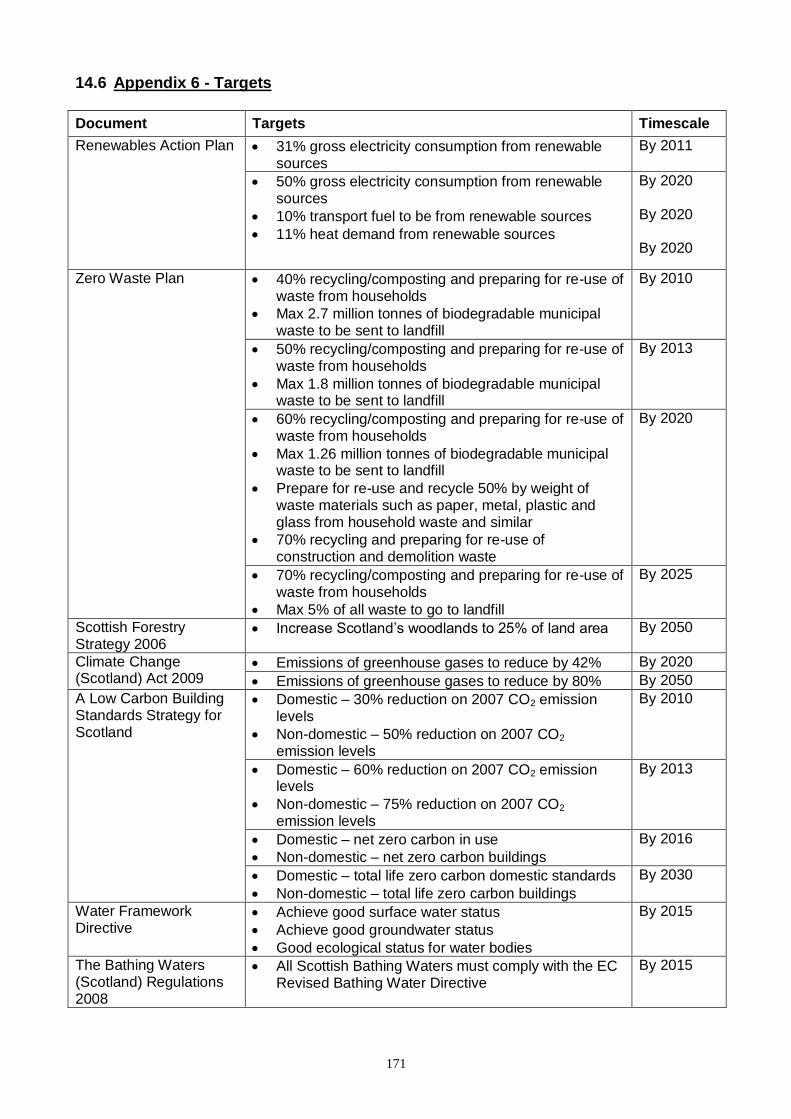
171
14.6 Appendix 6 - Targets
Document Targets Timescale
Renewables Action Plan 31% gross electricity consumption from renewable sources
By 2011
50% gross electricity consumption from renewable sources
10% transport fuel to be from renewable sources
11% heat demand from renewable sources
By 2020 By 2020 By 2020
Zero Waste Plan 40% recycling/composting and preparing for re-use of waste from households
Max 2.7 million tonnes of biodegradable municipal waste to be sent to landfill
By 2010
50% recycling/composting and preparing for re-use of waste from households
Max 1.8 million tonnes of biodegradable municipal waste to be sent to landfill
By 2013
60% recycling/composting and preparing for re-use of waste from households
Max 1.26 million tonnes of biodegradable municipal waste to be sent to landfill
Prepare for re-use and recycle 50% by weight of waste materials such as paper, metal, plastic and glass from household waste and similar
70% recycling and preparing for re-use of construction and demolition waste
By 2020
70% recycling/composting and preparing for re-use of waste from households
Max 5% of all waste to go to landfill
By 2025
Scottish Forestry Strategy 2006
Increase Scotland‘s woodlands to 25% of land area By 2050
Climate Change (Scotland) Act 2009
Emissions of greenhouse gases to reduce by 42% By 2020
Emissions of greenhouse gases to reduce by 80% By 2050
A Low Carbon Building Standards Strategy for Scotland
Domestic – 30% reduction on 2007 CO2 emission levels
Non-domestic – 50% reduction on 2007 CO2 emission levels
By 2010
Domestic – 60% reduction on 2007 CO2 emission levels
Non-domestic – 75% reduction on 2007 CO2 emission levels
By 2013
Domestic – net zero carbon in use
Non-domestic – net zero carbon buildings
By 2016
Domestic – total life zero carbon domestic standards
Non-domestic – total life zero carbon buildings
By 2030
Water Framework Directive
Achieve good surface water status
Achieve good groundwater status
Good ecological status for water bodies
By 2015
The Bathing Waters (Scotland) Regulations 2008
All Scottish Bathing Waters must comply with the EC Revised Bathing Water Directive
By 2015
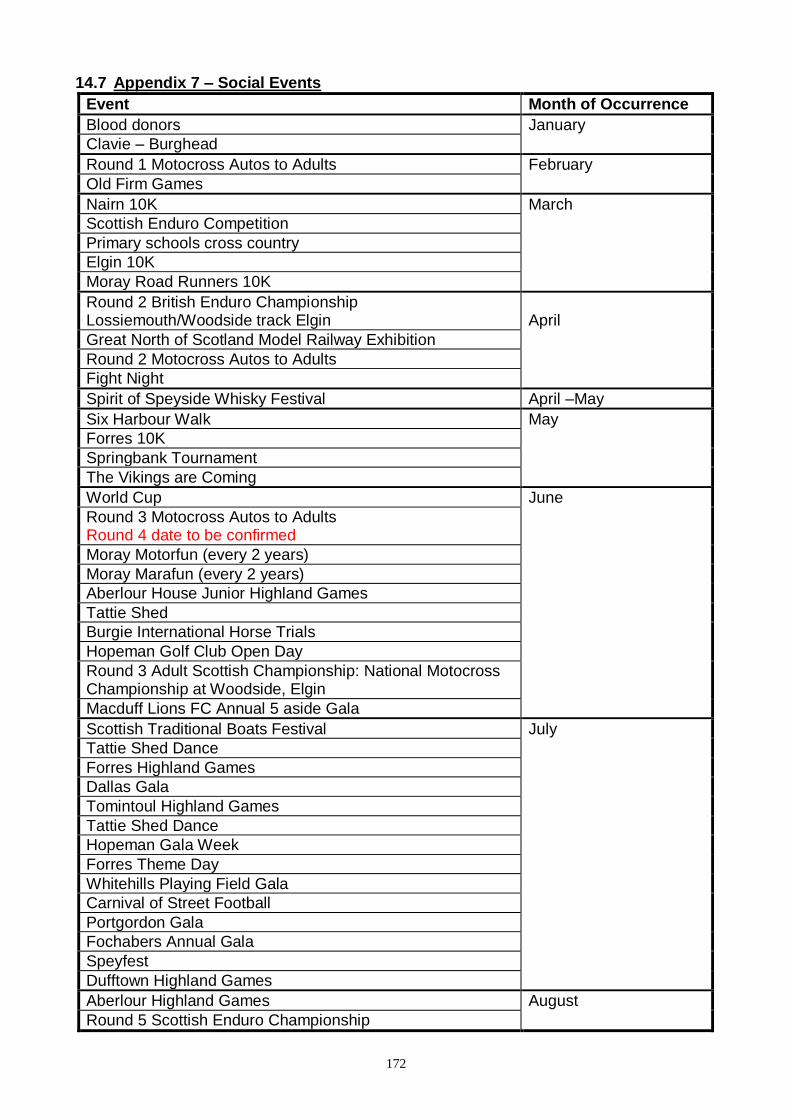
172
14.7 Appendix 7 – Social Events
Event Month of Occurrence
Blood donors January
Clavie – Burghead
Round 1 Motocross Autos to Adults February
Old Firm Games
Nairn 10K March
Scottish Enduro Competition
Primary schools cross country
Elgin 10K
Moray Road Runners 10K
Round 2 British Enduro Championship Lossiemouth/Woodside track Elgin
April
Great North of Scotland Model Railway Exhibition
Round 2 Motocross Autos to Adults
Fight Night
Spirit of Speyside Whisky Festival April –May
Six Harbour Walk May
Forres 10K
Springbank Tournament
The Vikings are Coming
World Cup June
Round 3 Motocross Autos to Adults Round 4 date to be confirmed
Moray Motorfun (every 2 years)
Moray Marafun (every 2 years)
Aberlour House Junior Highland Games
Tattie Shed
Burgie International Horse Trials
Hopeman Golf Club Open Day
Round 3 Adult Scottish Championship: National Motocross Championship at Woodside, Elgin
Macduff Lions FC Annual 5 aside Gala
Scottish Traditional Boats Festival July
Tattie Shed Dance
Forres Highland Games
Dallas Gala
Tomintoul Highland Games
Tattie Shed Dance
Hopeman Gala Week
Forres Theme Day
Whitehills Playing Field Gala
Carnival of Street Football
Portgordon Gala
Fochabers Annual Gala
Speyfest
Dufftown Highland Games
Aberlour Highland Games August
Round 5 Scottish Enduro Championship
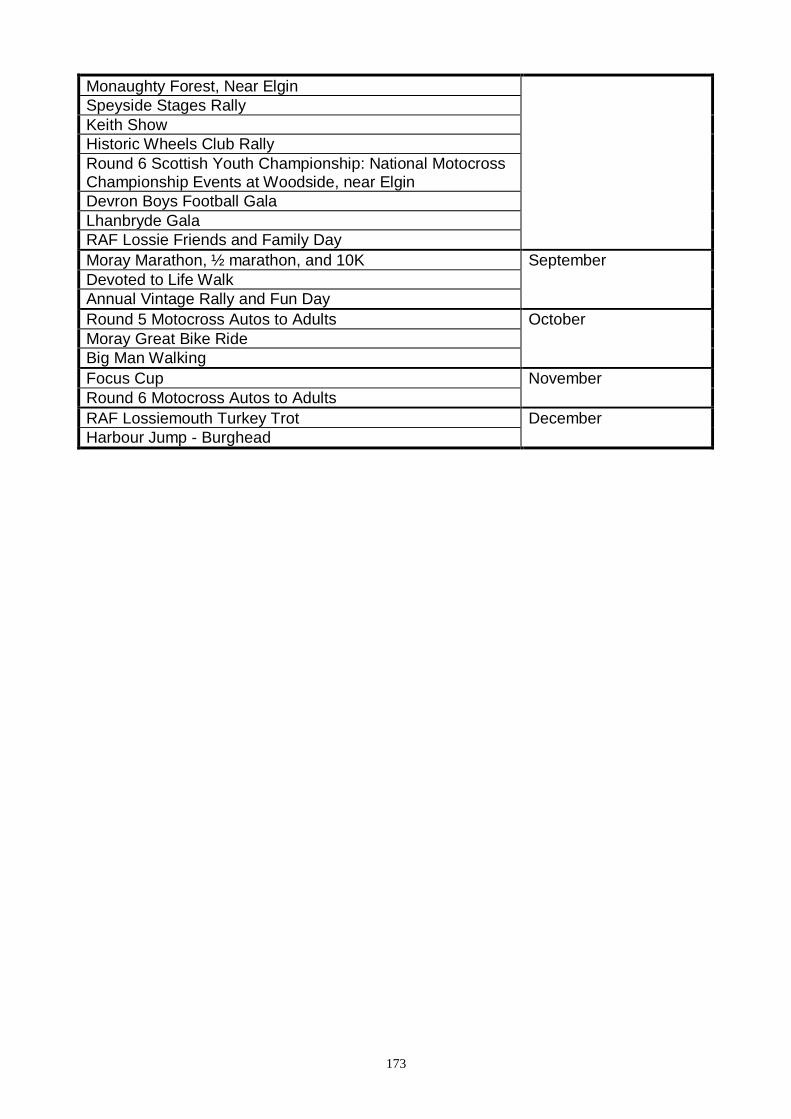
173
Monaughty Forest, Near Elgin
Speyside Stages Rally
Keith Show
Historic Wheels Club Rally
Round 6 Scottish Youth Championship: National Motocross Championship Events at Woodside, near Elgin
Devron Boys Football Gala
Lhanbryde Gala
RAF Lossie Friends and Family Day
Moray Marathon, ½ marathon, and 10K September
Devoted to Life Walk
Annual Vintage Rally and Fun Day
Round 5 Motocross Autos to Adults October
Moray Great Bike Ride
Big Man Walking
Focus Cup November
Round 6 Motocross Autos to Adults
RAF Lossiemouth Turkey Trot December
Harbour Jump - Burghead