Embed Size (px)
Citation preview


Strong Fundamentals, Bright Prospects, Imminent Growth2
- 3
- 4
- 17
- 19
- 23
- 27
- 29
- 33
CONTENTMessage from the President
Fund Manager’s Report
Independent Auditors’ Report
Statements of Financial Position
Statements of Comprehensive Income
Statements of Changes in Net Assets Attributable to Unitholders
Statements of Cash Flows
Notes to Financial Statements

Strong Fundamentals, Bright Prospects, Imminent Growth3
Dear Valued Policyholder,
Global financial markets have been beset with volatility since the latter part of 2015 as a result of low oil prices, Greece’s debt crisis, China’s economic slowdown, and the United States Federal Reserve’s decision to raise interest rates.
On the home front, our local bourse initially welcomed 2015 with a strong rally as the Philippine Stock Exchange Index (PSEi) registered a series of record highs, peaking at 8,127.48 in April on the back of abundant foreign fund inflows. Not immune to the global market sell-off, however, the PSEi closed 2015 with a 4% decline year-on-year, ending its six-year bull run since 2008 when it recorded its highest volume.
These global and local developments led to a dramatic decline in investor sentiment towards all asset classes and affected the performance of our various variable unit-linked (VUL) investment funds. Of the Wealth Series fund types, Dollar Fixed Income Fund reported the most gains, ending 2015 with a Net Asset Value Per Unit (NAVPU) of USD1.503543 or a 0.7% increase from the previous
year. The performance of each of the Wealth Series funds is reported in the subsequent pages which you may review in detail.
Despite the headwinds we are facing, Insular Life’s optimism in the Philippine economy remains robust. We see long-term opportunities driven by Filipinos’ rising per capita income and purchasing power, in addition to having a young demographic, which could lead to sustained demand for insurance products.
Therefore, as we face the challenges ahead, we re-affirm our commitment to sustain a prudent approach in managing your funds in order to deliver to you the best yields.
On behalf of the Company, I would like to thank you for choosing Insular Life as your partner in wealth creation.
MESSAGE FROM THE PRESIDENT
MONA LISA B. DE LA CRUZPresident and
Chief Operating Officer

Strong Fundamentals, Bright Prospects, Imminent Growth4
FUND MANAGER’S REPORT
FUND PERFORMANCEPeso Fixed Income Fund ended 2015 with a NAVPU of PHP1.854997, 0.7% down from previous year amid a volatile bond market due to growing concerns that local interest rates will increase as soon as the US starts raising interest rates. The Fund continues to invest in a mix of government and corporate bonds and short-term securities.
MARKET REVIEW AND OUTLOOKA rising interest rate environment is not bond fund-friendly. Year 2015 was characterized by speculations on the timing of when the US will start its policy normalization path. Local bond market players were mostly seen trading defensive due to mixed signals coming from the Fed. The Fed sounded dovish in their decision to keep rates unchanged (for most part of 2015) citing concerns about global market turbulence and its potential impact on the US economy. Nevertheless, the Fed also recognized that US growth looks strong, with solid job-market gains expected to continue. Likewise, falling commodity prices have been sending an alarming message about global growth outlook. The lingering concerns on efforts to restore growth in China, together with large currency devaluations all contributed to global financial market jitters. The local market was alarmed by the weakening of the PHP currency and huge decline in local equities.
PESO FIXED INCOME FUND
In 2015, the Bureau of the Treasury once again conducted a Domestic Liability Management program (bond swap) and successfully issued an aggregate amount of PHP264 billion of the new 10-Year and 25-Year Benchmark Bonds that carried a yield of 3.625% and 4.625% per annum, respectively. Nonetheless, the market remained muted for most of the trading days and volume was thin ahead of the coming Fed rate decision and despite headline inflation easing to 0.4% year-on-year in October 2015. Hawkish statements from the Bangko Sentral ng Pilipinas (BSP) Gov. Tetangco that Consumer Price Index (CPI) may have bottomed likewise added concerns that no further stimulus is expected. Indeed, November CPI came in at 1.1% and further increased, reaching 1.5% year-on-year in December. Though both headline and core inflation prints rose further, the average inflation rate of 1.4% for 2015 ended up well below the central bank’s target range of 2%-4%.
The global risk-off mode sent local fixed income investors to trim positions particularly in the long-end part of the curve and move to short-dated papers while in a volatile environment. Moving forward, expect yields to remain range bound in the near term. Trading appetite will likely center in the short-end and most liquid part of the curve as risk aversion persists.

Strong Fundamentals, Bright Prospects, Imminent Growth5
FUND MANAGER’S REPORT
Government SecuritieS:Philippine Government Bond due 20 Aug 2024Philippine Government Retail Treasury Bond due 15 Aug 2023Philippine Government Bond due 22 Nov 2019Philippine Government Bond due 25 Apr 2016Philippine Government Retail Treasury Bond due 01 Mar 2027
TOP HOLDINGS
FIXED INCOME FUNDFund Distribution by Market Value
Government Securities 85%
Corporate Securities8%
Short-termSecurities
7%

Strong Fundamentals, Bright Prospects, Imminent Growth6
FUND MANAGER’S REPORT
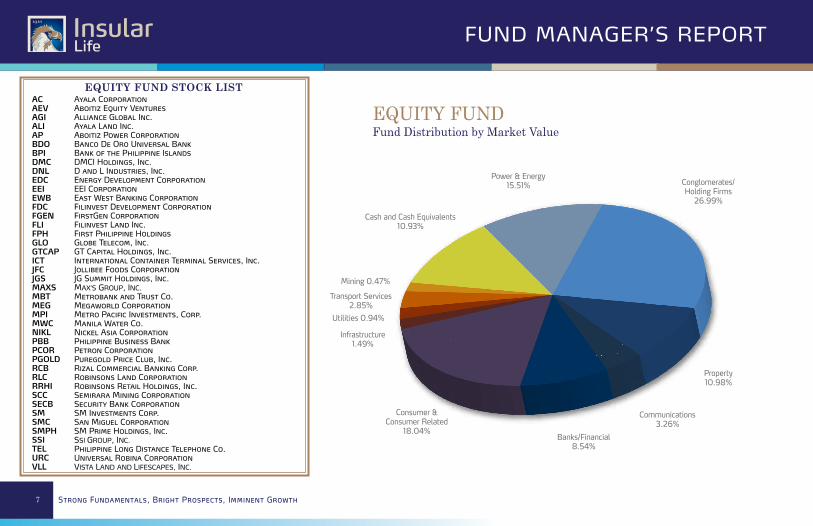
FUND PERFORMANCE The Equity Fund closed 2015 with a NAVPU of PHP4.297049, 9.1% down from the previous year. The Fund underperformed the PSEi, which posted a negative 3.9% growth for the year. Volatility of the Fund remained lower at 13.6% versus the PSEi’s 14.6% (Note: The volatility was based on the annualized standard deviation of daily returns of the portfolio and the PSEi).
The Fund maintains its exposure across all sectors of the market, with bias on conglomerates and consumer stocks. Cash position of the Fund was maintained at an optimal level of 10.9% to cushion market volatility in the coming year.
MARKET REVIEWThe local equities market welcomed 2015 with a strong run-up posting record highs as it breached the 8,000 level for the first time. Foreign funds inflow provided ample liquidity to push the PSEi towards its peak at 8,127.48 in April.
EQUITY FUND
Several headwinds came to play afterwards starting with Greece defaulting on its IMF loan, and signs of China’s economic slowdown beginning to creep in. The guessing game on the timing of the Fed rate hike was a cause of uncertainty throughout the year as well. The resulting sell-off wiped out the market’s gains for the year with the PSEi ending 2015 with a 3.85% decline year-on-year.
OUTLOOKThe country remains fundamentally sound, but the adverse developments abroad should continue to weigh down on equities. Foreign fund outflows remain as key risk to stock market performance as investors shift to traditional safe haven assets while waiting for the uncertainties to subside.
Strong Fundamentals, Bright Prospects, Imminent Growth7
FUND MANAGER’S REPORT
ACAEVAGIALIAPBDOBPIDMCDNLEDCEEIEWBFDCFGENFLIFPHGLOGTCAPICTJFCJGSMAXSMBTMEGMPIMWCNIKLPBBPCORPGOLDRCBRLCRRHISCCSECBSMSMCSMPHSSITELURCVLL
Ayala CorporationAboitiz Equity VenturesAlliance Global Inc.Ayala Land Inc.Aboitiz Power CorporationBanco De Oro Universal BankBank of the Philippine IslandsDMCI Holdings, Inc.D and L Industries, Inc.Energy Development CorporationEEI CorporationEast West Banking CorporationFilinvest Development CorporationFirstGen CorporationFilinvest Land Inc.First Philippine HoldingsGlobe Telecom, Inc.GT Capital Holdings, Inc.International Container Terminal Services, Inc.Jollibee Foods CorporationJG Summit Holdings, Inc.MAX’S GROUP, INC.Metrobank and Trust Co.Megaworld CorporationMetro Pacific Investments, Corp.Manila Water Co.Nickel Asia CorporationPhilippine Business BankPetron CorporationPuregold Price Club, Inc.Rizal Commercial Banking Corp.Robinsons Land CorporationRobinsons Retail Holdings, Inc.Semirara Mining CorporationSecurity Bank CorporationSM Investments Corp.San Miguel CorporationSM Prime Holdings, Inc.SSI GROUP, INC.Philippine Long Distance Telephone Co.Universal Robina CorporationVISTA LAND AND LIFESCAPES, INC.
EQUITY FUNDFund Distribution by Market Value
Power & Energy15.51%
Cash and Cash Equivalents10.93%
Mining 0.47%
Transport Services2.85%
Utilities 0.94%
Infrastructure1.49%
Consumer & Consumer Related
18.04%Banks/Financial
8.54%
Property10.98%
Conglomerates/Holding Firms
26.99%
Communications3.26%
EQUITY FUND STOCK LIST

Strong Fundamentals, Bright Prospects, Imminent Growth8
FUND MANAGER’S REPORT
FUND PERFORMANCEGrowth Fund NAVPU ended the year at PHP1.558152, down by 11.9% from the previous year. The Fund lagged the PSEi, which posted a negative 3.9% growth for 2015. Fund volatility was slightly lower at 14.4%, compared to PSEi’s 14.6%. (Note: The volatility was based on the annualized standard deviation of daily returns of the portfolio and the PSEi).
The Fund remained overweight on companies exposed in conglomerates, consumer, retail, and power sectors, all of which were believed to outperform the market during the period. Cash position of the Fund was modest at 5.3% due to significant profit taking of policyholders.
MARKET REVIEWAdverse developments abroad weighed on the equities market throughout 2015. Risk aversion dominated the local bourse towards the second half despite a strong start for the year. After reaching a record high of 8,127.48 in April, the PSEi succumbed to profit taking as global concerns raised fears of a widespread economic slowdown.
GROWTH FUND
Negative sentiment was mainly driven by the Greek debt crisis, China’s slowing economy, and the anticipation of Fed rate hike. The PSEi closed 2015 with a 3.85% decline year-on-year, ending the six (6) year bull run of the local equities market since 2008.
OUTLOOKVolatility in the local bourse should remain persistent given the lingering uncertainties in the global financial markets. Capital outflow should pose significant risk once again as we saw the local bourse record a net foreign selling of PHP59.7 billion for 2015, its highest since 2008’s PHP22.2 billion.

Strong Fundamentals, Bright Prospects, Imminent Growth9
FUND MANAGER’S REPORT
GROWTH FUNDFund Distribution by Market Value
Transport Services2.92%
Tourism0.83%
Consumer-Manufacturing
24.39%
Power & Energy17.47%
Conglomerates/ Holding Firms
24.92%
Banks/ Financial11.56%
Mining1.52%
Property9.06%
Infrastructure2.08%
ACAEVAGIAPBDOBELCICDMCDMPLDNLEDCEEIEWBFGENFPHGTCAPICTJGSLPZMAXSMBTMEGMPIMWIDENIKLPBBPCORPGOLDPIPPXRCBRFMRLCRRHIRWMSCCSECBSMSMCSMPHSSITAURCVLL
Ayala CorporationAboitiz Equity Ventures, Inc.Alliance Global Inc.Aboitiz Power CorporationBanco De Oro Universal BankBelle CorporationConcepcion Industrial CorporationDMCI Holdings, Inc.Del Monte Pacific Ltd.D and L Industries, Inc.Energy Development CorporationEEI CorporationEast West Banking CorporationFirstGen CorporationFirst Philippine HoldingsGT Capital Holdings, Inc.International Container Terminal Services, Inc.JG Summit Holdings, Inc.Lopez Holdings CorporationMAX’S GROUP, INC.Metropolitan Bank and Trust CompanyMegaworld CorporationMetro Pacific InvestmentsMegawide Construction Corp.Nickel Asia Corp.Philippine Business BankPetron CorporationPuregold Price Club, Inc.Pepsi-Cola Products Philippines, Inc.Philex MiningRizal Commercial Banking Corp.RFM CorporationRobinsons Land CorporationRobinsons Retail Holdings, Inc.Travellers International Hotel Group, Inc.Semirara Mining CorporationSecurity Bank CorporationSM Investments Corp.San Miguel CorporationSM Prime CorporationSSI GROUP, INC.Trans-Asia Oil and Energy Dev’t Corp.Universal Robina CorporationVISTA LAND AND LIFESCAPES, INC.
GROWTH FUND STOCK LIST
Cash and Cash Equivalents
5.25%

Strong Fundamentals, Bright Prospects, Imminent Growth10
FUND MANAGER’S REPORT
FUND PERFORMANCELocal stocks started the year on a high note as awash liquidity from foreign flows swamped the market towards record levels. Select Equities Fund (SEF) was able to ride the momentum with its NAVPU growing by 7.3% at its peak in April since being launched last 22 January 2015. Mounting global concerns however slowly took its toll on the market with SEF later on succumbing to significant profit taking.
SEF NAVPU ended 2015 at PHP0.860550, down by 13.9% from its launch date. The Fund lagged the PSEi, which posted a negative 3.9% growth for 2015. SEF volatility was higher at 16.2%, compared to PSEi’s 14.6% mainly due to its fewer component stocks. (Note: The volatility was based on the annualized standard deviation of daily returns of the portfolio and the PSEi).
MARKET REVIEWThe local equities market welcomed 2015 with a strong run-up posting record highs as it breached the 8,000 level for the first time. Foreign funds inflow provided ample liquidity to push the PSEi towards its peak at 8,127.48 in April.
SELECT EQUITIES FUND
Several headwinds came to play afterwards starting with Greece defaulting on its IMF loan, and signs of China’s economic slowdown beginning to creep in. The guessing game on the timing of the Fed rate hike was a cause of uncertainty throughout the year as well. The resulting sell-off wiped out the market’s gains for the year with the PSEi ending 2015 with a 3.85% decline year-on-year.
OUTLOOKThe country remains fundamentally sound, but the adverse developments abroad should continue to weigh down on equities. Foreign fund outflows remain as key risk to stock market performance as investors shift to traditional safe haven assets while waiting for the uncertainties to subside.

Strong Fundamentals, Bright Prospects, Imminent Growth11
FUND MANAGER’S REPORT
SELECT EQUITIES FUNDFund Distribution by Market Value
BPI8.76%
EDC8.19%
MBT8.30%
MEG8.63%
SM9.35%
SMPH10.23%
TEL7.20%
URC9.20%
Short-term MM Placements
4.45%
AGI7.16%
ALI9.12%
BDO9.41%
AGIALIBDOBPIEDCMBTMEGSMSMPHTELURC
ACGLOGTCAPJFCJGS
Alliance Global Group, Inc.Ayala Land, Inc.BDO UnibankBank of the Philippine IslandsEnergy Development Corp.MetrobankMegaworldSM Investments Corp.SM Prime Holdings Corp.PLDTUniversal Robina Corp.
Ayala CorporationGlobe Telecom, Inc.GT Capital Holdings, Inc.Jollibee Foods CorporationJG Summit Holdings, Inc.
COMPOSITION OF SEF AS OF 29 DECEMBER 2015IS AS FOLLOWS:
RESERVE LIST

Strong Fundamentals, Bright Prospects, Imminent Growth12
FUND MANAGER’S REPORT
FUND PERFORMANCEThe year 2015 saw the Balanced Fund post a NAVPU of PHP2.756962, registering a return of -5.7% compared to the previous year, on the back of diversified investments in fixed income securities and listed equities. This strategic asset allocation mix of the Fund was instrumental in allowing it to temper the turbulence present in both markets during the year.
MARKET REVIEWThe early part of 2015 had an exceptional showing for the local equities market as it surpassed the 8,000 mark on the PSEi. However, the rally eventually came to a halt as various global issues surprised investors causing a general risk-off sentiment. Greece and China again entered the headlines with their economic problems/concerns. Market players also kept close tabs on the US Fed, watching its every move in anticipation of the inevitable rate lift-off.
In the local bond market, investors also similarly watched the actions of the BSP and its cues on potential interest rate movements. The regulator’s hawkish stance on monetary policy prompted investors to lessen bets on any additional stimulus to
BALANCED FUND
the economy. This stance was supported by the average inflation of 1.4% in 2015, which was way below the central banks’ target of 2-4%. During the year the market was typically characterized by thin volume as market players preferred to stay on the sidelines until a clearer view of the market could be seen. Investors also favored taking a defensive stance staying in the short to mid part of the curve and moving in and out of the more liquid issues.
OUTLOOKWhile Philippine economic fundamentals have remained sound, global external factors will no doubt continue to affect the performance of both asset classes. The movement of hot money in the local stock market is a crucial risk factor that will exert influence, while in the fixed income space, general market sentiment may cause investors to run for cover in the near-term and remain liquid amidst the recent market uncertainties.

Strong Fundamentals, Bright Prospects, Imminent Growth13
FUND MANAGER’S REPORT
BALANCED FUNDFund Distribution by Market Value
Equities56.19%
Fixed Income43.81%

Strong Fundamentals, Bright Prospects, Imminent Growth14
FUND MANAGER’S REPORT
FUND PERFORMANCE2015 proved to be a challenging year as financial markets embarked on a rollercoaster of market ups and downs, causing Republic of the Philippines (ROP) bonds prices to swing back and forth, dictated by the movements of US treasury (UST) yields and global external developments. Consequently, the Dollar Fixed Income Fund, which is largely invested in Philippine sovereign bonds and a few select Philippine corporates registered a NAVPU of USD1.503543 as at 31 December 2015, returning 0.7% year-on-year.
MARKET REVIEWThe first half of the year saw ROPs rally on the back of favorable economic fundamentals and flight to yield investors that benefitted not only USTs but also emerging market bonds.
During this period, the Fed upgraded its assessment of the economy, noting promising economic growth at a solid pace and a stronger labor sector. Elsewhere in the world, Greece managed to grab headlines as talk of a default and exit from Euro Zone fueled investor concerns. By midyear, the trend was reversed seeing a general decline in ROP prices, following the movement of
DOLLAR FIXED INCOME FUND
USTs. This was mainly driven by positive developments in the US economy, which was reflected in increases in wages and salaries, sustained expansion of the manufacturing and service sectors and a recovering housing market. Developments in the Greek drama included a breakdown of negotiations between Greece and the Euro Zone, which called for a referendum. In the second half of the year, China added fuel to the fire with the surprise mini devaluation of its currency and serious concerns over a severe slowdown in its economy. However, the market corrected with a modest recovery from favorable developments in China and relatively strong US real consumer spending in 3Q. This fueled market optimism and soothed investors, encouraging risk appetite. As the year came to a close, ROP prices dipped, following the movements of UST, mainly driven by a surprisingly strong October nonfarm payrolls report and emerging market concerns, which weakened sentiment, triggering flight to safety. As largely anticipated by the market, the Fed stayed true to its statements and finally raised interest rates by 25 basis points, signaling the beginning of its gradual monetary policy tightening. ROPs remained an attractive investment outlet for investors throughout the year but as risk off sentiment prevailed as yearend approached, ROP prices ended flat, seemingly almost at the same levels where it began.

Strong Fundamentals, Bright Prospects, Imminent Growth15
FUND MANAGER’S REPORT
Locally, Philippine economic fundamentals remained consistent with favorable growth prospects throughout the year. Key data that supported this were strong 4Q economic growth of 6.3% as well as full year GDP growth of 5.8%, high foreign exchange reserves at around USD80 billion, structural inflows of roughly USD46 billion and benign inflation of 1.4% for the year. However, these economic gains were not attained without overcoming hurdles. In 2015, challenges were faced in several areas such as in accelerating infrastructure, government expenditures and power developments, weaker global growth and the threat of El Nino.
OUTLOOKThe environment for Philippine sovereigns continues to look good on the back of supporting local economic fundamentals that are expected to stay strong in 2016. Moving forward, emerging markets are seen to continue taking its cue from the developments in the US markets, primarily as it progresses from its fragile recovery, which will further influence the pace of interest rate hikes. External developments will be monitored as well as these are expected to remain the primary drivers for the market.

Strong Fundamentals, Bright Prospects, Imminent Growth16
FUND MANAGER’S REPORT
DOLLAR FIXED INCOME FUNDFund Distribution by Market Value
1 to 5 Years15.43%
Short-term Investments2 1 .96%
7 to 10 Years18.74%
10 to 15 Years4.50%
Longer than 15 Years3 6.08 %
5 to 7 Years3.29%
TOP HOLDINGSRepublic of the Philippines 2040Republic of the Philippines 2037Republic of the Philippines 2034Republic of the Philippines 2032Republic of the Philippines 2024

Strong Fundamentals, Bright Prospects, Imminent Growth17
INDEPENDENT AUDITORS’ REPORT
REPORT ON THE FINANCIAL STATEMENTSWe have audited the accompanying financial statements of Insular Life Wealth Series Funds, which comprise the statements of financial position as at December 31, 2015 and 2014, and the statements of comprehensive income, statements of changes in net assets attributable to unitholders, and statements of cash flows for the years then ended, and a summary of significant accounting policies and other explanatory information.
MANAGEMENT’S RESPONSIBILITY FOR THE FINANCIAL STATEMENTSManagement is responsible for the preparation and fair presentation of these financial statements in accordance with Philippine Financial Reporting Standards, and for such internal control as management determines is necessary to enable the preparation of financial statements that are free from material misstatement, whether due to fraud or error.
AUDITORS’ RESPONSIBILITYOur responsibility is to express an opinion on these financial statements based on our audits. We conducted our audits in accordance with Philippine Standards on Auditing. Those standards require that we comply with ethical requirements and plan and perform the audit to obtain reasonable assurance about whether the financial statements are free from material misstatement.An audit involves performing procedures to obtain audit evidence about the amounts and disclosures in the financial statements. The procedures selected depend on the auditor’s judgment, including the assessment of the risks of material misstatement of the financial statements, whether due to fraud or error. In making those risk assessments, the auditor considers internal control relevant to the entity’s preparation and fair presentation of the financial statements in order to design audit procedures that are appropriate in the circumstances, but not for the purpose of expressing an opinion on the effectiveness of the entity’s internal control.
THE BOARD OF TRUSTEESthe inSular life aSSurance company, ltd.

Strong Fundamentals, Bright Prospects, Imminent Growth18
INDEPENDENT AUDITORS’ REPORT
An audit also includes evaluating the appropriateness of accounting policies used and the reasonableness of accounting estimates made by management, as well as, evaluating the overall presentation of the financial statements.We believe that the audit evidence we have obtained is sufficient and appropriate to provide a basis for our audit opinion.
OPINIONIn our opinion, the financial statements present fairly, in all material respects, the financial position of the Insular Life Wealth Series Funds as at December 31, 2015 and 2014, and its financial performance and its cash flows for the years then ended in accordance with Philippine Financial Reporting Standards.
Djole S. GarciaPartnerCPA Certificate No. 0097907SEC Accreditation No. 1285-A (Group A), February 25, 2013, valid until April 30, 2016Tax Identification No. 201-960-347BIR Accreditation No. 08-001998-102-2015, November 25, 2015, valid until November 24, 2018PTR No. 5321641, January 4, 2016, Makati City
March 31, 2016
RESTRICTION ON DISTRIBUTION AND USEThis report is intended solely for the information and use of the board of trustees and management of The Insular Life Assurance Company, Ltd. and for submission to the Insurance Commission and should not be used for any other purpose.
SYCIP GORRES VELAYO & CO.

Strong Fundamentals, Bright Prospects, Imminent Growth19
Insular Life Wealth Series FundsStatements Of Financial Position
See accompanying Notes to Financial Statements.
December 31, 2015Peso Investment Funds
BalancedFund
FixedIncome
FundEquity
FundGrowth
Fund
SelectEquities
Fund
StrategicResources
Fund
AsianEmerging
CompaniesFund
PhilippineEquity
AdvantageFund
Tranche 1
PhilippineEquity
AdvantageFund
Tranche 2
Total PesoInvestment
Funds
P=133,762 P=90,486,377 P=533,510,659 P=238,905,636 P=198,321,415 P=– P=– P=– P=– P=1,061,357,849
– 1,262,154,459 – – – 314,080,000 286,371,732 268,949,000 130,920,000 2,262,475,191– – 4,343,211,102 4,310,703,440 4,256,176,614 – – – – 12,910,091,156
664,216,371 – – – – – – – – 664,216,371851,809,866 – – – – – – – – 851,809,866
– 358,323 2,139,940 – 2,819,989 – – – – 5,318,252– 9,681,768 1,826,162 965,746 4,191,588 – – – – 16,665,264
487,978 1,003,991 1,006,144 299 – – – – – 2,498,4121,516,647,977 1,363,684,918 4,881,694,007 4,550,575,121 4,461,509,606 314,080,000 286,371,732 268,949,000 130,920,000 17,774,432,361
(Note 6)2,204,778 244,798 2,241,758 1,698,744 – – – – – 6,390,078
429,843 2,122,857 9,668,656 9,064,151 7,790,504 – – – – 29,076,0112,634,621 2,367,655 11,910,414 10,762,895 7,790,504 – – – – 35,466,089
P=1,514,013,356 P=1,361,317,263 P=4,869,783,593 P=4,539,812,226 P=4,453,719,102 P=314,080,000 P=286,371,732 P=268,949,000 P=130,920,000 P=17,738,966,272
549,160,036 733,864,802 1,133,285,592 2,913,588,110 5,175,431,573 325,000 375,471 305,000 150,000
P=2.76 P=1.85 P=4.30 P=1.56 P=0.86 P=966.40 P=762.70 P=881.80 P=872.80
ASSETSCash and cash equivalents (Note 3)
Financial assets at fair value through profitor loss (Note 4):
Debt securitiesEquity securitiesInvestment in fixed income fundInvestment in equity fund
Receivables (Note 5):
Subscriptions receivableInvestment income receivableOther receivables
LIABILITIESAccounts payableAccrued and other liabilities
NET ASSETS ATTRIBUTABLETO UNITHOLDERS
Number of Units
Net Asset Value Per Unit

Strong Fundamentals, Bright Prospects, Imminent Growth20
Insular Life Wealth Series FundsStatements Of Financial Position
See accompanying Notes to Financial Statements.
December 31, 2015Dollar Investment Funds
FixedIncome
Fund
China PrimeFund
Tranche 1
China PrimeFund
Tranche 2
AsiaDynamic
Equity Fund
AsianEmerging
CompaniesFund
Euro BlueChips Dollar
Fund
Total DollarInvestment
Funds
Total Pesoand DollarInvestment
FundsEliminating
Entries Combined
P=377,379,008 P=– P=– P=– P=– P=– P=377,379,008 P=1,438,736,857 P=– P=1,438,736,857
1,649,709,571 181,872,096 78,537,286 131,861,986 399,401,688 320,421,749 2,761,804,376 5,024,279,567 – 5,024,279,567– – – – – – – 12,910,091,156 – 12,910,091,156– – – – – – – 664,216,371 (664,216,371) –– – – – – – – 851,809,866 (851,809,866) –
75,185 – – – – – 75,185 5,393,437 – 5,393,43730,688,453 – – – – – 30,688,453 47,353,717 – 47,353,717
283 – – – – – 283 2,498,695 (2,494,960) 3,7352,057,852,500 181,872,096 78,537,286 131,861,986 399,401,688 320,421,749 3,169,947,305 20,944,379,666 (1,518,521,197) 19,425,858,469
10,502,688 – – – – – 10,502,688 16,892,766 (2,204,778) 14,687,9883,189,367 – – – – – 3,189,367 32,265,378 (290,182) 31,975,196
13,692,055 – – – – – 13,692,055 49,158,144 (2,494,960) 46,663,184
P=2,044,160,445 P=181,872,096 P=78,537,286 P=131,861,986 P=399,401,688 P=320,421,749 P=3,156,255,250 P=20,895,221,522 (P=1,516,026,237) P=19,379,195,285
28,825,041 4,000 1,750 3,000 10,000 7,550
P=70.92 P=45,468.02 P=44,878.45 P=43,954.00 P=39,940.17 P=42,439.97
(Note 6)
ASSETSCash and cash equivalents (Note 3)
Financial assets at fair value through profitor loss (Note 4):
Debt securitiesEquity securitiesInvestment in fixed income fundInvestment in equity fund
Receivables (Note 5):
Subscriptions receivableInvestment income receivableOther receivables
LIABILITIESAccounts payableAccrued and other liabilities
NET ASSETS ATTRIBUTABLETO UNITHOLDERS
Number of Units
Net Asset Value Per Unit

Strong Fundamentals, Bright Prospects, Imminent Growth21
Insular Life Wealth Series FundsStatements Of Financial Position
December 31, 2014Peso Investment Funds
BalancedFund
FixedIncome
FundEquity
FundGrowth
Fund
StrategicResources
Fund
AsianEmerging
CompaniesFund
PhilippineEquity
AdvantageFund
Tranche 1
PhilippineEquity
AdvantageFund
Tranche 2
Total PesoInvestment
Funds
P=140,468 P=89,837,709 P=529,186,064 P=762,003,553 P=– P=– P=– P=– P=1,381,167,794
– 1,277,406,425 – – 322,790,000 309,763,575 274,927,000 134,025,000 2,318,912,000– – 4,569,977,655 5,192,879,910 – – – – 9,762,857,565
675,396,836 – – – – – – – 675,396,836942,557,685 – – – – – – – 942,557,685
425,722 287,841 8,415,055 3,188,047 – – – – 12,316,665– 9,416,990 1,225,947 1,026,430 – – – – 11,669,367– 593,334 597,629 4,591 – – – – 1,195,554
1,618,520,711 1,377,542,299 5,109,402,350 5,959,102,531 322,790,000 309,763,575 274,927,000 134,025,000 15,106,073,466
1,542,978 1,309 17,103,110 18,288,634 – – – – 36,936,031148,582 2,095,432 9,576,829 10,958,448 – – – – 22,779,291
1,691,560 2,096,741 26,679,939 29,247,082 – – – – 59,715,322
P=1,616,829,151 P=1,375,445,558 P=5,082,722,411 P=5,929,855,449 P=322,790,000 P=309,763,575 P=274,927,000 P=134,025,000 P=15,046,358,144
553,127,830 736,250,401 1,075,029,174 3,351,491,214 325,000 375,471 305,000 150,000
P=2.92 P=1.87 P=4.73 P=1.77 P=993.20 P=825.00 P=901.40 P=893.50
(Note 6)
ASSETSCash and cash equivalents (Note 3)
Financial assets at fair value through profitor loss (Note 4):
Debt securitiesEquity securitiesInvestment in fixed income fundInvestment in equity fund
Receivables (Note 5):
Subscriptions receivableInvestment income receivableOther receivables
LIABILITIESAccounts payableAccrued and other liabilities
NET ASSETS ATTRIBUTABLETO UNITHOLDERS
Number of Units
Net Asset Value Per Unit
See accompanying Notes to Financial Statements.

Strong Fundamentals, Bright Prospects, Imminent Growth22
Insular Life Wealth Series FundsStatements Of Financial Position
December 31, 2014Dollar Investment Funds
FixedIncome
Fund
GreaterChinaFund
StrategicEnergy
Fund
China PrimeFund
Tranche 1
China PrimeFund
Tranche 2
AsiaDynamic
Equity Fund
AsianEmerging
CompaniesFund
Euro BlueChips Dollar
Fund
Total DollarInvestment
Funds
Total Pesoand DollarInvestment
FundsEliminating
Entries Combined
P=536,947,787 P=– P=– P=– P=– P=– P=– P=– P=536,947,787 P=1,918,115,581 P=– P=1,918,115,581
1,132,872,616 325,394,106 737,438,699 174,059,840 74,823,824 126,382,114 392,272,665 311,627,660 3,274,871,524 5,593,783,524 – 5,593,783,524– – – – – – – – – 9,762,857,565 – 9,762,857,565– – – – – – – – – 675,396,836 (675,396,836) –– – – – – – – – – 942,557,685 (942,557,685) –
390,122 – – – – – – – 390,122 12,706,787 (425,722) 12,281,06520,990,028 – – – – – – – 20,990,028 32,659,395 – 32,659,395
– – – – – – – – – 1,195,554 (1,186,668) 8,8861,691,200,553 325,394,106 737,438,699 174,059,840 74,823,824 126,382,114 392,272,665 311,627,660 3,833,199,461 18,939,272,927 (1,619,566,911) 17,319,706,016
– – – – – – – – – 36,936,031 (1,542,978) 35,393,0532,461,740 – – – – – – – 2,461,740 25,241,031 (69,411) 25,171,6202,461,740 – – – – – – – 2,461,740 62,177,062 (1,612,389) 60,564,673
P=1,688,738,813 P=325,394,106 P=737,438,699 P=174,059,840 P=74,823,824 P=126,382,114 P=392,272,665 P=311,627,660 P=3,830,737,721 P=18,877,095,865 (P=1,617,954,522) P=17,259,141,343
25,346,550 7,228 16,300 4,000 1,750 3,000 10,000 7,550
P=66.63 P=45,018.55 P=45,241.64 P=43,514.96 P=42,756.47 P=42,127.37 P=39,227.27 P=41,275.19
(Note 6)
ASSETSCash and cash equivalents (Note 3)
Financial assets at fair value through profitor loss (Note 4):
Debt securitiesEquity securitiesInvestment in fixed income fundInvestment in equity fund
Receivables (Note 5):
Subscriptions receivableInvestment income receivableOther receivables
LIABILITIESAccounts payableAccrued and other liabilities
NET ASSETS ATTRIBUTABLETO UNITHOLDERS
Number of Units
Net Asset Value Per Unit
See accompanying Notes to Financial Statements.

Strong Fundamentals, Bright Prospects, Imminent Growth23
Insular Life Wealth Series FundsStatement OF Comprehensive Income
Year Ended December 31, 2015Peso Investment Funds
BalancedFund
FixedIncome
FundEquity
FundGrowth
Fund
SelectEquities
Fund
StrategicResources
Fund
AsianEmerging
CompaniesFund
PhilippineEquity
AdvantageFund
Tranche 1
PhilippineEquity
AdvantageFund
Tranche 2
Total PesoInvestment
Funds
INCOMEInterest income - deposits (Note 3) P=17 P=323,663 P=881,794 P=598,299 P=403,686 P=– P=– P=– P=– P=2,207,459Interest income - debt securities (Note 4) – 58,705,160 – – – – – – – 58,705,160
Dividends (Note 5) – – 76,986,866 81,865,921 70,465,893 – – – – 229,318,68017 59,028,823 77,868,660 82,464,220 70,869,579 – – – – 290,231,299
EXPENSESManagement fees (Note 7) – 20,525,231 97,551,617 103,391,148 63,468,391 – – – – 284,936,387Administration fees (Note 7) 881,804 772,842 2,702,919 2,863,507 2,012,721 – – – – 9,233,793Custody fees (Note 7) – 214,226 1,050,054 1,093,356 1,124,718 – – – – 3,482,354Government taxes and duties 3 11,064,727 258 79 338 – – – – 11,065,405Professional fees – 72,074 72,074 72,074 66,916 – – – – 283,138Transaction costs 5,720 76,843 180,852 114,516 90,486 – – – – 468,417
887,527 32,725,943 101,557,774 107,534,680 66,763,570 – – – – 309,469,494
OTHER INCOME (LOSSES)Net change in unrealized gain (loss)on investment (121,901,350) (35,706,525) (589,036,348) (731,466,785) (685,546,712) (8,710,000) (23,391,843) (5,978,000) (3,105,000) (2,204,842,563)Realized gain (loss) on investment 33,248,230 683,118 178,466,825 186,851,696 (9,689,414) – – – – 389,560,455Foreign currency gain – – – – – – – – – –
(88,653,120) (35,023,407) (410,569,523) (544,615,089) (695,236,126) (8,710,000) (23,391,843) (5,978,000) (3,105,000) (1,815,282,108)
NET INCREASE (DECREASE)IN NET ASSETS ATTRIBUTABLE TOUNITHOLDERS RESULTINGFROM OPERATIONS ANDOTHER COMPREHENSIVE INCOME
(P=89,540,630) (P=8,720,527) (P=434,258,637) (P=569,685,549) (P=691,130,117) (P=8,710,000) (P=23,391,843) (P=5,978,000) (P=3,105,000) (P=1,834,520,303)
See accompanying Notes to Financial Statements.

Strong Fundamentals, Bright Prospects, Imminent Growth24
Insular Life Wealth Series FundsStatement OF Comprehensive Income
Year Ended December 31, 2015Dollar Investment Funds
FixedIncome
Fund
GreaterChinaFund
StrategicEnergy
Fund
ChinaPrime Fund
Tranche 1
ChinaPrime Fund
Tranche 2
AsiaDynamic
Equity Fund
AsianEmerging
CompaniesFund
Euro BlueChips Dollar
Fund
Total DollarInvestment
Funds
Total Pesoand DollarInvestment
FundsEliminating
Entries Combined
P= 3,388,962 P=– P=– P=– P=– P=– P=– P=– P=3,388,962 P=5,596,421 P=– P=5,596,42175,573,604 – – – – – – – 75,573,604 134,278,764 – 134,278,764
– – – – – – – – – 229,318,680 – 229,318,68078,962,566 – – – – – – – 78,962,566 369,193,865 – 369,193,865
28,631,259 – – – – – – – 28,631,259 313,567,646 – 313,567,6461,049,813 – – – – – – – 1,049,813 10,283,606 – 10,283,606
314,480 – – – – – – – 314,480 3,796,834 – 3,796,834– – – – – – – – – 11,065,405 – 11,065,405
71,247 – – – – – – – 71,247 354,385 – 354,385329,197 – – – – – – – 329,197 797,614 – 797,614
30,395,996 – – – – – – – 30,395,996 339,865,490 – 339,865,490
(36,626,681) 5,730,677 32,437,848 (2,016,688) (530,942) (1,646,367) (14,455,909) (8,522,517) (25,630,579) (2,230,473,142) 121,901,350 (2,108,571,792)(888,406) – – – – – – – (888,406) 388,672,049 (33,248,230) 355,423,819
96,478,815 18,917,387 43,983,578 9,828,944 4,244,404 7,126,239 21,584,932 17,316,606 219,480,905 219,480,905 – 219,480,90558,963,728 24,648,064 76,421,426 7,812,256 3,713,462 5,479,872 7,129,023 8,794,089 192,961,920 (1,622,320,188) 88,653,120 (1,533,667,068)
P=107,530,298 P=24,648,064 P=76,421,426 P=7,812,256 P=3,713,462 P=5,479,872 P=7,129,023 P=8,794,089 P=241,528,490 (P=1,592,991,813) P=88,653,120 (P=1,504,338,693)
INCOMEInterest income - deposits (Note 3)Interest income - debt securities (Note 4)
Dividends (Note 5)
EXPENSESManagement fees (Note 7)Administration fees (Note 7)Custody fees (Note 7)Government taxes and dutiesProfessional feesTransaction costs
OTHER INCOME (LOSSES)Net change in unrealized gain (loss)on investmentRealized gain (loss) on investmentForeign currency gain
NET INCREASE (DECREASE)IN NET ASSETS ATTRIBUTABLE TOUNITHOLDERS RESULTINGFROM OPERATIONS ANDOTHER COMPREHENSIVE INCOME
See accompanying Notes to Financial Statements.

Strong Fundamentals, Bright Prospects, Imminent Growth25
Insular Life Wealth Series FundsStatement OF Comprehensive Income
See accompanying Notes to Financial Statements.
Year Ended December 31, 2014Peso Investment Funds
BalancedFund
FixedIncome
FundEquity
FundGrowth
Fund
StrategicResources
Fund
AsianEmerging
CompaniesFund
PhilippineEquity
AdvantageFund
Tranche 1
PhilippineEquity
AdvantageFund
Tranche 2
Total PesoInvestment
Funds
P=– P=888,097 P=1,172,556 P=1,478,228 P=– P=– P=– P=– P=3,538,881– 62,173,571 – – – – – – 62,173,571
– – 76,768,882 72,564,132 – – – – 149,333,014– 63,061,668 77,941,438 74,042,360 – – – – 215,045,466
– 20,798,393 84,955,973 95,361,555 – – – – 201,115,921885,033 803,153 2,376,834 2,662,988 – – – – 6,728,008
– 203,669 888,565 988,919 – – – – 2,081,153– 11,432,598 158 120 – – – – 11,432,876– 121,723 121,723 121,722 – – – – 365,168– 156,615 265,367 300,212 – – – – 722,194
885,033 33,516,151 88,608,620 99,435,516 – – – – 222,445,320
168,016,577 (8,208,673) 765,687,706 936,868,808 4,745,000 5,219,047 (30,073,000) (15,975,000) 1,826,280,46533,535,006 3,566,719 163,160,476 106,918,644 – – – – 307,180,845
– – – – – – – – –201,551,583 (4,641,954) 928,848,182 1,043,787,452 4,745,000 5,219,047 (30,073,000) (15,975,000) 2,133,461,310
P=200,666,550 P=24,903,563 P=918,181,000 P=1,018,394,296 P=4,745,000 P=5,219,047 (P=30,073,000) (P=15,975,000) P=2,126,061,456
INCOMEInterest income - deposits (Note 3)Interest income - debt securities (Note 4)
Dividends (Note 5)
EXPENSESManagement fees (Note 7)Administration fees (Note 7)Custody fees (Note 7)Government taxes and dutiesProfessional feesTransaction costs
OTHER INCOME (LOSSES)Net change in unrealized gain (loss)on investmentRealized gain (loss) on investmentForeign currency gain
NET INCREASE (DECREASE)IN NET ASSETS ATTRIBUTABLE TOUNITHOLDERS RESULTINGFROM OPERATIONS ANDOTHER COMPREHENSIVE INCOME

Strong Fundamentals, Bright Prospects, Imminent Growth26
Insular Life Wealth Series FundsStatement OF Comprehensive Income
Year Ended December 31, 2014Dollar Investment Funds
FixedIncome
Fund
GreaterChinaFund
StrategicEnergy
Fund
ChinaPrime Fund
Tranche 1
ChinaPrime Fund
Tranche 2
AsiaDynamic
Equity Fund
AsianEmerging
CompaniesFund
Euro BlueChips Dollar
Fund
Total DollarInvestment
Funds
Total Pesoand DollarInvestment
FundsEliminating
Entries Combined
P=– P=– P=– P=– P=– P=– P=– P=– P=– P=3,538,881 P=– P=3,538,88157,805,427 – – – – – – – 57,805,427 119,978,998 – 119,978,998
– – – – – – – – – 149,333,014 – 149,333,01457,805,427 – – – – – – – 57,805,427 272,850,893 – 272,850,893
21,708,161 – – – – – – – 21,708,161 222,824,082 – 222,824,082795,964 – – – – – – – 795,964 7,523,972 – 7,523,972203,183 – – – – – – – 203,183 2,284,336 – 2,284,336
– – – – – – – – – 11,432,876 – 11,432,876105,086 – – – – – – – 105,086 470,254 – 470,25496,149 – – – – – – – 96,149 818,343 – 818,343
22,908,543 – – – – – – – 22,908,543 245,353,863 – 245,353,863
62,552,842 (2,568,191) 14,116,989 4,583,524 2,836,944 10,765,953 34,332,023 (24,576,412) 102,043,672 1,928,324,137 (168,016,577) 1,760,307,560(952,537) – – – – – – – (952,537) 306,228,308 (33,535,006) 272,693,302
5,830,076 1,480,490 3,355,225 791,944 340,436 575,018 1,784,776 8,081,072 22,239,037 22,239,037 – 22,239,03767,430,381 (1,087,701) 17,472,214 5,375,468 3,177,380 11,340,971 36,116,799 (16,495,340) 123,330,172 2,256,791,482 (201,551,583) 2,055,239,899
P=102,327,265 (P=1,087,701) P=17,472,214 P=5,375,468 P=3,177,380 P=11,340,971 P=36,116,799 (P=16,495,340) P=158,227,056 P=2,284,288,512 (P=201,551,583) P=2,082,736,929
INCOMEInterest income - deposits (Note 3)Interest income - debt securities (Note 4)
Dividends (Note 5)
EXPENSESManagement fees (Note 7)Administration fees (Note 7)Custody fees (Note 7)Government taxes and dutiesProfessional feesTransaction costs
OTHER INCOME (LOSSES)Net change in unrealized gain (loss)on investmentRealized gain (loss) on investmentForeign currency gain
NET INCREASE (DECREASE)IN NET ASSETS ATTRIBUTABLE TOUNITHOLDERS RESULTINGFROM OPERATIONS ANDOTHER COMPREHENSIVE INCOME
See accompanying Notes to Financial Statements.

Strong Fundamentals, Bright Prospects, Imminent Growth27
Insular Life Wealth Series FundsStatements Of Changes In Net Assets Attributable To Unitholders
FOR THE YEARS ENDED DECEMBER 31, 2015 AND 2014
Peso Investment Funds
BalancedFund
Fixed IncomeFund
EquityFund
GrowthFund
Select EquitiesFund
StrategicResources
Fund
AsianEmerging
CompaniesFund
PhilippineEquity
AdvantageFund
Tranche 1
PhilippineEquity
AdvantageFund
Tranche 2
NET ASSETS ATTRIBUTABLE TOUNITHOLDERS AT DECEMBER 31, 2013
NET ASSETS ATTRIBUTABLE TOUNITHOLDERS AT DECEMBER 31, 2014
P=1,410,570,391 P=1,302,195,240 P=3,502,121,512 P=3,894,879,830 P=– P=318,045,000 P=304,544,528 P=– P=–
Contributions received from units issued 99,160,426 283,973,303 1,242,076,267 1,753,958,422 – – – 305,000,000 150,000,000Redemptions during the year (93,568,216) (235,626,548) (579,656,368) (737,377,099) – – – – –
5,592,210 48,346,755 662,419,899 1,016,581,323 – – – 305,000,000 150,000,000
Net increase (decrease) in net assetsattributable to unitholders resultingfrom operations
NET ASSETS ATTRIBUTABLE TOUNITHOLDERS AT DECEMBER 31, 2015
Contributions received from units issuedRedemptions during the year
Net increase (decrease) in net assetsattributable to unitholders resultingfrom operations
200,666,550 24,903,563 918,181,000 1,018,394,296 – 4,745,000 5,219,047 (30,073,000) (15,975,000)
1,616,829,151 1,375,445,558 5,082,722,411 5,929,855,449 – 322,790,000 309,763,575 274,927,000 134,025,000
74,423,822 251,647,304 926,119,788 190,126,166 5,179,346,976 – – – –(87,698,987) (257,055,072) (704,799,969) (1,010,483,840) (34,497,757) – – – –(13,275,165) (5,407,768) 221,319,819 (820,357,674) 5,144,849,219 – – – –
(89,540,630) (8,720,527) (434,258,637) (569,685,549) (691,130,117) (8,710,000) (23,391,843) (5,978,000) (3,105,000)
P=1,514,013,356 P=1,361,317,263 P=4,869,783,593 P=4,539,812,226 P=4,453,719,102 P=314,080,000 P=286,371,732 P=268,949,000 P=130,920,000
See accompanying Notes to Financial Statements.
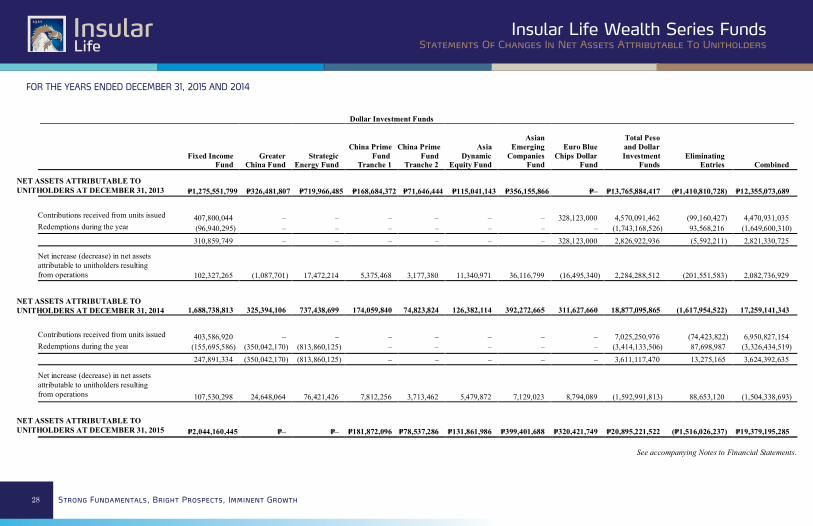
Strong Fundamentals, Bright Prospects, Imminent Growth28
Insular Life Wealth Series FundsStatements Of Changes In Net Assets Attributable To Unitholders
FOR THE YEARS ENDED DECEMBER 31, 2015 AND 2014
NET ASSETS ATTRIBUTABLE TOUNITHOLDERS AT DECEMBER 31, 2013
NET ASSETS ATTRIBUTABLE TOUNITHOLDERS AT DECEMBER 31, 2014
Contributions received from units issuedRedemptions during the year
Net increase (decrease) in net assetsattributable to unitholders resultingfrom operations
NET ASSETS ATTRIBUTABLE TOUNITHOLDERS AT DECEMBER 31, 2015
Contributions received from units issuedRedemptions during the year
Net increase (decrease) in net assetsattributable to unitholders resultingfrom operations
Dollar Investment Funds
Fixed IncomeFund
GreaterChina Fund
StrategicEnergy Fund
China PrimeFund
Tranche 1
China PrimeFund
Tranche 2
AsiaDynamic
Equity Fund
AsianEmerging
CompaniesFund
Euro BlueChips Dollar
Fund
Total Pesoand DollarInvestment
FundsEliminating
Entries Combined
P=1,275,551,799 P=326,481,807 P=719,966,485 P=168,684,372 P=71,646,444 P=115,041,143 P=356,155,866 P=– P=13,765,884,417 (P=1,410,810,728) P=12,355,073,689
407,800,044 – – – – – – 328,123,000 4,570,091,462 (99,160,427) 4,470,931,035(96,940,295) – – – – – – – (1,743,168,526) 93,568,216 (1,649,600,310)310,859,749 – – – – – – 328,123,000 2,826,922,936 (5,592,211) 2,821,330,725
102,327,265 (1,087,701) 17,472,214 5,375,468 3,177,380 11,340,971 36,116,799 (16,495,340) 2,284,288,512 (201,551,583) 2,082,736,929
1,688,738,813 325,394,106 737,438,699 174,059,840 74,823,824 126,382,114 392,272,665 311,627,660 18,877,095,865 (1,617,954,522) 17,259,141,343
403,586,920 – – – – – – – 7,025,250,976 (74,423,822) 6,950,827,154(155,695,586) (350,042,170) (813,860,125) – – – – – (3,414,133,506) 87,698,987 (3,326,434,519)247,891,334 (350,042,170) (813,860,125) – – – – – 3,611,117,470 13,275,165 3,624,392,635
107,530,298 24,648,064 76,421,426 7,812,256 3,713,462 5,479,872 7,129,023 8,794,089 (1,592,991,813) 88,653,120 (1,504,338,693)
P=2,044,160,445 P=– P=– P=181,872,096 P=78,537,286 P=131,861,986 P=399,401,688 P=320,421,749 P=20,895,221,522 (P=1,516,026,237) P=19,379,195,285
See accompanying Notes to Financial Statements.

Strong Fundamentals, Bright Prospects, Imminent Growth29
Insular Life Wealth Series FundsSTATEMENTS OF CASH FLOWS
FOR THE YEARS ENDED DECEMBER 31, 2015 AND 2014
See accompanying Notes to Financial Statements.
Year Ended December 31, 2015Peso Investment Funds
BalancedFund
Fixed IncomeFund
EquityFund
GrowthFund
SelectEquities
Fund
StrategicResources
Fund
AsianEmerging
CompaniesFund
PhilippineEquity
AdvantageFund
Tranche 1
PhilippineEquity
AdvantageFund
Tranche 2
CASH FLOWS FROM OPERATING ACTIVITIESNet increase (decrease) in net assets attributableto unitholders resulting from operations (P=89,540,630) (P=8,720,527) (P=434,258,637) (P=569,685,549) (P=691,130,117) (P=8,710,000) (P=23,391,843) (P=5,978,000) (P=3,105,000)
Adjustments for (gain) loss on increase/decreasein value and sale of investments - net 88,653,120 35,023,407 410,569,523 544,615,089 695,236,126 8,710,000 23,391,843 5,978,000 3,105,000
Operating income (loss) before workingcapital changes (887,510) 26,302,880 (23,689,114) (25,070,460) 4,106,009 – – – –Net increase (decrease):
Subscription receivable 425,722 (70,482) 6,275,115 3,188,047 (2,819,989) – – – –Investment income receivable – (264,778) (600,215) 60,684 (4,191,588) – – – –Other receivable (487,978) (410,657) (408,515) 4,292 – – – – –
Net (increase) decrease:Accounts payable, accrued and
other liabilities 943,060 270,914 (14,769,525) (18,484,187) 7,790,504 – – – –Net cash from operating activities (6,706) 25,827,877 (33,192,254) (40,301,624) 4,884,936 – – – –
CASH FLOWS FROM INVESTING ACTIVITIESNet (acquisition) sale of investments 13,275,165 (19,771,441) (183,802,970) 337,561,381 (4,951,412,740) – – – –
CASH FLOWS FROM FINANCING ACTIVITIESNet contributions (redemptions)to the funds (13,275,165) (5,407,768) 221,319,819 (820,357,674) 5,144,849,219 – – – –
NET INCREASE (DECREASE) INCASH AND CASH EQUIVALENTS (6,706) 648,668 4,324,595 (523,097,917) 198,321,415 – – – –
CASH AND CASH EQUIVALENTSAT BEGINNING OF YEAR 140,468 89,837,709 529,186,064 762,003,553 – – – – –
CASH AND CASH EQUIVALENTSAT END OF YEAR (Note 3) P=133,762 P=90,486,377 P=533,510,659 P=238,905,636 P=198,321,415 P=– P=– P=– P=–

Strong Fundamentals, Bright Prospects, Imminent Growth30
Insular Life Wealth Series FundsSTATEMENTS OF CASH FLOWS
FOR THE YEARS ENDED DECEMBER 31, 2015 AND 2014
See accompanying Notes to Financial Statements.
CASH FLOWS FROM OPERATING ACTIVITIESNet increase (decrease) in net assets attributableto unitholders resulting from operations
Adjustments for (gain) loss on increase/decreasein value and sale of investments - net
Operating income (loss) before workingcapital changesNet increase (decrease):
Subscription receivableInvestment income receivableOther receivable
Net (increase) decrease:Accounts payable, accrued and
other liabilitiesNet cash from operating activities
CASH FLOWS FROM INVESTING ACTIVITIESNet (acquisition) sale of investments
CASH FLOWS FROM FINANCING ACTIVITIESNet contributions (redemptions)to the funds
NET INCREASE (DECREASE) INCASH AND CASH EQUIVALENTS
CASH AND CASH EQUIVALENTSAT BEGINNING OF YEAR
CASH AND CASH EQUIVALENTSAT END OF YEAR (Note 3)
Year Ended December 31, 2015Dollar Investment Funds
FixedIncome
FundGreater
China FundStrategic
Energy Fund
China PrimeFund
Tranche 1
China PrimeFund
Tranche 2
AsiaDynamic
Equity Fund
AsianEmerging
CompaniesFund
Euro BlueChips Dollar
Fund TotalEliminating
Entries Combined
P=107,530,298 P=24,648,064 P=76,421,426 P=7,812,256 P=3,713,462 P=5,479,872 P=7,129,023 P=8,794,089 (P=1,592,991,813) P=88,653,120 (P=1,504,338,693)
(58,963,728) (24,648,064) (76,421,426) (7,812,256) (3,713,462) (5,479,872) (7,129,023) (8,794,089) 1,622,320,188 (88,653,120) 1,533,667,068
48,566,570 – – – – – – – 29,328,375 – 29,328,375
314,937 – – – – – – – 7,313,350 (425,722) 6,887,628(9,698,425) – – – – – – – (14,694,322) – (14,694,322)
(283) – – – – – – – (1,303,141) 1,308,292 5,151
11,230,315 – – – – – – – (13,018,919) (882,570) (13,901,489)50,413,114 – – – – – – – 7,625,343 – 7,625,343
(457,873,227) 350,042,170 813,860,125 – – – – – (4,098,121,537) (13,275,165) (4,111,396,702)
247,891,334 (350,042,170) (813,860,125) – – – – – 3,611,117,470 13,275,165 3,624,392,635
(159,568,779) – – – – – – – (479,378,724) – (479,378,724)
536,947,787 – – – – – – – 1,918,115,581 – 1,918,115,581
P=377,379,008 P=– P=– P=– P=– P=– P=– P=– P=1,438,736,857 P=– P=1,438,736,857

Strong Fundamentals, Bright Prospects, Imminent Growth31
Insular Life Wealth Series FundsSTATEMENTS OF CASH FLOWS
See accompanying Notes to Financial Statements.
FOR THE YEARS ENDED DECEMBER 31, 2015 AND 2014Year Ended December 31, 2014
Peso Investment Funds
BalancedFund
Fixed IncomeFund
EquityFund
GrowthFund
StrategicResources
Fund
AsianEmerging
CompaniesFund
PhilippineEquity
AdvantageFund
Tranche 1
PhilippineEquity
AdvantageFund
Tranche 2
TotalPeso
InvestmentFunds
P=200,666,550 P=24,903,563 P=918,181,000 P=1,018,394,296 P=4,745,000 P=5,219,047 (P=30,073,000) (P=15,975,000) P=2,126,061,456
(201,551,583) 4,641,954 (928,848,182) (1,043,787,452) (4,745,000) (5,219,047) 30,073,000 15,975,000 (2,133,461,310)
(885,033) 29,545,517 (10,667,182) (25,393,156) – – – – (7,399,854)
(256,734) 390,267 (3,145,217) 16,209,863 – – – – 13,198,179– 913,565 536,668 32,902 – – – – 1,483,135– (466,241) 4,045,596 3,882,217 – – – – 7,461,572
1,141,767 160,131 19,983,823 21,865,885 – – – – 43,151,606– 30,543,239 10,753,688 16,597,711 – – – – 57,894,638
(5,592,210) (216,449,758) (466,127,997) (788,779,018) – – (305,000,000) (150,000,000) (1,931,948,983)
5,592,210 48,346,755 662,419,899 1,016,581,323 – – 305,000,000 150,000,000 2,187,940,187
– (137,559,764) 207,045,590 244,400,016 – – – – 313,885,842
140,468 227,397,473 322,140,474 517,603,537 – – – – 1,067,281,952
P=140,468 P=89,837,709 P=529,186,064 P=762,003,553 P=– P=– P=– P=– P=1,381,167,794
CASH FLOWS FROM OPERATING ACTIVITIESNet increase (decrease) in net assets attributableto unitholders resulting from operations
Adjustments for (gain) loss on increase/decreasein value and sale of investments - net
Operating income (loss) before workingcapital changesNet increase (decrease):
Subscription receivableInvestment income receivableOther receivable
Net (increase) decrease:Accounts payable, accrued and
other liabilitiesNet cash from operating activities
CASH FLOWS FROM INVESTING ACTIVITIESNet (acquisition) sale of investments
CASH FLOWS FROM FINANCING ACTIVITIESNet contributions (redemptions)to the funds
NET INCREASE (DECREASE) INCASH AND CASH EQUIVALENTS
CASH AND CASH EQUIVALENTSAT BEGINNING OF YEAR
CASH AND CASH EQUIVALENTSAT END OF YEAR (Note 3)

Strong Fundamentals, Bright Prospects, Imminent Growth32
Insular Life Wealth Series FundsSTATEMENTS OF CASH FLOWS
Year Ended December 31, 2014Dollar Investment Funds
Fixed IncomeFund
GreaterChina Fund
StrategicEnergy Fund
China PrimeFund
Tranche 1
China PrimeFund
Tranche 2
AsiaDynamic
Equity Fund
AsianEmerging
CompaniesFund
Euro BlueChips Dollar
Fund
TotalDollar
InvestmentFunds Total
EliminatingEntries Combined
P=102,327,265 (P=1,087,701) P=17,472,214 P=5,375,468 P=3,177,380 P=11,340,971 P=36,116,799 (P=16,495,340) P=158,227,056 P=2,284,288,512 (P=201,551,583) P=2,082,736,929
(67,430,381) 1,087,701 (17,472,214) (5,375,468) (3,177,380) (11,340,971) (36,116,799) 16,495,340 (123,330,172) (2,256,791,482) 201,551,583 (2,055,239,899)
34,896,884 – – – – – – – 34,896,884 27,497,030 – 27,497,030
(390,122) – – – – – – – (390,122) 12,808,057 256,734 13,064,791(3,131,964) – – – – – – – (3,131,964) (1,648,829) – (1,648,829)
8,051 – – – – – – – 8,051 7,469,623 932,480 8,402,103
(1,036,148) – – – – – – – (1,036,148) 42,115,458 (1,189,214) 40,926,24430,346,701 – – – – – – – 30,346,701 88,241,339 – 88,241,339
(133,929,354) – – – – – – (328,123,000) (462,052,354) (2,394,001,337) 5,592,211 (2,388,409,126)
310,859,749 – – – – – – 328,123,000 638,982,749 2,826,922,936 (5,592,211) 2,821,330,725
207,277,096 – – – – – – – 207,277,096 521,162,938 – 521,162,938
329,670,691 – – – – – – – 329,670,691 1,396,952,643 – 1,396,952,643
P=536,947,787 P=– P=– P=– P=– P=– P=– P=– P=536,947,787 P=1,918,115,581 P=– P=1,918,115,581
CASH FLOWS FROM OPERATING ACTIVITIESNet increase (decrease) in net assets attributableto unitholders resulting from operations
Adjustments for (gain) loss on increase/decreasein value and sale of investments - net
Operating income (loss) before workingcapital changesNet increase (decrease):
Subscription receivableInvestment income receivableOther receivable
Net (increase) decrease:Accounts payable, accrued and
other liabilitiesNet cash from operating activities
CASH FLOWS FROM INVESTING ACTIVITIESNet (acquisition) sale of investments
CASH FLOWS FROM FINANCING ACTIVITIESNet contributions (redemptions)to the funds
NET INCREASE (DECREASE) INCASH AND CASH EQUIVALENTS
CASH AND CASH EQUIVALENTSAT BEGINNING OF YEAR
CASH AND CASH EQUIVALENTSAT END OF YEAR (Note 3)
FOR THE YEARS ENDED DECEMBER 31, 2015 AND 2014
See accompanying Notes to Financial Statements.
Strong Fundamentals, Bright Prospects, Imminent Growth33
Insular Life Wealth Series FundsNOTES TO FINANCIAL STATEMENTS
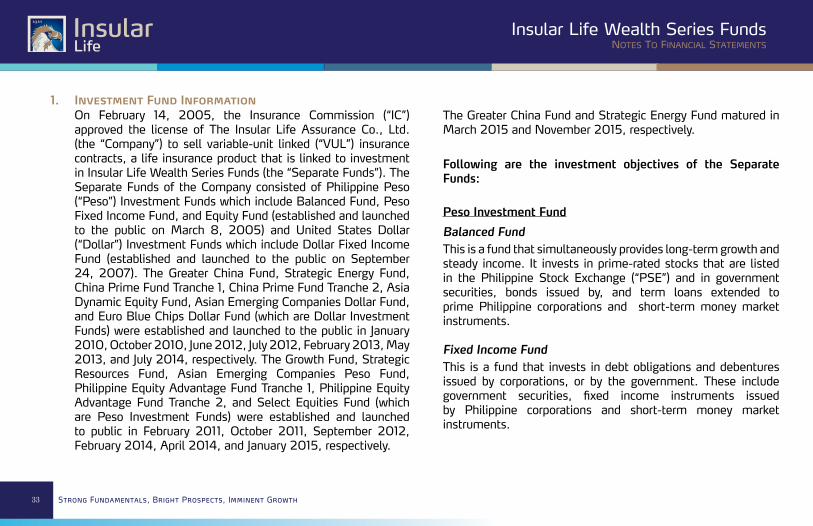
1. Investment Fund InformationOn February 14, 2005, the Insurance Commission (“IC”) approved the license of The Insular Life Assurance Co., Ltd. (the “Company”) to sell variable-unit linked (“VUL”) insurance contracts, a life insurance product that is linked to investment in Insular Life Wealth Series Funds (the “Separate Funds”). The Separate Funds of the Company consisted of Philippine Peso (“Peso”) Investment Funds which include Balanced Fund, Peso Fixed Income Fund, and Equity Fund (established and launched to the public on March 8, 2005) and United States Dollar (“Dollar”) Investment Funds which include Dollar Fixed Income Fund (established and launched to the public on September 24, 2007). The Greater China Fund, Strategic Energy Fund, China Prime Fund Tranche 1, China Prime Fund Tranche 2, Asia Dynamic Equity Fund, Asian Emerging Companies Dollar Fund, and Euro Blue Chips Dollar Fund (which are Dollar Investment Funds) were established and launched to the public in January 2010, October 2010, June 2012, July 2012, February 2013, May 2013, and July 2014, respectively. The Growth Fund, Strategic Resources Fund, Asian Emerging Companies Peso Fund, Philippine Equity Advantage Fund Tranche 1, Philippine Equity Advantage Fund Tranche 2, and Select Equities Fund (which are Peso Investment Funds) were established and launched to public in February 2011, October 2011, September 2012, February 2014, April 2014, and January 2015, respectively.
The Greater China Fund and Strategic Energy Fund matured in March 2015 and November 2015, respectively.
Following are the investment objectives of the Separate Funds:
Peso Investment Fund
Balanced FundThis is a fund that simultaneously provides long-term growth and steady income. It invests in prime-rated stocks that are listed in the Philippine Stock Exchange (“PSE”) and in government securities, bonds issued by, and term loans extended to prime Philippine corporations and short-term money market instruments.
Fixed Income FundThis is a fund that invests in debt obligations and debentures issued by corporations, or by the government. These include government securities, fixed income instruments issued by Philippine corporations and short-term money market instruments.

Strong Fundamentals, Bright Prospects, Imminent Growth34
Insular Life Wealth Series FundsNOTES TO FINANCIAL STATEMENTS
Strategic Resources FundThis is a fund that was offered for a limited period from August to September 2011. The objective of this fund is to deliver competitive returns on peso-denominated variable life insurance by investing in a structured note linked to the global resources of energy and agribusiness.
This fund is fully invested in a 5-year, Peso-linked, Dollar-structured note issued by ING Bank N.V. in October 2011. The structured note provides principal protection at maturity and an upside potential determined through participation in the performance of ING customized index which is allocated between cash and equities of SPDR S&P Oil & Gas Exploration & Production ETF (XOP US Equity) and Market Vectors Agribusiness ETF (MOO US Equity).
Asian Emerging Fund This is a fund that was offered for a limited period in September 2012. The objective of this fund is to deliver competitive returns on peso-denominated variable life insurance by investing in a structured note linked to the small-capitalized companies in Asia.
Equity FundThis is a fund that provides long-term total return and capital appreciation by investing primarily in dividend-paying shares of local companies with large capitalization and growth potential, and which are listed in the PSE. It also invests in short-term money market instruments.
Growth FundThis is a fund that provides long-term growth and capital appreciation by investing largely in medium to largely capitalized listed companies in the PSE leaning towards those with significant growth potential. It also invests in short-term money market instruments.
Select Equities FundThis is a fund that provides long-term portfolio growth from capital appreciation by primarily investing in ten (10) of the most liquid and well-capitalized dividend-paying stocks listed in the PSE. It also invests in short-term money market instruments.

Strong Fundamentals, Bright Prospects, Imminent Growth35
Insular Life Wealth Series FundsNOTES TO FINANCIAL STATEMENTS
This fund is fully invested in a 7-year, Peso-linked, Dollar-structured note issued by ING Bank N.V. in September 2012. The structured note provides principal protection at maturity and an upside potential determined through a participation in the performance of ING Asian Emerging Companies Index VT 10% Index.
Philippine Equity Advantage Fund - Tranche 1 This is a fund that was offered for a limited period in February 2014. The objective of this fund is to deliver competitive returns on peso-denominated variable life insurance by investing in a structured note linked to a custom index exposed to the Philippine Equity market.
This fund is fully invested in a 7-year, Peso-Denominated, Dollar-settled structured note issued by BNP Paribas in February 2014. The structured note provides principal protection at maturity and an upside potential determined through a participation in the performance of Insular Philippine Equity PHP VT 10% Index.
Philippine Equity Advantage Fund - Tranche 2This is a fund that was offered for a limited period in April 2014. The objective of this fund is to deliver competitive returns on peso-denominated variable life insurance by investing
in a structured note linked to a custom index exposed to the Philippine Equity market.
This fund is fully invested on a 7-year, Peso-Denominated, Dollar-settled structured note issued by BNP Paribas in April 2014. The structured note provides principal protection at maturity and an upside potential determined through a participation in the performance of Insular Philippine Equity PHP 2 VT 10% Index.
Dollar Investment Fund
Fixed Income Fund This is a fund that seeks to achieve capital preservation and provide income growth over a medium to long term period by investing on a diversified portfolio of Dollar-denominated fixed income instruments issued mainly by the Philippine government and prime corporations.
Greater China Fund This is a fund that was offered for a limited period from January to February 2010. The objective of this fund is to deliver competitive returns on Dollar-denominated variable life insurance by investing in a structured note linked to the growth markets of Greater China.

Strong Fundamentals, Bright Prospects, Imminent Growth36
Insular Life Wealth Series FundsNOTES TO FINANCIAL STATEMENTS
This fund is fully invested in a 5-year, Dollar-structured note issued by Citigroup Funding Inc. on February 22, 2010. The structured note, which is guaranteed by Citigroup, Inc., provides principal protection at maturity and an upside potential determined through a participation in the performance of the equity markets of Hong Kong, China, and Taiwan as represented by the Tracker Fund of Hong Kong (2800 HK Equity), Hang Seng Investment Index Funds Series - H Share Index Exchange Traded Fund (2828 HK Equity), and MSCI Taiwan Index (TAMSCI), respectively. This fund, with 7,228 total units, matured on February 24, 2015. This fund’s net asset value per unit (NAVPU) at maturity amounted to $1,026.77.
Strategic Energy FundThis is a fund that was offered for a limited period from October to November 2010. The objective of this fund is to deliver competitive returns on Dollar-denominated variable life insurance by investing in a structured note linked to the credit of the Republic of the Philippines (“ROP”) and to a basket of energy equity indices.
This fund is fully invested in a 5-year, Dollar-structured note issued by ING Bank N.V. on November 16, 2010. In the absence of a credit event by the ROP or the issuer, the structured note provides principal protection at maturity plus an
upside potential. The upside potential of the note is derived through participation in the performance of global energy indices represented by Energy Select Sector (XLE US Equity) and Powershares Wilderhill Clean Energy Portfolio (PBW US). This fund, with 16,300 total units, matured on November 16, 2015. This fund’s NAVPU at maturity amounted to $1,058.60.
China Prime Fund – Tranche 1 This is a fund that was offered for a limited period in June 2012. The objective of this fund is to deliver competitive returns on Dollar-denominated variable life insurance by investing in a structured note linked to the select stock companies in China.
This fund is fully invested in a 7-year, Dollar-structured note issued by Citigroup Funding Inc. in July 2012. The structured note, which is guaranteed by Citigroup, Inc., provides principal protection at maturity and an upside potential determined through a participation in the performance of the equity markets in China as represented by the Tracker Fund of Hang Seng Investment Enterprises Index (“HSCEI”).

Strong Fundamentals, Bright Prospects, Imminent Growth37
Insular Life Wealth Series FundsNOTES TO FINANCIAL STATEMENTS
China Prime Fund – Tranche 2 This is a fund that was offered for a limited period in July 2012. The objective of this fund is to deliver competitive returns on Dollar-denominated variable life insurance by investing in a structured note linked to the select stock companies in China.
This fund is fully invested in a 7-year, Dollar-structured note issued by Citigroup Funding Inc. in July 2012. The structured note, which is guaranteed by Citigroup, Inc., provides principal protection at maturity and an upside potential determined through a participation in the performance of the equity markets in China as represented by the Tracker Fund of HSCEI.
Asia Dynamic Equity FundThis fund was offered for a limited period in February 2013. The objective of this fund is to deliver competitive returns on dollar denominated variable life insurance by investing in a structured note that provides exposure to equities listed in Asia excluding Japan.
This fund is fully invested in a 7-year, Dollar-structured note issued by Standard Chartered Bank in March 2013. It provides payouts from the 1st to the 6th policy anniversary of 0.5% of the in force single premium and an upside potential at maturity determined through a participation in the performance of the Asia Risk Control Investable Index (ARC-I Index).
Asian Emerging Companies FundThis fund was offered for a limited period in May 2013. The objective of this fund is to deliver competitive returns on Dollar-denominated variable life insurance by investing in a structured note that provides exposure to emerging companies in Asia through a customized risk-control index called ING Asian Emerging Companies VT 10% Index.
The fund is fully invested in a 10-year, Dollar-structured note issued by ING Bank N.V. in May 2013. Maturity benefit of the note is paid out in four equal payouts on the 7th, 8th, 9th, and 10th anniversary. The payout will include both portion of the principal and the upside potential observed during the first 7 years through a participation in the performance of the ING Asian Emerging Companies VT 10% Index.

Strong Fundamentals, Bright Prospects, Imminent Growth38
Insular Life Wealth Series FundsNOTES TO FINANCIAL STATEMENTS
Euro Blue Chips Dollar FundThis fund was offered for a limited period in July 2014. The objective of this fund is to deliver competitive returns on Dollar-denominated variable life insurance by investing in a structured note that provides exposure to European Blue-Chip companies through a customized risk-control index called ING European Blue-Chip Companies VT 10% Index.
The fund is fully invested in a 7-year, Dollar-structured note linked to ROP credit issued by ING Bank N.V. in July 2014. The structured note provides principal protection at maturity and an upside potential determined through a participation in the performance of ING European Blue-Chip Companies VT 10% Index.
Balance Fund, Peso Fixed Income Fund, Equity Fund, Growth Fund, Select Equities Fund (which are all Peso Investment Funds), and Dollar Fixed Income Fund (which is a Dollar Investment Fund) are classified as “Traditional VUL.”
Strategic Resources Fund, Asian Emerging Companies Fund, Philippine Equity Advantage Fund Tranche 1, and Philippine Equity Advantage Fund Tranche 2 (which are all Peso
Investment Funds); and Greater China Fund, Strategic Energy Fund, China Prime Fund Tranche 1, China Prime Fund Tranche 2, Asia Dynamic Equity Fund, Asian Emerging Companies Fund, and Euro Blue Chips Dollar Fund (which are all Dollar Investment Funds) are classified as “Structured VUL.”
The Company entered into Service Level Agreement with a third-party multinational bank (the “Fund Administrator”) accredited by the Bangko Sentral ng Pilipinas (“BSP”). Under this agreement, the Fund Administrator shall perform fund accounting and valuation services of the Separate Funds. Custodianship of Separate Funds’ assets is also done by the said third-party multinational bank accredited by the BSP. The Company acts as Fund Manager to the Separate Funds.
The financial statements of the Separate Funds, which were prepared from the accounts maintained by the Fund Administrator, are provided solely for the Company’s use and for submission to the IC.
The financial statements were authorized for issue by the President and Chief Operating Officer of the Company on March 31, 2016.

Strong Fundamentals, Bright Prospects, Imminent Growth39
Insular Life Wealth Series FundsNOTES TO FINANCIAL STATEMENTS
2. Summary of Significant Accounting and Financial Reporting Policies
Statement of ComplianceThe Separate Funds’ financial statements have been prepared in accordance with Philippine Financial Reporting Standards (“PFRS”).
Basis of Financial Statement PreparationThe financial statements have been prepared on a historical cost basis, except for financial assets at fair value through profit or loss (“FVPL”) which are carried at fair value. The financial statements are presented in Philippine Peso, which is the Separate Funds’ functional currency.
The financial statements include the financial statements of the 15 and 16 Separate Wealth Series Funds as of December 31, 2015 and 2014, respectively, namely: Balanced Fund, Peso Fixed Income Fund, Equity Fund, Growth Fund, Select Equities Fund, Strategic Resources Fund, Asian Emerging Companies Fund, Philippine Equity Advantage Fund Tranche 1, and Philippine Equity Advantage Fund Tranche 2, which comprise the Peso Investment Funds; and Dollar Fixed Income Fund, Greater China Fund, Strategic Energy Fund, China Prime Fund Tranche 1, China Prime Fund Tranche 2, Asia Dynamic Equity Fund, Asian Emerging Companies Fund, and Euro Blue Chips
Dollar Fund, which comprise the Dollar Investment Funds. Inter-fund investments are eliminated in full.
Changes in Accounting PoliciesThe accounting policies adopted are consistent with those of the previous financial year, except that the Separate Funds have adopted the following new accounting pronouncements starting January 1, 2015. Adoption of these pronouncements is not expected to have a significant impact on the Separate Funds’ financial position or performance.
• Amendments to PAS 19, Employee Benefits - Defined Benefit Plans: Employee Contributions • Annual Improvements to PFRSs (2010 to 2012 cycle)• PFRS 2, Share-based Payment - Definition of Vesting Condition • PFRS 3, Business Combinations - Accounting for Contingent Consideration in a Business Combination • PFRS 8, Operating Segments - Aggregation of Operating Segments and Reconciliation of the Total of the Reportable Segments’ Assets to the Entity’s Assets • PAS 16, Property, Plant and Equipment, and PAS 38, Intangible Assets - Revaluation Method - Proportionate

Strong Fundamentals, Bright Prospects, Imminent Growth40
Insular Life Wealth Series FundsNOTES TO FINANCIAL STATEMENTS
Restatement of Accumulated Depreciation and Amortization• PAS 24, Related Party Disclosures - Key Management Personnel • Annual Improvements to PFRSs (2011 to 2013 cycle)• PFRS 3, Business Combinations - Scope Exceptions for Joint Arrangements • PFRS 13, Fair Value Measurement - Portfolio Exception • PAS 40, Investment Property - Clarifying the Interrelationship between PFRS 3 and PAS 40 when Classifying Property as Investment Property or Owner-occupied Property
Standards Issued but Not Yet EffectivePronouncements issued but not yet effective are listed in the next page. The Separate Funds does not expect that the future adoption of the said pronouncements to have a significant impact on its financial statements unless otherwise indicated. The Separate Funds intend to adopt the following pronouncements when they become effective.
Effective beginning January 1, 2016
• Amendments to PFRS 10, Consolidated Financial Statements, PFRS 12, Disclosure of Interests in Other Entities and PAS 28, Investments in Associates and Joint Ventures - Investment
Entities: Applying the Consolidation Exception• Amendments to PFRS 11, Joint Arrangements - Accounting for Acquisitions of Interests in Joint Operations • PFRS 14, Regulatory Deferral Accounts• Amendments to PAS 1, Presentation of Financial Statements - Disclosure Initiative• Amendments to PAS 16 and PAS 38 - Clarification of Acceptable Methods of Depreciation and Amortization • Amendments to PAS 16 and PAS 41 - Bearer Plants • Amendments to PAS 27, Separate Financial Statements - Equity Method in Separate Financial Statements • Annual Improvements to PFRSs (2012 to 2014 cycle)• PFRS 5, Non-current Assets Held for Sale and Discontinued Operations - Changes in Methods of Disposal• PFRS 7, Financial Instruments: Disclosures - Servicing Contracts• PFRS 7 - Applicability of the Amendments to PFRS 7 to Condensed Interim Financial Statements• PAS 19, Employee Benefits - Discount Rate: Regional Market Issue• PAS 34, Interim Financial Reporting - Disclosure of Information ‘Elsewhere in the Interim Financial Report’
Effective beginning January 1, 2018

Strong Fundamentals, Bright Prospects, Imminent Growth41
Insular Life Wealth Series FundsNOTES TO FINANCIAL STATEMENTS
• PFRS 9, Financial Instruments (2014 or final version) In July 2014, the final version of PFRS 9, Financial Instruments, was issued. PFRS 9 reflects all phases of the financial instruments project and replaces PAS 39, Financial Instruments: Recognition and Measurement, and all previous versions of PFRS 9. The standard introduces new requirements for classification and measurement, impairment, and hedge accounting. PFRS 9 is effective for annual periods beginning on or after January 1, 2018, with early application permitted. Retrospective application is required, but comparative information is not compulsory. Early application of previous versions of PFRS 9 is permitted if the date of initial application is before February 1, 2015. Management is still assessing the impact of this new accounting standard.
Issued by the IASB but not yet adopted by the Financial Reporting Standards Council
• IFRS 16, Leases• Internal Financial Reporting Standards (IFRS 15), Revenue from Contracts with Customers
IFRS 15 was issued in May 2014 and establishes a new five-step model that will apply to revenue arising from contracts with
customers. Under IFRS 15 revenue is recognized at an amount that reflects the consideration to which an entity expects to be entitled in exchange for transferring goods or services to a customer. The principles in IFRS 15 provide a more structured approach to measuring and recognizing revenue.
The new revenue standard is applicable to all entities and will supersede all current revenue recognition requirements under IFRS. Either a full or modified retrospective application is required for annual periods beginning on or after January 1, 2018 with early adoption permitted. Management is currently assessing the impact of IFRS 15 and plans to adopt the new standard on the required effective date once adopted locally.
The Company continues to assess the impact of the above new and amended accounting standards and interpretations effective subsequent to 2015 on the Separate Funds’ financial statements in the period of initial application. Additional disclosures required by these amendments will be included in the financial statements when these amendments are adopted.

Strong Fundamentals, Bright Prospects, Imminent Growth42
Insular Life Wealth Series FundsNOTES TO FINANCIAL STATEMENTS
Fair Value MeasurementFinancial instruments in the Separate Funds are measured at fair value at the end of each reporting date. Fair value is the price that would be received to sell an asset or paid to transfer a liability in an orderly transaction between market participants at the measurement date. The fair value measurement is based on the presumption that the transaction to sell the asset or transfer the liability takes place in either case as follows:
• In the principal market for the asset or liability; or• In the absence of a principal market, in the most advantageous market for the asset or liability.
The principal or the most advantageous market must be accessible to the Company. The fair value of an asset or a liability is measured using the assumptions that market participants would use when pricing the asset or liability, assuming that market participants act in their economic best interest.
The Company uses valuation techniques that are appropriate in the circumstances and for which sufficient data are available to measure fair value, maximizing the use of relevant observable inputs and minimizing the use of unobservable inputs.
All assets and liabilities for which fair value is measured or disclosed in the financial statements are categorized within the fair value hierarchy, described as follows, based on the lowest level input that is significant to the fair value measurement as a whole:• Level 1 - Quoted (unadjusted) market prices in active markets for identical assets or liabilities;• Level 2 - Valuation techniques for which the lowest level input that is significant to the fair value measurement is directly or indirectly observable; or• Level 3 - Valuation techniques for which the lowest level input that is significant to the fair value measurement is unobservable.
For assets and liabilities that are recognized in the Separate Funds’ financial statements on a recurring basis, the Company determines whether transfers have occurred between levels in the hierarchy by re-assessing categorization (based on the lowest level input that is significant to the fair value measurement as a whole) at the end of each reporting period.
The Company’s management determines the policies and procedures for both recurring and non-recurring fair value measurement.

Strong Fundamentals, Bright Prospects, Imminent Growth43
Insular Life Wealth Series FundsNOTES TO FINANCIAL STATEMENTS
At each reporting date, the management analyzes the movements in the values of assets and liabilities of the Separate Funds which are required to be re-measured or re-assessed as per the Company’s accounting policies. For this analysis, management verifies the major inputs applied in the latest valuation by agreeing the information in the valuation computation to contracts and other relevant documents.
For the purpose of fair value disclosures, the Company has determined classes of assets and liabilities on the basis of the nature, characteristics and risks of the asset or liability, and the level of the fair value hierarchy as explained above.
Financial InstrumentsThe Company recognizes a financial asset or a financial liability in the statements of financial position when it becomes a party to the contractual provisions of the instrument.All regular way purchases and sales of financial assets are recognized on the trade date, i.e., the date the Company commits to purchase or sell the financial asset. Regular way purchases or sales of financial assets require delivery of financial assets within the time frame generally established by regulation or convention in the market place.
Financial assets and financial liabilities are recognized initially at fair value. Transaction costs, if any, are included in the initial measurement of all financial assets and financial liabilities, except for financial instruments measured at FVPL.Financial liabilities, on the other hand, are classified as either financial liabilities at FVPL or other financial liabilities, as appropriate. The Company determines the classification of its financial instruments at initial recognition and, where allowed and appropriate, re-evaluates this designation at every reporting date.
Financial Assets at FVPLFinancial assets at FVPL include financial assets held-for-trading purposes or designated by management as financial asset at FVPL at initial recognition. Derivative instruments, except those covered by hedge accounting relationships, are classified under this category.
Financial assets are classified as held-for-trading if they are acquired for the purpose of selling in the near term.
Financial assets are designated as at FVPL by management on initial recognition when any of the following criteria is met:
Strong Fundamentals, Bright Prospects, Imminent Growth44
Insular Life Wealth Series FundsNOTES TO FINANCIAL STATEMENTS
• the designation eliminates or significantly reduces the inconsistent treatment that would otherwise arise from measuring the financial assets or recognizing gains or losses on them on a different basis; or• the assets are part of a group of financial assets, which are managed and their performance evaluated on a fair value basis, in accordance with a documented risk management or investment strategy; or• the financial instrument contains an embedded derivative, unless the embedded derivative does not significantly modify the cash flows or it is clear, with little or no analysis, that it would not be separately recorded.
These financial assets are subsequently measured at fair market value. Realized and unrealized gains and losses arising from changes in fair market value of financial assets at FVPL are recognized in the statements of comprehensive income. Interest earned on debt securities is recognized as the interest accrues taking into account the effective interest rate. Dividend income on equity securities is recognized according to the terms of the contract or when the right to receive payment has been established.
As of December 31, 2015 and 2014, the Separate Funds’ financial assets at FVPL consist of debt securities, equity securities, and
inter-fund investments. Inter-fund investments are eliminated in full in the statements of financial position.
After initial measurement, financial assets which are classified as financial assets at FVPL, are measured at their fair values in the Separate Funds. The fair value of financial asset is based on their quoted market prices on a recognized exchange or sourced from a reputable counterparty, in the case of non-exchange traded instruments, at the reporting date without any deduction for estimated future selling costs.
Subsequent changes in the fair value of financial assets at FVPL are recognized in the statements of comprehensive income.
Loans and receivablesLoans and receivables are non-derivative financial assets with fixed or determinable payments that are not quoted in active markets. These comprise of cash and cash equivalents, subscriptions receivable, investment income receivable, and other receivables.
After initial measurement, such assets are subsequently measured at amortized cost using effective interest r`ate method less any allowance for impairment. The effective interest rate

Strong Fundamentals, Bright Prospects, Imminent Growth45
Insular Life Wealth Series FundsNOTES TO FINANCIAL STATEMENTS
amortization and loss arising from impairment, if any, are recognized in the statements of comprehensive income.
Derecognition of Financial AssetsA financial asset (or, where applicable, a part of a financial asset or part of a group of similar financial assets) is derecognized when:• the rights to receive cash flows from the financial asset have expired;• the Separate Funds retain the right to receive cash flows from the financial asset, but has assumed an obligation to pay them in full without material delay to a third party under a “pass-through” arrangement; or• the Separate Funds have transferred its right to receive cash flows from the financial asset and either (a) has transferred substantially all the risks and rewards of the financial asset, or (b) has neither transferred nor retained substantially all the risks and rewards of the financial asset, but have transferred control of the financial asset.
Where the Separate Funds have transferred rights to receive cash flows from a financial asset and have neither transferred nor retained substantially all the risks and rewards of the asset nor transferred control of the financial asset, the financial asset is recognized to the extent of the Separate Funds’ continuing involvement in the asset.
Continuing involvement that takes the form of a guarantee over the transferred asset is measured at the lower of the original carrying amount of the asset and the maximum amount of consideration that the Separate Funds could be required to repay.
Impairment of Financial AssetsThe Company assesses at the end of each reporting period whether there is objective evidence that a financial asset or group of financial asset in the Separate Funds is impaired. A financial asset or group of financial assets is deemed to be impaired if, and only if, there is objective evidence of impairment as a result of one or more events that occurred after the initial recognition of the asset (an incurred “loss event”) and that loss event has an impact on the estimated future cash flows of the financial asset or group of financial assets that can be reliably estimated.
Evidence of impairment may include indications that a debtor or a group of debtors is experiencing significant financial difficulty, default or delinquency in interests or principal repayments, the probability that they will enter bankruptcy or other financial reorganization, and observable data indicating that there is a measurable decrease in the estimated future cash flows, such as changes in arrears or economic conditions that correlate with defaults.

Strong Fundamentals, Bright Prospects, Imminent Growth46
Insular Life Wealth Series FundsNOTES TO FINANCIAL STATEMENTS
Financial assets carried at amortized costFor financial assets carried at amortized cost, the Company first assesses individually whether objective evidence of impairment exists for financial assets in the Separate Funds that are individually significant, or collectively, for financial assets that are not individually significant. If the Company determined that no objective evidence of impairment exists for an individually assessed financial asset, whether significant or not, it include the asset in a group of financial assets with similar credit risk characteristics and collectively assess them for impairment. Assets that are individually assessed for impairment and for which an impairment loss is, or continues to be recognized are not included in a collective assessment of impairment.
If there is objective evidence that an impairment loss has been incurred, the amount of loss is measured as the difference between the assets’ carrying amount and the present value of estimated future cash flows (excluding future credit losses that have not yet been incurred).
The present value of the estimated future cash flows is discounted at the financial asset’s original effective interest rate (i.e., the effective interest rate computed at initial recognition).
If a loan has variable interest rate, the discount rate for measuring any impairment loss is the current effective interest rate.
The carrying amount of the asset is reduced through the use of an allowance account and the loss is recognized in the statements of comprehensive income. Interest income continues to be accrued on the reduced carrying amount and is accrued using the rate of interest used to discount the future cash flows for the purpose of measuring the impairment loss. Loans and receivables together with any associated allowance are written off when there is no realistic prospect of future recovery and all collateral has been realized or has been transferred to the Separate Funds.
If, in a subsequent period, the amount of the estimated impairment loss increases or decreases because of an event occurring after the impairment was recognized, the previously recognized impairment loss is increased or reduced by adjusting the allowance account. If a write-off is later recovered, the recovery is credited to the statements of comprehensive income.
Cash and Cash EquivalentsFor the purpose of the statements of cash flows, cash includes cash in banks. Cash equivalents are short-term, highly liquid

Strong Fundamentals, Bright Prospects, Imminent Growth47
Insular Life Wealth Series FundsNOTES TO FINANCIAL STATEMENTS
investments that are readily convertible to known amounts of cash with original maturities of three months or less and that are subject to an insignificant risk of change in value.
Revenue RecognitionRevenue is recognized when it is probable that the economic benefits will flow to the Separate Funds and when the revenue can be measured reliably, on the following bases:
Interest income is recognized on an accrual basis using the effective interest rate method by applying the rate that discounts the estimated future cash receipts over the expected life of the financial instrument to the net carrying amount of the financial asset. Interest income on cash and cash equivalents (“Interest income-deposits” in the statements of comprehensive income) is disclosed separately from interest income on debt securities (“Interest income-debt securities” in the statements of comprehensive income).
Dividend income is recognized when the Separate Funds’ rights to receive payment has been established. Dividend income relating to exchange-traded equity investments is recognized in the statements of comprehensive income on ex-
dividend date. Property dividend is recognized for the amount of cash dividend alternative with the corresponding debit treated as an additional investment.
Realized gains and losses on investment arise from sale of investments while unrealized gains and losses on investments include marked to market valuation of investment held as of reporting date.
Expense RecognitionAll expenses, including administration, custody, and investment management fees, are recognized in the statements of comprehensive income on an accrual basis.
Administration, custody, and investment management fees of the Separate Funds are being charged by the Fund Administrators, Fund Custodians, and the Fund Manager, respectively, as a percentage of the Separate Funds’ net asset value before deduction for such expenses and are recognized in the statements of comprehensive income as they accrue.
Transaction costs include charges by brokers for the purchase and sell transactions of equity and debt securities and are recognized in the statements of comprehensive income when incurred.

Strong Fundamentals, Bright Prospects, Imminent Growth48
Insular Life Wealth Series FundsNOTES TO FINANCIAL STATEMENTS
2015
Peso Investment Funds
DollarInvestment
Fund
BalancedFund
FixedIncome
FundEquity
FundGrowth
Fund
SelectEquities
FundFixed
Income Fund CombinedCash in banks P=133,762 P=386,377 P=1,210,659 P=1,605,636 P=1,921,415 P=139,019,660 P=144,277,509Cash equivalents – 90,100,000 532,300,000 237,300,000 196,400,000 238,359,348 1,294,459,348
P=133,762 P=90,486,377 P=533,510,659 P=238,905,636 P=198,321,415 P=377,379,008 P=1,438,736,857
2014
Peso Investment Funds
DollarInvestment
FundBalanced
FundFixed
Income FundEquity
FundGrowth
FundFixed
Income Fund CombinedCash in banks P=140,468 P=1,837,709 P=1,186,064 P=1,503,553 P=536,947,787 P=541,615,581Cash equivalents – 88,000,000 528,000,000 760,500,000 – 1,376,500,000
P=140,468 P=89,837,709 P=529,186,064 P=762,003,553 P=536,947,787 P=1,918,115,581
Cash in banks earns interest at the prevailing bank deposit rates. Cash equivalents are made for varying periods of between one day and three months and earn interest at the prevailing short-term deposit rates. Interest income on bank deposits totaled P5,596,421 and P3,538,881 in 2015 and 2014, respectively.
3. Cash and Cash Equivalents

Strong Fundamentals, Bright Prospects, Imminent Growth49
Insular Life Wealth Series FundsNOTES TO FINANCIAL STATEMENTS
4. Financial Assets at Fair Value Through Profit or Loss
Investments in Debt Securities
2015Peso Investment Funds
FixedIncome
Fund
StrategicResources
Fund
AsianEmerging
CompaniesFund
PhilippineEquity
AdvantageFund
Tranche 1
PhilippineEquity
AdvantageFund
Tranche 2Acquisition cost 000,000,051=P 000,000,503=P 000,174,573=P 000,000,523=P 980,993,662,1=PIncrease (decrease) in value of investments (4,244,630) (10,920,000) (89,099,268) (36,051,000) (19,080,000)Fair value 000,029,031=P 000,949,862=P 237,173,682=P 000,080,413=P 954,451,262,1=P
2014Peso Investment Funds
FixedIncome
Fund
StrategicResources
Fund
AsianEmerging
CompaniesFund
PhilippineEquity
AdvantageFund
Tranche 1
PhilippineEquity
AdvantageFund
Tranche 2Acquisition cost 035,449,542,1=P P=325,000,000 P=375,471,000 P=305,000,000 P=150,000,000Increase (decrease) in value of investments 31,461,895 (2,210,000) (65,707,425) (30,073,000) (15,975,000)Fair value P=1,277,406,425 P=322,790,000 P=309,763,575 P=274,927,000 P=134,025,000

Strong Fundamentals, Bright Prospects, Imminent Growth50
Insular Life Wealth Series FundsNOTES TO FINANCIAL STATEMENTS
2015Dollar Investment Funds
FixedIncome
Fund
China PrimeFund
Tranche 1
China PrimeFund
Tranche 2
AsiaDynamic
Equity Fund
AsiaEmerging
Fund
Euro BlueChips Dollar
Fund Combined000,656,771=P 234,984,256,1=P 000,041,444=P 000,242,331=P 005,427,77=P 120,542,532,5=P 000,321,823=P
(2,779,861) 4,216,096 812,786 (1,380,014) (44,738,312) (7,701,251) (210,965,454)175,907,946,1=P 690,278,181=P 886,104,993=P 689,168,131=P 682,735,87=P 947,124,023=P 765,972,420,5=P
2014Dollar Investment Funds
FixedIncome
Fund
GreaterChinaFund
StrategicEnergy
Fund
China PrimeFund
Tranche 1
China PrimeFund
Tranche 2
AsiaDynamic
Equity Fund
AsiaEmerging
Fund
Euro BlueChips Dollar
Fund CombinedP=1,100,854,986 P=321,024,392 P=723,948,200 P=177,656,000 P=77,724,500 P=133,242,000 P=444,140,000 P=328,123,000 806,821,807,5=P
32,017,630 4,369,714 13,490,499 (3,596,160) (2,900,676) (6,859,886) (51,867,335) (16,495,340) (114,345,084)P=1,132,872,616 P=325,394,106 P=737,438,699 P=174,059,840 P=74,823,824 P=126,382,114 P=392,272,665 P =311,627,660 425,387,395,5=P
Acquisition costIncrease (decrease) in value of investmentsFair value
Acquisition costIncrease (decrease) in value of investmentsFair value
Investments in debt securities include bonds and structured notes (see Note 8).

Strong Fundamentals, Bright Prospects, Imminent Growth51
Insular Life Wealth Series FundsNOTES TO FINANCIAL STATEMENTS
2015
2015Peso Investment Funds
Dollar Investment Funds
FixedIncome
Fund
StrategicResources
Fund*
AsianEmerging
CompaniesFund*
PhilippineEquity
AdvantageFund
Tranche 1*
PhilippineEquity
AdvantageFund
Tranche 2*
FixedIncome
Fund
China PrimeFund
Tranche 1*
China PrimeFund
Tranche 2*
AsiaDynamic
Equity Fund*
AsiaEmerging
Fund*
Euro BlueChips Dollar
Fund* Combined
Due after one year through five years 000,174,573=P 000,000,523=P 350,040,806=P P=– P=–
568,920,307=P 000,466,881=P 005,045,28=P 000,894,141=P P=– P=– 814,342,424,2 =P
Due after five years 1,227,227,197 – – 305,000,000 150,000,000
1,687,781,070 – – – 471,660,000 356,103,300 4,197,771,567539,018,093,2=P
000,000,051=P 000,000,503=P 000,174,573=P 000,000,523=P 052,762,538,1=P
000,466,881=P 005,045,28=P 000,894,141=P 000,066,174=P 003,301,653=P 589,410,226,6=P
Due after one year through five yearsDue after five years
The following tables present the breakdown of investments in debt securities by contractual maturity as of
*The contractual maturity disclosed represents the acquisition cost of these securities due to the difficulty in projecting the maturity value of the structured notes based on the best available data

Strong Fundamentals, Bright Prospects, Imminent Growth52
Insular Life Wealth Series FundsNOTES TO FINANCIAL STATEMENTS
2014Peso Investment Funds
FixedIncome
Fund
StrategicResources
Fund*
AsianEmerging
CompaniesFund*
PhilippineEquity
AdvantageFund
Tranche 1*
PhilippineEquity
AdvantageFund
Tranche 2*Due after one year through five years P=713,205,913 P=325,000,000 P=375,471,000 P=– P=–Due after five years 1,034,591,458 – – 305,000,000 150,000,000
P=1,747,797,371 P=325,000,000 P=375,471,000 P=305,000,000 P=150,000,000
Due after one year through five yearsDue after five years
2014Dollar Investment Funds
FixedIncome
Fund
GreaterChinaFund*
StrategicEnergyFund*
China PrimeFund
Tranche 1*
China PrimeFund
Tranche 2*
AsiaDynamic
Equity Fund*
AsiaEmerging
Fund*
Euro BlueChips Dollar
Fund* CombinedP=508,611,492 P=322,491,676 P=727,257,100 P=178,468,000 P=78,079,750 P=– P=– P=– 139,485,822,3=P1,092,893,415 – – – – 133,851,000 446,170,000 336,858,350 3,499,364,223P=1,601,504,907 P=322,491,676 P=727,257,100 P=178,468,000 P=78,079,750 P=133,851,000 P=446,170,000 P=336,858,350 451,949,727,6=P
*The contractual maturity disclosed represents the acquisition cost of these securities due to the difficulty in projecting the maturity value of the structured notes based on the best available data
Interest income from investment in debt securities totaled P134,278,764 and P119,978,998 in 2015 and 2014, respectively.

Strong Fundamentals, Bright Prospects, Imminent Growth53
Insular Life Wealth Series FundsNOTES TO FINANCIAL STATEMENTS
Investments in Equity Securities
2015Equity
FundGrowth
FundSelect Equities
Fund CombinedAcquisition cost P=3,633,207,813 P=3,916,667,566 P=4,941,723,326 P=12,491,598,705Increase in value of investments 710,003,289 394,035,874 (685,546,712) 418,492,451Fair value P=4,343,211,102 P=4,310,703,440 P=4,256,176,614 P=12,910,091,156
2014Equity
FundGrowth
Fund CombinedAcquisition costP =3,270,938,018 P=4,067,377,251 P=7,338,315,269Increase in value of investments 1,299,039,637 1,125,502,659 2,424,542,296Fair value P=4,569,977,655 P=5,192,879,910 P=9,762,857,565

Strong Fundamentals, Bright Prospects, Imminent Growth54
Insular Life Wealth Series FundsNOTES TO FINANCIAL STATEMENTS
5. Receivables
2015
Peso Investment Funds
DollarInvestment
Fund
BalancedFund
FixedIncome
FundEquity
FundGrowth
Fund
SelectEquities
Fund
FixedIncome
Fund CombinedInvestment incomereceivables: Accrued interest P=– P=9,681,768 P=7,097 P=3,164 P=2,619 P=30,688,453 P=40,383,101 Accrued dividends – – 1,819,065 962,582 4,188,969 – 6,970,616
– 9,681,768 1,826,162 965,746 4,191,588 30,688,453 47,353,717Subscriptions receivable – 358,323 2,139,940 – 2,819,989 75,185 5,393,437Other receivables 1,000 – 2,153 299 – 283 3,735
P=1,000 P=10,040,091 P=3,968,255 P=966,045 P=7,011,577 P=30,763,921 P=52,750,889
2014
Peso Investment Funds
DollarInvestment
FundFixed
IncomeFund
EquityFund
GrowthFund
Fixed IncomeFund Combined
Investment income receivables: Accrued interest P=9,416,990 P=7,040 P=10,140 P=20,990,028 P=30,424,198 Accrued dividends – 1,218,907 1,016,290 – 2,235,197
9,416,990 1,225,947 1,026,430 20,990,028 32,659,395Subscriptions receivable 287,841 8,415,055 3,188,047 390,122 12,281,065Other receivables – 4,295 4,591 – 8,886
P=9,704,831 P=9,645,297 P=4,219,068 P=21,380,150 P=44,949,346

Strong Fundamentals, Bright Prospects, Imminent Growth55
Insular Life Wealth Series FundsNOTES TO FINANCIAL STATEMENTS
• Accrued interest receivable pertains to interest earned on investments in debt securities but not yet credited to the Separate Funds as of reporting date. Interest rates for such investments range from 1.625% to 10.625% for both in 2015 and 2014.
• Accrued dividend receivables are noninterest-bearing and pertain to dividends earned on investment in equity securities but not yet received by the Separate Funds.
• Subscription receivable pertains to value of units subscribed but not yet received as at reporting date. Subscription receivables of Balanced Fund amounting PHP425,722 in 2014 (nil in 2015), have been eliminated in full (see Note 6).
• Other receivable includes due from Fund Manager and outstanding sales as at reporting period. Inter-fund receivable of Peso Fixed Income Fund amounting PHP1,003,991 and PHP593,334 in 2015 and 2014, respectively; inter-fund receivable of Equity Fund amounting PHP1,003,991 and PHP593,334 in 2015 and 2014, respectively; and inter-fund receivable of Balanced Fund amounting P486,978 in 2015 (nil in 2014) have been eliminated in full (see Note 6).

Strong Fundamentals, Bright Prospects, Imminent Growth56
Insular Life Wealth Series FundsNOTES TO FINANCIAL STATEMENTS
6. Accounts Payable and Accrued and Other Liabilities
December 31, 2015
Peso Investment FundsDollar Investment
Fund
BalancedFund
FixedIncome
FundEquity
FundGrowth
FundSelect Equities
Fund
Fixed Income
Fund CombinedAccounts payable -
Due to broker –=P P=– P=1,996,960 P=998,518 –=P P=10,449,784 P=13,445,262Due to related party 486,978 1,309 1,309 700,226 – 52,904 1,242,726
486,978 1,309 1,998,269 1,698,744 – 10,502,688 14,687,988Accrued and other liabilities:
Management fees payable (Note 7) – 1,888,865 9,001,941 8,452,854 7,200,392 2,842,481 29,386,533
Administration fees payable (Note 7) 139,661 128,497 455,607 433,229 411,748 188,441 1,757,183
Custody fees payable (Note 7) – 30,974 80,357 79,973 79,156 79,819 350,279Professional fees payable – 74,521 74,521 74,521 66,917 74,689 365,169Transaction fees payable – – 38,171 2,900 9,700 – 50,771Taxes payable – – 18,059 20,674 22,591 3,937 65,261
Transaction fees payable 139,661 2,122,857 9,668,656 9,064,151 7,790,504 3,189,367 31,975,196P=626,639 P=2,124,166 P=11,666,925 P=10,762,895 P=7,790,504 P=13,692,055 P=46,663,184

Strong Fundamentals, Bright Prospects, Imminent Growth57
Insular Life Wealth Series FundsNOTES TO FINANCIAL STATEMENTS
December 31, 2014
Peso Investment FundsDollar Investment
Fund
BalancedFund
FixedIncome
FundEquity
FundGrowth
Fund
Fixed Income
Fund CombinedAccounts payable -
Due to broker –=P –=P 108,101,71=P 436,882,81=P –=P 534,093,53=PDue to related party – 1,309 1,309 – – 2,618
– 1,309 17,103,110 18,288,634 – 35,393,053Accrued and other liabilities:
Management fees payable (Note 7) – 1,907,343 9,032,619 10,403,956 2,263,203 23,607,121Administration fees payable (Note 7) 79,171 72,186 250,647 288,359 82,986 773,349Custody fees payable (Note 7) – 19,161 80,911 92,116 20,492 212,680Professional fees payable – 93,625 93,625 93,625 93,409 374,284Transaction fees payable – – 44,170 9,300 – 53,470Taxes payable – 3,117 74,857 71,092 1,650 150,716
79,171 2,095,432 9,576,829 10,958,448 2,461,740 25,171,620171,97=P P=2,096,741 939,976,62=P 280,742,92=P P=2,461,740 376,465,06=P
The accounts payable and accrued and other liabilities of Balanced Fund for 2015 and 2014 in the above table are net of inter-fund receivables and payables (see Note 5).

Strong Fundamentals, Bright Prospects, Imminent Growth58
Insular Life Wealth Series FundsNOTES TO FINANCIAL STATEMENTS
a) Management feesPursuant to the investment management agreement, the Fund Manager is entitled to receive from the Separate Funds an investment management fee equal to 1.5% per annum of the net asset value before deduction of the administration, custody, and investment management fee, of the Peso Fixed Income Fund and Dollar Fixed Income Fund; 1.75% per annum of the net asset value before deduction of the administration, custody, and investment management fee of the Select Equities Fund, and 2.0% per annum of the net asset value before deduction of investment management fee of the Growth Fund and the Equity Fund. The other remaining funds are passively managed. Due to this, no investment management fee was incurred in 2015 and 2014 related to these funds.
Investment management fees expense amounted to PHP313,567,646 and PHP222,824,082 in 2015 and 2014, respectively. Investment management fees payable outstanding as of December 31, 2015 and 2014 amounted to PHP29,386,533 and PHP23,607,121, respectively (see Note 6).
b) Administration feesPursuant to the Service Level Agreement, the Fund Administrator is entitled to receive administration fee
payable monthly in arrears and calculated at 5.5 basis points per annum based on the net asset value before deduction of the administration, custody, and investment management fees. Funds without administration fee incurred in 2015 and 2014 are passively administered.
Administration fees expense amounted to PHP10,283,606 and PHP7,523,972 in 2015 and 2014, respectively. Administration fees payable outstanding as ofDecember 31, 2015 and 2014 amounted to PHP1,757,183 and PHP773,349, respectively (see Note 6).
c) Custody feesPursuant to the Service Level Agreement, the Fund Custodian is entitled to receive between 2.0 to 3.0 basis points per annum based on the total portfolio asset value of the Separate Funds. Structured notes are held at the custody of the Company and as such there was no custody fee expense incurred for all structured notes in 2015 and 2014(see Note 6).
Custody fees expense amounted to PHP3,796,834 and PHP2,284,336 in 2015 and 2014, respectively. Outstanding balances of custody fees payable amounted to PHP350,279 and PHP212,680 as of December 31, 2015 and 2014, respectively (see Note 6).
7. Fees

Strong Fundamentals, Bright Prospects, Imminent Growth59
Insular Life Wealth Series FundsNOTES TO FINANCIAL STATEMENTS
8. Financial Instruments
The following tables summarize the financial instruments by category of the Separate Funds as of December 31:
2015Peso Investment Funds Dollar Investment Funds
TotalFair Value through
profit or lossLoans and
receivablesFair Value through
profit or lossLoans and
receivablesFinancial assetsTraditional VULs: Cash and cash equivalents –=P P=1,061,357,849 –=P P=377,379,008 P=1,438,736,857 Equity securities - quoted 12,910,091,156 – – – 12,910,091,156 Debt securities - quoted fixed interest rates 1,262,154,459 – 1,649,709,571 – 2,911,864,030 Subscriptions receivable – 5,318,252 – 75,185 5,393,437 Investment income receivable – 16,665,264 – 30,688,453 47,353,717 Other receivables – 3,452 – 283 3,735Structured VULs 1,000,320,732 – 1,112,094,805 – 2,112,415,537
P=15,172,566,347 P=1,083,344,817 P=2,761,804,376 P=408,142,929 P=19,425,858,469
2015Peso Investment Funds Dollar Investment Funds
Other financial liabilities
Other financial liabilities Total
Financial liabilitiesAccounts payable P=4,185,300 P=10,502,688 P=14,687,988Accrued and other liabilities* 28,724,505 3,185,430 31,909,935
P=32,909,805 P=13,688,118 P=46,597,923
*Excluding taxes payable amounting P=65,261

Strong Fundamentals, Bright Prospects, Imminent Growth60
Insular Life Wealth Series FundsNOTES TO FINANCIAL STATEMENTS
The carrying values of loans and receivables and other financial liabilities approximate their fair values since these are short term in nature.
2014Peso Investment Funds Dollar Investment Funds
Total Fair Value through
profit or lossLoans and
receivables Fair Value through
profit or lossLoans and
receivablesFinancial assetsTraditional VULs: Cash and cash equivalents –=P P=1,381,167,794 –=P 787,749,635=P P=1,918,115,581 Equity securities - quoted 9,762,857,565 – – – 9,762,857,565 Debt securities - quoted fixed interest rates 1,277,406,425 – 1,132,872,616 – 2,410,279,041 Subscriptions receivable – 11,890,943 – 390,122 12,281,065 Investment income receivable – 11,669,367 – 20,990,028 32,659,395 Other receivables – 8,886 – – 8,886Structured VULs 1,041,505,575 – 2,141,998,908 – 3,183,504,483
565,967,180,21=P P=1,404,736,990 P=3,274,871,524 610,607,913,71=P 739,723,855=P
2014Peso Investment Funds Dollar Investment Funds
Other financial liabilities
Other financial liabilities Total
Financial liabilitiesAccounts payable 350,393,53=P –=P 350,393,53=PAccrued and other liabilities* 22,560,814 2,460,090 25,020,904
768,359,75=P P=2,460,090 759,314,06=P
*Excluding taxes payable amounting P=150,716

Strong Fundamentals, Bright Prospects, Imminent Growth61
Insular Life Wealth Series FundsNOTES TO FINANCIAL STATEMENTS
The following table presents the fair value hierarchy of the financial assets at FVPL as at December 31, 2015 and 2014:
The fair values of financial assets at FVPL on Level 1 category are based on the quoted market prices.

Strong Fundamentals, Bright Prospects, Imminent Growth62
Insular Life Wealth Series FundsNOTES TO FINANCIAL STATEMENTS
The following table shows the reconciliation of the beginning and ending balances of Level 3 financial assets at FVPL as of December 31:
There were no transfers within different levels of the fair value hierarchy in 2015 and 2014.
The structured notes can be decomposed into bond components and option components. Fair value of structured notes has been computed by counterparties using present value calculations and option pricing models as applicable. The valuation requires management to make certain assumptions about the model inputs particularly the credit spread of the issuer. The model also used certain market observable inputs in`cluding credit default swap (CDS) of the ROP, USD interest rate swap rates (IRS) (for the USD denominated issuances), and USD/PHP cross currency swap rates (for the PHP-denominated issuances). The probabilities of the various estimates within the range can be reasonably assessed and are used in management’s estimate of the fair value of structured notes.
2015 2014PesoBeginning balance P=1,041,505,575 P=622,589,528Additions – 455,000,000Fair value loss (41,184,843) (36,083,953)Ending balance 1,000,320,732 1,041,505,575
USDBeginning balance 2,141,998,908 1,757,976,117Maturity (1,163,902,295) 328,123,000Fair value gain 133,998,192 55,899,791Ending balance 1,112,094,805 2,141,998,908Total Level 3 financial assets P=2,112,415,537 P=3,183,504,483

Strong Fundamentals, Bright Prospects, Imminent Growth63
Insular Life Wealth Series FundsNOTES TO FINANCIAL STATEMENTS
The analysis of the fair market value of the structured notes as of December 31 is performed for the reasonable possible movement in the significant inputs other than quoted prices included within Level 1, with all other variables held constant, showing the impact to profit and loss follows:

Strong Fundamentals, Bright Prospects, Imminent Growth64
Insular Life Wealth Series FundsNOTES TO FINANCIAL STATEMENTS

Strong Fundamentals, Bright Prospects, Imminent Growth65
Insular Life Wealth Series FundsNOTES TO FINANCIAL STATEMENTS
The analysis of the fair market value of the structured notes as of December 31 is performed for the reasonably possible movement in the significant unobservable inputs with all other variables held constant, showing the impact to profit and loss follows:

Strong Fundamentals, Bright Prospects, Imminent Growth66
Insular Life Wealth Series FundsNOTES TO FINANCIAL STATEMENTS
The Bank CDS level is based on the closest available CDS maturity of the counterparty matched to the remaining maturity of the structured notes. Further, the Bank CDS is a proxy for the funding cost of the counterparty which is considered as a significant unobservable input.
The estimates are based on assumptions that if altered can change the analysis expressed herein. This shall not constitute a representation or warranty as to future performance of the structured notes. Further, past performance is not indicative of future results.

Strong Fundamentals, Bright Prospects, Imminent Growth67
Insular Life Wealth Series FundsNOTES TO FINANCIAL STATEMENTS
9. Financial Risk Management Objectives and Policies
The financial instruments of the Separate Funds consist mainly of cash and cash equivalents, financial assets at FVPL, receivables, accounts payable, and accrued and other liabilities excluding taxes. The overall risk management program of the Separate Funds focuses on the unpredictability of financial markets and seeks to minimize potential adverse effects on financial performance. The Separate Funds is exposed to credit risk, liquidity risk, equity price risk, fair value interest rate risk, and foreign currency risk. These risks arise from open positions in interest rate, currency, and equity products, all of which are exposed to general and specific market movements.
Credit riskCredit risk is the risk that the Separate Funds will incur a loss because its counterparties failed to discharge their contractual obligations. The Separate Funds’ exposure to credit risk arises from default of the counterparty, with a maximum credit exposure equal to the carrying amount of the financial assets of the Separate Funds.
As of December 31, 2015 and 2014, all of the Separate Funds’ financial assets are neither past due nor impaired.
The Separate Funds use a credit rating concept based on the borrowers’ and counterparties’ overall creditworthiness, as follows:
• Investment grade - rating given to borrowers and counterparties who possess strong to very strong capacity to meet their obligations;• Non-investment grade - rating given to borrowers and counterparties who possess above average capacity to meet their obligations.
As of December 31, 2015 and 2014, all of the Separate Funds’ financial assets fall under investment grade category.
Risk concentrations of the maximum exposure to credit riskThe Company’s market risk policy requires it to manage such risks by setting and monitoring objectives and constraints on investments, diversification plan, and limits on investment in each industry or sector.

Strong Fundamentals, Bright Prospects, Imminent Growth68
Insular Life Wealth Series FundsNOTES TO FINANCIAL STATEMENTS
The following table presents the Separate Funds’ concentration of credit risk in its debt securities portfolio by industrial distribution as percentage of total debt securities as of December 31:
Liquidity riskLiquidity or funding risk is the risk that an entity will encounter difficulty in raising funds to meet commitments associated with financial instruments. Liquidity risk may result from either the inability to sell financial assets quickly at their fair values, or counterparty failing on repayment of a contractual obligation or inability to generate cash inflows as anticipated.
The Separate Funds manage liquidity through a group liquidity risk policy which determines what constitutes liquidity risk for the Separate Funds, specify minimum proportion of funds to meet emergency calls, set up of contingency funding plans, specify the sources of funding and the events that would trigger the plan, and determine concentration of funding sources, report of liquidity risk exposures, and breaches to the monitoring authority.
As of December 31, 2015 and 2014, the Separate Funds’ other financial liabilities excluding taxes payable amounting to PHP46,612,413 and PHP60,413,957 respectively, have maturities of less than one year. The Separate Funds has cash amounting to PHP1,438,736,857 and PHP1,918,115,581 as of December 31, 2015 and 2014, respectively, which are due on demand that can be used to settle financial liabilities.
2015 2014Government 52% 36%Financial institutions 42% 57%Electricity, energy, power,a nd water 4% 6%Others 2% 1%Total 100% 100%

Strong Fundamentals, Bright Prospects, Imminent Growth69
Insular Life Wealth Series FundsNOTES TO FINANCIAL STATEMENTS
Equity price riskThe Separate Funds’ equity price risk exposure at year-end relates to financial assets whose values will fluctuate as a result of changes in market prices.
Such investment securities are subject to price risk due to changes in market values of instruments arising either from factors specific to individual instruments or their issuers or factors affecting all instruments traded in the market.
The Separate Funds are exposed to equity price risk because of investments held under Equity Fund, Growth Fund, and Select Equities Fund which are classified in the statements of financial position as financial assets at FVPL. The following table demonstrates the sensitivity to a reasonable possible change in the price of equity securities as of December 31:
Risk concentrations of the maximum exposure to equity price riskThe Company’s market risk policy requires it to manage such risks by setting and monitoring objectives and constraints on investments, diversification plan, and limits on investment in each industry or sector.
2015 2014
Change in QuotedPrices of InvestmentsCarried at Fair Value
Effect onNet Asset ValueAttributable to
Unitholders
Change in QuotedPrices of InvestmentsCarried at Fair Value
Effect onNet Asset Value
Attributable toUnitholders
50 basis points rise P=64,545,641 50 basis points rise P=44,759,56250 basis points fall (64,545,641) 50 basis points fall (44,759,562)

Strong Fundamentals, Bright Prospects, Imminent Growth70
Insular Life Wealth Series FundsNOTES TO FINANCIAL STATEMENTS
The following table analyses the Separate Funds’ concentration of equity price risk in its equity portfolio by industrial distribution as percentage of total equity securities as of December 31:
2015 2014Holding Firms 23% 23%Banks 17% 10%Electricity, energy, power, and water 16% 23%Property 16% 10%Food, beverage, and tobacco 13% 13%Retail 5% 7%Transportation services 2% 4%Mining 2% 4%Others 6% 6%Total 100% 100%
Fair value interest rate riskFair value interest rate risk arises from the possibility that changes in interest rates will affect the fair values of investment in debt securities under FVPL. The exposure of the Separate Funds to market risk for changes in interest rates is related primarily to investments under the Peso Fixed Income Fund and Dollar Fixed Income Fund, which are classified in the statements of financial position as financial assets at FVPL.

Strong Fundamentals, Bright Prospects, Imminent Growth71
Insular Life Wealth Series FundsNOTES TO FINANCIAL STATEMENTS
2015 2014
Change in MarketRate of Interest
Effect onNet Asset Value Attributable to
UnitholdersChange in Market
Rate of Interest
Effect onNet Asset Value Attributable to
Unitholders25 basis points rise (P=51,932,587) 25 basis points rise (P=34,265,590)25 basis points fall 54,731,103 25 basis points fall 38,915,445
Foreign currency riskForeign currency risk is the risk that the fair value of future cash flows of a financial instrument will fluctuate because of changes in foreign exchange rates.
The following table demonstrates the sensitivity to a reasonable possible change in interest rates:

Strong Fundamentals, Bright Prospects, Imminent Growth72
Insular Life Wealth Series FundsNOTES TO FINANCIAL STATEMENTS
The Separate Funds’ foreign currency-denominated assets and liability as of December 31 consist of the following:
The foregoing Dollar amounts have been restated to their Peso equivalents using the exchange rate of PHP47.166 and PHP44.617 to USD1, as recommended by IC, as of December 31, 2015 and 2014, respectively.

Strong Fundamentals, Bright Prospects, Imminent Growth73
Insular Life Wealth Series FundsNOTES TO FINANCIAL STATEMENTS
The analysis below is performed for reasonably possible movements in key variables with all other variables held constant, showing the impact on net asset value attributable to unitholders:
2015 2014
Change in Peso -Foreign Exchange Rate
Effect onNet Asset Value Attributable to
UnitholdersChange in Peso -
Foreign Exchange Rate
Effect onNet Asset Value Attributable to
UnitholdersPeso appreciation of 1.53% P=48,290,705 Peso appreciation of 0.48% P=18,777,191Peso depreciation of 1.53% (48,290,705) Peso depreciation of 0.48% (18,777,191)

At Insular Life, we apply over a hundred years of experience in financial protection, savings and investments to help you make confident decisions for you and your loved ones. We recognize financial priorities change over time — that is why we are here to help you plan ahead, every step of the way.
As an Insular Life customer, you have the confidence of being protected by a company with a consolidated asset base of PHP106.1 billion, revenues of PHP19.9 billion, net income of PHP1.8 billion and total business-in-force of PHP251.6 billion as of year-end 2015.
We remain committed to serving the Filipino, as we spread the benefits of life insurance to every family. Thus, as you look ahead, be assured that Insular Life will guide you, as you advance from one life stage to the next.
Company Profile


![Downes v. Bidwell (1901) [Insular Cases]](https://img.pdfslide.us/doc/110x75/568165f6550346895dd91c9d/downes-v-bidwell-1901-insular-cases.jpg)