Embed Size (px)
Citation preview
2015 Canadian Drilling Activity ForecastPublished October 29, 2014
© 2014 Petroleum Services Association of Canada (PSAC) - Reproduction rights reserved. Nothing herein may be reprinted in part or in whole without explicit permission from PSAC.
page 1 Introduction
1 Acknowledgements
2 Methodology – Historical Well Counts & License Data
3 PSAC Area Map
4 PSAC 2015 Canadian Drilling Activity Forecast
8 Wells Drilled Canada – Summary
12 BC British Columbia BC1 Southern British Columbia
BC2 Northern British Columbia
BC3 Coastal British Columbia
18 AB1 Foothills
23 AB2 Foothills Front
29 AB3 Southeastern Alberta
35 AB4 East Central Alberta
41 AB5 Central Alberta
47 AB6 Northeastern Alberta
53 AB7 Northwestern Alberta
59 SK1 Central Saskatchewan
65 SK2 Southwestern Saskatchewan
71 SK3 Eastern Saskatchewan
77 MB Manitoba
83 ON Ontario
88 Eastern Canada Quebec, New Brunswick, Nova Scotia, Prince Edward Island and Newfoundland & Labrador
93 Northern Canada Yukon, Northwest Territories and Nunavut
2015 Canadian Drilling Activity Forecast – published October 29, 2014
Table of Contents
© 2014 Petroleum Services Association of Canada (PSAC) — Reproduction rights reserved. Nothing herein may be reprinted in part or in whole without explicit permission from PSAC.While all reasonable effort is made to ensure the quality and accuracy of the data, June Warren-Nickle’s Energy Group and PSAC accept no liability for the data contained within this report.
Rig release, Top Operators and license data by June Warren-Nickle’s Energy GroupPSAC Area Map by Digital Projections
12015 Canadian Drilling Activity Forecast – published October 29, 2014
© 2014 Petroleum Services Association of Canada (PSAC) — Reproduction rights reserved. Nothing herein may be reprinted in part or in whole without explicit permission from PSAC.While all reasonable effort is made to ensure the quality and accuracy of the data, June Warren-Nickle’s Energy Group and PSAC accept no liability for the data contained within this report.
Introduction
Purpose
Since 1991, the Petroleum Services Association of Canada (PSAC) has provided the PSAC
Canadian Drilling Activity Forecast to its membership, members of the petroleum industry
and other interested parties. The document estimates upcoming drilling activity levels in
Canada and reports historic activity levels.
Forecasts such as this one can help companies increase sales, streamline operations, set
budgets, analyze competition, define markets, price products and services, determine
geographic focal areas, position personnel and equipment, and identify key trends
affecting the future of the industry.
When used in conjunction with the PSAC Well Cost Study, the PSAC Canadian Drilling
Activity Forecast can be used to determine potential market sizes for drilling and
completion products and services, as well as pricing and activity direction.
Format
Components of the PSAC Canadian Drilling Activity Forecast include a projection of
activity levels for the coming year, as well as a breakdown of historic drilling data for
previous years. The document provides historical drilling activity levels and licensing
information broken down by:
• PSAC’s geographic areas in Canada
• Status (oil, gas, dry, service, standing)
• Status depth
• Developmental and exploratory activity
• Horizontal and directional drilling activity
• Top 20 operators for previous quarter
• Quarterly breakdown of activity
Additional information includes:
• Licenses issued by PSAC area
• Average license to spud days (by area)
• Average spud to rig release days (by area)
Subscriptions
The document is published in electronic format (.pdf) and is updated quarterly
(October, January, April, July). Subscribers receive access to the October forecast and all
of its updates (January, April, July).
Acknowledgements
In acknowledgement of our partners in preparing the 2015 PSAC Canadian Drilling
Activity Forecast, PSAC thanks June Warren - Nickle’s Energy Group for being the official
supplier of all of the rig release and license data. PSAC recognizes Digital Projections for
the development of the PSAC Area Map. Without the support of our partners, this
Forecast could not have been published.
Disclaimer
While all reasonable effort is made to ensure the quality and accuracy of this
document, June Warren - Nickle’s Energy Group and PSAC accept no liability for the
data contained within this report.
More Information
For additional information or comments, please contact:
Mark Salkeld, President
Petroleum Services Association of Canada (PSAC)
1150, 800 – 6th Avenue SW
Calgary, Alberta T2P 3G3
Tel: (403) 781-7383
Email: [email protected]

© 2014 Petroleum Services Association of Canada (PSAC) — Reproduction rights reserved. Nothing herein may be reprinted in part or in whole without explicit permission from PSAC.While all reasonable effort is made to ensure the quality and accuracy of the data, June Warren-Nickle’s Energy Group and PSAC accept no liability for the data contained within this report.
22015 Canadian Drilling Activity Forecast – published October 29, 2014
Well counts are based on a rig release classification, versus well completions. A rig released
well is reported immediately, once the hole has been drilled. Well completions are often not
reported until the well has been completed and is producing, which results in a reporting time
lag. Reporting based on rig release date is beneficial for counting the number of wells that
have actually been drilled to an exact date, with little or no time delay. This methodology
allows PSAC to report in a more consistent manner with other industry forecasts and enhances
reporting accuracy.
June Warren - Nickle’s Energy Group (data supplier to PSAC for this document) receives its
information from government, operating company and drilling rig contractor sources and
reports information to reflect the best available data. Sometimes well status information may
change as new information is received. PSAC updates its data on a quarterly basis to reflect
any changes in well status for previous quarters.
Standing Wells
Since wells drilled are reported as soon as they have been rig released, well status (oil, gas, dry,
service) is sometimes unknown. Wells can be rig released and left standing (drilled and cased),
therefore not producing and not allowing a status to be reported. Wells can also be drilled and
left to be completed at a later date due to infrastructure economics, commodity pricing or
weather conditions. The PSAC Forecast updates unallocated standing wells to the four categories
listed (oil, gas, dry, service), based on the percentage made up by each of those categories.
Service Wells
A service well does not produce oil or gas but is used to inject liquids or gas into the main
producing formation to maintain pressure, enhance recovery, or store or dispose of salt
water and other substances.
Other Wells
Falling into this category are wells for which there has been no exact status defined,
including "tight hole" wells. These wells make up a small percentage, which are added to
the appropriate status count once the status is clarified. The PSAC Forecast updates
unallocated “other” wells to the four categories listed (oil, gas, dry, service), based on the
percentage made up by each of those categories.
SAGD Wells
Both the steam injector well and the producing well are licensed separately and count
as individual wells by the AER and this study.
Licenses Issued
Licenses issued have been calculated based on the license date for which year the
license was issued. Readers must be careful in making assumptions about upcoming
activity levels based solely on licensing information, as licenses get cancelled and do not
have a direct correlation with potential drilling activity.
Average License to Spud Date
The average license to spud date is an average of all wells rig released in the particular
quarter and year in which they are reported. The average license to spud date is
calculated based on the year and quarter in which the well was rig released.
Average Spud to Rig Release Date
The average spud to rig release date is an average of all wells rig released in the particular
quarter and year in which they are reported. The average spud to rig release date is also
calculated based on the year and quarter in which the well was rig released.
Data Collection and Analysis
In calculating the annual well count forecast, PSAC collects input from the following
sources:
• Operators (oil & gas companies)
• PSAC members (roundtable discussions)
• Historical trending analysis by PSAC area
• Current macro-economic fundamentals such as commodity pricing and
commodity supply and demand indicators
Methodology – Historical Well Counts & License Data
Wells Drilled – Rig Releases
Tuktoyatuk
Whitehorse
Yellowknife
FortNelson
FortSt. John
Vancouver
Edmonton
Calgary
Lethbridge
Saskatoon
Lloydminster
Winnipeg Thunder Bay
Toronto
Ottawa
Montreal
Quebec Halifax
Fredericton
Charlottetown
St. John's
ReginaSwift
Current
FortMcMurray
RedDeer
Victoria
GrandePrairie
NT
YT
BC2
BC1BC3
AB6
AB4
AB5AB2
AB1
SK1 SK3 MB
AB7
ON QC
NL
NS
NB
PE
NU
AB3 SK2
© 2014 Petroleum Services Association of Canada (PSAC) — Reproduction rights reserved. Nothing herein may be reprinted in part or in whole without explicit permission from PSAC.While all reasonable effort is made to ensure the quality and accuracy of the data, June Warren-Nickle’s Energy Group and PSAC accept no liability for the data contained within this report.
32015 Canadian Drilling Activity Forecast – published October 29, 2014
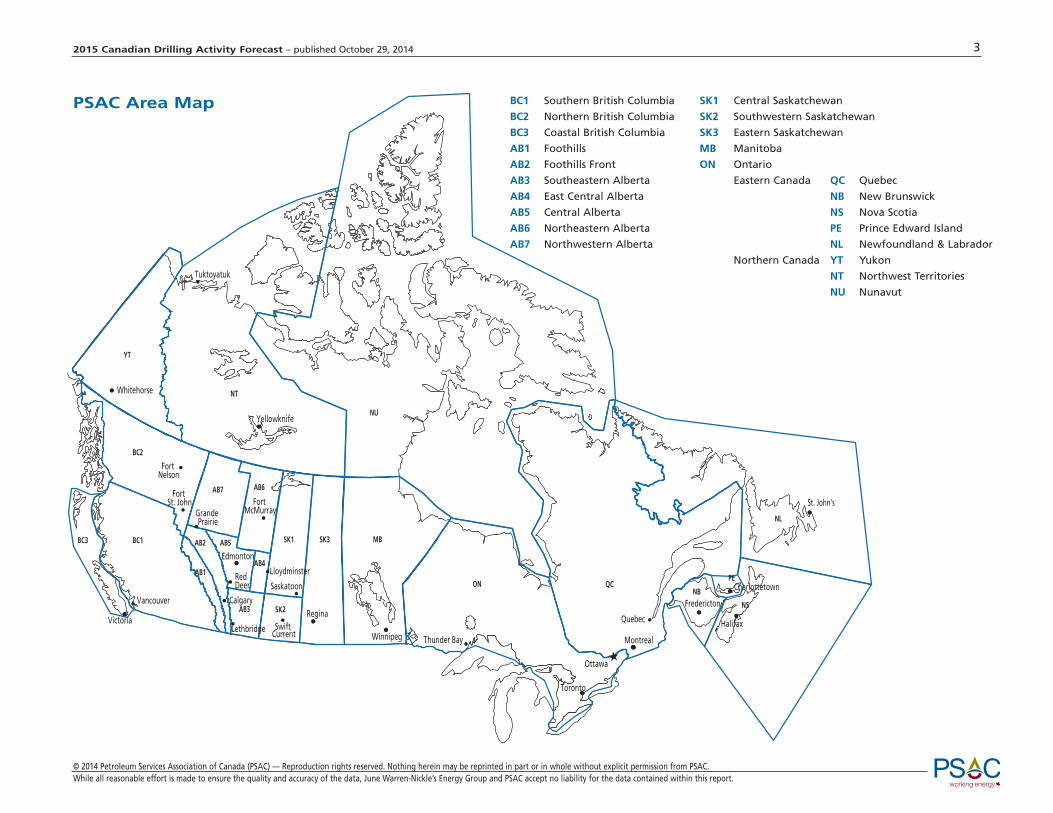
PSAC Area Map BC1 Southern British Columbia
BC2 Northern British Columbia
BC3 Coastal British Columbia
AB1 Foothills
AB2 Foothills Front
AB3 Southeastern Alberta
AB4 East Central Alberta
AB5 Central Alberta
AB6 Northeastern Alberta
AB7 Northwestern Alberta
SK1 Central Saskatchewan
SK2 Southwestern Saskatchewan
SK3 Eastern Saskatchewan
MB Manitoba
ON Ontario
Eastern Canada QC Quebec
NB New Brunswick
NS Nova Scotia
PE Prince Edward Island
NL Newfoundland & Labrador
Northern Canada YT Yukon
NT Northwest Territories
NU Nunavut
© 2014 Petroleum Services Association of Canada (PSAC) — Reproduction rights reserved. Nothing herein may be reprinted in part or in whole without explicit permission from PSAC.While all reasonable effort is made to ensure the quality and accuracy of the data, June Warren-Nickle’s Energy Group and PSAC accept no liability for the data contained within this report. For an explanation of “standing wells”, please see page 2.
182015 Canadian Drilling Activity Forecast – published October 29, 2014
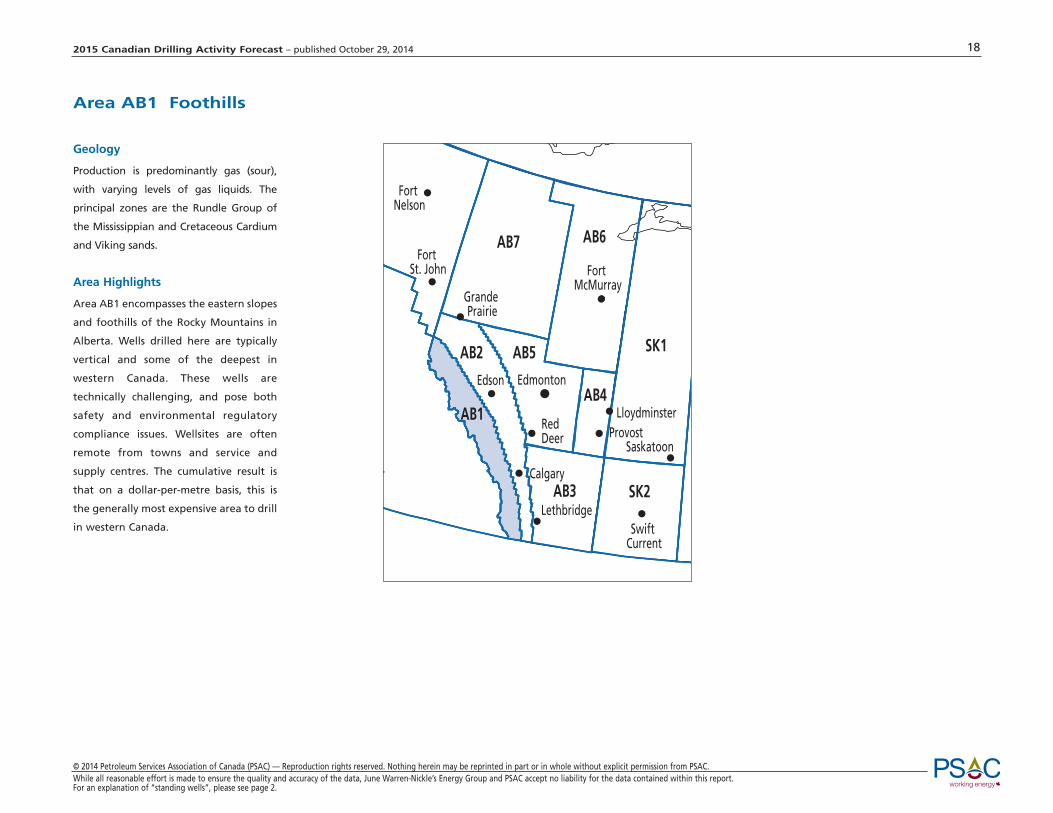
Area AB1 Foothills
FortNelson
FortSt. John
r
Edmonton
Calgary
Lethbridge
Saskatoon
Lloydminster
SwiftCurrent
FortMcMurray
RedDeer
GrandePrairie
AB6
AB4
AB5AB2
AB1
SK1
AB7
AB3 SK2
Edson
Provost
Geology
Production is predominantly gas (sour),
with varying levels of gas liquids. The
principal zones are the Rundle Group of
the Mississippian and Cretaceous Cardium
and Viking sands.
Area Highlights
Area AB1 encompasses the eastern slopes
and foothills of the Rocky Mountains in
Alberta. Wells drilled here are typically
vertical and some of the deepest in
western Canada. These wells are
technically challenging, and pose both
safety and environmental regulatory
compliance issues. Wellsites are often
remote from towns and service and
supply centres. The cumulative result is
that on a dollar-per-metre basis, this is
the generally most expensive area to drill
in western Canada.
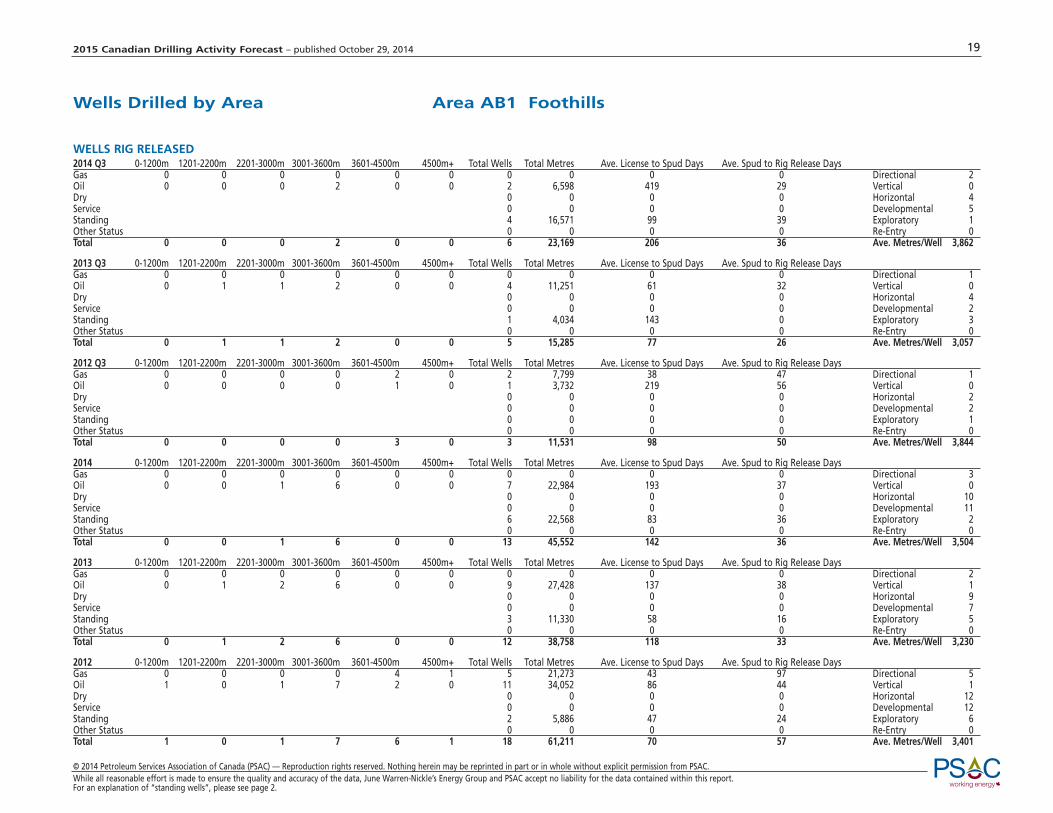
WELLS RIG RELEASED2014 Q3 0-1200m 1201-2200m 2201-3000m 3001-3600m 3601-4500m 4500m+ Total Wells Total Metres Ave. License to Spud Days Ave. Spud to Rig Release DaysGas 0 0 0 0 0 0 0 0 0 0 Directional 2Oil 0 0 0 2 0 0 2 6,598 419 29 Vertical 0Dry 0 0 0 0 Horizontal 4Service 0 0 0 0 Developmental 5Standing 4 16,571 99 39 Exploratory 1Other Status 0 0 0 0 Re-Entry 0Total 0 0 0 2 0 0 6 23,169 206 36 Ave. Metres/Well 3,862
2013 Q3 0-1200m 1201-2200m 2201-3000m 3001-3600m 3601-4500m 4500m+ Total Wells Total Metres Ave. License to Spud Days Ave. Spud to Rig Release DaysGas 0 0 0 0 0 0 0 0 0 0 Directional 1Oil 0 1 1 2 0 0 4 11,251 61 32 Vertical 0Dry 0 0 0 0 Horizontal 4Service 0 0 0 0 Developmental 2Standing 1 4,034 143 0 Exploratory 3Other Status 0 0 0 0 Re-Entry 0Total 0 1 1 2 0 0 5 15,285 77 26 Ave. Metres/Well 3,057
2012 Q3 0-1200m 1201-2200m 2201-3000m 3001-3600m 3601-4500m 4500m+ Total Wells Total Metres Ave. License to Spud Days Ave. Spud to Rig Release DaysGas 0 0 0 0 2 0 2 7,799 38 47 Directional 1Oil 0 0 0 0 1 0 1 3,732 219 56 Vertical 0Dry 0 0 0 0 Horizontal 2Service 0 0 0 0 Developmental 2Standing 0 0 0 0 Exploratory 1Other Status 0 0 0 0 Re-Entry 0Total 0 0 0 0 3 0 3 11,531 98 50 Ave. Metres/Well 3,844
2014 0-1200m 1201-2200m 2201-3000m 3001-3600m 3601-4500m 4500m+ Total Wells Total Metres Ave. License to Spud Days Ave. Spud to Rig Release DaysGas 0 0 0 0 0 0 0 0 0 0 Directional 3Oil 0 0 1 6 0 0 7 22,984 193 37 Vertical 0Dry 0 0 0 0 Horizontal 10Service 0 0 0 0 Developmental 11Standing 6 22,568 83 36 Exploratory 2Other Status 0 0 0 0 Re-Entry 0Total 0 0 1 6 0 0 13 45,552 142 36 Ave. Metres/Well 3,504
2013 0-1200m 1201-2200m 2201-3000m 3001-3600m 3601-4500m 4500m+ Total Wells Total Metres Ave. License to Spud Days Ave. Spud to Rig Release DaysGas 0 0 0 0 0 0 0 0 0 0 Directional 2Oil 0 1 2 6 0 0 9 27,428 137 38 Vertical 1Dry 0 0 0 0 Horizontal 9Service 0 0 0 0 Developmental 7Standing 3 11,330 58 16 Exploratory 5Other Status 0 0 0 0 Re-Entry 0Total 0 1 2 6 0 0 12 38,758 118 33 Ave. Metres/Well 3,230
2012 0-1200m 1201-2200m 2201-3000m 3001-3600m 3601-4500m 4500m+ Total Wells Total Metres Ave. License to Spud Days Ave. Spud to Rig Release DaysGas 0 0 0 0 4 1 5 21,273 43 97 Directional 5Oil 1 0 1 7 2 0 11 34,052 86 44 Vertical 1Dry 0 0 0 0 Horizontal 12Service 0 0 0 0 Developmental 12Standing 2 5,886 47 24 Exploratory 6Other Status 0 0 0 0 Re-Entry 0Total 1 0 1 7 6 1 18 61,211 70 57 Ave. Metres/Well 3,401
192015 Canadian Drilling Activity Forecast – published October 29, 2014
© 2014 Petroleum Services Association of Canada (PSAC) — Reproduction rights reserved. Nothing herein may be reprinted in part or in whole without explicit permission from PSAC.While all reasonable effort is made to ensure the quality and accuracy of the data, June Warren-Nickle’s Energy Group and PSAC accept no liability for the data contained within this report. For an explanation of “standing wells”, please see page 2.
Wells Drilled by Area Area AB1 Foothills

© 2014 Petroleum Services Association of Canada (PSAC) — Reproduction rights reserved. Nothing herein may be reprinted in part or in whole without explicit permission from PSAC.While all reasonable effort is made to ensure the quality and accuracy of the data, June Warren-Nickle’s Energy Group and PSAC accept no liability for the data contained within this report. For an explanation of “standing wells”, please see page 2.
202015 Canadian Drilling Activity Forecast – published October 29, 2014
Top 20 Operators Area AB1 Foothills
2014 GAS OIL1201- 2201- 3001- 3601- TOTAL 0- 1201- 2201- 3001- 3601- TOTAL WELL TYPE WELL CLASS
Company 0-1200m 2200m 3000m 3600m 4500m 4500m+ GAS 1200m 2200m 3000m 3600m 4500m 4500m+ OIL DRY SERVICE STAND OTHER TOTAL DIR VER HOR DEV EXP RE-ENTLegacy Oil + Gas Inc. 6 6 1 7 7 7Manitok Energy Inc. 1 1 1 2 2 2Tourmaline Oil Corp. 2 2 2 1 1Forent Energy Ltd. 1 1 1 1Shell Canada Limited 1 1 1 1
2013 GAS OIL1201- 2201- 3001- 3601- TOTAL 0- 1201- 2201- 3001- 3601- TOTAL WELL TYPE WELL CLASS
Company 0-1200m 2200m 3000m 3600m 4500m 4500m+ GAS 1200m 2200m 3000m 3600m 4500m 4500m+ OIL DRY SERVICE STAND OTHER TOTAL DIR VER HOR DEV EXP RE-ENTLegacy Oil + Gas Inc. 5 5 5 5 5Manitok Energy Inc. 1 1 2 2 2 2Tourmaline Oil Corp. 1 1 1 2 1 1 2Blackshale Resources Inc. 1 1 1 1
2012 GAS OIL1201- 2201- 3001- 3601- TOTAL 0- 1201- 2201- 3001- 3601- TOTAL WELL TYPE WELL CLASS
Company 0-1200m 2200m 3000m 3600m 4500m 4500m+ GAS 1200m 2200m 3000m 3600m 4500m 4500m+ OIL DRY SERVICE STAND OTHER TOTAL DIR VER HOR DEV EXP RE-ENTLegacy Oil + Gas Inc. 1 6 2 9 9 9 9Manitok Energy Inc. 1 1 2 2 1 1 1 1Tourmaline Oil Corp. 2 2 2 1 1 2Direct Energy Marketing Limited 1 1 1 1 1
2011 GAS OIL1201- 2201- 3001- 3601- TOTAL 0- 1201- 2201- 3001- 3601- TOTAL WELL TYPE WELL CLASS
Company 0-1200m 2200m 3000m 3600m 4500m 4500m+ GAS 1200m 2200m 3000m 3600m 4500m 4500m+ OIL DRY SERVICE STAND OTHER TOTAL DIR VER HOR DEV EXP RE-ENTTourmaline Oil Corp. 4 4 4 3 1 3 1Paramount Resources Ltd. 1 1 1 1 1Talisman Energy Inc. 1 1 1 1 1
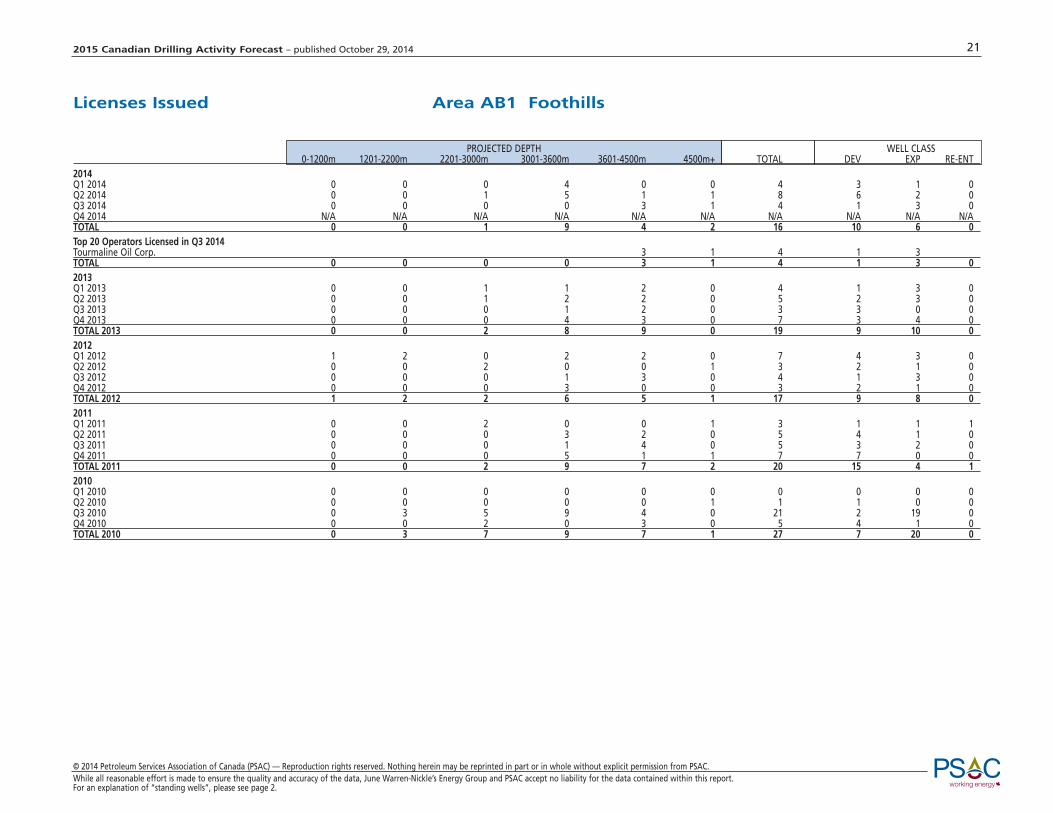
PROJECTED DEPTH WELL CLASS0-1200m 1201-2200m 2201-3000m 3001-3600m 3601-4500m 4500m+ TOTAL DEV EXP RE-ENT
2014Q1 2014 0 0 0 4 0 0 4 3 1 0Q2 2014 0 0 1 5 1 1 8 6 2 0Q3 2014 0 0 0 0 3 1 4 1 3 0Q4 2014 N/A N/A N/A N/A N/A N/A N/A N/A N/A N/ATOTAL 0 0 1 9 4 2 16 10 6 0Top 20 Operators Licensed in Q3 2014Tourmaline Oil Corp. 3 1 4 1 3TOTAL 0 0 0 0 3 1 4 1 3 02013Q1 2013 0 0 1 1 2 0 4 1 3 0Q2 2013 0 0 1 2 2 0 5 2 3 0Q3 2013 0 0 0 1 2 0 3 3 0 0Q4 2013 0 0 0 4 3 0 7 3 4 0TOTAL 2013 0 0 2 8 9 0 19 9 10 02012Q1 2012 1 2 0 2 2 0 7 4 3 0Q2 2012 0 0 2 0 0 1 3 2 1 0Q3 2012 0 0 0 1 3 0 4 1 3 0Q4 2012 0 0 0 3 0 0 3 2 1 0TOTAL 2012 1 2 2 6 5 1 17 9 8 02011Q1 2011 0 0 2 0 0 1 3 1 1 1Q2 2011 0 0 0 3 2 0 5 4 1 0Q3 2011 0 0 0 1 4 0 5 3 2 0Q4 2011 0 0 0 5 1 1 7 7 0 0TOTAL 2011 0 0 2 9 7 2 20 15 4 12010Q1 2010 0 0 0 0 0 0 0 0 0 0Q2 2010 0 0 0 0 0 1 1 1 0 0Q3 2010 0 3 5 9 4 0 21 2 19 0Q4 2010 0 0 2 0 3 0 5 4 1 0TOTAL 2010 0 3 7 9 7 1 27 7 20 0
212015 Canadian Drilling Activity Forecast – published October 29, 2014
© 2014 Petroleum Services Association of Canada (PSAC) — Reproduction rights reserved. Nothing herein may be reprinted in part or in whole without explicit permission from PSAC.While all reasonable effort is made to ensure the quality and accuracy of the data, June Warren-Nickle’s Energy Group and PSAC accept no liability for the data contained within this report. For an explanation of “standing wells”, please see page 2.
Licenses Issued Area AB1 Foothills
© 2014 Petroleum Services Association of Canada (PSAC) — Reproduction rights reserved. Nothing herein may be reprinted in part or in whole without explicit permission from PSAC.While all reasonable effort is made to ensure the quality and accuracy of the data, June Warren-Nickle’s Energy Group and PSAC accept no liability for the data contained within this report. For an explanation of “standing wells”, please see page 2.
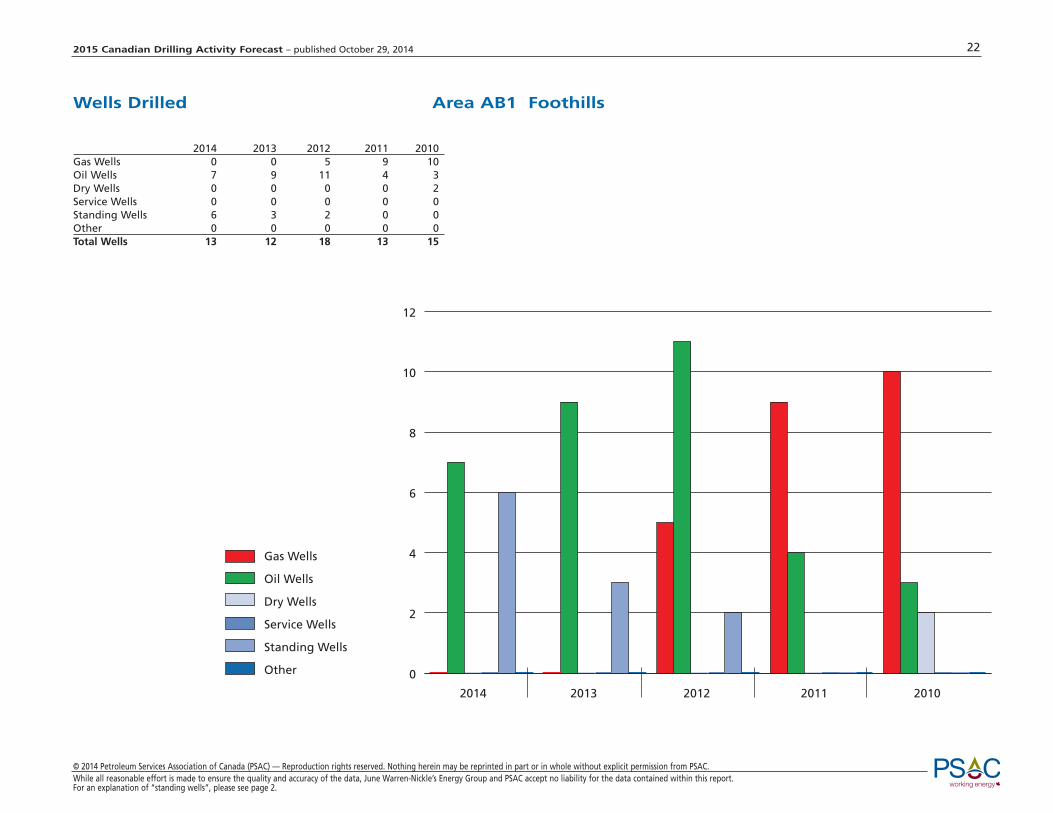
222015 Canadian Drilling Activity Forecast – published October 29, 2014
2014 2013 2012 2011 2010Gas Wells 0 0 5 9 10Oil Wells 7 9 11 4 3Dry Wells 0 0 0 0 2Service Wells 0 0 0 0 0Standing Wells 6 3 2 0 0Other 0 0 0 0 0Total Wells 13 12 18 13 15
Wells Drilled Area AB1 Foothills
0
2
4
6
8
10
12
Gas Wells
Oil Wells
Dry Wells
Service Wells
Standing Wells
Other
2012 2013 2011 20102014