Embed Size (px)
Citation preview
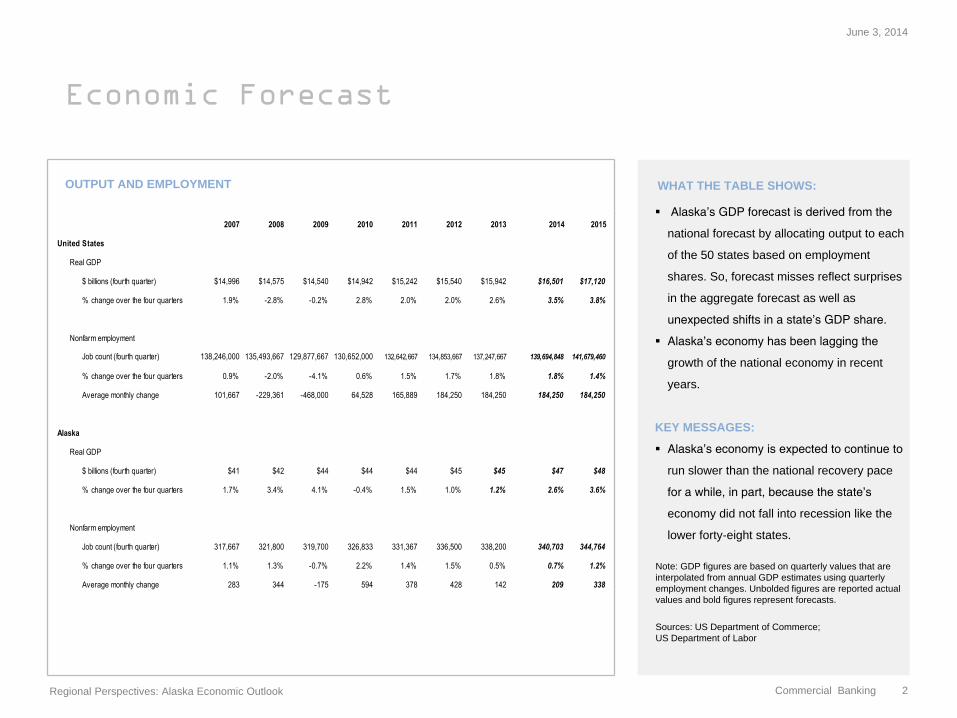
Economic Forecast
OUTPUT AND EMPLOYMENT WHAT THE TABLE SHOWS:
Alaska’s GDP forecast is derived from the
national forecast by allocating output to each
of the 50 states based on employment
shares. So, forecast misses reflect surprises
in the aggregate forecast as well as
unexpected shifts in a state’s GDP share.
Alaska’s economy has been lagging the
growth of the national economy in recent
years.
KEY MESSAGES:
Alaska’s economy is expected to continue to
run slower than the national recovery pace
for a while, in part, because the state’s
economy did not fall into recession like the
lower forty-eight states.
Note: GDP figures are based on quarterly values that are
interpolated from annual GDP estimates using quarterly
employment changes. Unbolded figures are reported actual
values and bold figures represent forecasts.
Sources: US Department of Commerce;
US Department of Labor
June 3, 2014
Regional Perspectives: Alaska Economic Outlook
Commercial Banking 2
2007 2008 2009 2010 2011 2012 2013 2014 2015
United States
Real GDP
$ billions (fourth quarter) $14,996 $14,575 $14,540 $14,942 $15,242 $15,540 $15,942 $16,501 $17,120
% change over the four quarters 1.9% -2.8% -0.2% 2.8% 2.0% 2.0% 2.6% 3.5% 3.8%
Nonfarm employment
Job count (fourth quarter) 138,246,000 135,493,667 129,877,667 130,652,000 132,642,667 134,853,667 137,247,667 139,694,848 141,679,460
% change over the four quarters 0.9% -2.0% -4.1% 0.6% 1.5% 1.7% 1.8% 1.8% 1.4%
Average monthly change 101,667 -229,361 -468,000 64,528 165,889 184,250 184,250 184,250 184,250
Alaska
Real GDP
$ billions (fourth quarter) $41 $42 $44 $44 $44 $45 $45 $47 $48
% change over the four quarters 1.7% 3.4% 4.1% -0.4% 1.5% 1.0% 1.2% 2.6% 3.6%
Nonfarm employment
Job count (fourth quarter) 317,667 321,800 319,700 326,833 331,367 336,500 338,200 340,703 344,764
% change over the four quarters 1.1% 1.3% -0.7% 2.2% 1.4% 1.5% 0.5% 0.7% 1.2%
Average monthly change 283 344 -175 594 378 428 142 209 338
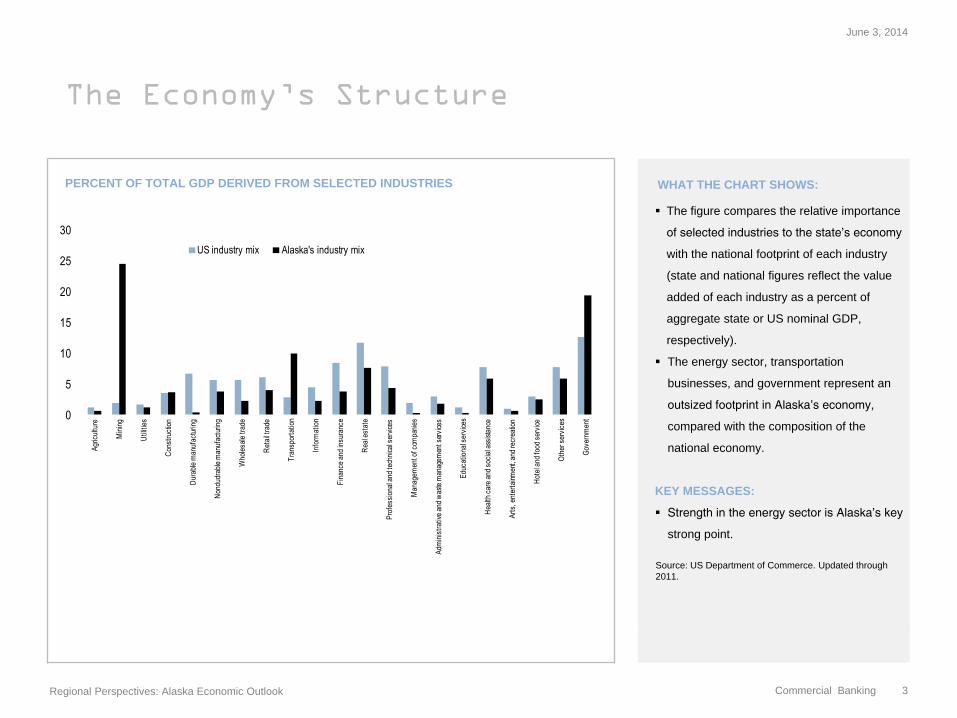
The Economy’s Structure
PERCENT OF TOTAL GDP DERIVED FROM SELECTED INDUSTRIES WHAT THE CHART SHOWS:
The figure compares the relative importance
of selected industries to the state’s economy
with the national footprint of each industry
(state and national figures reflect the value
added of each industry as a percent of
aggregate state or US nominal GDP,
respectively).
The energy sector, transportation
businesses, and government represent an
outsized footprint in Alaska’s economy,
compared with the composition of the
national economy.
KEY MESSAGES:
Strength in the energy sector is Alaska’s key
strong point.
Source: US Department of Commerce. Updated through
2011.
June 3, 2014
Regional Perspectives: Alaska Economic Outlook
Commercial Banking 3
0
5
10
15
20
25
30
Agr
icul
ture
Min
ing
Util
ities
Con
stru
ctio
n
Dur
able
man
ufac
turin
g
Non
dudr
able
man
ufac
turin
g
Who
lesa
le tr
ade
Ret
ail t
rade
Tra
nspo
rtat
ion
Info
rmat
ion
Fin
ance
and
insu
ranc
e
Rea
l est
ate
Pro
fess
iona
l and
tech
nica
l ser
vice
s
Man
agem
ent o
f com
pani
es
Adm
inis
trat
ive
and
was
te m
anag
emen
t ser
vice
s
Edu
catio
nal s
ervi
ces
Hea
lth c
are
and
soci
al a
ssis
tanc
e
Art
s, e
nter
tain
men
t, an
d re
crea
tion
Hot
el a
nd fo
od s
ervi
ce
Oth
er s
ervi
ces
Gov
ernm
ent
US industry mix Alaska's industry mix

Bankruptcies
RATIO OF BANKRUPTCY FILINGS TO THE 2007 Q4 NUMBER WHAT THE CHART SHOWS:
The figure illustrates trends in bankruptcy
filings by businesses and persons relative to
the number of filings in 2007 Q4, prior to the
recession.
Bankruptcy filings are relatively low.
KEY MESSAGES:
Indicators of financial stress are a useful
coincident indication of economic distress.
From this perspective, Alaska appears to
have averted most of the problems that
plagued the West Coast and financial
pressures appear to be easing.
Source: Administrative Office of the U.S. Courts; Updated
through March 2014.
June 3, 2014
Regional Perspectives: Alaska Economic Outlook
Commercial Banking 4
0
1
2
3
4
5
0
1
2
3
4
5
1990 1992 1994 1996 1998 2000 2002 2004 2006 2008 2010 2012 2014
Business bankruptcy filingsNonbusiness bankruptcy filings
All US bankruptcy filings (shaded area)
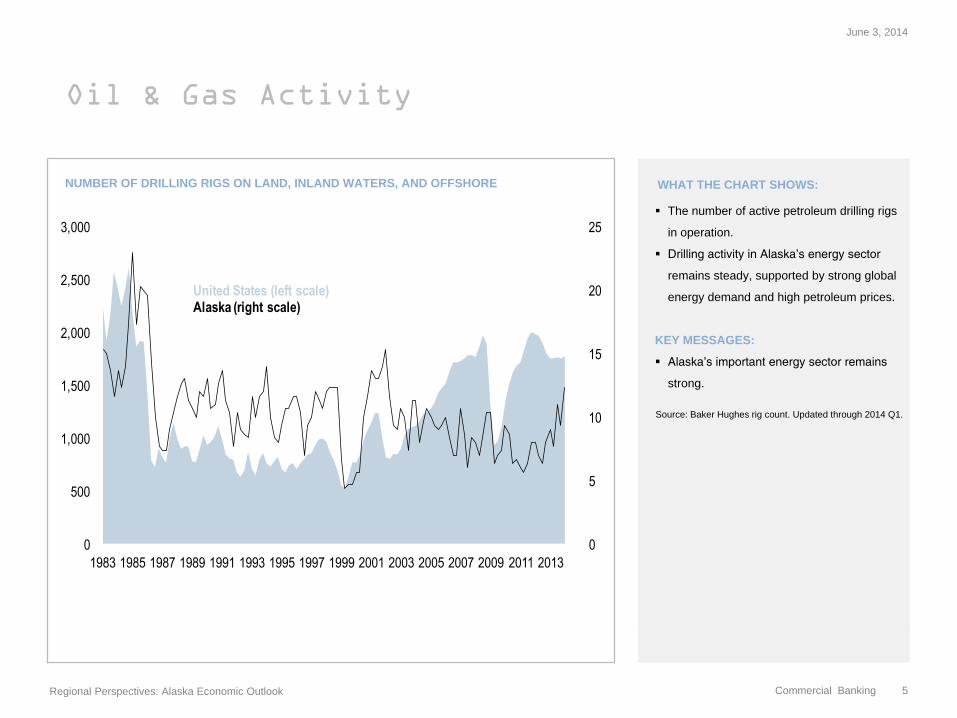
Oil & Gas Activity
NUMBER OF DRILLING RIGS ON LAND, INLAND WATERS, AND OFFSHORE WHAT THE CHART SHOWS:
The number of active petroleum drilling rigs
in operation.
Drilling activity in Alaska’s energy sector
remains steady, supported by strong global
energy demand and high petroleum prices.
KEY MESSAGES:
Alaska’s important energy sector remains
strong.
Source: Baker Hughes rig count. Updated through 2014 Q1.
June 3, 2014
Regional Perspectives: Alaska Economic Outlook
Commercial Banking 5
0
5
10
15
20
25
0
500
1,000
1,500
2,000
2,500
3,000
1983 1985 1987 1989 1991 1993 1995 1997 1999 2001 2003 2005 2007 2009 2011 2013
United States (left scale)Alaska (right scale)
Initial Jobless Claims
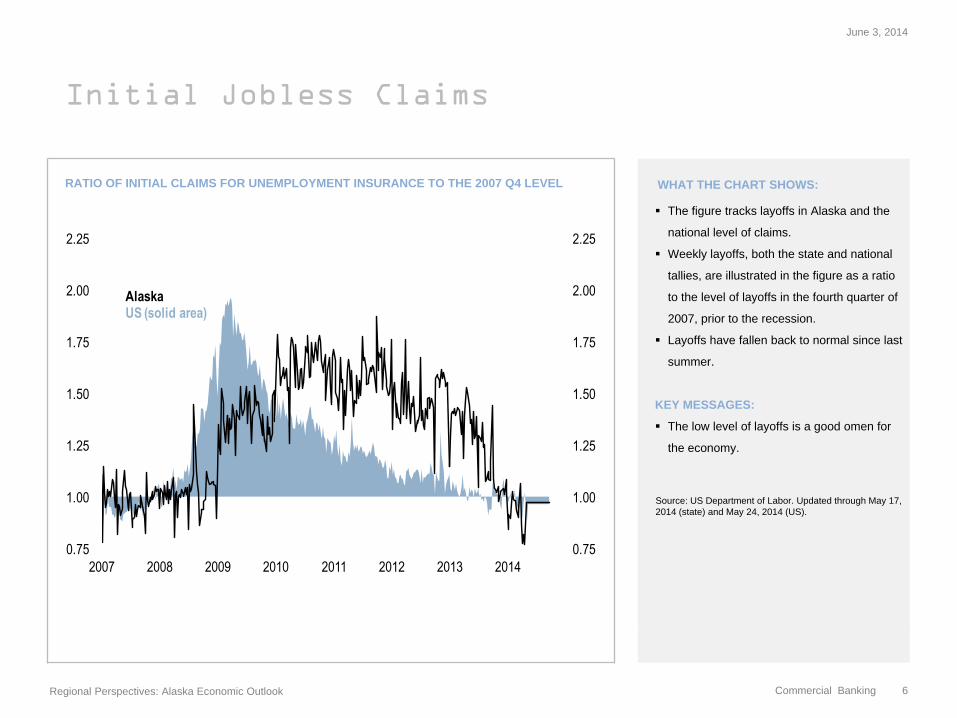
RATIO OF INITIAL CLAIMS FOR UNEMPLOYMENT INSURANCE TO THE 2007 Q4 LEVEL WHAT THE CHART SHOWS:
The figure tracks layoffs in Alaska and the
national level of claims.
Weekly layoffs, both the state and national
tallies, are illustrated in the figure as a ratio
to the level of layoffs in the fourth quarter of
2007, prior to the recession.
Layoffs have fallen back to normal since last
summer.
KEY MESSAGES:
The low level of layoffs is a good omen for
the economy.
Source: US Department of Labor. Updated through May 17,
2014 (state) and May 24, 2014 (US).
June 3, 2014
Regional Perspectives: Alaska Economic Outlook
Commercial Banking 6
0.75
1.00
1.25
1.50
1.75
2.00
2.25
0.75
1.00
1.25
1.50
1.75
2.00
2.25
2007 2008 2009 2010 2011 2012 2013 2014
AlaskaUS (solid area)

Economic Growth
REAL GDP GROWTH (PERCENT CHANGE FROM FOUR QUARTERS EARLIER) WHAT THE CHART SHOWS:
Real GDP growth in Alaska (the line in the
figure) is superimposed on top of US real
GDP growth (bars in the figure).
Alaska’s economy is volatile but its
underlying performance is strong.
KEY MESSAGES:
Alaska benefits from the global boom in
energy demand.
Source: US Department of Commerce. Updated through
2012 (state) and 2014 Q1 (US). Quarterly estimates for
states after 2012 are interpolated from employment figures
(through April 2014), based on the historical correlation of
state and national employment changes.
June 3, 2014
Regional Perspectives: Alaska Economic Outlook
Commercial Banking 7
-6
-5
-4
-3
-2
-1
0
1
2
3
4
5
6
7
8
9
-6
-5
-4
-3
-2
-1
0
1
2
3
4
5
6
7
8
9
90 91 92 93 94 95 96 97 98 99 00 01 02 03 04 05 06 07 08 09 10 11 12 13 14 15
Alaska
USForecast

Economic Output
REAL GDP LEVEL (RATIO TO 2000 Q4) WHAT THE CHART SHOWS:
The figure illustrates the evolution of real
GDP of the state and the overall US
economy since the fourth quarter of 2000,
the peak of the previous business cycle—
that is, at any point in time the lines trace the
ratio of real GDP to its level in 2000 Q4.
Alaska’s economy has fared far better than
the national economy and is on the leading
edge of the national recovery.
KEY MESSAGES:
Alaska’s economy is likely to remain on a
fast track into 2014.
Source: US Department of Commerce. Updated through
2012 (state) and 2014 Q1 (US). Quarterly estimates for
states after 2012 are interpolated from employment figures
(through April 2014), based on the historical correlation of
state and national employment changes.
June 3, 2014
Regional Perspectives: Alaska Economic Outlook
Commercial Banking 8
0.95
1.00
1.05
1.10
1.15
1.20
1.25
1.30
1.35
1.40
0.95
1.00
1.05
1.10
1.15
1.20
1.25
1.30
1.35
1.40
2000 2001 2002 2003 2004 2005 2006 2007 2008 2009 2010 2011 2012 2013 2014 2015
Alaska
US
Forecast
Employment Growth
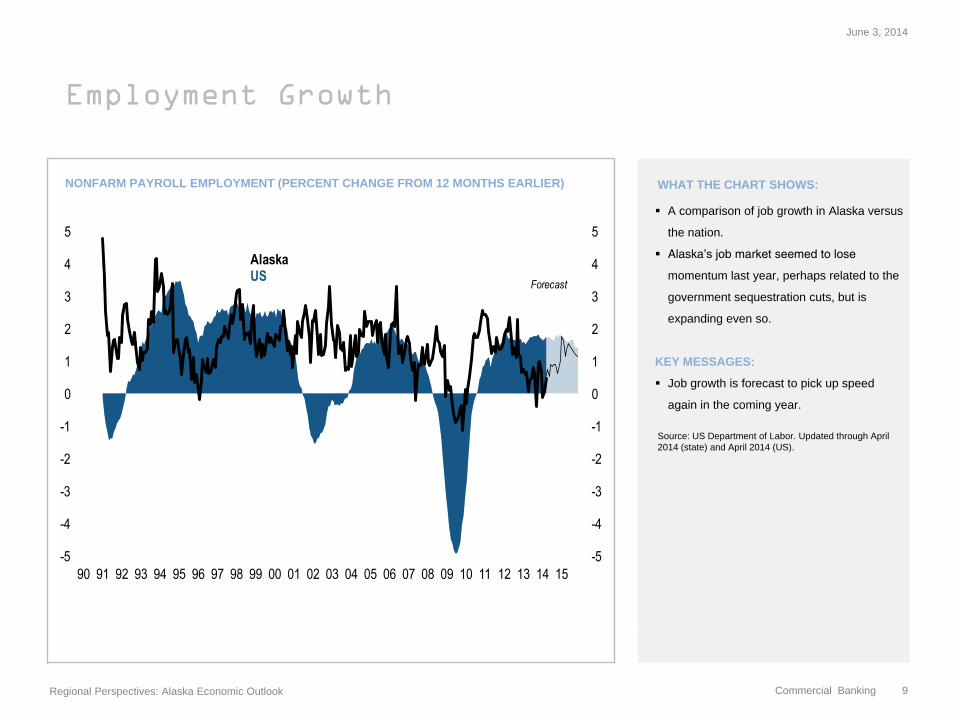
NONFARM PAYROLL EMPLOYMENT (PERCENT CHANGE FROM 12 MONTHS EARLIER) WHAT THE CHART SHOWS:
A comparison of job growth in Alaska versus
the nation.
Alaska’s job market seemed to lose
momentum last year, perhaps related to the
government sequestration cuts, but is
expanding even so.
KEY MESSAGES:
Job growth is forecast to pick up speed
again in the coming year.
Source: US Department of Labor. Updated through April
2014 (state) and April 2014 (US).
June 3, 2014
Regional Perspectives: Alaska Economic Outlook
Commercial Banking 9
-5
-4
-3
-2
-1
0
1
2
3
4
5
-5
-4
-3
-2
-1
0
1
2
3
4
5
90 91 92 93 94 95 96 97 98 99 00 01 02 03 04 05 06 07 08 09 10 11 12 13 14 15
AlaskaUS
Forecast

Employment
NONFARM PAYROLL EMPLOYMENT (RATIO TO THE 2000 Q4 LEVEL) WHAT THE CHART SHOWS:
The figure illustrates the evolution of
employment in the state compared with the
nation since 2000 Q4, the peak of the
previous business cycle. The lines trace out
the ratio of employment at the time to
employment in 2000 Q4.
Alaska’s job count stands 15 percent above
decade-ago levels.
KEY MESSAGES:
From an employment perspective, Alaska is
on a steady ascending path.
Source: US Department of Labor. Updated through April
2014 (state) and April 2014 (US).
June 3, 2014
Regional Perspectives: Alaska Economic Outlook
Commercial Banking 10
0.95
1.00
1.05
1.10
1.15
1.20
0.95
1.00
1.05
1.10
1.15
1.20
2000 2001 2002 2003 2004 2005 2006 2007 2008 2009 2010 2011 2012 2013 2014 2015
Alaska
US
Forecast
Intrastate Employment
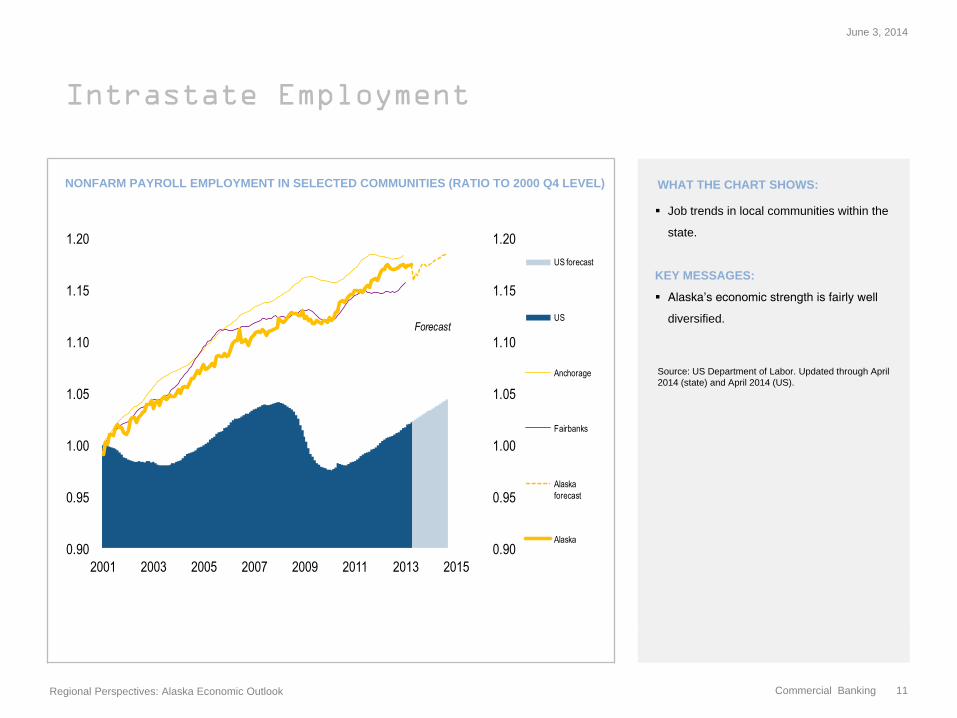
NONFARM PAYROLL EMPLOYMENT IN SELECTED COMMUNITIES (RATIO TO 2000 Q4 LEVEL) WHAT THE CHART SHOWS:
Job trends in local communities within the
state.
KEY MESSAGES:
Alaska’s economic strength is fairly well
diversified.
Source: US Department of Labor. Updated through April
2014 (state) and April 2014 (US).
June 3, 2014
Regional Perspectives: Alaska Economic Outlook
Commercial Banking 11
0.90
0.95
1.00
1.05
1.10
1.15
1.20
0.90
0.95
1.00
1.05
1.10
1.15
1.20
2001 2003 2005 2007 2009 2011 2013 2015
US forecast
US
Anchorage
Fairbanks
Alaska
forecast
Alaska
Forecast
Unemployment
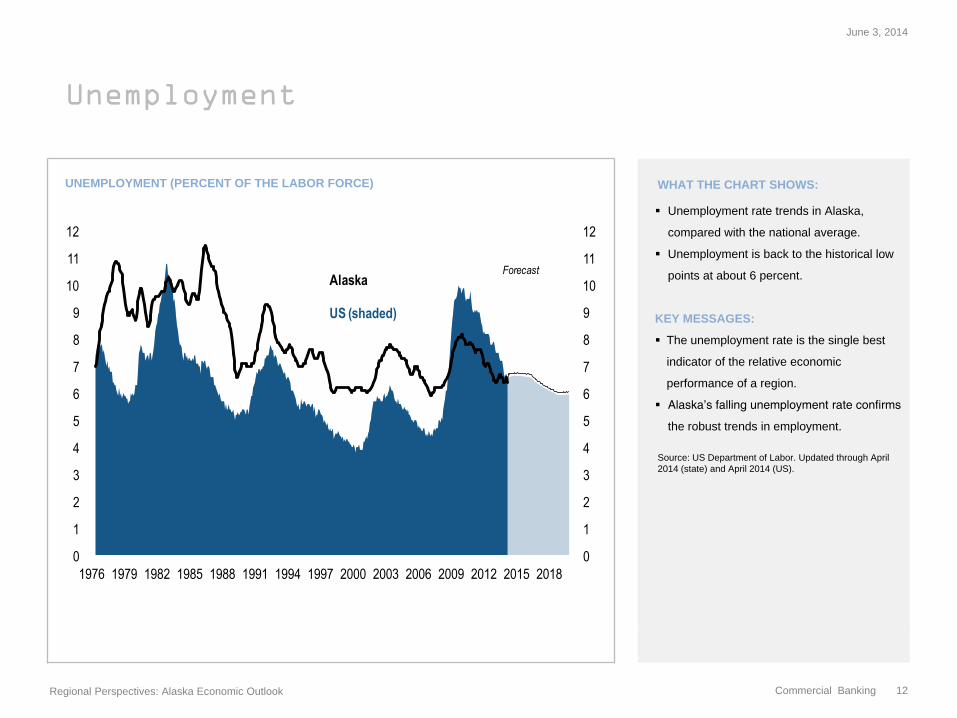
UNEMPLOYMENT (PERCENT OF THE LABOR FORCE) WHAT THE CHART SHOWS:
Unemployment rate trends in Alaska,
compared with the national average.
Unemployment is back to the historical low
points at about 6 percent.
KEY MESSAGES:
The unemployment rate is the single best
indicator of the relative economic
performance of a region.
Alaska’s falling unemployment rate confirms
the robust trends in employment.
Source: US Department of Labor. Updated through April
2014 (state) and April 2014 (US).
June 3, 2014
Regional Perspectives: Alaska Economic Outlook
Commercial Banking 12
0
1
2
3
4
5
6
7
8
9
10
11
12
0
1
2
3
4
5
6
7
8
9
10
11
12
1976 1979 1982 1985 1988 1991 1994 1997 2000 2003 2006 2009 2012 2015 2018
Alaska
US (shaded)
Forecast
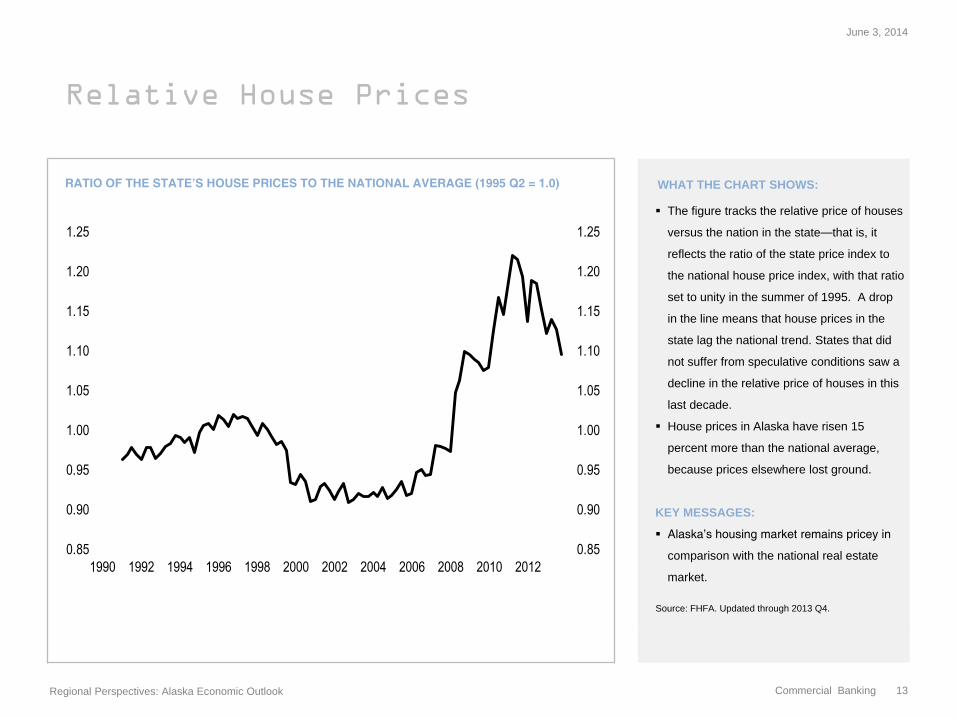
Relative House Prices
RATIO OF THE STATE’S HOUSE PRICES TO THE NATIONAL AVERAGE (1995 Q2 = 1.0) WHAT THE CHART SHOWS:
The figure tracks the relative price of houses
versus the nation in the state—that is, it
reflects the ratio of the state price index to
the national house price index, with that ratio
set to unity in the summer of 1995. A drop
in the line means that house prices in the
state lag the national trend. States that did
not suffer from speculative conditions saw a
decline in the relative price of houses in this
last decade.
House prices in Alaska have risen 15
percent more than the national average,
because prices elsewhere lost ground.
KEY MESSAGES:
Alaska’s housing market remains pricey in
comparison with the national real estate
market.
Source: FHFA. Updated through 2013 Q4.
June 3, 2014
Regional Perspectives: Alaska Economic Outlook
Commercial Banking 13
0.85
0.90
0.95
1.00
1.05
1.10
1.15
1.20
1.25
0.85
0.90
0.95
1.00
1.05
1.10
1.15
1.20
1.25
1990 1992 1994 1996 1998 2000 2002 2004 2006 2008 2010 2012

Real Estate Markets
HOUSE PRICES IN SELECTED COMMUNITIES (RATIO TO THE 1995 Q2 LEVEL) WHAT THE CHART SHOWS:
The figure tracks the cumulative percentage
deviation in house prices since 1995 in
selected local markets and compares those
with the national average.
Prices have flattened since 2006 even as
prices in most other markets have fallen.
KEY MESSAGE:
Real estate values held up better in Alaska
than in the lower 48, perhaps a sign that
speculation was less intense in the state’s
real estate markets.
Source: FHFA. Updated through 2013 Q4.
June 3, 2014
Regional Perspectives: Alaska Economic Outlook
Commercial Banking 14
0.75
1.00
1.25
1.50
1.75
2.00
2.25
0.75
1.00
1.25
1.50
1.75
2.00
2.25
90 91 92 93 94 95 96 97 98 99 00 01 02 03 04 05 06 07 08 09 10 11 12 13
US
Anchorage
Fairbanks

New Home Building
HOUSING STARTS (RATIO TO JULY 1990) WHAT THE CHART SHOWS:
Home building in the state, compared with
the US.
Housing activity is relatively flat.
KEY MESSAGES:
Housing activity is expected to strengthen in
coming years, in line with a national housing
recovery.
Source: Census Department. Updated through March 2014
(state) and April 2014 (US).
June 3, 2014
Regional Perspectives: Alaska Economic Outlook
Commercial Banking 15
0
1
2
3
4
5
6
7
0
1
2
3
4
5
6
7
2000 2003 2006 2009 2012 2015
USAlaska
Forecast