Embed Size (px)
Citation preview


Foreword This proposed 2019 operating budget and capital plan has been developed to
guide staff in the operation and management of Port Authority facilities andactivities for Fiscal Year 2019. It is being presented to the Port Commission onNovember 13, 2018.
Note that the operating budget does not include tax revenues, which are usedexclusively for debt service on the Port Authority’s outstanding generalobligation ad valorem tax bonds.
While the capital plan may be approved as to maximum annual amount ofcapital expenditures, individual operating expense and capital projectsexceeding $50,000 will continue to be presented separately to the PortCommission for approval in accordance with statutory requirements.
References to “2018 Budget Reforecast” refer to an update to the 2018 Budgetthat was prepared by staff as of July 2018 and submitted to the PortCommission. It has been posted on the Port Authority’s website(www.portofhouston.com).
1

Executive Summary – 2019 Operating & Capital Budget Narrative overview
Operating revenues up 8% anticipating continued ramp-up of resin production combined with growth in Import Loads; Total revenues grow 6%
Operating expenses, including General & Administrative, grow 8% on volume projections and spending on new initiatives; Total expenses grow 9%
Operating income dollars up 7%, a 25% profitability margin, “flat” to mid-year 2018 forecast
Operating Cash Flow increases 7% in 2019 to $172 million; Total Cash Flow $171 million, up 3%
Headcount growth of 33 new positions for 2019 - 26 Operations (24-Ops, 2-Infrastructure); 7 G&A (2-PSEO, 2-Technology, 2-Finance, 1-People)
$287 million Capital Plan focused primarily on Container Terminal development & reinvestment (~89% of Plan)
Liquidity projections show sufficient resources to fund Capital Plans through the planning horizon, before consideration of ‘major’ Ship Channel Widening/Deepening projects
2
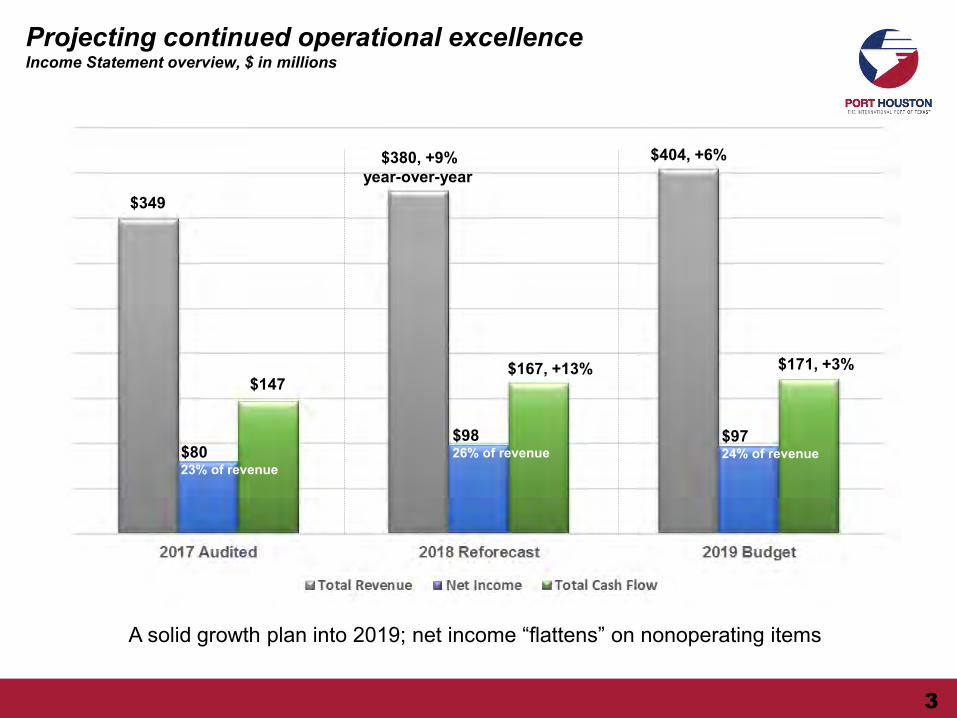
Projecting continued operational excellence Income Statement overview, $ in millions
$349
$380, +9% year-over-year
$404, +6%
$147 $167, +13% $171, +3%
A solid growth plan into 2019; net income “flattens” on nonoperating items
$80 23% of revenue
$98 26% of revenue
$97 24% of revenue
3

Container and Steel showing continued growth Container Units, Steel tonnage (000s)
9% increase
11% increase
Total Containers Total Steel
Export loads up 12.3% as resin production ramps; Import loads up 8.0% on economic strength, TransPacific service growth
Anticipating continued ‘share’ gain from Port of Houston import tonnage
4

Autos and Other General Cargos Auto Units, cargo tonnage (000s)
Total Autos Other General Cargos
Bayport Auto Terminal projecting slight growth; Turning Basin Auto down 8%
Other cargos (machinery & equipment, bagged goods, wood products, etc.) showing growth into next year
2,281 2,136
1,940 2,074
2,183
2016 2017 2018Reforecast
2019 2020
7% increase
86
75 67 64 65
2016 2017 2018Reforecast
2019 2020
5% decrease
5

2019 Revenue analysis, key changes from 2018 $ in millions
2018 Reforecast – Total Revenue $380
Change
• Increase in Container revenue driven by volume growth
27
• Increase in Turning Basin from cargo and lease revenues
2
• Decrease in Lease revenues (2)
• Increase in Channel Development revenue streams due to DMA Fees and Barge Fleeting
2
• Decrease in Nonoperating revenues, primarily driven by reduced Interest Income
(5)
Subtotal 24
2019 Budget – Total Revenue $404
$380, +9% year-over-year
$404, +6%
6

Container, 78% of total; +10%
Revenue growth driven by Container Terminals Total Revenues, in $ millions (mix and year-over-year growth)
10% Container Terminals revenue growth on a 9% increase in units. Export loaded units up 9.9% andImport loaded units up 8.3%; Empty units up 0.8%
Turning Basin Terminals with modest growth of 2%; Steel projected up by 11% and other generalcargos up 10%
Lease* declines 12% primarily from the conclusion of terms for several properties
All other drops 6% from Nonoperating revenues: lower Interest Income
$404, +6%
Turning Basin, 14% of total; +2%
Lease*, 4% of total; -12% All other, 4% of total; -12% v. 2018 Rfcst
* Non-Terminal Lease revenues only
Mix of business – 2019 Budget
7

2018 Reforecast – Total Expense $282
Change
Changes in Operating and infrastructure-related:
• PHA and ILA labor 9
• Depreciation & amortization 5
• Contribution to local/state agencies 3
Changes in General and administrative:
• Personnel salaries and benefits 2
• Fees & services (Cyber security, Environmental Projects, etc.) 2
• Building-related and other expenses 4
Subtotal 25
2019 Budget – Total Expense $307
2019 Expense analysis, key changes from 2018 $ in millions
$282, +5% $307, +9%
8

Expenses driven by volume growth and other initiatives Total Expenses, in $ millions (mix and year-over-year growth)
Salaries & Benefits, 50% of total, +8%
Terminal/Asset Maint, 8% of total; +7%
Discretionary, 12% of total; +15%
Salaries & Benefits, including ILA labor, growing, though not as fast as Revenue Depreciation expense reflects capacity additions and recapitalization Discretionary includes Fees & Services for Cyber security, Environmental and other strategic initiatives Terminal/Asset Maint. increasing with volumes, LED initiative, Executive Office Building updates Gross margin rate, which reveals efficiency of operational spend, is “up” from mid-year 2018 Reforecast G&A spend as a percent of revenue, which illustrates efficiency of overhead spend, is “flat” to mid-year
2018 Reforecast (and 2018 Budget)
Depreciation, 24 % of total; +7%
Nonoperating, 2% of total; +84%
All other, 4% of total; +0.6% v. 2018 Rfcst
Mix of expense – 2019 Budget
$307, +9%
9

2017 Audited
2018 Budget
2018 Reforecast
2019 Budget
Total Revenue $349 $374 $380 $404
Total Expense 269 284 282 307
Net Income $80 $90 $98 $97
Net Profit Margin 23% 24% 26% 24%
Cash Flow $147 $158 $167 $171
Projecting continued operational excellence Income Statement overview, $ in millions
10

Staffing growth will support Operations and strategic initiatives Headcount analysis, Number of Employees*
2019 Budgeted Staffing
Exempt 221
Nonexempt 431
Total Actual Headcount, 9/30/2018 652
Approved, existing open reqs 18
New 33
Total Budgeted Positions 703
2019 Budget – Headcount 703
* Does not include Casual Labor
669
653
703
Actu
al
Ope
n
33
17
$562 $563 $575, +3% Actual Reforecast Budget
Revenue per Headcount (000s)
11

2018 Budgeted
2018 Actual YTD*
2019 Budgeted
Total Incremental Spend
$5.3 m $1.3 m $2.4 m
• Strategic spend represents the cost of initiativesand deliverables directly relating to strategicplan action items
• 2018 lags in intended FICAP spending
• As required by statute, the strategic plan will beupdated in 2019 and presented to theCommission in 2020.
• Beginning in 2019, P&D budget is NOT includedin strategic Incremental Spend calculation
Strategic investments support short- and long-term performance
*2018 Actual YTD calculated through Q3 of 2018
2019 Priority Initiatives:
People & Organization Growth
Infrastructure Stewardship
• Organizational Change Management• Enhanced Employee Training and Development Programs
(Port Houston Academy)• Enterprise Collaboration and Knowledge Management through
SharePoint Development
• Inland Cargo Growth Plan• Operating Terminal Technology Upgrades• Brand Awareness and Recognition• Maritime Marketing Analysis
• Marine Structure Condition Assessment• Houston Ship Channel Mega Study Completion• Enterprise Asset Software• Freight Mobility Studies
• Cybersecurity Processes, Procedures, and Guidelines• Continuous Improvement of M/V Sam Houston Experience• ISO 45001 Safety Compliance
$265K $148K
$1,915K $84K
12

Terminal # Oldest Newest Age Range Ave. Age
Bayport 5 2007 2018 1-12 years 2010
Barbours Cut 8 1973 1997 21-46 years 1983
Turning Basin North and South
38 1915 1984 33-104 years 1946
Age of Wharves
13

FICAP- Budget
Year Corrosion Electrical
Distribution and Communication
Other “Buckets”
Marine Assets
Zero Based Budget
2019 ~350,000 ~$550,000 $0 ~$1,000,000 ~$2.2m
2020 tbd tbd tbd ~$1,000,000 ~$2.2m
Marine Assets
Facility Inspection & Condition Assessment Program (FICAP) - Marine Assets- Structures
Types Wharves Docks Bulkheads Shorelines Bridge Total #
2017 – Complete 3 3 2018 (95% complete) 26 5 4 4 39
2019 16 1 17 2020 12 2 1 15
2021 9 6 28 43
Defer 1 19 20 Not Needed 1 3 4
Total # 67 14 5 54 1 141
14

Examples of Findings - Marine Assets - Structures
Follow-Up/Recommended Actions
Property Priority
(Intermediate) Priority Routine Total Actions
Albermarle Lease 0 0 0 0
Manchester Wharf 1 0 0 1 1
Northside Turning Basin - CD 21 1 5 9 15
Northside Turning Basin - CD 22 0 9 7 16 Northside Turning Basin - CD 23 0 0 1 1
Northside Turning Basin - CD 24 0 5 6 11
Northside Turning Basin - CD 25 1 5 6 12
Northside Turning Basin - CD 26 1 5 14 20
Northside Turning Basin - CD 27 0 2 3 5
Northside Turning Basin - CD 28 0 3 7 10
Northside Turning Basin - CD 30 0 4 6 10
Northside Turning Basin - CD 31 0 4 7 11 Northside Turning Basin - Block 22 0 0 0 0
Northside Turning Basin - BH1 0 0 5 5
Vopak Lease 0 0 0 0
Totals per Priority 3 42 72 117 15

Operating cash flow will fund the 2019 Capital budget of $287 million
2019 Capital Improvement Program
Channel, 7% Maintenance, other, 4%
Strategic projects = $206 million– These investments support new growth
opportunities
Recapitalization projects = $49 million– Investments required to sustain high
service levels and/or enhance productivity
Channel projects = $19 million– Development at container terminals and
DAMP areas
Remaining projects = $13 million– Includes maintenance equipment and
other replacements
Strategic, 72%
Recap 17%
16

Liquidity projections, 2019 Operating & Capital Budget $ in thousands
2018 2019 2020Funds Available, Beginning of Period 361,939$ 194,476$ 78,011$ Debt Service, Contingency, Other (58,220) - - Outstanding PO's and Commitments (110,337) - -
193,382$ 194,476$ 78,011$ Sources: Net Operating Cash Flow 166,534 170,932 174,622 Available Resources 359,916$ 365,408$ 252,633$
Uses: New Capital Investment Barbours Cut 23,254 129,611 77,780 Bayport Terminal 84,281 93,473 55,389 Turning Basin Terminals 7,310 20,092 44,383 Bayport Railroad 14,543 19,472 13,615 Channel Development 5,451 6,847 3,527 Real Estate 871 5,946 1,190 Maintenance 14,839 5,100 - PSEO 11,169 5,000 10,397 Other 3,722 1,856 10,385
Net Uses 165,440 287,397 216,666 Funds Available, End of Period 194,476$ 78,011$ 35,967$
17

WELCOME MESSAGE | 2
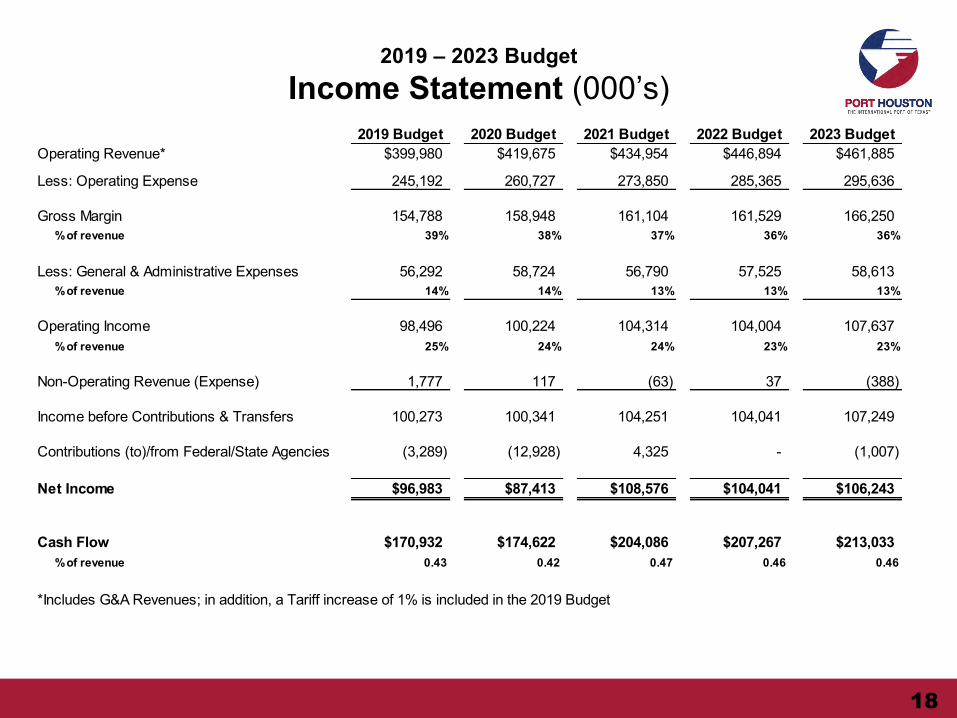
2019 – 2023 Budget Income Statement (000’s)
2019 Budget 2020 Budget 2021 Budget 2022 Budget 2023 BudgetOperating Revenue* $399,980 $419,675 $434,954 $446,894 $461,885
Less: Operating Expense 245,192 260,727 273,850 285,365 295,636
Gross Margin 154,788 158,948 161,104 161,529 166,250 % of revenue 39% 38% 37% 36% 36%
Less: General & Administrative Expenses 56,292 58,724 56,790 57,525 58,613 % of revenue 14% 14% 13% 13% 13%
Operating Income 98,496 100,224 104,314 104,004 107,637 % of revenue 25% 24% 24% 23% 23%
Non-Operating Revenue (Expense) 1,777 117 (63) 37 (388)
Income before Contributions & Transfers 100,273 100,341 104,251 104,041 107,249
Contributions (to)/from Federal/State Agencies (3,289) (12,928) 4,325 - (1,007)
Net Income $96,983 $87,413 $108,576 $104,041 $106,243
Cash Flow $170,932 $174,622 $204,086 $207,267 $213,033 % of revenue 0.43 0.42 0.47 0.46 0.46
*Includes G&A Revenues; in addition, a Tariff increase of 1% is included in the 2019 Budget
18

WELCOME MESSAGE | 2
2019 – 2023 Budget Capital Plan (000’s)
2018 Budget
2019 Budget
2020 Budget
2021 Budget
2022 Budget
2023 Budget
Barbours Cut 99,837$ 129,611$ 77,780$ 14,482$ 90,281$ 25,490$ Bayport Terminal 83,597 93,473 55,389 92,708 300 13,613 Channel Development 13,835 20,092 3,527 17,108 36,482 33,283 Turning Basin Terminals 24,897 19,472 44,383 3,700 6,710 18,900 Maintenance 7,662 6,847 - 3,833 2,808 2,770 PSEO 7,073 5,946 10,397 1,510 1,310 5,850 Bayport Railroad 15,343 5,100 13,615 - - - Real Estate 12,565 5,000 1,190 10,000 - - Other 9,729 1,856 10,385 6,773 6,472 3,911 Total Capital 274,538$ 287,397$ 216,666$ 150,114$ 144,363$ 103,817$
Grant Reimbursements (4,035) (1,598) (5,342) (4,325) - -
Net Capital 270,503$ 285,799$ 211,324$ 145,789$ 144,363$ 103,817$
19

WELCOME MESSAGE | 2
2019 – 2023 Budget Liquidity (000’s)
2018 2019 2020 2021 2022 2023Funds Available, Beginning of Period 361,939$ 194,476$ 78,011$ 35,967$ 89,939$ 152,843$ Debt Service,Contingency, & Other (58,220) - - - - - Outstanding PO's and Commitments (110,337) - - - - -
193,382$ 194,476$ 78,011$ 35,967$ 89,939$ 152,843$ Sources: Net Operating Cash Flow 166,534 170,932 174,622 204,086 207,267 213,033 Available Resources 359,916$ 365,408$ 252,633$ 240,053$ 297,206$ 365,876$
Uses: New Capital Investment Barbours Cut 23,254 129,611 77,780 14,482 90,281 25,490 Bayport Terminal 84,281 93,473 55,389 92,708 300 13,613 Turning Basin Terminals 7,310 20,092 44,383 3,700 6,710 18,900 Bayport Railroad 14,543 19,472 13,615 - - - Channel Development 5,451 6,847 3,527 17,108 36,482 33,283 Real Estate 871 5,946 1,190 10,000 - - Maintenance 14,839 5,100 - 3,833 2,808 2,770 PSEO 11,169 5,000 10,397 1,510 1,310 5,850 Other 3,722 1,856 10,385 6,773 6,472 3,911 Net Uses 165,440 287,397 216,666 150,114 144,363 103,817 Funds Available, End of Period 194,476$ 78,011$ 35,967$ 89,939$ 152,843$ 262,059$
20