Embed Size (px)
Citation preview

i
Contents
1 INTRODUCTION ........................................................................................................... 1
2 EXISTING CONDITIONS ................................................................................................. 2
Site Details .................................................................................................................. 2
Existing/Extant Use ...................................................................................................... 2
Census Data ....................................................................................................... 3
Site Access ................................................................................................................... 4
Walking ....................................................................................................................... 4
Cycling ............................................................................................................... 6
Bus Services ....................................................................................................... 8
Rail Services ..................................................................................................... 11
Local Highway Network ............................................................................................. 12
Higham Lane .................................................................................................... 12
Hydes Pastures .......................................................................................................... 12
Hinckley Road (A47) ................................................................................................... 13
Existing Traffic Flows ................................................................................................. 13
Summary ................................................................................................................... 14
3 DEVELOPMENT PROPOSALS ....................................................................................... 16
Development Composition ........................................................................................ 16
Pedestrian/Cycling Facilities ...................................................................................... 17
Vehicular Access ........................................................................................................ 17
Parking ...................................................................................................................... 18
Internal Highway Layout ............................................................................................ 19
Servicing .................................................................................................................... 19
4 TRAFFIC ANALYSIS ..................................................................................................... 21
Background Traffic Growth ........................................................................................ 21
Committed Development........................................................................................... 24
Traffic Generation ...................................................................................................... 24
Extant/Permitted Use ................................................................................................ 26
Trip Type Assessment ................................................................................................ 27
Distribution ............................................................................................................... 29
Effect on the Network ................................................................................................ 31
Junction Capacity Analysis ......................................................................................... 32
Summary ......................................................................................................... 33
Forecast Parking Utilisation ....................................................................................... 33
5 SUMMARY AND CONCLUSIONS .................................................................................. 35
ii
Summary ................................................................................................................... 35
Conclusion ................................................................................................................. 36
Figures
Figure 2.1 - Site Location
Figure 2.2 - Location of PRoW
Figure 2.3 - 15 and 30 minute indicative walking isochrones
Figure 2.4 - National Cycle Route 32
Figure 2.5 - 15 and 30 minute indicative cycling isochrones
Figure 2.6 - Local Bus Stops
Figure 2.7 - Existing Bus Services
Figure 3.1 - Proposed Site Plan
Figure 3.2 - Proposed Site Access Drawing
Figure 4.1-4.2 - 2016 Traffic Flows
Figure 4.3-4.4 - 2021 Traffic Flows
Figure 4.5-4.6 - AM and PM Traffic Distribution
Figure 4.7 - Forecast Parking Utilisation
Appendices
Appendix A - Traffic Surveys
Appendix B - Proposed Site Plan
Appendix C - Proposed Site Access Drawing
Appendix D - Swept Path Analysis
Appendix E - TEMPro Summary
Appendix F - TRICS Output
Appendix G - PICADY Output
Appendix H - ARCADY Output
Lidl Nuneaton, Transport Statement 1
H:\Projects\W150000\W151834 - Lidl - Nuneaton - Hinckley Road\Word\R01-CR-151834-15_08_07 - Transport
Statement.docx
August 2015
1 INTRODUCTION
1.1 Vectos is retained by Lidl UK GmbH to provide traffic and transportation advice in support of
a planning application for the development on land currently used as a Ford dealership, to a
Lidl store on Hydes Pastures, Nuneaton.
1.2 It is proposed to redevelop the site to accommodate a Lidl food retail store with a gross
external area (GEA) of 2556m2 (2458m2 GIA) and associated car parking and servicing
facilities.
1.3 This Transport Statement has been prepared to assess:
The site’s accessibility by sustainable modes of transport;
The trip attraction associated with the proposed redevelopment of the site and
potential effect on the adjoining local highway network;
The proposed access arrangements to the site, including junction capacity assessment
based on traffic surveys for the weekday AM and PM peak periods; and
The servicing arrangements and parking provision within the site.
1.4 The scope of this Transport Assessment has been agreed with the traffic and transportation
officers within Warwickshire County Council (agreed with Ben Nailing on 2nd July).
1.5 The structure of the report is as follows:
Section 2: sets out the existing conditions;
Section 3: provides details of the development proposals;
Section 4: details the forecast vehicular trip attraction to the proposal and provides
comment on the effect on the:
adjacent highway;
the utilisation of the car park;
the proposed servicing arrangements; and
Section 5: Provides a summary and conclusions.
Lidl Nuneaton, Transport Statement 2
H:\Projects\W150000\W151834 - Lidl - Nuneaton - Hinckley Road\Word\R01-CR-151834-15_08_07 - Transport
Statement.docx
August 2015
2 EXISTING CONDITIONS
Site Details
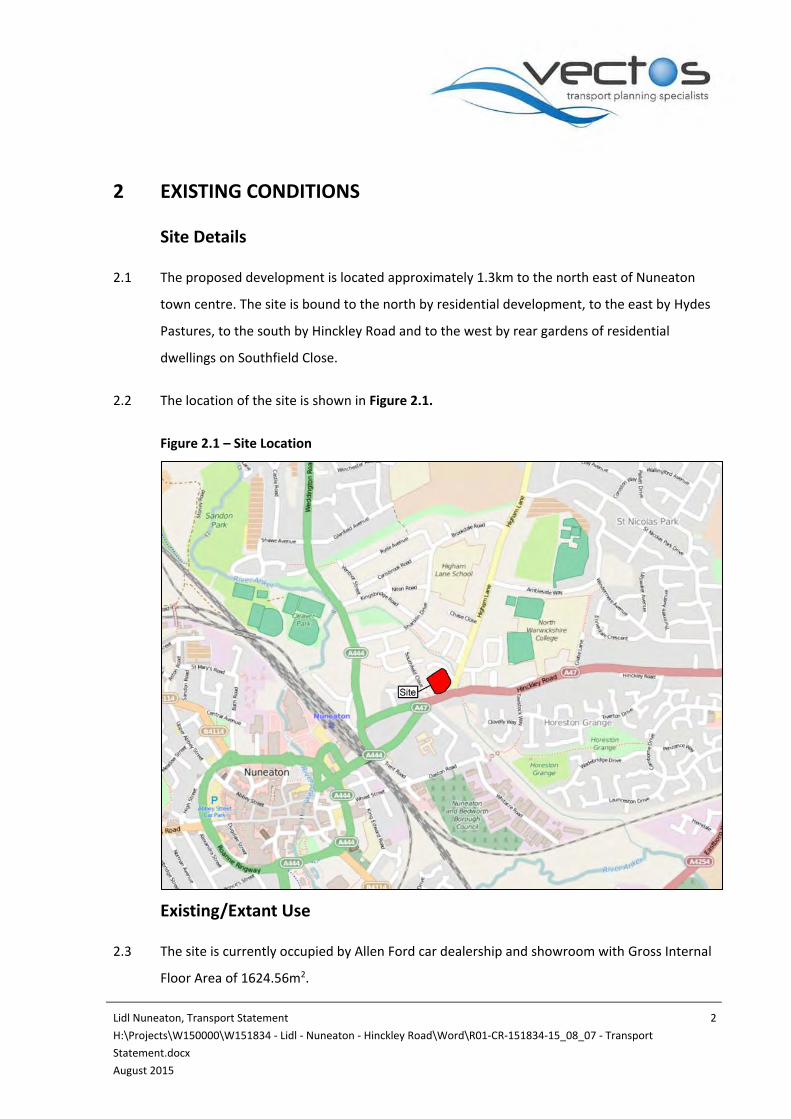
2.1 The proposed development is located approximately 1.3km to the north east of Nuneaton
town centre. The site is bound to the north by residential development, to the east by Hydes
Pastures, to the south by Hinckley Road and to the west by rear gardens of residential
dwellings on Southfield Close.
2.2 The location of the site is shown in Figure 2.1.
Figure 2.1 – Site Location
Existing/Extant Use
2.3 The site is currently occupied by Allen Ford car dealership and showroom with Gross Internal
Floor Area of 1624.56m2.
Lidl Nuneaton, Transport Statement 3
H:\Projects\W150000\W151834 - Lidl - Nuneaton - Hinckley Road\Word\R01-CR-151834-15_08_07 - Transport
Statement.docx
August 2015
2.4 The site is ideally located to meet the convenience shopping needs in this area due to its
location within a residential settlement and catchment. It will cater mainly for food and
convenience shopping needs, as well as the ‘top-up’ shopping requirements to a significant
walk-in catchment population. There will also, due to the location of the site, be an element
of pass-by and linked trips.
Census Data
2.5 The observed mode split for journeys to the Super Output Area ‘Nuneaton and Bedworth
001’ has been taken from the 2011 Census data, and is summarised in Table 2.2.
Table 2.2 – Method of Travel to Work (2011 Census)
Mode Mode Split
(travel to work)
Work Mainly at or From Home 0%
Train 1%
Bus, Minibus or Coach 3%
Taxi 0%
Motorcycle, Scooter or Moped 0%
Driving a Car or Van 69%
Passenger in a Car or Van 7%
Bicycle 2%
On Foot 17%
Other Method of Travel to Work 0%
Total 100%
2.6 The data summarised in Table 2.2 illustrates that those who currently work in the ‘Nuneaton
and Bedworth 001’ area, currently travel to work with a relatively high proportion of car
drivers (69%). However, this area also sees a high proportion of people travelling to work on
foot (17%) and as passengers (7%). Evidentially, walking is a major form of transport in this
area (behind the private vehicle), and so identifying the good walking routes and linkages are
paramount.

Lidl Nuneaton, Transport Statement 4
H:\Projects\W150000\W151834 - Lidl - Nuneaton - Hinckley Road\Word\R01-CR-151834-15_08_07 - Transport
Statement.docx
August 2015
Site Access
2.7 The site is currently accessed from Hydes Pastures via a priority T-junction. Pedestrian access
to the site is provided via a footpath on Hydes Pastures which leads into the site. Cyclists are
accommodated on road in the vicinity of the site.
Walking
2.8 One of the main factors demonstrating the suitability of a development site is its accessibility
by non-car modes of transport. This helps to reduce the reliance on the use of the private car
as well as promoting the aims of ‘smarter’ travel choices.
2.9 Hydes Pastures is the natural access point to the site. The road currently provides footways
on both sides of the carriageway, and through excellent pedestrian provision on Higham
Lane and Hinkley Road, links are provided to the neighbouring communities. These lit
footways are all a good width and are in a good state of repair. In part a number of the
footways also include a grassed verge segregating it from the carriageway.
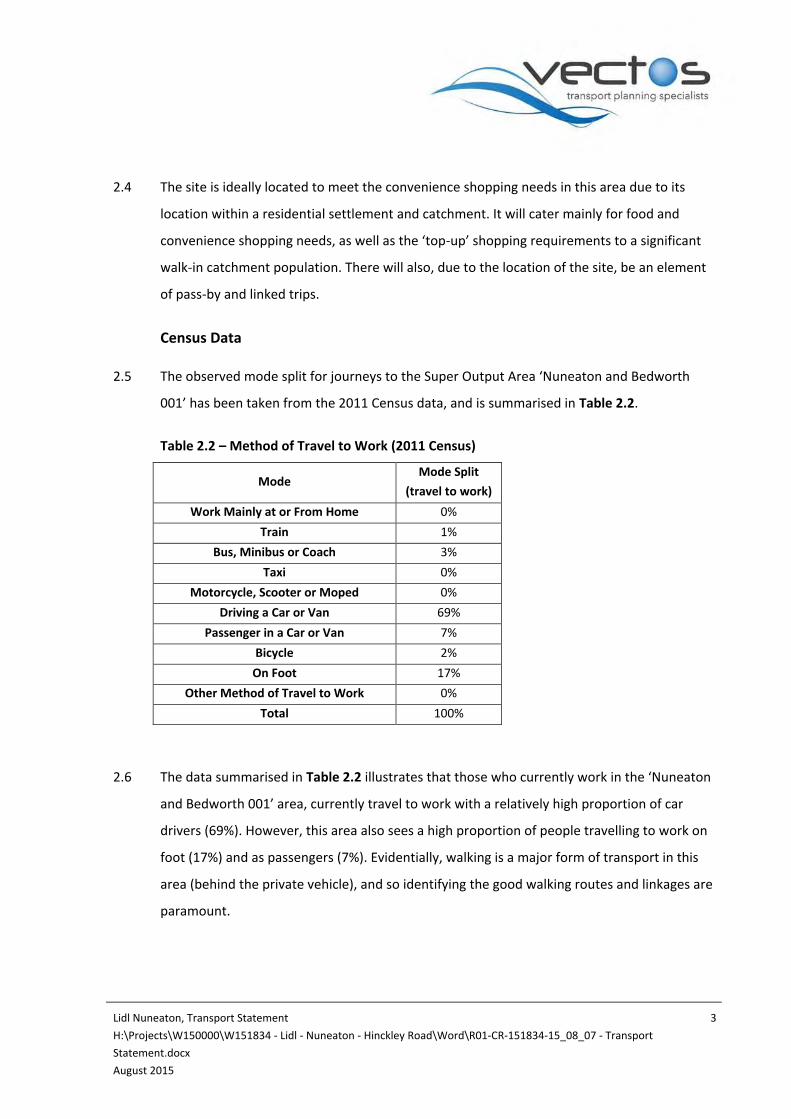
2.10 There are some PRoW in the local vicinity to the site. In addition to these, the nature of the
local road network encourages accessibility by foot and cycle; furthermore they offer ideal
pedestrian links via informal footways. There are a number of existing footways that serve
the site providing access to the local residential catchment area. In addition, there are a
number of informal pedestrian crossing points (build outs, dropped kerbs and tactile paving)
along the junctions in the vicinity of the site.
2.11 The local PRoW are shown in Figure 2.2 below.
Lidl Nuneaton, Transport Statement 5
H:\Projects\W150000\W151834 - Lidl - Nuneaton - Hinckley Road\Word\R01-CR-151834-15_08_07 - Transport
Statement.docx
August 2015
Figure 2.2 – Location of PRoW
2.12 The propensity for people to walk or cycle depends on individual preferences and
circumstances. These circumstances might include, for instance, the purpose of the journey,
the attractiveness of, and activity along, the route, the weather, and the cost of alternatives.
2.13 The thrust of land use and transport policy is to promote and encourage the choice of
walking and cycling above all else where travel needs to occur. Therefore, it is both
reasonable to assume that walking is a viable and growing means of travel, and that new
development, such as this one, should be designed to promote and encourage it. Section 3
explains the design principles for the site.
2.14 In practice, the distance that any individual is likely to choose to walk depends on that
individual and the circumstances, but it is fair to assume that over time, given current
policies to encourage community, the propensity for individuals to walk, and to walk further,
will increase.
Site
Lidl Nuneaton, Transport Statement 6
H:\Projects\W150000\W151834 - Lidl - Nuneaton - Hinckley Road\Word\R01-CR-151834-15_08_07 - Transport
Statement.docx
August 2015
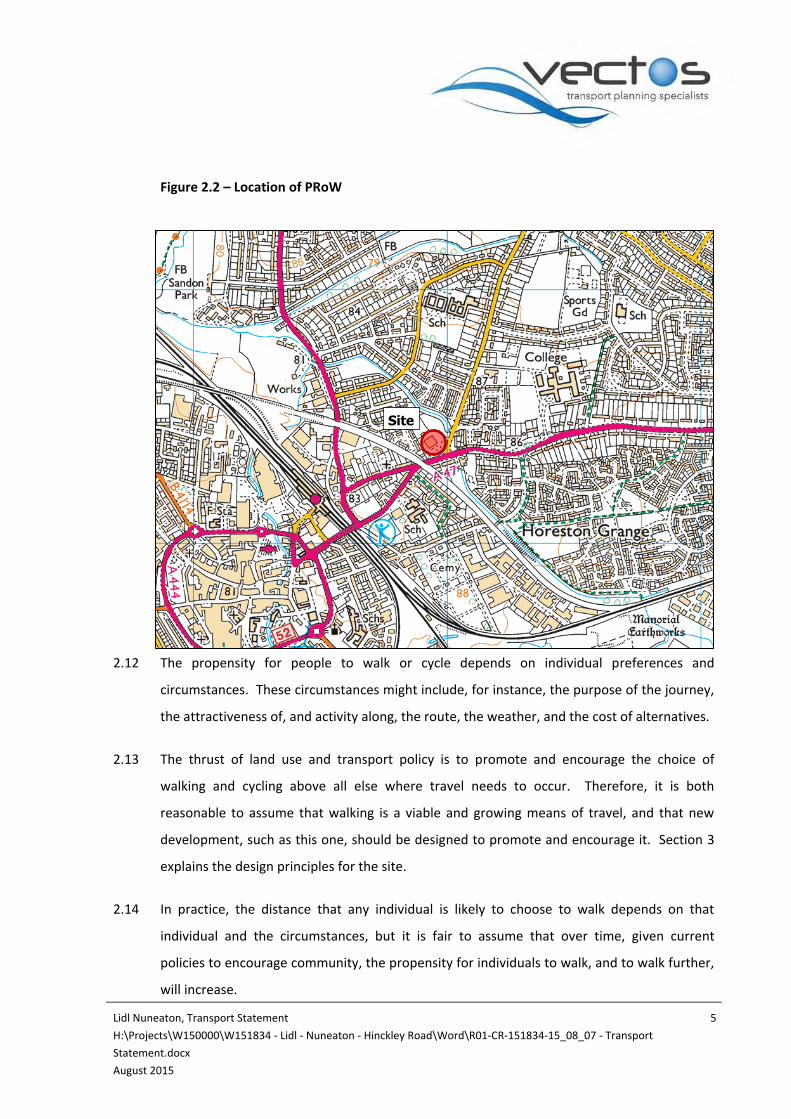
2.15 Figure 2.3 shows the 15 minute and 30 minute walking isochrones for the site.
Figure 2.3 – 15 (purple) & 30 (green) minute indicative walking isochrones
Cycling
2.16 The area is served by good quality pedestrian routes and through attractive and active
environment, the local streets are conducive to cycling.
2.17 The existing cycle infrastructure within this area of Nuneaton is good, with much of Higham
Lane being classified as an ‘advisory’ cycle route to the north. National Cycle Route 52 is
located nearby to the west of the site, this runs from Warwick, through Coventry and links
with NCR 6 just west of Loughborough. The local cycle provision is illustrated in Figure 2.4.
Figure 2.4 National Cycle Route 52
Lidl Nuneaton, Transport Statement 7
H:\Projects\W150000\W151834 - Lidl - Nuneaton - Hinckley Road\Word\R01-CR-151834-15_08_07 - Transport
Statement.docx
August 2015
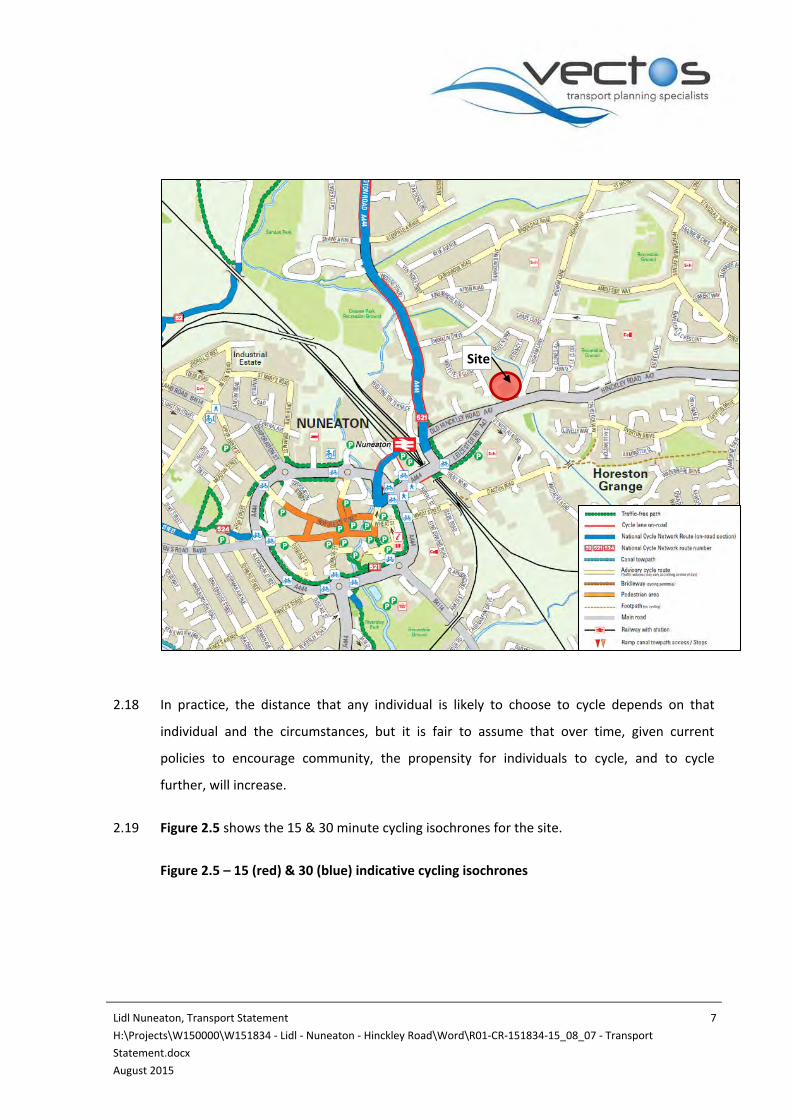
2.18 In practice, the distance that any individual is likely to choose to cycle depends on that
individual and the circumstances, but it is fair to assume that over time, given current
policies to encourage community, the propensity for individuals to cycle, and to cycle
further, will increase.
2.19 Figure 2.5 shows the 15 & 30 minute cycling isochrones for the site.
Figure 2.5 – 15 (red) & 30 (blue) indicative cycling isochrones
Site
Lidl Nuneaton, Transport Statement 8
H:\Projects\W150000\W151834 - Lidl - Nuneaton - Hinckley Road\Word\R01-CR-151834-15_08_07 - Transport
Statement.docx
August 2015
Bus Services
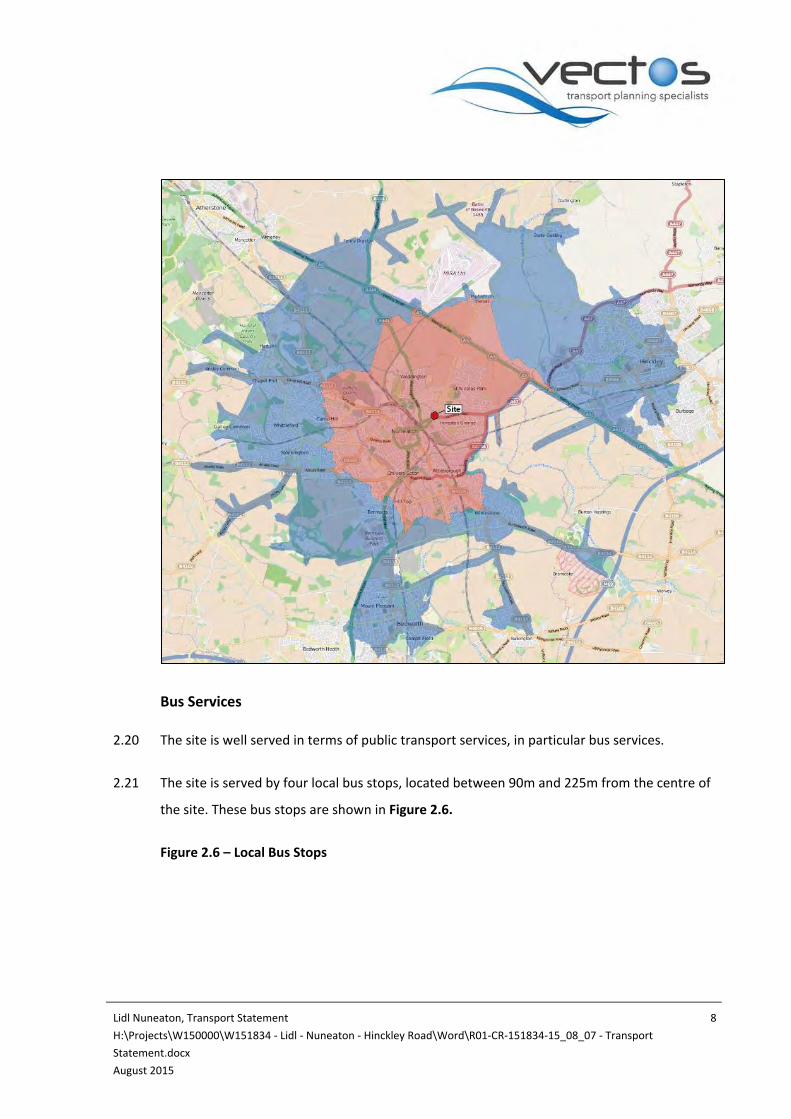
2.20 The site is well served in terms of public transport services, in particular bus services.
2.21 The site is served by four local bus stops, located between 90m and 225m from the centre of
the site. These bus stops are shown in Figure 2.6.
Figure 2.6 – Local Bus Stops
Lidl Nuneaton, Transport Statement 9
H:\Projects\W150000\W151834 - Lidl - Nuneaton - Hinckley Road\Word\R01-CR-151834-15_08_07 - Transport
Statement.docx
August 2015
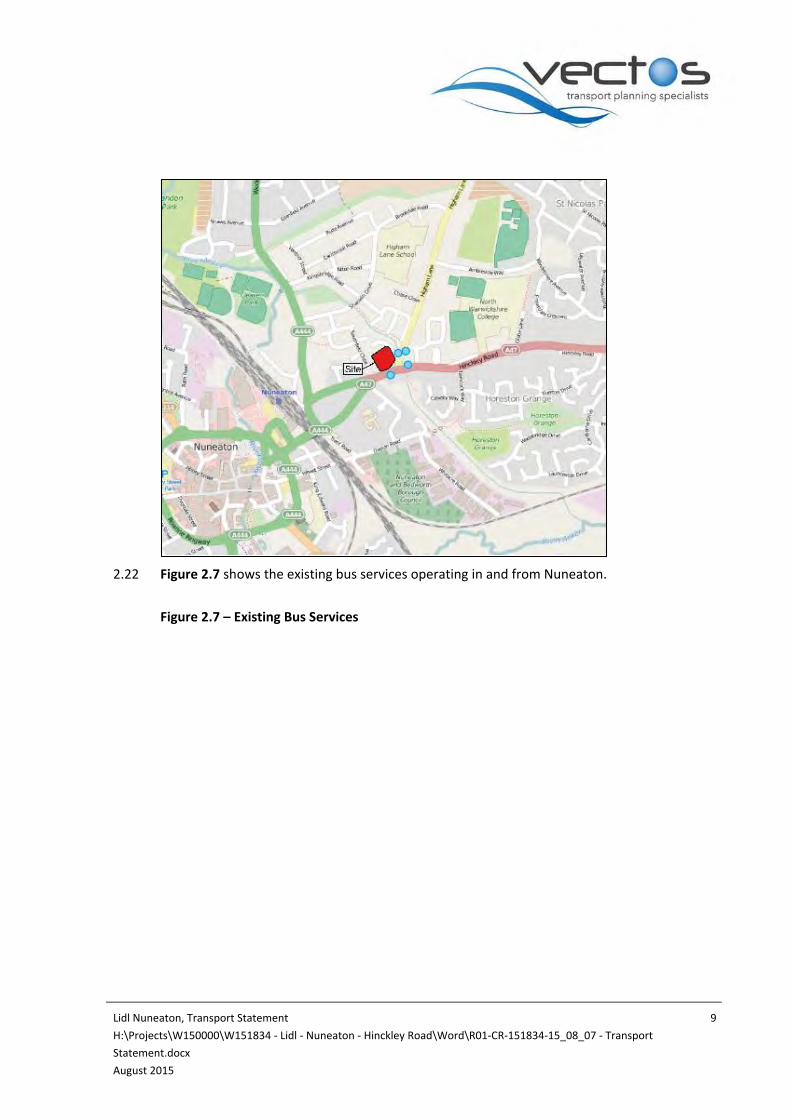
2.22 Figure 2.7 shows the existing bus services operating in and from Nuneaton.
Figure 2.7 – Existing Bus Services
Lidl Nuneaton, Transport Statement 10
H:\Projects\W150000\W151834 - Lidl - Nuneaton - Hinckley Road\Word\R01-CR-151834-15_08_07 - Transport
Statement.docx
August 2015
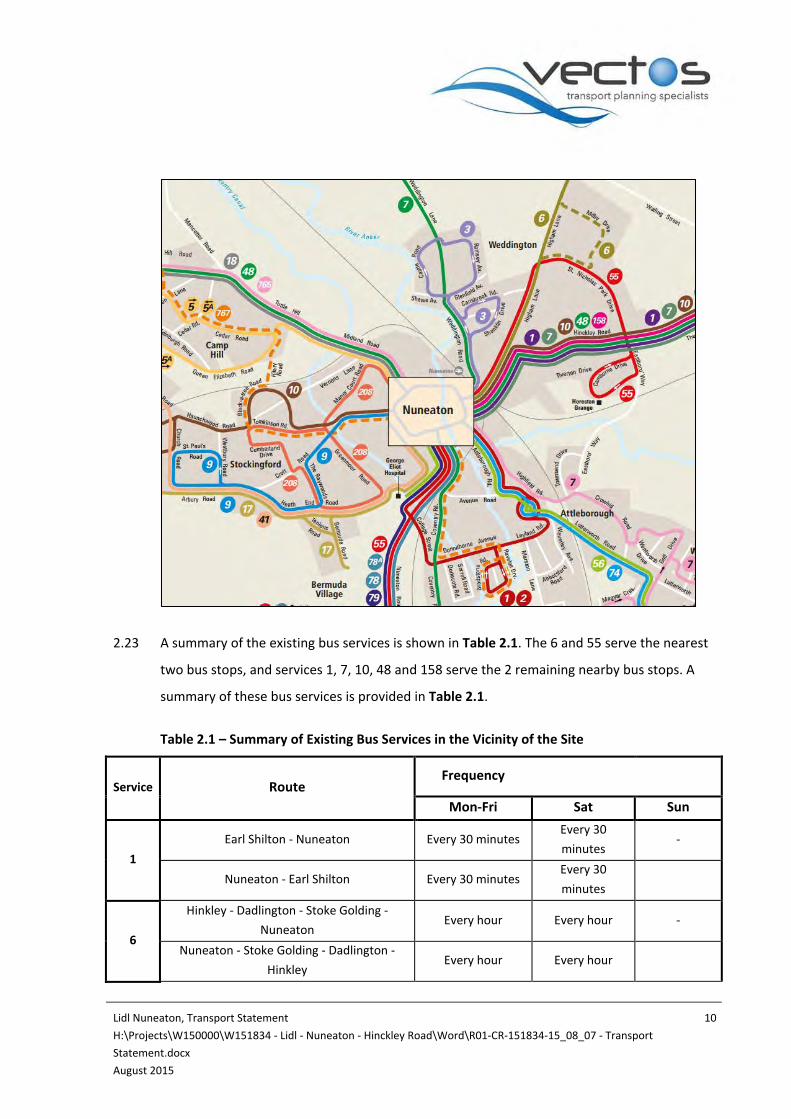
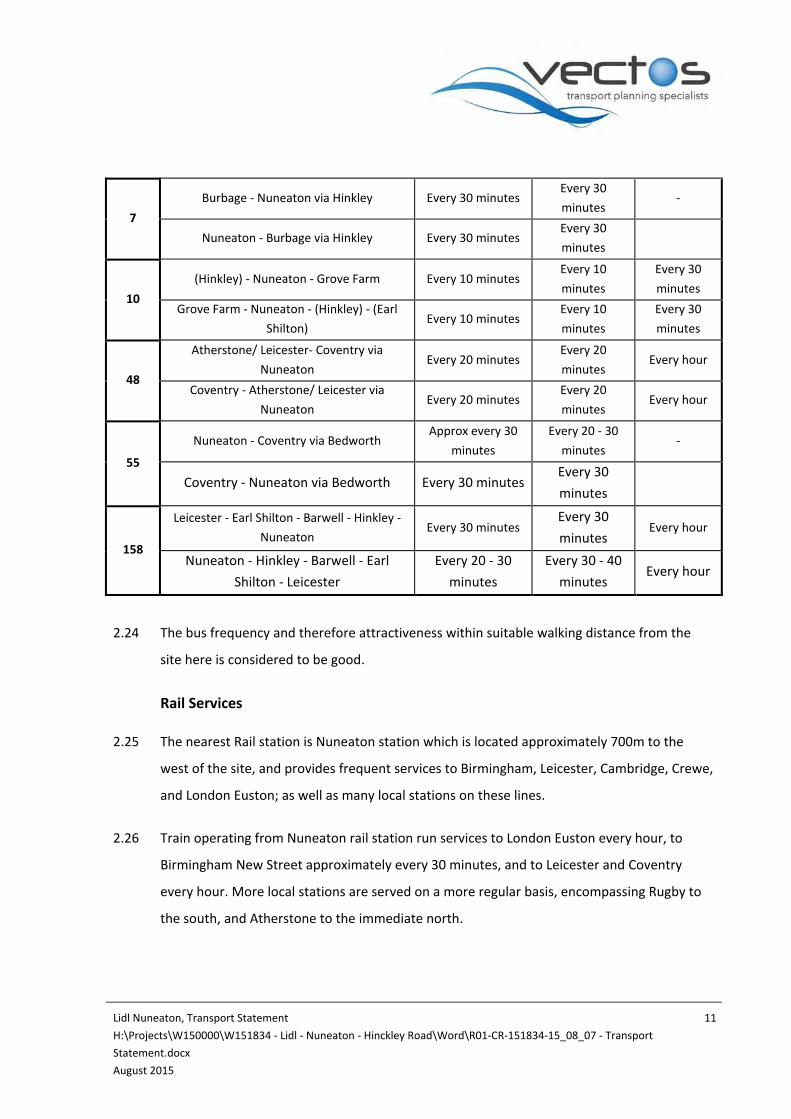
2.23 A summary of the existing bus services is shown in Table 2.1. The 6 and 55 serve the nearest
two bus stops, and services 1, 7, 10, 48 and 158 serve the 2 remaining nearby bus stops. A
summary of these bus services is provided in Table 2.1.
Table 2.1 – Summary of Existing Bus Services in the Vicinity of the Site
Service Route Frequency
Mon-Fri Sat Sun
1
Earl Shilton - Nuneaton Every 30 minutes Every 30
minutes -
Nuneaton - Earl Shilton Every 30 minutes Every 30
minutes
6
Hinkley - Dadlington - Stoke Golding -
Nuneaton Every hour Every hour -
Nuneaton - Stoke Golding - Dadlington -
Hinkley Every hour Every hour
Lidl Nuneaton, Transport Statement 11
H:\Projects\W150000\W151834 - Lidl - Nuneaton - Hinckley Road\Word\R01-CR-151834-15_08_07 - Transport
Statement.docx
August 2015
7
Burbage - Nuneaton via Hinkley Every 30 minutes Every 30
minutes -
Nuneaton - Burbage via Hinkley Every 30 minutes Every 30
minutes
10
(Hinkley) - Nuneaton - Grove Farm Every 10 minutes Every 10
minutes
Every 30
minutes
Grove Farm - Nuneaton - (Hinkley) - (Earl
Shilton) Every 10 minutes
Every 10
minutes
Every 30
minutes
48
Atherstone/ Leicester- Coventry via
Nuneaton Every 20 minutes
Every 20
minutes Every hour
Coventry - Atherstone/ Leicester via
Nuneaton Every 20 minutes
Every 20
minutes Every hour
55
Nuneaton - Coventry via Bedworth Approx every 30
minutes
Every 20 - 30
minutes -
Coventry - Nuneaton via Bedworth Every 30 minutes Every 30
minutes
158
Leicester - Earl Shilton - Barwell - Hinkley -
Nuneaton Every 30 minutes
Every 30
minutes Every hour
Nuneaton - Hinkley - Barwell - Earl
Shilton - Leicester
Every 20 - 30
minutes
Every 30 - 40
minutes Every hour
2.24 The bus frequency and therefore attractiveness within suitable walking distance from the
site here is considered to be good.
Rail Services
2.25 The nearest Rail station is Nuneaton station which is located approximately 700m to the
west of the site, and provides frequent services to Birmingham, Leicester, Cambridge, Crewe,
and London Euston; as well as many local stations on these lines.
2.26 Train operating from Nuneaton rail station run services to London Euston every hour, to
Birmingham New Street approximately every 30 minutes, and to Leicester and Coventry
every hour. More local stations are served on a more regular basis, encompassing Rugby to
the south, and Atherstone to the immediate north.

Lidl Nuneaton, Transport Statement 12
H:\Projects\W150000\W151834 - Lidl - Nuneaton - Hinckley Road\Word\R01-CR-151834-15_08_07 - Transport
Statement.docx
August 2015
Local Highway Network
Higham Lane
2.27 Higham Lane provides a link between Hinkley Road to the south, and the A5 to the north of
Nuneaton. This lit, single carriageway road is subject to a 30 mph speed limit in the vicinity of
the site, and becomes 40 mph to the north as the nature of the area becomes less
residential.
2.28 Currently there exist footways along both sides of the carriageway for a good length of
Higham Lane within the bounds of the built-up area, with footways separated from the
carriageway via a grass verge on much of the western side of the carriageway.
2.29 An informal crossing is provided across Higham Road immediately before the mini-
roundabout junction with Hinkley Road, which consists of a central island and benefits from
dropped kerbs. Continuous pedestrian linkages are provided through dropped kerbs and
some tactile paving along the length of Higham Lane.
2.30 Two bus stops are provided on Higham Lane within close proximity to the site. These are
‘opposite’ and ‘adjacent’ to Ferndale Close.
Hydes Pastures
2.31 Hydes Pastures joins Higham Lane at a priority T-junction whereby Higham Lane has priority.
This lit street forms the sole access to the recent residential development adjacent to the
site.
2.32 As a result of the recent residential development, Hydes Pastures is currently in the process
of being adopted by Warwickshire County Council. We understand following discussions
with the Engineering Manager in the Council that the developer and the Council have a
signed legal agreement in place and that the highway adoption will follow within the next
few months once the snagging process is completed.
Lidl Nuneaton, Transport Statement 13
H:\Projects\W150000\W151834 - Lidl - Nuneaton - Hinckley Road\Word\R01-CR-151834-15_08_07 - Transport
Statement.docx
August 2015
2.33 Footways of generous width are provided on either side of the carriageway, thereby
continuing the good pedestrian provision on Higham Lane, past the site, and into the new
residential development.
2.34 Hydes Pastures is subject to a 30 mph speed limit, continued from Higham Lane.
Hinckley Road (A47)
2.35 Hinckley Road boarders the southern edge of the site, whilst Higham Lane connects to it via a
mini-roundabout.
2.36 Old Hinckley Road connects the A444 to the west, to the A4254 to the east where it becomes
The Long Shoot (A57) at a roundabout.
2.37 Hinckley Road is single carriageway in the vicinity of the site and is subject to a 30 mph speed
limit.
2.38 Two bus stops are existent on either side of the mini-roundabout junction with Higham Lane,
the eastbound stop benefits from a dedicated layby, shelter and timetable. Similarly the
westbound stop is equipped with a shelter, bin and timetable.
2.39 Footways are provided on both sides of the carriageway and for the most part these are
separated from the carriageway by grass verges. These footways also have the advantage of
lighting. A signalised pedestrian crossing is provided to the east of the junction with Higham
Lane, providing safe and easy connectivity for pedestrians.
Existing Traffic Flows
2.40 Following a site visit, it was apparent that there were Severn Trent Water road works on
Higham Lane north of Hydes Pastures and the local highway authority advised that these
road works could skew the traffic data.
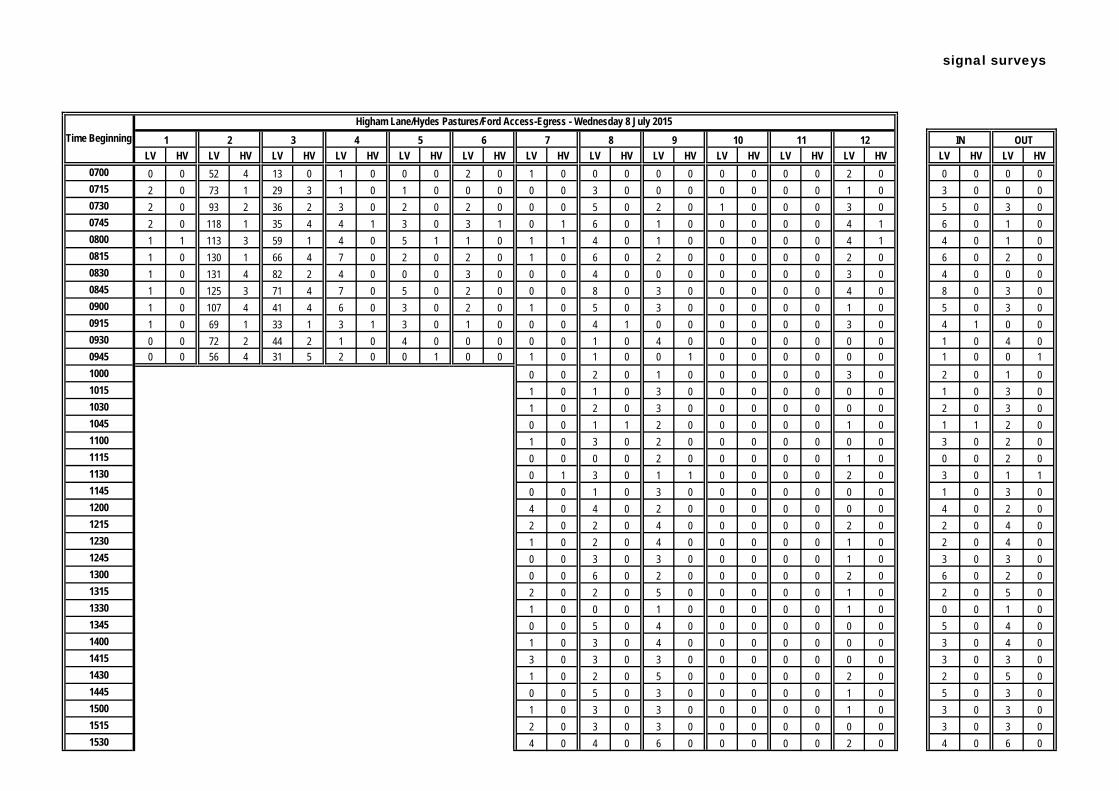
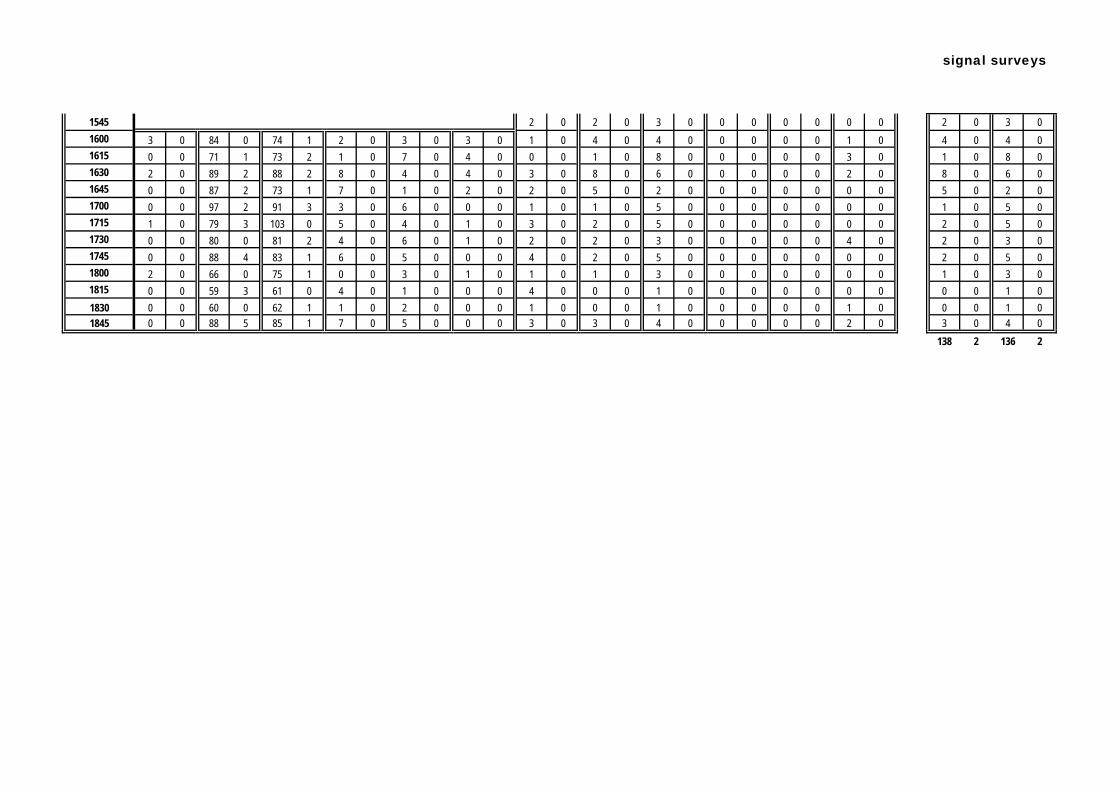
2.41 However and in order to understand the existing traffic demand from the site, a traffic
survey was undertaken on Wednesday 8th July at the Site Access/Hydes Pastures junction
Lidl Nuneaton, Transport Statement 14
H:\Projects\W150000\W151834 - Lidl - Nuneaton - Hinckley Road\Word\R01-CR-151834-15_08_07 - Transport
Statement.docx
August 2015
and the Hydes Pastures/Higham Lane junction. The full traffic surveys are included at
Appendix A.
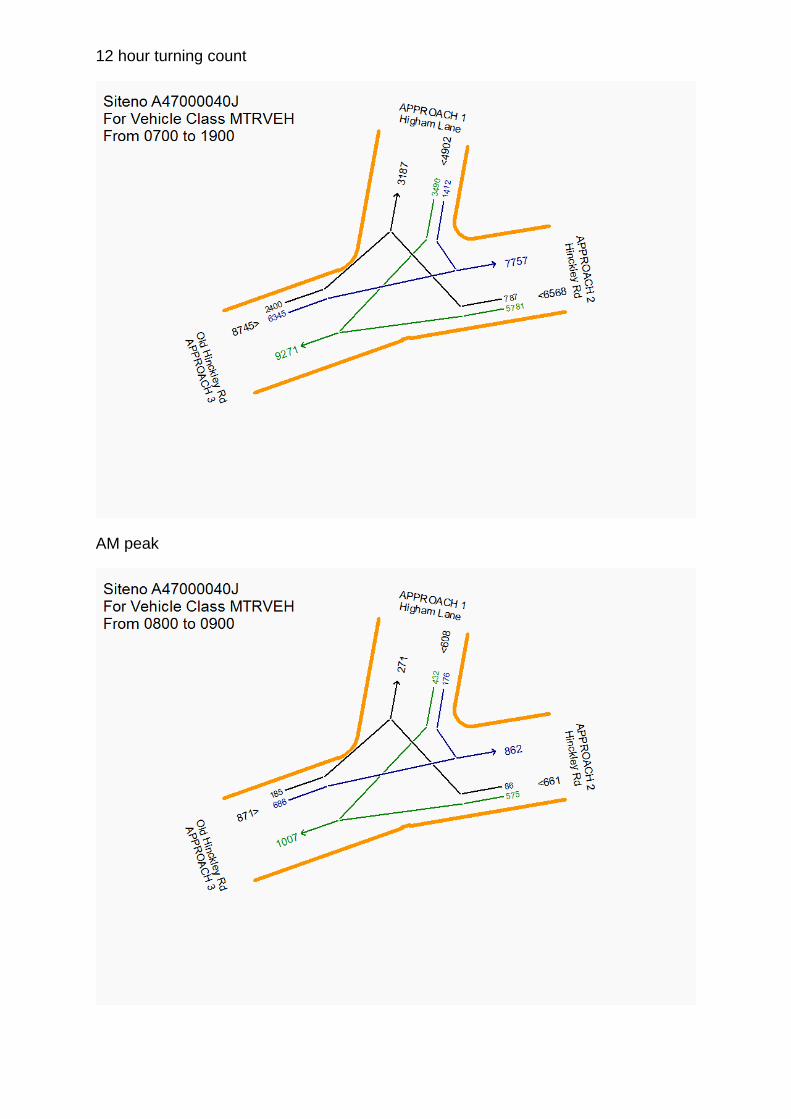
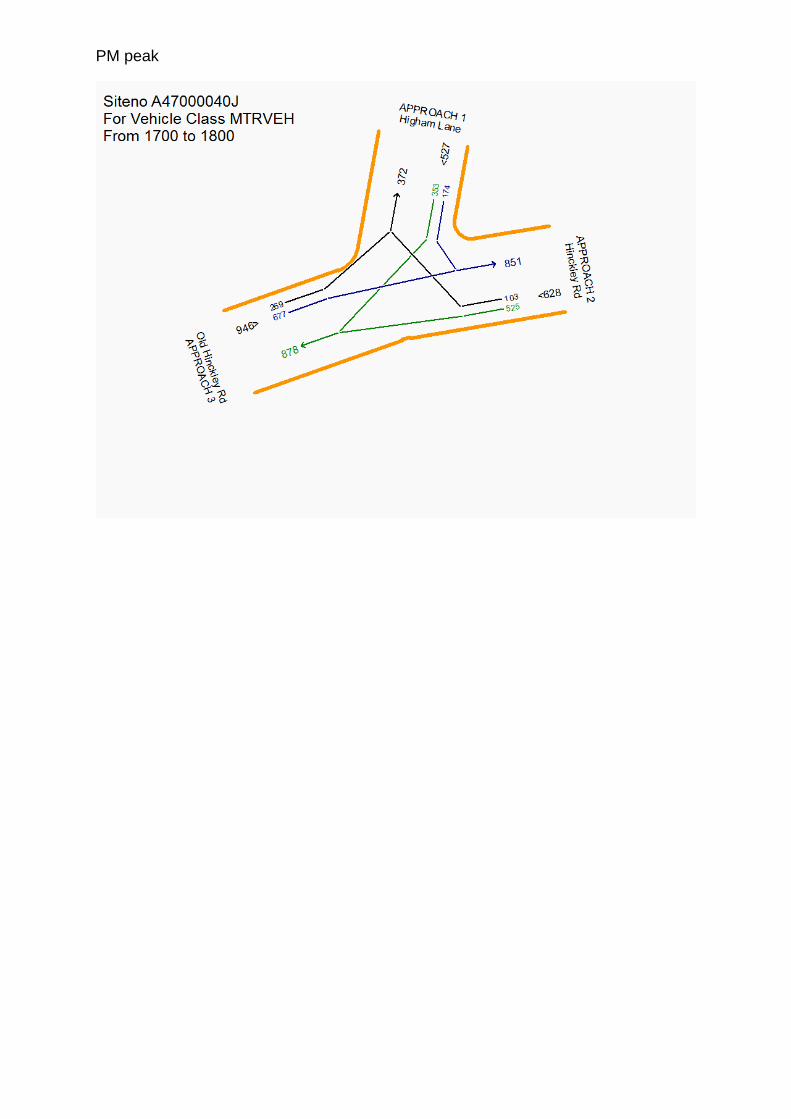
2.42 In addition survey data was procured from Warwickshire County Council (WCC) for the
Higham Lane/Hinckley Road junction. This survey was undertaken on Thursday 12th March
2015. The survey results are also included at Appendix A.
2.43 A comparison between the northbound and southbound traffic flows on Higham Lane from
each set of surveys, shows that there are discrepancies in the flows between the Higham
Lane/Hydes Pastures and Higham Lane/Hinckley Road junctions. This is expected and would
naturally be the case in traffic levels recorded on different days.
2.44 In the AM peak, there is a discrepancy of 40 vehicles travelling northbound between the
junctions and a discrepancy of 85 vehicles travelling southbound. In the PM peak, there is a
discrepancy of 10 vehicles travelling northbound and 153 vehicles travelling southbound.
This suggests that there is a daily variation of traffic on Higham Lane.
2.45 For robustness, the highest recorded volumes of traffic in both directions on Higham
Lanehave been used within the assessment.
Summary
2.46 There are currently good pedestrian and cycle networks in the vicinity of the site. The site is
also located in close proximity to a number of residential developments in the surrounding
area which means that the site is in walking distance to a large residential catchment. The
location of the site will benefit customers and employees.
2.47 There are bus stops located within 225m of the site which provide services to a number of
destinations including Nuneaton, Burbage, Hinkley, Coventry, Leicester and Bedworth. There
are currently 36 services per hour in both directions. The site is also located within 700m of
the site with rail services to Birmingham, Leicester, Cambridge, Crewe and London Euston,
stopping at local stations along the route.

Lidl Nuneaton, Transport Statement 15
H:\Projects\W150000\W151834 - Lidl - Nuneaton - Hinckley Road\Word\R01-CR-151834-15_08_07 - Transport
Statement.docx
August 2015
2.48 As demonstrated in this chapter, the site is located in a highly sustainable location and can
be easily accessed by a number of sustainable modes.
Lidl Nuneaton, Transport Statement 16
H:\Projects\W150000\W151834 - Lidl - Nuneaton - Hinckley Road\Word\R01-CR-151834-15_08_07 - Transport
Statement.docx
August 2015
3 DEVELOPMENT PROPOSALS
Development Composition
3.1 It is proposed to change the existing use of the site from car dealership/showroom to A1
discount food retail with a GEA of 2,556m2. At the time of writing this report the site was
fully occupied by the car dealership with full operational traffic associated with its use.
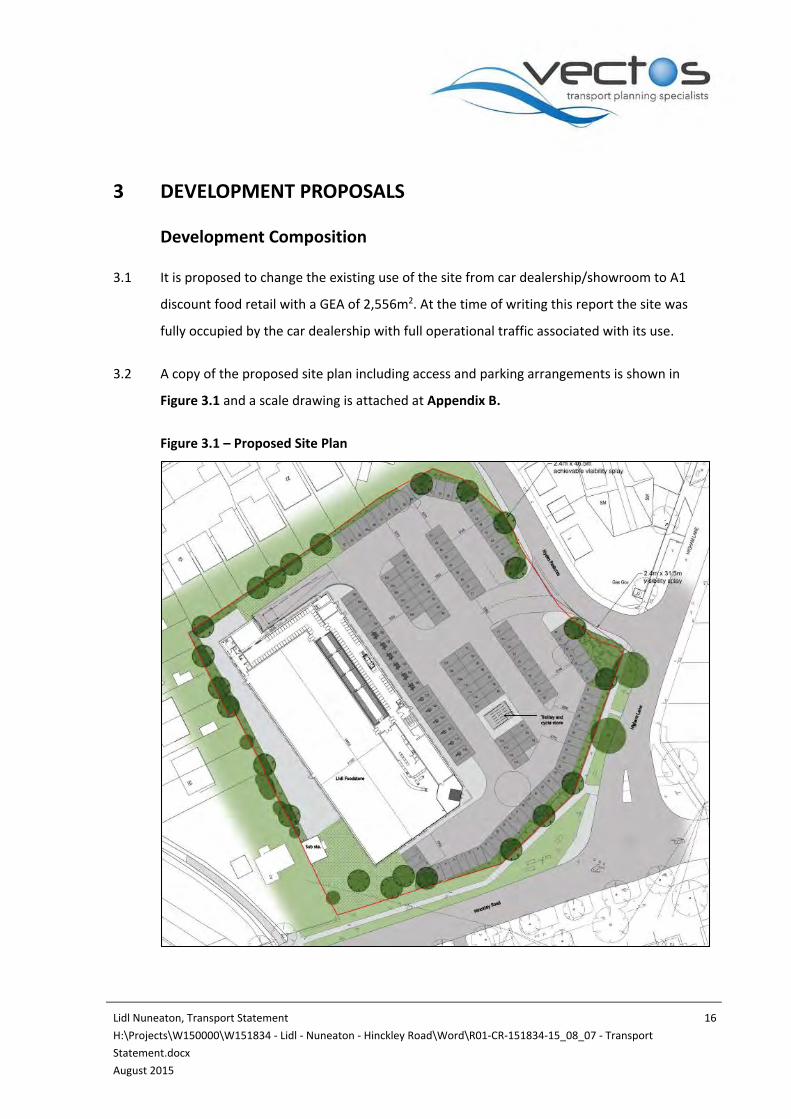
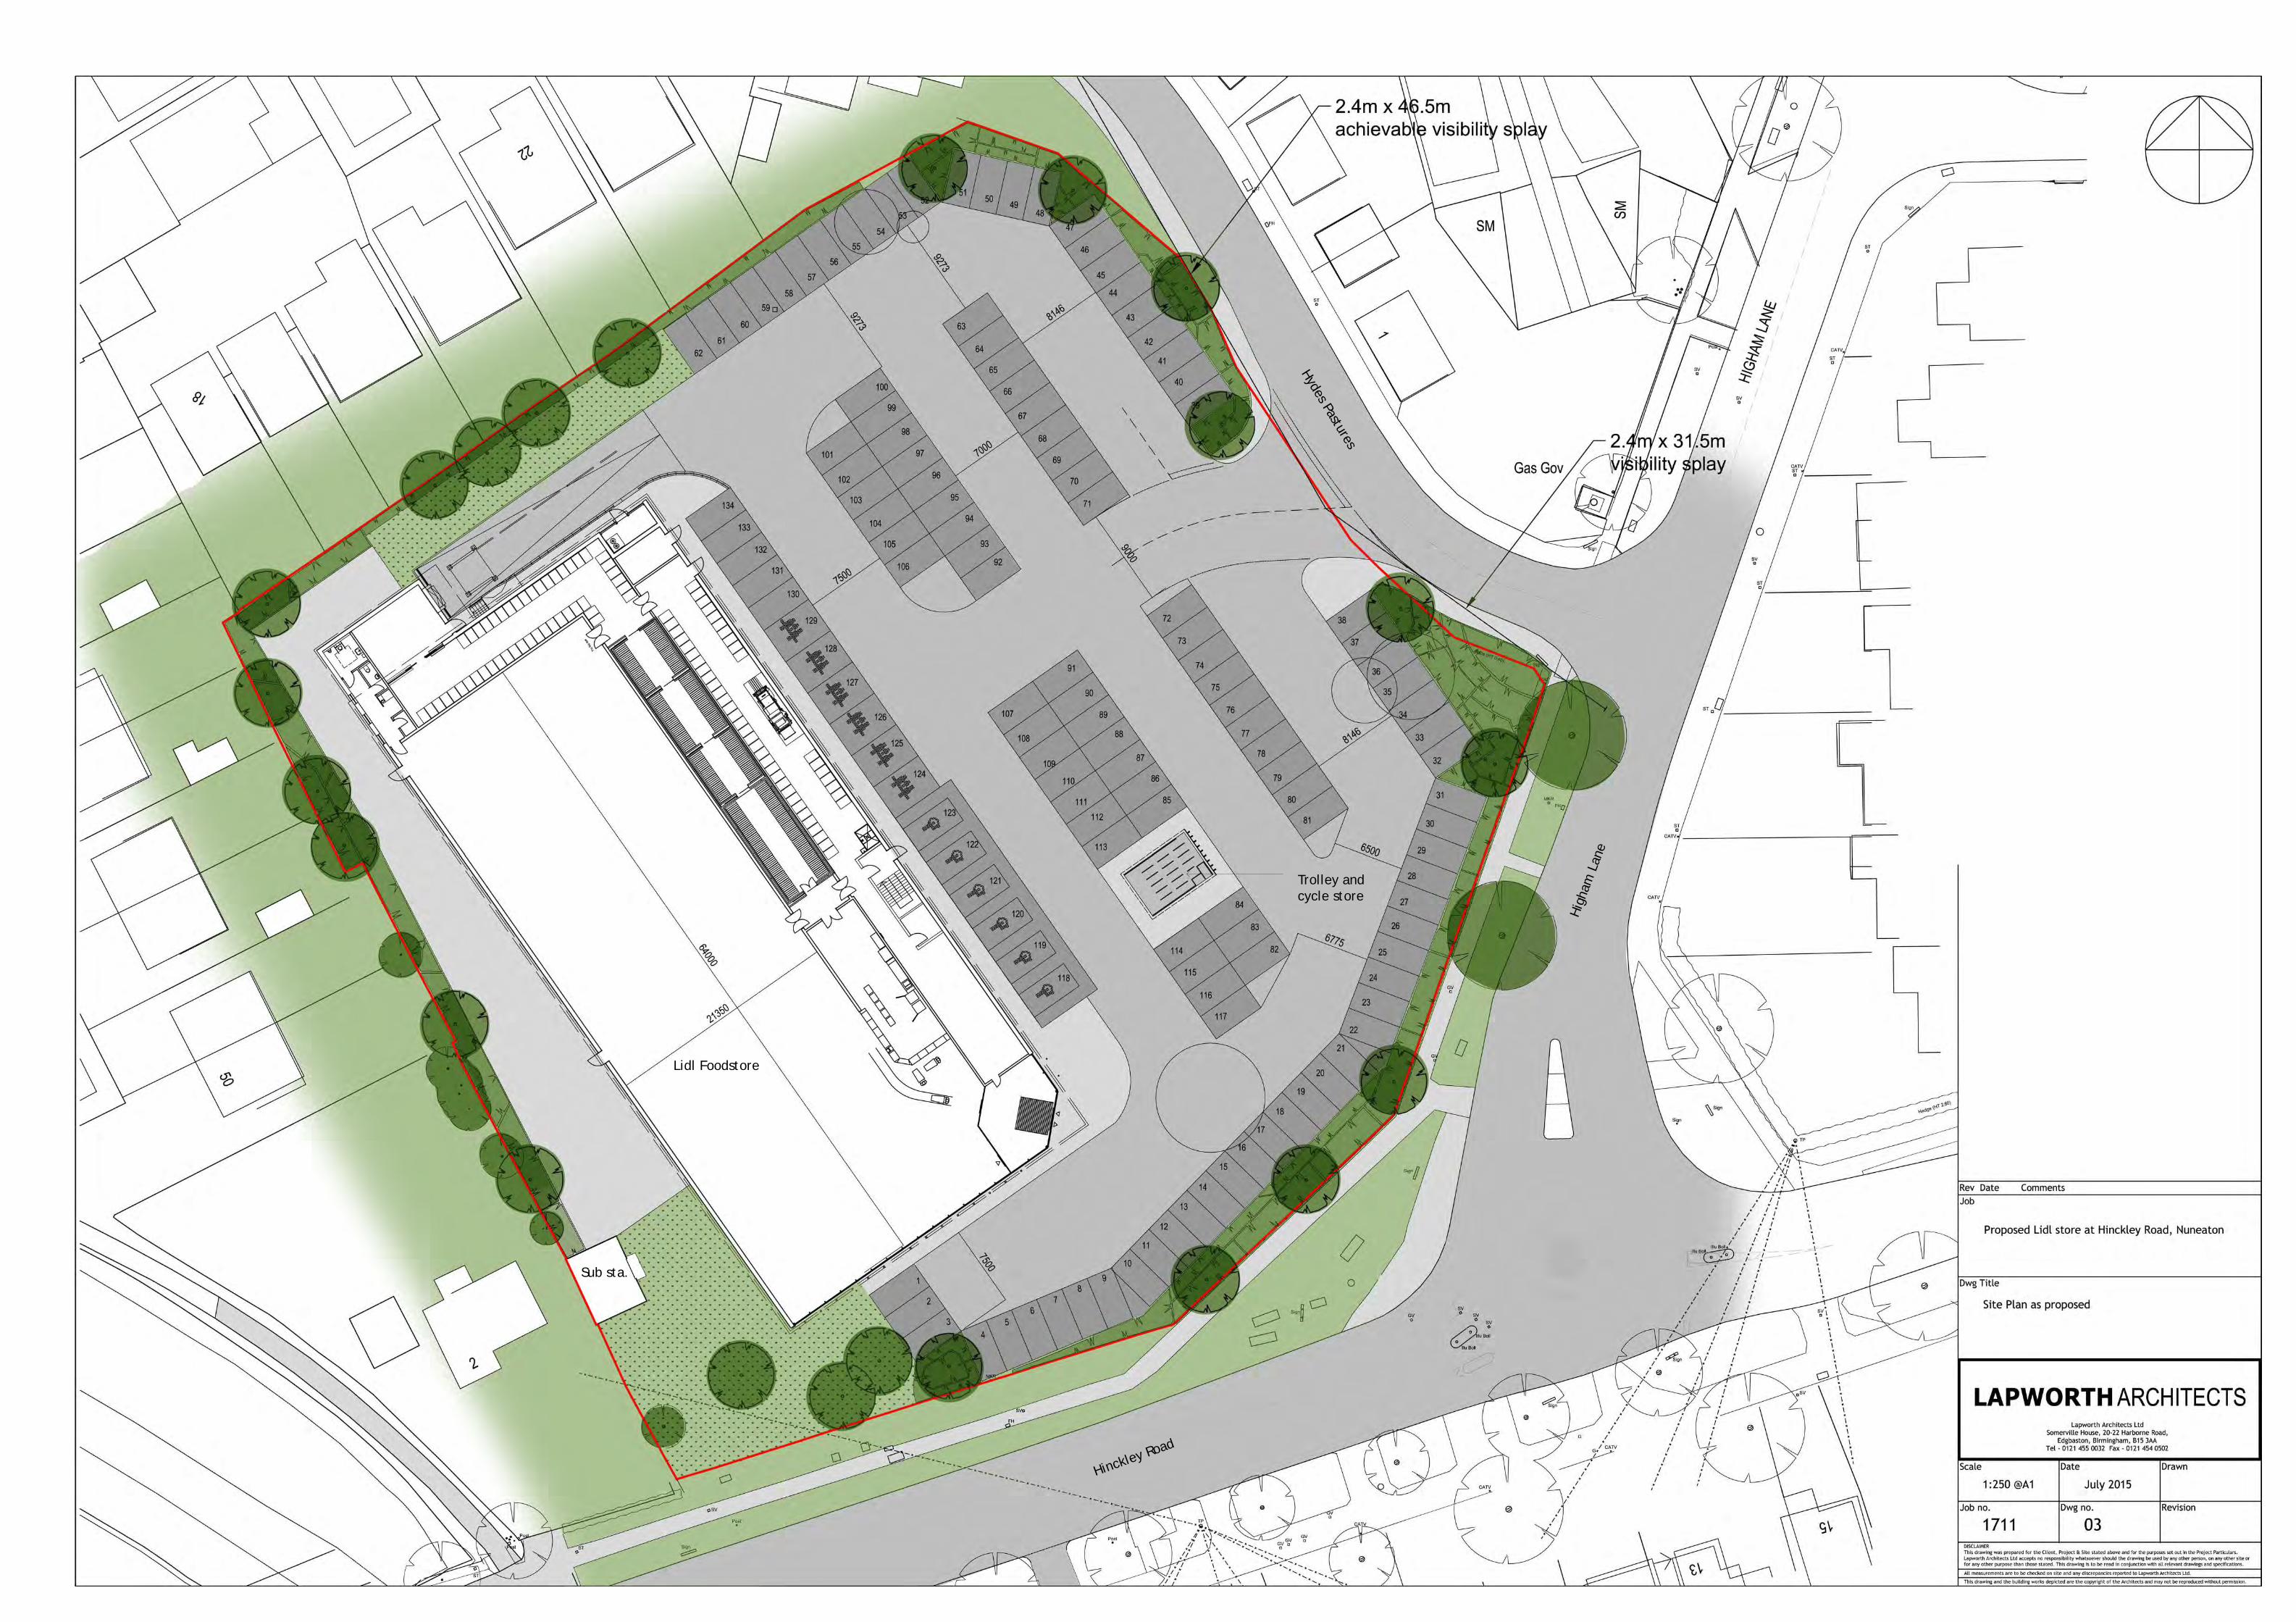
3.2 A copy of the proposed site plan including access and parking arrangements is shown in
Figure 3.1 and a scale drawing is attached at Appendix B.
Figure 3.1 – Proposed Site Plan

Lidl Nuneaton, Transport Statement 17
H:\Projects\W150000\W151834 - Lidl - Nuneaton - Hinckley Road\Word\R01-CR-151834-15_08_07 - Transport
Statement.docx
August 2015
Pedestrian/Cycling Facilities
3.3 The existing pedestrian and cycling facilities in the vicinity of the site are considered to be
very good. The location of the site is extremely well placed in terms of accessibility and
connects with the existing pedestrian and cycling network immediately adjacent to the site.
3.4 Long and short term cycle parking will be provided on site for the use of employees and
customers in a safe, secure and convenient location within the car park in close proximity to
the store entrance of the site as shown in Figure 3.1.
Vehicular Access
3.5 The site will be accessed by customers and service vehicles via the existing access from
Hydes Pastures. This will be the only point of access to the site.
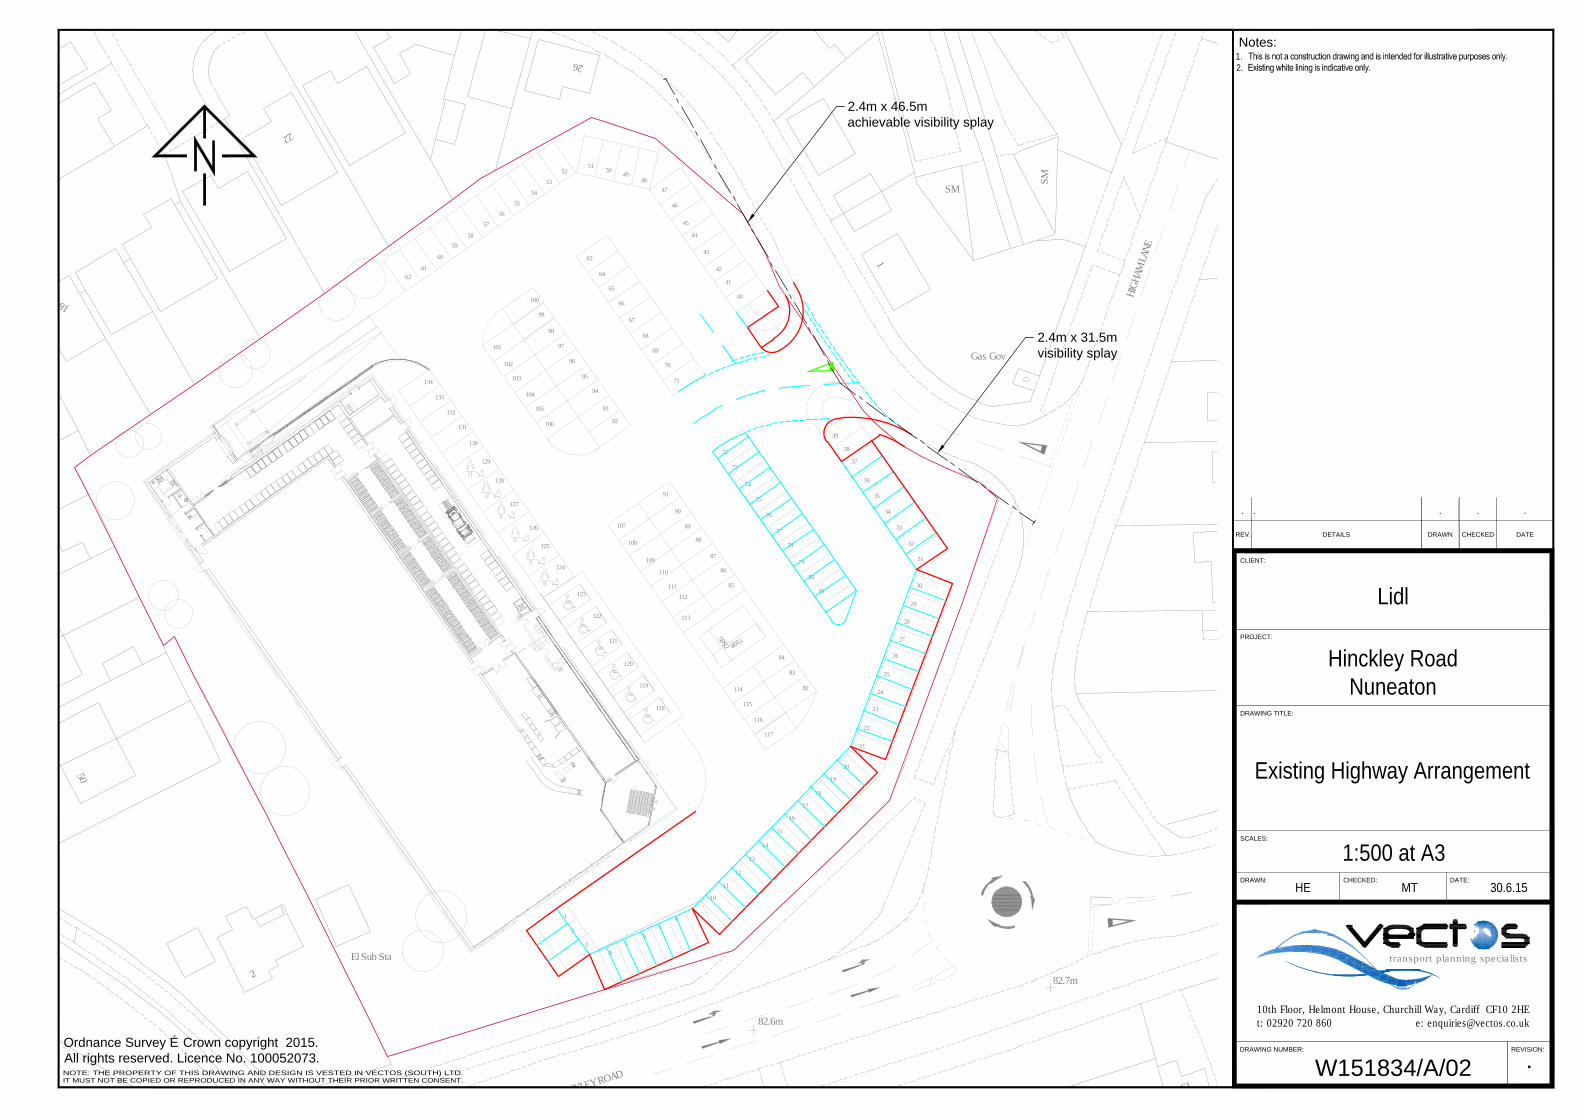
3.6 The proposed access arrangements are shown in Figure 3.2 and a scale drawing is contained
at Appendix C. The junction has been widened to cater for the swept path of delivery
vehicles which in turn has improved upon the existing visibility from the site.
Figure 3.2 – Proposed Site Access

Lidl Nuneaton, Transport Statement 18
H:\Projects\W150000\W151834 - Lidl - Nuneaton - Hinckley Road\Word\R01-CR-151834-15_08_07 - Transport
Statement.docx
August 2015
Parking
3.7 The parking provision on the site will be in accordance with Nuneaton and Bedworth’s
Supplementary Planning Guidance, Car Parking Standards (March 2008). The parking
standards are summarised in Table 3.1.
Table 3.1 – Nuneaton and Bedworth Maximum Car Parking Standards
Use Car parking standard
A1 Shops
Shop under 1000sqm 1 space per 40 sqm
Non food shop over 1000sqm 1 space per 25 sqm
Food shop over 1000sqm 1 space per 15 sqm
3.8 Based on the maximum parking standards as set out in Table 3.1, a total of 160 car parking
spaces would be permitted at the site.

Lidl Nuneaton, Transport Statement 19
H:\Projects\W150000\W151834 - Lidl - Nuneaton - Hinckley Road\Word\R01-CR-151834-15_08_07 - Transport
Statement.docx
August 2015
3.9 As part of the development proposals, a total of 134 car parking spaces are proposed. These
include 6 disabled car parking spaces and 6 parent and child parking spaces. In line with the
sustainable nature of the site, with regard to proximity to residential properties and bus
stops, the proposed level of paring on the site is considered sufficient to meet the demands
3.10 Cycle parking will also be provided at the site for employees and customers.
Internal Highway Layout
3.11 The proposed internal site layout is shown in Figure 3.1 and has been designed to make the
most efficient use of the space whilst having regard to the safe access, circulation and
parking within the site.
Servicing
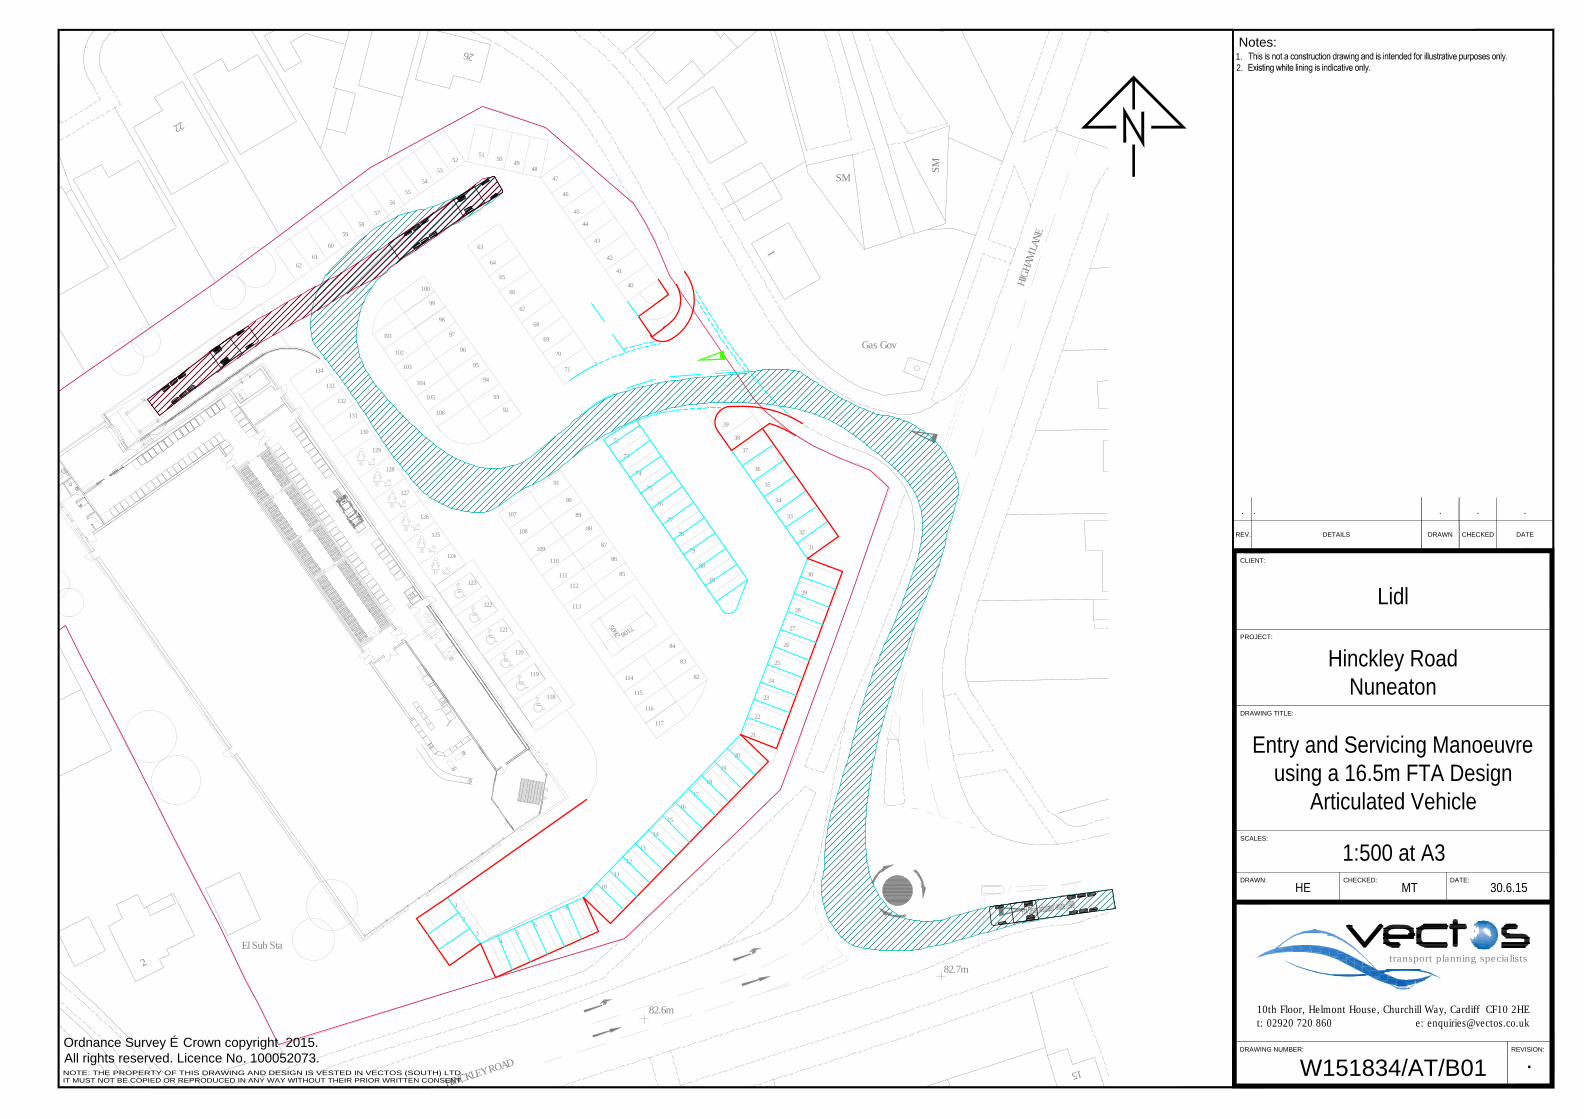
3.12 Servicing of the site will take place in the north western corner of the site. Servicing vehicles
will enter the site via the site access from Hydes Pastures, manoeuvre through the car park
and reverse into the service bay. On exit, the servicing vehicle will drive in forward gear from
the service bay, through the car park and out of the site via the site access onto Hydes
Pastures.
3.13 Appendix D includes the swept path analysis for the site and shows how the largest 16.5m
Articulated Vehicle anticipated for this type of development can be accommodated by the
proposed servicing arrangements.
3.14 With regard to servicing of the Lidl food store, Lidl as a multi-national operator, have full
control over their supply chain and have the infrastructure, expertise and logistics network in
place to allow efficient multi-platform operations and cross docking of goods at nationwide
centralised depots. For this reason deliveries can be confined to a minimal number and
undertaken in an adept manner, so that all servicing is both efficient and effective and can
fully control all servicing requirements. Lidl food stores of this size receive 1 delivery per day
or infrequently where peak periods in demand dictate otherwise e.g. Christmas period, a

Lidl Nuneaton, Transport Statement 20
H:\Projects\W150000\W151834 - Lidl - Nuneaton - Hinckley Road\Word\R01-CR-151834-15_08_07 - Transport
Statement.docx
August 2015
maximum of 2 deliveries per day, which are scheduled to arrive at different times during the
day i.e. 1 delivery in the morning and 1 delivery in the afternoon.
3.15 For these reasons the provision of one service bay is considered more than sufficient to meet
the requirements of the forecast servicing arrangements of the site and is in line with other
existing Lidl stores in the UK.
3.16 In the majority of instances, deliveries to the store will be undertaken at off-peak highway
hours when traffic levels are relatively light. In other words, it is unlikely that deliveries will
be undertaken in the weekday AM or PM peak hour.
3.17 Instead of the main depot delivery returning empty, on their return journey, Lidl vehicles
remove food waste and recyclable materials, thereby reducing the number of servicing trips.
This also reduces fuel usage, vehicle mileage and overall lowers servicing trips.

Lidl Nuneaton, Transport Statement 21
H:\Projects\W150000\W151834 - Lidl - Nuneaton - Hinckley Road\Word\R01-CR-151834-15_08_07 - Transport
Statement.docx
August 2015
4 TRAFFIC ANALYSIS
4.1 This section examines the forecast effect of the proposed development traffic on the local
highway network. The scope of the operational assessment has been agreed with
Warwickshire County Council, and accordingly the potential effects of the development
traffic has been assessed at the following junctions:
Proposed Site Access / Hydes Pastures;
Hydes Pastures / Higham Lane; and
Hinckley Road / Higham Lane.
Background Traffic Growth
4.2 National Traffic Model (NTM) background traffic growth factors have been applied to the
observed 2015 traffic data for the Weekday AM and PM peak periods to reflect the potential
traffic flows on this part of the highway network in the opening year (2016) and design year
(2021). The full NTM summary is provided in Appendix E.
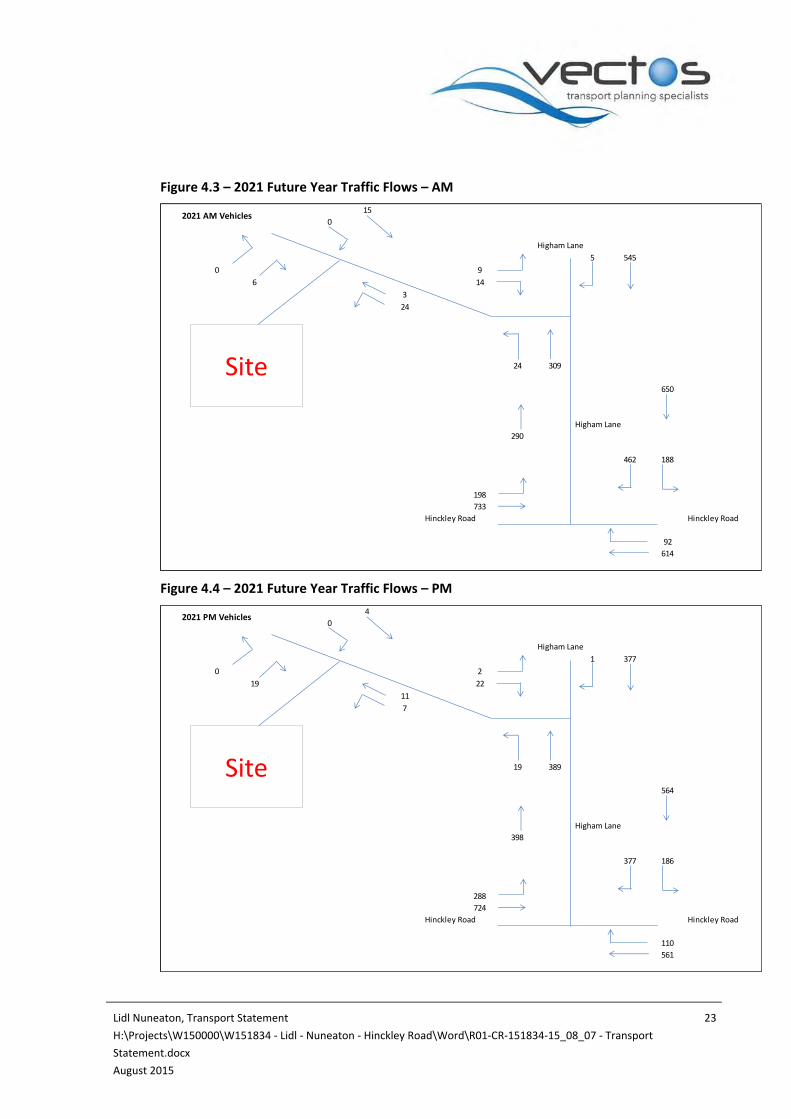
4.3 The background opening year (2016) and design year (2021) traffic flows for the weekday
AM and PM peak periods are shown in Figures 4.1 – 4.2 and 4.3 – 4.4.

Lidl Nuneaton, Transport Statement 22
H:\Projects\W150000\W151834 - Lidl - Nuneaton - Hinckley Road\Word\R01-CR-151834-15_08_07 - Transport
Statement.docx
August 2015
Figure 4.1 – 2016 Opening Year Traffic Flows – AM
Figure 4.2 – 2016 Opening Year Traffic Flows – PM
14
0
Higham Lane
5 516
0 8
6 13
3
22
22 293
615
Higham Lane
274
437 178
187
694
Hinckley Road Hinckley Road
87
582
2016 AM Vehicles
Site
4
0
Higham Lane
1 357
0 2
18 21
10
7
18 369
534
Higham Lane
377
357 176
272
686
Hinckley Road Hinckley Road
104
532
2016 PM Vehicles
Site
Lidl Nuneaton, Transport Statement 23
H:\Projects\W150000\W151834 - Lidl - Nuneaton - Hinckley Road\Word\R01-CR-151834-15_08_07 - Transport
Statement.docx
August 2015
Figure 4.3 – 2021 Future Year Traffic Flows – AM
Figure 4.4 – 2021 Future Year Traffic Flows – PM
15
0
Higham Lane
5 545
0 9
6 14
3
24
24 309
650
Higham Lane
290
462 188
198
733
Hinckley Road Hinckley Road
92
614
2021 AM Vehicles
Site
4
0
Higham Lane
1 377
0 2
19 22
11
7
19 389
564
Higham Lane
398
377 186
288
724
Hinckley Road Hinckley Road
110
561
2021 PM Vehicles
Site

Lidl Nuneaton, Transport Statement 24
H:\Projects\W150000\W151834 - Lidl - Nuneaton - Hinckley Road\Word\R01-CR-151834-15_08_07 - Transport
Statement.docx
August 2015
Committed Development
4.4 There are no committed development schemes included in the assessment.
Traffic Generation
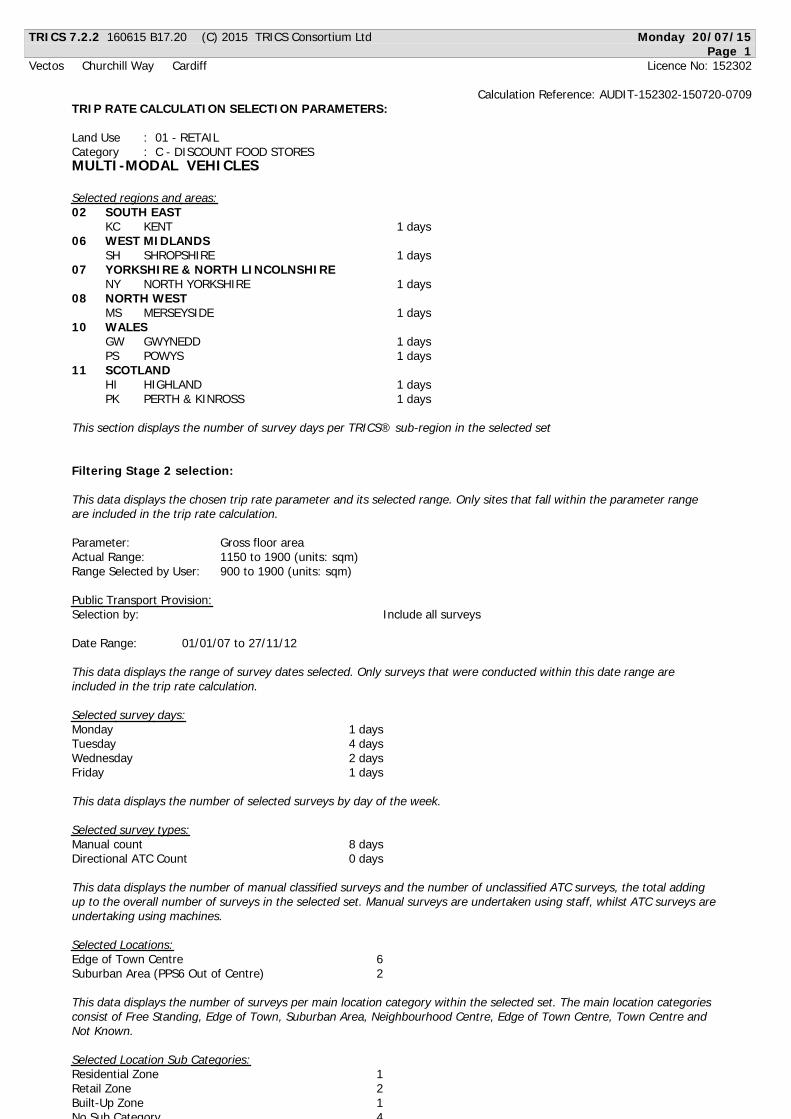
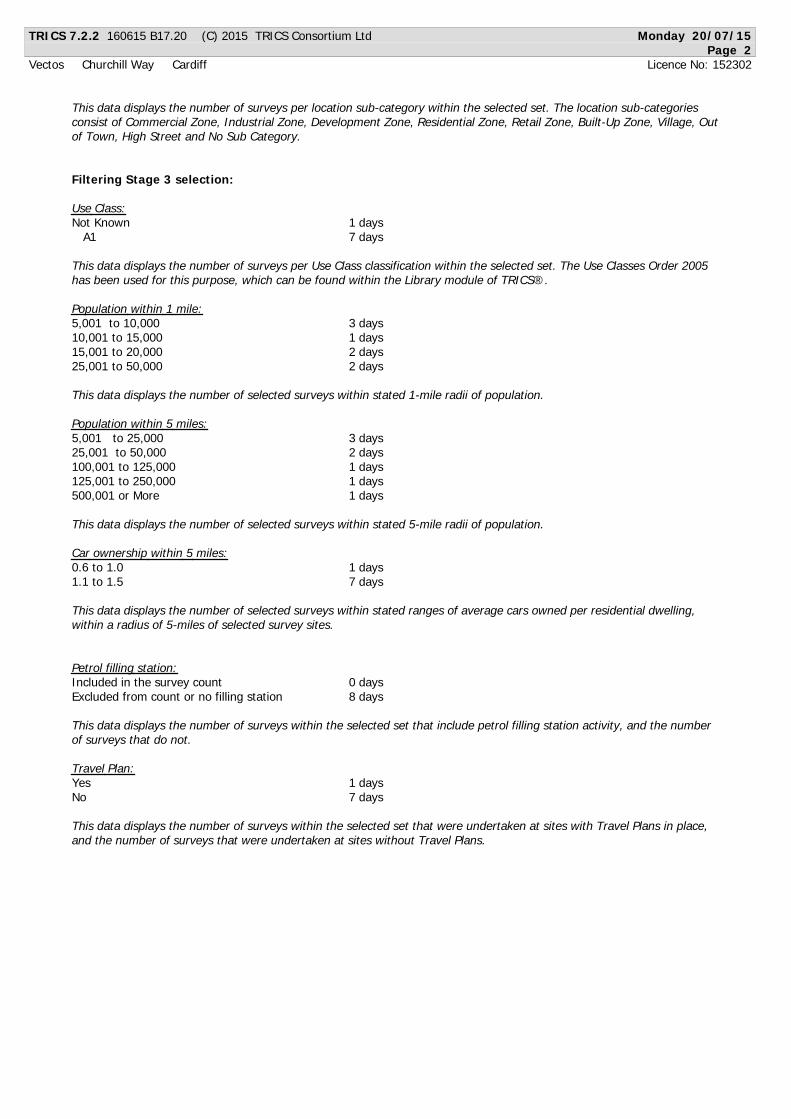
4.5 Vehicle trip rates for the proposed development have been based on trips derived from the
TRICS database for the corresponding land use. TRICS is a database of trip generation data
from a wide variety of land uses (retail, employment, leisure etc.) across the UK. Traffic
surveys are carried out to measure how many people travel to a site, by what mode, at what
time of day. The purpose of the database is to provide an estimate of likely trip generation
to/from a new development, by comparing it with trip generation from existing comparative
sites.
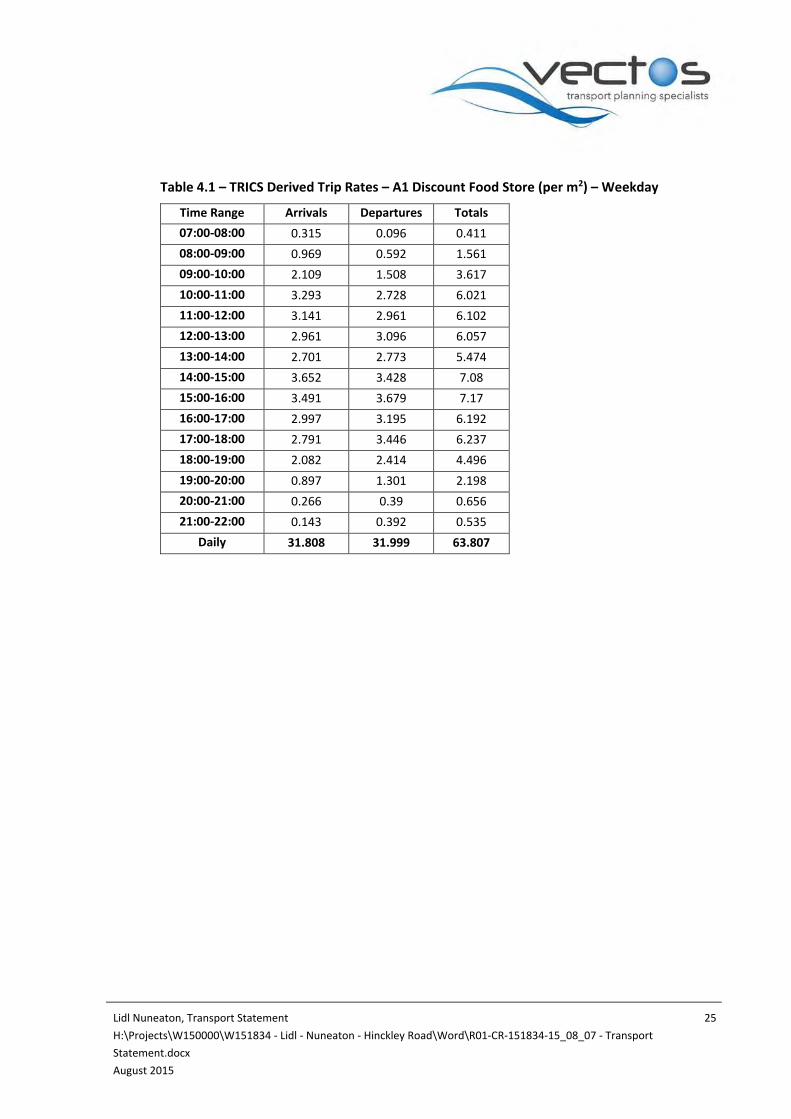
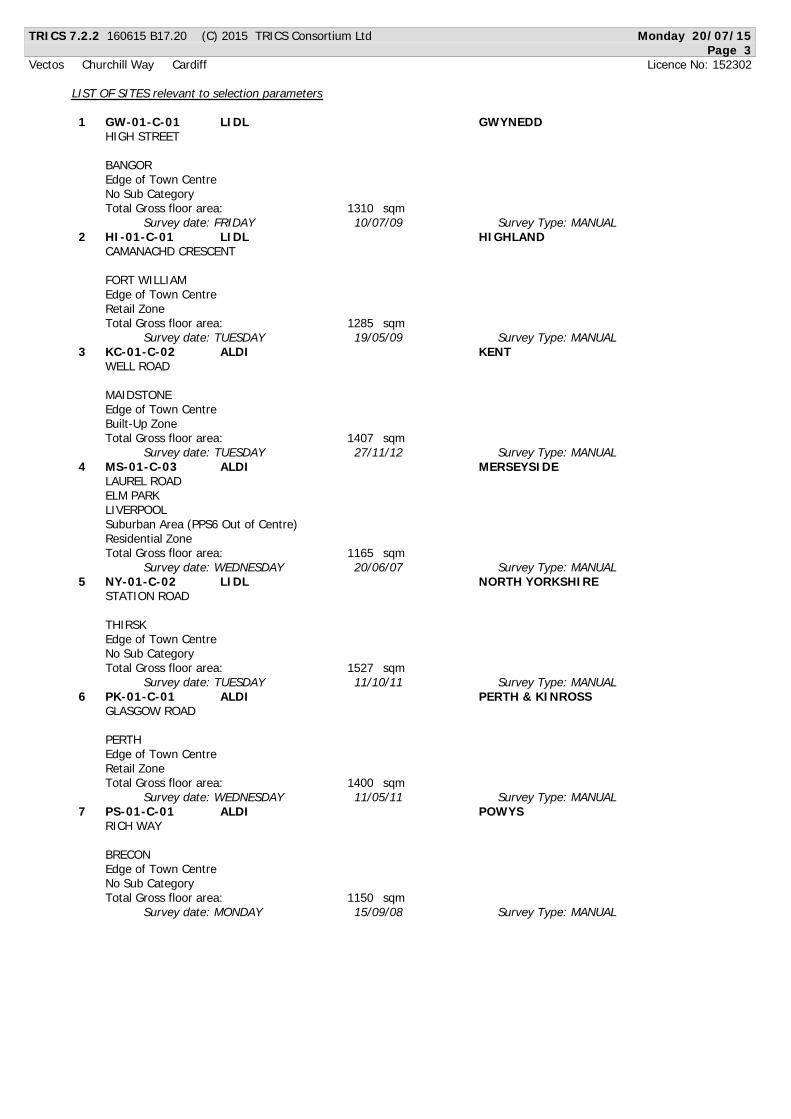
4.6 The TRICS derived trip rates for a typical Friday are shown in Table 4.1 and the detailed TRICS
data sets are shown in Appendix F.
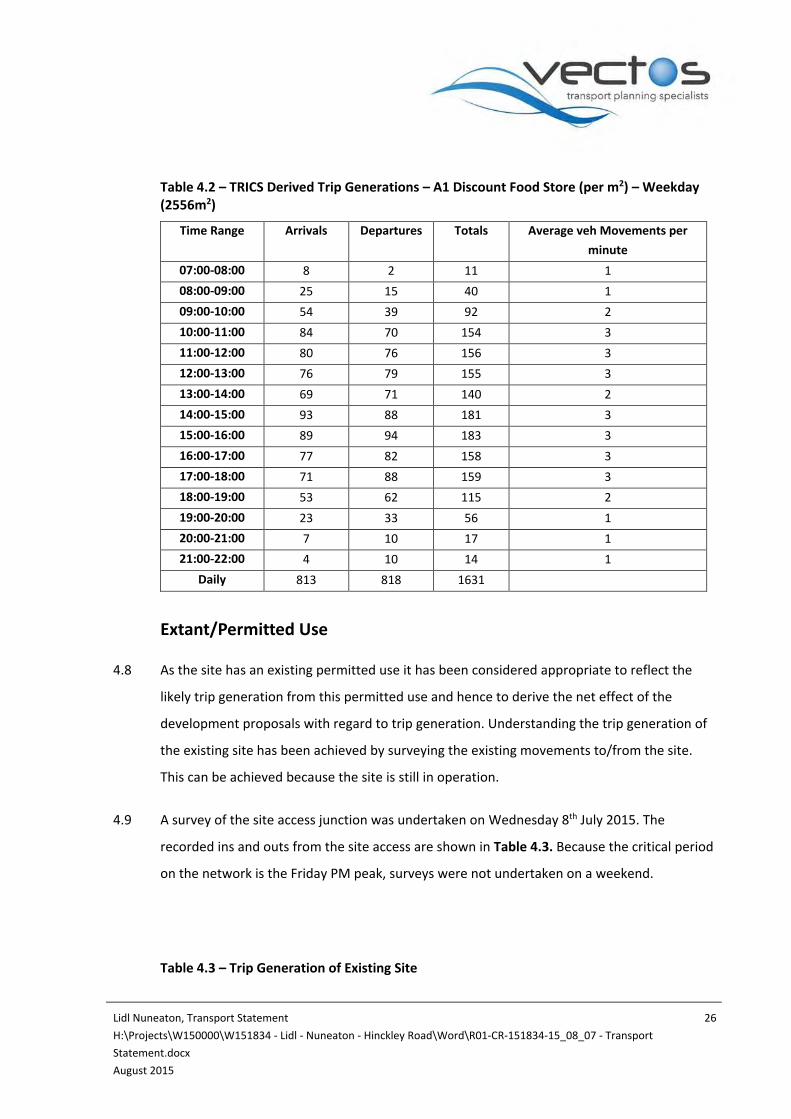
4.7 The corresponding TRICS derived trip generation for the proposed development is shown in
Table 4.2.
Lidl Nuneaton, Transport Statement 25
H:\Projects\W150000\W151834 - Lidl - Nuneaton - Hinckley Road\Word\R01-CR-151834-15_08_07 - Transport
Statement.docx
August 2015
Table 4.1 – TRICS Derived Trip Rates – A1 Discount Food Store (per m2) – Weekday
Time Range Arrivals Departures Totals
07:00-08:00 0.315 0.096 0.411
08:00-09:00 0.969 0.592 1.561
09:00-10:00 2.109 1.508 3.617
10:00-11:00 3.293 2.728 6.021
11:00-12:00 3.141 2.961 6.102
12:00-13:00 2.961 3.096 6.057
13:00-14:00 2.701 2.773 5.474
14:00-15:00 3.652 3.428 7.08
15:00-16:00 3.491 3.679 7.17
16:00-17:00 2.997 3.195 6.192
17:00-18:00 2.791 3.446 6.237
18:00-19:00 2.082 2.414 4.496
19:00-20:00 0.897 1.301 2.198
20:00-21:00 0.266 0.39 0.656
21:00-22:00 0.143 0.392 0.535
Daily 31.808 31.999 63.807
Lidl Nuneaton, Transport Statement 26
H:\Projects\W150000\W151834 - Lidl - Nuneaton - Hinckley Road\Word\R01-CR-151834-15_08_07 - Transport
Statement.docx
August 2015
Table 4.2 – TRICS Derived Trip Generations – A1 Discount Food Store (per m2) – Weekday (2556m2)
Time Range Arrivals Departures Totals Average veh Movements per
minute
07:00-08:00 8 2 11 1
08:00-09:00 25 15 40 1
09:00-10:00 54 39 92 2
10:00-11:00 84 70 154 3
11:00-12:00 80 76 156 3
12:00-13:00 76 79 155 3
13:00-14:00 69 71 140 2
14:00-15:00 93 88 181 3
15:00-16:00 89 94 183 3
16:00-17:00 77 82 158 3
17:00-18:00 71 88 159 3
18:00-19:00 53 62 115 2
19:00-20:00 23 33 56 1
20:00-21:00 7 10 17 1
21:00-22:00 4 10 14 1
Daily 813 818 1631
Extant/Permitted Use
4.8 As the site has an existing permitted use it has been considered appropriate to reflect the
likely trip generation from this permitted use and hence to derive the net effect of the
development proposals with regard to trip generation. Understanding the trip generation of
the existing site has been achieved by surveying the existing movements to/from the site.
This can be achieved because the site is still in operation.
4.9 A survey of the site access junction was undertaken on Wednesday 8th July 2015. The
recorded ins and outs from the site access are shown in Table 4.3. Because the critical period
on the network is the Friday PM peak, surveys were not undertaken on a weekend.
Table 4.3 – Trip Generation of Existing Site
Lidl Nuneaton, Transport Statement 27
H:\Projects\W150000\W151834 - Lidl - Nuneaton - Hinckley Road\Word\R01-CR-151834-15_08_07 - Transport
Statement.docx
August 2015
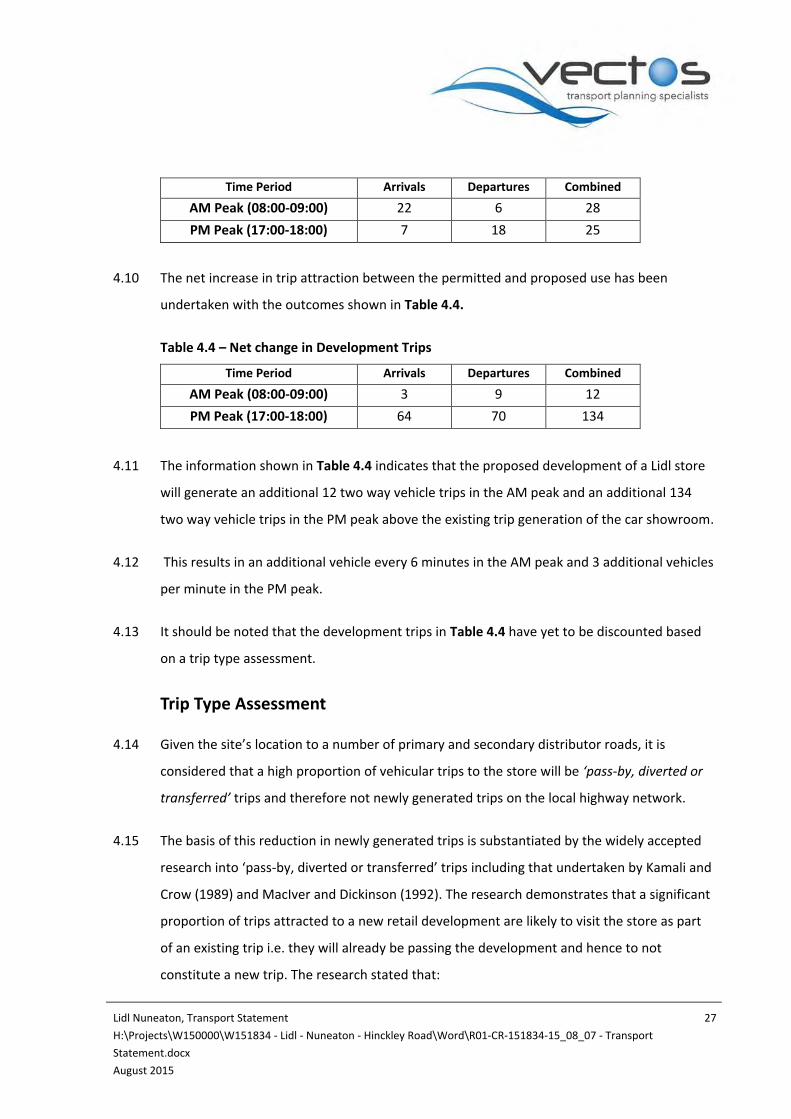
Time Period Arrivals Departures Combined
AM Peak (08:00-09:00) 22 6 28
PM Peak (17:00-18:00) 7 18 25
4.10 The net increase in trip attraction between the permitted and proposed use has been
undertaken with the outcomes shown in Table 4.4.
Table 4.4 – Net change in Development Trips
Time Period Arrivals Departures Combined
AM Peak (08:00-09:00) 3 9 12
PM Peak (17:00-18:00) 64 70 134
4.11 The information shown in Table 4.4 indicates that the proposed development of a Lidl store
will generate an additional 12 two way vehicle trips in the AM peak and an additional 134
two way vehicle trips in the PM peak above the existing trip generation of the car showroom.
4.12 This results in an additional vehicle every 6 minutes in the AM peak and 3 additional vehicles
per minute in the PM peak.
4.13 It should be noted that the development trips in Table 4.4 have yet to be discounted based
on a trip type assessment.
Trip Type Assessment
4.14 Given the site’s location to a number of primary and secondary distributor roads, it is
considered that a high proportion of vehicular trips to the store will be ‘pass-by, diverted or
transferred’ trips and therefore not newly generated trips on the local highway network.
4.15 The basis of this reduction in newly generated trips is substantiated by the widely accepted
research into ‘pass-by, diverted or transferred’ trips including that undertaken by Kamali and
Crow (1989) and MacIver and Dickinson (1992). The research demonstrates that a significant
proportion of trips attracted to a new retail development are likely to visit the store as part
of an existing trip i.e. they will already be passing the development and hence to not
constitute a new trip. The research stated that:
Lidl Nuneaton, Transport Statement 28
H:\Projects\W150000\W151834 - Lidl - Nuneaton - Hinckley Road\Word\R01-CR-151834-15_08_07 - Transport
Statement.docx
August 2015
‘if a development is located near to a strategic commuting route (which the proposed Lidl
Store is) the major roads may be largely unaffected by the introduction of a store’.
4.16 It further went on to conclude that:
‘in most circumstances 10% or less of the total trips are completely new and in practice the
value is so small it can be discounted.’
4.17 A proportion of trips to a new food store will also comprise ‘transferred trips’, which can be
classified as trips made to another food store (e.g. ASDA in the town centre) that have been
transferred to the new development.
4.18 On this basis, we consider that during the peak periods, it would be realistic to assume that a
large proportion of trips associated with the development of a food store in this location
would already be on the highway network in the vicinity of the site.
4.19 Based on the widely accepted principles detailed above, regarding trip type proportions to
new food stores, it is considered that new trips to the food store would account for 10% of
total trips to the site on a weekday.
4.20 A judgement has therefore been made that only a small proportion of trips to the site should
be classified as ‘new’ trips. On this basis, the foregoing assessment has been based on the
trip type proportions shown in Table 4.5.
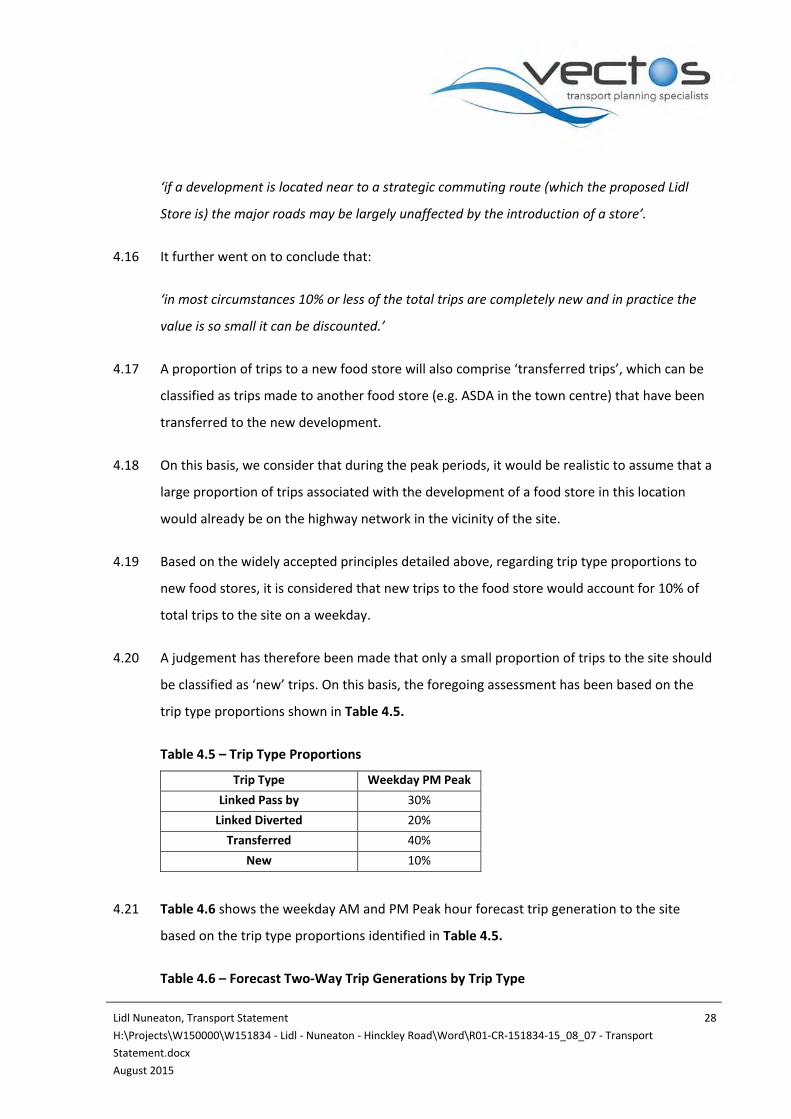
Table 4.5 – Trip Type Proportions
Trip Type Weekday PM Peak
Linked Pass by 30%
Linked Diverted 20%
Transferred 40%
New 10%
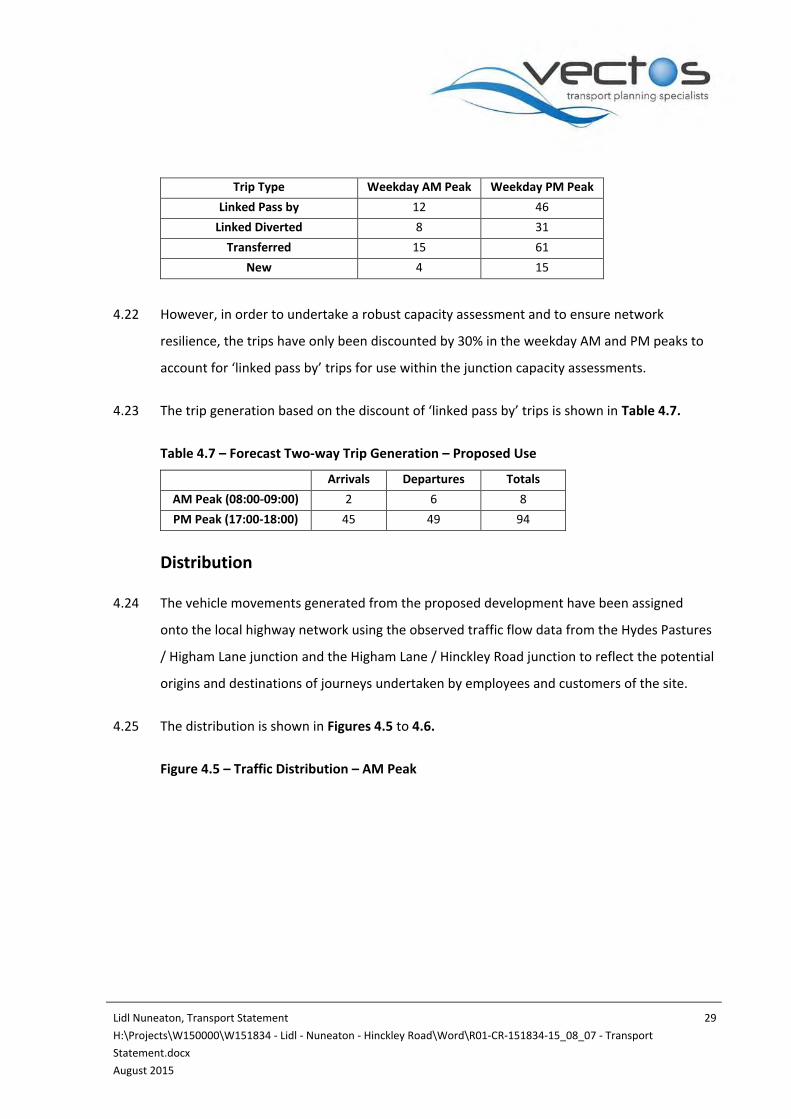
4.21 Table 4.6 shows the weekday AM and PM Peak hour forecast trip generation to the site
based on the trip type proportions identified in Table 4.5.
Table 4.6 – Forecast Two-Way Trip Generations by Trip Type
Lidl Nuneaton, Transport Statement 29
H:\Projects\W150000\W151834 - Lidl - Nuneaton - Hinckley Road\Word\R01-CR-151834-15_08_07 - Transport
Statement.docx
August 2015
Trip Type Weekday AM Peak Weekday PM Peak
Linked Pass by 12 46
Linked Diverted 8 31
Transferred 15 61
New 4 15
4.22 However, in order to undertake a robust capacity assessment and to ensure network
resilience, the trips have only been discounted by 30% in the weekday AM and PM peaks to
account for ‘linked pass by’ trips for use within the junction capacity assessments.
4.23 The trip generation based on the discount of ‘linked pass by’ trips is shown in Table 4.7.
Table 4.7 – Forecast Two-way Trip Generation – Proposed Use
Arrivals Departures Totals
AM Peak (08:00-09:00) 2 6 8
PM Peak (17:00-18:00) 45 49 94
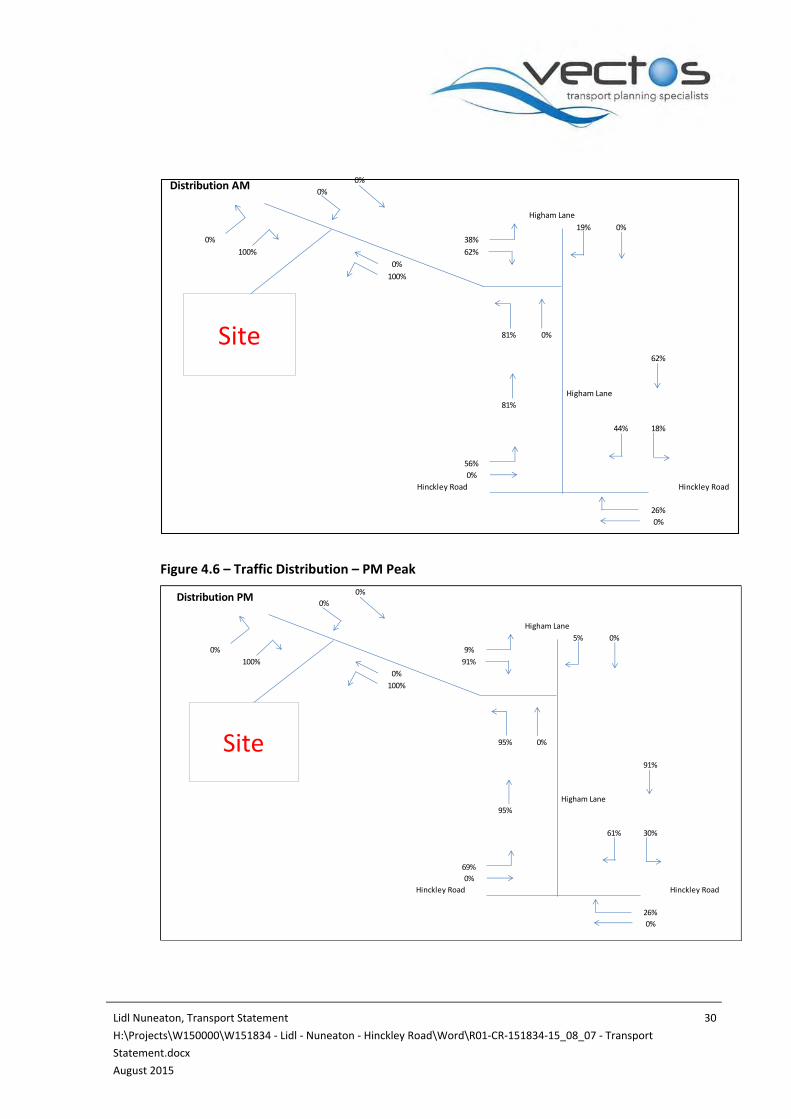
Distribution
4.24 The vehicle movements generated from the proposed development have been assigned
onto the local highway network using the observed traffic flow data from the Hydes Pastures
/ Higham Lane junction and the Higham Lane / Hinckley Road junction to reflect the potential
origins and destinations of journeys undertaken by employees and customers of the site.
4.25 The distribution is shown in Figures 4.5 to 4.6.
Figure 4.5 – Traffic Distribution – AM Peak
Lidl Nuneaton, Transport Statement 30
H:\Projects\W150000\W151834 - Lidl - Nuneaton - Hinckley Road\Word\R01-CR-151834-15_08_07 - Transport
Statement.docx
August 2015
Figure 4.6 – Traffic Distribution – PM Peak
0%
0%
Higham Lane
19% 0%
0% 38%
100% 62%
0%
100%
81% 0%
62%
Higham Lane
81%
44% 18%
56%
0%
Hinckley Road Hinckley Road
26%
0%
Distribution AM
Site
0%
0%
Higham Lane
5% 0%
0% 9%
100% 91%
0%
100%
95% 0%
91%
Higham Lane
95%
61% 30%
69%
0%
Hinckley Road Hinckley Road
26%
0%
Distribution PM
Site
Lidl Nuneaton, Transport Statement 31
H:\Projects\W150000\W151834 - Lidl - Nuneaton - Hinckley Road\Word\R01-CR-151834-15_08_07 - Transport
Statement.docx
August 2015
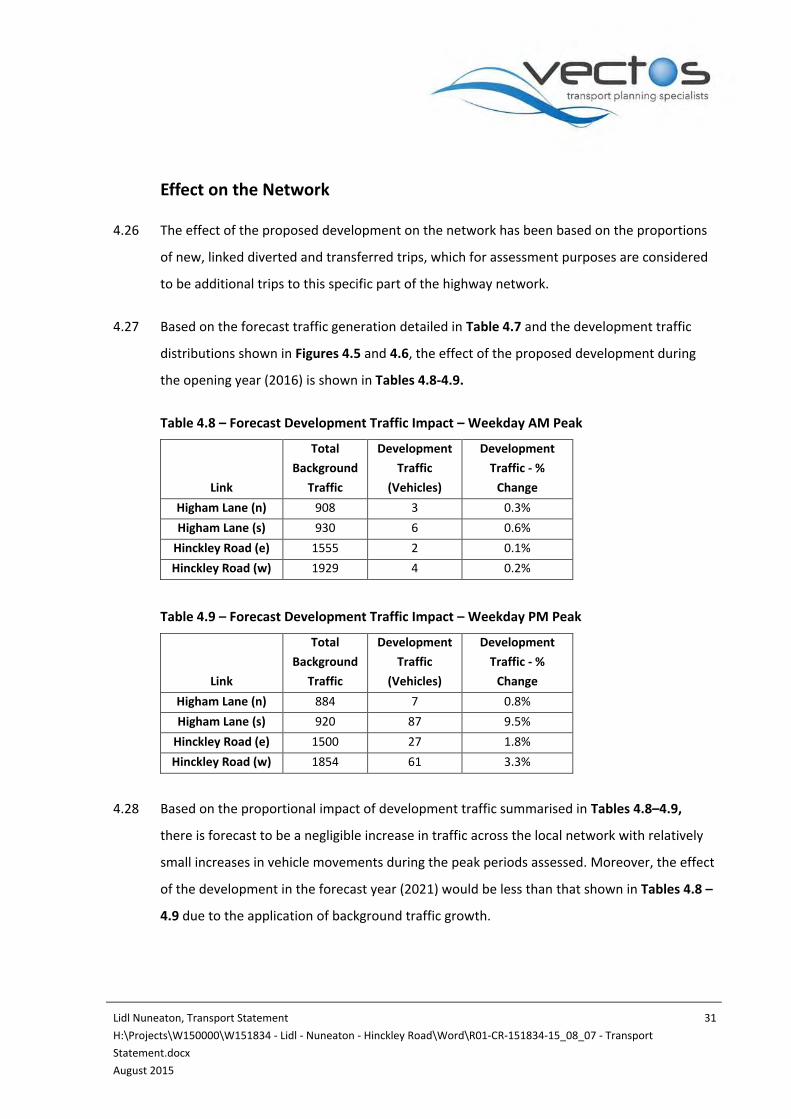
Effect on the Network
4.26 The effect of the proposed development on the network has been based on the proportions
of new, linked diverted and transferred trips, which for assessment purposes are considered
to be additional trips to this specific part of the highway network.
4.27 Based on the forecast traffic generation detailed in Table 4.7 and the development traffic
distributions shown in Figures 4.5 and 4.6, the effect of the proposed development during
the opening year (2016) is shown in Tables 4.8-4.9.
Table 4.8 – Forecast Development Traffic Impact – Weekday AM Peak
Link
Total
Background
Traffic
Development
Traffic
(Vehicles)
Development
Traffic - %
Change
Higham Lane (n) 908 3 0.3%
Higham Lane (s) 930 6 0.6%
Hinckley Road (e) 1555 2 0.1%
Hinckley Road (w) 1929 4 0.2%
Table 4.9 – Forecast Development Traffic Impact – Weekday PM Peak
Link
Total
Background
Traffic
Development
Traffic
(Vehicles)
Development
Traffic - %
Change
Higham Lane (n) 884 7 0.8%
Higham Lane (s) 920 87 9.5%
Hinckley Road (e) 1500 27 1.8%
Hinckley Road (w) 1854 61 3.3%
4.28 Based on the proportional impact of development traffic summarised in Tables 4.8–4.9,
there is forecast to be a negligible increase in traffic across the local network with relatively
small increases in vehicle movements during the peak periods assessed. Moreover, the effect
of the development in the forecast year (2021) would be less than that shown in Tables 4.8 –
4.9 due to the application of background traffic growth.
Lidl Nuneaton, Transport Statement 32
H:\Projects\W150000\W151834 - Lidl - Nuneaton - Hinckley Road\Word\R01-CR-151834-15_08_07 - Transport
Statement.docx
August 2015
Junction Capacity Analysis
4.29 Operational capacity assessments have been undertaken at the Hydes Pastures / Higham
Lane junction, and the Hinckley Road/ Higham Lane mini-roundabout for the forecast design
year, 5 years after opening i.e. 2021.
4.30 Due to the low traffic generations associated with the proposed site and the fact that it is an
existing access to a car showroom/garage, it has not been considered necessary to assess the
capacity of the Site Access / Hydes Pastures junction.
4.31 The operational analyses have been undertaken during the weekday AM and PM peak
periods whereby the background traffic flows passing the site are at their highest for the
Design Year (2021) with the addition of the development traffic on the highway network as
shown in Figures 4.3-4.4.
4.32 It should be noted that an assessment has not been undertaken during the likely opening
year (2016) with the addition of development traffic as if the junction operates within
capacity in the design year, then it will inevitably operate within capacity during the opening
year as there will be fewer traffic movements at the junction.
4.33 PICADY and ARCADY have been used to model traffic conditions on the proposed site access
and existing mini-roundabout. PICADY and ARCADY are computer programmes that forecast
capacities, queues and delays at priority junctions and roundabouts respectively.
4.34 The results from the analysis of the site access junction based on the forecast effect of
proposed development on the local highway network and inclusion of background traffic
growth is summarised in Table 4.10 in terms of Ratio of Flow Capacity (RFC) and maximum
vehicle queue lengths. The PICADY outputs are provided in Appendix G.
Table 4.10 - Hydes Pastures / Higham Lane - PICADY Outputs (Design Year 2021 with Development)
Link
Reference
AM 2021 PM 2021
Max RFC
Queue Length
(veh) Max RFC
Queue Length
(veh)
Lidl Nuneaton, Transport Statement 33
H:\Projects\W150000\W151834 - Lidl - Nuneaton - Hinckley Road\Word\R01-CR-151834-15_08_07 - Transport
Statement.docx
August 2015
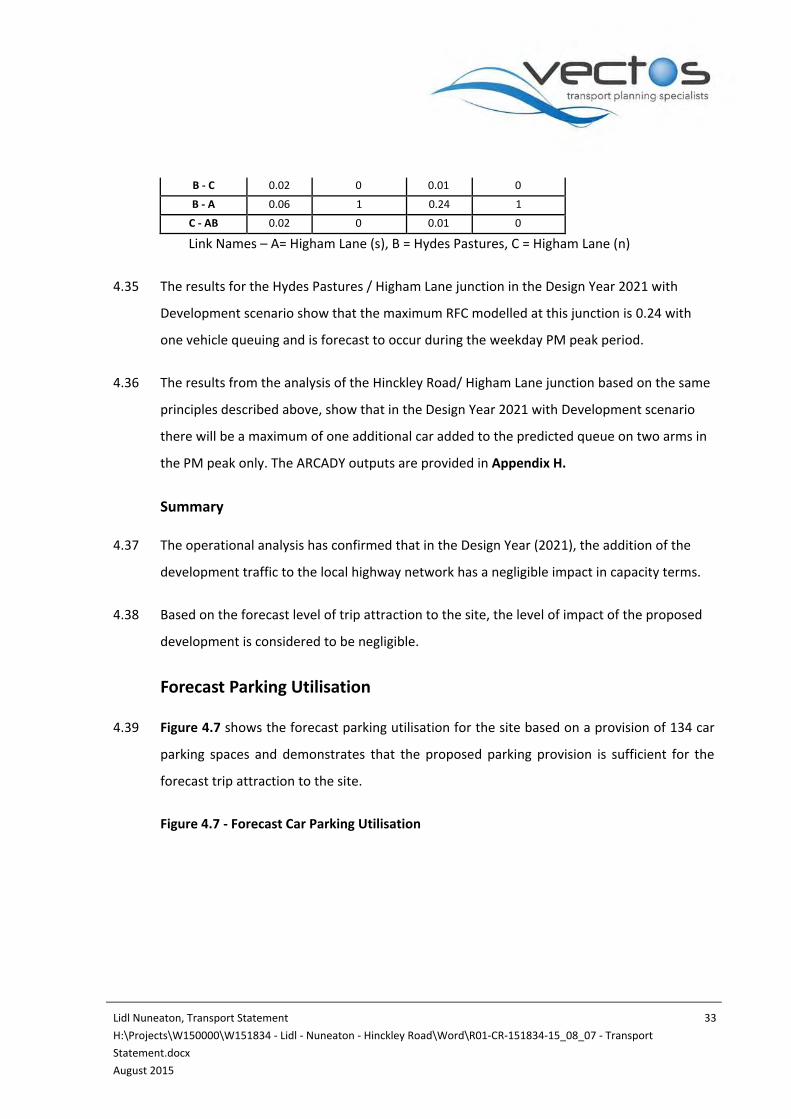
B - C 0.02 0 0.01 0
B - A 0.06 1 0.24 1
C - AB 0.02 0 0.01 0
Link Names – A= Higham Lane (s), B = Hydes Pastures, C = Higham Lane (n)
4.35 The results for the Hydes Pastures / Higham Lane junction in the Design Year 2021 with
Development scenario show that the maximum RFC modelled at this junction is 0.24 with
one vehicle queuing and is forecast to occur during the weekday PM peak period.
4.36 The results from the analysis of the Hinckley Road/ Higham Lane junction based on the same
principles described above, show that in the Design Year 2021 with Development scenario
there will be a maximum of one additional car added to the predicted queue on two arms in
the PM peak only. The ARCADY outputs are provided in Appendix H.
Summary
4.37 The operational analysis has confirmed that in the Design Year (2021), the addition of the
development traffic to the local highway network has a negligible impact in capacity terms.
4.38 Based on the forecast level of trip attraction to the site, the level of impact of the proposed
development is considered to be negligible.
Forecast Parking Utilisation
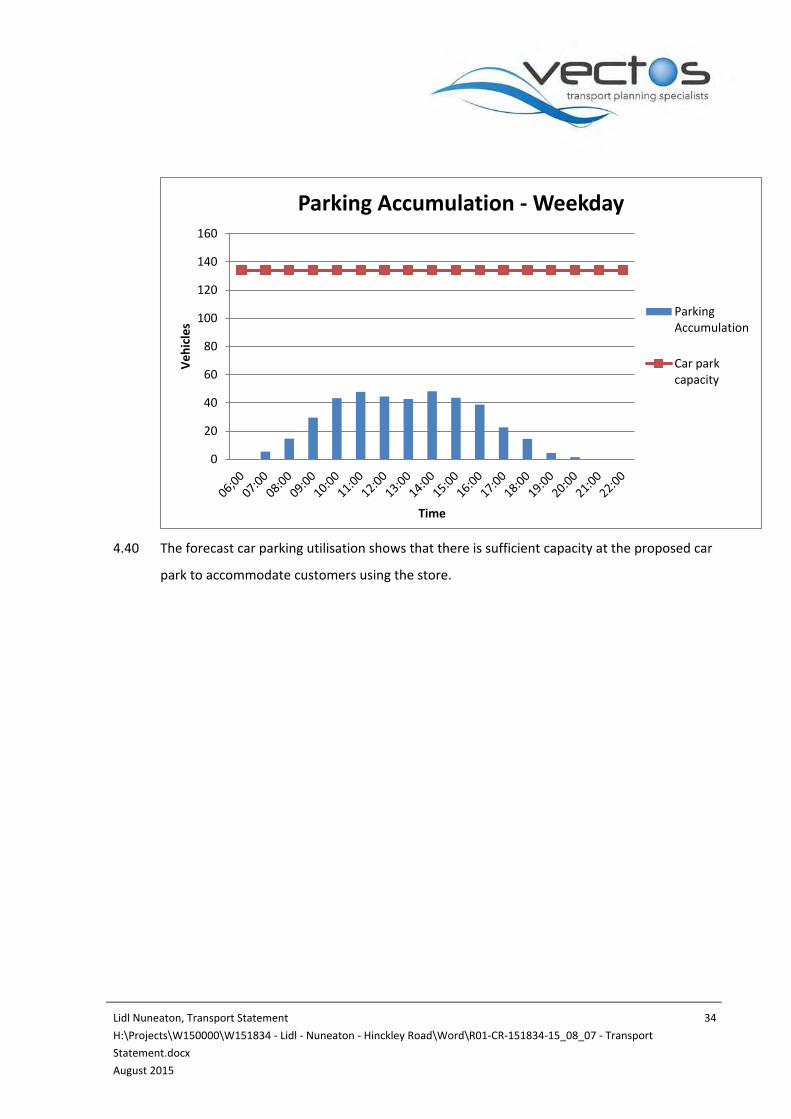
4.39 Figure 4.7 shows the forecast parking utilisation for the site based on a provision of 134 car
parking spaces and demonstrates that the proposed parking provision is sufficient for the
forecast trip attraction to the site.
Figure 4.7 - Forecast Car Parking Utilisation
Lidl Nuneaton, Transport Statement 34
H:\Projects\W150000\W151834 - Lidl - Nuneaton - Hinckley Road\Word\R01-CR-151834-15_08_07 - Transport
Statement.docx
August 2015
4.40 The forecast car parking utilisation shows that there is sufficient capacity at the proposed car
park to accommodate customers using the store.
0
20
40
60
80
100
120
140
160
Ve
hic
les
Time
Parking Accumulation - Weekday
ParkingAccumulation
Car parkcapacity

Lidl Nuneaton, Transport Statement 35
H:\Projects\W150000\W151834 - Lidl - Nuneaton - Hinckley Road\Word\R01-CR-151834-15_08_07 - Transport
Statement.docx
August 2015
5 SUMMARY AND CONCLUSIONS
Summary
5.1 This Transport Statement has assessed the effect in traffic demand and parking utilisation for
the proposed redevelopment from Car Show Room / Garage to A1 Food Retail.
5.2 The development of the site accords with national Planning Policy in regard to access by
sustainable transport modes.
5.3 There are a number of benefits to the proposed development from a transportation
perspective including:
The retail offering and location of the site to a number of primary and secondary
distributor roads, will result in a significant proportion of vehicular trips to the store
being either ‘pass-by’, ‘linked’ and ‘diverted’ trips and therefore not newly generated
trips on the highway network;
The highly sustainable location of the site within an existing residential community
makes it an attractive option for the resident population to walk/cycle to the site;
Cycle parking will be provided within the site in safe, secure and convenient locations
encouraging both employees and customers to cycle to the site; and
The site is located within 100m of a number of bus stops and pedestrian footways
providing an ideal location, for customers and employees to travel to the site by these
sustainable modes.
5.4 The proposed car parking provision has been shown to be suitable for the requirements of
the site, and is within WCC’s maximum parking standards for food retail developments.
5.5 The operational analysis of Hydes Pastures / Higham Lane and Hinckley Road/ Higham Lane
junctions shows that the forecast traffic generation as a result of the proposals will be able
to be suitable accommodated by the local highway network without any adverse effects i.e.
additional traffic congestion and resultant queuing.
Lidl Nuneaton, Transport Statement 36
H:\Projects\W150000\W151834 - Lidl - Nuneaton - Hinckley Road\Word\R01-CR-151834-15_08_07 - Transport
Statement.docx
August 2015
Conclusion
5.6 In conclusion, based on the information provided in the foregoing, there should be no reason
from a transportation viewpoint why planning consent relating to the proposed
redevelopment should not be granted.

APPENDIX A
Traffic Surveys

signal surveys
SURVEY CONTROL
Client: Vectos
Client Contact: Matt Thomas
Survey Location: Nuneaton
Date(s) of Survey: Wednesday 8 July 2015
Notes:
On Site Supervisor: David Cheng
Data Checking: Richard Adams
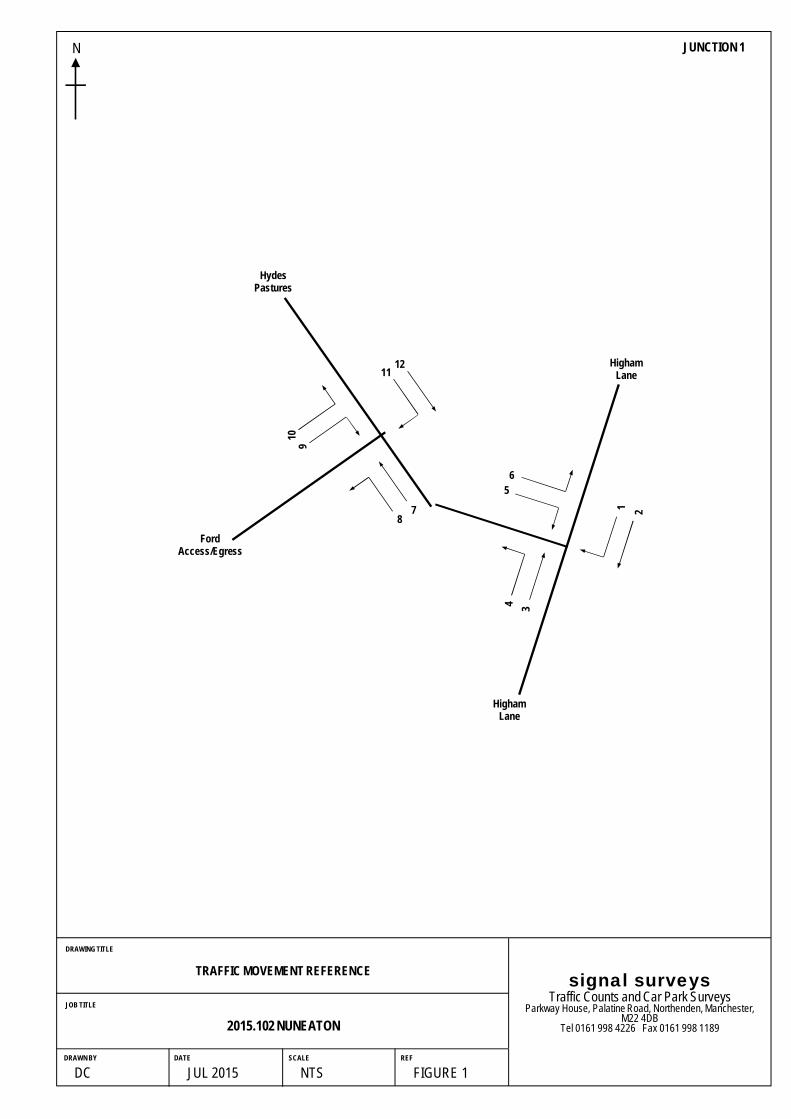
Survey Reference: 2015.102 Nuneaton
Status: Final
Date of Issue: 14 July 2015
DRAWING TITLE
DRAWN BY DATE REF
TRAFFIC MOVEMENT REFERENCE
DC FIGURE 1JUL 2015SCALE
NTS
N
JOB TITLE
2015.102 NUNEATON
signal surveysTraffic Counts and Car Park Surveys
Parkway House, Palatine Road, Northenden, Manchester, M22 4DB
Tel 0161 998 4226 Fax 0161 998 1189
JUNCTION 1
HydesPastures
4 3
1 2
56
7
10
8
1211
9
HighamLane
FordAccess/Egress
HighamLane
signal surveys
LV HV LV HV LV HV LV HV LV HV LV HV LV HV LV HV LV HV LV HV LV HV LV HV LV HV LV HV
0700 0 0 52 4 13 0 1 0 0 0 2 0 1 0 0 0 0 0 0 0 0 0 2 0 0 0 0 0
0715 2 0 73 1 29 3 1 0 1 0 0 0 0 0 3 0 0 0 0 0 0 0 1 0 3 0 0 0
0730 2 0 93 2 36 2 3 0 2 0 2 0 0 0 5 0 2 0 1 0 0 0 3 0 5 0 3 0
0745 2 0 118 1 35 4 4 1 3 0 3 1 0 1 6 0 1 0 0 0 0 0 4 1 6 0 1 0
0800 1 1 113 3 59 1 4 0 5 1 1 0 1 1 4 0 1 0 0 0 0 0 4 1 4 0 1 0
0815 1 0 130 1 66 4 7 0 2 0 2 0 1 0 6 0 2 0 0 0 0 0 2 0 6 0 2 0
0830 1 0 131 4 82 2 4 0 0 0 3 0 0 0 4 0 0 0 0 0 0 0 3 0 4 0 0 0
0845 1 0 125 3 71 4 7 0 5 0 2 0 0 0 8 0 3 0 0 0 0 0 4 0 8 0 3 0
0900 1 0 107 4 41 4 6 0 3 0 2 0 1 0 5 0 3 0 0 0 0 0 1 0 5 0 3 0
0915 1 0 69 1 33 1 3 1 3 0 1 0 0 0 4 1 0 0 0 0 0 0 3 0 4 1 0 0
0930 0 0 72 2 44 2 1 0 4 0 0 0 0 0 1 0 4 0 0 0 0 0 0 0 1 0 4 0
0945 0 0 56 4 31 5 2 0 0 1 0 0 1 0 1 0 0 1 0 0 0 0 0 0 1 0 0 1
1000 0 0 2 0 1 0 0 0 0 0 3 0 2 0 1 0
1015 1 0 1 0 3 0 0 0 0 0 0 0 1 0 3 0
1030 1 0 2 0 3 0 0 0 0 0 0 0 2 0 3 0
1045 0 0 1 1 2 0 0 0 0 0 1 0 1 1 2 0
1100 1 0 3 0 2 0 0 0 0 0 0 0 3 0 2 0
1115 0 0 0 0 2 0 0 0 0 0 1 0 0 0 2 0
1130 0 1 3 0 1 1 0 0 0 0 2 0 3 0 1 1
1145 0 0 1 0 3 0 0 0 0 0 0 0 1 0 3 0
1200 4 0 4 0 2 0 0 0 0 0 0 0 4 0 2 0
1215 2 0 2 0 4 0 0 0 0 0 2 0 2 0 4 0
1230 1 0 2 0 4 0 0 0 0 0 1 0 2 0 4 0
1245 0 0 3 0 3 0 0 0 0 0 1 0 3 0 3 0
1300 0 0 6 0 2 0 0 0 0 0 2 0 6 0 2 0
1315 2 0 2 0 5 0 0 0 0 0 1 0 2 0 5 0
1330 1 0 0 0 1 0 0 0 0 0 1 0 0 0 1 0
1345 0 0 5 0 4 0 0 0 0 0 0 0 5 0 4 0
1400 1 0 3 0 4 0 0 0 0 0 0 0 3 0 4 0
1415 3 0 3 0 3 0 0 0 0 0 0 0 3 0 3 0
1430 1 0 2 0 5 0 0 0 0 0 2 0 2 0 5 0
1445 0 0 5 0 3 0 0 0 0 0 1 0 5 0 3 0
1500 1 0 3 0 3 0 0 0 0 0 1 0 3 0 3 0
1515 2 0 3 0 3 0 0 0 0 0 0 0 3 0 3 0
1530 4 0 4 0 6 0 0 0 0 0 2 0 4 0 6 0
Time Beginning
Higham Lane/Hydes Pastures/Ford Access-Egress - Wednesday 8 July 2015
1 2 3 4 5 6 7 8 IN OUT9 10 11 12
signal surveys
1545 2 0 2 0 3 0 0 0 0 0 0 0 2 0 3 0
1600 3 0 84 0 74 1 2 0 3 0 3 0 1 0 4 0 4 0 0 0 0 0 1 0 4 0 4 0
1615 0 0 71 1 73 2 1 0 7 0 4 0 0 0 1 0 8 0 0 0 0 0 3 0 1 0 8 0
1630 2 0 89 2 88 2 8 0 4 0 4 0 3 0 8 0 6 0 0 0 0 0 2 0 8 0 6 0
1645 0 0 87 2 73 1 7 0 1 0 2 0 2 0 5 0 2 0 0 0 0 0 0 0 5 0 2 0
1700 0 0 97 2 91 3 3 0 6 0 0 0 1 0 1 0 5 0 0 0 0 0 0 0 1 0 5 0
1715 1 0 79 3 103 0 5 0 4 0 1 0 3 0 2 0 5 0 0 0 0 0 0 0 2 0 5 0
1730 0 0 80 0 81 2 4 0 6 0 1 0 2 0 2 0 3 0 0 0 0 0 4 0 2 0 3 0
1745 0 0 88 4 83 1 6 0 5 0 0 0 4 0 2 0 5 0 0 0 0 0 0 0 2 0 5 0
1800 2 0 66 0 75 1 0 0 3 0 1 0 1 0 1 0 3 0 0 0 0 0 0 0 1 0 3 0
1815 0 0 59 3 61 0 4 0 1 0 0 0 4 0 0 0 1 0 0 0 0 0 0 0 0 0 1 0
1830 0 0 60 0 62 1 1 0 2 0 0 0 1 0 0 0 1 0 0 0 0 0 1 0 0 0 1 0
1845 0 0 88 5 85 1 7 0 5 0 0 0 3 0 3 0 4 0 0 0 0 0 2 0 3 0 4 0
138 2 136 2
12 hour turning count
AM peak
PM peak

APPENDIX B
Proposed Site Plan
Hydes Pastures
Hig
ham
Lan
e
Hinckley Road
Lidl Foodstore
Sub sta.
Trolley and cycle store

APPENDIX C
Proposed Site Access Drawing
2
15
50
Gas Gov
82.7m
SM
HINCKLEY ROAD
El Sub Sta
18
1
HIGH
AM LA
NE
26
SM
22
82.6m
47
46
45
44
43
42
41
40
39
38
37
36
35
34
33
32
31
30
29
28
27
26
25
24
23
22
21
20
19
18
17
16
15
14
13
12
11
10
98
76
54
71085092
2
117
71
70
69
68
67
66
65
64
99
98
97
96
95
94
93
92106
105
104
103
129
128
127
116
115
114
84
83
85
88
89
90
91
107
108
109
110
111112
113
81
80
79
78
77
76
75
74
73
72
1
3
12587
86
118
119
120
121
122
123
82
48495051
63
100
101
102
130
131
132
133
134
124
126
5253
5455
5657
5859
60
6162
2.4m x 31.5m
visibility splay
2.4m x 46.5m
achievable visibility splay
HE
W151834/A/02
.
1:500 at A3
MT 30.6.15
. . . . .
Lidl
Hinckley Road
Nuneaton
Existing Highway Arrangement
1.
2.
This is not a construction drawing and is intended for illustrative purposes only.
Existing white lining is indicative only.
DRAWING NUMBER:
SCALES:
DRAWN: CHECKED:
REVISION:
DATE:
DRAWING TITLE:
PROJECT:
CLIENT:
REV. DETAILS DRAWN DATECHECKED
Notes:
NOTE: THE PROPERTY OF THIS DRAWING AND DESIGN IS VESTED IN VECTOS (SOUTH) LTD.
IT MUST NOT BE COPIED OR REPRODUCED IN ANY WAY WITHOUT THEIR PRIOR WRITTEN CONSENT.
10th Floor, Helmont House, Churchill Way, Cardiff CF10 2HE
t: 02920 720 860 e: [email protected]
transport planning specialists
Ordnance Survey © Crown copyright .
All rights reserved. Licence No. 100052073.
2015

APPENDIX D
Swept Path Analysis
2
15
Gas Gov
82.7m
SM
HINCKLEY ROAD
El Sub Sta
1
HIGH
AM LA
NE
26
SM
22
82.6m
47
46
45
44
43
42
41
40
39
38
37
36
35
34
33
32
31
30
29
28
27
26
25
24
23
22
21
20
19
18
17
16
15
14
13
12
11
10
98
76
54
71085092
2
117
71
70
69
68
67
66
65
64
99
98
97
96
95
94
93
92106
105
104
103
129
128
127
116
115
114
84
83
85
88
89
90
91
107
108
109
110
111112
113
81
80
79
78
77
76
75
74
73
72
1
3
12587
86
118
119
120
121
122
123
82
48495051
63
100
101
102
130
131
132
133
134
124
126
5253
5455
5657
5859
60
6162
FTA Design A
rticulate
d Vehicle (1
998)
HE
W151834/AT/B01
.
1:500 at A3
MT 30.6.15
. . . . .
Lidl
Hinckley Road
Nuneaton
Entry and Servicing Manoeuvre
using a 16.5m FTA Design
Articulated Vehicle
1.
2.
This is not a construction drawing and is intended for illustrative purposes only.
Existing white lining is indicative only.
DRAWING NUMBER:
SCALES:
DRAWN: CHECKED:
REVISION:
DATE:
DRAWING TITLE:
PROJECT:
CLIENT:
REV. DETAILS DRAWN DATECHECKED
Notes:
NOTE: THE PROPERTY OF THIS DRAWING AND DESIGN IS VESTED IN VECTOS (SOUTH) LTD.
IT MUST NOT BE COPIED OR REPRODUCED IN ANY WAY WITHOUT THEIR PRIOR WRITTEN CONSENT.
10th Floor, Helmont House, Churchill Way, Cardiff CF10 2HE
t: 02920 720 860 e: [email protected]
transport planning specialists
Ordnance Survey © Crown copyright .
All rights reserved. Licence No. 100052073.
2015
2
15
Gas Gov
82.7m
SM
HINCKLEY ROAD
El Sub Sta
1
HIGH
AM LA
NE
26
SM
22
82.6m
47
46
45
44
43
42
41
40
39
38
37
36
35
34
33
32
31
30
29
28
27
26
25
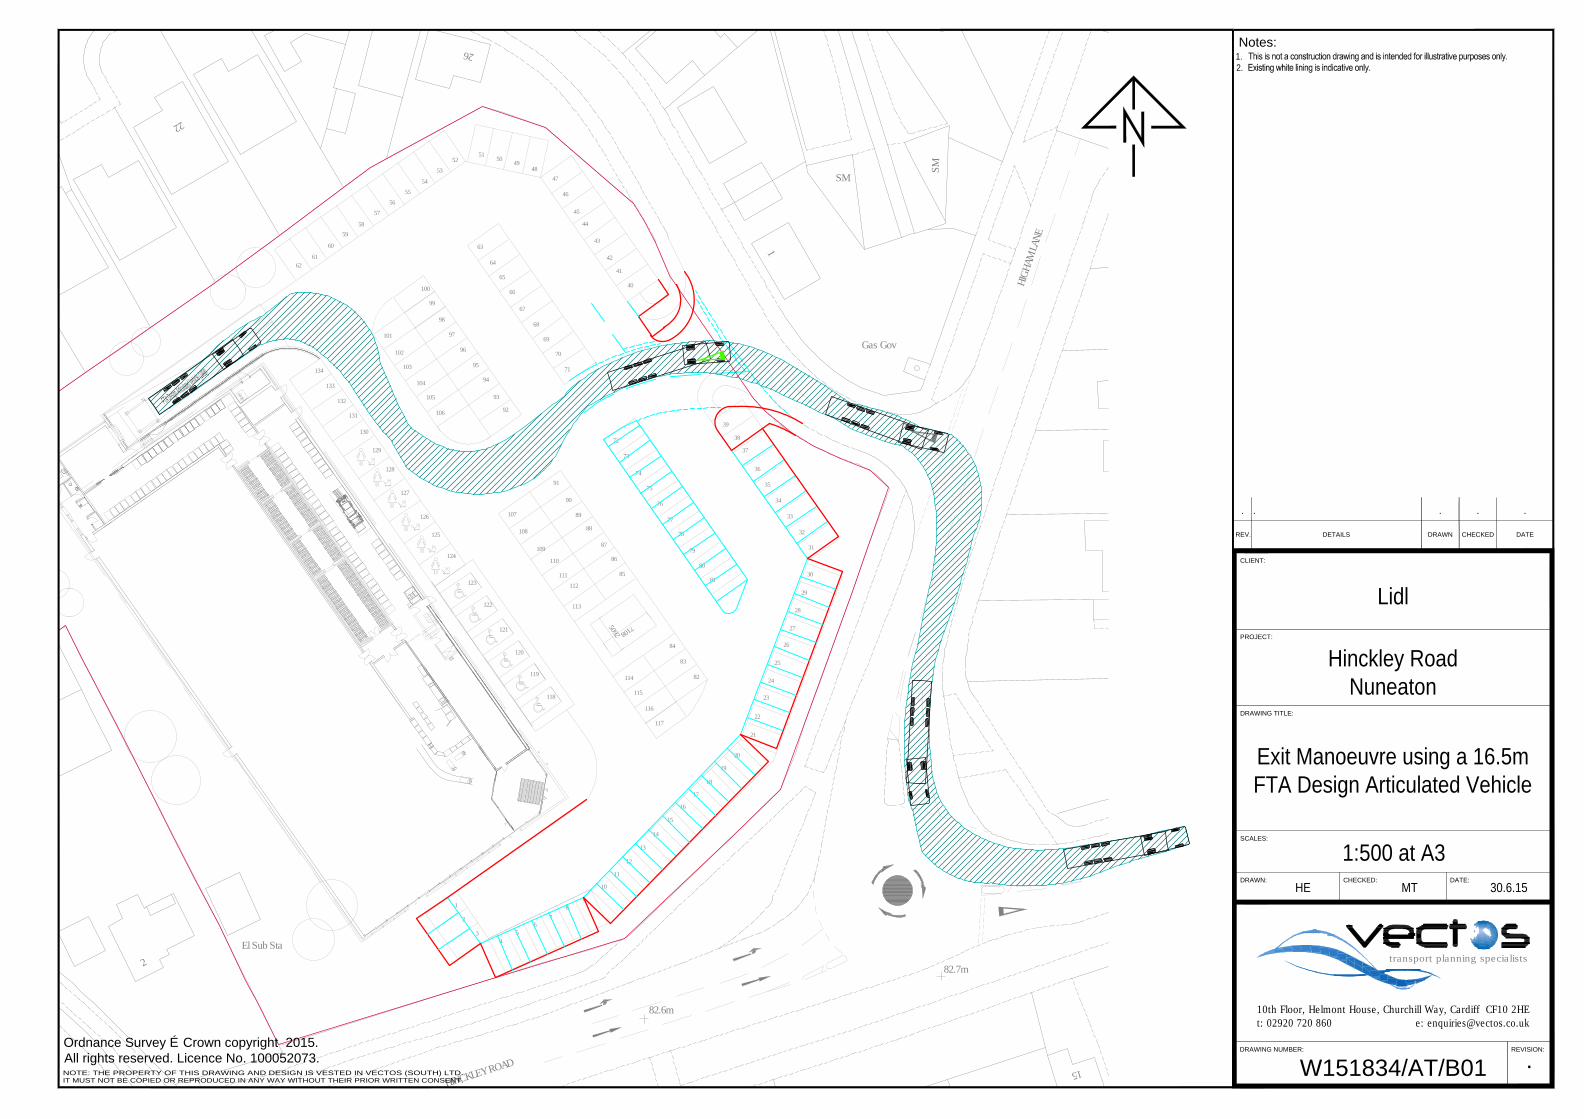
24
23
22
21
20
19
18
17
16
15
14
13
12
11
10
98
76
54
71085092
2
117
71
70
69
68
67
66
65
64
99
98
97
96
95
94
93
92106
105
104
103
129
128
127
116
115
114
84
83
85
88
89
90
91
107
108
109
110
111112
113
81
80
79
78
77
76
75
74
73
72
1
3
12587
86
118
119
120
121
122
123
82
48495051
63
100
101
102
130
131
132
133
134
124
126
5253
5455
5657
5859
60
6162
F
T
A
D
e
s
ig
n
A
rtic
u
la
te
d
V
e
h
ic
le
(1
9
9
8
)
HE
W151834/AT/B01
.
1:500 at A3
MT 30.6.15
. . . . .
Lidl
Hinckley Road
Nuneaton
Exit Manoeuvre using a 16.5m
FTA Design Articulated Vehicle
1.
2.
This is not a construction drawing and is intended for illustrative purposes only.
Existing white lining is indicative only.
DRAWING NUMBER:
SCALES:
DRAWN: CHECKED:
REVISION:
DATE:
DRAWING TITLE:
PROJECT:
CLIENT:
REV. DETAILS DRAWN DATECHECKED
Notes:
NOTE: THE PROPERTY OF THIS DRAWING AND DESIGN IS VESTED IN VECTOS (SOUTH) LTD.
IT MUST NOT BE COPIED OR REPRODUCED IN ANY WAY WITHOUT THEIR PRIOR WRITTEN CONSENT.
10th Floor, Helmont House, Churchill Way, Cardiff CF10 2HE
t: 02920 720 860 e: [email protected]
transport planning specialists
Ordnance Survey © Crown copyright .
All rights reserved. Licence No. 100052073.
2015

APPENDIX E
TEMPro Summary

Period Level Area Weekday AM peak Weekday PM peak
2015‐2016 44UC3 Nuneaton 1.012272733 1.012625003
2015‐2021 44UC3 Nuneaton 1.068665746 1.069400405

APPENDIX F
TRICS Output
TRICS 7.2.2 160615 B17.20 (C) 2015 TRICS Consortium Ltd Monday 20/07/15
Page 1
Vectos Churchill Way Cardiff Licence No: 152302
Calculation Reference: AUDIT-152302-150720-0709TRIP RATE CALCULATION SELECTION PARAMETERS:
Land Use : 01 - RETAILCategory : C - DISCOUNT FOOD STORESMULTI-MODAL VEHICLES
Selected regions and areas:
02 SOUTH EAST
KC KENT 1 days06 WEST MIDLANDS
SH SHROPSHIRE 1 days07 YORKSHIRE & NORTH LINCOLNSHIRE
NY NORTH YORKSHIRE 1 days08 NORTH WEST
MS MERSEYSIDE 1 days10 WALES
GW GWYNEDD 1 daysPS POWYS 1 days
11 SCOTLAND
HI HIGHLAND 1 daysPK PERTH & KINROSS 1 days
This section displays the number of survey days per TRICS® sub-region in the selected set
Filtering Stage 2 selection:
This data displays the chosen trip rate parameter and its selected range. Only sites that fall within the parameter range
are included in the trip rate calculation.
Parameter: Gross floor areaActual Range: 1150 to 1900 (units: sqm)Range Selected by User: 900 to 1900 (units: sqm)
Public Transport Provision:Selection by: Include all surveys
Date Range: 01/01/07 to 27/11/12
This data displays the range of survey dates selected. Only surveys that were conducted within this date range are
included in the trip rate calculation.
Selected survey days:
Monday 1 daysTuesday 4 daysWednesday 2 daysFriday 1 days
This data displays the number of selected surveys by day of the week.
Selected survey types:
Manual count 8 daysDirectional ATC Count 0 days
This data displays the number of manual classified surveys and the number of unclassified ATC surveys, the total adding
up to the overall number of surveys in the selected set. Manual surveys are undertaken using staff, whilst ATC surveys are
undertaking using machines.
Selected Locations:
Edge of Town Centre 6Suburban Area (PPS6 Out of Centre) 2
This data displays the number of surveys per main location category within the selected set. The main location categories
consist of Free Standing, Edge of Town, Suburban Area, Neighbourhood Centre, Edge of Town Centre, Town Centre and
Not Known.
Selected Location Sub Categories:
Residential Zone 1Retail Zone 2Built-Up Zone 1No Sub Category 4
TRICS 7.2.2 160615 B17.20 (C) 2015 TRICS Consortium Ltd Monday 20/07/15
Page 2
Vectos Churchill Way Cardiff Licence No: 152302
This data displays the number of surveys per location sub-category within the selected set. The location sub-categories
consist of Commercial Zone, Industrial Zone, Development Zone, Residential Zone, Retail Zone, Built-Up Zone, Village, Out
of Town, High Street and No Sub Category.
Filtering Stage 3 selection:
Use Class:
Not Known 1 days A 1 7 days
This data displays the number of surveys per Use Class classification within the selected set. The Use Classes Order 2005
has been used for this purpose, which can be found within the Library module of TRICS®.
Population within 1 mile:
5,001 to 10,000 3 days10,001 to 15,000 1 days15,001 to 20,000 2 days25,001 to 50,000 2 days
This data displays the number of selected surveys within stated 1-mile radii of population.
Population within 5 miles:
5,001 to 25,000 3 days25,001 to 50,000 2 days100,001 to 125,000 1 days125,001 to 250,000 1 days500,001 or More 1 days
This data displays the number of selected surveys within stated 5-mile radii of population.
Car ownership within 5 miles:
0.6 to 1.0 1 days1.1 to 1.5 7 days
This data displays the number of selected surveys within stated ranges of average cars owned per residential dwelling,
within a radius of 5-miles of selected survey sites.
Petrol filling station:
Included in the survey count 0 daysExcluded from count or no filling station 8 days
This data displays the number of surveys within the selected set that include petrol filling station activity, and the number
of surveys that do not.
Travel Plan:
Yes 1 daysNo 7 days
This data displays the number of surveys within the selected set that were undertaken at sites with Travel Plans in place,
and the number of surveys that were undertaken at sites without Travel Plans.
TRICS 7.2.2 160615 B17.20 (C) 2015 TRICS Consortium Ltd Monday 20/07/15
Page 3
Vectos Churchill Way Cardiff Licence No: 152302
LIST OF SITES relevant to selection parameters
1 GW-01-C-01 LIDL GWYNEDD
HIGH STREET
BANGOREdge of Town CentreNo Sub CategoryTotal Gross floor area: 1 3 1 0 sqm
Survey date: FRIDAY 10/07/09 Survey Type: MANUAL
2 HI-01-C-01 LIDL HIGHLAND
CAMANACHD CRESCENT
FORT WILLIAMEdge of Town CentreRetail ZoneTotal Gross floor area: 1 2 8 5 sqm
Survey date: TUESDAY 19/05/09 Survey Type: MANUAL
3 KC-01-C-02 ALDI KENT
WELL ROAD
MAIDSTONEEdge of Town CentreBuilt-Up ZoneTotal Gross floor area: 1 4 0 7 sqm
Survey date: TUESDAY 27/11/12 Survey Type: MANUAL
4 MS-01-C-03 ALDI MERSEYSIDE
LAUREL ROADELM PARKLIVERPOOLSuburban Area (PPS6 Out of Centre)Residential ZoneTotal Gross floor area: 1 1 6 5 sqm
Survey date: WEDNESDAY 20/06/07 Survey Type: MANUAL
5 NY-01-C-02 LIDL NORTH YORKSHIRE
STATION ROAD
THIRSKEdge of Town CentreNo Sub CategoryTotal Gross floor area: 1 5 2 7 sqm
Survey date: TUESDAY 11/10/11 Survey Type: MANUAL
6 PK-01-C-01 ALDI PERTH & KINROSS
GLASGOW ROAD
PERTHEdge of Town CentreRetail ZoneTotal Gross floor area: 1 4 0 0 sqm
Survey date: WEDNESDAY 11/05/11 Survey Type: MANUAL
7 PS-01-C-01 ALDI POWYS
RICH WAY
BRECONEdge of Town CentreNo Sub CategoryTotal Gross floor area: 1 1 5 0 sqm
Survey date: MONDAY 15/09/08 Survey Type: MANUAL

TRICS 7.2.2 160615 B17.20 (C) 2015 TRICS Consortium Ltd Monday 20/07/15
Page 4
Vectos Churchill Way Cardiff Licence No: 152302
LIST OF SITES relevant to selection parameters (Cont.)
8 SH-01-C-01 LIDL SHROPSHIRE
CASTLE STREETHADLEYTELFORDSuburban Area (PPS6 Out of Centre)No Sub CategoryTotal Gross floor area: 1 9 0 0 sqm
Survey date: TUESDAY 16/06/09 Survey Type: MANUAL
This section provides a list of all survey sites and days in the selected set. For each individual survey site, it displays a
unique site reference code and site address, the selected trip rate calculation parameter and its value, the day of the week
and date of each survey, and whether the survey was a manual classified count or an ATC count.

TRICS 7.2.2 160615 B17.20 (C) 2015 TRICS Consortium Ltd Monday 20/07/15
Page 5
Vectos Churchill Way Cardiff Licence No: 152302
TRIP RATE for Land Use 01 - RETAIL/C - DISCOUNT FOOD STORESMULTI-MODAL VEHICLES
Calculation factor: 100 sqm
BOLD print indicates peak (busiest) period
ARRIVALS DEPARTURES TOTALSNo. Ave. Trip No. Ave. Trip No. Ave. Trip
Time Range Days GFA Rate Days GFA Rate Days GFA Rate00:00 - 01:0001:00 - 02:0002:00 - 03:0003:00 - 04:0004:00 - 05:0005:00 - 06:0006:00 - 07:00
5 1460 0.315 5 1460 0.096 5 1460 0.41107:00 - 08:008 1393 0.969 8 1393 0.592 8 1393 1.56108:00 - 09:008 1393 2.109 8 1393 1.508 8 1393 3.61709:00 - 10:008 1393 3.293 8 1393 2.728 8 1393 6.02110:00 - 11:008 1393 3.141 8 1393 2.961 8 1393 6.10211:00 - 12:008 1393 2.961 8 1393 3.096 8 1393 6.05712:00 - 13:008 1393 2.701 8 1393 2.773 8 1393 5.47413:00 - 14:008 1393 3.652 8 1393 3.428 8 1393 7.08014:00 - 15:008 1393 3.491 8 1393 3.679 8 1393 7.17015:00 - 16:008 1393 2.997 8 1393 3.195 8 1393 6.19216:00 - 17:008 1393 2.791 8 1393 3.446 8 1393 6.23717:00 - 18:008 1393 2.082 8 1393 2.414 8 1393 4.49618:00 - 19:008 1393 0.897 8 1393 1.301 8 1393 2.19819:00 - 20:004 1411 0.266 4 1411 0.390 4 1411 0.65620:00 - 21:002 1404 0.143 2 1404 0.392 2 1404 0.53521:00 - 22:00
22:00 - 23:0023:00 - 24:00
Total Rates: 3 1.808 3 1.999 6 3.807
This section displays the trip rate results based on the selected set of surveys and the selected count type (shown just
above the table). It is split by three main columns, representing arrivals trips, departures trips, and total trips (arrivals plus
departures). Within each of these main columns are three sub-columns. These display the number of survey days where
count data is included (per time period), the average value of the selected trip rate calculation parameter (per time
period), and the trip rate result (per time period). Total trip rates (the sum of the column) are also displayed at the foot of
the table.
To obtain a trip rate, the average (mean) trip rate parameter value (TRP) is first calculated for all selected survey days
that have count data available for the stated time period. The average (mean) number of arrivals, departures or totals
(whichever applies) is also calculated (COUNT) for all selected survey days that have count data available for the stated
time period. Then, the average count is divided by the average trip rate parameter value, and multiplied by the stated
calculation factor (shown just above the table and abbreviated here as FACT). So, the method is: COUNT/TRP*FACT. Trip
rates are then rounded to 3 decimal places.
Parameter summary
Trip rate parameter range selected: 1150 - 1900 (units: sqm)Survey date date range: 01/01/07 - 27/11/12Number of weekdays (Monday-Friday): 8Number of Saturdays: 0Number of Sundays: 0Surveys manually removed from selection: 0
This section displays a quick summary of some of the data filtering selections made by the TRICS® user. The trip rate
calculation parameter range of all selected surveys is displayed first, followed by the range of minimum and maximum
survey dates selected by the user. Then, the total number of selected weekdays and weekend days in the selected set of
surveys are show. Finally, the number of survey days that have been manually removed from the selected set outside of
the standard filtering procedure are displayed.
TRICS 7.2.2 160615 B17.20 (C) 2015 TRICS Consortium Ltd Monday 20/07/15
Page 6
Vectos Churchill Way Cardiff Licence No: 152302
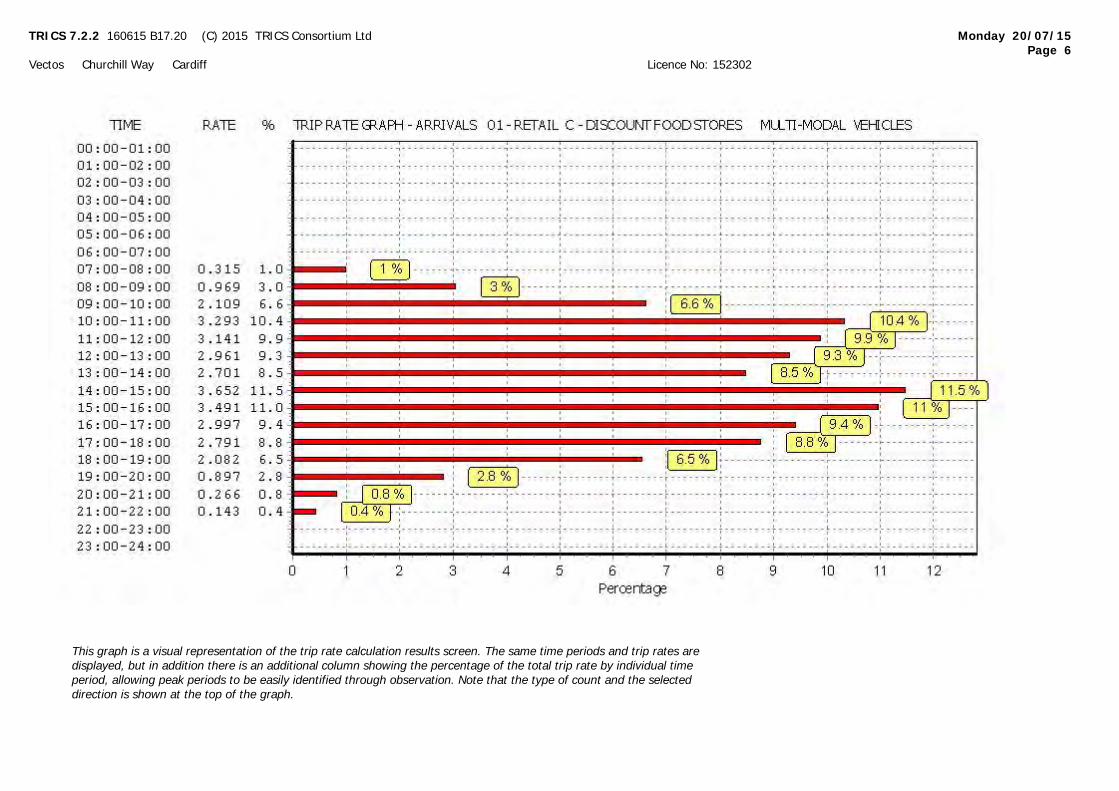
This graph is a visual representation of the trip rate calculation results screen. The same time periods and trip rates are
displayed, but in addition there is an additional column showing the percentage of the total trip rate by individual time
period, allowing peak periods to be easily identified through observation. Note that the type of count and the selected
direction is shown at the top of the graph.
TRICS 7.2.2 160615 B17.20 (C) 2015 TRICS Consortium Ltd Monday 20/07/15
Page 7
Vectos Churchill Way Cardiff Licence No: 152302
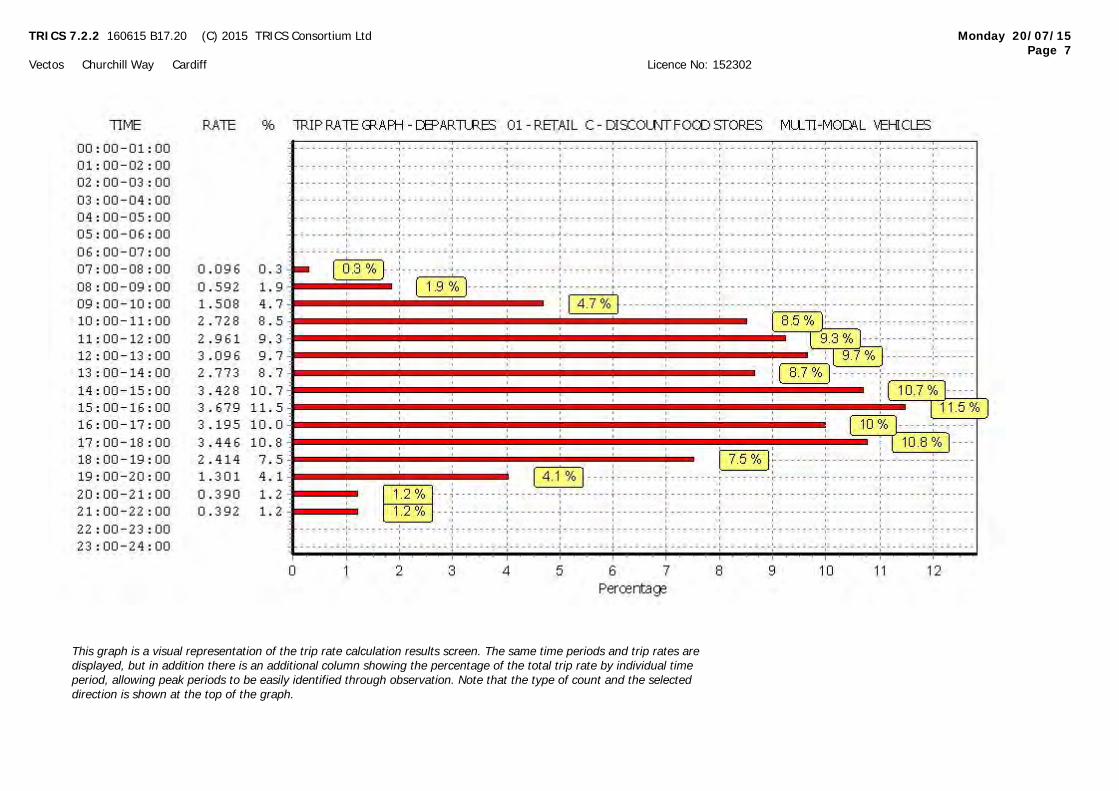
This graph is a visual representation of the trip rate calculation results screen. The same time periods and trip rates are
displayed, but in addition there is an additional column showing the percentage of the total trip rate by individual time
period, allowing peak periods to be easily identified through observation. Note that the type of count and the selected
direction is shown at the top of the graph.
TRICS 7.2.2 160615 B17.20 (C) 2015 TRICS Consortium Ltd Monday 20/07/15
Page 8
Vectos Churchill Way Cardiff Licence No: 152302
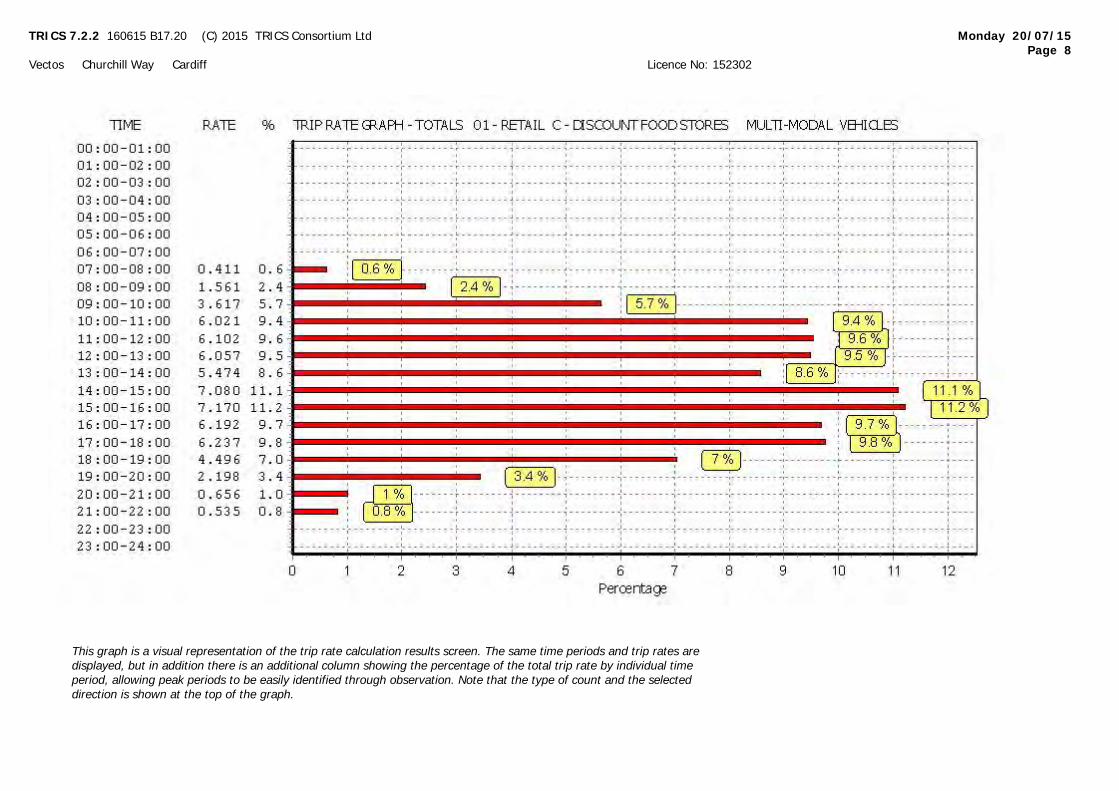
This graph is a visual representation of the trip rate calculation results screen. The same time periods and trip rates are
displayed, but in addition there is an additional column showing the percentage of the total trip rate by individual time
period, allowing peak periods to be easily identified through observation. Note that the type of count and the selected
direction is shown at the top of the graph.

TRICS 7.2.2 160615 B17.20 (C) 2015 TRICS Consortium Ltd Monday 20/07/15
Page 9
Vectos Churchill Way Cardiff Licence No: 152302
TRIP RATE for Land Use 01 - RETAIL/C - DISCOUNT FOOD STORESMULTI-MODAL TAXIS
Calculation factor: 100 sqm
BOLD print indicates peak (busiest) period
ARRIVALS DEPARTURES TOTALSNo. Ave. Trip No. Ave. Trip No. Ave. Trip
Time Range Days GFA Rate Days GFA Rate Days GFA Rate00:00 - 01:0001:00 - 02:0002:00 - 03:0003:00 - 04:0004:00 - 05:0005:00 - 06:0006:00 - 07:00
5 1460 0.000 5 1460 0.000 5 1460 0.00007:00 - 08:008 1393 0.009 8 1393 0.009 8 1393 0.01808:00 - 09:008 1393 0.009 8 1393 0.009 8 1393 0.01809:00 - 10:008 1393 0.054 8 1393 0.036 8 1393 0.09010:00 - 11:008 1393 0.036 8 1393 0.045 8 1393 0.08111:00 - 12:008 1393 0.027 8 1393 0.036 8 1393 0.06312:00 - 13:008 1393 0.054 8 1393 0.054 8 1393 0.10813:00 - 14:008 1393 0.045 8 1393 0.045 8 1393 0.09014:00 - 15:008 1393 0.054 8 1393 0.054 8 1393 0.10815:00 - 16:008 1393 0.045 8 1393 0.036 8 1393 0.08116:00 - 17:008 1393 0.045 8 1393 0.036 8 1393 0.08117:00 - 18:008 1393 0.018 8 1393 0.036 8 1393 0.05418:00 - 19:008 1393 0.009 8 1393 0.009 8 1393 0.01819:00 - 20:004 1411 0.000 4 1411 0.000 4 1411 0.00020:00 - 21:002 1404 0.000 2 1404 0.000 2 1404 0.00021:00 - 22:00
22:00 - 23:0023:00 - 24:00
Total Rates: 0.405 0.405 0.810
This section displays the trip rate results based on the selected set of surveys and the selected count type (shown just
above the table). It is split by three main columns, representing arrivals trips, departures trips, and total trips (arrivals plus
departures). Within each of these main columns are three sub-columns. These display the number of survey days where
count data is included (per time period), the average value of the selected trip rate calculation parameter (per time
period), and the trip rate result (per time period). Total trip rates (the sum of the column) are also displayed at the foot of
the table.
To obtain a trip rate, the average (mean) trip rate parameter value (TRP) is first calculated for all selected survey days
that have count data available for the stated time period. The average (mean) number of arrivals, departures or totals
(whichever applies) is also calculated (COUNT) for all selected survey days that have count data available for the stated
time period. Then, the average count is divided by the average trip rate parameter value, and multiplied by the stated
calculation factor (shown just above the table and abbreviated here as FACT). So, the method is: COUNT/TRP*FACT. Trip
rates are then rounded to 3 decimal places.
Parameter summary
Trip rate parameter range selected: 1150 - 1900 (units: sqm)Survey date date range: 01/01/07 - 27/11/12Number of weekdays (Monday-Friday): 8Number of Saturdays: 0Number of Sundays: 0Surveys manually removed from selection: 0
This section displays a quick summary of some of the data filtering selections made by the TRICS® user. The trip rate
calculation parameter range of all selected surveys is displayed first, followed by the range of minimum and maximum
survey dates selected by the user. Then, the total number of selected weekdays and weekend days in the selected set of
surveys are show. Finally, the number of survey days that have been manually removed from the selected set outside of
the standard filtering procedure are displayed.
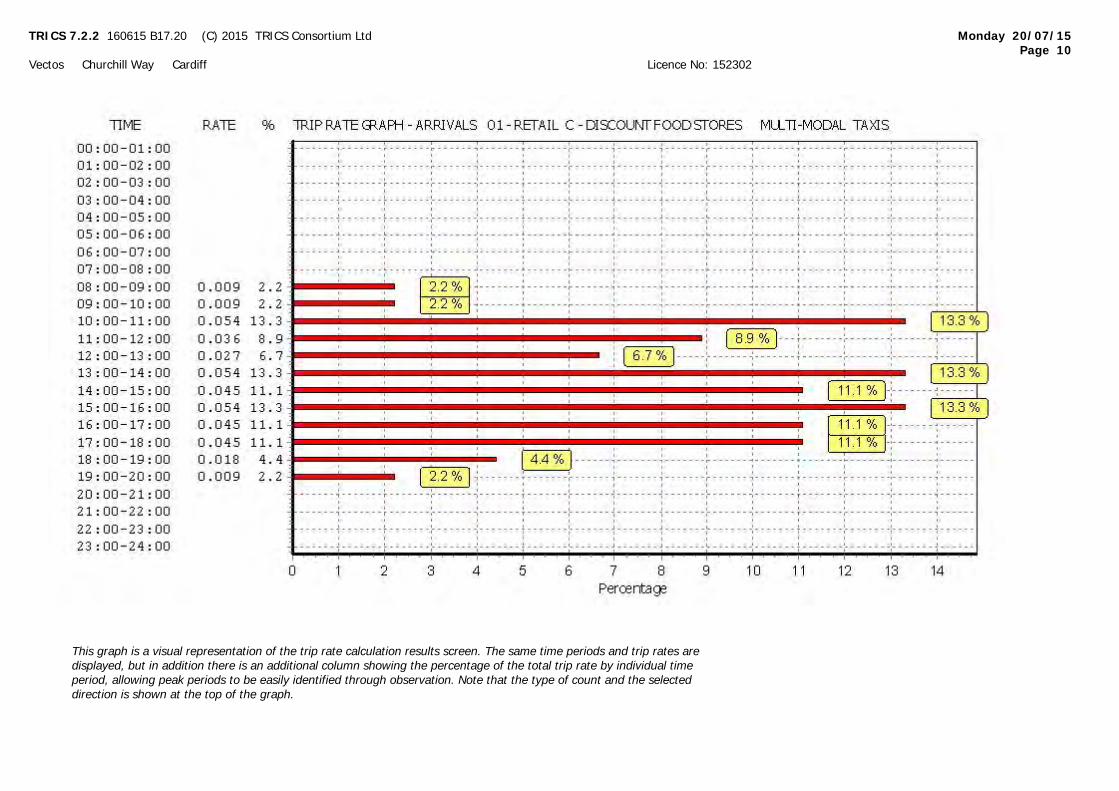
TRICS 7.2.2 160615 B17.20 (C) 2015 TRICS Consortium Ltd Monday 20/07/15
Page 10
Vectos Churchill Way Cardiff Licence No: 152302
This graph is a visual representation of the trip rate calculation results screen. The same time periods and trip rates are
displayed, but in addition there is an additional column showing the percentage of the total trip rate by individual time
period, allowing peak periods to be easily identified through observation. Note that the type of count and the selected
direction is shown at the top of the graph.
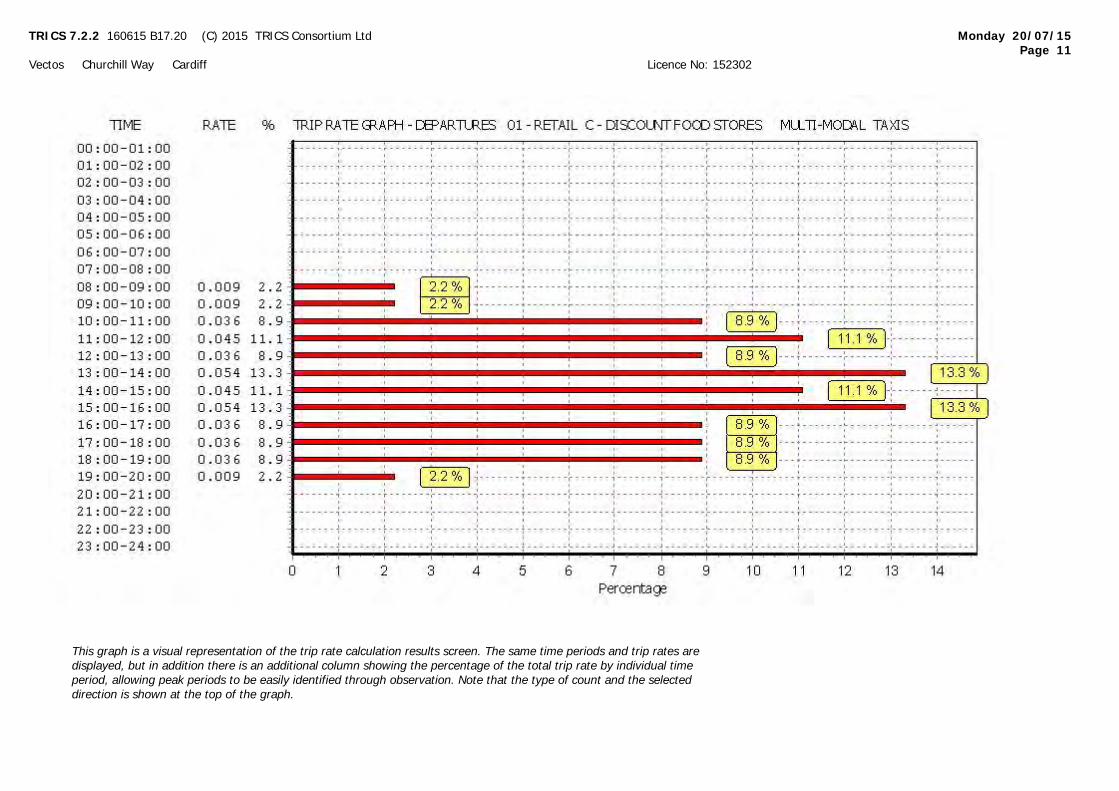
TRICS 7.2.2 160615 B17.20 (C) 2015 TRICS Consortium Ltd Monday 20/07/15
Page 11
Vectos Churchill Way Cardiff Licence No: 152302
This graph is a visual representation of the trip rate calculation results screen. The same time periods and trip rates are
displayed, but in addition there is an additional column showing the percentage of the total trip rate by individual time
period, allowing peak periods to be easily identified through observation. Note that the type of count and the selected
direction is shown at the top of the graph.
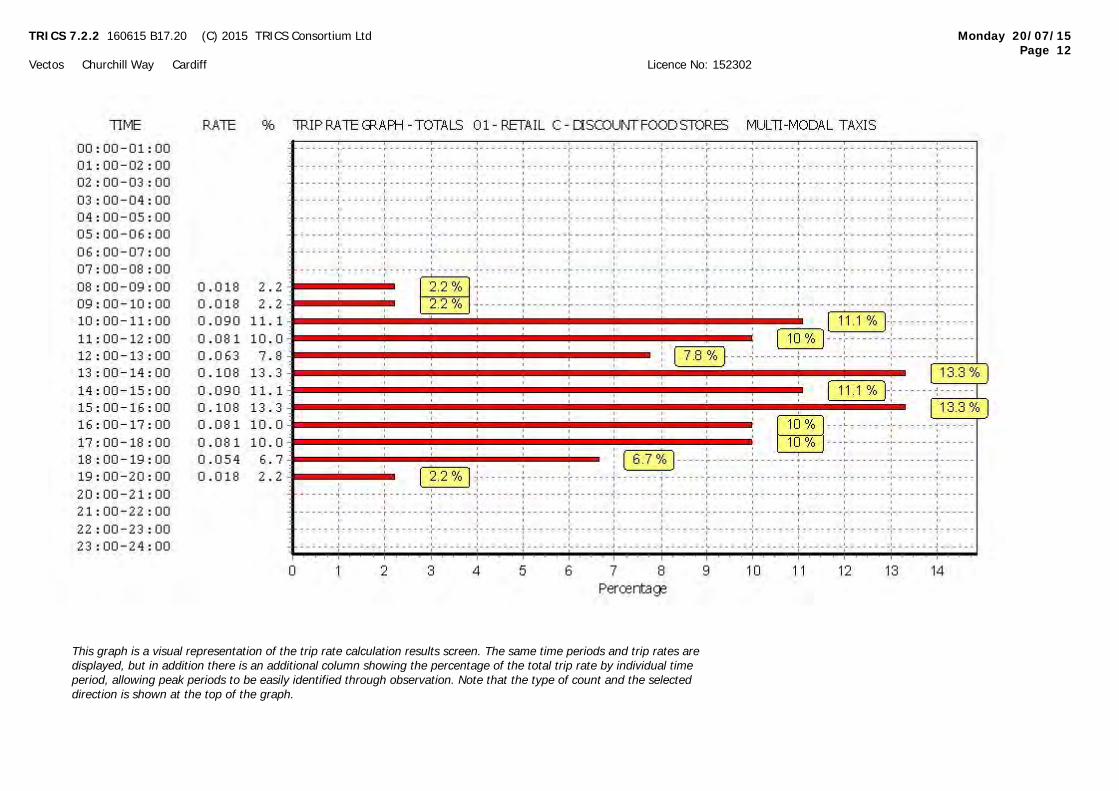
TRICS 7.2.2 160615 B17.20 (C) 2015 TRICS Consortium Ltd Monday 20/07/15
Page 12
Vectos Churchill Way Cardiff Licence No: 152302
This graph is a visual representation of the trip rate calculation results screen. The same time periods and trip rates are
displayed, but in addition there is an additional column showing the percentage of the total trip rate by individual time
period, allowing peak periods to be easily identified through observation. Note that the type of count and the selected
direction is shown at the top of the graph.

TRICS 7.2.2 160615 B17.20 (C) 2015 TRICS Consortium Ltd Monday 20/07/15
Page 13
Vectos Churchill Way Cardiff Licence No: 152302
TRIP RATE for Land Use 01 - RETAIL/C - DISCOUNT FOOD STORESMULTI-MODAL OGVS
Calculation factor: 100 sqm
BOLD print indicates peak (busiest) period
ARRIVALS DEPARTURES TOTALSNo. Ave. Trip No. Ave. Trip No. Ave. Trip
Time Range Days GFA Rate Days GFA Rate Days GFA Rate00:00 - 01:0001:00 - 02:0002:00 - 03:0003:00 - 04:0004:00 - 05:0005:00 - 06:0006:00 - 07:00
5 1460 0.000 5 1460 0.000 5 1460 0.00007:00 - 08:008 1393 0.027 8 1393 0.036 8 1393 0.06308:00 - 09:008 1393 0.027 8 1393 0.018 8 1393 0.04509:00 - 10:008 1393 0.018 8 1393 0.027 8 1393 0.04510:00 - 11:008 1393 0.018 8 1393 0.018 8 1393 0.03611:00 - 12:008 1393 0.009 8 1393 0.009 8 1393 0.01812:00 - 13:008 1393 0.027 8 1393 0.027 8 1393 0.05413:00 - 14:008 1393 0.027 8 1393 0.027 8 1393 0.05414:00 - 15:008 1393 0.009 8 1393 0.000 8 1393 0.00915:00 - 16:008 1393 0.000 8 1393 0.009 8 1393 0.00916:00 - 17:008 1393 0.000 8 1393 0.000 8 1393 0.00017:00 - 18:008 1393 0.000 8 1393 0.000 8 1393 0.00018:00 - 19:008 1393 0.000 8 1393 0.000 8 1393 0.00019:00 - 20:004 1411 0.000 4 1411 0.000 4 1411 0.00020:00 - 21:002 1404 0.000 2 1404 0.000 2 1404 0.00021:00 - 22:00
22:00 - 23:0023:00 - 24:00
Total Rates: 0.162 0.171 0.333
This section displays the trip rate results based on the selected set of surveys and the selected count type (shown just
above the table). It is split by three main columns, representing arrivals trips, departures trips, and total trips (arrivals plus
departures). Within each of these main columns are three sub-columns. These display the number of survey days where
count data is included (per time period), the average value of the selected trip rate calculation parameter (per time
period), and the trip rate result (per time period). Total trip rates (the sum of the column) are also displayed at the foot of
the table.
To obtain a trip rate, the average (mean) trip rate parameter value (TRP) is first calculated for all selected survey days
that have count data available for the stated time period. The average (mean) number of arrivals, departures or totals
(whichever applies) is also calculated (COUNT) for all selected survey days that have count data available for the stated
time period. Then, the average count is divided by the average trip rate parameter value, and multiplied by the stated
calculation factor (shown just above the table and abbreviated here as FACT). So, the method is: COUNT/TRP*FACT. Trip
rates are then rounded to 3 decimal places.
Parameter summary
Trip rate parameter range selected: 1150 - 1900 (units: sqm)Survey date date range: 01/01/07 - 27/11/12Number of weekdays (Monday-Friday): 8Number of Saturdays: 0Number of Sundays: 0Surveys manually removed from selection: 0
This section displays a quick summary of some of the data filtering selections made by the TRICS® user. The trip rate
calculation parameter range of all selected surveys is displayed first, followed by the range of minimum and maximum
survey dates selected by the user. Then, the total number of selected weekdays and weekend days in the selected set of
surveys are show. Finally, the number of survey days that have been manually removed from the selected set outside of
the standard filtering procedure are displayed.
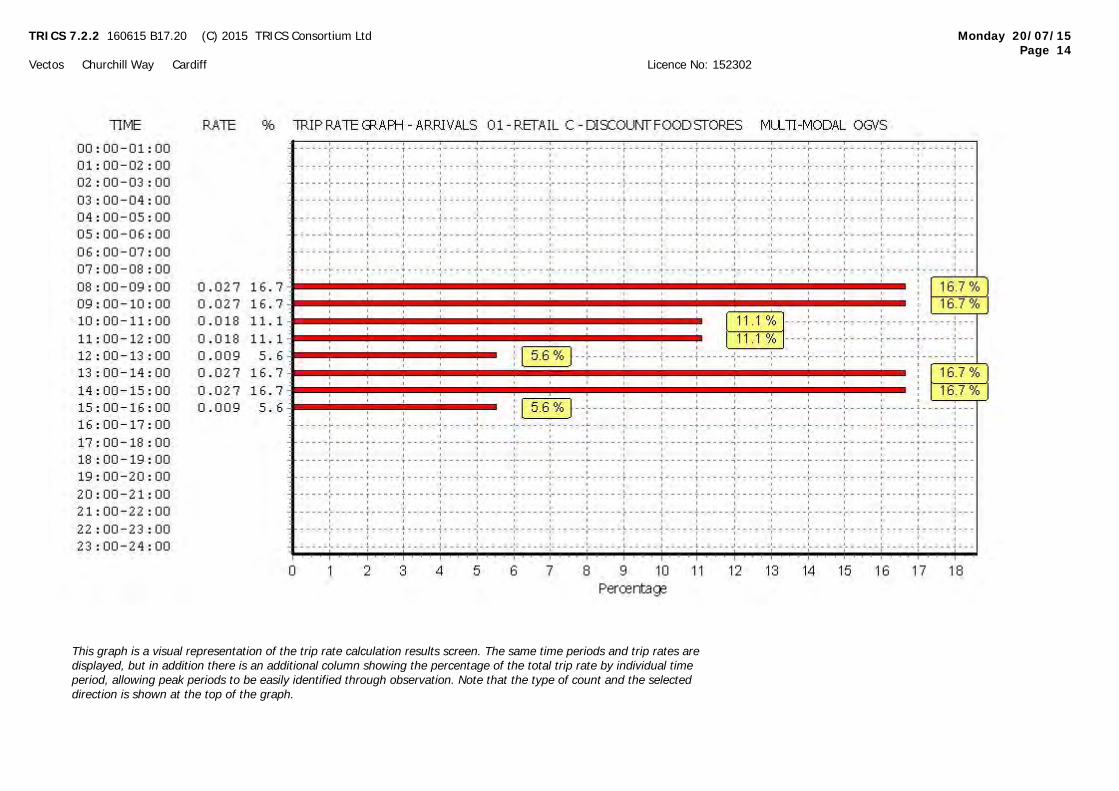
TRICS 7.2.2 160615 B17.20 (C) 2015 TRICS Consortium Ltd Monday 20/07/15
Page 14
Vectos Churchill Way Cardiff Licence No: 152302
This graph is a visual representation of the trip rate calculation results screen. The same time periods and trip rates are
displayed, but in addition there is an additional column showing the percentage of the total trip rate by individual time
period, allowing peak periods to be easily identified through observation. Note that the type of count and the selected
direction is shown at the top of the graph.
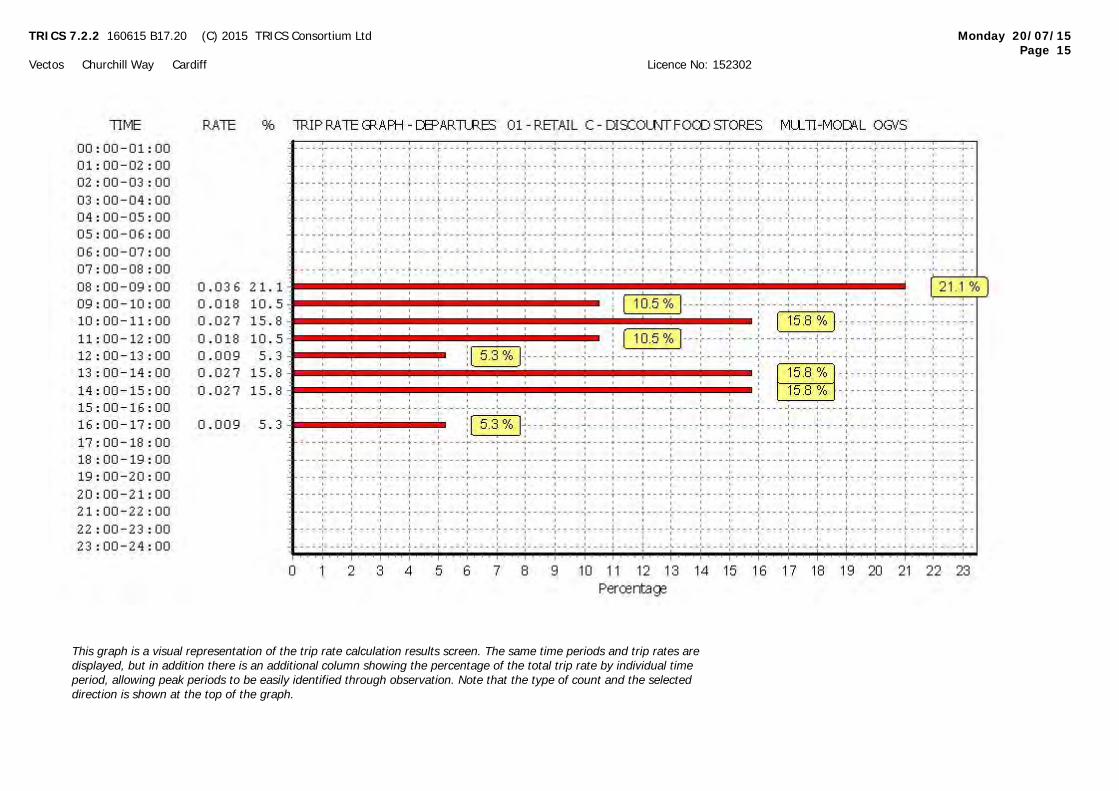
TRICS 7.2.2 160615 B17.20 (C) 2015 TRICS Consortium Ltd Monday 20/07/15
Page 15
Vectos Churchill Way Cardiff Licence No: 152302
This graph is a visual representation of the trip rate calculation results screen. The same time periods and trip rates are
displayed, but in addition there is an additional column showing the percentage of the total trip rate by individual time
period, allowing peak periods to be easily identified through observation. Note that the type of count and the selected
direction is shown at the top of the graph.

TRICS 7.2.2 160615 B17.20 (C) 2015 TRICS Consortium Ltd Monday 20/07/15
Page 16
Vectos Churchill Way Cardiff Licence No: 152302
This graph is a visual representation of the trip rate calculation results screen. The same time periods and trip rates are
displayed, but in addition there is an additional column showing the percentage of the total trip rate by individual time
period, allowing peak periods to be easily identified through observation. Note that the type of count and the selected
direction is shown at the top of the graph.
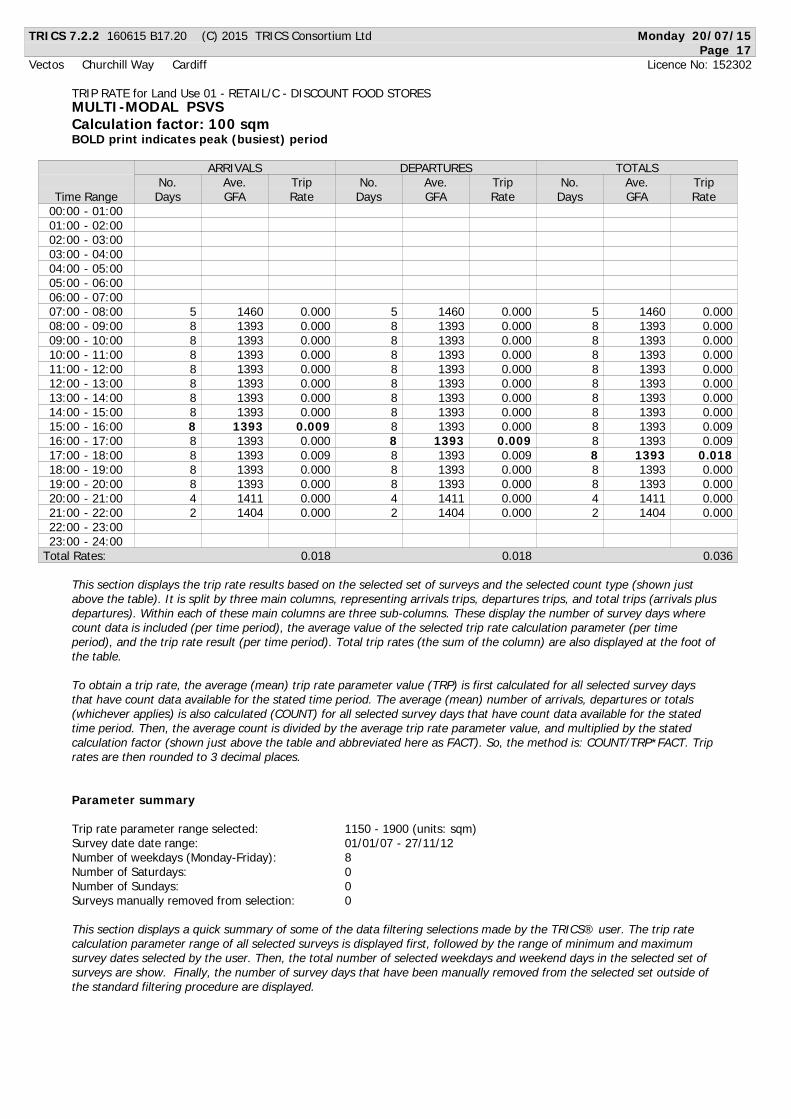
TRICS 7.2.2 160615 B17.20 (C) 2015 TRICS Consortium Ltd Monday 20/07/15
Page 17
Vectos Churchill Way Cardiff Licence No: 152302
TRIP RATE for Land Use 01 - RETAIL/C - DISCOUNT FOOD STORESMULTI-MODAL PSVS
Calculation factor: 100 sqm
BOLD print indicates peak (busiest) period
ARRIVALS DEPARTURES TOTALSNo. Ave. Trip No. Ave. Trip No. Ave. Trip
Time Range Days GFA Rate Days GFA Rate Days GFA Rate00:00 - 01:0001:00 - 02:0002:00 - 03:0003:00 - 04:0004:00 - 05:0005:00 - 06:0006:00 - 07:00
5 1460 0.000 5 1460 0.000 5 1460 0.00007:00 - 08:008 1393 0.000 8 1393 0.000 8 1393 0.00008:00 - 09:008 1393 0.000 8 1393 0.000 8 1393 0.00009:00 - 10:008 1393 0.000 8 1393 0.000 8 1393 0.00010:00 - 11:008 1393 0.000 8 1393 0.000 8 1393 0.00011:00 - 12:008 1393 0.000 8 1393 0.000 8 1393 0.00012:00 - 13:008 1393 0.000 8 1393 0.000 8 1393 0.00013:00 - 14:008 1393 0.000 8 1393 0.000 8 1393 0.00014:00 - 15:008 1393 0.009 8 1393 0.000 8 1393 0.00915:00 - 16:008 1393 0.000 8 1393 0.009 8 1393 0.00916:00 - 17:008 1393 0.009 8 1393 0.009 8 1393 0.01817:00 - 18:008 1393 0.000 8 1393 0.000 8 1393 0.00018:00 - 19:008 1393 0.000 8 1393 0.000 8 1393 0.00019:00 - 20:004 1411 0.000 4 1411 0.000 4 1411 0.00020:00 - 21:002 1404 0.000 2 1404 0.000 2 1404 0.00021:00 - 22:00
22:00 - 23:0023:00 - 24:00
Total Rates: 0.018 0.018 0.036
This section displays the trip rate results based on the selected set of surveys and the selected count type (shown just
above the table). It is split by three main columns, representing arrivals trips, departures trips, and total trips (arrivals plus
departures). Within each of these main columns are three sub-columns. These display the number of survey days where
count data is included (per time period), the average value of the selected trip rate calculation parameter (per time
period), and the trip rate result (per time period). Total trip rates (the sum of the column) are also displayed at the foot of
the table.
To obtain a trip rate, the average (mean) trip rate parameter value (TRP) is first calculated for all selected survey days
that have count data available for the stated time period. The average (mean) number of arrivals, departures or totals
(whichever applies) is also calculated (COUNT) for all selected survey days that have count data available for the stated
time period. Then, the average count is divided by the average trip rate parameter value, and multiplied by the stated
calculation factor (shown just above the table and abbreviated here as FACT). So, the method is: COUNT/TRP*FACT. Trip
rates are then rounded to 3 decimal places.
Parameter summary
Trip rate parameter range selected: 1150 - 1900 (units: sqm)Survey date date range: 01/01/07 - 27/11/12Number of weekdays (Monday-Friday): 8Number of Saturdays: 0Number of Sundays: 0Surveys manually removed from selection: 0
This section displays a quick summary of some of the data filtering selections made by the TRICS® user. The trip rate
calculation parameter range of all selected surveys is displayed first, followed by the range of minimum and maximum
survey dates selected by the user. Then, the total number of selected weekdays and weekend days in the selected set of
surveys are show. Finally, the number of survey days that have been manually removed from the selected set outside of
the standard filtering procedure are displayed.
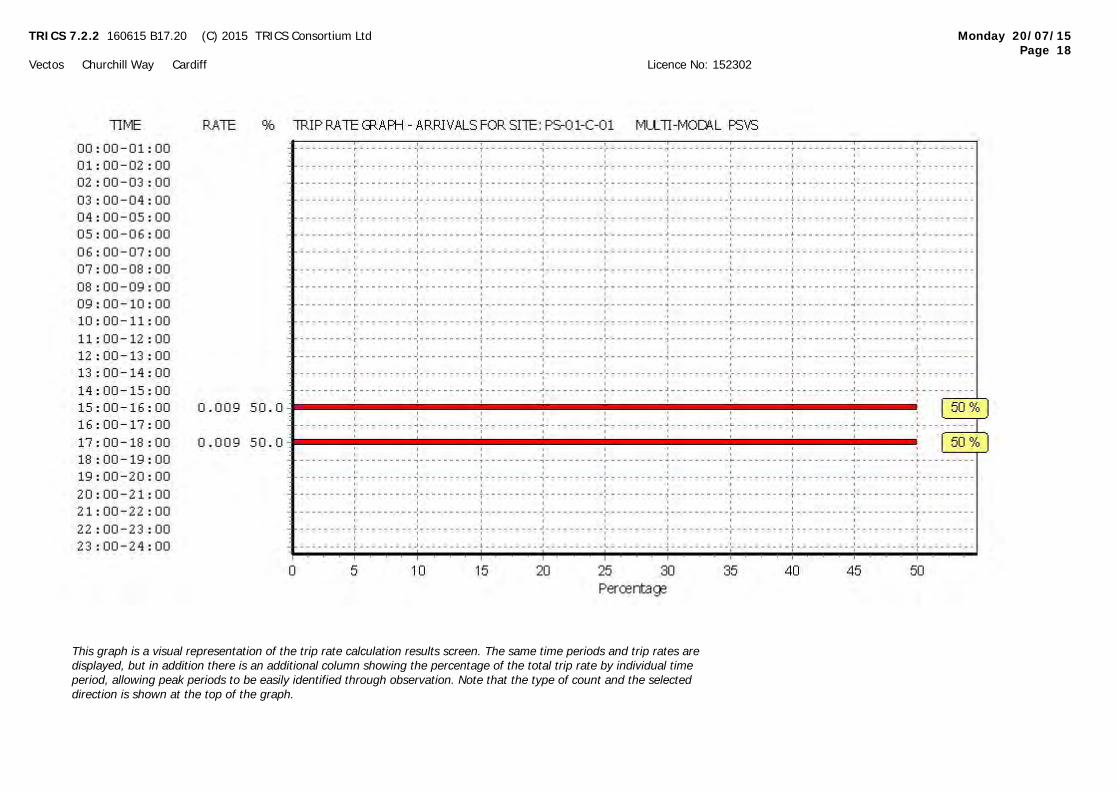
TRICS 7.2.2 160615 B17.20 (C) 2015 TRICS Consortium Ltd Monday 20/07/15
Page 18
Vectos Churchill Way Cardiff Licence No: 152302
This graph is a visual representation of the trip rate calculation results screen. The same time periods and trip rates are
displayed, but in addition there is an additional column showing the percentage of the total trip rate by individual time
period, allowing peak periods to be easily identified through observation. Note that the type of count and the selected
direction is shown at the top of the graph.
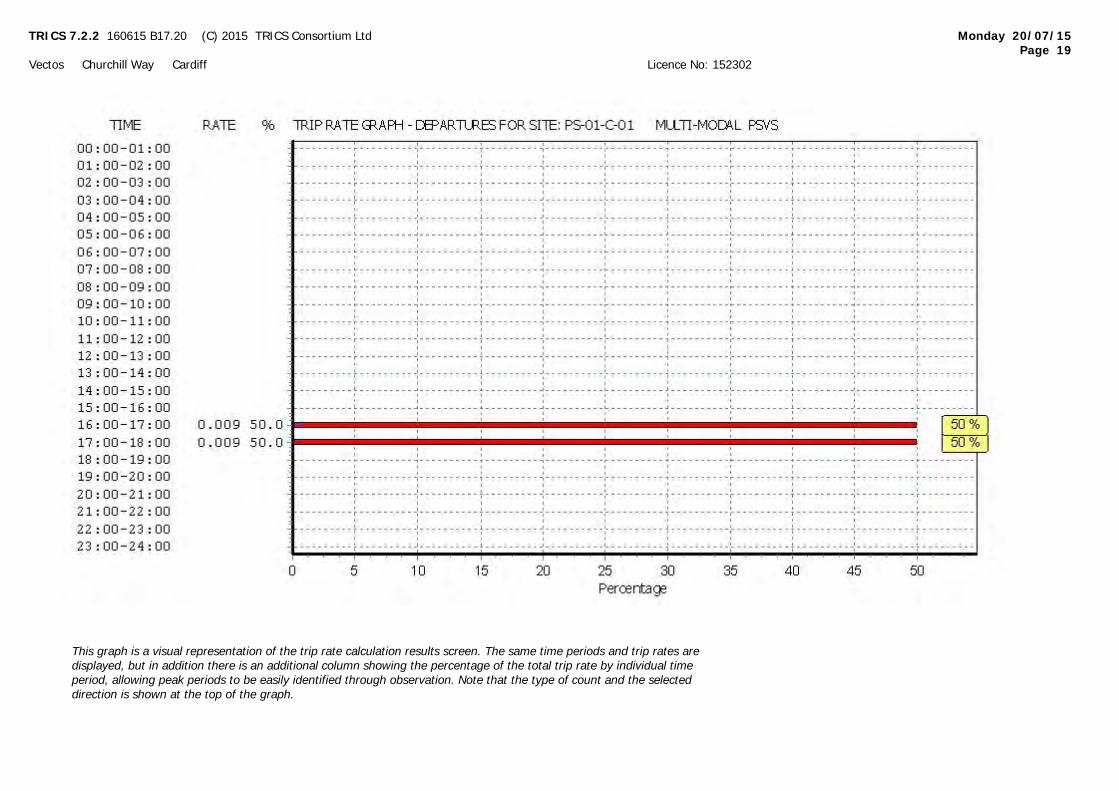
TRICS 7.2.2 160615 B17.20 (C) 2015 TRICS Consortium Ltd Monday 20/07/15
Page 19
Vectos Churchill Way Cardiff Licence No: 152302
This graph is a visual representation of the trip rate calculation results screen. The same time periods and trip rates are
displayed, but in addition there is an additional column showing the percentage of the total trip rate by individual time
period, allowing peak periods to be easily identified through observation. Note that the type of count and the selected
direction is shown at the top of the graph.
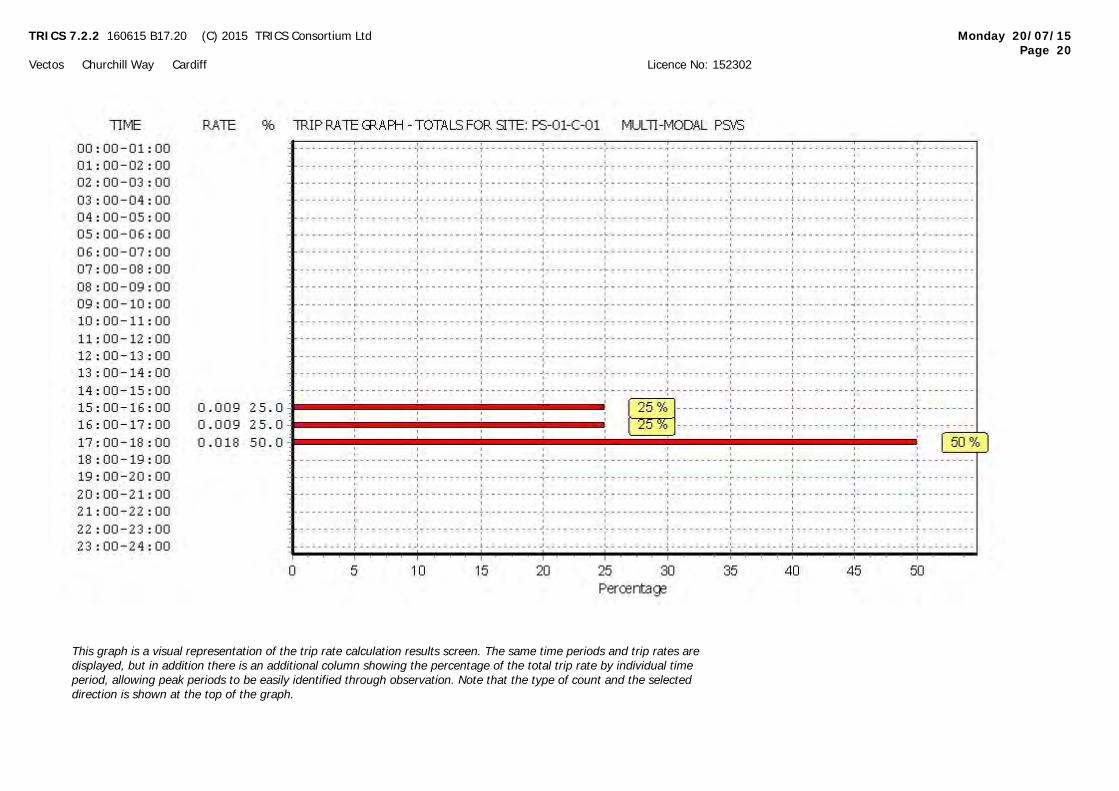
TRICS 7.2.2 160615 B17.20 (C) 2015 TRICS Consortium Ltd Monday 20/07/15
Page 20
Vectos Churchill Way Cardiff Licence No: 152302
This graph is a visual representation of the trip rate calculation results screen. The same time periods and trip rates are
displayed, but in addition there is an additional column showing the percentage of the total trip rate by individual time
period, allowing peak periods to be easily identified through observation. Note that the type of count and the selected
direction is shown at the top of the graph.

TRICS 7.2.2 160615 B17.20 (C) 2015 TRICS Consortium Ltd Monday 20/07/15
Page 21
Vectos Churchill Way Cardiff Licence No: 152302
TRIP RATE for Land Use 01 - RETAIL/C - DISCOUNT FOOD STORESMULTI-MODAL CYCLISTS
Calculation factor: 100 sqm
BOLD print indicates peak (busiest) period
ARRIVALS DEPARTURES TOTALSNo. Ave. Trip No. Ave. Trip No. Ave. Trip
Time Range Days GFA Rate Days GFA Rate Days GFA Rate00:00 - 01:0001:00 - 02:0002:00 - 03:0003:00 - 04:0004:00 - 05:0005:00 - 06:0006:00 - 07:00
5 1460 0.000 5 1460 0.000 5 1460 0.00007:00 - 08:008 1393 0.018 8 1393 0.027 8 1393 0.04508:00 - 09:008 1393 0.063 8 1393 0.072 8 1393 0.13509:00 - 10:008 1393 0.036 8 1393 0.036 8 1393 0.07210:00 - 11:008 1393 0.054 8 1393 0.018 8 1393 0.07211:00 - 12:008 1393 0.045 8 1393 0.045 8 1393 0.09012:00 - 13:008 1393 0.063 8 1393 0.063 8 1393 0.12613:00 - 14:008 1393 0.054 8 1393 0.054 8 1393 0.10814:00 - 15:008 1393 0.063 8 1393 0.045 8 1393 0.10815:00 - 16:008 1393 0.090 8 1393 0.099 8 1393 0.18916:00 - 17:008 1393 0.099 8 1393 0.117 8 1393 0.21617:00 - 18:008 1393 0.018 8 1393 0.009 8 1393 0.02718:00 - 19:008 1393 0.018 8 1393 0.027 8 1393 0.04519:00 - 20:004 1411 0.000 4 1411 0.018 4 1411 0.01820:00 - 21:002 1404 0.000 2 1404 0.000 2 1404 0.00021:00 - 22:00
22:00 - 23:0023:00 - 24:00
Total Rates: 0.621 0.630 1.251
This section displays the trip rate results based on the selected set of surveys and the selected count type (shown just
above the table). It is split by three main columns, representing arrivals trips, departures trips, and total trips (arrivals plus
departures). Within each of these main columns are three sub-columns. These display the number of survey days where
count data is included (per time period), the average value of the selected trip rate calculation parameter (per time
period), and the trip rate result (per time period). Total trip rates (the sum of the column) are also displayed at the foot of
the table.
To obtain a trip rate, the average (mean) trip rate parameter value (TRP) is first calculated for all selected survey days
that have count data available for the stated time period. The average (mean) number of arrivals, departures or totals
(whichever applies) is also calculated (COUNT) for all selected survey days that have count data available for the stated
time period. Then, the average count is divided by the average trip rate parameter value, and multiplied by the stated
calculation factor (shown just above the table and abbreviated here as FACT). So, the method is: COUNT/TRP*FACT. Trip
rates are then rounded to 3 decimal places.
Parameter summary
Trip rate parameter range selected: 1150 - 1900 (units: sqm)Survey date date range: 01/01/07 - 27/11/12Number of weekdays (Monday-Friday): 8Number of Saturdays: 0Number of Sundays: 0Surveys manually removed from selection: 0
This section displays a quick summary of some of the data filtering selections made by the TRICS® user. The trip rate
calculation parameter range of all selected surveys is displayed first, followed by the range of minimum and maximum
survey dates selected by the user. Then, the total number of selected weekdays and weekend days in the selected set of
surveys are show. Finally, the number of survey days that have been manually removed from the selected set outside of
the standard filtering procedure are displayed.
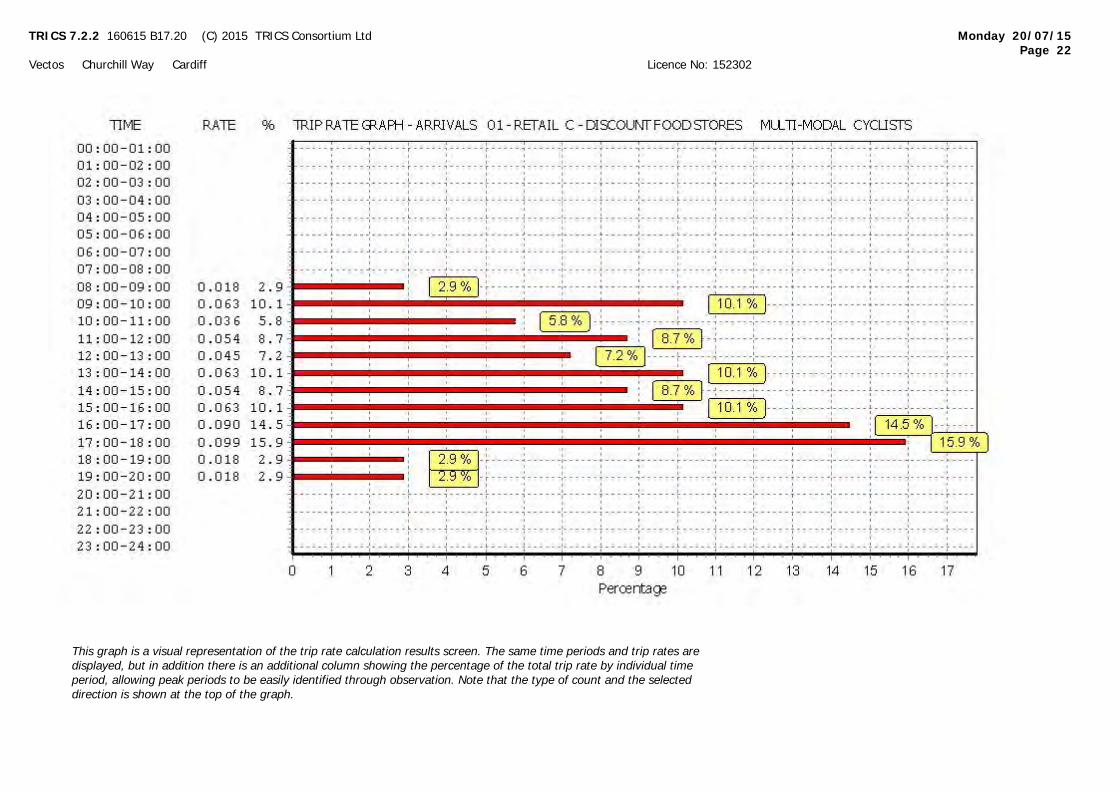
TRICS 7.2.2 160615 B17.20 (C) 2015 TRICS Consortium Ltd Monday 20/07/15
Page 22
Vectos Churchill Way Cardiff Licence No: 152302
This graph is a visual representation of the trip rate calculation results screen. The same time periods and trip rates are
displayed, but in addition there is an additional column showing the percentage of the total trip rate by individual time
period, allowing peak periods to be easily identified through observation. Note that the type of count and the selected
direction is shown at the top of the graph.
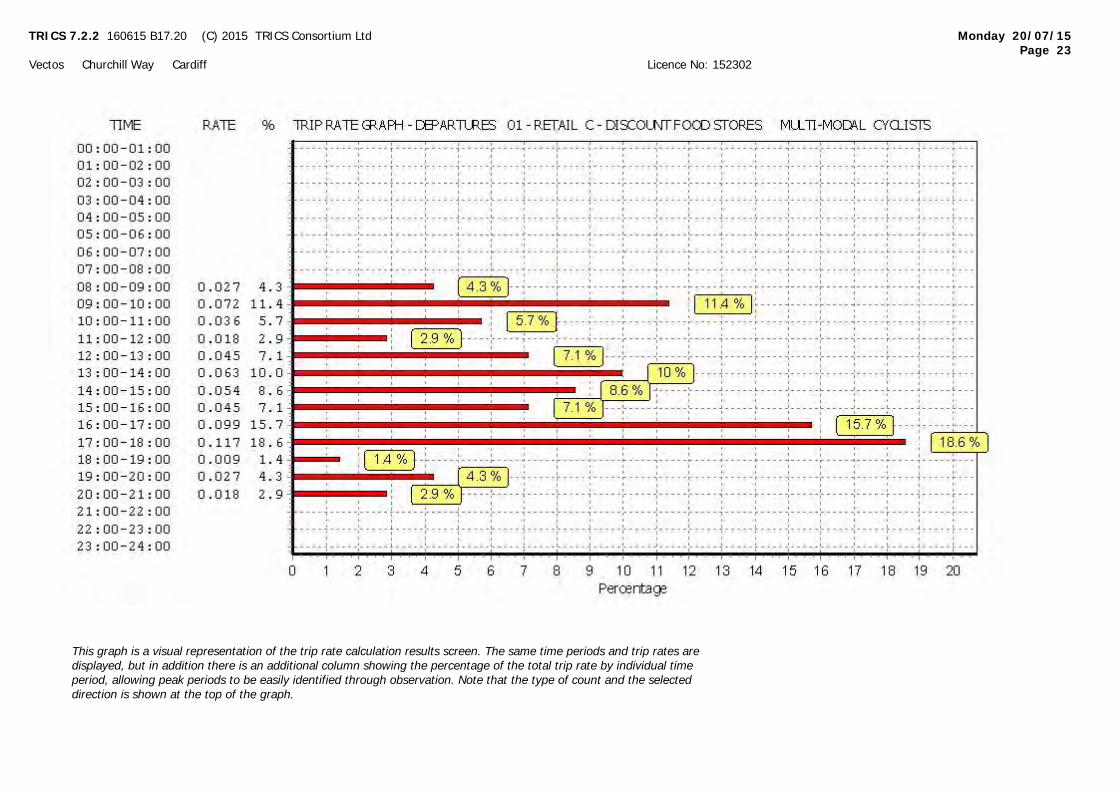
TRICS 7.2.2 160615 B17.20 (C) 2015 TRICS Consortium Ltd Monday 20/07/15
Page 23
Vectos Churchill Way Cardiff Licence No: 152302
This graph is a visual representation of the trip rate calculation results screen. The same time periods and trip rates are
displayed, but in addition there is an additional column showing the percentage of the total trip rate by individual time
period, allowing peak periods to be easily identified through observation. Note that the type of count and the selected
direction is shown at the top of the graph.
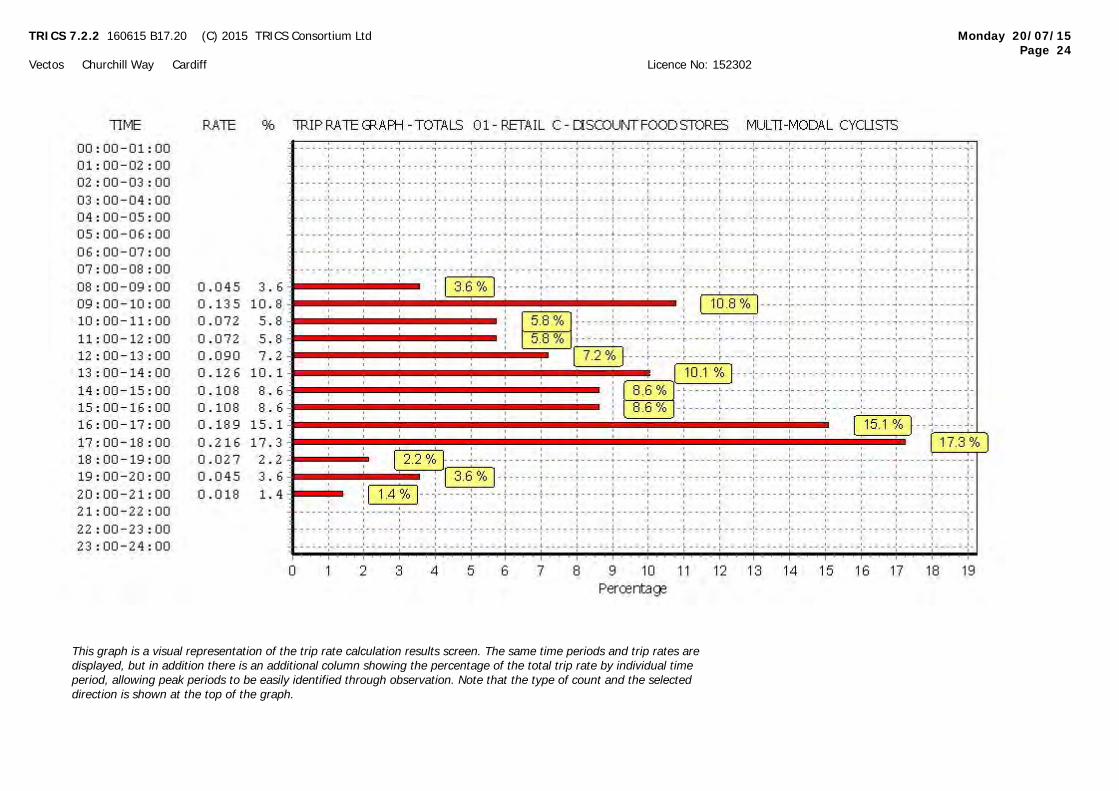
TRICS 7.2.2 160615 B17.20 (C) 2015 TRICS Consortium Ltd Monday 20/07/15
Page 24
Vectos Churchill Way Cardiff Licence No: 152302
This graph is a visual representation of the trip rate calculation results screen. The same time periods and trip rates are
displayed, but in addition there is an additional column showing the percentage of the total trip rate by individual time
period, allowing peak periods to be easily identified through observation. Note that the type of count and the selected
direction is shown at the top of the graph.

TRICS 7.2.2 160615 B17.20 (C) 2015 TRICS Consortium Ltd Monday 20/07/15
Page 25
Vectos Churchill Way Cardiff Licence No: 152302
TRIP RATE for Land Use 01 - RETAIL/C - DISCOUNT FOOD STORESMULTI-MODAL VEHICLE OCCUPANTS
Calculation factor: 100 sqm
BOLD print indicates peak (busiest) period
ARRIVALS DEPARTURES TOTALSNo. Ave. Trip No. Ave. Trip No. Ave. Trip
Time Range Days GFA Rate Days GFA Rate Days GFA Rate00:00 - 01:0001:00 - 02:0002:00 - 03:0003:00 - 04:0004:00 - 05:0005:00 - 06:0006:00 - 07:00
5 1460 0.370 5 1460 0.123 5 1460 0.49307:00 - 08:008 1393 1.176 8 1393 0.700 8 1393 1.87608:00 - 09:008 1393 2.746 8 1393 1.902 8 1393 4.64809:00 - 10:008 1393 4.496 8 1393 3.607 8 1393 8.10310:00 - 11:008 1393 4.469 8 1393 4.191 8 1393 8.66011:00 - 12:008 1393 4.235 8 1393 4.585 8 1393 8.82012:00 - 13:008 1393 3.715 8 1393 3.975 8 1393 7.69013:00 - 14:008 1393 5.196 8 1393 5.088 8 1393 10.28414:00 - 15:008 1393 5.662 8 1393 5.537 8 1393 11.19915:00 - 16:008 1393 4.469 8 1393 4.792 8 1393 9.26116:00 - 17:008 1393 4.424 8 1393 4.944 8 1393 9.36817:00 - 18:008 1393 3.410 8 1393 3.877 8 1393 7.28718:00 - 19:008 1393 1.382 8 1393 1.911 8 1393 3.29319:00 - 20:004 1411 0.372 4 1411 0.478 4 1411 0.85020:00 - 21:002 1404 0.143 2 1404 0.143 2 1404 0.28621:00 - 22:00
22:00 - 23:0023:00 - 24:00
Total Rates: 4 6.265 4 5.853 9 2.118
This section displays the trip rate results based on the selected set of surveys and the selected count type (shown just
above the table). It is split by three main columns, representing arrivals trips, departures trips, and total trips (arrivals plus
departures). Within each of these main columns are three sub-columns. These display the number of survey days where
count data is included (per time period), the average value of the selected trip rate calculation parameter (per time
period), and the trip rate result (per time period). Total trip rates (the sum of the column) are also displayed at the foot of
the table.
To obtain a trip rate, the average (mean) trip rate parameter value (TRP) is first calculated for all selected survey days
that have count data available for the stated time period. The average (mean) number of arrivals, departures or totals
(whichever applies) is also calculated (COUNT) for all selected survey days that have count data available for the stated
time period. Then, the average count is divided by the average trip rate parameter value, and multiplied by the stated
calculation factor (shown just above the table and abbreviated here as FACT). So, the method is: COUNT/TRP*FACT. Trip
rates are then rounded to 3 decimal places.
Parameter summary
Trip rate parameter range selected: 1150 - 1900 (units: sqm)Survey date date range: 01/01/07 - 27/11/12Number of weekdays (Monday-Friday): 8Number of Saturdays: 0Number of Sundays: 0Surveys manually removed from selection: 0
This section displays a quick summary of some of the data filtering selections made by the TRICS® user. The trip rate
calculation parameter range of all selected surveys is displayed first, followed by the range of minimum and maximum
survey dates selected by the user. Then, the total number of selected weekdays and weekend days in the selected set of
surveys are show. Finally, the number of survey days that have been manually removed from the selected set outside of
the standard filtering procedure are displayed.
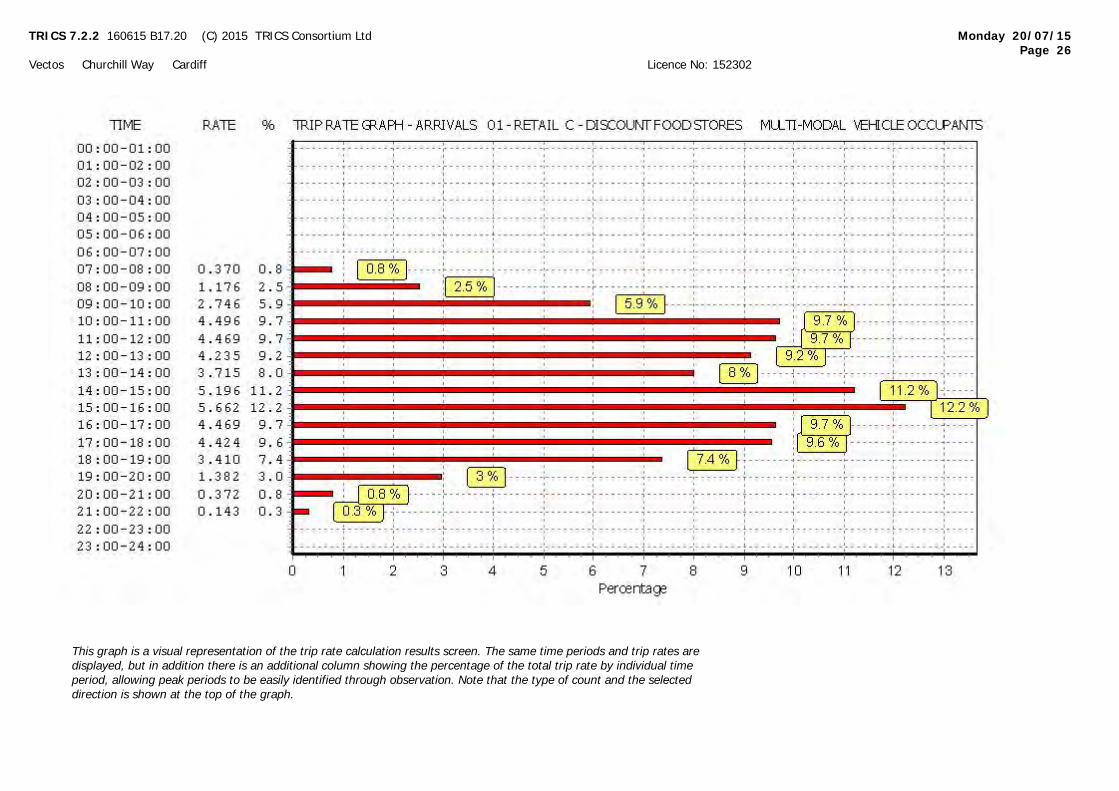
TRICS 7.2.2 160615 B17.20 (C) 2015 TRICS Consortium Ltd Monday 20/07/15
Page 26
Vectos Churchill Way Cardiff Licence No: 152302
This graph is a visual representation of the trip rate calculation results screen. The same time periods and trip rates are
displayed, but in addition there is an additional column showing the percentage of the total trip rate by individual time
period, allowing peak periods to be easily identified through observation. Note that the type of count and the selected
direction is shown at the top of the graph.
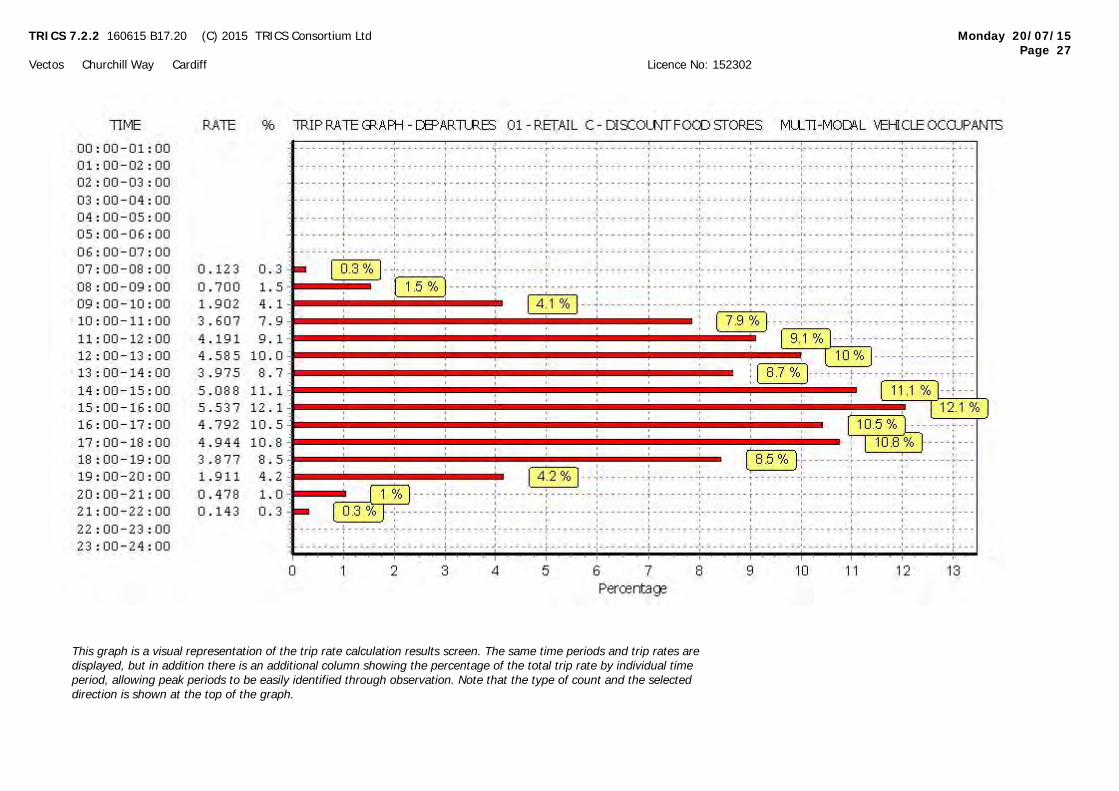
TRICS 7.2.2 160615 B17.20 (C) 2015 TRICS Consortium Ltd Monday 20/07/15
Page 27
Vectos Churchill Way Cardiff Licence No: 152302
This graph is a visual representation of the trip rate calculation results screen. The same time periods and trip rates are
displayed, but in addition there is an additional column showing the percentage of the total trip rate by individual time
period, allowing peak periods to be easily identified through observation. Note that the type of count and the selected
direction is shown at the top of the graph.
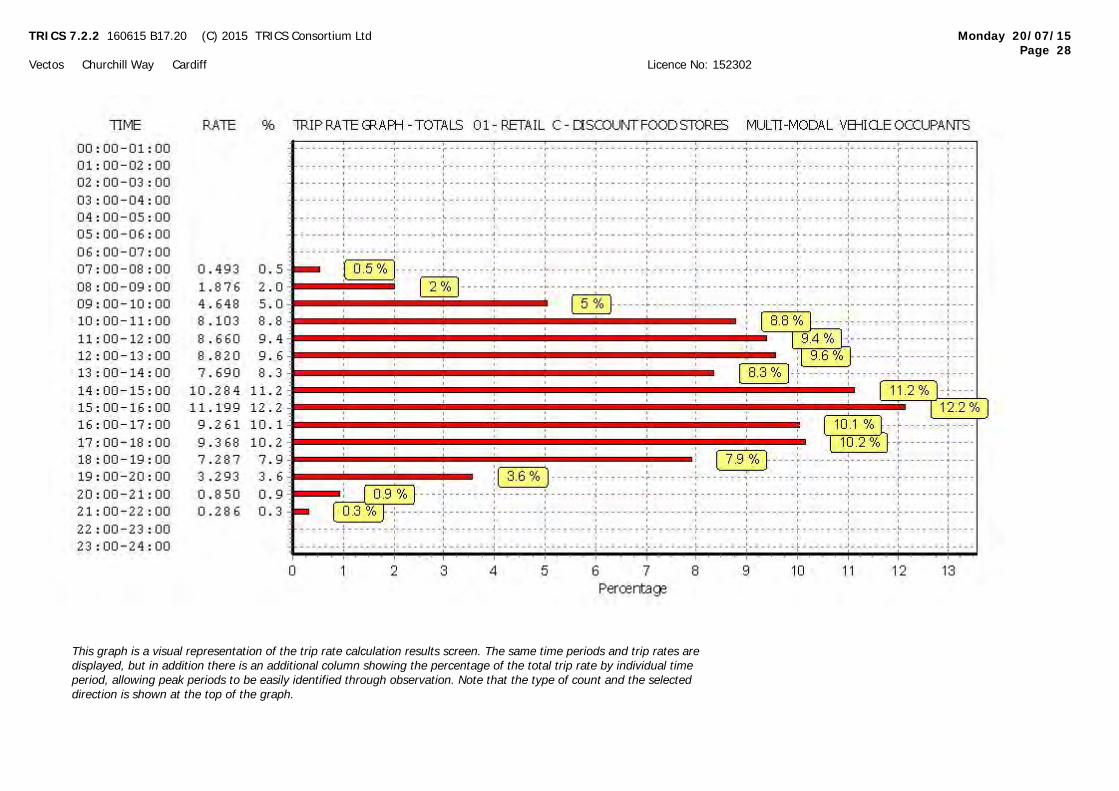
TRICS 7.2.2 160615 B17.20 (C) 2015 TRICS Consortium Ltd Monday 20/07/15
Page 28
Vectos Churchill Way Cardiff Licence No: 152302
This graph is a visual representation of the trip rate calculation results screen. The same time periods and trip rates are
displayed, but in addition there is an additional column showing the percentage of the total trip rate by individual time
period, allowing peak periods to be easily identified through observation. Note that the type of count and the selected
direction is shown at the top of the graph.
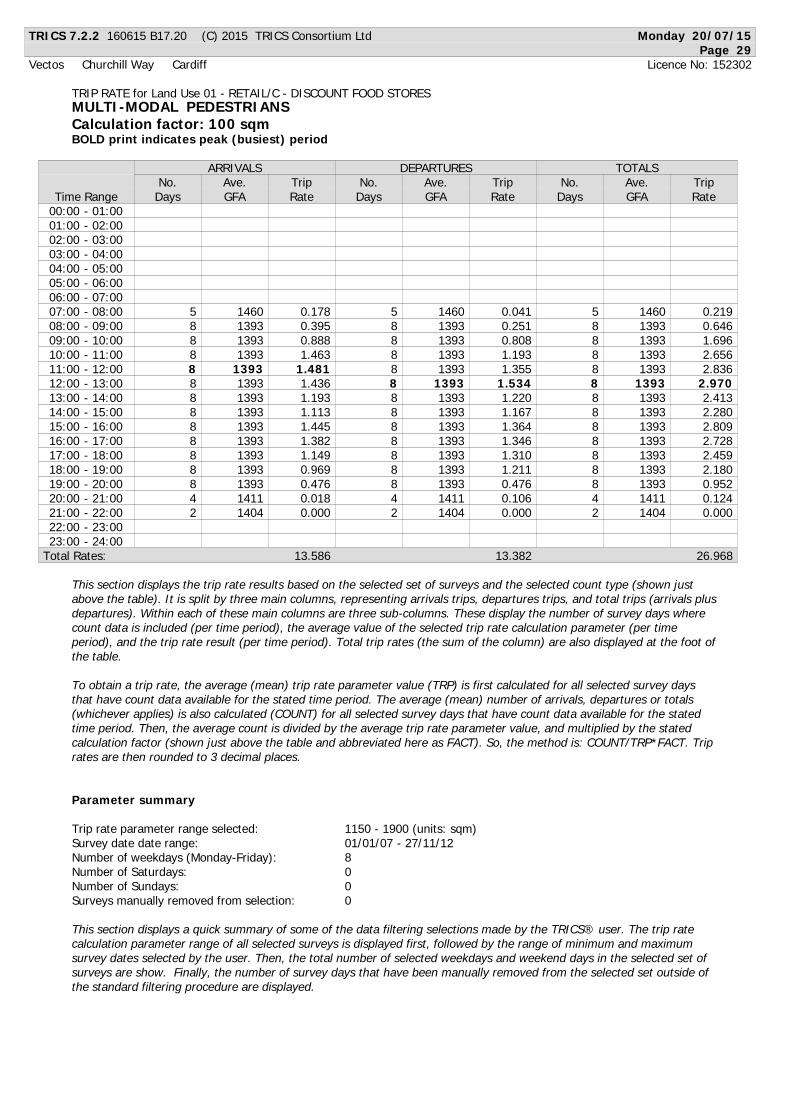
TRICS 7.2.2 160615 B17.20 (C) 2015 TRICS Consortium Ltd Monday 20/07/15
Page 29
Vectos Churchill Way Cardiff Licence No: 152302
TRIP RATE for Land Use 01 - RETAIL/C - DISCOUNT FOOD STORESMULTI-MODAL PEDESTRIANS
Calculation factor: 100 sqm
BOLD print indicates peak (busiest) period
ARRIVALS DEPARTURES TOTALSNo. Ave. Trip No. Ave. Trip No. Ave. Trip
Time Range Days GFA Rate Days GFA Rate Days GFA Rate00:00 - 01:0001:00 - 02:0002:00 - 03:0003:00 - 04:0004:00 - 05:0005:00 - 06:0006:00 - 07:00
5 1460 0.178 5 1460 0.041 5 1460 0.21907:00 - 08:008 1393 0.395 8 1393 0.251 8 1393 0.64608:00 - 09:008 1393 0.888 8 1393 0.808 8 1393 1.69609:00 - 10:008 1393 1.463 8 1393 1.193 8 1393 2.65610:00 - 11:008 1393 1.481 8 1393 1.355 8 1393 2.83611:00 - 12:008 1393 1.436 8 1393 1.534 8 1393 2.97012:00 - 13:008 1393 1.193 8 1393 1.220 8 1393 2.41313:00 - 14:008 1393 1.113 8 1393 1.167 8 1393 2.28014:00 - 15:008 1393 1.445 8 1393 1.364 8 1393 2.80915:00 - 16:008 1393 1.382 8 1393 1.346 8 1393 2.72816:00 - 17:008 1393 1.149 8 1393 1.310 8 1393 2.45917:00 - 18:008 1393 0.969 8 1393 1.211 8 1393 2.18018:00 - 19:008 1393 0.476 8 1393 0.476 8 1393 0.95219:00 - 20:004 1411 0.018 4 1411 0.106 4 1411 0.12420:00 - 21:002 1404 0.000 2 1404 0.000 2 1404 0.00021:00 - 22:00
22:00 - 23:0023:00 - 24:00
Total Rates: 1 3.586 1 3.382 2 6.968
This section displays the trip rate results based on the selected set of surveys and the selected count type (shown just
above the table). It is split by three main columns, representing arrivals trips, departures trips, and total trips (arrivals plus
departures). Within each of these main columns are three sub-columns. These display the number of survey days where
count data is included (per time period), the average value of the selected trip rate calculation parameter (per time
period), and the trip rate result (per time period). Total trip rates (the sum of the column) are also displayed at the foot of
the table.
To obtain a trip rate, the average (mean) trip rate parameter value (TRP) is first calculated for all selected survey days
that have count data available for the stated time period. The average (mean) number of arrivals, departures or totals
(whichever applies) is also calculated (COUNT) for all selected survey days that have count data available for the stated
time period. Then, the average count is divided by the average trip rate parameter value, and multiplied by the stated
calculation factor (shown just above the table and abbreviated here as FACT). So, the method is: COUNT/TRP*FACT. Trip
rates are then rounded to 3 decimal places.
Parameter summary
Trip rate parameter range selected: 1150 - 1900 (units: sqm)Survey date date range: 01/01/07 - 27/11/12Number of weekdays (Monday-Friday): 8Number of Saturdays: 0Number of Sundays: 0Surveys manually removed from selection: 0
This section displays a quick summary of some of the data filtering selections made by the TRICS® user. The trip rate
calculation parameter range of all selected surveys is displayed first, followed by the range of minimum and maximum
survey dates selected by the user. Then, the total number of selected weekdays and weekend days in the selected set of
surveys are show. Finally, the number of survey days that have been manually removed from the selected set outside of
the standard filtering procedure are displayed.
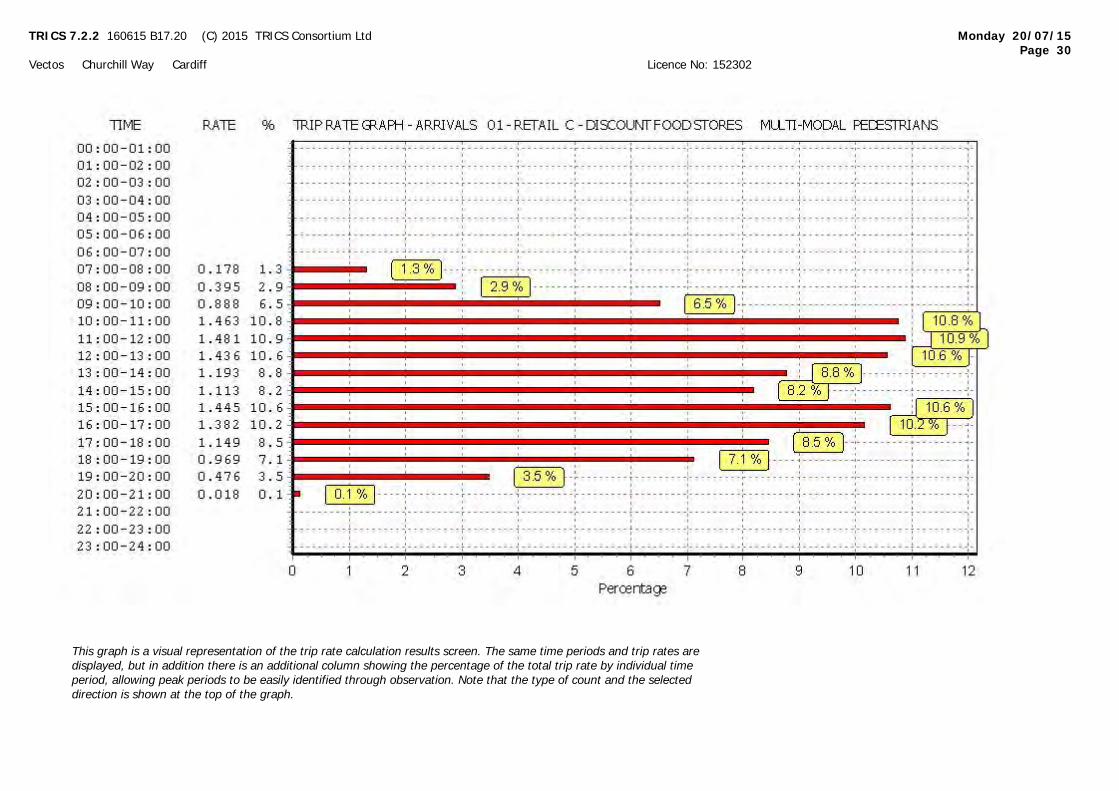
TRICS 7.2.2 160615 B17.20 (C) 2015 TRICS Consortium Ltd Monday 20/07/15
Page 30
Vectos Churchill Way Cardiff Licence No: 152302
This graph is a visual representation of the trip rate calculation results screen. The same time periods and trip rates are
displayed, but in addition there is an additional column showing the percentage of the total trip rate by individual time
period, allowing peak periods to be easily identified through observation. Note that the type of count and the selected
direction is shown at the top of the graph.
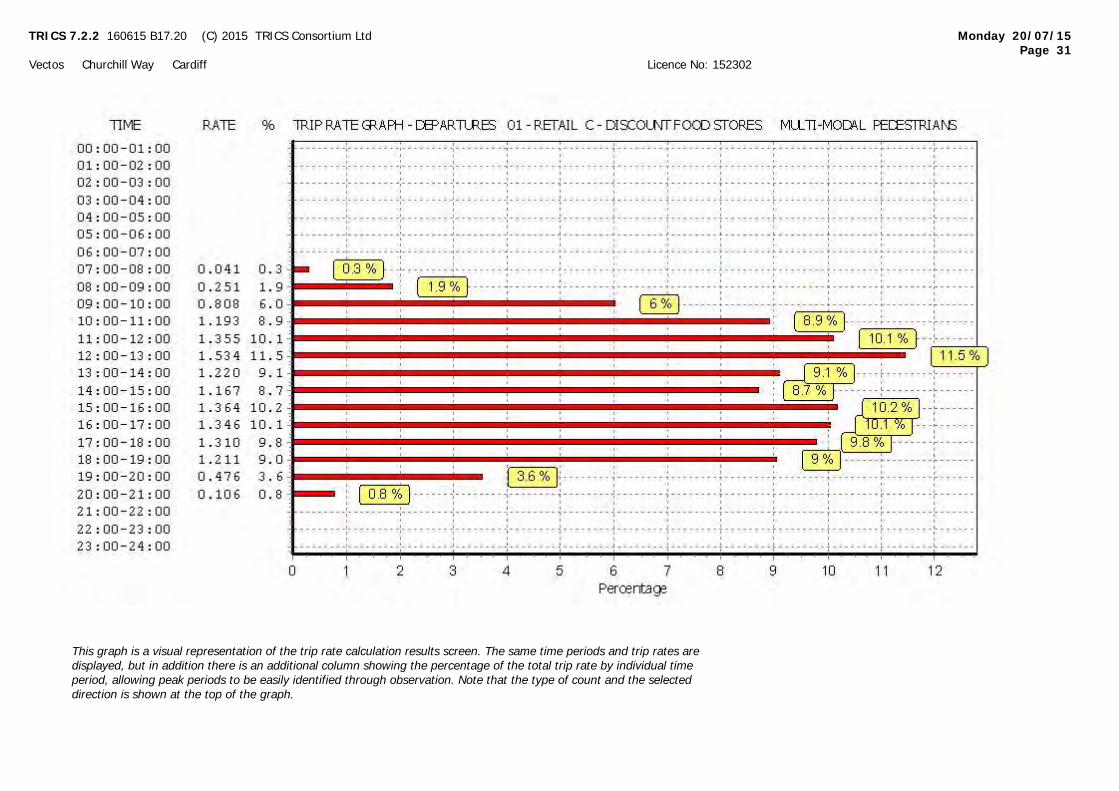
TRICS 7.2.2 160615 B17.20 (C) 2015 TRICS Consortium Ltd Monday 20/07/15
Page 31
Vectos Churchill Way Cardiff Licence No: 152302
This graph is a visual representation of the trip rate calculation results screen. The same time periods and trip rates are
displayed, but in addition there is an additional column showing the percentage of the total trip rate by individual time
period, allowing peak periods to be easily identified through observation. Note that the type of count and the selected
direction is shown at the top of the graph.

TRICS 7.2.2 160615 B17.20 (C) 2015 TRICS Consortium Ltd Monday 20/07/15
Page 32
Vectos Churchill Way Cardiff Licence No: 152302
This graph is a visual representation of the trip rate calculation results screen. The same time periods and trip rates are
displayed, but in addition there is an additional column showing the percentage of the total trip rate by individual time
period, allowing peak periods to be easily identified through observation. Note that the type of count and the selected
direction is shown at the top of the graph.

TRICS 7.2.2 160615 B17.20 (C) 2015 TRICS Consortium Ltd Monday 20/07/15
Page 33
Vectos Churchill Way Cardiff Licence No: 152302
TRIP RATE for Land Use 01 - RETAIL/C - DISCOUNT FOOD STORESMULTI-MODAL BUS/TRAM PASSENGERS
Calculation factor: 100 sqm
BOLD print indicates peak (busiest) period
ARRIVALS DEPARTURES TOTALSNo. Ave. Trip No. Ave. Trip No. Ave. Trip
Time Range Days GFA Rate Days GFA Rate Days GFA Rate00:00 - 01:0001:00 - 02:0002:00 - 03:0003:00 - 04:0004:00 - 05:0005:00 - 06:0006:00 - 07:00
5 1460 0.041 5 1460 0.000 5 1460 0.04107:00 - 08:008 1393 0.072 8 1393 0.036 8 1393 0.10808:00 - 09:008 1393 0.170 8 1393 0.135 8 1393 0.30509:00 - 10:008 1393 0.305 8 1393 0.278 8 1393 0.58310:00 - 11:008 1393 0.197 8 1393 0.206 8 1393 0.40311:00 - 12:008 1393 0.242 8 1393 0.287 8 1393 0.52912:00 - 13:008 1393 0.179 8 1393 0.206 8 1393 0.38513:00 - 14:008 1393 0.108 8 1393 0.144 8 1393 0.25214:00 - 15:008 1393 0.260 8 1393 0.179 8 1393 0.43915:00 - 16:008 1393 0.144 8 1393 0.224 8 1393 0.36816:00 - 17:008 1393 0.072 8 1393 0.117 8 1393 0.18917:00 - 18:008 1393 0.054 8 1393 0.063 8 1393 0.11718:00 - 19:008 1393 0.009 8 1393 0.027 8 1393 0.03619:00 - 20:004 1411 0.000 4 1411 0.000 4 1411 0.00020:00 - 21:002 1404 0.000 2 1404 0.000 2 1404 0.00021:00 - 22:00
22:00 - 23:0023:00 - 24:00
Total Rates: 1.853 1.902 3.755
This section displays the trip rate results based on the selected set of surveys and the selected count type (shown just
above the table). It is split by three main columns, representing arrivals trips, departures trips, and total trips (arrivals plus
departures). Within each of these main columns are three sub-columns. These display the number of survey days where
count data is included (per time period), the average value of the selected trip rate calculation parameter (per time
period), and the trip rate result (per time period). Total trip rates (the sum of the column) are also displayed at the foot of
the table.
To obtain a trip rate, the average (mean) trip rate parameter value (TRP) is first calculated for all selected survey days
that have count data available for the stated time period. The average (mean) number of arrivals, departures or totals
(whichever applies) is also calculated (COUNT) for all selected survey days that have count data available for the stated
time period. Then, the average count is divided by the average trip rate parameter value, and multiplied by the stated
calculation factor (shown just above the table and abbreviated here as FACT). So, the method is: COUNT/TRP*FACT. Trip
rates are then rounded to 3 decimal places.
Parameter summary
Trip rate parameter range selected: 1150 - 1900 (units: sqm)Survey date date range: 01/01/07 - 27/11/12Number of weekdays (Monday-Friday): 8Number of Saturdays: 0Number of Sundays: 0Surveys manually removed from selection: 0
This section displays a quick summary of some of the data filtering selections made by the TRICS® user. The trip rate
calculation parameter range of all selected surveys is displayed first, followed by the range of minimum and maximum
survey dates selected by the user. Then, the total number of selected weekdays and weekend days in the selected set of
surveys are show. Finally, the number of survey days that have been manually removed from the selected set outside of
the standard filtering procedure are displayed.
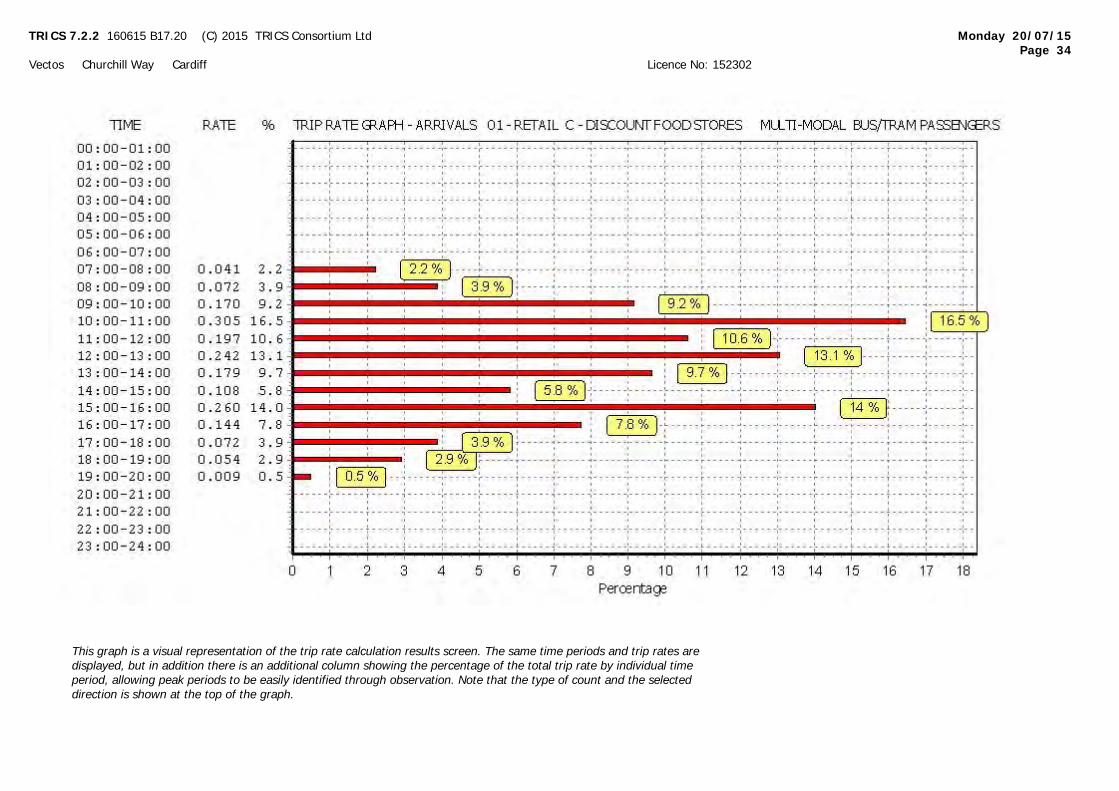
TRICS 7.2.2 160615 B17.20 (C) 2015 TRICS Consortium Ltd Monday 20/07/15
Page 34
Vectos Churchill Way Cardiff Licence No: 152302
This graph is a visual representation of the trip rate calculation results screen. The same time periods and trip rates are
displayed, but in addition there is an additional column showing the percentage of the total trip rate by individual time
period, allowing peak periods to be easily identified through observation. Note that the type of count and the selected
direction is shown at the top of the graph.
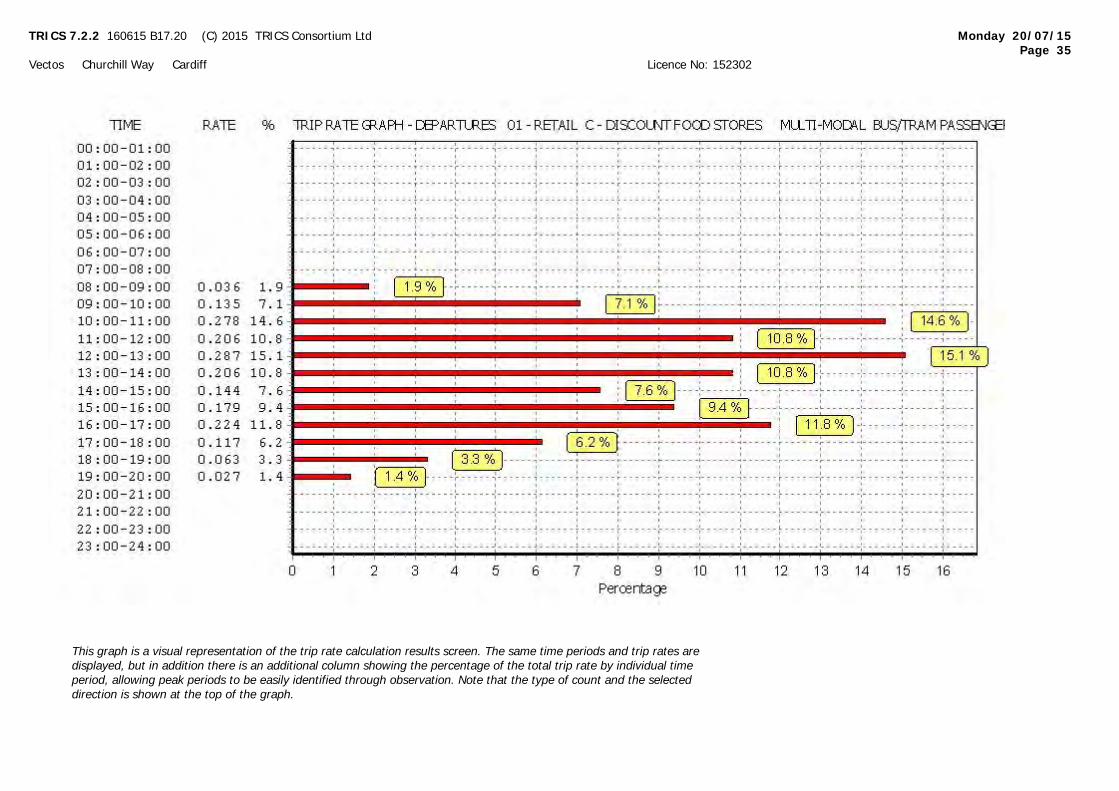
TRICS 7.2.2 160615 B17.20 (C) 2015 TRICS Consortium Ltd Monday 20/07/15
Page 35
Vectos Churchill Way Cardiff Licence No: 152302
This graph is a visual representation of the trip rate calculation results screen. The same time periods and trip rates are
displayed, but in addition there is an additional column showing the percentage of the total trip rate by individual time
period, allowing peak periods to be easily identified through observation. Note that the type of count and the selected
direction is shown at the top of the graph.
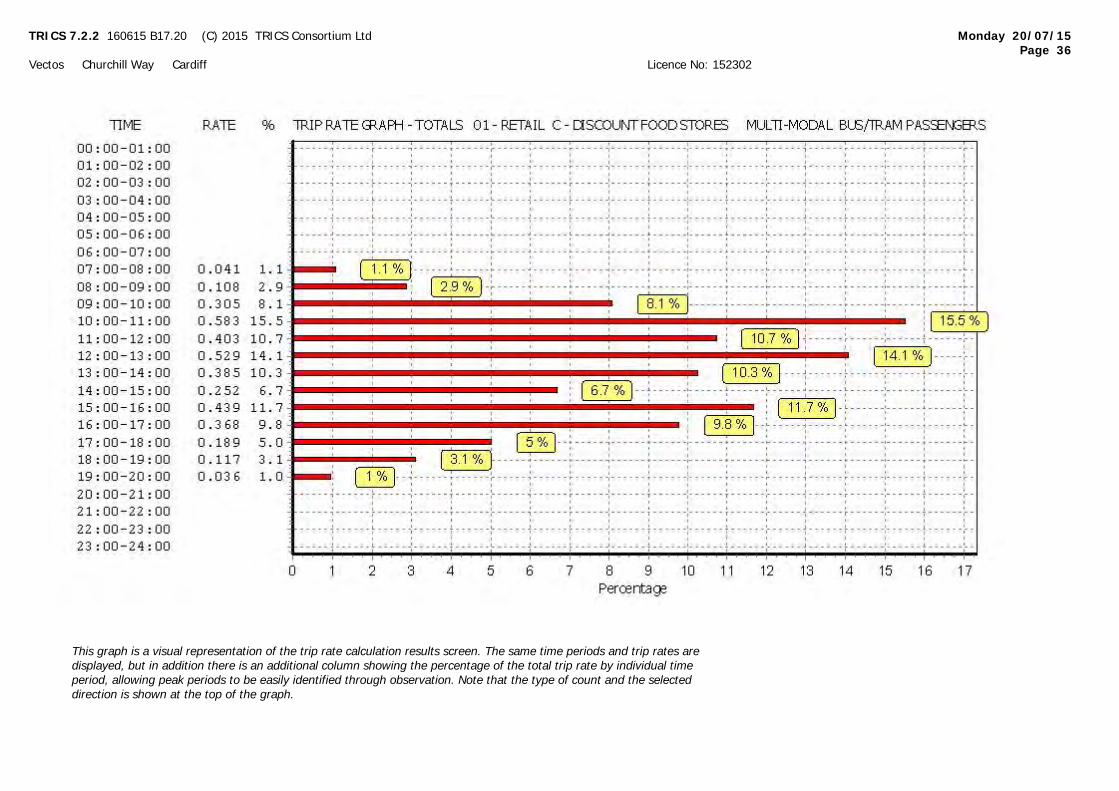
TRICS 7.2.2 160615 B17.20 (C) 2015 TRICS Consortium Ltd Monday 20/07/15
Page 36
Vectos Churchill Way Cardiff Licence No: 152302
This graph is a visual representation of the trip rate calculation results screen. The same time periods and trip rates are
displayed, but in addition there is an additional column showing the percentage of the total trip rate by individual time
period, allowing peak periods to be easily identified through observation. Note that the type of count and the selected
direction is shown at the top of the graph.
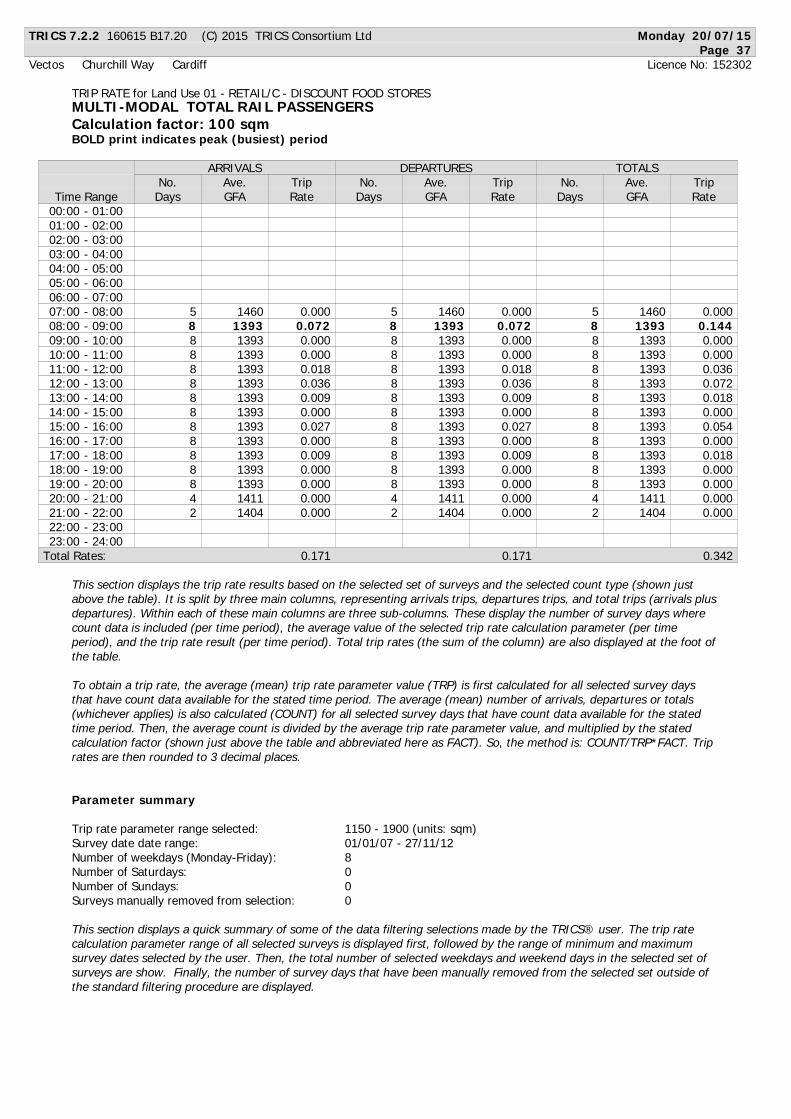
TRICS 7.2.2 160615 B17.20 (C) 2015 TRICS Consortium Ltd Monday 20/07/15
Page 37
Vectos Churchill Way Cardiff Licence No: 152302
TRIP RATE for Land Use 01 - RETAIL/C - DISCOUNT FOOD STORESMULTI-MODAL TOTAL RAIL PASSENGERS
Calculation factor: 100 sqm
BOLD print indicates peak (busiest) period
ARRIVALS DEPARTURES TOTALSNo. Ave. Trip No. Ave. Trip No. Ave. Trip
Time Range Days GFA Rate Days GFA Rate Days GFA Rate00:00 - 01:0001:00 - 02:0002:00 - 03:0003:00 - 04:0004:00 - 05:0005:00 - 06:0006:00 - 07:00
5 1460 0.000 5 1460 0.000 5 1460 0.00007:00 - 08:008 1393 0.072 8 1393 0.072 8 1393 0.14408:00 - 09:008 1393 0.000 8 1393 0.000 8 1393 0.00009:00 - 10:008 1393 0.000 8 1393 0.000 8 1393 0.00010:00 - 11:008 1393 0.018 8 1393 0.018 8 1393 0.03611:00 - 12:008 1393 0.036 8 1393 0.036 8 1393 0.07212:00 - 13:008 1393 0.009 8 1393 0.009 8 1393 0.01813:00 - 14:008 1393 0.000 8 1393 0.000 8 1393 0.00014:00 - 15:008 1393 0.027 8 1393 0.027 8 1393 0.05415:00 - 16:008 1393 0.000 8 1393 0.000 8 1393 0.00016:00 - 17:008 1393 0.009 8 1393 0.009 8 1393 0.01817:00 - 18:008 1393 0.000 8 1393 0.000 8 1393 0.00018:00 - 19:008 1393 0.000 8 1393 0.000 8 1393 0.00019:00 - 20:004 1411 0.000 4 1411 0.000 4 1411 0.00020:00 - 21:002 1404 0.000 2 1404 0.000 2 1404 0.00021:00 - 22:00
22:00 - 23:0023:00 - 24:00
Total Rates: 0.171 0.171 0.342
This section displays the trip rate results based on the selected set of surveys and the selected count type (shown just
above the table). It is split by three main columns, representing arrivals trips, departures trips, and total trips (arrivals plus
departures). Within each of these main columns are three sub-columns. These display the number of survey days where
count data is included (per time period), the average value of the selected trip rate calculation parameter (per time
period), and the trip rate result (per time period). Total trip rates (the sum of the column) are also displayed at the foot of
the table.
To obtain a trip rate, the average (mean) trip rate parameter value (TRP) is first calculated for all selected survey days
that have count data available for the stated time period. The average (mean) number of arrivals, departures or totals
(whichever applies) is also calculated (COUNT) for all selected survey days that have count data available for the stated
time period. Then, the average count is divided by the average trip rate parameter value, and multiplied by the stated
calculation factor (shown just above the table and abbreviated here as FACT). So, the method is: COUNT/TRP*FACT. Trip
rates are then rounded to 3 decimal places.
Parameter summary
Trip rate parameter range selected: 1150 - 1900 (units: sqm)Survey date date range: 01/01/07 - 27/11/12Number of weekdays (Monday-Friday): 8Number of Saturdays: 0Number of Sundays: 0Surveys manually removed from selection: 0
This section displays a quick summary of some of the data filtering selections made by the TRICS® user. The trip rate
calculation parameter range of all selected surveys is displayed first, followed by the range of minimum and maximum
survey dates selected by the user. Then, the total number of selected weekdays and weekend days in the selected set of
surveys are show. Finally, the number of survey days that have been manually removed from the selected set outside of
the standard filtering procedure are displayed.
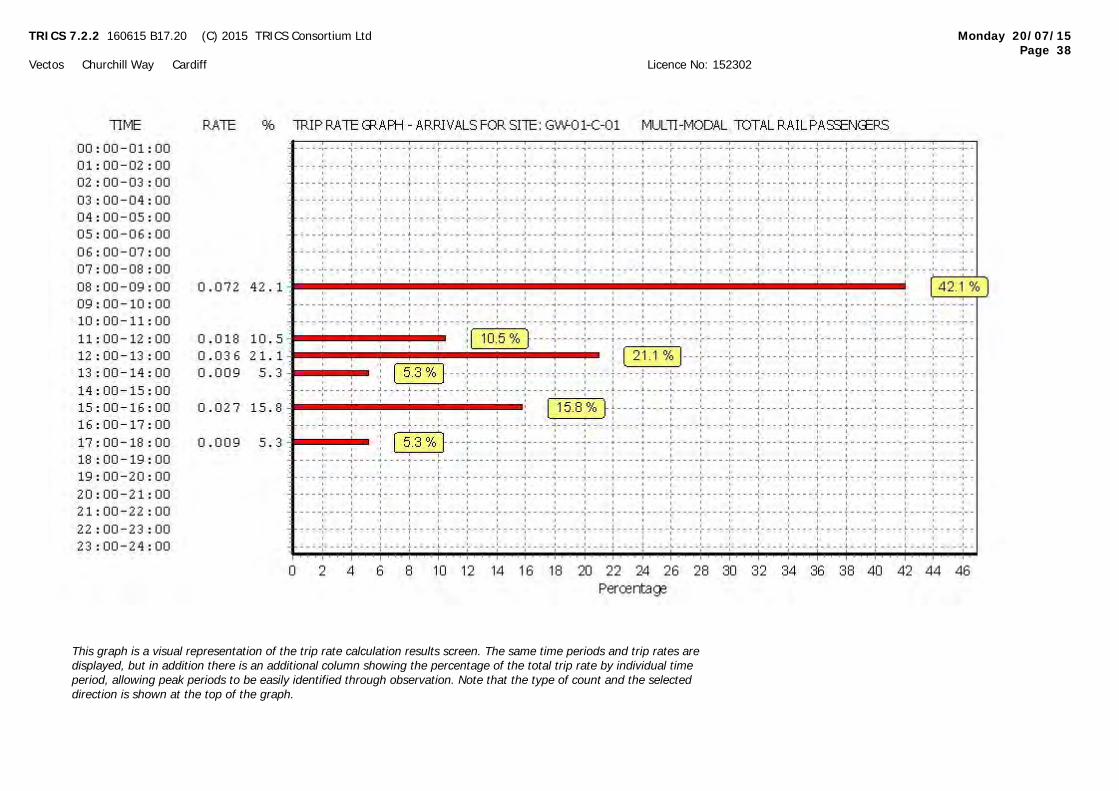
TRICS 7.2.2 160615 B17.20 (C) 2015 TRICS Consortium Ltd Monday 20/07/15
Page 38
Vectos Churchill Way Cardiff Licence No: 152302
This graph is a visual representation of the trip rate calculation results screen. The same time periods and trip rates are
displayed, but in addition there is an additional column showing the percentage of the total trip rate by individual time
period, allowing peak periods to be easily identified through observation. Note that the type of count and the selected
direction is shown at the top of the graph.

TRICS 7.2.2 160615 B17.20 (C) 2015 TRICS Consortium Ltd Monday 20/07/15
Page 39
Vectos Churchill Way Cardiff Licence No: 152302
This graph is a visual representation of the trip rate calculation results screen. The same time periods and trip rates are
displayed, but in addition there is an additional column showing the percentage of the total trip rate by individual time
period, allowing peak periods to be easily identified through observation. Note that the type of count and the selected
direction is shown at the top of the graph.
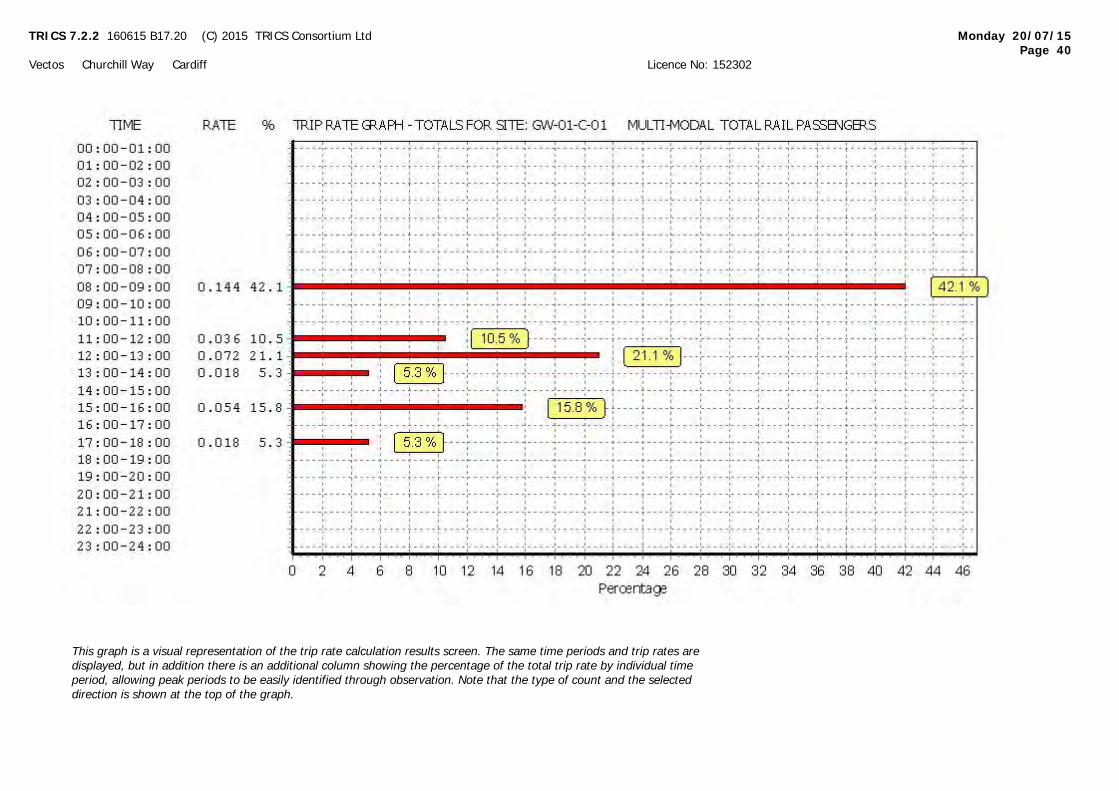
TRICS 7.2.2 160615 B17.20 (C) 2015 TRICS Consortium Ltd Monday 20/07/15
Page 40
Vectos Churchill Way Cardiff Licence No: 152302
This graph is a visual representation of the trip rate calculation results screen. The same time periods and trip rates are
displayed, but in addition there is an additional column showing the percentage of the total trip rate by individual time
period, allowing peak periods to be easily identified through observation. Note that the type of count and the selected
direction is shown at the top of the graph.

TRICS 7.2.2 160615 B17.20 (C) 2015 TRICS Consortium Ltd Monday 20/07/15
Page 41
Vectos Churchill Way Cardiff Licence No: 152302
TRIP RATE for Land Use 01 - RETAIL/C - DISCOUNT FOOD STORESMULTI-MODAL COACH PASSENGERS
Calculation factor: 100 sqm
BOLD print indicates peak (busiest) period
ARRIVALS DEPARTURES TOTALSNo. Ave. Trip No. Ave. Trip No. Ave. Trip
Time Range Days GFA Rate Days GFA Rate Days GFA Rate00:00 - 01:0001:00 - 02:0002:00 - 03:0003:00 - 04:0004:00 - 05:0005:00 - 06:0006:00 - 07:00
5 1460 0.000 5 1460 0.000 5 1460 0.00007:00 - 08:008 1393 0.000 8 1393 0.000 8 1393 0.00008:00 - 09:008 1393 0.000 8 1393 0.000 8 1393 0.00009:00 - 10:008 1393 0.000 8 1393 0.000 8 1393 0.00010:00 - 11:008 1393 0.000 8 1393 0.000 8 1393 0.00011:00 - 12:008 1393 0.000 8 1393 0.000 8 1393 0.00012:00 - 13:008 1393 0.000 8 1393 0.000 8 1393 0.00013:00 - 14:008 1393 0.000 8 1393 0.000 8 1393 0.00014:00 - 15:008 1393 0.054 8 1393 0.000 8 1393 0.05415:00 - 16:008 1393 0.000 8 1393 0.054 8 1393 0.05416:00 - 17:008 1393 0.036 8 1393 0.036 8 1393 0.07217:00 - 18:008 1393 0.000 8 1393 0.000 8 1393 0.00018:00 - 19:008 1393 0.000 8 1393 0.000 8 1393 0.00019:00 - 20:004 1411 0.000 4 1411 0.000 4 1411 0.00020:00 - 21:002 1404 0.000 2 1404 0.000 2 1404 0.00021:00 - 22:00
22:00 - 23:0023:00 - 24:00
Total Rates: 0.090 0.090 0.180
This section displays the trip rate results based on the selected set of surveys and the selected count type (shown just
above the table). It is split by three main columns, representing arrivals trips, departures trips, and total trips (arrivals plus
departures). Within each of these main columns are three sub-columns. These display the number of survey days where
count data is included (per time period), the average value of the selected trip rate calculation parameter (per time
period), and the trip rate result (per time period). Total trip rates (the sum of the column) are also displayed at the foot of
the table.
To obtain a trip rate, the average (mean) trip rate parameter value (TRP) is first calculated for all selected survey days
that have count data available for the stated time period. The average (mean) number of arrivals, departures or totals
(whichever applies) is also calculated (COUNT) for all selected survey days that have count data available for the stated
time period. Then, the average count is divided by the average trip rate parameter value, and multiplied by the stated
calculation factor (shown just above the table and abbreviated here as FACT). So, the method is: COUNT/TRP*FACT. Trip
rates are then rounded to 3 decimal places.
Parameter summary
Trip rate parameter range selected: 1150 - 1900 (units: sqm)Survey date date range: 01/01/07 - 27/11/12Number of weekdays (Monday-Friday): 8Number of Saturdays: 0Number of Sundays: 0Surveys manually removed from selection: 0
This section displays a quick summary of some of the data filtering selections made by the TRICS® user. The trip rate
calculation parameter range of all selected surveys is displayed first, followed by the range of minimum and maximum
survey dates selected by the user. Then, the total number of selected weekdays and weekend days in the selected set of
surveys are show. Finally, the number of survey days that have been manually removed from the selected set outside of
the standard filtering procedure are displayed.
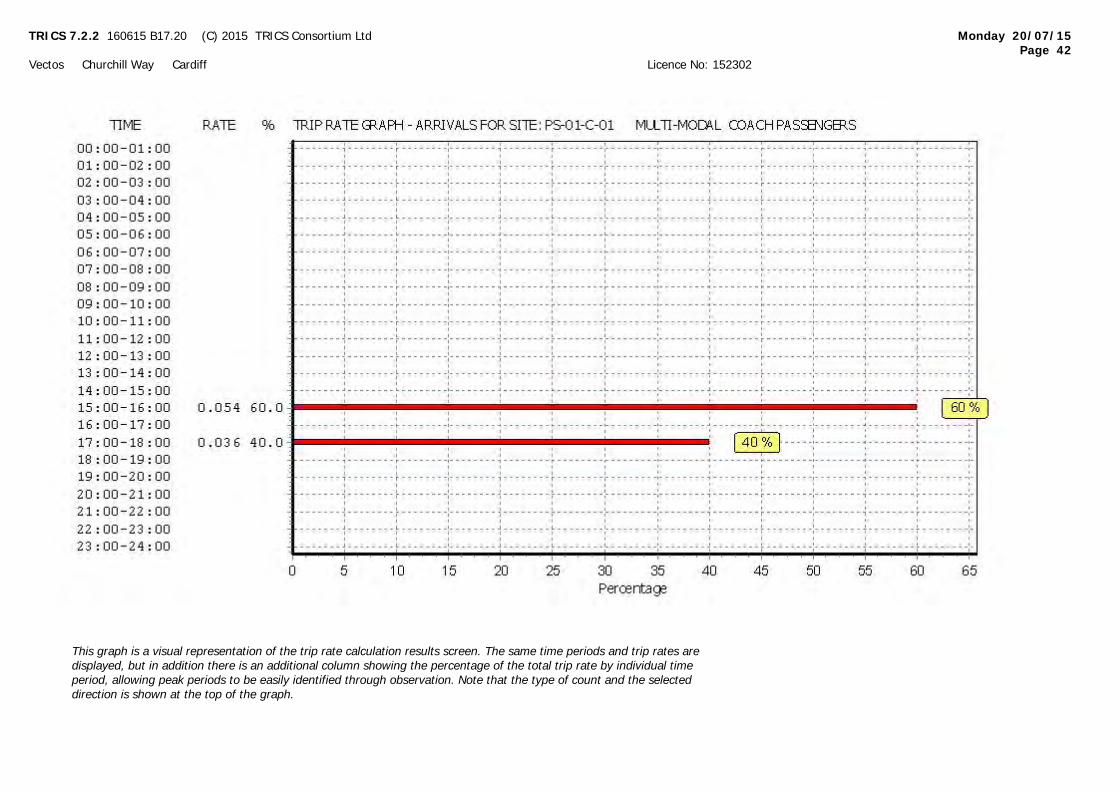
TRICS 7.2.2 160615 B17.20 (C) 2015 TRICS Consortium Ltd Monday 20/07/15
Page 42
Vectos Churchill Way Cardiff Licence No: 152302
This graph is a visual representation of the trip rate calculation results screen. The same time periods and trip rates are
displayed, but in addition there is an additional column showing the percentage of the total trip rate by individual time
period, allowing peak periods to be easily identified through observation. Note that the type of count and the selected
direction is shown at the top of the graph.
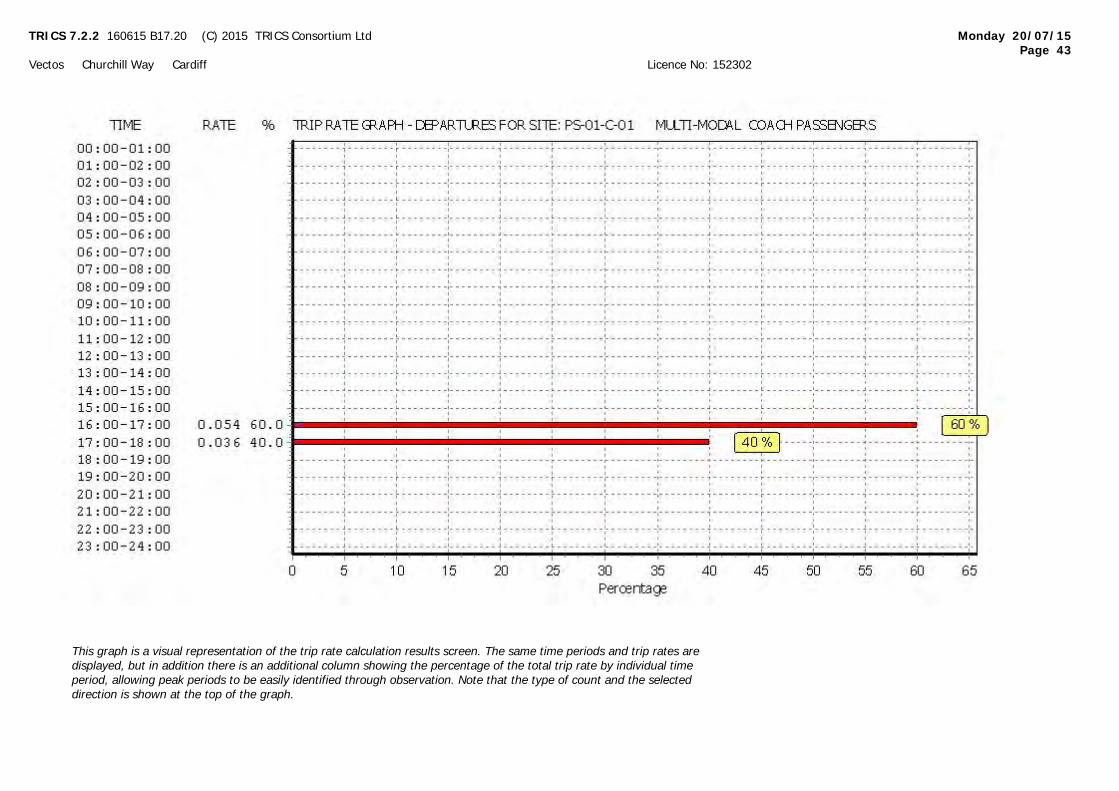
TRICS 7.2.2 160615 B17.20 (C) 2015 TRICS Consortium Ltd Monday 20/07/15
Page 43
Vectos Churchill Way Cardiff Licence No: 152302
This graph is a visual representation of the trip rate calculation results screen. The same time periods and trip rates are
displayed, but in addition there is an additional column showing the percentage of the total trip rate by individual time
period, allowing peak periods to be easily identified through observation. Note that the type of count and the selected
direction is shown at the top of the graph.
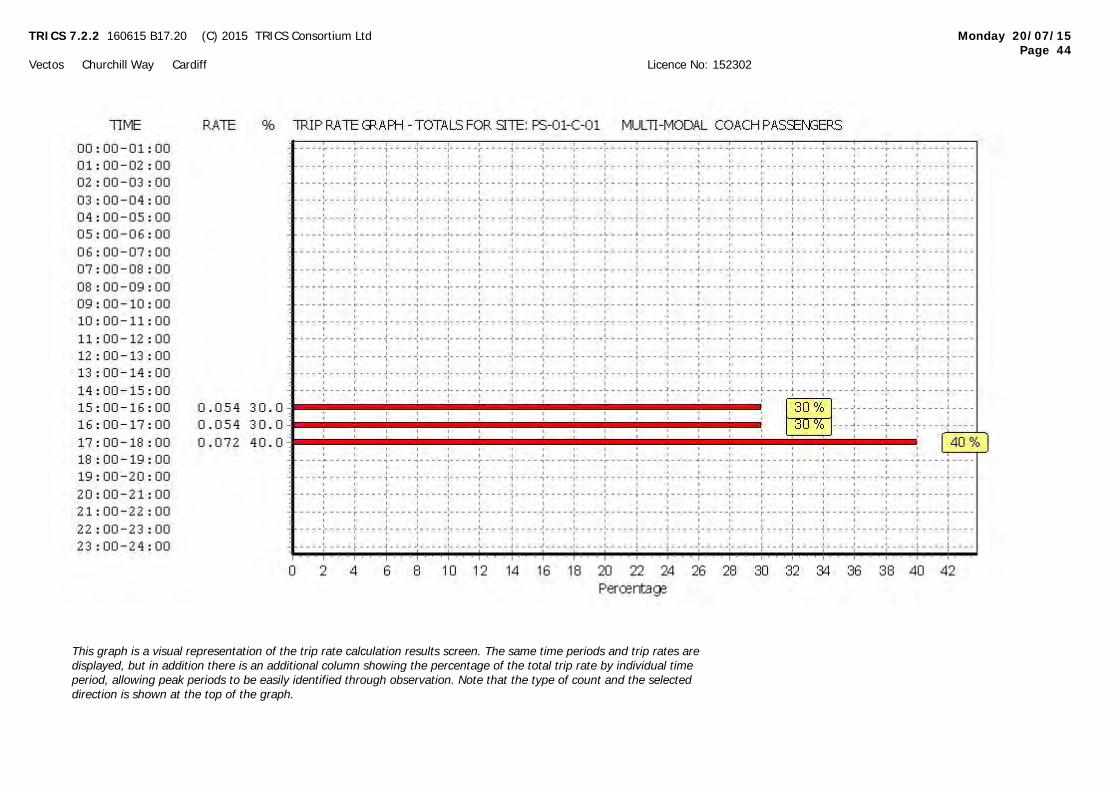
TRICS 7.2.2 160615 B17.20 (C) 2015 TRICS Consortium Ltd Monday 20/07/15
Page 44
Vectos Churchill Way Cardiff Licence No: 152302
This graph is a visual representation of the trip rate calculation results screen. The same time periods and trip rates are
displayed, but in addition there is an additional column showing the percentage of the total trip rate by individual time
period, allowing peak periods to be easily identified through observation. Note that the type of count and the selected
direction is shown at the top of the graph.

TRICS 7.2.2 160615 B17.20 (C) 2015 TRICS Consortium Ltd Monday 20/07/15
Page 45
Vectos Churchill Way Cardiff Licence No: 152302
TRIP RATE for Land Use 01 - RETAIL/C - DISCOUNT FOOD STORESMULTI-MODAL PUBLIC TRANSPORT USERS
Calculation factor: 100 sqm
BOLD print indicates peak (busiest) period
ARRIVALS DEPARTURES TOTALSNo. Ave. Trip No. Ave. Trip No. Ave. Trip
Time Range Days GFA Rate Days GFA Rate Days GFA Rate00:00 - 01:0001:00 - 02:0002:00 - 03:0003:00 - 04:0004:00 - 05:0005:00 - 06:0006:00 - 07:00
5 1460 0.041 5 1460 0.000 5 1460 0.04107:00 - 08:008 1393 0.144 8 1393 0.108 8 1393 0.25208:00 - 09:008 1393 0.170 8 1393 0.135 8 1393 0.30509:00 - 10:008 1393 0.305 8 1393 0.278 8 1393 0.58310:00 - 11:008 1393 0.215 8 1393 0.224 8 1393 0.43911:00 - 12:008 1393 0.278 8 1393 0.323 8 1393 0.60112:00 - 13:008 1393 0.188 8 1393 0.215 8 1393 0.40313:00 - 14:008 1393 0.108 8 1393 0.144 8 1393 0.25214:00 - 15:008 1393 0.341 8 1393 0.206 8 1393 0.54715:00 - 16:008 1393 0.144 8 1393 0.278 8 1393 0.42216:00 - 17:008 1393 0.117 8 1393 0.162 8 1393 0.27917:00 - 18:008 1393 0.054 8 1393 0.063 8 1393 0.11718:00 - 19:008 1393 0.009 8 1393 0.027 8 1393 0.03619:00 - 20:004 1411 0.000 4 1411 0.000 4 1411 0.00020:00 - 21:002 1404 0.000 2 1404 0.000 2 1404 0.00021:00 - 22:00
22:00 - 23:0023:00 - 24:00
Total Rates: 2.114 2.163 4.277
This section displays the trip rate results based on the selected set of surveys and the selected count type (shown just
above the table). It is split by three main columns, representing arrivals trips, departures trips, and total trips (arrivals plus
departures). Within each of these main columns are three sub-columns. These display the number of survey days where
count data is included (per time period), the average value of the selected trip rate calculation parameter (per time
period), and the trip rate result (per time period). Total trip rates (the sum of the column) are also displayed at the foot of
the table.
To obtain a trip rate, the average (mean) trip rate parameter value (TRP) is first calculated for all selected survey days
that have count data available for the stated time period. The average (mean) number of arrivals, departures or totals
(whichever applies) is also calculated (COUNT) for all selected survey days that have count data available for the stated
time period. Then, the average count is divided by the average trip rate parameter value, and multiplied by the stated
calculation factor (shown just above the table and abbreviated here as FACT). So, the method is: COUNT/TRP*FACT. Trip
rates are then rounded to 3 decimal places.
Parameter summary
Trip rate parameter range selected: 1150 - 1900 (units: sqm)Survey date date range: 01/01/07 - 27/11/12Number of weekdays (Monday-Friday): 8Number of Saturdays: 0Number of Sundays: 0Surveys manually removed from selection: 0
This section displays a quick summary of some of the data filtering selections made by the TRICS® user. The trip rate
calculation parameter range of all selected surveys is displayed first, followed by the range of minimum and maximum
survey dates selected by the user. Then, the total number of selected weekdays and weekend days in the selected set of
surveys are show. Finally, the number of survey days that have been manually removed from the selected set outside of
the standard filtering procedure are displayed.
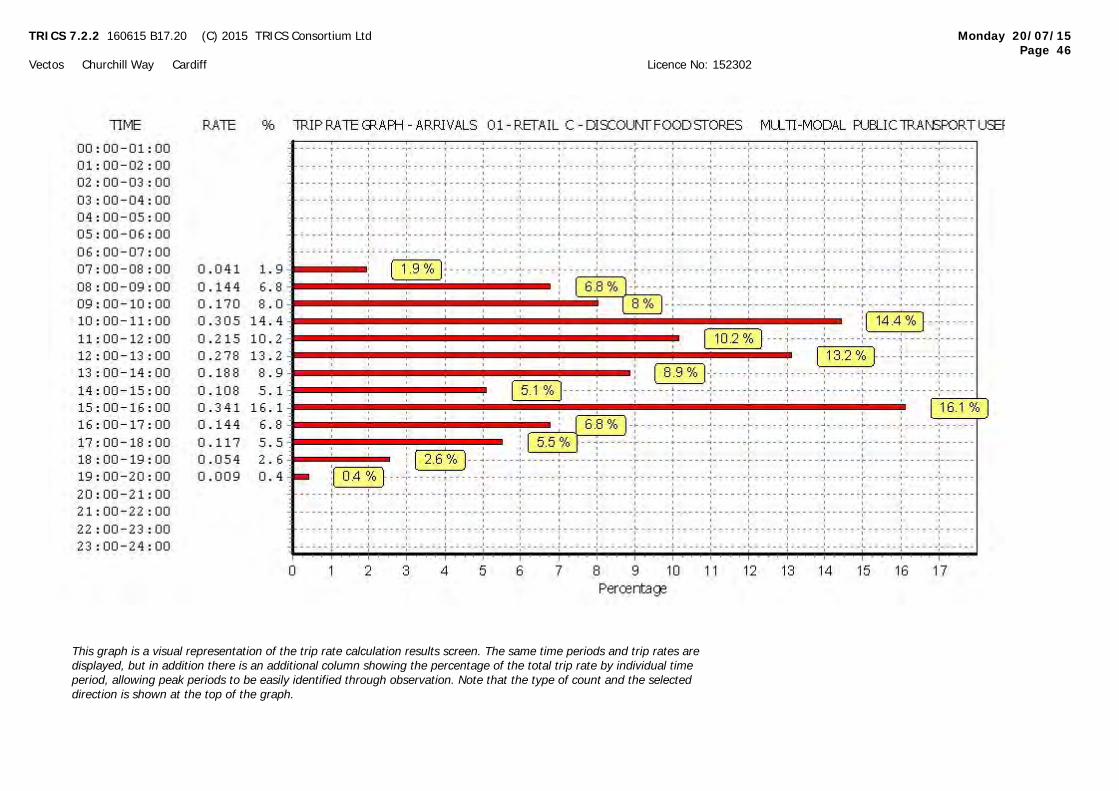
TRICS 7.2.2 160615 B17.20 (C) 2015 TRICS Consortium Ltd Monday 20/07/15
Page 46
Vectos Churchill Way Cardiff Licence No: 152302
This graph is a visual representation of the trip rate calculation results screen. The same time periods and trip rates are
displayed, but in addition there is an additional column showing the percentage of the total trip rate by individual time
period, allowing peak periods to be easily identified through observation. Note that the type of count and the selected
direction is shown at the top of the graph.
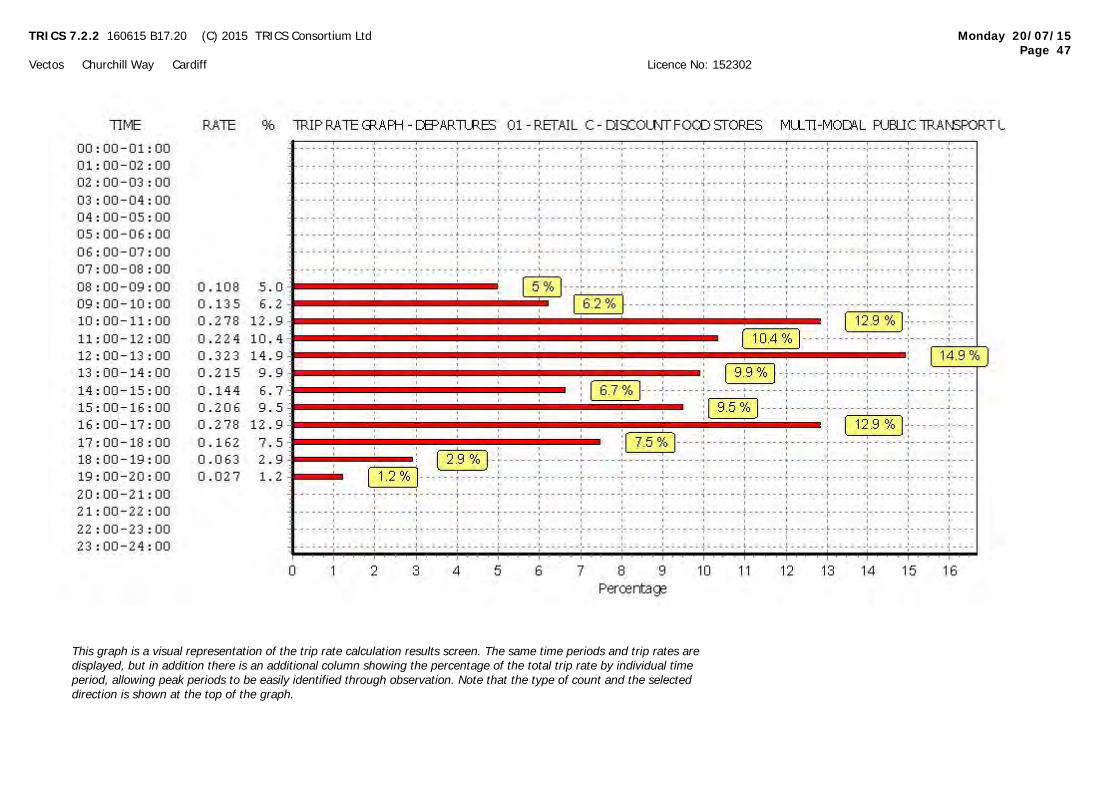
TRICS 7.2.2 160615 B17.20 (C) 2015 TRICS Consortium Ltd Monday 20/07/15
Page 47
Vectos Churchill Way Cardiff Licence No: 152302
This graph is a visual representation of the trip rate calculation results screen. The same time periods and trip rates are
displayed, but in addition there is an additional column showing the percentage of the total trip rate by individual time
period, allowing peak periods to be easily identified through observation. Note that the type of count and the selected
direction is shown at the top of the graph.
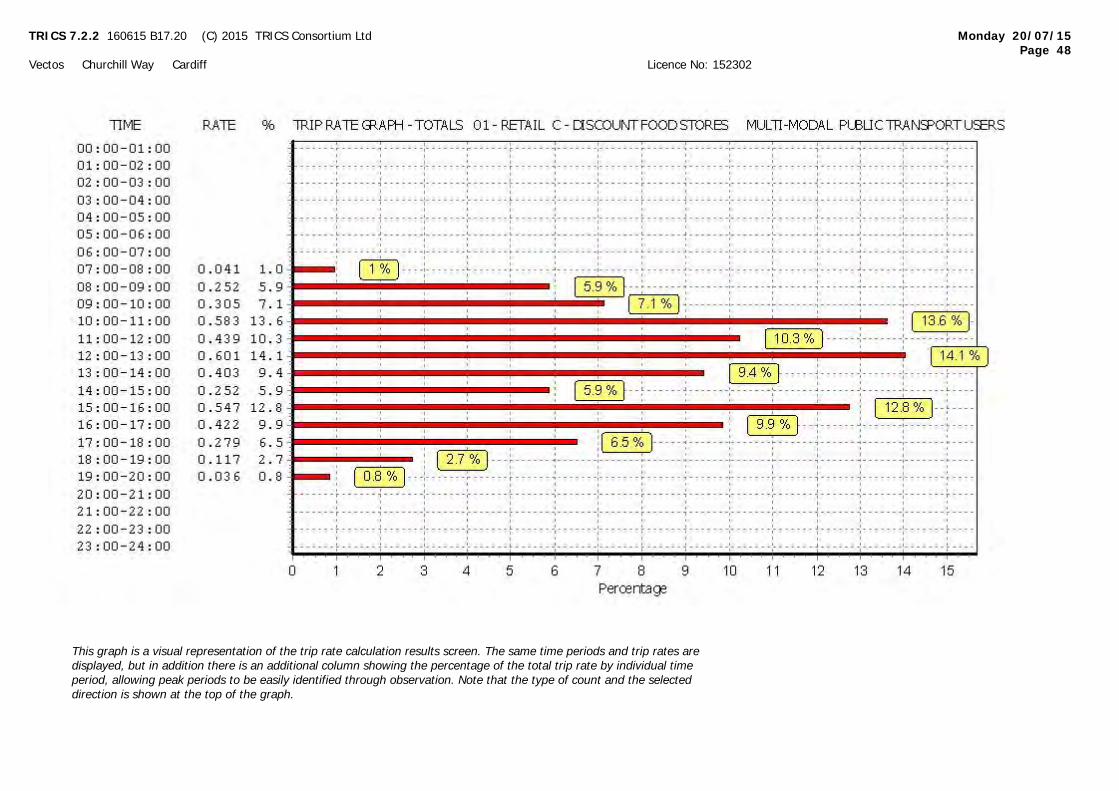
TRICS 7.2.2 160615 B17.20 (C) 2015 TRICS Consortium Ltd Monday 20/07/15
Page 48
Vectos Churchill Way Cardiff Licence No: 152302
This graph is a visual representation of the trip rate calculation results screen. The same time periods and trip rates are
displayed, but in addition there is an additional column showing the percentage of the total trip rate by individual time
period, allowing peak periods to be easily identified through observation. Note that the type of count and the selected
direction is shown at the top of the graph.

TRICS 7.2.2 160615 B17.20 (C) 2015 TRICS Consortium Ltd Monday 20/07/15
Page 49
Vectos Churchill Way Cardiff Licence No: 152302
TRIP RATE for Land Use 01 - RETAIL/C - DISCOUNT FOOD STORESMULTI-MODAL TOTAL PEOPLE
Calculation factor: 100 sqm
BOLD print indicates peak (busiest) period
ARRIVALS DEPARTURES TOTALSNo. Ave. Trip No. Ave. Trip No. Ave. Trip
Time Range Days GFA Rate Days GFA Rate Days GFA Rate00:00 - 01:0001:00 - 02:0002:00 - 03:0003:00 - 04:0004:00 - 05:0005:00 - 06:0006:00 - 07:00
5 1460 0.589 5 1460 0.164 5 1460 0.75307:00 - 08:008 1393 1.732 8 1393 1.086 8 1393 2.81808:00 - 09:008 1393 3.868 8 1393 2.916 8 1393 6.78409:00 - 10:008 1393 6.299 8 1393 5.115 8 1393 11.41410:00 - 11:008 1393 6.219 8 1393 5.788 8 1393 12.00711:00 - 12:008 1393 5.994 8 1393 6.488 8 1393 12.48212:00 - 13:008 1393 5.160 8 1393 5.474 8 1393 10.63413:00 - 14:008 1393 6.470 8 1393 6.452 8 1393 12.92214:00 - 15:008 1393 7.511 8 1393 7.152 8 1393 14.66315:00 - 16:008 1393 6.084 8 1393 6.515 8 1393 12.59916:00 - 17:008 1393 5.788 8 1393 6.533 8 1393 12.32117:00 - 18:008 1393 4.451 8 1393 5.160 8 1393 9.61118:00 - 19:008 1393 1.884 8 1393 2.441 8 1393 4.32519:00 - 20:004 1411 0.390 4 1411 0.602 4 1411 0.99220:00 - 21:002 1404 0.143 2 1404 0.143 2 1404 0.28621:00 - 22:00
22:00 - 23:0023:00 - 24:00
Total Rates: 6 2.582 6 2.029 124.611
This section displays the trip rate results based on the selected set of surveys and the selected count type (shown just
above the table). It is split by three main columns, representing arrivals trips, departures trips, and total trips (arrivals plus
departures). Within each of these main columns are three sub-columns. These display the number of survey days where
count data is included (per time period), the average value of the selected trip rate calculation parameter (per time
period), and the trip rate result (per time period). Total trip rates (the sum of the column) are also displayed at the foot of
the table.
To obtain a trip rate, the average (mean) trip rate parameter value (TRP) is first calculated for all selected survey days
that have count data available for the stated time period. The average (mean) number of arrivals, departures or totals
(whichever applies) is also calculated (COUNT) for all selected survey days that have count data available for the stated
time period. Then, the average count is divided by the average trip rate parameter value, and multiplied by the stated
calculation factor (shown just above the table and abbreviated here as FACT). So, the method is: COUNT/TRP*FACT. Trip
rates are then rounded to 3 decimal places.
Parameter summary
Trip rate parameter range selected: 1150 - 1900 (units: sqm)Survey date date range: 01/01/07 - 27/11/12Number of weekdays (Monday-Friday): 8Number of Saturdays: 0Number of Sundays: 0Surveys manually removed from selection: 0
This section displays a quick summary of some of the data filtering selections made by the TRICS® user. The trip rate
calculation parameter range of all selected surveys is displayed first, followed by the range of minimum and maximum
survey dates selected by the user. Then, the total number of selected weekdays and weekend days in the selected set of
surveys are show. Finally, the number of survey days that have been manually removed from the selected set outside of
the standard filtering procedure are displayed.
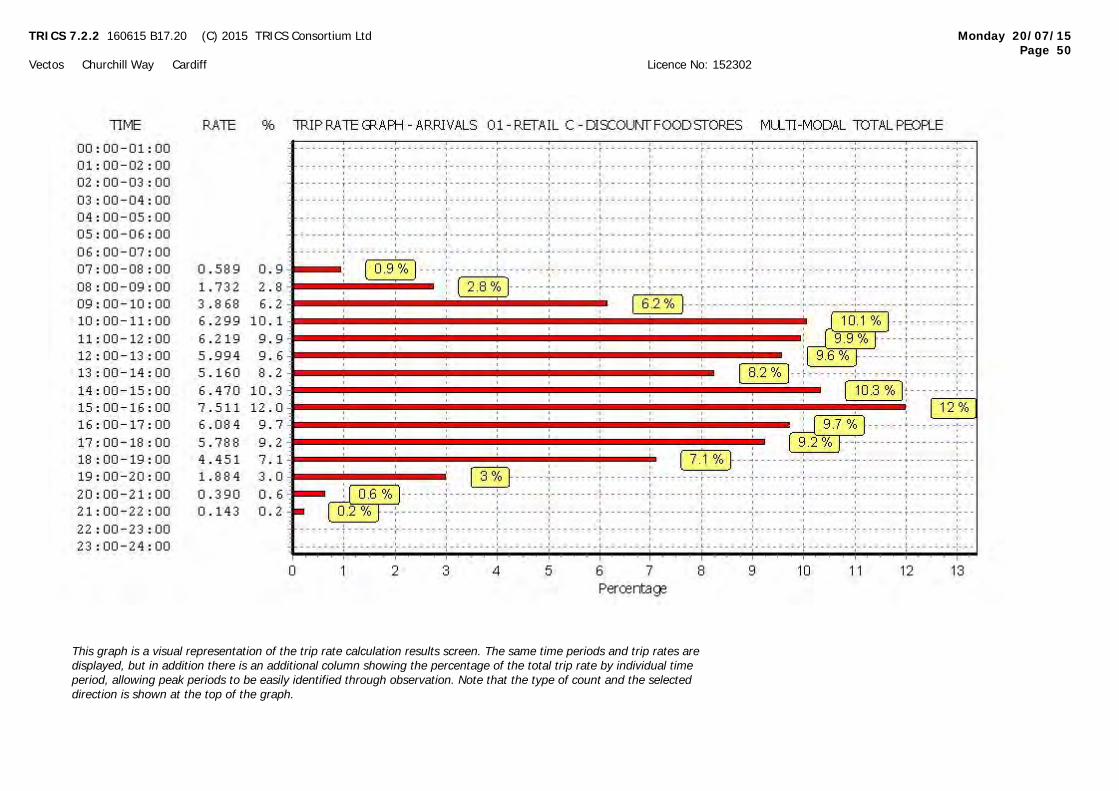
TRICS 7.2.2 160615 B17.20 (C) 2015 TRICS Consortium Ltd Monday 20/07/15
Page 50
Vectos Churchill Way Cardiff Licence No: 152302
This graph is a visual representation of the trip rate calculation results screen. The same time periods and trip rates are
displayed, but in addition there is an additional column showing the percentage of the total trip rate by individual time
period, allowing peak periods to be easily identified through observation. Note that the type of count and the selected
direction is shown at the top of the graph.

TRICS 7.2.2 160615 B17.20 (C) 2015 TRICS Consortium Ltd Monday 20/07/15
Page 51
Vectos Churchill Way Cardiff Licence No: 152302
This graph is a visual representation of the trip rate calculation results screen. The same time periods and trip rates are
displayed, but in addition there is an additional column showing the percentage of the total trip rate by individual time
period, allowing peak periods to be easily identified through observation. Note that the type of count and the selected
direction is shown at the top of the graph.
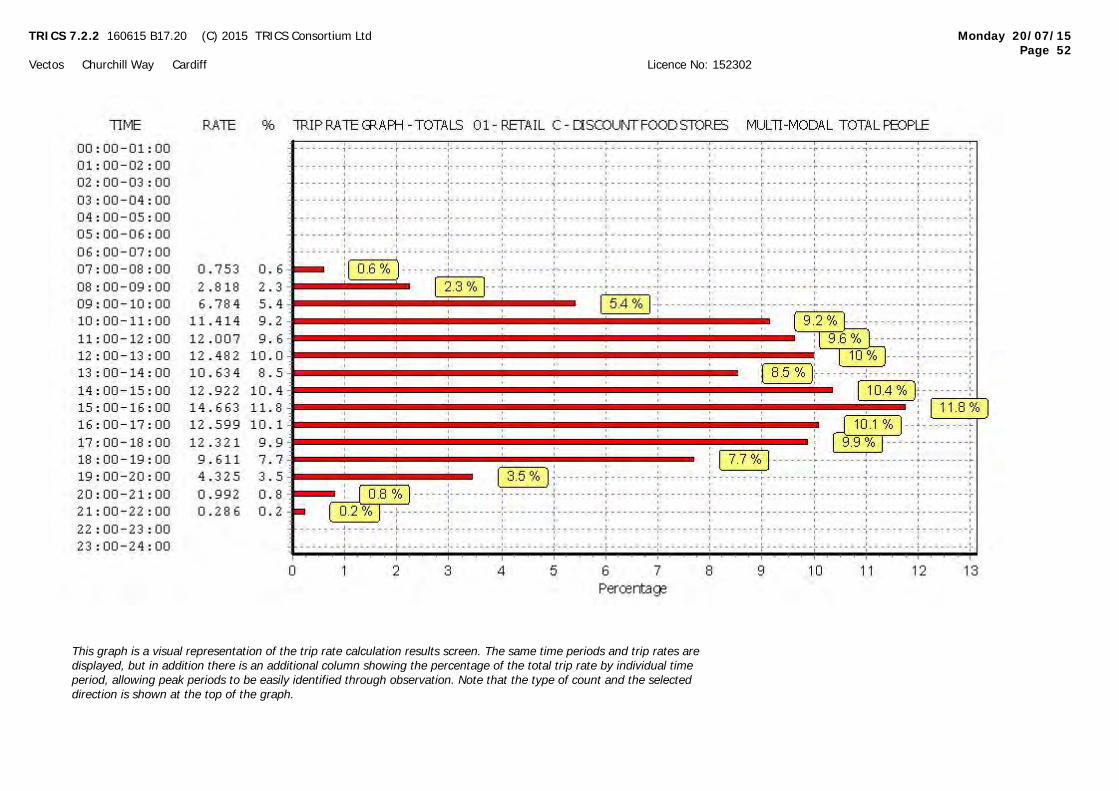
TRICS 7.2.2 160615 B17.20 (C) 2015 TRICS Consortium Ltd Monday 20/07/15
Page 52
Vectos Churchill Way Cardiff Licence No: 152302
This graph is a visual representation of the trip rate calculation results screen. The same time periods and trip rates are
displayed, but in addition there is an additional column showing the percentage of the total trip rate by individual time
period, allowing peak periods to be easily identified through observation. Note that the type of count and the selected
direction is shown at the top of the graph.

APPENDIX G
PICADY Output
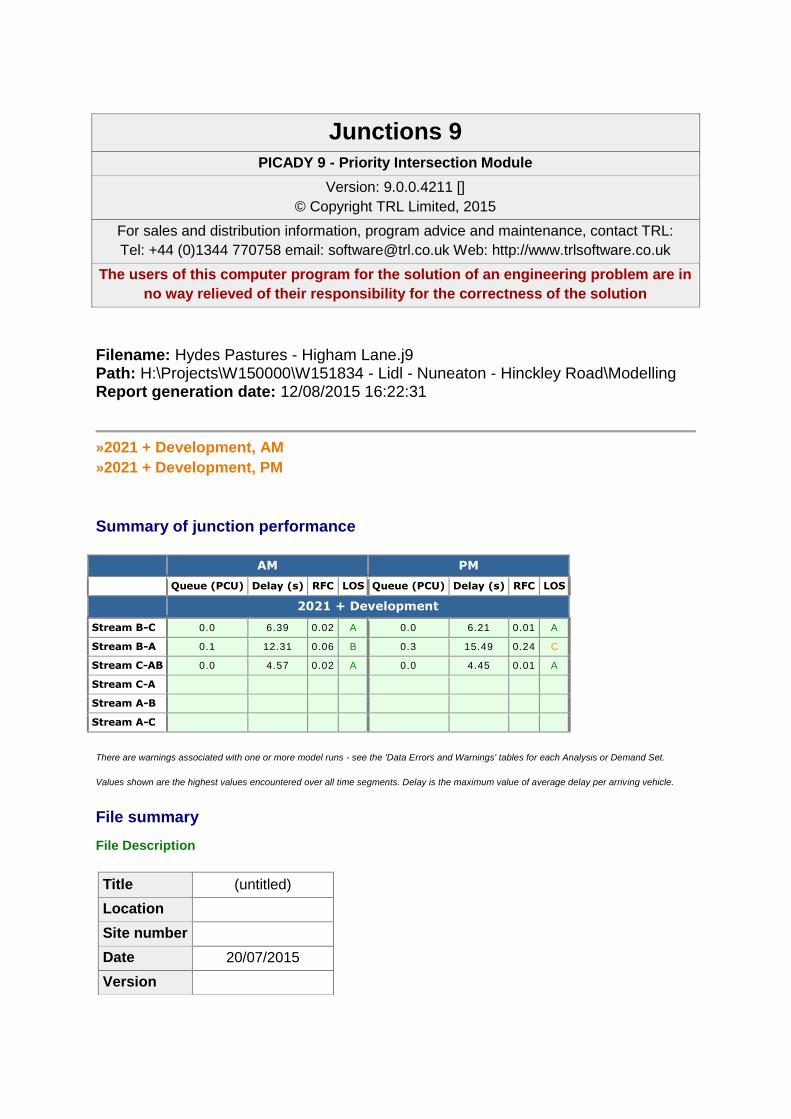
Junctions 9
PICADY 9 - Priority Intersection Module
Version: 9.0.0.4211 []
© Copyright TRL Limited, 2015
For sales and distribution information, program advice and maintenance, contact TRL:
Tel: +44 (0)1344 770758 email: [email protected] Web: http://www.trlsoftware.co.uk
The users of this computer program for the solution of an engineering problem are in
no way relieved of their responsibility for the correctness of the solution
Filename: Hydes Pastures - Higham Lane.j9 Path: H:\Projects\W150000\W151834 - Lidl - Nuneaton - Hinckley Road\Modelling Report generation date: 12/08/2015 16:22:31
»2021 + Development, AM
»2021 + Development, PM
Summary of junction performance
AM PM
Queue (PCU) Delay (s) RFC LOS Queue (PCU) Delay (s) RFC LOS
2021 + Development
Stream B-C 0.0 6.39 0.02 A 0.0 6.21 0.01 A
Stream B-A 0.1 12.31 0.06 B 0.3 15.49 0.24 C
Stream C-AB 0.0 4.57 0.02 A 0.0 4.45 0.01 A
Stream C-A
Stream A-B
Stream A-C
There are warnings associated with one or more model runs - see the 'Data Errors and Warnings' tables for each Analysis or Demand Set.
Values shown are the highest values encountered over all time segments. Delay is the maximum value of average delay per arriving vehicle.
File summary
File Description
Title (untitled)
Location
Site number
Date 20/07/2015
Version
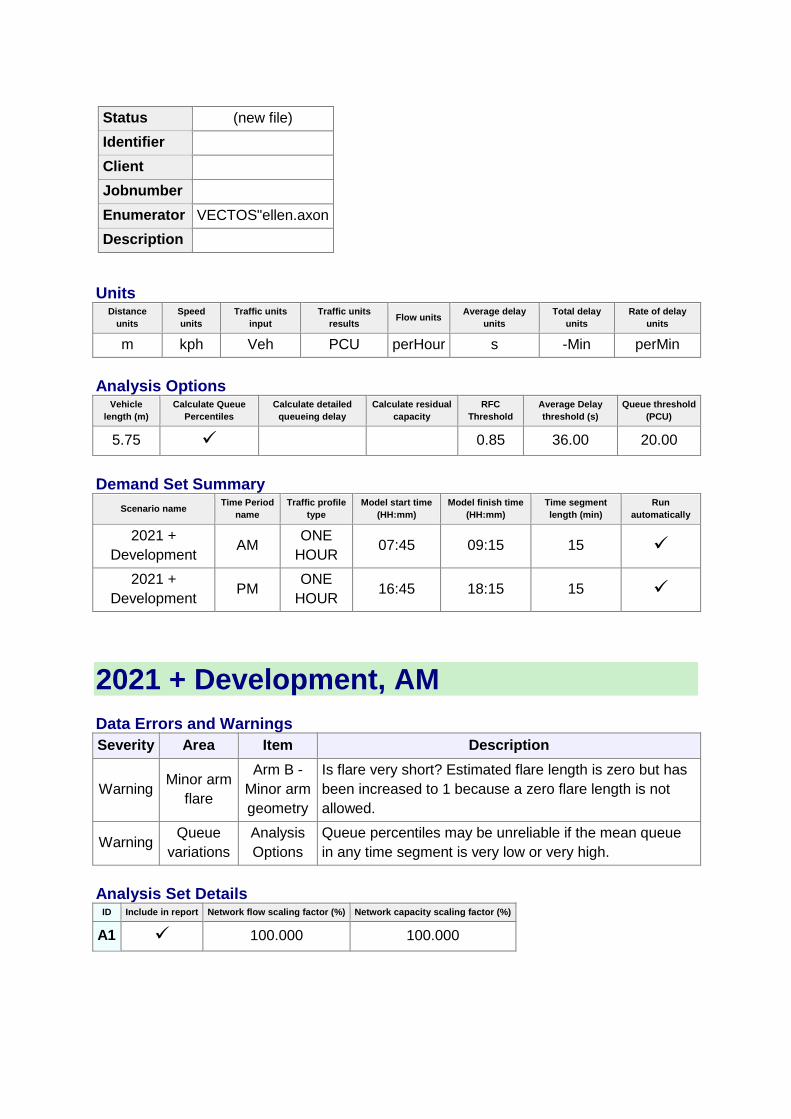
Status (new file)
Identifier
Client
Jobnumber
Enumerator VECTOS"ellen.axon
Description
Units Distance
units
Speed
units
Traffic units
input
Traffic units
results Flow units
Average delay
units
Total delay
units
Rate of delay
units
m kph Veh PCU perHour s -Min perMin
Analysis Options Vehicle
length (m)
Calculate Queue
Percentiles
Calculate detailed
queueing delay
Calculate residual
capacity
RFC
Threshold
Average Delay
threshold (s)
Queue threshold
(PCU)
5.75
0.85 36.00 20.00
Demand Set Summary
Scenario name Time Period
name
Traffic profile
type
Model start time
(HH:mm)
Model finish time
(HH:mm)
Time segment
length (min)
Run
automatically
2021 +
Development AM
ONE
HOUR 07:45 09:15 15
2021 +
Development PM
ONE
HOUR 16:45 18:15 15
2021 + Development, AM
Data Errors and Warnings
Severity Area Item Description
Warning Minor arm
flare
Arm B -
Minor arm
geometry
Is flare very short? Estimated flare length is zero but has
been increased to 1 because a zero flare length is not
allowed.
Warning Queue
variations
Analysis
Options
Queue percentiles may be unreliable if the mean queue
in any time segment is very low or very high.
Analysis Set Details ID Include in report Network flow scaling factor (%) Network capacity scaling factor (%)
A1 100.000 100.000
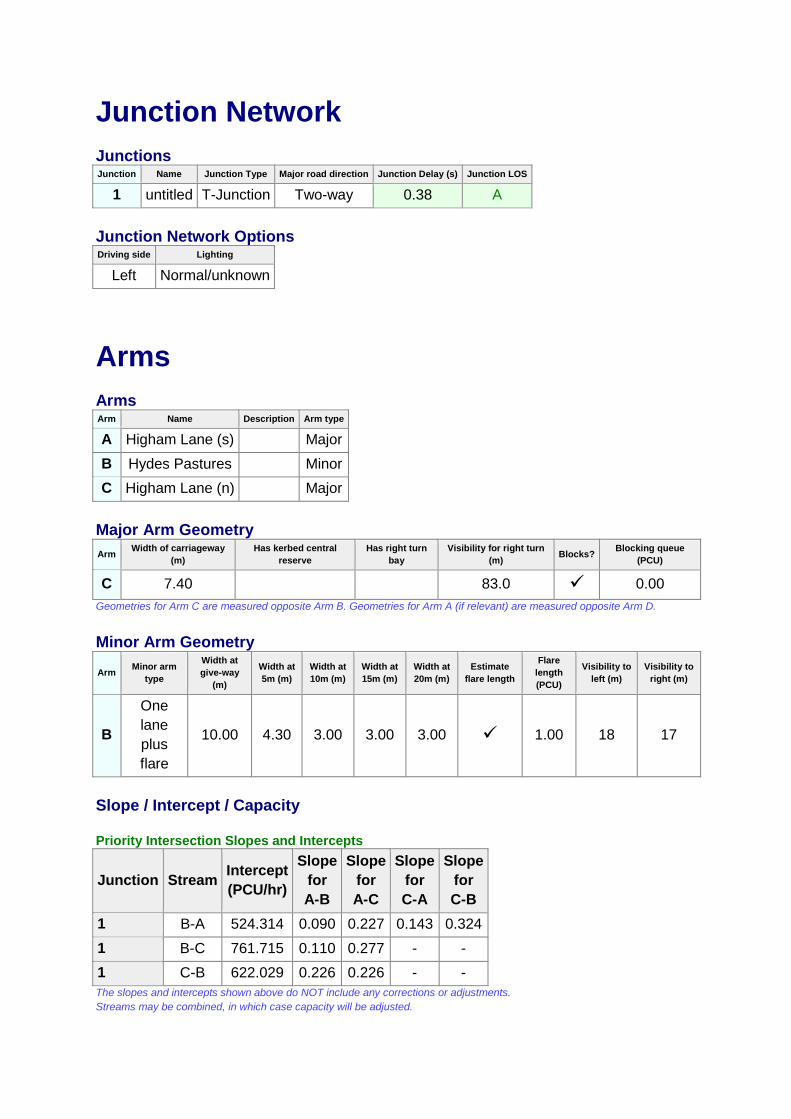
Junction Network
Junctions Junction Name Junction Type Major road direction Junction Delay (s) Junction LOS
1 untitled T-Junction Two-way 0.38 A
Junction Network Options Driving side Lighting
Left Normal/unknown
Arms
Arms Arm Name Description Arm type
A Higham Lane (s)
Major
B Hydes Pastures
Minor
C Higham Lane (n)
Major
Major Arm Geometry
Arm Width of carriageway
(m)
Has kerbed central
reserve
Has right turn
bay
Visibility for right turn
(m) Blocks?
Blocking queue
(PCU)
C 7.40
83.0 0.00
Geometries for Arm C are measured opposite Arm B. Geometries for Arm A (if relevant) are measured opposite Arm D.
Minor Arm Geometry
Arm Minor arm
type
Width at
give-way
(m)
Width at
5m (m)
Width at
10m (m)
Width at
15m (m)
Width at
20m (m)
Estimate
flare length
Flare
length
(PCU)
Visibility to
left (m)
Visibility to
right (m)
B
One
lane
plus
flare
10.00 4.30 3.00 3.00 3.00 1.00 18 17
Slope / Intercept / Capacity
Priority Intersection Slopes and Intercepts
Junction Stream Intercept
(PCU/hr)
Slope
for
A-B
Slope
for
A-C
Slope
for
C-A
Slope
for
C-B
1 B-A 524.314 0.090 0.227 0.143 0.324
1 B-C 761.715 0.110 0.277 - -
1 C-B 622.029 0.226 0.226 - - The slopes and intercepts shown above do NOT include any corrections or adjustments.
Streams may be combined, in which case capacity will be adjusted.
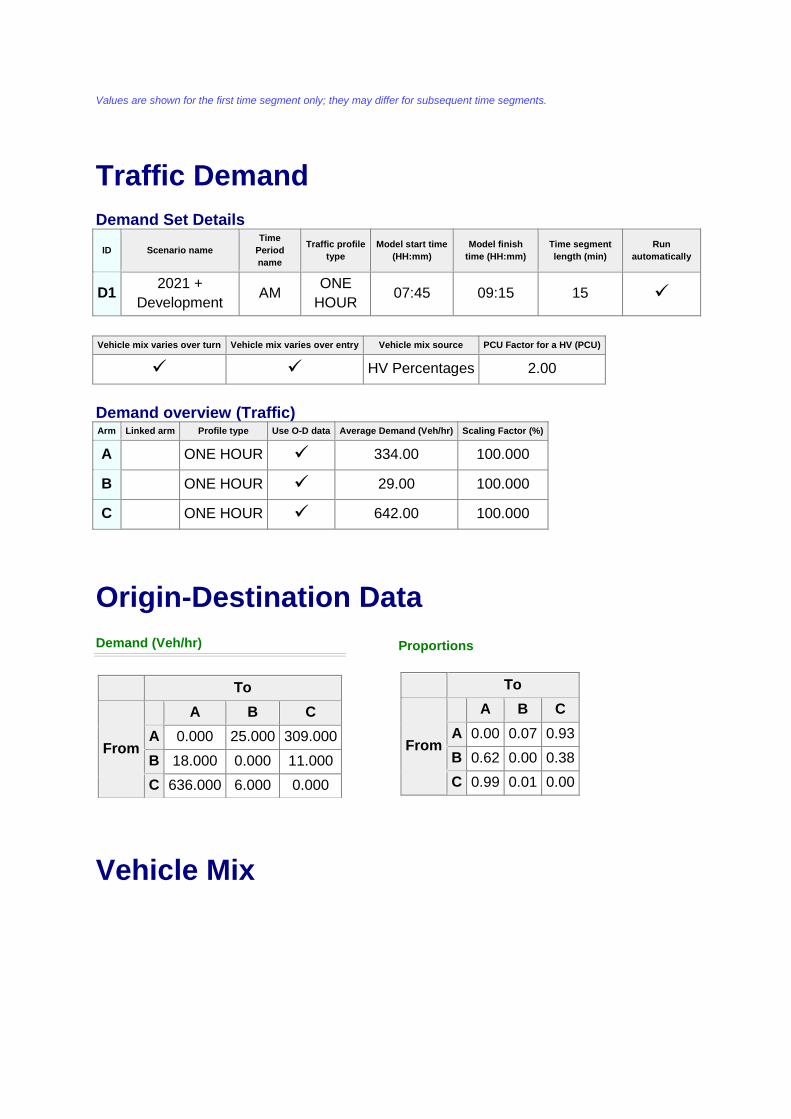
Values are shown for the first time segment only; they may differ for subsequent time segments.
Traffic Demand
Demand Set Details
ID Scenario name
Time
Period
name
Traffic profile
type
Model start time
(HH:mm)
Model finish
time (HH:mm)
Time segment
length (min)
Run
automatically
D1 2021 +
Development AM
ONE
HOUR 07:45 09:15 15
Vehicle mix varies over turn Vehicle mix varies over entry Vehicle mix source PCU Factor for a HV (PCU)
HV Percentages 2.00
Demand overview (Traffic) Arm Linked arm Profile type Use O-D data Average Demand (Veh/hr) Scaling Factor (%)
A
ONE HOUR 334.00 100.000
B
ONE HOUR 29.00 100.000
C
ONE HOUR 642.00 100.000
Origin-Destination Data
Demand (Veh/hr)
To
From
A B C
A 0.000 25.000 309.000
B 18.000 0.000 11.000
C 636.000 6.000 0.000
Proportions
To
From
A B C
A 0.00 0.07 0.93
B 0.62 0.00 0.38
C 0.99 0.01 0.00
Vehicle Mix
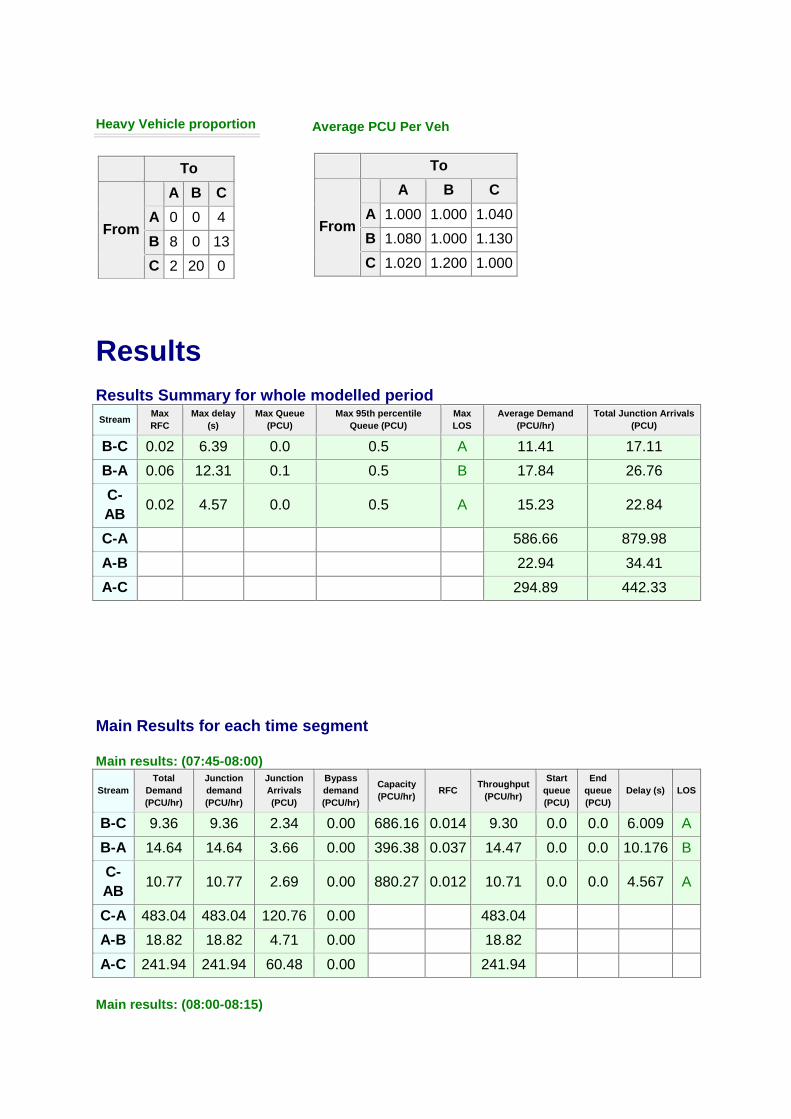
Heavy Vehicle proportion
To
From
A B C
A 0 0 4
B 8 0 13
C 2 20 0
Average PCU Per Veh
To
From
A B C
A 1.000 1.000 1.040
B 1.080 1.000 1.130
C 1.020 1.200 1.000
Results
Results Summary for whole modelled period
Stream Max
RFC
Max delay
(s)
Max Queue
(PCU)
Max 95th percentile
Queue (PCU)
Max
LOS
Average Demand
(PCU/hr)
Total Junction Arrivals
(PCU)
B-C 0.02 6.39 0.0 0.5 A 11.41 17.11
B-A 0.06 12.31 0.1 0.5 B 17.84 26.76
C-
AB 0.02 4.57 0.0 0.5 A 15.23 22.84
C-A
586.66 879.98
A-B
22.94 34.41
A-C
294.89 442.33
Main Results for each time segment
Main results: (07:45-08:00)
Stream
Total
Demand
(PCU/hr)
Junction
demand
(PCU/hr)
Junction
Arrivals
(PCU)
Bypass
demand
(PCU/hr)
Capacity
(PCU/hr) RFC
Throughput
(PCU/hr)
Start
queue
(PCU)
End
queue
(PCU)
Delay (s) LOS
B-C 9.36 9.36 2.34 0.00 686.16 0.014 9.30 0.0 0.0 6.009 A
B-A 14.64 14.64 3.66 0.00 396.38 0.037 14.47 0.0 0.0 10.176 B
C-
AB 10.77 10.77 2.69 0.00 880.27 0.012 10.71 0.0 0.0 4.567 A
C-A 483.04 483.04 120.76 0.00
483.04
A-B 18.82 18.82 4.71 0.00
18.82
A-C 241.94 241.94 60.48 0.00
241.94
Main results: (08:00-08:15)
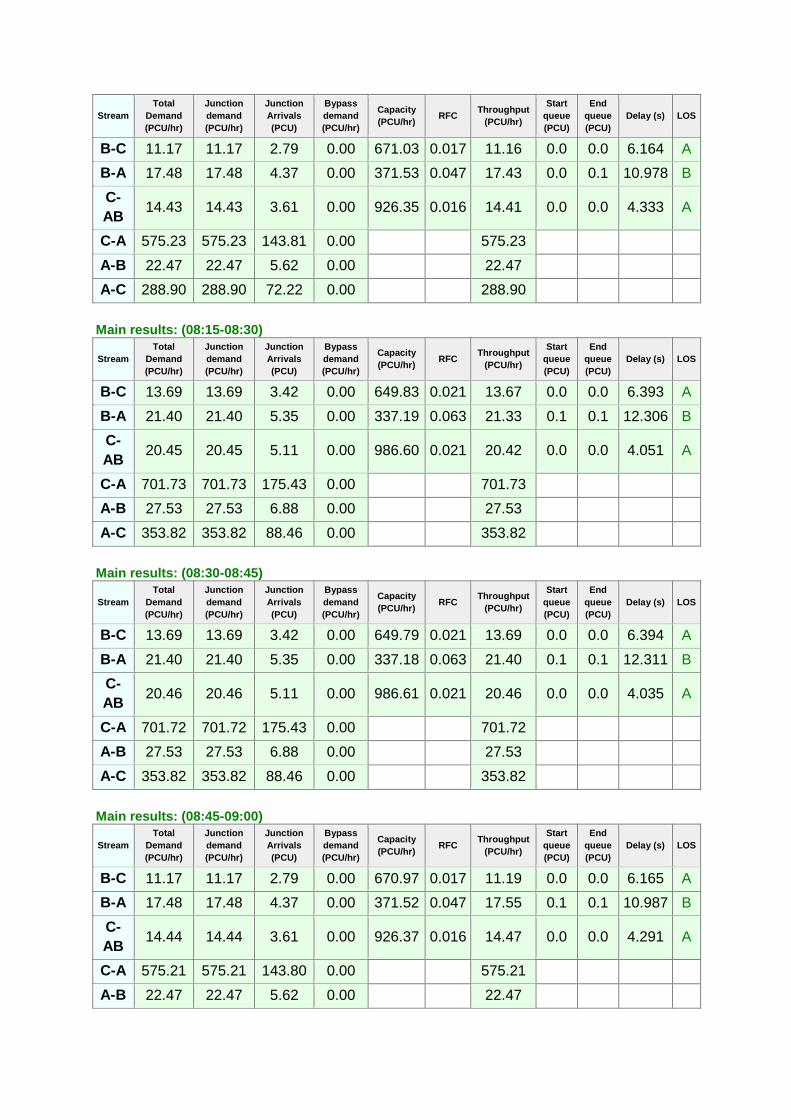
Stream
Total
Demand
(PCU/hr)
Junction
demand
(PCU/hr)
Junction
Arrivals
(PCU)
Bypass
demand
(PCU/hr)
Capacity
(PCU/hr) RFC
Throughput
(PCU/hr)
Start
queue
(PCU)
End
queue
(PCU)
Delay (s) LOS
B-C 11.17 11.17 2.79 0.00 671.03 0.017 11.16 0.0 0.0 6.164 A
B-A 17.48 17.48 4.37 0.00 371.53 0.047 17.43 0.0 0.1 10.978 B
C-
AB 14.43 14.43 3.61 0.00 926.35 0.016 14.41 0.0 0.0 4.333 A
C-A 575.23 575.23 143.81 0.00
575.23
A-B 22.47 22.47 5.62 0.00
22.47
A-C 288.90 288.90 72.22 0.00
288.90
Main results: (08:15-08:30)
Stream
Total
Demand
(PCU/hr)
Junction
demand
(PCU/hr)
Junction
Arrivals
(PCU)
Bypass
demand
(PCU/hr)
Capacity
(PCU/hr) RFC
Throughput
(PCU/hr)
Start
queue
(PCU)
End
queue
(PCU)
Delay (s) LOS
B-C 13.69 13.69 3.42 0.00 649.83 0.021 13.67 0.0 0.0 6.393 A
B-A 21.40 21.40 5.35 0.00 337.19 0.063 21.33 0.1 0.1 12.306 B
C-
AB 20.45 20.45 5.11 0.00 986.60 0.021 20.42 0.0 0.0 4.051 A
C-A 701.73 701.73 175.43 0.00
701.73
A-B 27.53 27.53 6.88 0.00
27.53
A-C 353.82 353.82 88.46 0.00
353.82
Main results: (08:30-08:45)
Stream
Total
Demand
(PCU/hr)
Junction
demand
(PCU/hr)
Junction
Arrivals
(PCU)
Bypass
demand
(PCU/hr)
Capacity
(PCU/hr) RFC
Throughput
(PCU/hr)
Start
queue
(PCU)
End
queue
(PCU)
Delay (s) LOS
B-C 13.69 13.69 3.42 0.00 649.79 0.021 13.69 0.0 0.0 6.394 A
B-A 21.40 21.40 5.35 0.00 337.18 0.063 21.40 0.1 0.1 12.311 B
C-
AB 20.46 20.46 5.11 0.00 986.61 0.021 20.46 0.0 0.0 4.035 A
C-A 701.72 701.72 175.43 0.00
701.72
A-B 27.53 27.53 6.88 0.00
27.53
A-C 353.82 353.82 88.46 0.00
353.82
Main results: (08:45-09:00)
Stream
Total
Demand
(PCU/hr)
Junction
demand
(PCU/hr)
Junction
Arrivals
(PCU)
Bypass
demand
(PCU/hr)
Capacity
(PCU/hr) RFC
Throughput
(PCU/hr)
Start
queue
(PCU)
End
queue
(PCU)
Delay (s) LOS
B-C 11.17 11.17 2.79 0.00 670.97 0.017 11.19 0.0 0.0 6.165 A
B-A 17.48 17.48 4.37 0.00 371.52 0.047 17.55 0.1 0.1 10.987 B
C-
AB 14.44 14.44 3.61 0.00 926.37 0.016 14.47 0.0 0.0 4.291 A
C-A 575.21 575.21 143.80 0.00
575.21
A-B 22.47 22.47 5.62 0.00
22.47
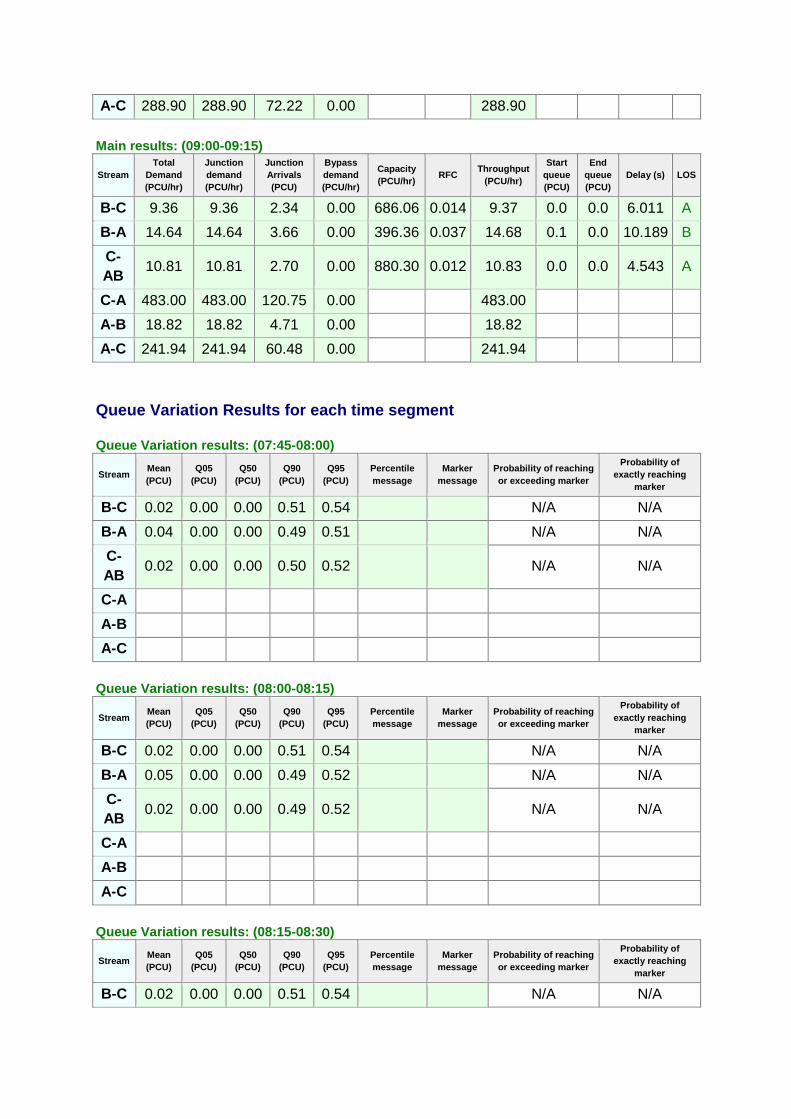
A-C 288.90 288.90 72.22 0.00
288.90
Main results: (09:00-09:15)
Stream
Total
Demand
(PCU/hr)
Junction
demand
(PCU/hr)
Junction
Arrivals
(PCU)
Bypass
demand
(PCU/hr)
Capacity
(PCU/hr) RFC
Throughput
(PCU/hr)
Start
queue
(PCU)
End
queue
(PCU)
Delay (s) LOS
B-C 9.36 9.36 2.34 0.00 686.06 0.014 9.37 0.0 0.0 6.011 A
B-A 14.64 14.64 3.66 0.00 396.36 0.037 14.68 0.1 0.0 10.189 B
C-
AB 10.81 10.81 2.70 0.00 880.30 0.012 10.83 0.0 0.0 4.543 A
C-A 483.00 483.00 120.75 0.00
483.00
A-B 18.82 18.82 4.71 0.00
18.82
A-C 241.94 241.94 60.48 0.00
241.94
Queue Variation Results for each time segment
Queue Variation results: (07:45-08:00)
Stream Mean
(PCU)
Q05
(PCU)
Q50
(PCU)
Q90
(PCU)
Q95
(PCU)
Percentile
message
Marker
message
Probability of reaching
or exceeding marker
Probability of
exactly reaching
marker
B-C 0.02 0.00 0.00 0.51 0.54
N/A N/A
B-A 0.04 0.00 0.00 0.49 0.51
N/A N/A
C-
AB 0.02 0.00 0.00 0.50 0.52
N/A N/A
C-A
A-B
A-C
Queue Variation results: (08:00-08:15)
Stream Mean
(PCU)
Q05
(PCU)
Q50
(PCU)
Q90
(PCU)
Q95
(PCU)
Percentile
message
Marker
message
Probability of reaching
or exceeding marker
Probability of
exactly reaching
marker
B-C 0.02 0.00 0.00 0.51 0.54
N/A N/A
B-A 0.05 0.00 0.00 0.49 0.52
N/A N/A
C-
AB 0.02 0.00 0.00 0.49 0.52
N/A N/A
C-A
A-B
A-C
Queue Variation results: (08:15-08:30)
Stream Mean
(PCU)
Q05
(PCU)
Q50
(PCU)
Q90
(PCU)
Q95
(PCU)
Percentile
message
Marker
message
Probability of reaching
or exceeding marker
Probability of
exactly reaching
marker
B-C 0.02 0.00 0.00 0.51 0.54
N/A N/A
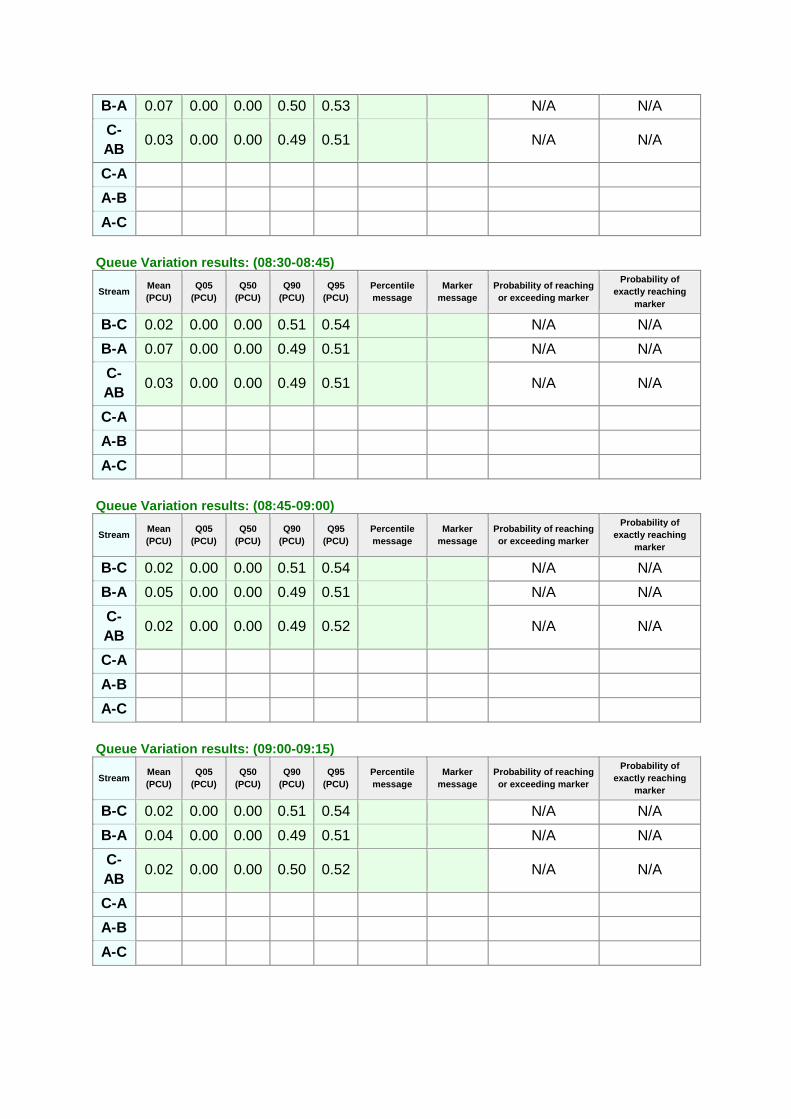
B-A 0.07 0.00 0.00 0.50 0.53
N/A N/A
C-
AB 0.03 0.00 0.00 0.49 0.51
N/A N/A
C-A
A-B
A-C
Queue Variation results: (08:30-08:45)
Stream Mean
(PCU)
Q05
(PCU)
Q50
(PCU)
Q90
(PCU)
Q95
(PCU)
Percentile
message
Marker
message
Probability of reaching
or exceeding marker
Probability of
exactly reaching
marker
B-C 0.02 0.00 0.00 0.51 0.54
N/A N/A
B-A 0.07 0.00 0.00 0.49 0.51
N/A N/A
C-
AB 0.03 0.00 0.00 0.49 0.51
N/A N/A
C-A
A-B
A-C
Queue Variation results: (08:45-09:00)
Stream Mean
(PCU)
Q05
(PCU)
Q50
(PCU)
Q90
(PCU)
Q95
(PCU)
Percentile
message
Marker
message
Probability of reaching
or exceeding marker
Probability of
exactly reaching
marker
B-C 0.02 0.00 0.00 0.51 0.54
N/A N/A
B-A 0.05 0.00 0.00 0.49 0.51
N/A N/A
C-
AB 0.02 0.00 0.00 0.49 0.52
N/A N/A
C-A
A-B
A-C
Queue Variation results: (09:00-09:15)
Stream Mean
(PCU)
Q05
(PCU)
Q50
(PCU)
Q90
(PCU)
Q95
(PCU)
Percentile
message
Marker
message
Probability of reaching
or exceeding marker
Probability of
exactly reaching
marker
B-C 0.02 0.00 0.00 0.51 0.54
N/A N/A
B-A 0.04 0.00 0.00 0.49 0.51
N/A N/A
C-
AB 0.02 0.00 0.00 0.50 0.52
N/A N/A
C-A
A-B
A-C
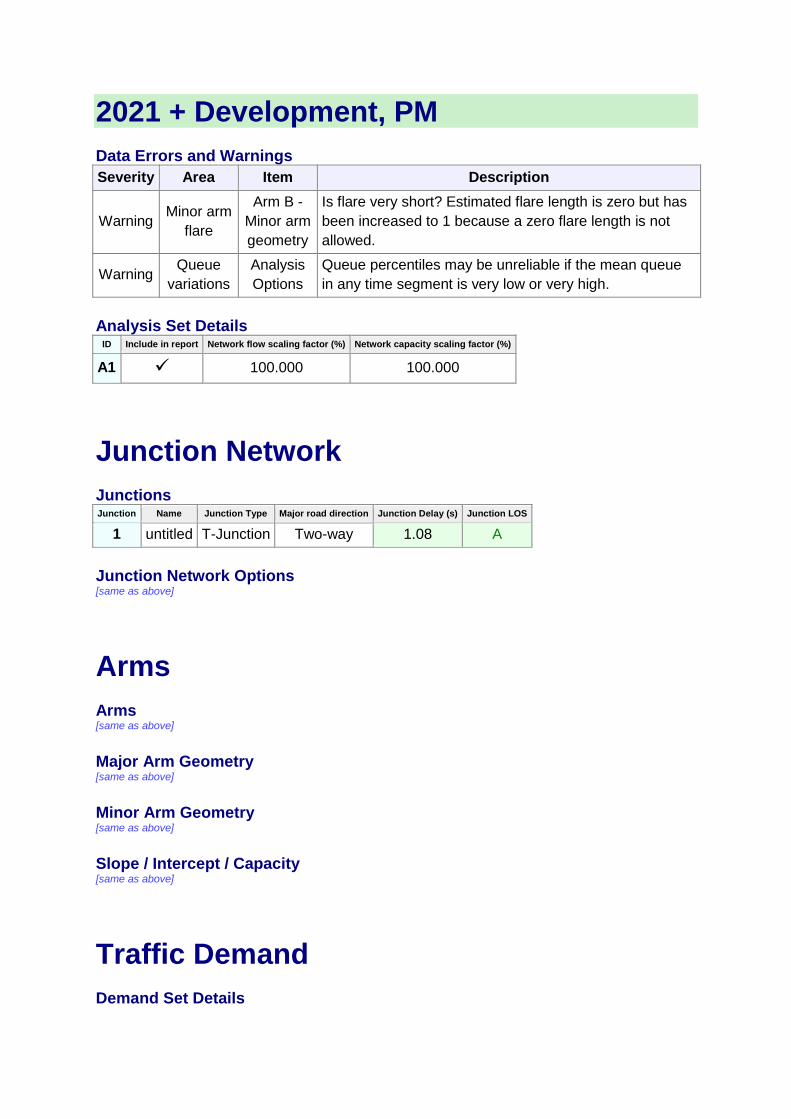
2021 + Development, PM
Data Errors and Warnings
Severity Area Item Description
Warning Minor arm
flare
Arm B -
Minor arm
geometry
Is flare very short? Estimated flare length is zero but has
been increased to 1 because a zero flare length is not
allowed.
Warning Queue
variations
Analysis
Options
Queue percentiles may be unreliable if the mean queue
in any time segment is very low or very high.
Analysis Set Details ID Include in report Network flow scaling factor (%) Network capacity scaling factor (%)
A1 100.000 100.000
Junction Network
Junctions Junction Name Junction Type Major road direction Junction Delay (s) Junction LOS
1 untitled T-Junction Two-way 1.08 A
Junction Network Options [same as above]
Arms
Arms [same as above]
Major Arm Geometry [same as above]
Minor Arm Geometry [same as above]
Slope / Intercept / Capacity [same as above]
Traffic Demand
Demand Set Details
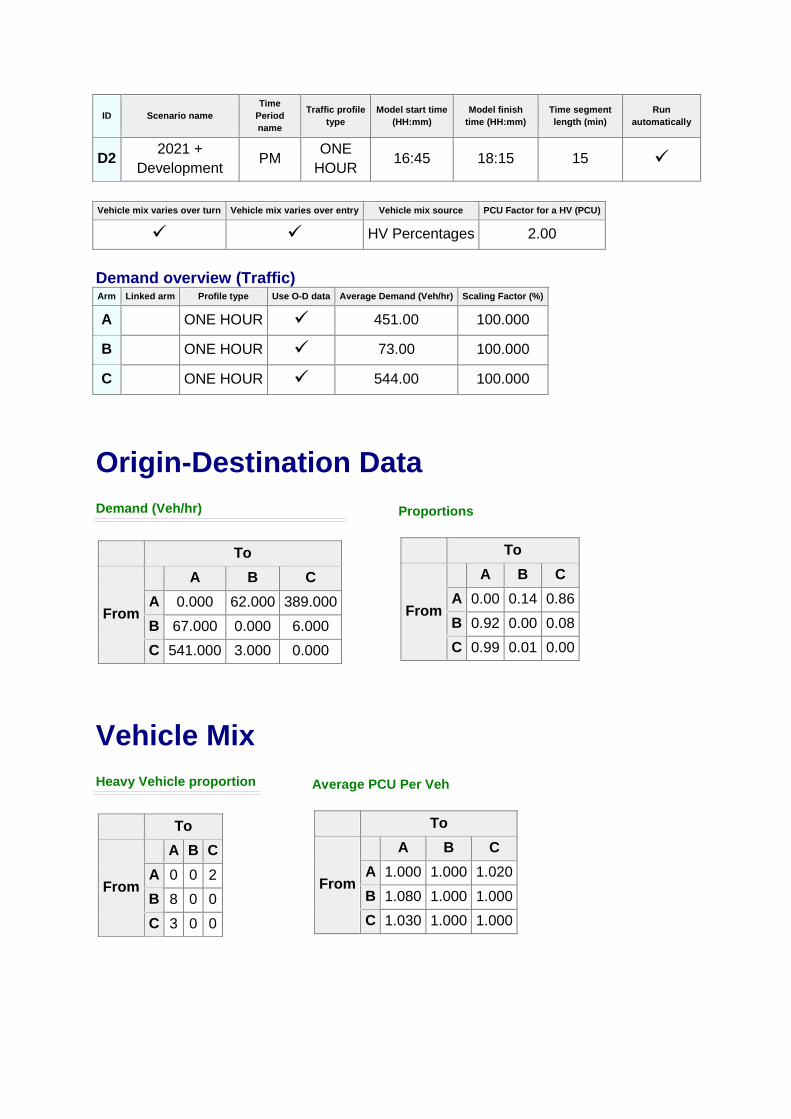
ID Scenario name
Time
Period
name
Traffic profile
type
Model start time
(HH:mm)
Model finish
time (HH:mm)
Time segment
length (min)
Run
automatically
D2 2021 +
Development PM
ONE
HOUR 16:45 18:15 15
Vehicle mix varies over turn Vehicle mix varies over entry Vehicle mix source PCU Factor for a HV (PCU)
HV Percentages 2.00
Demand overview (Traffic) Arm Linked arm Profile type Use O-D data Average Demand (Veh/hr) Scaling Factor (%)
A
ONE HOUR 451.00 100.000
B
ONE HOUR 73.00 100.000
C
ONE HOUR 544.00 100.000
Origin-Destination Data
Demand (Veh/hr)
To
From
A B C
A 0.000 62.000 389.000
B 67.000 0.000 6.000
C 541.000 3.000 0.000
Proportions
To
From
A B C
A 0.00 0.14 0.86
B 0.92 0.00 0.08
C 0.99 0.01 0.00
Vehicle Mix
Heavy Vehicle proportion
To
From
A B C
A 0 0 2
B 8 0 0
C 3 0 0
Average PCU Per Veh
To
From
A B C
A 1.000 1.000 1.020
B 1.080 1.000 1.000
C 1.030 1.000 1.000
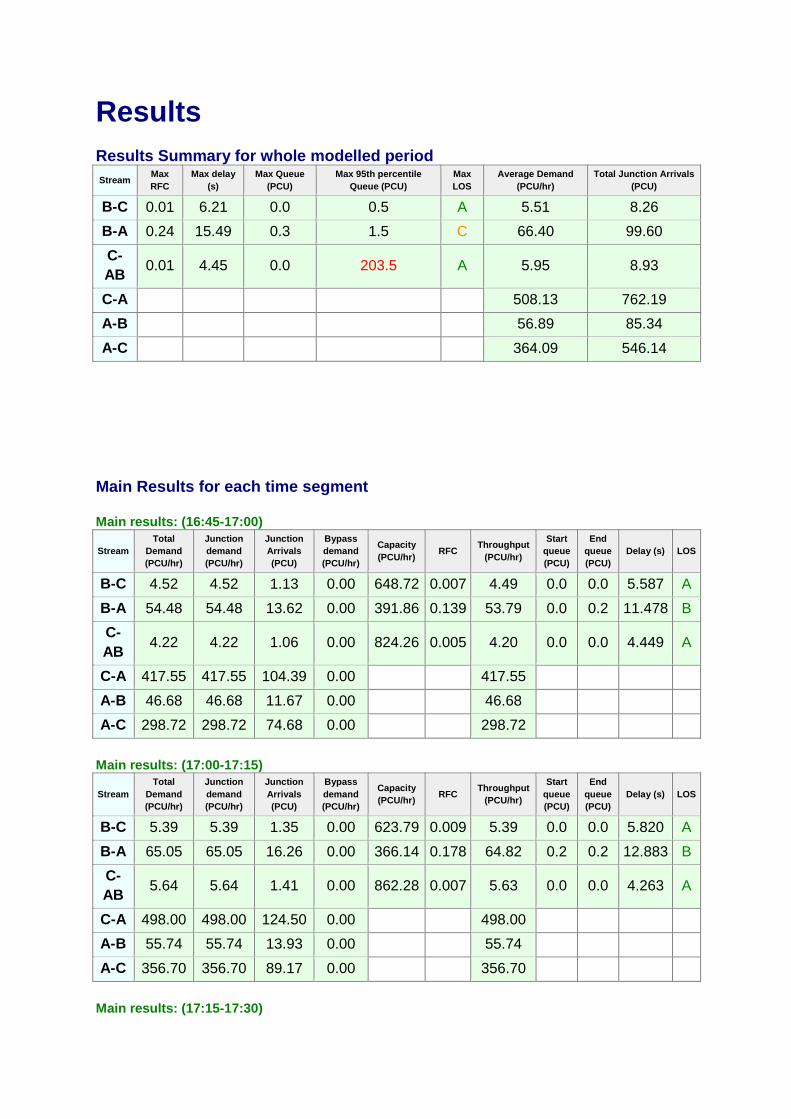
Results
Results Summary for whole modelled period
Stream Max
RFC
Max delay
(s)
Max Queue
(PCU)
Max 95th percentile
Queue (PCU)
Max
LOS
Average Demand
(PCU/hr)
Total Junction Arrivals
(PCU)
B-C 0.01 6.21 0.0 0.5 A 5.51 8.26
B-A 0.24 15.49 0.3 1.5 C 66.40 99.60
C-
AB 0.01 4.45 0.0 203.5 A 5.95 8.93
C-A
508.13 762.19
A-B
56.89 85.34
A-C
364.09 546.14
Main Results for each time segment
Main results: (16:45-17:00)
Stream
Total
Demand
(PCU/hr)
Junction
demand
(PCU/hr)
Junction
Arrivals
(PCU)
Bypass
demand
(PCU/hr)
Capacity
(PCU/hr) RFC
Throughput
(PCU/hr)
Start
queue
(PCU)
End
queue
(PCU)
Delay (s) LOS
B-C 4.52 4.52 1.13 0.00 648.72 0.007 4.49 0.0 0.0 5.587 A
B-A 54.48 54.48 13.62 0.00 391.86 0.139 53.79 0.0 0.2 11.478 B
C-
AB 4.22 4.22 1.06 0.00 824.26 0.005 4.20 0.0 0.0 4.449 A
C-A 417.55 417.55 104.39 0.00
417.55
A-B 46.68 46.68 11.67 0.00
46.68
A-C 298.72 298.72 74.68 0.00
298.72
Main results: (17:00-17:15)
Stream
Total
Demand
(PCU/hr)
Junction
demand
(PCU/hr)
Junction
Arrivals
(PCU)
Bypass
demand
(PCU/hr)
Capacity
(PCU/hr) RFC
Throughput
(PCU/hr)
Start
queue
(PCU)
End
queue
(PCU)
Delay (s) LOS
B-C 5.39 5.39 1.35 0.00 623.79 0.009 5.39 0.0 0.0 5.820 A
B-A 65.05 65.05 16.26 0.00 366.14 0.178 64.82 0.2 0.2 12.883 B
C-
AB 5.64 5.64 1.41 0.00 862.28 0.007 5.63 0.0 0.0 4.263 A
C-A 498.00 498.00 124.50 0.00
498.00
A-B 55.74 55.74 13.93 0.00
55.74
A-C 356.70 356.70 89.17 0.00
356.70
Main results: (17:15-17:30)
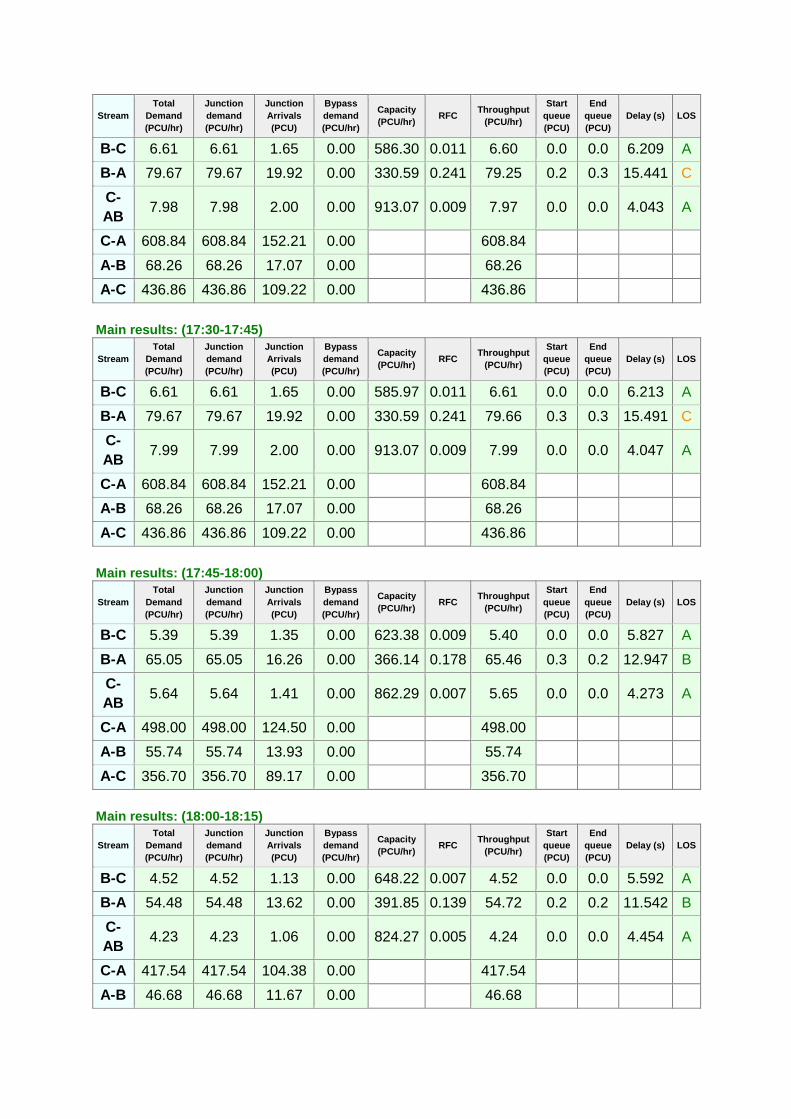
Stream
Total
Demand
(PCU/hr)
Junction
demand
(PCU/hr)
Junction
Arrivals
(PCU)
Bypass
demand
(PCU/hr)
Capacity
(PCU/hr) RFC
Throughput
(PCU/hr)
Start
queue
(PCU)
End
queue
(PCU)
Delay (s) LOS
B-C 6.61 6.61 1.65 0.00 586.30 0.011 6.60 0.0 0.0 6.209 A
B-A 79.67 79.67 19.92 0.00 330.59 0.241 79.25 0.2 0.3 15.441 C
C-
AB 7.98 7.98 2.00 0.00 913.07 0.009 7.97 0.0 0.0 4.043 A
C-A 608.84 608.84 152.21 0.00
608.84
A-B 68.26 68.26 17.07 0.00
68.26
A-C 436.86 436.86 109.22 0.00
436.86
Main results: (17:30-17:45)
Stream
Total
Demand
(PCU/hr)
Junction
demand
(PCU/hr)
Junction
Arrivals
(PCU)
Bypass
demand
(PCU/hr)
Capacity
(PCU/hr) RFC
Throughput
(PCU/hr)
Start
queue
(PCU)
End
queue
(PCU)
Delay (s) LOS
B-C 6.61 6.61 1.65 0.00 585.97 0.011 6.61 0.0 0.0 6.213 A
B-A 79.67 79.67 19.92 0.00 330.59 0.241 79.66 0.3 0.3 15.491 C
C-
AB 7.99 7.99 2.00 0.00 913.07 0.009 7.99 0.0 0.0 4.047 A
C-A 608.84 608.84 152.21 0.00
608.84
A-B 68.26 68.26 17.07 0.00
68.26
A-C 436.86 436.86 109.22 0.00
436.86
Main results: (17:45-18:00)
Stream
Total
Demand
(PCU/hr)
Junction
demand
(PCU/hr)
Junction
Arrivals
(PCU)
Bypass
demand
(PCU/hr)
Capacity
(PCU/hr) RFC
Throughput
(PCU/hr)
Start
queue
(PCU)
End
queue
(PCU)
Delay (s) LOS
B-C 5.39 5.39 1.35 0.00 623.38 0.009 5.40 0.0 0.0 5.827 A
B-A 65.05 65.05 16.26 0.00 366.14 0.178 65.46 0.3 0.2 12.947 B
C-
AB 5.64 5.64 1.41 0.00 862.29 0.007 5.65 0.0 0.0 4.273 A
C-A 498.00 498.00 124.50 0.00
498.00
A-B 55.74 55.74 13.93 0.00
55.74
A-C 356.70 356.70 89.17 0.00
356.70
Main results: (18:00-18:15)
Stream
Total
Demand
(PCU/hr)
Junction
demand
(PCU/hr)
Junction
Arrivals
(PCU)
Bypass
demand
(PCU/hr)
Capacity
(PCU/hr) RFC
Throughput
(PCU/hr)
Start
queue
(PCU)
End
queue
(PCU)
Delay (s) LOS
B-C 4.52 4.52 1.13 0.00 648.22 0.007 4.52 0.0 0.0 5.592 A
B-A 54.48 54.48 13.62 0.00 391.85 0.139 54.72 0.2 0.2 11.542 B
C-
AB 4.23 4.23 1.06 0.00 824.27 0.005 4.24 0.0 0.0 4.454 A
C-A 417.54 417.54 104.38 0.00
417.54
A-B 46.68 46.68 11.67 0.00
46.68
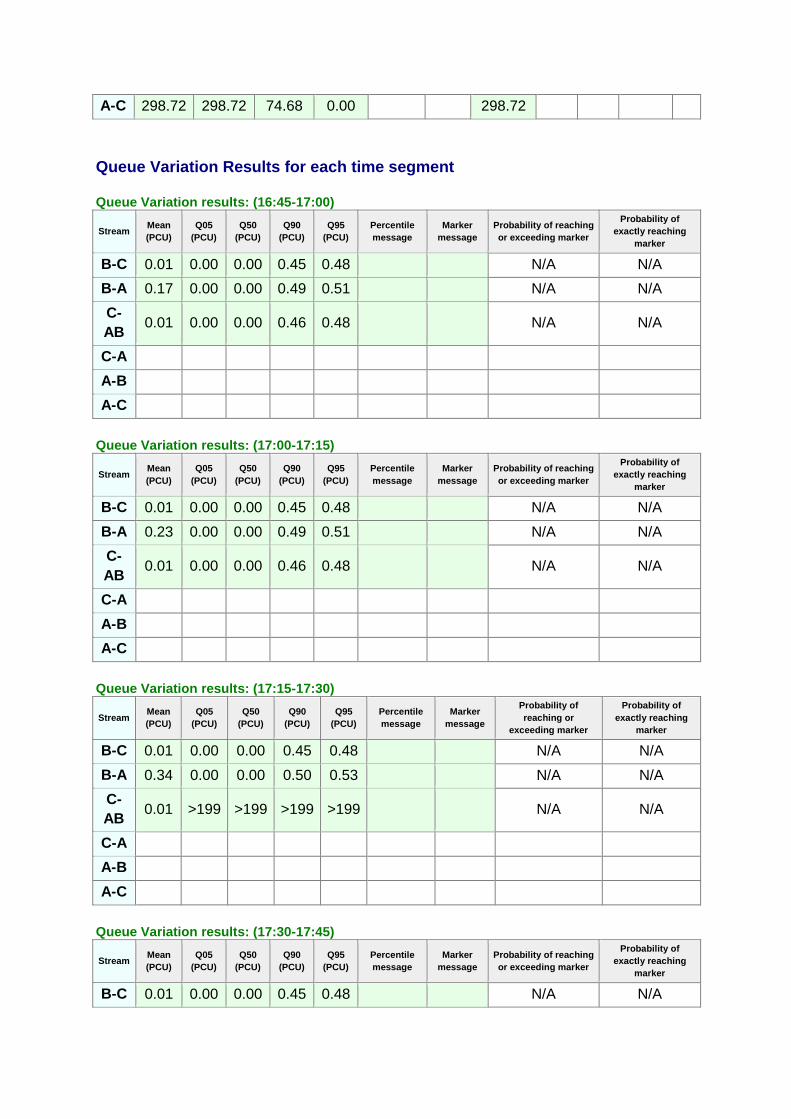
A-C 298.72 298.72 74.68 0.00
298.72
Queue Variation Results for each time segment
Queue Variation results: (16:45-17:00)
Stream Mean
(PCU)
Q05
(PCU)
Q50
(PCU)
Q90
(PCU)
Q95
(PCU)
Percentile
message
Marker
message
Probability of reaching
or exceeding marker
Probability of
exactly reaching
marker
B-C 0.01 0.00 0.00 0.45 0.48
N/A N/A
B-A 0.17 0.00 0.00 0.49 0.51
N/A N/A
C-
AB 0.01 0.00 0.00 0.46 0.48
N/A N/A
C-A
A-B
A-C
Queue Variation results: (17:00-17:15)
Stream Mean
(PCU)
Q05
(PCU)
Q50
(PCU)
Q90
(PCU)
Q95
(PCU)
Percentile
message
Marker
message
Probability of reaching
or exceeding marker
Probability of
exactly reaching
marker
B-C 0.01 0.00 0.00 0.45 0.48
N/A N/A
B-A 0.23 0.00 0.00 0.49 0.51
N/A N/A
C-
AB 0.01 0.00 0.00 0.46 0.48
N/A N/A
C-A
A-B
A-C
Queue Variation results: (17:15-17:30)
Stream Mean
(PCU)
Q05
(PCU)
Q50
(PCU)
Q90
(PCU)
Q95
(PCU)
Percentile
message
Marker
message
Probability of
reaching or
exceeding marker
Probability of
exactly reaching
marker
B-C 0.01 0.00 0.00 0.45 0.48
N/A N/A
B-A 0.34 0.00 0.00 0.50 0.53
N/A N/A
C-
AB 0.01 >199 >199 >199 >199
N/A N/A
C-A
A-B
A-C
Queue Variation results: (17:30-17:45)
Stream Mean
(PCU)
Q05
(PCU)
Q50
(PCU)
Q90
(PCU)
Q95
(PCU)
Percentile
message
Marker
message
Probability of reaching
or exceeding marker
Probability of
exactly reaching
marker
B-C 0.01 0.00 0.00 0.45 0.48
N/A N/A
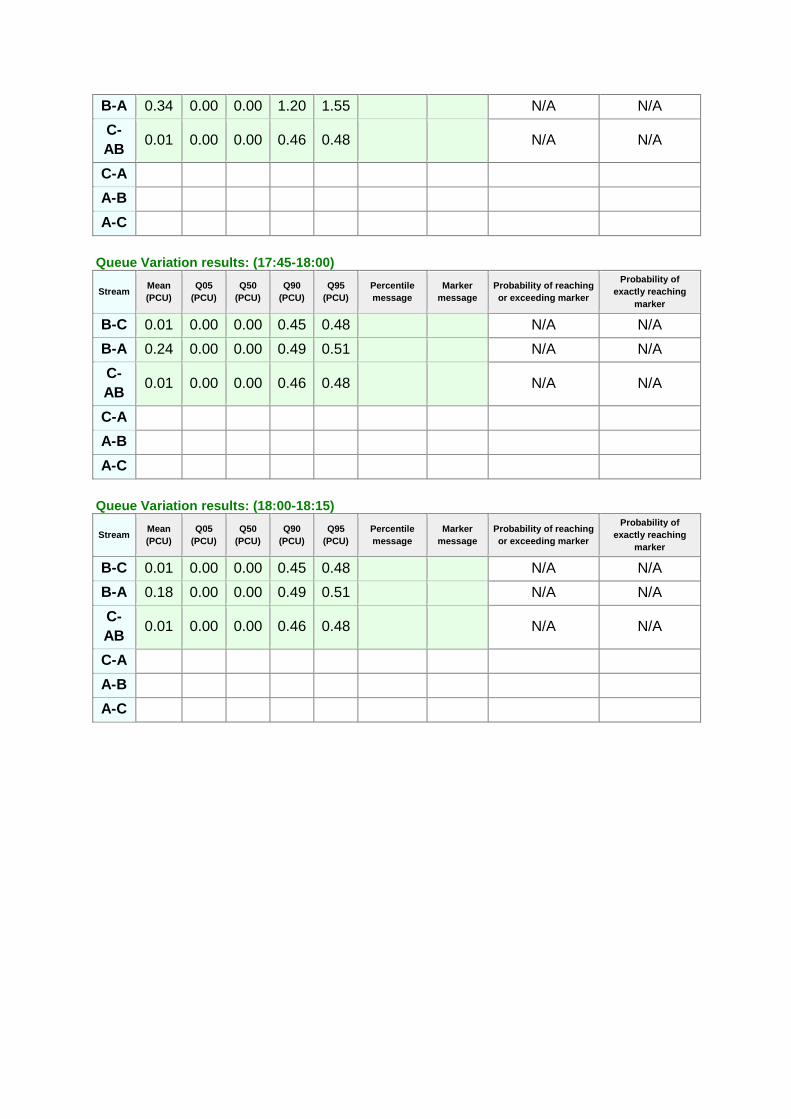
B-A 0.34 0.00 0.00 1.20 1.55
N/A N/A
C-
AB 0.01 0.00 0.00 0.46 0.48
N/A N/A
C-A
A-B
A-C
Queue Variation results: (17:45-18:00)
Stream Mean
(PCU)
Q05
(PCU)
Q50
(PCU)
Q90
(PCU)
Q95
(PCU)
Percentile
message
Marker
message
Probability of reaching
or exceeding marker
Probability of
exactly reaching
marker
B-C 0.01 0.00 0.00 0.45 0.48
N/A N/A
B-A 0.24 0.00 0.00 0.49 0.51
N/A N/A
C-
AB 0.01 0.00 0.00 0.46 0.48
N/A N/A
C-A
A-B
A-C
Queue Variation results: (18:00-18:15)
Stream Mean
(PCU)
Q05
(PCU)
Q50
(PCU)
Q90
(PCU)
Q95
(PCU)
Percentile
message
Marker
message
Probability of reaching
or exceeding marker
Probability of
exactly reaching
marker
B-C 0.01 0.00 0.00 0.45 0.48
N/A N/A
B-A 0.18 0.00 0.00 0.49 0.51
N/A N/A
C-
AB 0.01 0.00 0.00 0.46 0.48
N/A N/A
C-A
A-B
A-C

APPENDIX H
ARCADY Output
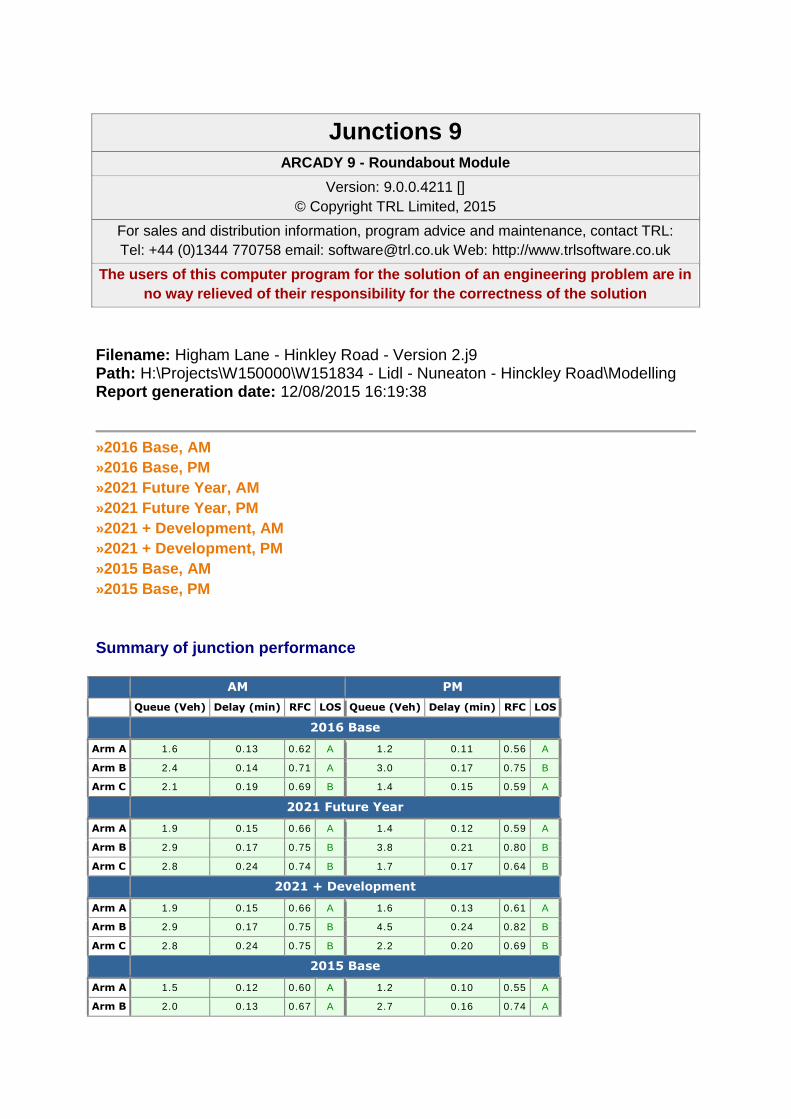
Junctions 9
ARCADY 9 - Roundabout Module
Version: 9.0.0.4211 []
© Copyright TRL Limited, 2015
For sales and distribution information, program advice and maintenance, contact TRL:
Tel: +44 (0)1344 770758 email: [email protected] Web: http://www.trlsoftware.co.uk
The users of this computer program for the solution of an engineering problem are in
no way relieved of their responsibility for the correctness of the solution
Filename: Higham Lane - Hinkley Road - Version 2.j9 Path: H:\Projects\W150000\W151834 - Lidl - Nuneaton - Hinckley Road\Modelling Report generation date: 12/08/2015 16:19:38
»2016 Base, AM
»2016 Base, PM
»2021 Future Year, AM
»2021 Future Year, PM
»2021 + Development, AM
»2021 + Development, PM
»2015 Base, AM
»2015 Base, PM
Summary of junction performance
AM PM
Queue (Veh) Delay (min) RFC LOS Queue (Veh) Delay (min) RFC LOS
2016 Base
Arm A 1.6 0.13 0.62 A 1.2 0.11 0.56 A
Arm B 2.4 0.14 0.71 A 3.0 0.17 0.75 B
Arm C 2.1 0.19 0.69 B 1.4 0.15 0.59 A
2021 Future Year
Arm A 1.9 0.15 0.66 A 1.4 0.12 0.59 A
Arm B 2.9 0.17 0.75 B 3.8 0.21 0.80 B
Arm C 2.8 0.24 0.74 B 1.7 0.17 0.64 B
2021 + Development
Arm A 1.9 0.15 0.66 A 1.6 0.13 0.61 A
Arm B 2.9 0.17 0.75 B 4.5 0.24 0.82 B
Arm C 2.8 0.24 0.75 B 2.2 0.20 0.69 B
2015 Base
Arm A 1.5 0.12 0.60 A 1.2 0.10 0.55 A
Arm B 2.0 0.13 0.67 A 2.7 0.16 0.74 A
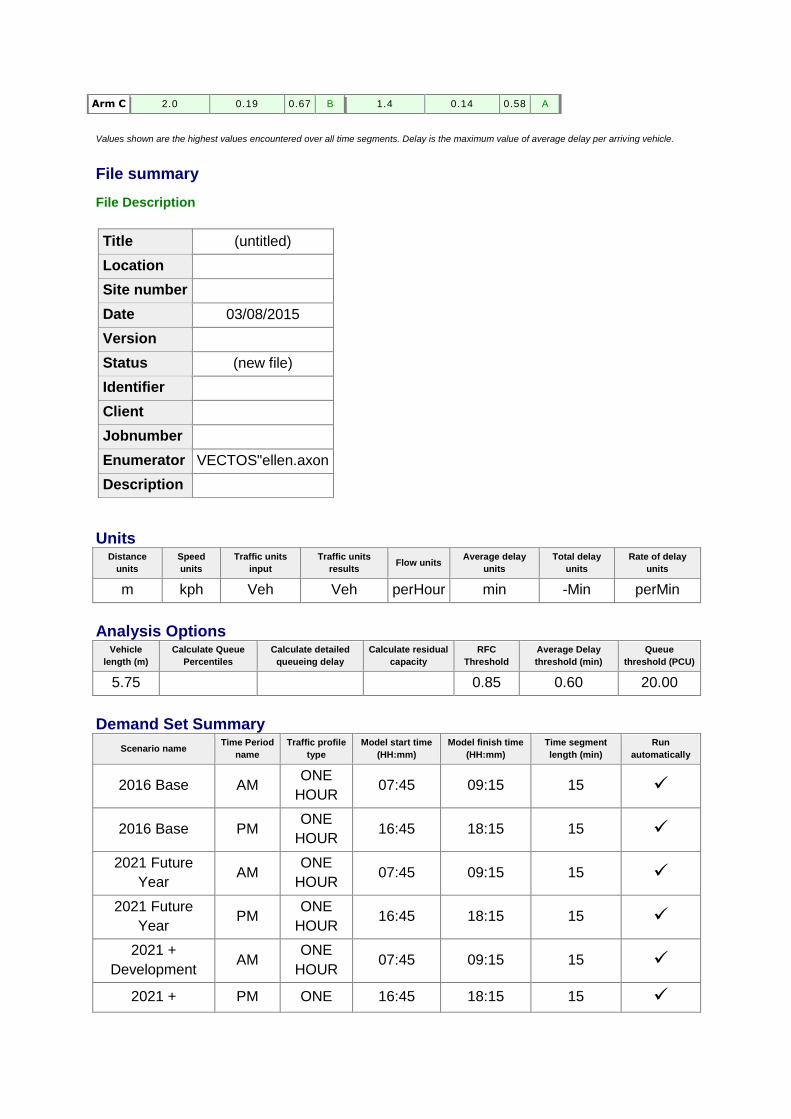
Arm C 2.0 0.19 0.67 B 1.4 0.14 0.58 A
Values shown are the highest values encountered over all time segments. Delay is the maximum value of average delay per arriving vehicle.
File summary
File Description
Title (untitled)
Location
Site number
Date 03/08/2015
Version
Status (new file)
Identifier
Client
Jobnumber
Enumerator VECTOS"ellen.axon
Description
Units Distance
units
Speed
units
Traffic units
input
Traffic units
results Flow units
Average delay
units
Total delay
units
Rate of delay
units
m kph Veh Veh perHour min -Min perMin
Analysis Options Vehicle
length (m)
Calculate Queue
Percentiles
Calculate detailed
queueing delay
Calculate residual
capacity
RFC
Threshold
Average Delay
threshold (min)
Queue
threshold (PCU)
5.75
0.85 0.60 20.00
Demand Set Summary
Scenario name Time Period
name
Traffic profile
type
Model start time
(HH:mm)
Model finish time
(HH:mm)
Time segment
length (min)
Run
automatically
2016 Base AM ONE
HOUR 07:45 09:15 15
2016 Base PM ONE
HOUR 16:45 18:15 15
2021 Future
Year AM
ONE
HOUR 07:45 09:15 15
2021 Future
Year PM
ONE
HOUR 16:45 18:15 15
2021 +
Development AM
ONE
HOUR 07:45 09:15 15
2021 + PM ONE 16:45 18:15 15
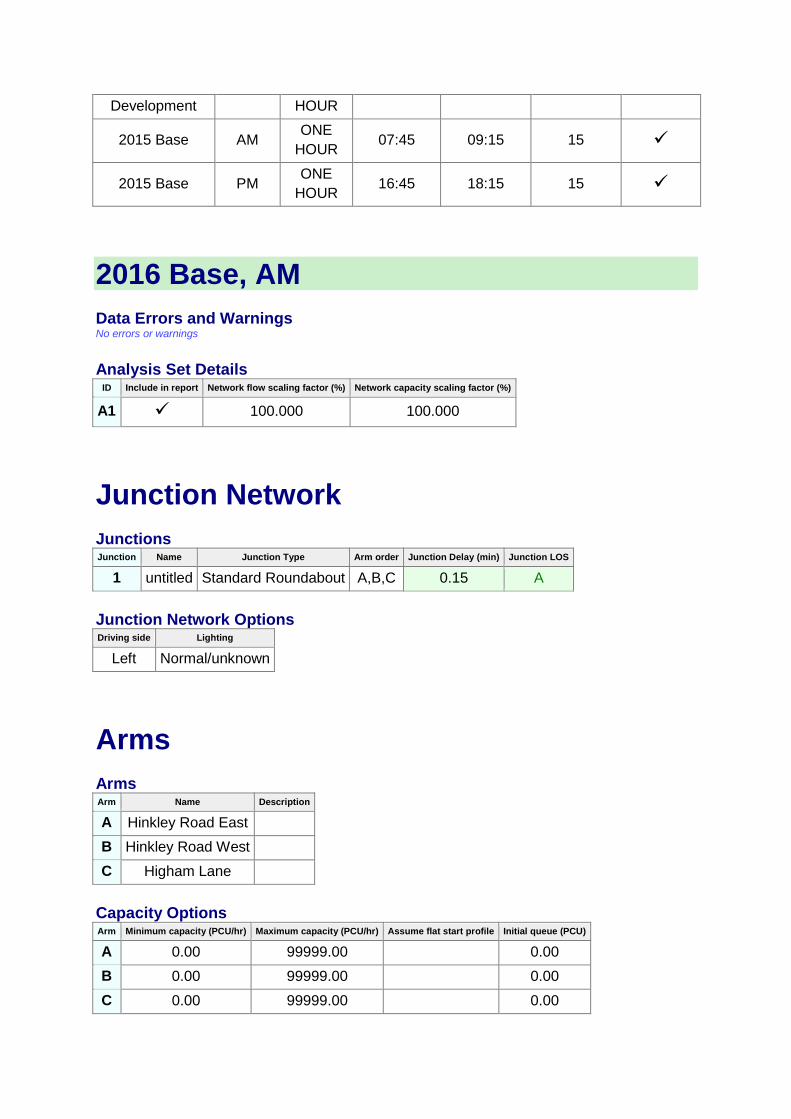
Development HOUR
2015 Base AM ONE
HOUR 07:45 09:15 15
2015 Base PM ONE
HOUR 16:45 18:15 15
2016 Base, AM
Data Errors and Warnings No errors or warnings
Analysis Set Details ID Include in report Network flow scaling factor (%) Network capacity scaling factor (%)
A1 100.000 100.000
Junction Network
Junctions Junction Name Junction Type Arm order Junction Delay (min) Junction LOS
1 untitled Standard Roundabout A,B,C 0.15 A
Junction Network Options Driving side Lighting
Left Normal/unknown
Arms
Arms Arm Name Description
A Hinkley Road East
B Hinkley Road West
C Higham Lane
Capacity Options Arm Minimum capacity (PCU/hr) Maximum capacity (PCU/hr) Assume flat start profile Initial queue (PCU)
A 0.00 99999.00
0.00
B 0.00 99999.00
0.00
C 0.00 99999.00
0.00
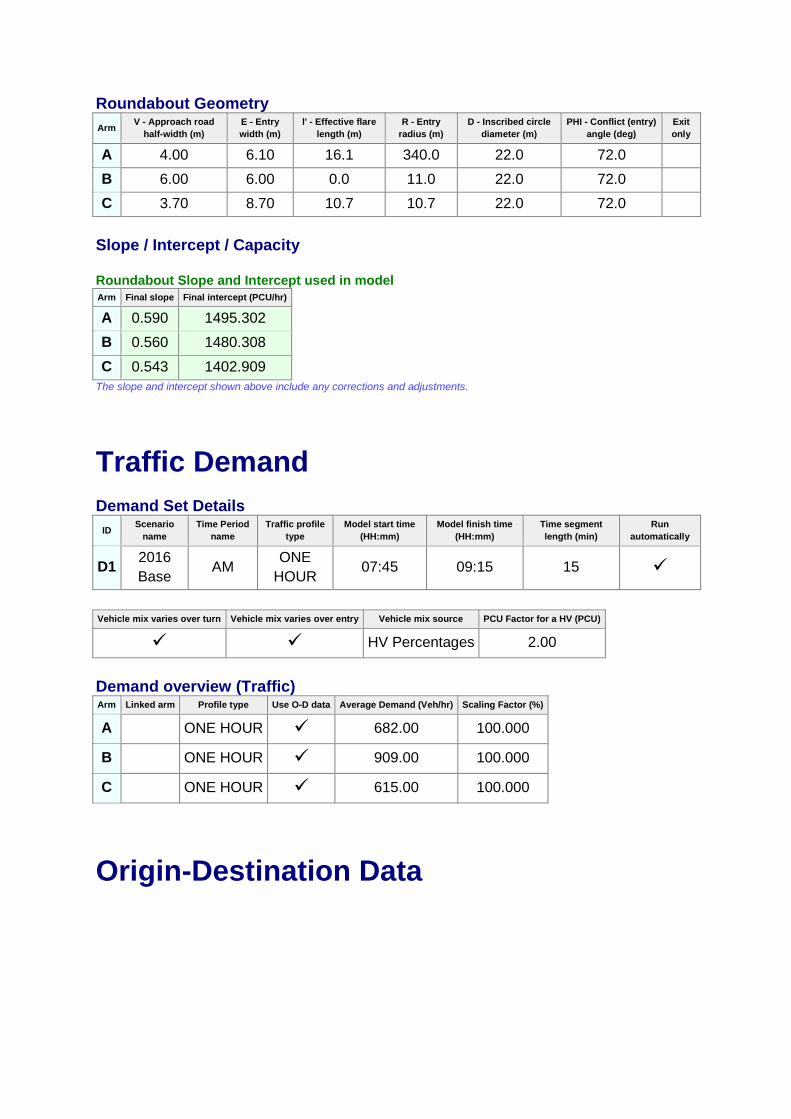
Roundabout Geometry
Arm V - Approach road
half-width (m)
E - Entry
width (m)
l' - Effective flare
length (m)
R - Entry
radius (m)
D - Inscribed circle
diameter (m)
PHI - Conflict (entry)
angle (deg)
Exit
only
A 4.00 6.10 16.1 340.0 22.0 72.0
B 6.00 6.00 0.0 11.0 22.0 72.0
C 3.70 8.70 10.7 10.7 22.0 72.0
Slope / Intercept / Capacity
Roundabout Slope and Intercept used in model
Arm Final slope Final intercept (PCU/hr)
A 0.590 1495.302
B 0.560 1480.308
C 0.543 1402.909 The slope and intercept shown above include any corrections and adjustments.
Traffic Demand
Demand Set Details
ID Scenario
name
Time Period
name
Traffic profile
type
Model start time
(HH:mm)
Model finish time
(HH:mm)
Time segment
length (min)
Run
automatically
D1 2016
Base AM
ONE
HOUR 07:45 09:15 15
Vehicle mix varies over turn Vehicle mix varies over entry Vehicle mix source PCU Factor for a HV (PCU)
HV Percentages 2.00
Demand overview (Traffic) Arm Linked arm Profile type Use O-D data Average Demand (Veh/hr) Scaling Factor (%)
A
ONE HOUR 682.00 100.000
B
ONE HOUR 909.00 100.000
C
ONE HOUR 615.00 100.000
Origin-Destination Data
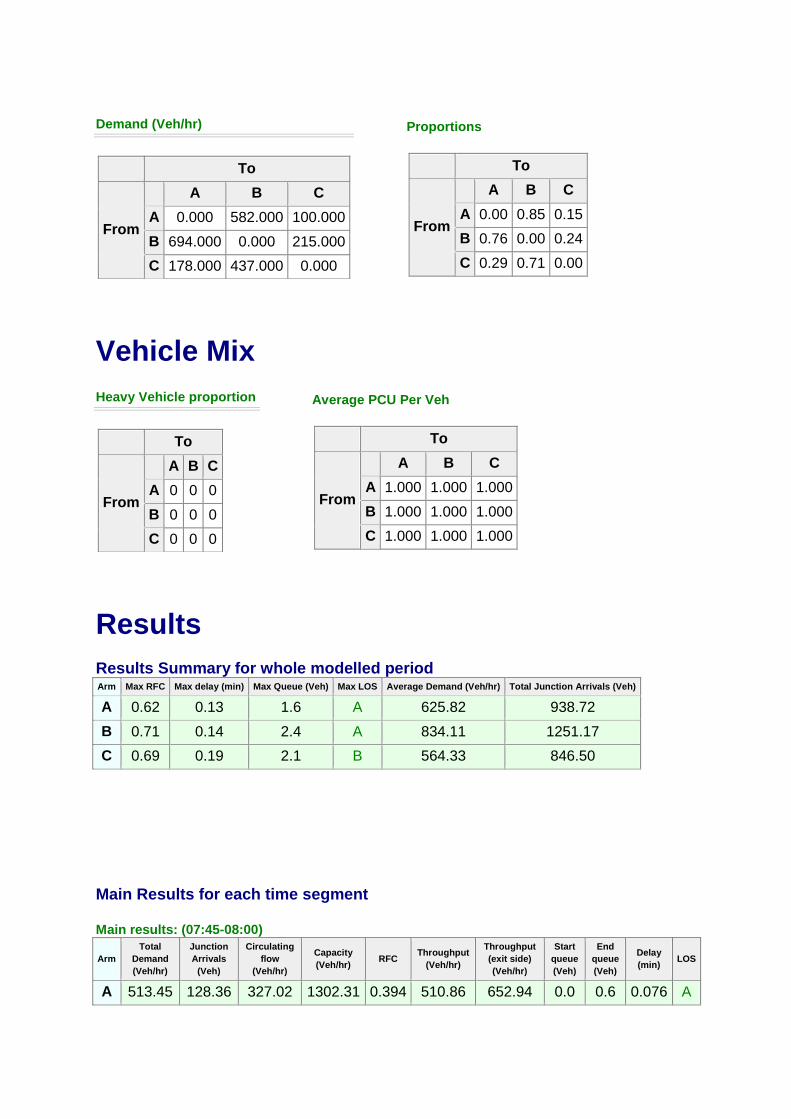
Demand (Veh/hr)
To
From
A B C
A 0.000 582.000 100.000
B 694.000 0.000 215.000
C 178.000 437.000 0.000
Proportions
To
From
A B C
A 0.00 0.85 0.15
B 0.76 0.00 0.24
C 0.29 0.71 0.00
Vehicle Mix
Heavy Vehicle proportion
To
From
A B C
A 0 0 0
B 0 0 0
C 0 0 0
Average PCU Per Veh
To
From
A B C
A 1.000 1.000 1.000
B 1.000 1.000 1.000
C 1.000 1.000 1.000
Results
Results Summary for whole modelled period Arm Max RFC Max delay (min) Max Queue (Veh) Max LOS Average Demand (Veh/hr) Total Junction Arrivals (Veh)
A 0.62 0.13 1.6 A 625.82 938.72
B 0.71 0.14 2.4 A 834.11 1251.17
C 0.69 0.19 2.1 B 564.33 846.50
Main Results for each time segment
Main results: (07:45-08:00)
Arm
Total
Demand
(Veh/hr)
Junction
Arrivals
(Veh)
Circulating
flow
(Veh/hr)
Capacity
(Veh/hr) RFC
Throughput
(Veh/hr)
Throughput
(exit side)
(Veh/hr)
Start
queue
(Veh)
End
queue
(Veh)
Delay
(min) LOS
A 513.45 128.36 327.02 1302.31 0.394 510.86 652.94 0.0 0.6 0.076 A
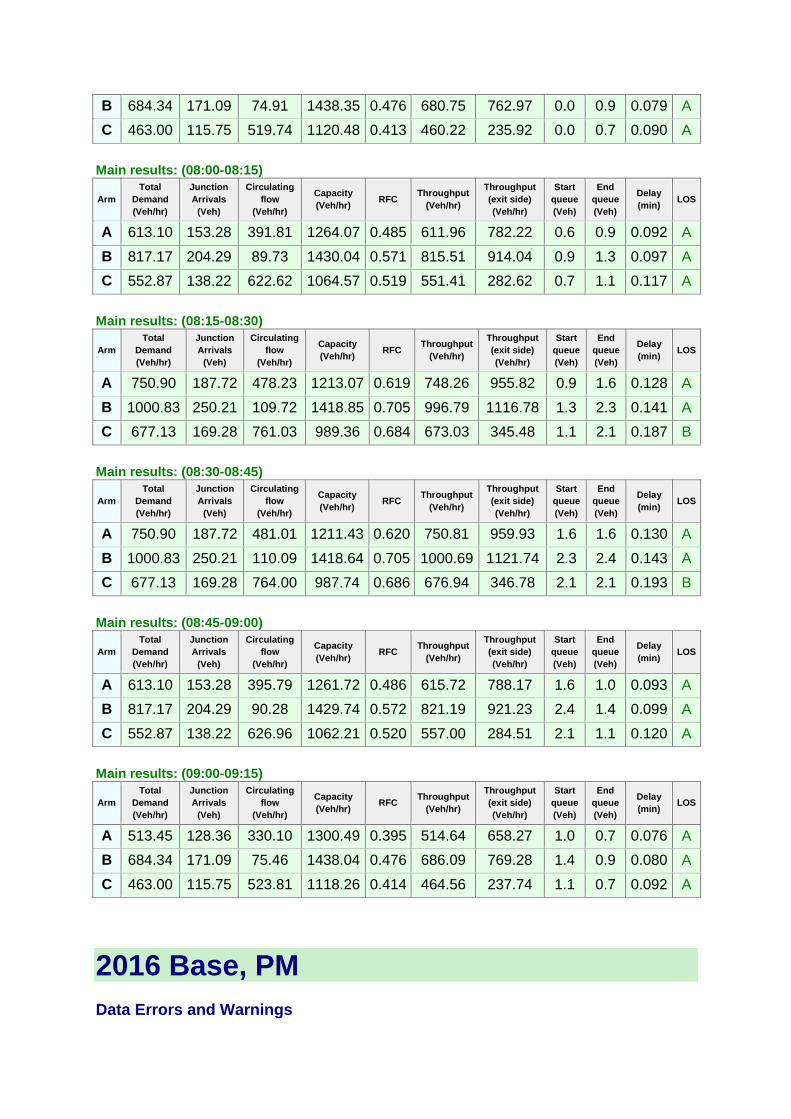
B 684.34 171.09 74.91 1438.35 0.476 680.75 762.97 0.0 0.9 0.079 A
C 463.00 115.75 519.74 1120.48 0.413 460.22 235.92 0.0 0.7 0.090 A
Main results: (08:00-08:15)
Arm
Total
Demand
(Veh/hr)
Junction
Arrivals
(Veh)
Circulating
flow
(Veh/hr)
Capacity
(Veh/hr) RFC
Throughput
(Veh/hr)
Throughput
(exit side)
(Veh/hr)
Start
queue
(Veh)
End
queue
(Veh)
Delay
(min) LOS
A 613.10 153.28 391.81 1264.07 0.485 611.96 782.22 0.6 0.9 0.092 A
B 817.17 204.29 89.73 1430.04 0.571 815.51 914.04 0.9 1.3 0.097 A
C 552.87 138.22 622.62 1064.57 0.519 551.41 282.62 0.7 1.1 0.117 A
Main results: (08:15-08:30)
Arm
Total
Demand
(Veh/hr)
Junction
Arrivals
(Veh)
Circulating
flow
(Veh/hr)
Capacity
(Veh/hr) RFC
Throughput
(Veh/hr)
Throughput
(exit side)
(Veh/hr)
Start
queue
(Veh)
End
queue
(Veh)
Delay
(min) LOS
A 750.90 187.72 478.23 1213.07 0.619 748.26 955.82 0.9 1.6 0.128 A
B 1000.83 250.21 109.72 1418.85 0.705 996.79 1116.78 1.3 2.3 0.141 A
C 677.13 169.28 761.03 989.36 0.684 673.03 345.48 1.1 2.1 0.187 B
Main results: (08:30-08:45)
Arm
Total
Demand
(Veh/hr)
Junction
Arrivals
(Veh)
Circulating
flow
(Veh/hr)
Capacity
(Veh/hr) RFC
Throughput
(Veh/hr)
Throughput
(exit side)
(Veh/hr)
Start
queue
(Veh)
End
queue
(Veh)
Delay
(min) LOS
A 750.90 187.72 481.01 1211.43 0.620 750.81 959.93 1.6 1.6 0.130 A
B 1000.83 250.21 110.09 1418.64 0.705 1000.69 1121.74 2.3 2.4 0.143 A
C 677.13 169.28 764.00 987.74 0.686 676.94 346.78 2.1 2.1 0.193 B
Main results: (08:45-09:00)
Arm
Total
Demand
(Veh/hr)
Junction
Arrivals
(Veh)
Circulating
flow
(Veh/hr)
Capacity
(Veh/hr) RFC
Throughput
(Veh/hr)
Throughput
(exit side)
(Veh/hr)
Start
queue
(Veh)
End
queue
(Veh)
Delay
(min) LOS
A 613.10 153.28 395.79 1261.72 0.486 615.72 788.17 1.6 1.0 0.093 A
B 817.17 204.29 90.28 1429.74 0.572 821.19 921.23 2.4 1.4 0.099 A
C 552.87 138.22 626.96 1062.21 0.520 557.00 284.51 2.1 1.1 0.120 A
Main results: (09:00-09:15)
Arm
Total
Demand
(Veh/hr)
Junction
Arrivals
(Veh)
Circulating
flow
(Veh/hr)
Capacity
(Veh/hr) RFC
Throughput
(Veh/hr)
Throughput
(exit side)
(Veh/hr)
Start
queue
(Veh)
End
queue
(Veh)
Delay
(min) LOS
A 513.45 128.36 330.10 1300.49 0.395 514.64 658.27 1.0 0.7 0.076 A
B 684.34 171.09 75.46 1438.04 0.476 686.09 769.28 1.4 0.9 0.080 A
C 463.00 115.75 523.81 1118.26 0.414 464.56 237.74 1.1 0.7 0.092 A
2016 Base, PM
Data Errors and Warnings
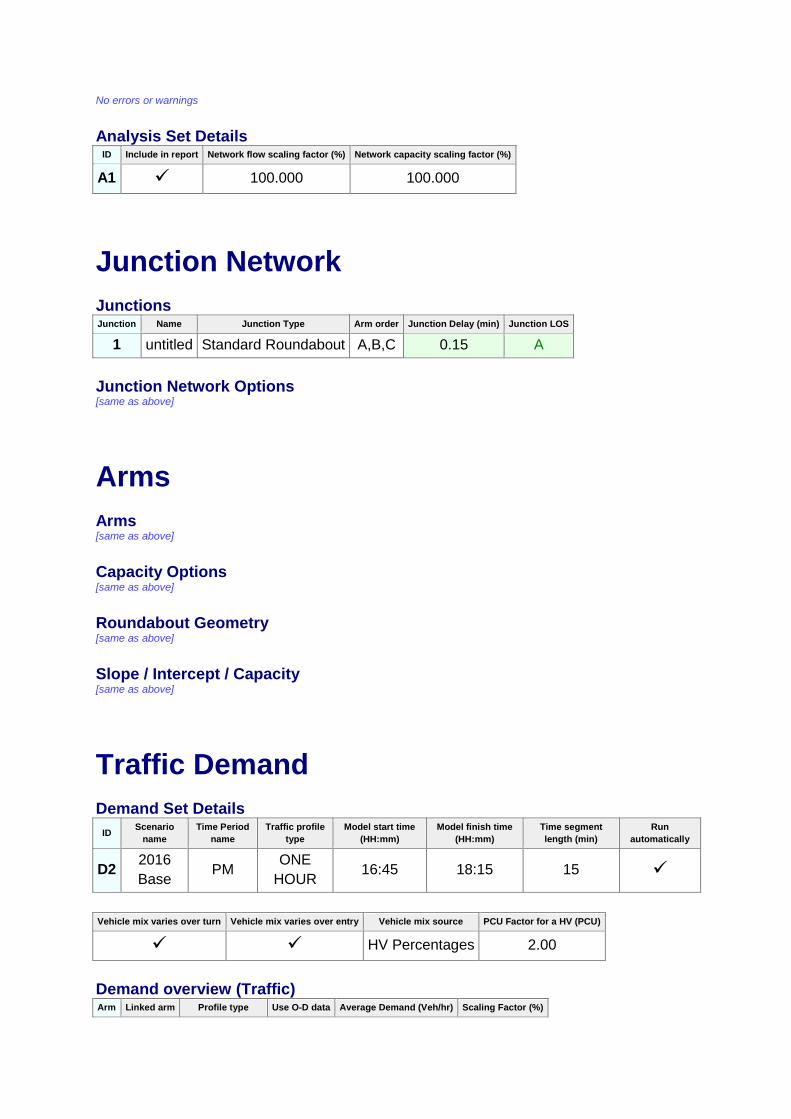
No errors or warnings
Analysis Set Details ID Include in report Network flow scaling factor (%) Network capacity scaling factor (%)
A1 100.000 100.000
Junction Network
Junctions Junction Name Junction Type Arm order Junction Delay (min) Junction LOS
1 untitled Standard Roundabout A,B,C 0.15 A
Junction Network Options [same as above]
Arms
Arms [same as above]
Capacity Options [same as above]
Roundabout Geometry [same as above]
Slope / Intercept / Capacity [same as above]
Traffic Demand
Demand Set Details
ID Scenario
name
Time Period
name
Traffic profile
type
Model start time
(HH:mm)
Model finish time
(HH:mm)
Time segment
length (min)
Run
automatically
D2 2016
Base PM
ONE
HOUR 16:45 18:15 15
Vehicle mix varies over turn Vehicle mix varies over entry Vehicle mix source PCU Factor for a HV (PCU)
HV Percentages 2.00
Demand overview (Traffic) Arm Linked arm Profile type Use O-D data Average Demand (Veh/hr) Scaling Factor (%)
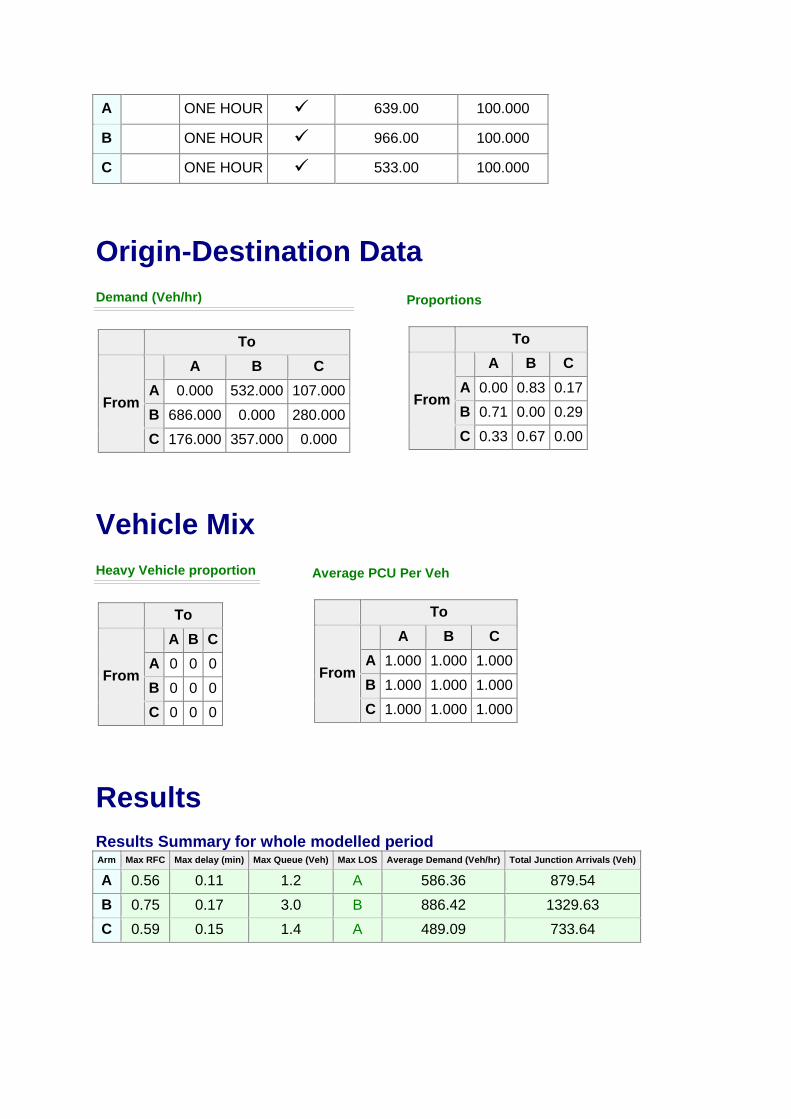
A
ONE HOUR 639.00 100.000
B
ONE HOUR 966.00 100.000
C
ONE HOUR 533.00 100.000
Origin-Destination Data
Demand (Veh/hr)
To
From
A B C
A 0.000 532.000 107.000
B 686.000 0.000 280.000
C 176.000 357.000 0.000
Proportions
To
From
A B C
A 0.00 0.83 0.17
B 0.71 0.00 0.29
C 0.33 0.67 0.00
Vehicle Mix
Heavy Vehicle proportion
To
From
A B C
A 0 0 0
B 0 0 0
C 0 0 0
Average PCU Per Veh
To
From
A B C
A 1.000 1.000 1.000
B 1.000 1.000 1.000
C 1.000 1.000 1.000
Results
Results Summary for whole modelled period Arm Max RFC Max delay (min) Max Queue (Veh) Max LOS Average Demand (Veh/hr) Total Junction Arrivals (Veh)
A 0.56 0.11 1.2 A 586.36 879.54
B 0.75 0.17 3.0 B 886.42 1329.63
C 0.59 0.15 1.4 A 489.09 733.64

Main Results for each time segment
Main results: (16:45-17:00)
Arm
Total
Demand
(Veh/hr)
Junction
Arrivals
(Veh)
Circulating
flow
(Veh/hr)
Capacity
(Veh/hr) RFC
Throughput
(Veh/hr)
Throughput
(exit side)
(Veh/hr)
Start
queue
(Veh)
End
queue
(Veh)
Delay
(min) LOS
A 481.07 120.27 267.29 1337.56 0.360 478.84 645.35 0.0 0.6 0.070 A
B 727.26 181.81 80.18 1435.39 0.507 723.19 665.95 0.0 1.0 0.084 A
C 401.27 100.32 513.57 1123.83 0.357 399.07 289.80 0.0 0.6 0.083 A
Main results: (17:00-17:15)
Arm
Total
Demand
(Veh/hr)
Junction
Arrivals
(Veh)
Circulating
flow
(Veh/hr)
Capacity
(Veh/hr) RFC
Throughput
(Veh/hr)
Throughput
(exit side)
(Veh/hr)
Start
queue
(Veh)
End
queue
(Veh)
Delay
(min) LOS
A 574.45 143.61 320.26 1306.30 0.440 573.57 773.13 0.6 0.8 0.082 A
B 868.41 217.10 96.04 1426.51 0.609 866.36 797.78 1.0 1.5 0.107 A
C 479.16 119.79 615.24 1068.58 0.448 478.15 347.16 0.6 0.8 0.101 A
Main results: (17:15-17:30)
Arm
Total
Demand
(Veh/hr)
Junction
Arrivals
(Veh)
Circulating
flow
(Veh/hr)
Capacity
(Veh/hr) RFC
Throughput
(Veh/hr)
Throughput
(exit side)
(Veh/hr)
Start
queue
(Veh)
End
queue
(Veh)
Delay
(min) LOS
A 703.55 175.89 391.45 1264.29 0.556 701.72 944.37 0.8 1.2 0.106 A
B 1063.59 265.90 117.50 1414.49 0.752 1058.08 975.67 1.5 2.9 0.166 A
C 586.84 146.71 751.39 994.60 0.590 584.43 424.19 0.8 1.4 0.145 A
Main results: (17:30-17:45)
Arm
Total
Demand
(Veh/hr)
Junction
Arrivals
(Veh)
Circulating
flow
(Veh/hr)
Capacity
(Veh/hr) RFC
Throughput
(Veh/hr)
Throughput
(exit side)
(Veh/hr)
Start
queue
(Veh)
End
queue
(Veh)
Delay
(min) LOS
A 703.55 175.89 393.01 1263.36 0.557 703.51 948.88 1.2 1.2 0.107 A
B 1063.59 265.90 117.80 1414.32 0.752 1063.34 978.71 2.9 3.0 0.171 B
C 586.84 146.71 755.13 992.56 0.591 586.76 426.02 1.4 1.4 0.148 A
Main results: (17:45-18:00)
Arm
Total
Demand
(Veh/hr)
Junction
Arrivals
(Veh)
Circulating
flow
(Veh/hr)
Capacity
(Veh/hr) RFC
Throughput
(Veh/hr)
Throughput
(exit side)
(Veh/hr)
Start
queue
(Veh)
End
queue
(Veh)
Delay
(min) LOS
A 574.45 143.61 322.55 1304.95 0.440 576.26 779.64 1.2 0.8 0.083 A
B 868.41 217.10 96.49 1426.26 0.609 873.94 802.31 3.0 1.6 0.110 A
C 479.16 119.79 620.62 1065.66 0.450 481.56 349.81 1.4 0.8 0.103 A
Main results: (18:00-18:15)
Arm
Total
Demand
(Veh/hr)
Junction
Arrivals
(Veh)
Circulating
flow
(Veh/hr)
Capacity
(Veh/hr) RFC
Throughput
(Veh/hr)
Throughput
(exit side)
(Veh/hr)
Start
queue
(Veh)
End
queue
(Veh)
Delay
(min) LOS
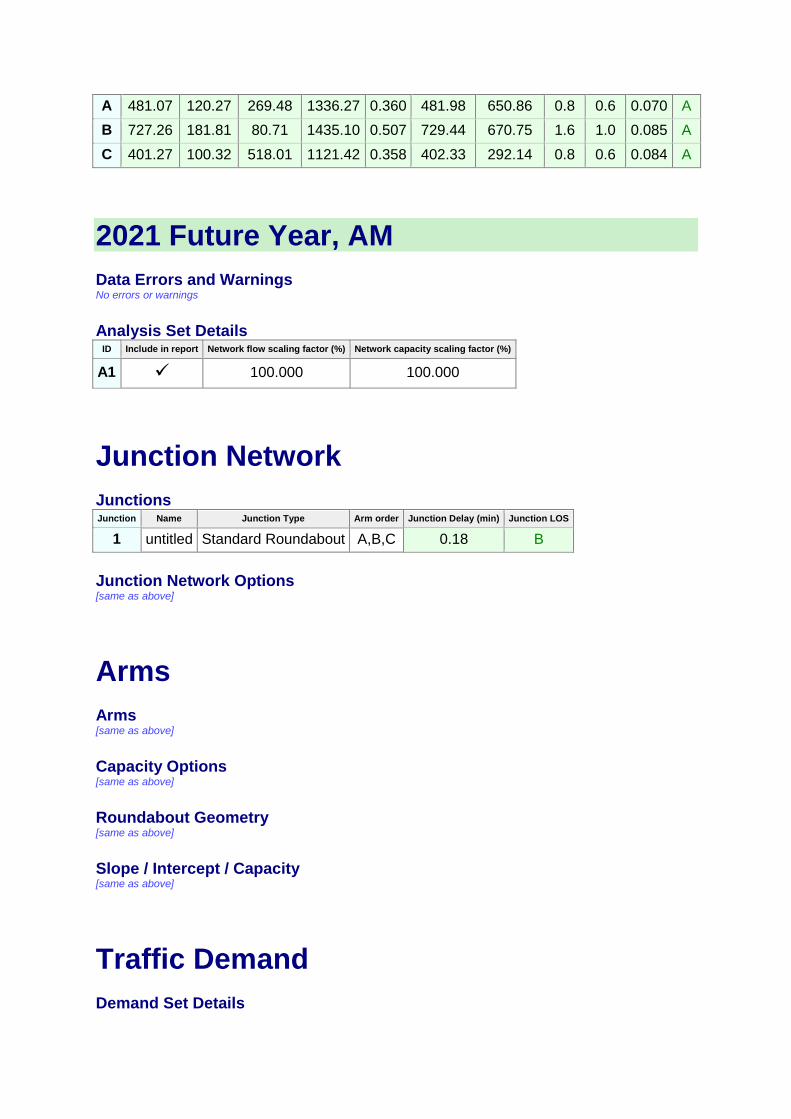
A 481.07 120.27 269.48 1336.27 0.360 481.98 650.86 0.8 0.6 0.070 A
B 727.26 181.81 80.71 1435.10 0.507 729.44 670.75 1.6 1.0 0.085 A
C 401.27 100.32 518.01 1121.42 0.358 402.33 292.14 0.8 0.6 0.084 A
2021 Future Year, AM
Data Errors and Warnings No errors or warnings
Analysis Set Details ID Include in report Network flow scaling factor (%) Network capacity scaling factor (%)
A1 100.000 100.000
Junction Network
Junctions Junction Name Junction Type Arm order Junction Delay (min) Junction LOS
1 untitled Standard Roundabout A,B,C 0.18 B
Junction Network Options [same as above]
Arms
Arms [same as above]
Capacity Options [same as above]
Roundabout Geometry [same as above]
Slope / Intercept / Capacity [same as above]
Traffic Demand
Demand Set Details
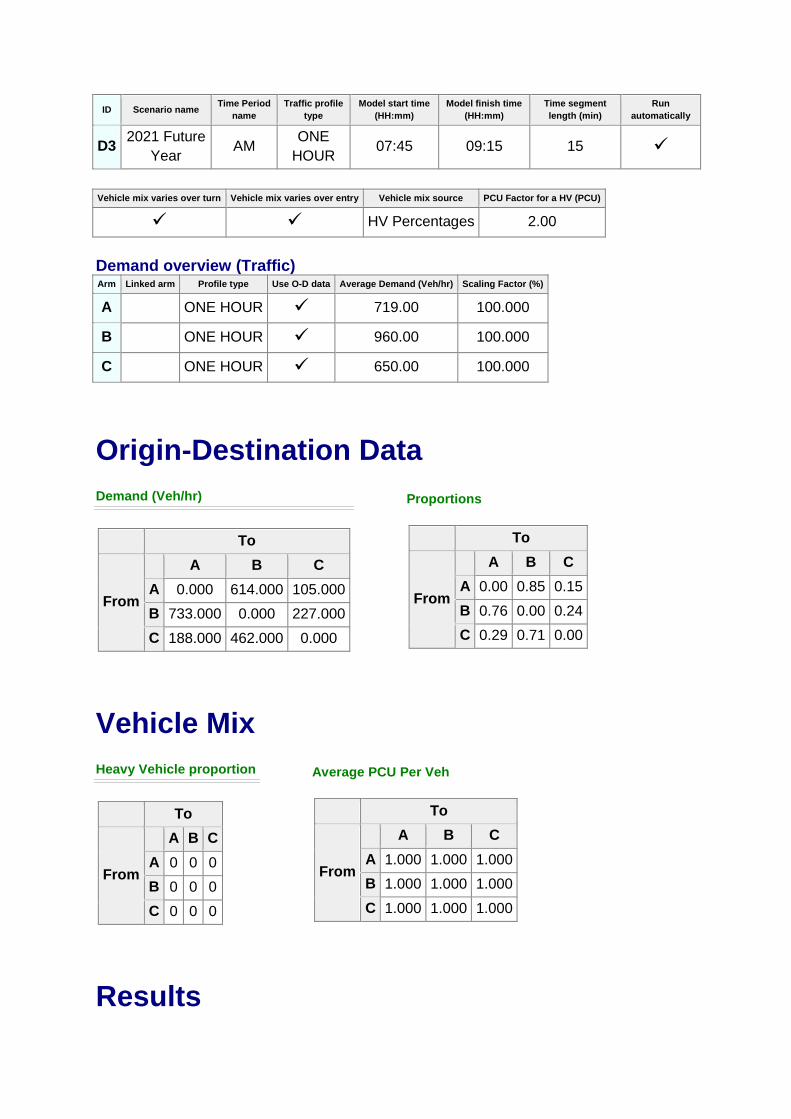
ID Scenario name Time Period
name
Traffic profile
type
Model start time
(HH:mm)
Model finish time
(HH:mm)
Time segment
length (min)
Run
automatically
D3 2021 Future
Year AM
ONE
HOUR 07:45 09:15 15
Vehicle mix varies over turn Vehicle mix varies over entry Vehicle mix source PCU Factor for a HV (PCU)
HV Percentages 2.00
Demand overview (Traffic) Arm Linked arm Profile type Use O-D data Average Demand (Veh/hr) Scaling Factor (%)
A
ONE HOUR 719.00 100.000
B
ONE HOUR 960.00 100.000
C
ONE HOUR 650.00 100.000
Origin-Destination Data
Demand (Veh/hr)
To
From
A B C
A 0.000 614.000 105.000
B 733.000 0.000 227.000
C 188.000 462.000 0.000
Proportions
To
From
A B C
A 0.00 0.85 0.15
B 0.76 0.00 0.24
C 0.29 0.71 0.00
Vehicle Mix
Heavy Vehicle proportion
To
From
A B C
A 0 0 0
B 0 0 0
C 0 0 0
Average PCU Per Veh
To
From
A B C
A 1.000 1.000 1.000
B 1.000 1.000 1.000
C 1.000 1.000 1.000
Results
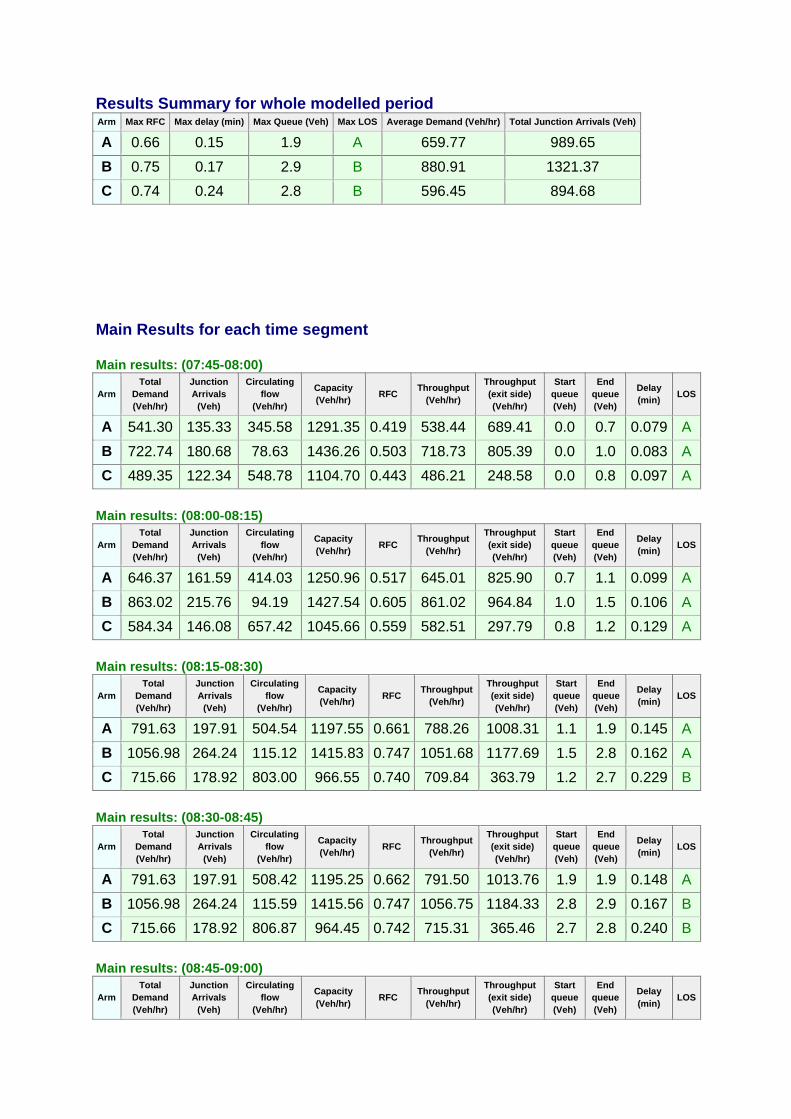
Results Summary for whole modelled period Arm Max RFC Max delay (min) Max Queue (Veh) Max LOS Average Demand (Veh/hr) Total Junction Arrivals (Veh)
A 0.66 0.15 1.9 A 659.77 989.65
B 0.75 0.17 2.9 B 880.91 1321.37
C 0.74 0.24 2.8 B 596.45 894.68
Main Results for each time segment
Main results: (07:45-08:00)
Arm
Total
Demand
(Veh/hr)
Junction
Arrivals
(Veh)
Circulating
flow
(Veh/hr)
Capacity
(Veh/hr) RFC
Throughput
(Veh/hr)
Throughput
(exit side)
(Veh/hr)
Start
queue
(Veh)
End
queue
(Veh)
Delay
(min) LOS
A 541.30 135.33 345.58 1291.35 0.419 538.44 689.41 0.0 0.7 0.079 A
B 722.74 180.68 78.63 1436.26 0.503 718.73 805.39 0.0 1.0 0.083 A
C 489.35 122.34 548.78 1104.70 0.443 486.21 248.58 0.0 0.8 0.097 A
Main results: (08:00-08:15)
Arm
Total
Demand
(Veh/hr)
Junction
Arrivals
(Veh)
Circulating
flow
(Veh/hr)
Capacity
(Veh/hr) RFC
Throughput
(Veh/hr)
Throughput
(exit side)
(Veh/hr)
Start
queue
(Veh)
End
queue
(Veh)
Delay
(min) LOS
A 646.37 161.59 414.03 1250.96 0.517 645.01 825.90 0.7 1.1 0.099 A
B 863.02 215.76 94.19 1427.54 0.605 861.02 964.84 1.0 1.5 0.106 A
C 584.34 146.08 657.42 1045.66 0.559 582.51 297.79 0.8 1.2 0.129 A
Main results: (08:15-08:30)
Arm
Total
Demand
(Veh/hr)
Junction
Arrivals
(Veh)
Circulating
flow
(Veh/hr)
Capacity
(Veh/hr) RFC
Throughput
(Veh/hr)
Throughput
(exit side)
(Veh/hr)
Start
queue
(Veh)
End
queue
(Veh)
Delay
(min) LOS
A 791.63 197.91 504.54 1197.55 0.661 788.26 1008.31 1.1 1.9 0.145 A
B 1056.98 264.24 115.12 1415.83 0.747 1051.68 1177.69 1.5 2.8 0.162 A
C 715.66 178.92 803.00 966.55 0.740 709.84 363.79 1.2 2.7 0.229 B
Main results: (08:30-08:45)
Arm
Total
Demand
(Veh/hr)
Junction
Arrivals
(Veh)
Circulating
flow
(Veh/hr)
Capacity
(Veh/hr) RFC
Throughput
(Veh/hr)
Throughput
(exit side)
(Veh/hr)
Start
queue
(Veh)
End
queue
(Veh)
Delay
(min) LOS
A 791.63 197.91 508.42 1195.25 0.662 791.50 1013.76 1.9 1.9 0.148 A
B 1056.98 264.24 115.59 1415.56 0.747 1056.75 1184.33 2.8 2.9 0.167 B
C 715.66 178.92 806.87 964.45 0.742 715.31 365.46 2.7 2.8 0.240 B
Main results: (08:45-09:00)
Arm
Total
Demand
(Veh/hr)
Junction
Arrivals
(Veh)
Circulating
flow
(Veh/hr)
Capacity
(Veh/hr) RFC
Throughput
(Veh/hr)
Throughput
(exit side)
(Veh/hr)
Start
queue
(Veh)
End
queue
(Veh)
Delay
(min) LOS
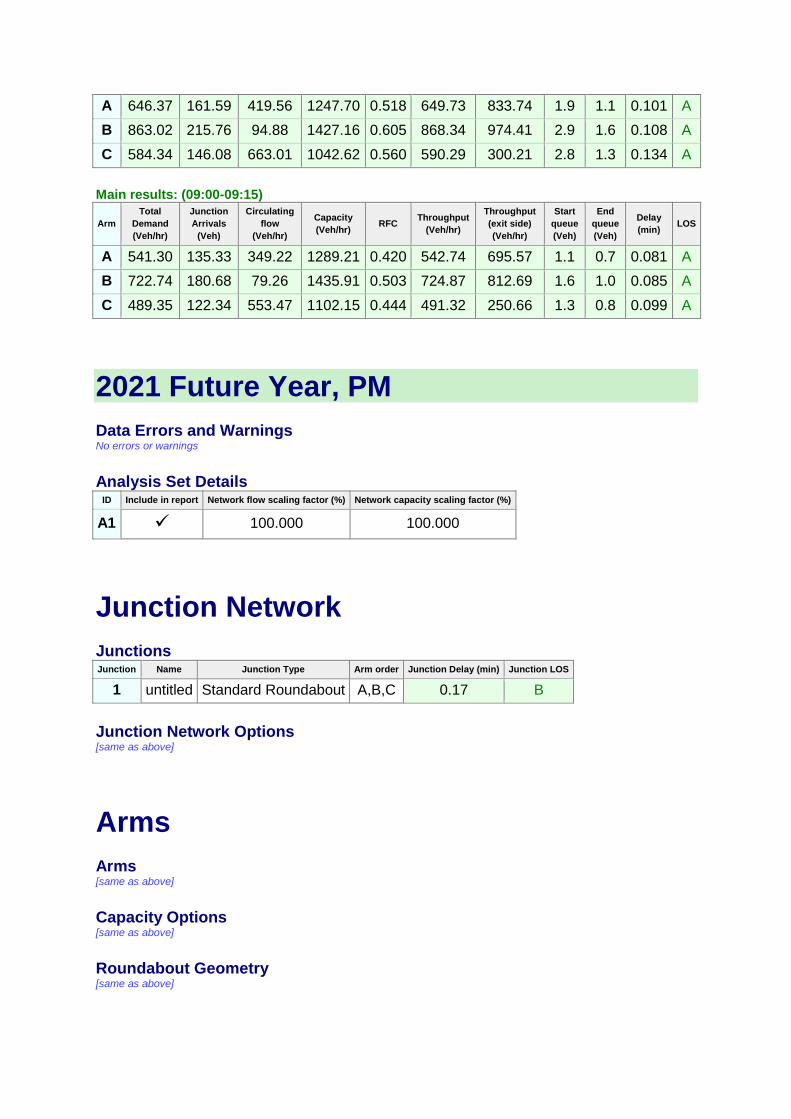
A 646.37 161.59 419.56 1247.70 0.518 649.73 833.74 1.9 1.1 0.101 A
B 863.02 215.76 94.88 1427.16 0.605 868.34 974.41 2.9 1.6 0.108 A
C 584.34 146.08 663.01 1042.62 0.560 590.29 300.21 2.8 1.3 0.134 A
Main results: (09:00-09:15)
Arm
Total
Demand
(Veh/hr)
Junction
Arrivals
(Veh)
Circulating
flow
(Veh/hr)
Capacity
(Veh/hr) RFC
Throughput
(Veh/hr)
Throughput
(exit side)
(Veh/hr)
Start
queue
(Veh)
End
queue
(Veh)
Delay
(min) LOS
A 541.30 135.33 349.22 1289.21 0.420 542.74 695.57 1.1 0.7 0.081 A
B 722.74 180.68 79.26 1435.91 0.503 724.87 812.69 1.6 1.0 0.085 A
C 489.35 122.34 553.47 1102.15 0.444 491.32 250.66 1.3 0.8 0.099 A
2021 Future Year, PM
Data Errors and Warnings No errors or warnings
Analysis Set Details ID Include in report Network flow scaling factor (%) Network capacity scaling factor (%)
A1 100.000 100.000
Junction Network
Junctions Junction Name Junction Type Arm order Junction Delay (min) Junction LOS
1 untitled Standard Roundabout A,B,C 0.17 B
Junction Network Options [same as above]
Arms
Arms [same as above]
Capacity Options [same as above]
Roundabout Geometry [same as above]
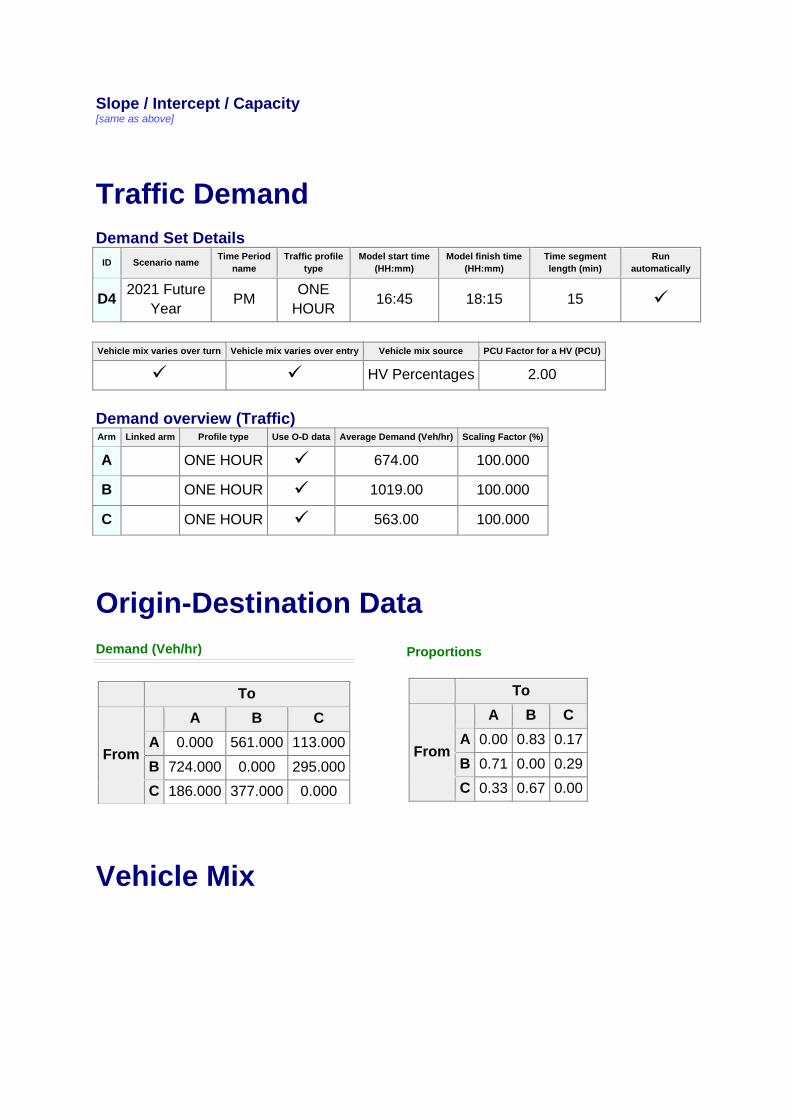
Slope / Intercept / Capacity [same as above]
Traffic Demand
Demand Set Details
ID Scenario name Time Period
name
Traffic profile
type
Model start time
(HH:mm)
Model finish time
(HH:mm)
Time segment
length (min)
Run
automatically
D4 2021 Future
Year PM
ONE
HOUR 16:45 18:15 15
Vehicle mix varies over turn Vehicle mix varies over entry Vehicle mix source PCU Factor for a HV (PCU)
HV Percentages 2.00
Demand overview (Traffic) Arm Linked arm Profile type Use O-D data Average Demand (Veh/hr) Scaling Factor (%)
A
ONE HOUR 674.00 100.000
B
ONE HOUR 1019.00 100.000
C
ONE HOUR 563.00 100.000
Origin-Destination Data
Demand (Veh/hr)
To
From
A B C
A 0.000 561.000 113.000
B 724.000 0.000 295.000
C 186.000 377.000 0.000
Proportions
To
From
A B C
A 0.00 0.83 0.17
B 0.71 0.00 0.29
C 0.33 0.67 0.00
Vehicle Mix
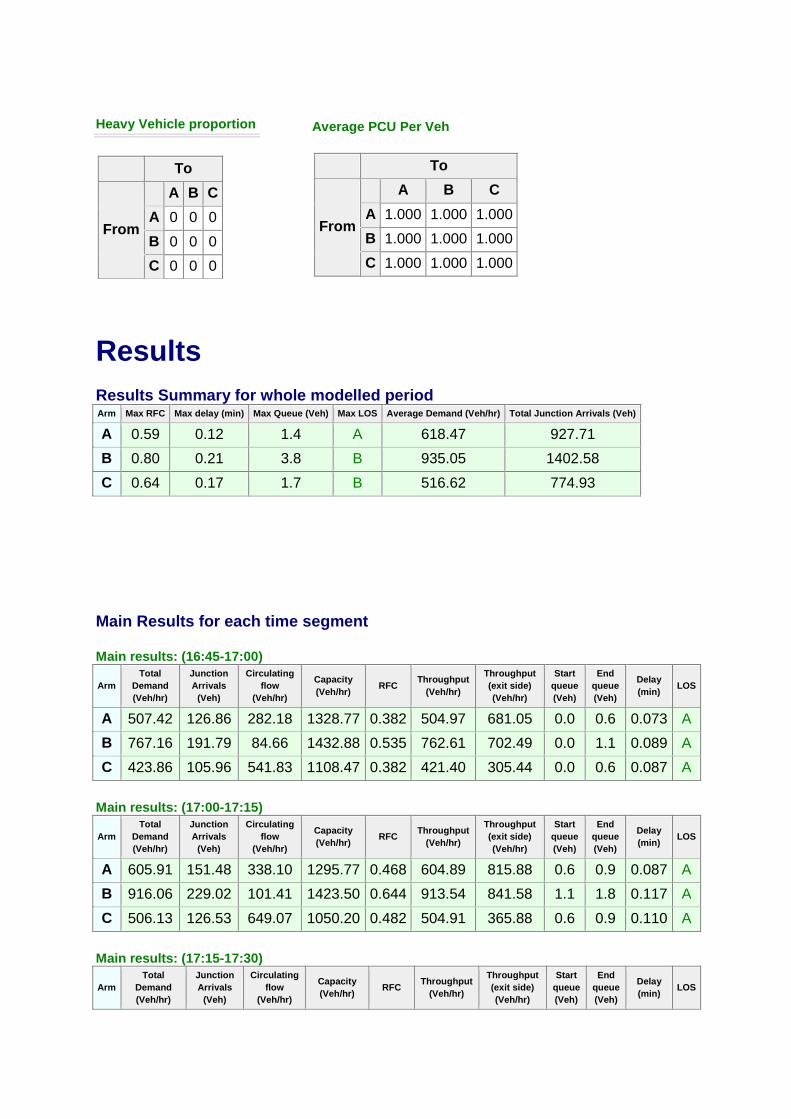
Heavy Vehicle proportion
To
From
A B C
A 0 0 0
B 0 0 0
C 0 0 0
Average PCU Per Veh
To
From
A B C
A 1.000 1.000 1.000
B 1.000 1.000 1.000
C 1.000 1.000 1.000
Results
Results Summary for whole modelled period Arm Max RFC Max delay (min) Max Queue (Veh) Max LOS Average Demand (Veh/hr) Total Junction Arrivals (Veh)
A 0.59 0.12 1.4 A 618.47 927.71
B 0.80 0.21 3.8 B 935.05 1402.58
C 0.64 0.17 1.7 B 516.62 774.93
Main Results for each time segment
Main results: (16:45-17:00)
Arm
Total
Demand
(Veh/hr)
Junction
Arrivals
(Veh)
Circulating
flow
(Veh/hr)
Capacity
(Veh/hr) RFC
Throughput
(Veh/hr)
Throughput
(exit side)
(Veh/hr)
Start
queue
(Veh)
End
queue
(Veh)
Delay
(min) LOS
A 507.42 126.86 282.18 1328.77 0.382 504.97 681.05 0.0 0.6 0.073 A
B 767.16 191.79 84.66 1432.88 0.535 762.61 702.49 0.0 1.1 0.089 A
C 423.86 105.96 541.83 1108.47 0.382 421.40 305.44 0.0 0.6 0.087 A
Main results: (17:00-17:15)
Arm
Total
Demand
(Veh/hr)
Junction
Arrivals
(Veh)
Circulating
flow
(Veh/hr)
Capacity
(Veh/hr) RFC
Throughput
(Veh/hr)
Throughput
(exit side)
(Veh/hr)
Start
queue
(Veh)
End
queue
(Veh)
Delay
(min) LOS
A 605.91 151.48 338.10 1295.77 0.468 604.89 815.88 0.6 0.9 0.087 A
B 916.06 229.02 101.41 1423.50 0.644 913.54 841.58 1.1 1.8 0.117 A
C 506.13 126.53 649.07 1050.20 0.482 504.91 365.88 0.6 0.9 0.110 A
Main results: (17:15-17:30)
Arm
Total
Demand
(Veh/hr)
Junction
Arrivals
(Veh)
Circulating
flow
(Veh/hr)
Capacity
(Veh/hr) RFC
Throughput
(Veh/hr)
Throughput
(exit side)
(Veh/hr)
Start
queue
(Veh)
End
queue
(Veh)
Delay
(min) LOS
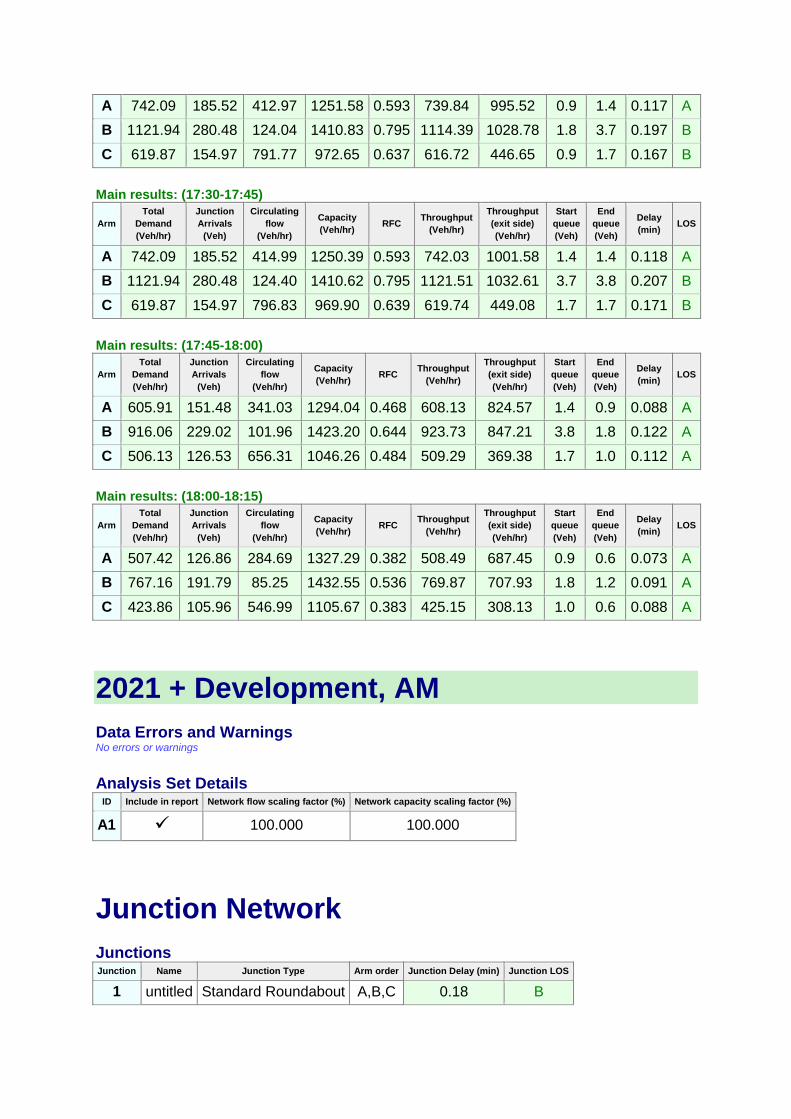
A 742.09 185.52 412.97 1251.58 0.593 739.84 995.52 0.9 1.4 0.117 A
B 1121.94 280.48 124.04 1410.83 0.795 1114.39 1028.78 1.8 3.7 0.197 B
C 619.87 154.97 791.77 972.65 0.637 616.72 446.65 0.9 1.7 0.167 B
Main results: (17:30-17:45)
Arm
Total
Demand
(Veh/hr)
Junction
Arrivals
(Veh)
Circulating
flow
(Veh/hr)
Capacity
(Veh/hr) RFC
Throughput
(Veh/hr)
Throughput
(exit side)
(Veh/hr)
Start
queue
(Veh)
End
queue
(Veh)
Delay
(min) LOS
A 742.09 185.52 414.99 1250.39 0.593 742.03 1001.58 1.4 1.4 0.118 A
B 1121.94 280.48 124.40 1410.62 0.795 1121.51 1032.61 3.7 3.8 0.207 B
C 619.87 154.97 796.83 969.90 0.639 619.74 449.08 1.7 1.7 0.171 B
Main results: (17:45-18:00)
Arm
Total
Demand
(Veh/hr)
Junction
Arrivals
(Veh)
Circulating
flow
(Veh/hr)
Capacity
(Veh/hr) RFC
Throughput
(Veh/hr)
Throughput
(exit side)
(Veh/hr)
Start
queue
(Veh)
End
queue
(Veh)
Delay
(min) LOS
A 605.91 151.48 341.03 1294.04 0.468 608.13 824.57 1.4 0.9 0.088 A
B 916.06 229.02 101.96 1423.20 0.644 923.73 847.21 3.8 1.8 0.122 A
C 506.13 126.53 656.31 1046.26 0.484 509.29 369.38 1.7 1.0 0.112 A
Main results: (18:00-18:15)
Arm
Total
Demand
(Veh/hr)
Junction
Arrivals
(Veh)
Circulating
flow
(Veh/hr)
Capacity
(Veh/hr) RFC
Throughput
(Veh/hr)
Throughput
(exit side)
(Veh/hr)
Start
queue
(Veh)
End
queue
(Veh)
Delay
(min) LOS
A 507.42 126.86 284.69 1327.29 0.382 508.49 687.45 0.9 0.6 0.073 A
B 767.16 191.79 85.25 1432.55 0.536 769.87 707.93 1.8 1.2 0.091 A
C 423.86 105.96 546.99 1105.67 0.383 425.15 308.13 1.0 0.6 0.088 A
2021 + Development, AM
Data Errors and Warnings No errors or warnings
Analysis Set Details ID Include in report Network flow scaling factor (%) Network capacity scaling factor (%)
A1 100.000 100.000
Junction Network
Junctions Junction Name Junction Type Arm order Junction Delay (min) Junction LOS
1 untitled Standard Roundabout A,B,C 0.18 B
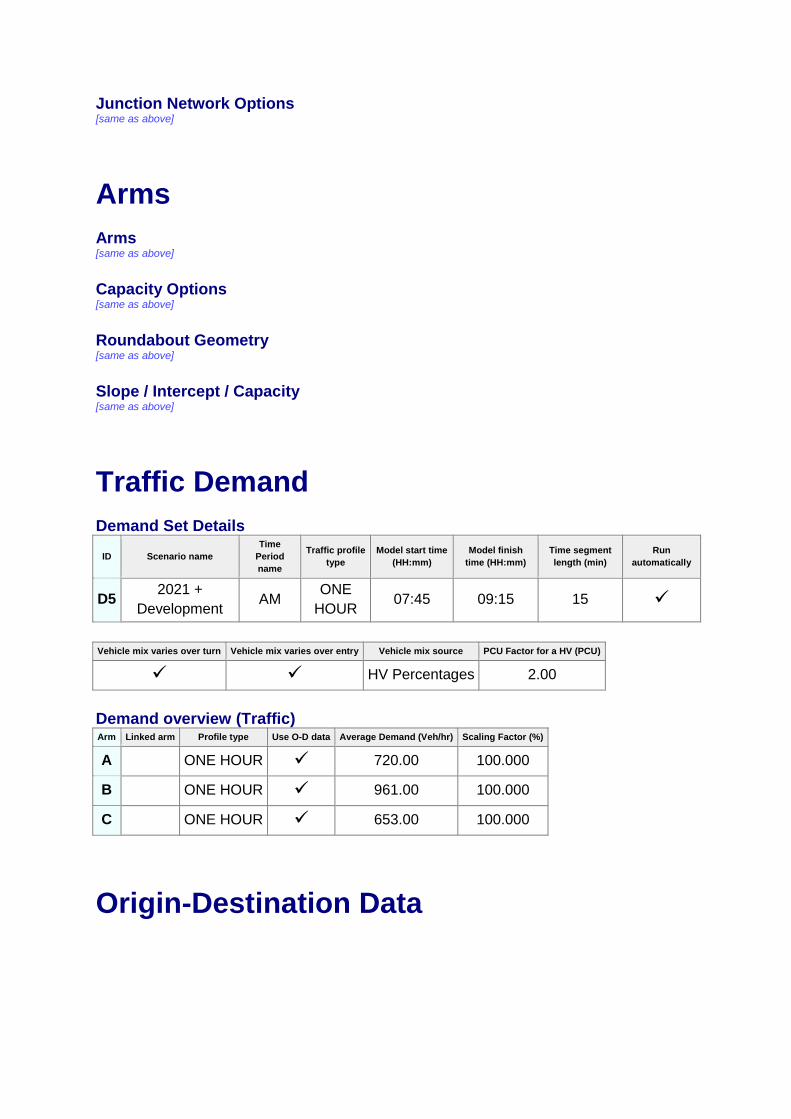
Junction Network Options [same as above]
Arms
Arms [same as above]
Capacity Options [same as above]
Roundabout Geometry [same as above]
Slope / Intercept / Capacity [same as above]
Traffic Demand
Demand Set Details
ID Scenario name
Time
Period
name
Traffic profile
type
Model start time
(HH:mm)
Model finish
time (HH:mm)
Time segment
length (min)
Run
automatically
D5 2021 +
Development AM
ONE
HOUR 07:45 09:15 15
Vehicle mix varies over turn Vehicle mix varies over entry Vehicle mix source PCU Factor for a HV (PCU)
HV Percentages 2.00
Demand overview (Traffic) Arm Linked arm Profile type Use O-D data Average Demand (Veh/hr) Scaling Factor (%)
A
ONE HOUR 720.00 100.000
B
ONE HOUR 961.00 100.000
C
ONE HOUR 653.00 100.000
Origin-Destination Data

Demand (Veh/hr)
To
From
A B C
A 0.000 614.000 106.000
B 733.000 0.000 228.000
C 189.000 464.000 0.000
Proportions
To
From
A B C
A 0.00 0.85 0.15
B 0.76 0.00 0.24
C 0.29 0.71 0.00
Vehicle Mix
Heavy Vehicle proportion
To
From
A B C
A 0 0 0
B 0 0 0
C 0 0 0
Average PCU Per Veh
To
From
A B C
A 1.000 1.000 1.000
B 1.000 1.000 1.000
C 1.000 1.000 1.000
Results
Results Summary for whole modelled period Arm Max RFC Max delay (min) Max Queue (Veh) Max LOS Average Demand (Veh/hr) Total Junction Arrivals (Veh)
A 0.66 0.15 1.9 A 660.68 991.03
B 0.75 0.17 2.9 B 881.83 1322.75
C 0.75 0.24 2.8 B 599.20 898.81
Main Results for each time segment
Main results: (07:45-08:00)
Arm
Total
Demand
(Veh/hr)
Junction
Arrivals
(Veh)
Circulating
flow
(Veh/hr)
Capacity
(Veh/hr) RFC
Throughput
(Veh/hr)
Throughput
(exit side)
(Veh/hr)
Start
queue
(Veh)
End
queue
(Veh)
Delay
(min) LOS
A 542.05 135.51 347.07 1290.47 0.420 539.18 690.15 0.0 0.7 0.080 A
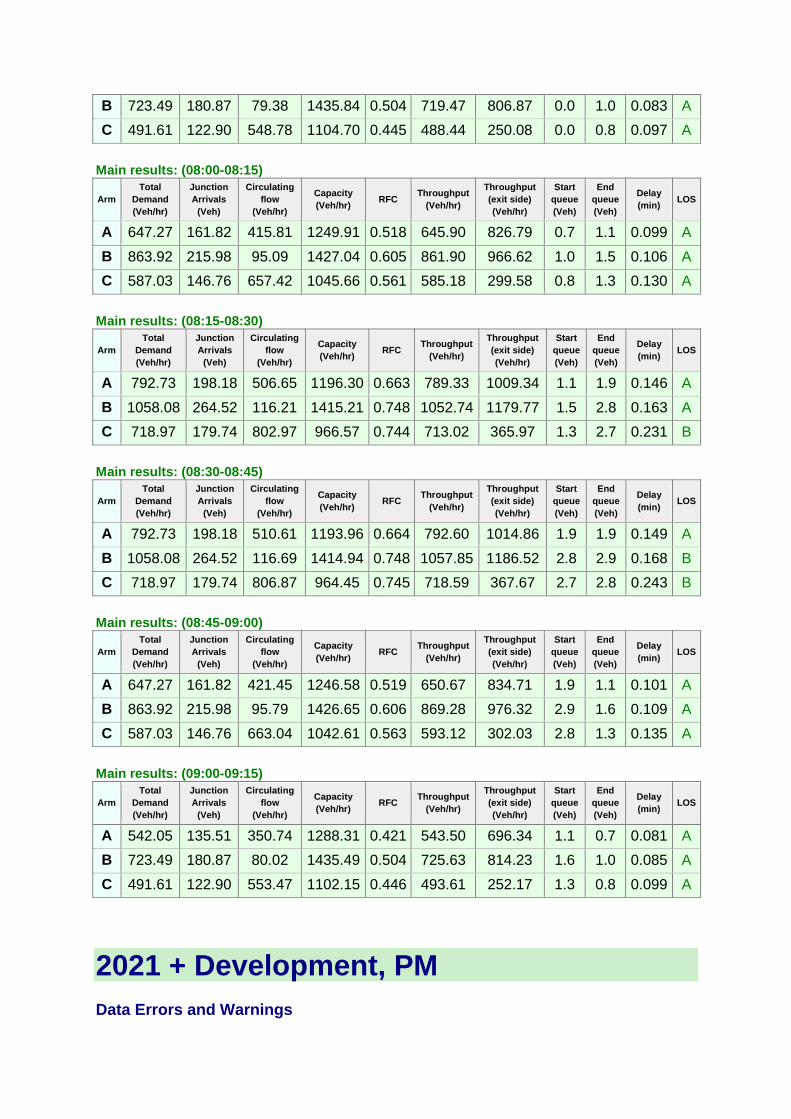
B 723.49 180.87 79.38 1435.84 0.504 719.47 806.87 0.0 1.0 0.083 A
C 491.61 122.90 548.78 1104.70 0.445 488.44 250.08 0.0 0.8 0.097 A
Main results: (08:00-08:15)
Arm
Total
Demand
(Veh/hr)
Junction
Arrivals
(Veh)
Circulating
flow
(Veh/hr)
Capacity
(Veh/hr) RFC
Throughput
(Veh/hr)
Throughput
(exit side)
(Veh/hr)
Start
queue
(Veh)
End
queue
(Veh)
Delay
(min) LOS
A 647.27 161.82 415.81 1249.91 0.518 645.90 826.79 0.7 1.1 0.099 A
B 863.92 215.98 95.09 1427.04 0.605 861.90 966.62 1.0 1.5 0.106 A
C 587.03 146.76 657.42 1045.66 0.561 585.18 299.58 0.8 1.3 0.130 A
Main results: (08:15-08:30)
Arm
Total
Demand
(Veh/hr)
Junction
Arrivals
(Veh)
Circulating
flow
(Veh/hr)
Capacity
(Veh/hr) RFC
Throughput
(Veh/hr)
Throughput
(exit side)
(Veh/hr)
Start
queue
(Veh)
End
queue
(Veh)
Delay
(min) LOS
A 792.73 198.18 506.65 1196.30 0.663 789.33 1009.34 1.1 1.9 0.146 A
B 1058.08 264.52 116.21 1415.21 0.748 1052.74 1179.77 1.5 2.8 0.163 A
C 718.97 179.74 802.97 966.57 0.744 713.02 365.97 1.3 2.7 0.231 B
Main results: (08:30-08:45)
Arm
Total
Demand
(Veh/hr)
Junction
Arrivals
(Veh)
Circulating
flow
(Veh/hr)
Capacity
(Veh/hr) RFC
Throughput
(Veh/hr)
Throughput
(exit side)
(Veh/hr)
Start
queue
(Veh)
End
queue
(Veh)
Delay
(min) LOS
A 792.73 198.18 510.61 1193.96 0.664 792.60 1014.86 1.9 1.9 0.149 A
B 1058.08 264.52 116.69 1414.94 0.748 1057.85 1186.52 2.8 2.9 0.168 B
C 718.97 179.74 806.87 964.45 0.745 718.59 367.67 2.7 2.8 0.243 B
Main results: (08:45-09:00)
Arm
Total
Demand
(Veh/hr)
Junction
Arrivals
(Veh)
Circulating
flow
(Veh/hr)
Capacity
(Veh/hr) RFC
Throughput
(Veh/hr)
Throughput
(exit side)
(Veh/hr)
Start
queue
(Veh)
End
queue
(Veh)
Delay
(min) LOS
A 647.27 161.82 421.45 1246.58 0.519 650.67 834.71 1.9 1.1 0.101 A
B 863.92 215.98 95.79 1426.65 0.606 869.28 976.32 2.9 1.6 0.109 A
C 587.03 146.76 663.04 1042.61 0.563 593.12 302.03 2.8 1.3 0.135 A
Main results: (09:00-09:15)
Arm
Total
Demand
(Veh/hr)
Junction
Arrivals
(Veh)
Circulating
flow
(Veh/hr)
Capacity
(Veh/hr) RFC
Throughput
(Veh/hr)
Throughput
(exit side)
(Veh/hr)
Start
queue
(Veh)
End
queue
(Veh)
Delay
(min) LOS
A 542.05 135.51 350.74 1288.31 0.421 543.50 696.34 1.1 0.7 0.081 A
B 723.49 180.87 80.02 1435.49 0.504 725.63 814.23 1.6 1.0 0.085 A
C 491.61 122.90 553.47 1102.15 0.446 493.61 252.17 1.3 0.8 0.099 A
2021 + Development, PM
Data Errors and Warnings
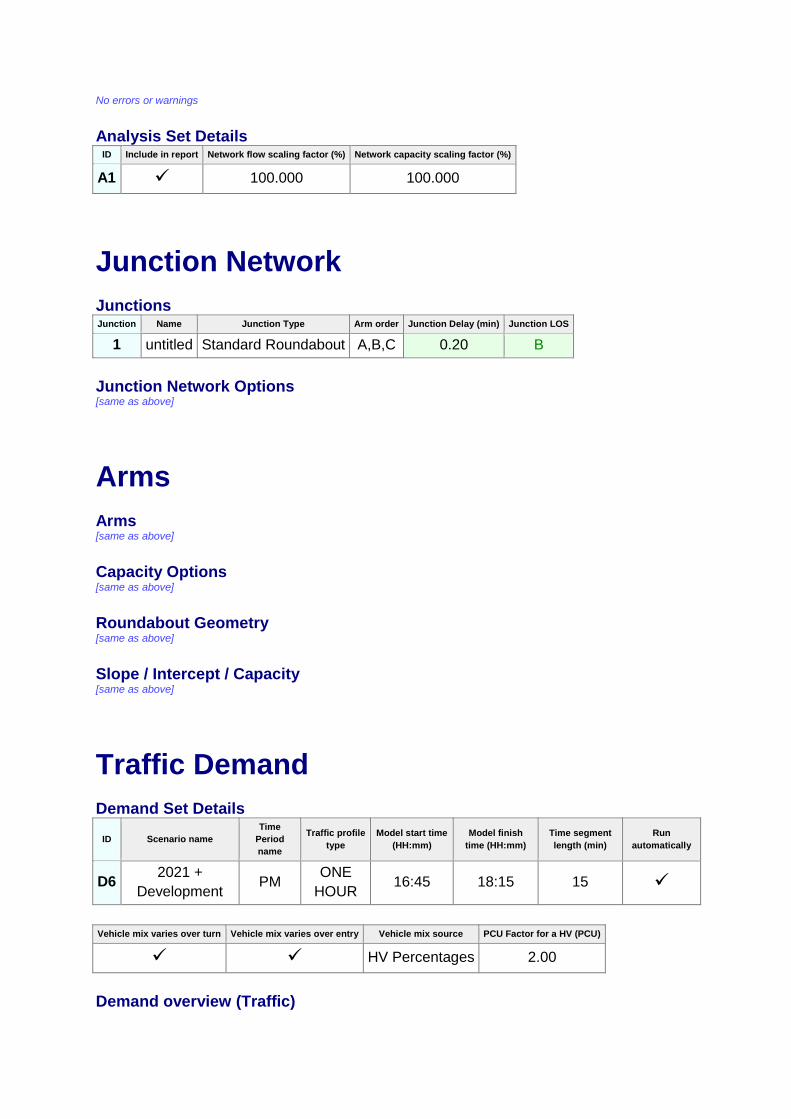
No errors or warnings
Analysis Set Details ID Include in report Network flow scaling factor (%) Network capacity scaling factor (%)
A1 100.000 100.000
Junction Network
Junctions Junction Name Junction Type Arm order Junction Delay (min) Junction LOS
1 untitled Standard Roundabout A,B,C 0.20 B
Junction Network Options [same as above]
Arms
Arms [same as above]
Capacity Options [same as above]
Roundabout Geometry [same as above]
Slope / Intercept / Capacity [same as above]
Traffic Demand
Demand Set Details
ID Scenario name
Time
Period
name
Traffic profile
type
Model start time
(HH:mm)
Model finish
time (HH:mm)
Time segment
length (min)
Run
automatically
D6 2021 +
Development PM
ONE
HOUR 16:45 18:15 15
Vehicle mix varies over turn Vehicle mix varies over entry Vehicle mix source PCU Factor for a HV (PCU)
HV Percentages 2.00
Demand overview (Traffic)
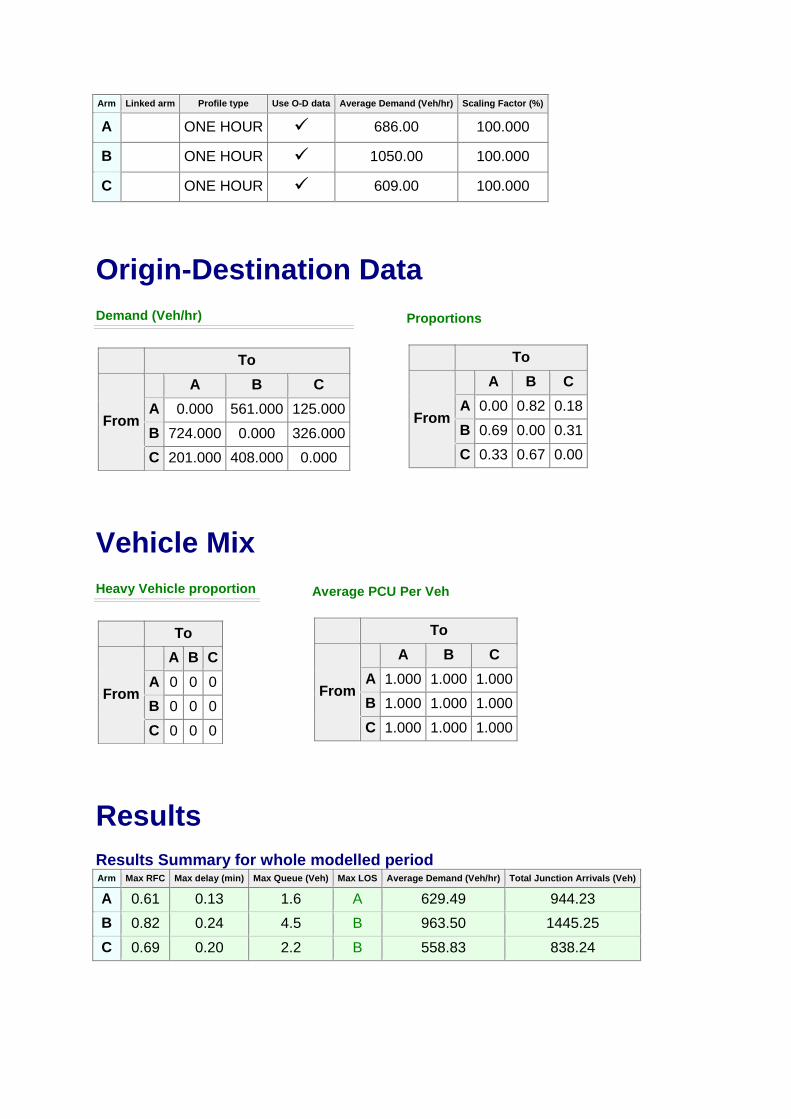
Arm Linked arm Profile type Use O-D data Average Demand (Veh/hr) Scaling Factor (%)
A
ONE HOUR 686.00 100.000
B
ONE HOUR 1050.00 100.000
C
ONE HOUR 609.00 100.000
Origin-Destination Data
Demand (Veh/hr)
To
From
A B C
A 0.000 561.000 125.000
B 724.000 0.000 326.000
C 201.000 408.000 0.000
Proportions
To
From
A B C
A 0.00 0.82 0.18
B 0.69 0.00 0.31
C 0.33 0.67 0.00
Vehicle Mix
Heavy Vehicle proportion
To
From
A B C
A 0 0 0
B 0 0 0
C 0 0 0
Average PCU Per Veh
To
From
A B C
A 1.000 1.000 1.000
B 1.000 1.000 1.000
C 1.000 1.000 1.000
Results
Results Summary for whole modelled period Arm Max RFC Max delay (min) Max Queue (Veh) Max LOS Average Demand (Veh/hr) Total Junction Arrivals (Veh)
A 0.61 0.13 1.6 A 629.49 944.23
B 0.82 0.24 4.5 B 963.50 1445.25
C 0.69 0.20 2.2 B 558.83 838.24
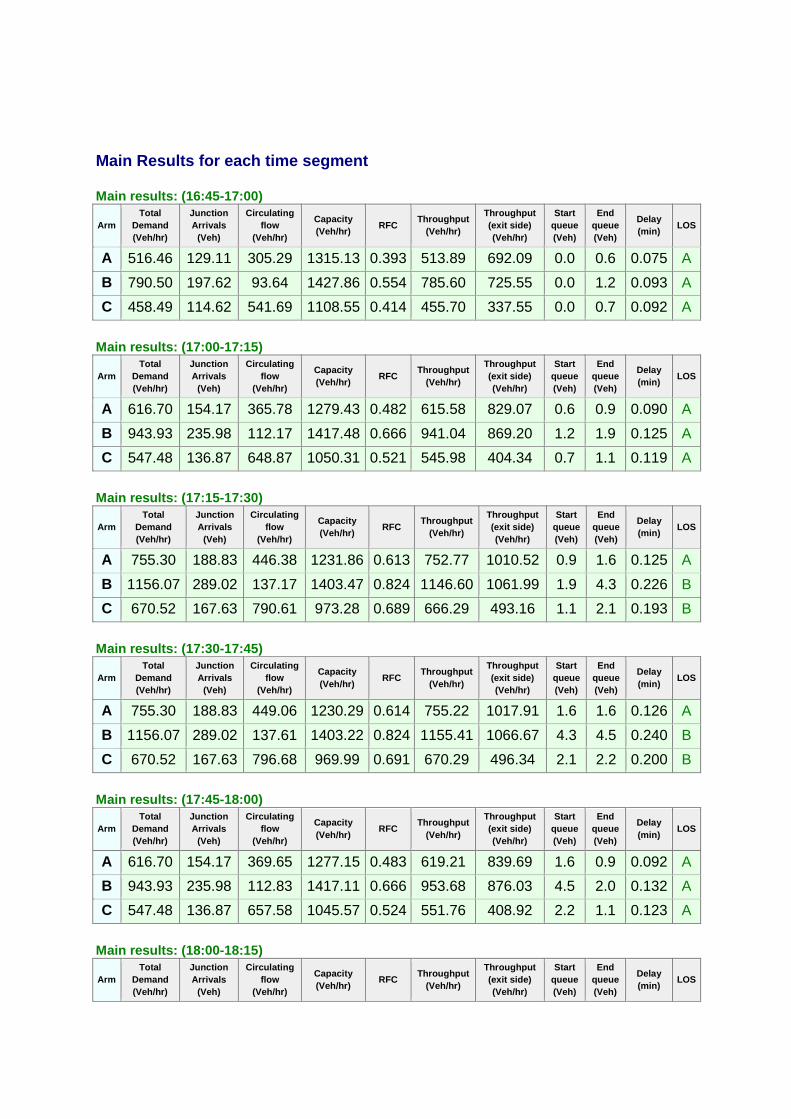
Main Results for each time segment
Main results: (16:45-17:00)
Arm
Total
Demand
(Veh/hr)
Junction
Arrivals
(Veh)
Circulating
flow
(Veh/hr)
Capacity
(Veh/hr) RFC
Throughput
(Veh/hr)
Throughput
(exit side)
(Veh/hr)
Start
queue
(Veh)
End
queue
(Veh)
Delay
(min) LOS
A 516.46 129.11 305.29 1315.13 0.393 513.89 692.09 0.0 0.6 0.075 A
B 790.50 197.62 93.64 1427.86 0.554 785.60 725.55 0.0 1.2 0.093 A
C 458.49 114.62 541.69 1108.55 0.414 455.70 337.55 0.0 0.7 0.092 A
Main results: (17:00-17:15)
Arm
Total
Demand
(Veh/hr)
Junction
Arrivals
(Veh)
Circulating
flow
(Veh/hr)
Capacity
(Veh/hr) RFC
Throughput
(Veh/hr)
Throughput
(exit side)
(Veh/hr)
Start
queue
(Veh)
End
queue
(Veh)
Delay
(min) LOS
A 616.70 154.17 365.78 1279.43 0.482 615.58 829.07 0.6 0.9 0.090 A
B 943.93 235.98 112.17 1417.48 0.666 941.04 869.20 1.2 1.9 0.125 A
C 547.48 136.87 648.87 1050.31 0.521 545.98 404.34 0.7 1.1 0.119 A
Main results: (17:15-17:30)
Arm
Total
Demand
(Veh/hr)
Junction
Arrivals
(Veh)
Circulating
flow
(Veh/hr)
Capacity
(Veh/hr) RFC
Throughput
(Veh/hr)
Throughput
(exit side)
(Veh/hr)
Start
queue
(Veh)
End
queue
(Veh)
Delay
(min) LOS
A 755.30 188.83 446.38 1231.86 0.613 752.77 1010.52 0.9 1.6 0.125 A
B 1156.07 289.02 137.17 1403.47 0.824 1146.60 1061.99 1.9 4.3 0.226 B
C 670.52 167.63 790.61 973.28 0.689 666.29 493.16 1.1 2.1 0.193 B
Main results: (17:30-17:45)
Arm
Total
Demand
(Veh/hr)
Junction
Arrivals
(Veh)
Circulating
flow
(Veh/hr)
Capacity
(Veh/hr) RFC
Throughput
(Veh/hr)
Throughput
(exit side)
(Veh/hr)
Start
queue
(Veh)
End
queue
(Veh)
Delay
(min) LOS
A 755.30 188.83 449.06 1230.29 0.614 755.22 1017.91 1.6 1.6 0.126 A
B 1156.07 289.02 137.61 1403.22 0.824 1155.41 1066.67 4.3 4.5 0.240 B
C 670.52 167.63 796.68 969.99 0.691 670.29 496.34 2.1 2.2 0.200 B
Main results: (17:45-18:00)
Arm
Total
Demand
(Veh/hr)
Junction
Arrivals
(Veh)
Circulating
flow
(Veh/hr)
Capacity
(Veh/hr) RFC
Throughput
(Veh/hr)
Throughput
(exit side)
(Veh/hr)
Start
queue
(Veh)
End
queue
(Veh)
Delay
(min) LOS
A 616.70 154.17 369.65 1277.15 0.483 619.21 839.69 1.6 0.9 0.092 A
B 943.93 235.98 112.83 1417.11 0.666 953.68 876.03 4.5 2.0 0.132 A
C 547.48 136.87 657.58 1045.57 0.524 551.76 408.92 2.2 1.1 0.123 A
Main results: (18:00-18:15)
Arm
Total
Demand
(Veh/hr)
Junction
Arrivals
(Veh)
Circulating
flow
(Veh/hr)
Capacity
(Veh/hr) RFC
Throughput
(Veh/hr)
Throughput
(exit side)
(Veh/hr)
Start
queue
(Veh)
End
queue
(Veh)
Delay
(min) LOS
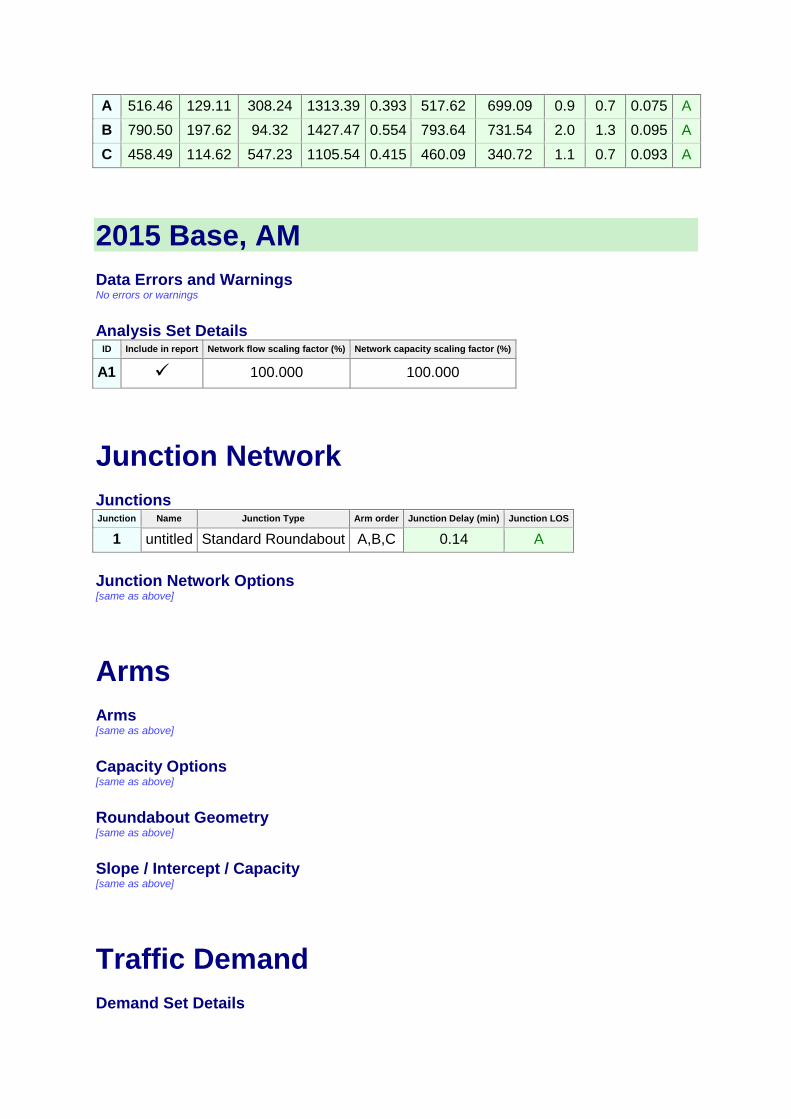
A 516.46 129.11 308.24 1313.39 0.393 517.62 699.09 0.9 0.7 0.075 A
B 790.50 197.62 94.32 1427.47 0.554 793.64 731.54 2.0 1.3 0.095 A
C 458.49 114.62 547.23 1105.54 0.415 460.09 340.72 1.1 0.7 0.093 A
2015 Base, AM
Data Errors and Warnings No errors or warnings
Analysis Set Details ID Include in report Network flow scaling factor (%) Network capacity scaling factor (%)
A1 100.000 100.000
Junction Network
Junctions Junction Name Junction Type Arm order Junction Delay (min) Junction LOS
1 untitled Standard Roundabout A,B,C 0.14 A
Junction Network Options [same as above]
Arms
Arms [same as above]
Capacity Options [same as above]
Roundabout Geometry [same as above]
Slope / Intercept / Capacity [same as above]
Traffic Demand
Demand Set Details

ID Scenario
name
Time Period
name
Traffic profile
type
Model start time
(HH:mm)
Model finish time
(HH:mm)
Time segment
length (min)
Run
automatically
D7 2015
Base AM
ONE
HOUR 07:45 09:15 15
Vehicle mix varies over turn Vehicle mix varies over entry Vehicle mix source PCU Factor for a HV (PCU)
HV Percentages 2.00
Demand overview (Traffic) Arm Linked arm Profile type Use O-D data Average Demand (Veh/hr) Scaling Factor (%)
A
ONE HOUR 661.00 100.000
B
ONE HOUR 871.00 100.000
C
ONE HOUR 608.00 100.000
Origin-Destination Data
Demand (Veh/hr)
To
From
A B C
A 0.000 575.000 86.000
B 686.000 0.000 185.000
C 176.000 432.000 0.000
Proportions
To
From
A B C
A 0.00 0.87 0.13
B 0.79 0.00 0.21
C 0.29 0.71 0.00
Vehicle Mix
Heavy Vehicle proportion
To
From
A B C
A 0 0 0
B 0 0 0
C 0 0 0
Average PCU Per Veh
To
From
A B C
A 1.000 1.000 1.000
B 1.000 1.000 1.000
C 1.000 1.000 1.000
Results

Results Summary for whole modelled period Arm Max RFC Max delay (min) Max Queue (Veh) Max LOS Average Demand (Veh/hr) Total Junction Arrivals (Veh)
A 0.60 0.12 1.5 A 606.55 909.82
B 0.67 0.13 2.0 A 799.24 1198.87
C 0.67 0.19 2.0 B 557.91 836.87
Main Results for each time segment
Main results: (07:45-08:00)
Arm
Total
Demand
(Veh/hr)
Junction
Arrivals
(Veh)
Circulating
flow
(Veh/hr)
Capacity
(Veh/hr) RFC
Throughput
(Veh/hr)
Throughput
(exit side)
(Veh/hr)
Start
queue
(Veh)
End
queue
(Veh)
Delay
(min) LOS
A 497.64 124.41 323.30 1304.50 0.381 495.19 645.57 0.0 0.6 0.074 A
B 655.73 163.93 64.43 1444.22 0.454 652.44 754.06 0.0 0.8 0.075 A
C 457.73 114.43 513.86 1123.67 0.407 455.01 203.00 0.0 0.7 0.089 A
Main results: (08:00-08:15)
Arm
Total
Demand
(Veh/hr)
Junction
Arrivals
(Veh)
Circulating
flow
(Veh/hr)
Capacity
(Veh/hr) RFC
Throughput
(Veh/hr)
Throughput
(exit side)
(Veh/hr)
Start
queue
(Veh)
End
queue
(Veh)
Delay
(min) LOS
A 594.23 148.56 387.36 1266.70 0.469 593.18 773.39 0.6 0.9 0.089 A
B 783.01 195.75 77.18 1437.08 0.545 781.58 903.36 0.8 1.2 0.091 A
C 546.58 136.64 615.57 1068.40 0.512 545.17 243.18 0.7 1.0 0.114 A
Main results: (08:15-08:30)
Arm
Total
Demand
(Veh/hr)
Junction
Arrivals
(Veh)
Circulating
flow
(Veh/hr)
Capacity
(Veh/hr) RFC
Throughput
(Veh/hr)
Throughput
(exit side)
(Veh/hr)
Start
queue
(Veh)
End
queue
(Veh)
Delay
(min) LOS
A 727.77 181.94 472.91 1216.21 0.598 725.43 945.40 0.9 1.5 0.122 A
B 958.99 239.75 94.38 1427.44 0.672 955.73 1103.96 1.2 2.0 0.126 A
C 669.42 167.36 752.73 993.87 0.674 665.58 297.38 1.0 2.0 0.181 B
Main results: (08:30-08:45)
Arm
Total
Demand
(Veh/hr)
Junction
Arrivals
(Veh)
Circulating
flow
(Veh/hr)
Capacity
(Veh/hr) RFC
Throughput
(Veh/hr)
Throughput
(exit side)
(Veh/hr)
Start
queue
(Veh)
End
queue
(Veh)
Delay
(min) LOS
A 727.77 181.94 475.53 1214.67 0.599 727.70 948.96 1.5 1.5 0.123 A
B 958.99 239.75 94.68 1427.27 0.672 958.89 1108.55 2.0 2.0 0.128 A
C 669.42 167.36 755.22 992.51 0.674 669.26 298.35 2.0 2.0 0.185 B
Main results: (08:45-09:00)
Arm
Total
Demand
(Veh/hr)
Junction
Arrivals
(Veh)
Circulating
flow
(Veh/hr)
Capacity
(Veh/hr) RFC
Throughput
(Veh/hr)
Throughput
(exit side)
(Veh/hr)
Start
queue
(Veh)
End
queue
(Veh)
Delay
(min) LOS
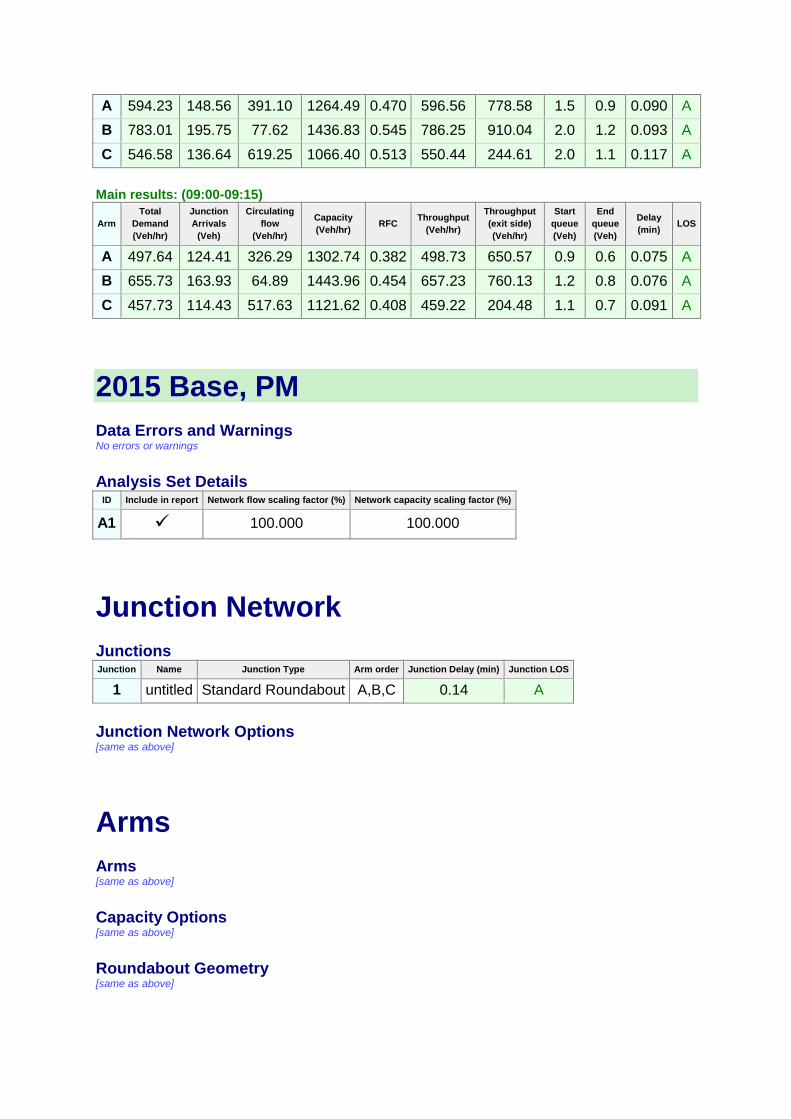
A 594.23 148.56 391.10 1264.49 0.470 596.56 778.58 1.5 0.9 0.090 A
B 783.01 195.75 77.62 1436.83 0.545 786.25 910.04 2.0 1.2 0.093 A
C 546.58 136.64 619.25 1066.40 0.513 550.44 244.61 2.0 1.1 0.117 A
Main results: (09:00-09:15)
Arm
Total
Demand
(Veh/hr)
Junction
Arrivals
(Veh)
Circulating
flow
(Veh/hr)
Capacity
(Veh/hr) RFC
Throughput
(Veh/hr)
Throughput
(exit side)
(Veh/hr)
Start
queue
(Veh)
End
queue
(Veh)
Delay
(min) LOS
A 497.64 124.41 326.29 1302.74 0.382 498.73 650.57 0.9 0.6 0.075 A
B 655.73 163.93 64.89 1443.96 0.454 657.23 760.13 1.2 0.8 0.076 A
C 457.73 114.43 517.63 1121.62 0.408 459.22 204.48 1.1 0.7 0.091 A
2015 Base, PM
Data Errors and Warnings No errors or warnings
Analysis Set Details ID Include in report Network flow scaling factor (%) Network capacity scaling factor (%)
A1 100.000 100.000
Junction Network
Junctions Junction Name Junction Type Arm order Junction Delay (min) Junction LOS
1 untitled Standard Roundabout A,B,C 0.14 A
Junction Network Options [same as above]
Arms
Arms [same as above]
Capacity Options [same as above]
Roundabout Geometry [same as above]

Slope / Intercept / Capacity [same as above]
Traffic Demand
Demand Set Details
ID Scenario
name
Time Period
name
Traffic profile
type
Model start time
(HH:mm)
Model finish time
(HH:mm)
Time segment
length (min)
Run
automatically
D8 2015
Base PM
ONE
HOUR 16:45 18:15 15
Vehicle mix varies over turn Vehicle mix varies over entry Vehicle mix source PCU Factor for a HV (PCU)
HV Percentages 2.00
Demand overview (Traffic) Arm Linked arm Profile type Use O-D data Average Demand (Veh/hr) Scaling Factor (%)
A
ONE HOUR 628.00 100.000
B
ONE HOUR 946.00 100.000
C
ONE HOUR 527.00 100.000
Origin-Destination Data
Demand (Veh/hr)
To
From
A B C
A 0.000 525.000 103.000
B 677.000 0.000 269.000
C 174.000 353.000 0.000
Proportions
To
From
A B C
A 0.00 0.84 0.16
B 0.72 0.00 0.28
C 0.33 0.67 0.00
Vehicle Mix

Heavy Vehicle proportion
To
From
A B C
A 0 0 0
B 0 0 0
C 0 0 0
Average PCU Per Veh
To
From
A B C
A 1.000 1.000 1.000
B 1.000 1.000 1.000
C 1.000 1.000 1.000
Results
Results Summary for whole modelled period Arm Max RFC Max delay (min) Max Queue (Veh) Max LOS Average Demand (Veh/hr) Total Junction Arrivals (Veh)
A 0.55 0.10 1.2 A 576.26 864.40
B 0.74 0.16 2.7 A 868.07 1302.10
C 0.58 0.14 1.4 A 483.58 725.38
Main Results for each time segment
Main results: (16:45-17:00)
Arm
Total
Demand
(Veh/hr)
Junction
Arrivals
(Veh)
Circulating
flow
(Veh/hr)
Capacity
(Veh/hr) RFC
Throughput
(Veh/hr)
Throughput
(exit side)
(Veh/hr)
Start
queue
(Veh)
End
queue
(Veh)
Delay
(min) LOS
A 472.79 118.20 264.31 1339.31 0.353 470.62 637.18 0.0 0.5 0.069 A
B 712.20 178.05 77.19 1437.07 0.496 708.31 657.75 0.0 1.0 0.082 A
C 396.75 99.19 506.90 1127.45 0.352 394.60 278.60 0.0 0.5 0.082 A
Main results: (17:00-17:15)
Arm
Total
Demand
(Veh/hr)
Junction
Arrivals
(Veh)
Circulating
flow
(Veh/hr)
Capacity
(Veh/hr) RFC
Throughput
(Veh/hr)
Throughput
(exit side)
(Veh/hr)
Start
queue
(Veh)
End
queue
(Veh)
Delay
(min) LOS
A 564.56 141.14 316.69 1308.41 0.431 563.72 763.35 0.5 0.8 0.080 A
B 850.43 212.61 92.46 1428.52 0.595 848.53 787.95 1.0 1.4 0.103 A
C 473.76 118.44 607.25 1072.92 0.442 472.79 333.74 0.5 0.8 0.100 A
Main results: (17:15-17:30)
Arm
Total
Demand
(Veh/hr)
Junction
Arrivals
(Veh)
Circulating
flow
(Veh/hr)
Capacity
(Veh/hr) RFC
Throughput
(Veh/hr)
Throughput
(exit side)
(Veh/hr)
Start
queue
(Veh)
End
queue
(Veh)
Delay
(min) LOS
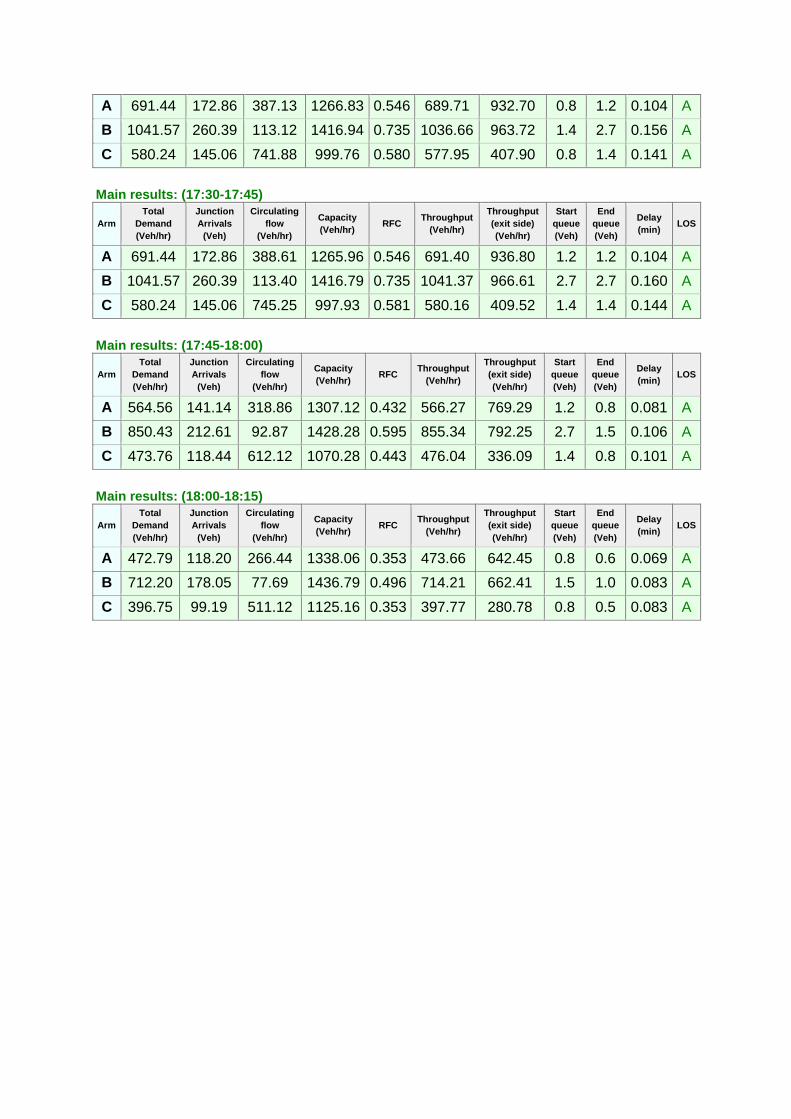
A 691.44 172.86 387.13 1266.83 0.546 689.71 932.70 0.8 1.2 0.104 A
B 1041.57 260.39 113.12 1416.94 0.735 1036.66 963.72 1.4 2.7 0.156 A
C 580.24 145.06 741.88 999.76 0.580 577.95 407.90 0.8 1.4 0.141 A
Main results: (17:30-17:45)
Arm
Total
Demand
(Veh/hr)
Junction
Arrivals
(Veh)
Circulating
flow
(Veh/hr)
Capacity
(Veh/hr) RFC
Throughput
(Veh/hr)
Throughput
(exit side)
(Veh/hr)
Start
queue
(Veh)
End
queue
(Veh)
Delay
(min) LOS
A 691.44 172.86 388.61 1265.96 0.546 691.40 936.80 1.2 1.2 0.104 A
B 1041.57 260.39 113.40 1416.79 0.735 1041.37 966.61 2.7 2.7 0.160 A
C 580.24 145.06 745.25 997.93 0.581 580.16 409.52 1.4 1.4 0.144 A
Main results: (17:45-18:00)
Arm
Total
Demand
(Veh/hr)
Junction
Arrivals
(Veh)
Circulating
flow
(Veh/hr)
Capacity
(Veh/hr) RFC
Throughput
(Veh/hr)
Throughput
(exit side)
(Veh/hr)
Start
queue
(Veh)
End
queue
(Veh)
Delay
(min) LOS
A 564.56 141.14 318.86 1307.12 0.432 566.27 769.29 1.2 0.8 0.081 A
B 850.43 212.61 92.87 1428.28 0.595 855.34 792.25 2.7 1.5 0.106 A
C 473.76 118.44 612.12 1070.28 0.443 476.04 336.09 1.4 0.8 0.101 A
Main results: (18:00-18:15)
Arm
Total
Demand
(Veh/hr)
Junction
Arrivals
(Veh)
Circulating
flow
(Veh/hr)
Capacity
(Veh/hr) RFC
Throughput
(Veh/hr)
Throughput
(exit side)
(Veh/hr)
Start
queue
(Veh)
End
queue
(Veh)
Delay
(min) LOS
A 472.79 118.20 266.44 1338.06 0.353 473.66 642.45 0.8 0.6 0.069 A
B 712.20 178.05 77.69 1436.79 0.496 714.21 662.41 1.5 1.0 0.083 A
C 396.75 99.19 511.12 1125.16 0.353 397.77 280.78 0.8 0.5 0.083 A