Embed Size (px)
Citation preview

© 2000 by Prentice-Hall IncRussell/Taylor Oper Mgt 3/e
Chapter 12
Inventory Management

2000 by Prentice-Hall, Inc 2Ch 12 - 2© 2000 by Prentice-Hall IncRussell/Taylor Oper Mgt 3/e
Inventory
Stock of items held to meet future demand
Inventory management answers two questions
How much to order When to order
2000 by Prentice-Hall, Inc 3Ch 12 - 3© 2000 by Prentice-Hall IncRussell/Taylor Oper Mgt 3/e
Types of Inventory
Raw materials Purchased parts and supplies Labor In-process (partially completed) products Component parts Working capital Tools, machinery, and equipment Finished goods

2000 by Prentice-Hall, Inc 4Ch 12 - 4© 2000 by Prentice-Hall IncRussell/Taylor Oper Mgt 3/e
Reasons To Hold Inventory
Meet unexpected demandSmooth seasonal or cyclical demandMeet variations in customer demandTake advantage of price discountsHedge against price increases
2000 by Prentice-Hall, Inc 5Ch 12 - 5© 2000 by Prentice-Hall IncRussell/Taylor Oper Mgt 3/e
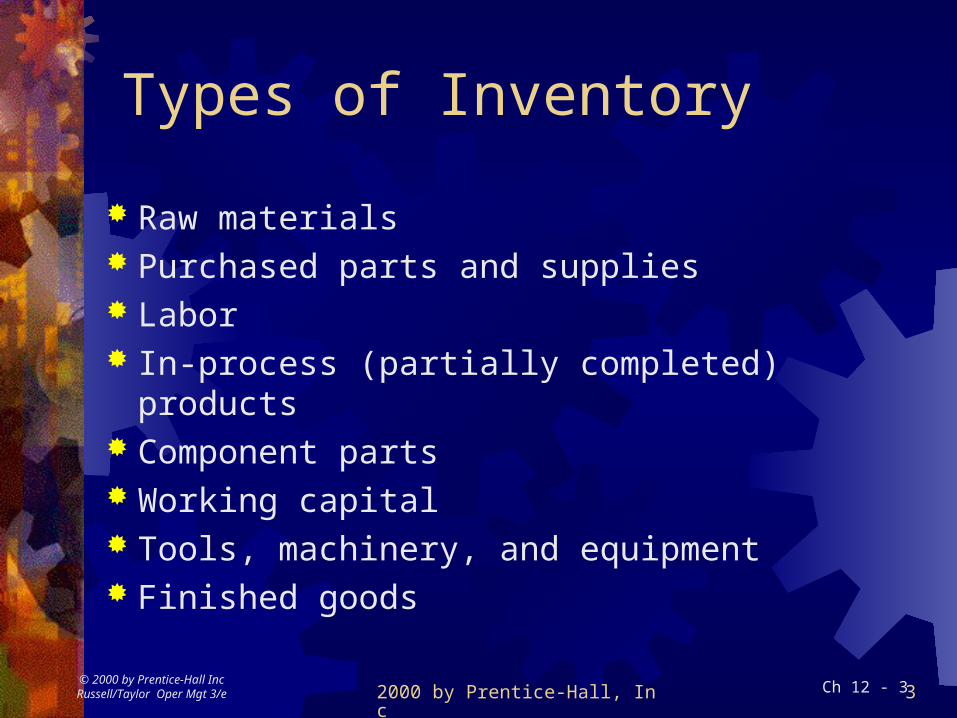
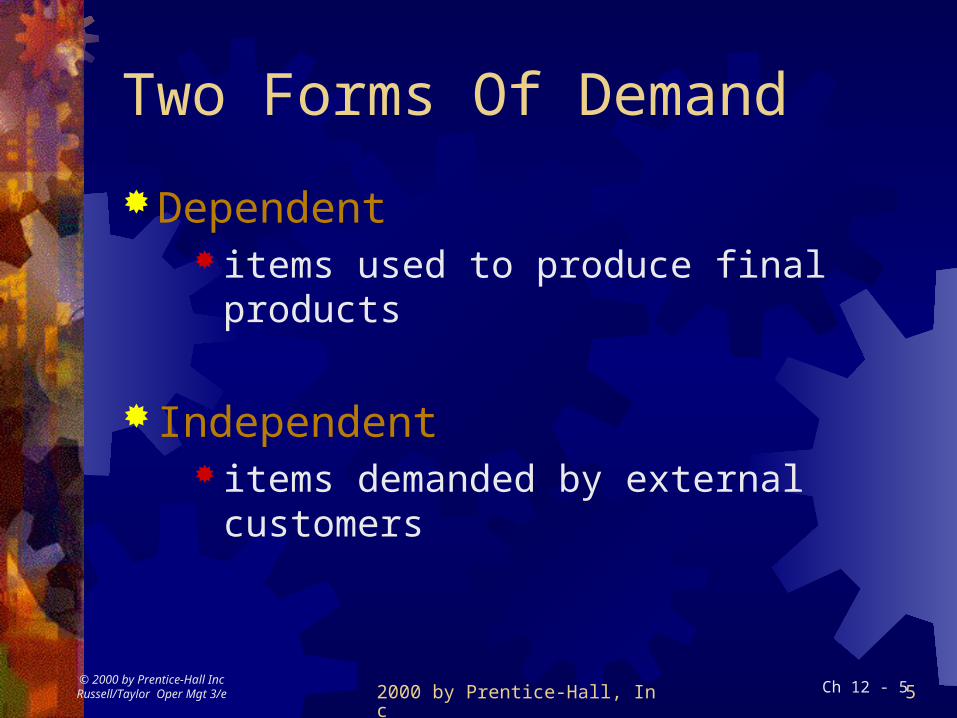
Two Forms Of Demand
Dependent items used to produce final products
Independent items demanded by external customers
2000 by Prentice-Hall, Inc 6Ch 12 - 6© 2000 by Prentice-Hall IncRussell/Taylor Oper Mgt 3/e
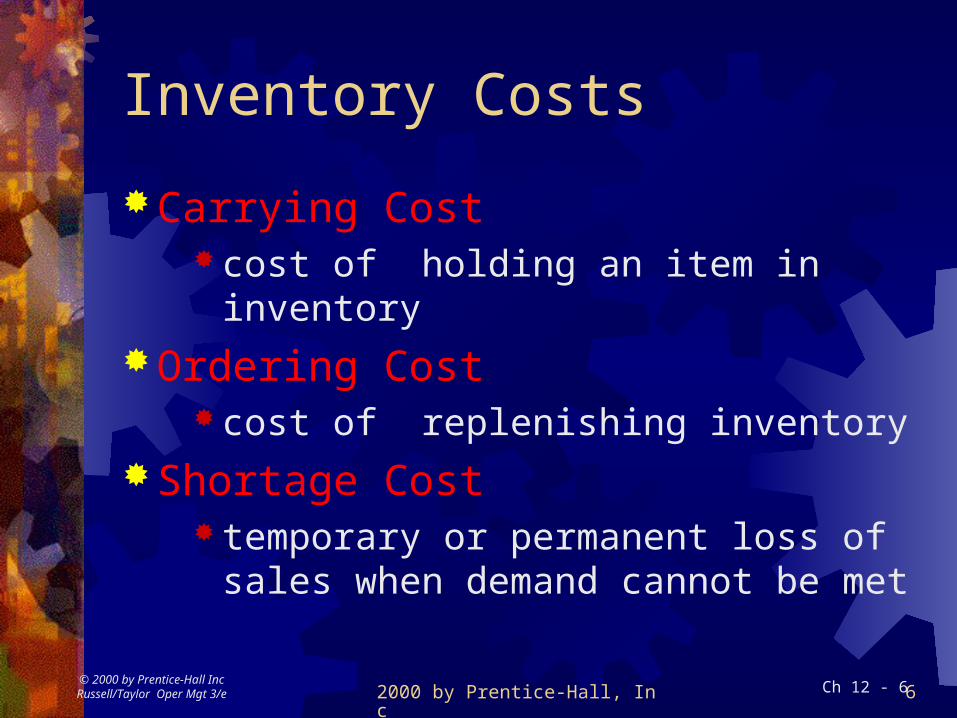
Inventory Costs
Carrying Cost cost of holding an item in inventory
Ordering Cost cost of replenishing inventory
Shortage Cost temporary or permanent loss of sales
when demand cannot be met

2000 by Prentice-Hall, Inc 7Ch 12 - 7© 2000 by Prentice-Hall IncRussell/Taylor Oper Mgt 3/e
Inventory Control Systems
Fixed-order-quantity system (Continuous)
constant amount ordered when inventory declines to predetermined level
Fixed-time-period system (Periodic) order placed for variable amount after
fixed passage of time
2000 by Prentice-Hall, Inc 8Ch 12 - 8© 2000 by Prentice-Hall IncRussell/Taylor Oper Mgt 3/e
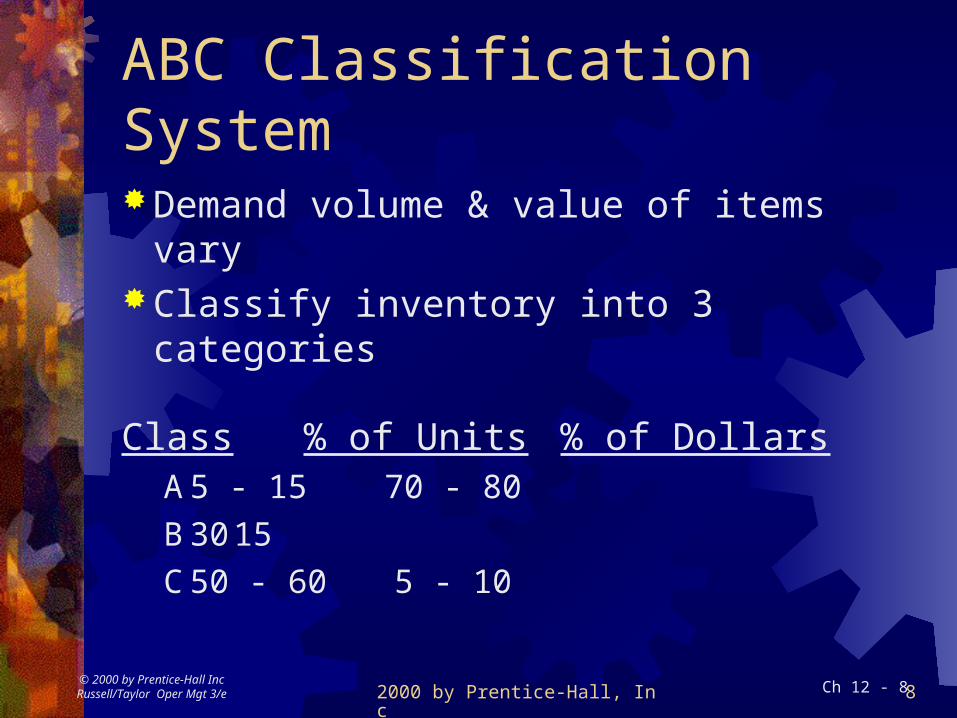
ABC Classification System
Demand volume & value of items varyClassify inventory into 3 categories
Class% of Units% of DollarsA 5 - 15 70 - 80
B 30 15
C 50 - 60 5 - 10

2000 by Prentice-Hall, Inc 9Ch 12 - 9© 2000 by Prentice-Hall IncRussell/Taylor Oper Mgt 3/e
ABC Classification ExampleCost Usage Part Value Value Quantity Cumulative
60 90 9 30,600 35.8 6.0 6.0350 40 8 16,000 18.7 5.0 11.030 130 2 14,000 16.4 4.0 15.080 60 1 5,400 6.3 9.0 24.030 100 4 4,800 5.6 6.0 30.020 180 3 3,900 4.6 13.0 43.010 170 6 3,600 4.2 18.0 61.0
320 50 5 3,000 3.5 10.0 71.0510 60 10 2,400 2.8 12.0 83.020 120 7 1,700 2.0 17.0 100.0
85,400$
Class Items % Value % UnitsA 9,8,2 71 15B 1, 4, 3 16.5 25C 6, 5, 10, 7 12.5 60
2000 by Prentice-Hall, Inc 10Ch 12 - 10© 2000 by Prentice-Hall IncRussell/Taylor Oper Mgt 3/e
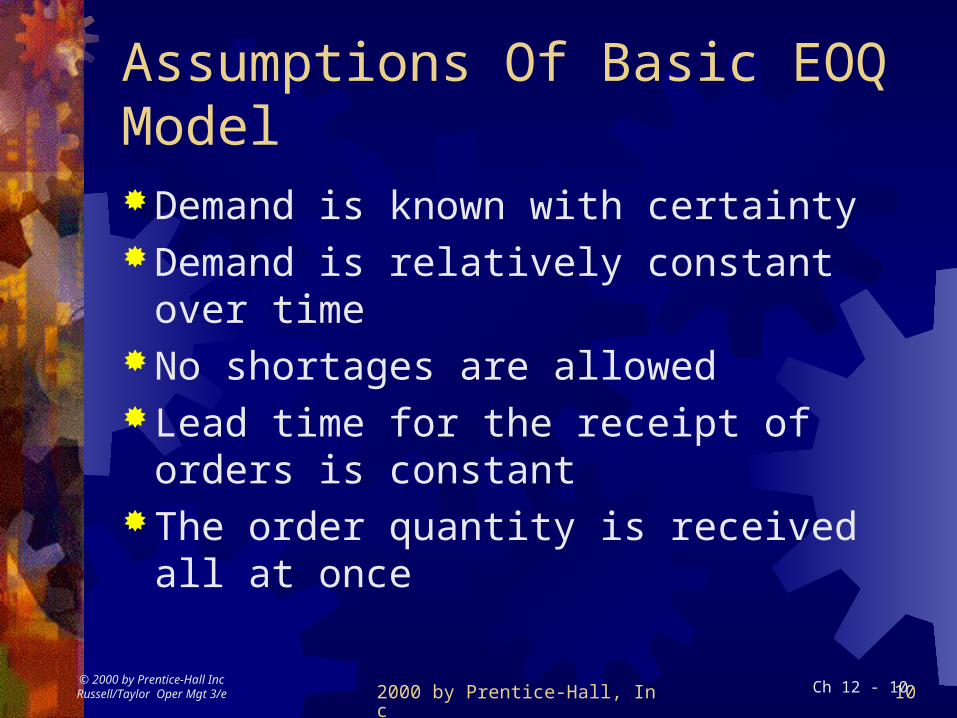
Assumptions Of Basic EOQ ModelDemand is known with certainty Demand is relatively constant over timeNo shortages are allowedLead time for the receipt of orders is
constantThe order quantity is received all at
once

2000 by Prentice-Hall, Inc 11Ch 12 - 11© 2000 by Prentice-Hall IncRussell/Taylor Oper Mgt 3/e
The Inventory Order Cycle
Demand rate
0 TimeLead time
Lead time
Order Placed
Order Placed
Order Received
Order Received
Inve
nto
ry L
eve
l
Reorder point, R
Order qty, Q
2000 by Prentice-Hall, Inc 12Ch 12 - 12© 2000 by Prentice-Hall IncRussell/Taylor Oper Mgt 3/e
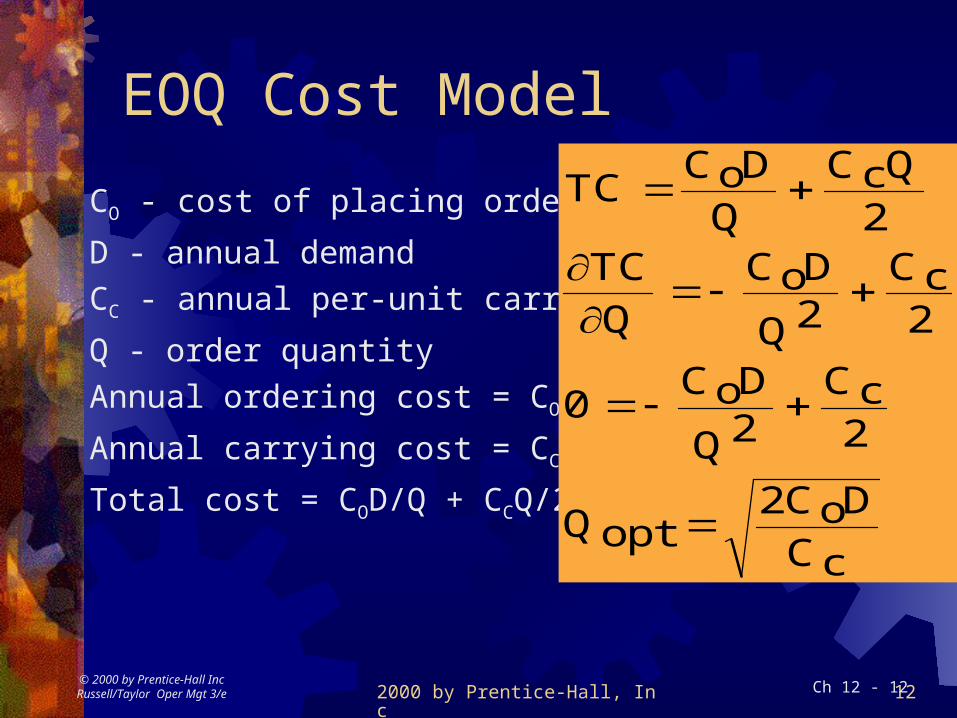
EOQ Cost Model
CO - cost of placing order
D - annual demand
CC - annual per-unit carrying cost
Q - order quantity
Annual ordering cost = COD/Q
Annual carrying cost = CCQ/2
Total cost = COD/Q + CCQ/2
TCCoD
QCcQ
TCQ
CoD
Q
Cc
CoD
Q
Cc
QoptCoDCc
2
2 2
02 2
2
2000 by Prentice-Hall, Inc 13Ch 12 - 13© 2000 by Prentice-Hall IncRussell/Taylor Oper Mgt 3/e
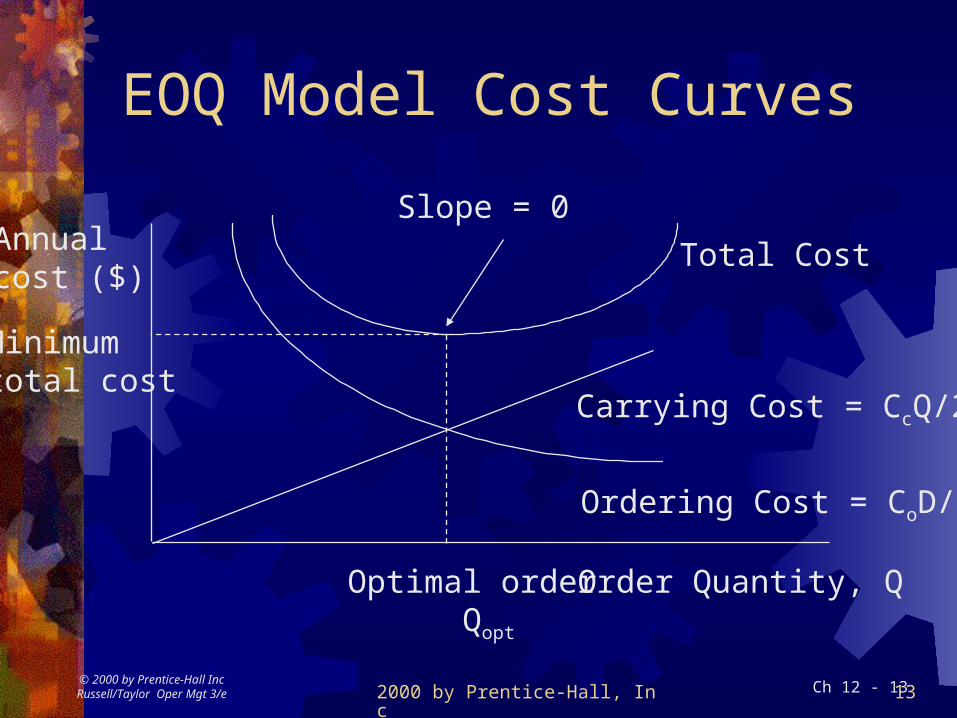
EOQ Model Cost Curves
Slope = 0
Total Cost
Ordering Cost = CoD/Q
Order Quantity, Q
Annualcost ($)
Minimumtotal cost
Optimal order Qopt
Carrying Cost = CcQ/2

2000 by Prentice-Hall, Inc 14Ch 12 - 15© 2000 by Prentice-Hall IncRussell/Taylor Oper Mgt 3/e
EOQ With Noninstantaneous Receipt
Q(1-d/p)
Inventorylevel
(1-d/p)Q2
Time0
Orderreceipt period
BeginOrderreceipt
EndOrderreceipt
Maximuminventory level
Averageinventory level
2000 by Prentice-Hall, Inc 16Ch 12 - 18© 2000 by Prentice-Hall IncRussell/Taylor Oper Mgt 3/e
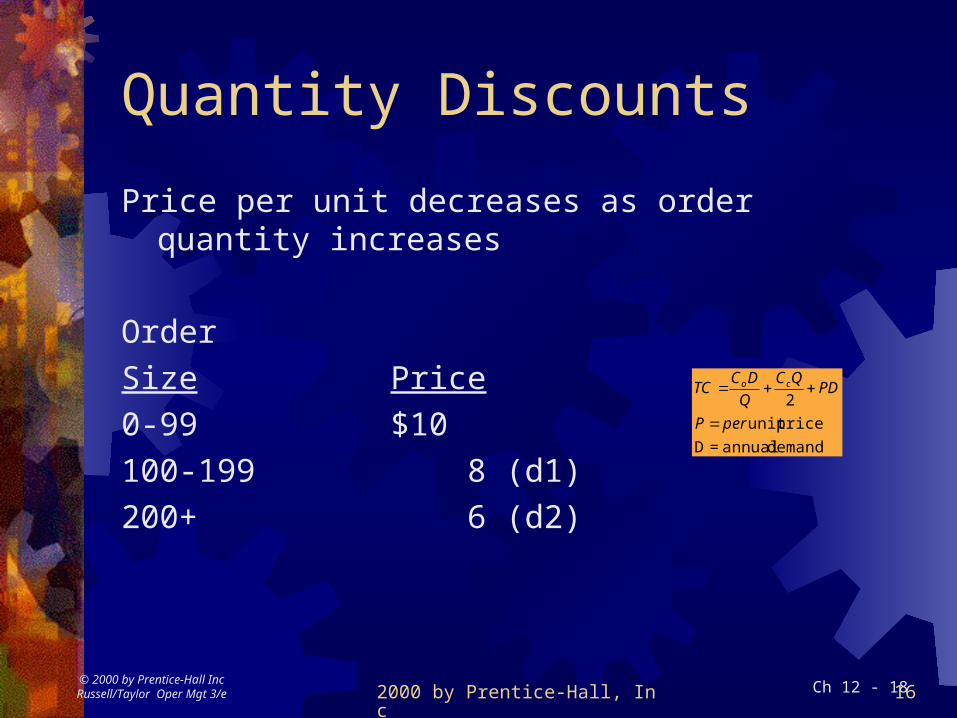
Quantity Discounts
Price per unit decreases as order quantity increases
Order
Size Price
0-99 $10
100-199 8 (d1)
200+ 6 (d2)
demand annual=D
priceunit
2
perP
PDQC
Q
DCTC co
2000 by Prentice-Hall, Inc 17Ch 12 - 19© 2000 by Prentice-Hall IncRussell/Taylor Oper Mgt 3/e
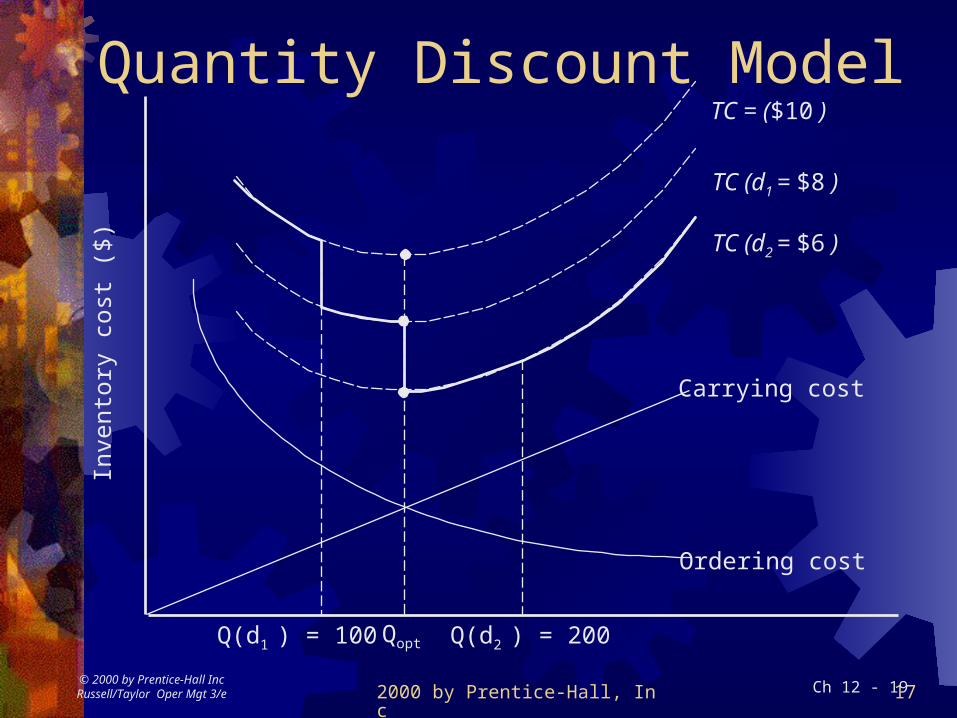
Quantity Discount Model
Qopt
Carrying cost
Ordering cost
Inve
ntor
y co
st (
$)
Q(d1 ) = 100 Q(d2 ) = 200
TC (d2 = $6 )
TC (d1 = $8 )
TC = ($10 )

2000 by Prentice-Hall, Inc 18Ch 12 - 21© 2000 by Prentice-Hall IncRussell/Taylor Oper Mgt 3/e
When to Order
Reorder Point -level of inventory at which to place a new order
R = dL
where
d = demand rate per period
L = lead time

2000 by Prentice-Hall, Inc 20Ch 12 - 23© 2000 by Prentice-Hall IncRussell/Taylor Oper Mgt 3/e
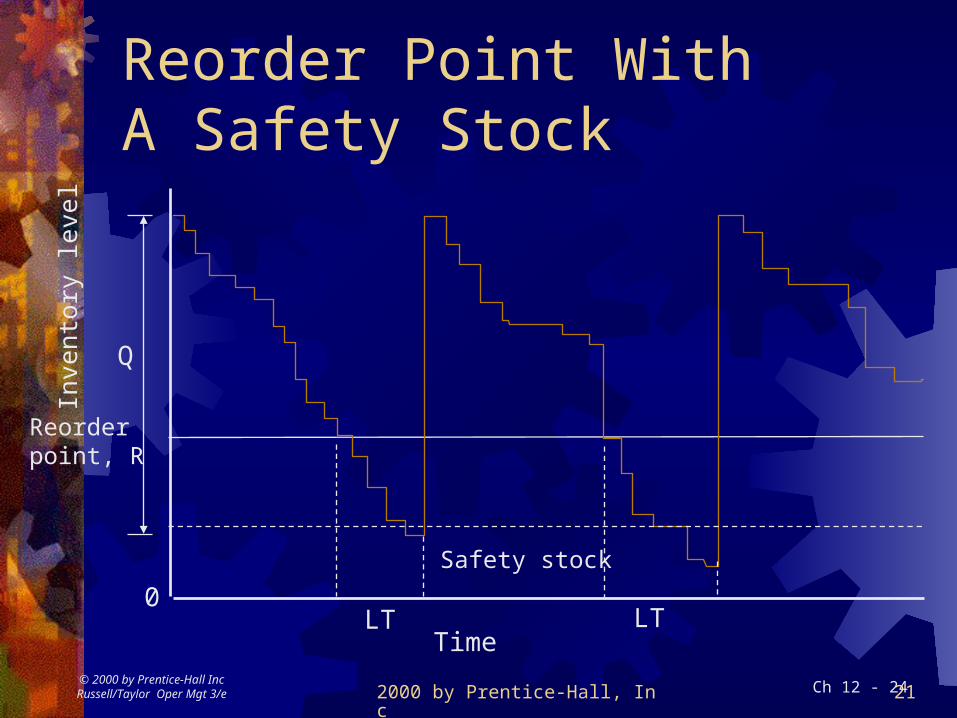
Safety Stocks
Safety stock buffer added to on hand inventory during
lead timeStockout
an inventory shortageService level
probability that the inventory available during lead time will meet
demand
2000 by Prentice-Hall, Inc 21Ch 12 - 24© 2000 by Prentice-Hall IncRussell/Taylor Oper Mgt 3/e
Reorder Point With A Safety Stock
Reorderpoint, R
Q
0
Inve
ntor
y le
vel
LT LTTime
Safety stock

2000 by Prentice-Hall, Inc 22Ch 12 - 25© 2000 by Prentice-Hall IncRussell/Taylor Oper Mgt 3/e
Reorder Point With Variable Demand
R dL z d L
where
d
d
z d L safety stock
= average daily demand
L = lead time
standard deviation of daily demand
z = number of standard deviations for desired service level
Variance
L
S dard deviation L
d L
(
tan
daily variances) x (number of days of lead time)
= d2
d2

2000 by Prentice-Hall, Inc 23Ch 12 - 26© 2000 by Prentice-Hall IncRussell/Taylor Oper Mgt 3/e
Reorder Point For A Service Level
Safety stock
R
Probability of meeting demand during lead time = service level
dLDemand
z d L
Probability of a stockout

2000 by Prentice-Hall, Inc 24Ch 12 - 28© 2000 by Prentice-Hall IncRussell/Taylor Oper Mgt 3/e
Determining Z Value For Service LevelZ 0.00 0.01 ... 0.05
1.6 0.4452 0.4463 … 0.4505...
Z = 1.650
Probability of a stockout = 5%
0.45050.5000
Service level = area to left of Z value or 95%
......
...

2000 by Prentice-Hall, Inc 25Ch 12 - 29© 2000 by Prentice-Hall IncRussell/Taylor Oper Mgt 3/e
Order Quantity For A Periodic Inventory System
Q d t L z t L I
where
d
t
z t L
b d b
b
d
d b
= average demand rate
fixed time between orders
L = lead time
standard deviation of demand
safety stock
I = inventory in stock