Embed Size (px)
Citation preview

表

T - 1
表 1.1 作業工程
Phase I : Review of Present Situations and Formulation of the Capacity Improvement Plans for Field Offices
1st Field Work in the Philippines (20th August 2000 to 2nd March 2001)
(1) Explanation and Discussion on the Inception Report(2) Preparation of the Technology Transfer Plan(3) Investigations and Analyses of the Macro-framing Plans(4) Investigations and Analyses of the Studies and Projects Implemented by the Donor
Countries and International Institutions(5) Grasp of the Present Situations in the Entire NIA’s Management System(6) Formulation of the Capacity Improvement Plan for NIA Field Offices(7) Preparation of the Progress Report(8) Implementation, Monitoring and Revision of the Capacity Improvement Plan for
Field Offices(9) Analyses of the NIA Central Office Management System
(10) Investigations on the Irrigation Systems(11) Conduct of the Farmer Beneficiaries’ Intention Survey(12) GIS Planning and Its Establishment(13) Preparation and the Draft Interim Report(14) Explanation and Discussion of the Draft Interim Report
1st Home Work in Japan (5 March to 19 March 2001)
(1) Upgrading of the Interim Report
Phase II : Formulation of the NIA’s Management System Strengthening Plan
2nd Field Work in the Philippines (3rd June to 16th August 2001)
(1) Discussion of Interim Report(2) Continued Implementation of the Capacity Improvement Plan at the Application
Offices(3) GIS Training at Central Office and UPRIIS(4) Preparation of the Public Relations (PR) Tools(5) Formulation of the NIA’s Management System Strengthening Plan(6) Preparation of the Draft Final Report(7) Discussion of the Draft Final Report(8) Submission of the Final Report
3rd Field Work in the Philippines (10th to 24th October 2001)
(1) Technology Transfer and Holding of the Seminar
T - 2
表 1.2 政府機関間調整委員会(IACC)及び NIA内部タスクフォース(ITF)のメンバーリスト
(1) Inter-Agency Coordination Committee (IACC)
Member Agencies Representatives(Official Members)
1) Department of Agriculture (DA) Undersecretary, DA
2) Department of Agrarian Reform (DAR) Undersecretary, DAR
3) Department of Public Works and Highways (DPWH) Undersecretary, DPWH
4) Department of Interior and Local Government (DILG) Undersecretary, DILG
5) National Economic and Development Authority (NEDA) Undersecretary, NEDA
6) Department of Budget and Management (DBM) Undersecretary, DBM
7) Others Representative
(2) Internal Task Force (ITF)
Name Membership
1) Advisory Team
1)-1 Deputy Administrator Chairman1)-2 Assistant Administrator for Project Development and
Implementation (PDI) Member
1)-3 Assistant Administrator for Operation and Equipment Management (SO EM)
Member
1)-4 Assistant Administrator for Finance and Management (FM) Member
1)-5 Assistant Administrator for Administrator Services (AS) Member
2) Task Force Team
2)-1 Manager of Corporate Planning Staff Team Leader2)-2 Manager of Project Development Department (PDD) Member2)-3 Manager of Design and Specifications Department (DSD) Member2)-4 Manager of Construction Management Department (CMD) Member2)-5 Manager of Institutional Development Department (IDD) Member2)-6 Manager of Equipment Management Department (EMD) Member2)-7 Manager of Systems Management Department (SMD) Member2)-8 Manager of Controllership Department (CD) Member
2)-9 Manager of Management Services Department (MSD) Member
2)-10 Manager of Treasury Department (TD) Member2)-11 Manager of Personnel and Records Management Department
(PRMD) Member
2)-12 Manager of Legal Department (LD) Member2)-13 Manager of Procurement and Physical Resources Department
(PPRD) Member

T - 3
表 1.3 作業監理委員会メンバー、JICA フィリピン事務所代表、及び
JICA 専門家のリスト
(1) Advisory Committee Members
Name Position
1) Mr. Katsumi NozawaLeader of the Advisory Committee for theStudy on Strengthening of NIA’s ManagementSystem
2) Mr. Katsuhiro Yamauchi Member of the Advisory Committee3) Mr. Shigeo Ishida “ “4) Mr. Masaaki Hanai “ “
5) Mr. Iwao Wada “ “6) Mr. Ieko Kakuta “ “
(2) JICA Philippines Office Representatives
Name Position1) Mr. Motofumi Kohara Deputy Resident Representative2) Mr. Tetsuji Iida Assistant Resident Representative
(3) JICA Experts
Name Position1) Mr. Kanezo Takeuchi JICA Expert to NIA2) Mr. Toshiyuki Yoshioka JICA Expert to NIA3) Mr. Takahiro Ota Advisor, PDS-DA

1. Mr. Toshikazu TAI - Mr. Dominador D. PASCUATeam Leader/ Institutional Development Manager, Corporate Planning Staff, NIA
2. Mr. Fumihiko FURUICHI - Mr. Guillermo C. MERCADODeputy Leader/ Organization & Institutions Management Systems Development Chief,
Officer-in-Charge, Organization and Methods Division, MSD
3. Mr. David C. ROCO - Mr. Ariel P. CASTROFinance and Accounting Manager, Revenue Generation Services Division, Treasury Department
- Ms. Virginia R. ATIENZAManager, General Accounting Division, Controllership Department
4. Mr. Masami SUGIMOTO - Mr. Romeo G. NATIVIDADAuditing Management Systems Development Chief,
Officer-in-Charge, Management Audit Division, MSD- Ms. Corazon P. GARCIA
Sr. Management Analyst, MSD
5. Mr. Takayoshi YAMAZAKI - Ms. Leonor P. FERNANDEZAgriculture/ Irrigation Policy Senior Corporate Planning Analyst, Corporate Planning Staff
6. Mr. Takao OZAKI - Ms. Anabelen J. LANDICHOCorporate Management Corporate Planning Specialist, Corporate Planning Staff
7. Mr. Virgilio E. CABEZON - Mr. Roberto V. Dela CRUZOperations Management Supervising Engineer, NIA Region 3
- Mr. Basilio LOZANO (Substitute in Manila), Senior Economist A, Research& Development Division, SMD
8. Mr. Shinichi HAMADA - Mr. Basilio LOZANOIrrigation Facilities Senior Economist A, Research & Development Division, SMD
9. Mr. Wenhao SHA / Mr. Takeshi TOYOOKA - Mr. Celso BERNARDOGeographic Information System (GIS) Senior Engineer, Operations & Management Division, SMD
- Mr. Reynaldo BALOLOYPrincipal Engineer A, Irrigation Waterhed and Environmental Division
10. Mr. Masahiro OSEKO - Ms. Martha CAMADAParticipatory Approach Technician Assistant, Office of the Deputy Administrator
11. Mr. Janakiraman K. KUMAR - Mr. Julius U. CABAUATANSystem Engineer Management Information Design Specialist, Management Information
Systems Division, Corporate Planning Staff
12. Mr. Atsushi FUJINO / Miss Sayaka HARA - Ms. Rosalin C. MANGAHASLogistics Statistician, Corporate Planning Staff
T - 4
表 1.4 JICA調査団及びカウンターパートのリスト
JICA Study Team Counterpart Personnel (GOP)No.

T - 5
表 2.1 灌漑開発関連の外国借款及び資本支出、1969~1999年 (1/2)
Year Loan Project
LoanAmount(million
US$)
CapitalReleases(million
PHP)
%Foreign % Local
1969 ADB Cotabato Irrigation 2.50 188.6 n.a. n.a.1970 WB Upper Pampanga River Project 34.0 168.0 n.a. n.a.1971 - 356.7 - -1972 - 568.4 - -
1973 ADB Angat-Magat Integrated IrrigationDevelopment 9.6 901.3 n.a. n.a.
ADB Davao del Norte Irrigation 4.2 - n.a. n.a.1974 WB Aurora Penaranda Irrigation Project 68.0 901.3 n.a. n.a.
ADB Agusan del Sur Irrigation Project 5.8 901.3 n.a. n.a.
1975 WB Tarlac Irrigation System ImprovementProject 17.0 1,889.8 n.a. n.a.
WB Rural Infrastructure Project 25.0 - - -ADB Pulangui River Irrigation 13.5 - - -ADB Laguna de Bay Development 27.5 - - -
1976 WB Magat River Irrigation Project 42.0 1,795.1 17.3 82.7WB Chico River Irrigation Project 50.0 - - -ADB Second Davao del Norte Project 15.0 - - -
1977 WB Jalaur River Irrigation Project 15.0 1,801.6 23 77
WB National Irrigation System ImprovementProject I 50.0 - - -
WB Mindoro River Development Project 15.0 - - -ADB Tago River Irrigation 22.0 - - -
1978 WB National Irrigation System ImprovementProject 65.0 1,889.8 23.5 76.5
WB Samar River Development Project 28.0 - - -WB Magat River Development Project II 150.0 - - -ADB Allah River Irrigation 23.5 - - -ADB Second Agusan Irrigation 14.0 - - -OECF CIADP 49.3 - - -
1979 WB Magat River Development Project III 21.0 2,937.2 35.6 64.4ADB Bukindon Irrigation 15.0 - - -ADB Third Mindanao Irrigation Study 1.70 - - -ADB Bicol River Basin Irrigation Development 41.0 - - -OPEC Bukindon Irrigation 3.5 - - -IFAD Magat River Development Project III 10.0 - - -
1980 WB Philippine Medium Scale Irrigation Project 71.0 2,937.2 35.5 64.4ADB Second Laguna de Bay Irrigation 20.0 - - -
1981 WB Watershed Management and Erosion 38.0 2,307.5 44 56ADB Palawan Integrated Area Development 47.0 - - -OPEC Laguna de Bay Project 7.5 - - -
1982 WB Communal Irrigation Development Project I 71.1 2,046.7 38 62ADB Third Davao del Norte Irrigation 45.3 - - -
IFAD Communal Irrigation Development Project IProject I 12.0 - - -

T - 6
表 2.1 灌漑開発関連の外国借款及び資本支出、1969~1999年 (2/2)
Year Loan Project
LoanAmount(million
US$)
CapitalReleases(million
PHP)
%Foreign % Local
1983 ADB Special Assistance for Selected Bank Projects 30.2 1,618.9 53 47ADB Irrigation Sector 36.8 - - -ADB Fourth Mindanao Irrigation Study 1.5 - - -OECF Bohol Irrigation 40.0 - - -
1984 ADB Allah River Irrigation (Supplementary) 27.9 810.1 83.6 16.41985 - 876.9 63.3 36.71986 ADB Special Project Implementation Assistance 30.2 554.3 53.5 46.5
ADB Highland Agricultural Development 18.8 - - -1987 - - - -1988 WB Irrigation Operations Support Project I 45.0 n.a. - -
ADB Sorsogon Integrated Area Development 3.7 n.a. - -1989 - - - -1990 ADB Palawan Integrated Area Development 13.9 n.a. - -
ADB Irrigation Systems Improvement Project I 29.0 - - -OECF Malitubog-Maridagao Irrigation Project 38.9 - - -
1991 WB Communal Irrigation Development Project II 46.2 n.aOECF Pampanga Delta Irrigation Project 68.3 n.a. - -
1992 ADB Kabulnan Irrigation and Area DevelopmentProject 48.0 - - -
IFAD Visayas Communal Irrigation andParticipatory Project 15.1 - - -
1993 WB Irrigation Operations Support Project II 51.3 n.a. - -1994 - - - -1995 WB Water Resources Development Project 54.7 n.a. - -
ADB Irrigation Systems Improvement Project II 30.0 - - -1996 OECF Lower Agusan Development Project 40.3 n.a. - -1997 WB Water Resources Development Project 54.7 n.a. - -
OECF Tarlac Groundwater Irrigation SystemReactivation Project - n.a. - -
1998 OECF Central Luzon Improvement Project 103.9 - - -1999 ADB Southern Philippines Irrigation Project 60.0 n.a. - -
Total Lending for 1969-1999 2,001.3 - - -
Sources: Svendsen et al, 1990, World Bank, 1992 and NIA, 1999. This does not include 56 million
dollars in grants from agencies such as USAID and JICA. Loan amount reflects the portion
of the loan used for irrigation project component.
T - 7
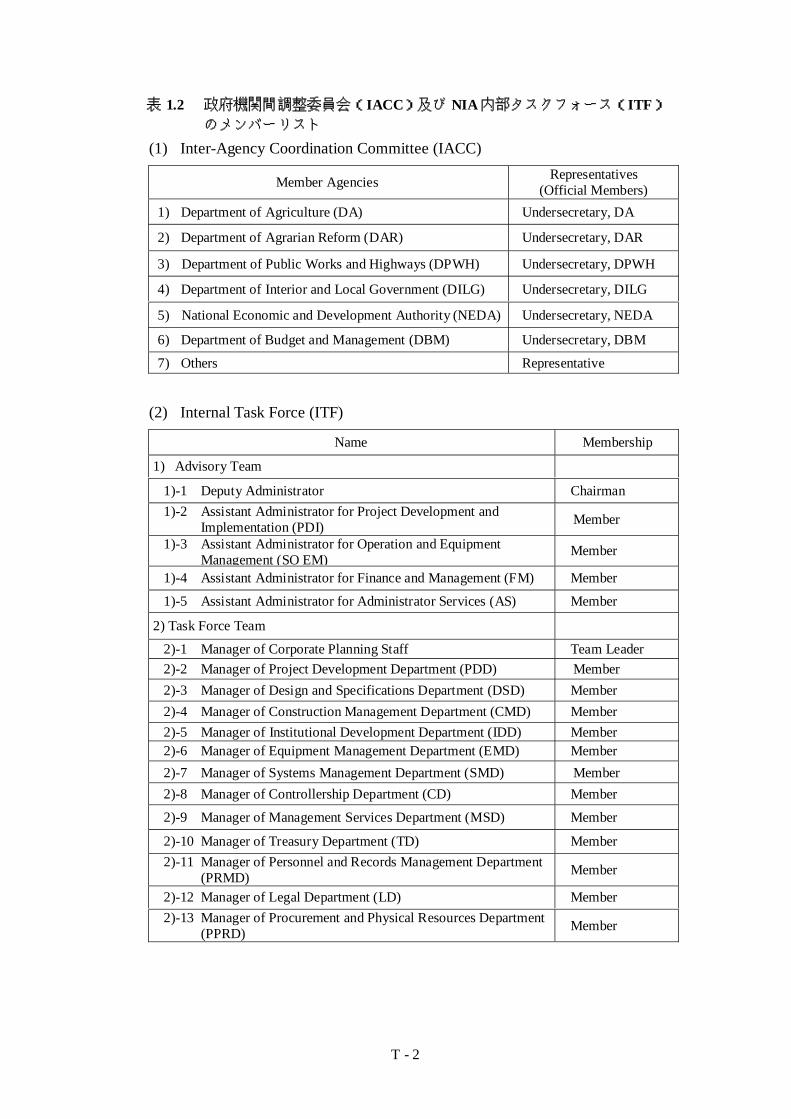
表 2.2 農務省(DA)及び NIA が実施中の外国支援灌漑プロジェクト・プロファイル (1/3)
Project Title (Duration) / Description Project Location Fund Source /Cost (PHP1,000)
Malitubog-Maridagao Irrigation Project (1990-2001)1.
Construction of diversion dam and irrigation and drainage facilities to irrigate 6,502ha of land in order to improve the living condition and increase farmers’ income inCentral MIndanao
Region 12North Cotabato (Pikit,Carmen); Maguindanao(Pagalungan)
OECF Loan PH-112LP – 1,024,678GOP – 978,837
TPC – 2,003515
Pampanga Delta Irrigation Project (1991-2001)2.
Construction of diversion dam, pumping station, irrigation and drainage canals, on-farm facilities and other project facilites to irrigate 10,270 ha
Region 3Pampanga (Arayat, Sta. Ana,Mexico, San Luis, San Simon,Candaba)
OECF Loan PH-123LP – 2,107,330GOP – 755,730
TPC – 2,863,060Lower Agusan Development Project (1996-2002)3.
To irrigate 8 existing CIS covering 840 ha and extend irrigation benefits to 7,152 ha ofnew area for a total of 7,992 ha
Region 13Agusan del Sur (Butuan Cityand Buenvista)
OECF Loan PH-153LP – 979,210
GOP – 325,150TPC – 1,304,360
Tarlac Groundwater Irrigation System Reactivation Project (1997-2003)4.
Construction of diversion dam and irrigation and drainage facilities to irrigate 6,502ha of land in order to improve the living condition and increase farmers’ income inCentral Mindanao
Region 3Tarlac (Panique, Pura, Ramos,Gerona, Tarlac, Victoria,Capas, La Paz, Concepcion,Mondaca)
OECF LoanLP – 450,000
GOP – 173,600TPC – 623,600
Casecnan Multi-Purpose Irrigation Project (1998-2003)5.
Improving the existing drainage facilities in the UPRIIS. The scheme will makeavailable additional 301.9 million cum of water annually conveyed through DC andexisting canal networks of UPRIIS. Also expected to be achieved through the projectis the improving of institutional concerns of NIA
Regions 2 & 3Nueva Vizcaya, Nueva Ecija,Bulacan
OECF LoanLP – 2,882,286
GOP – 1,784,000TPC – 4,666,286
6. Bohol Irrigation Project – Stage II (2000 – 2008) Region 7 JBIC (Ex‐OECF)Loan
Construction of an earth fill dam across Bayongan River, diversion canal, main canaland laterals, drainage and road networks, development of on-farm facilities includingland development, relocation and resettlement of families affected by damconstruction and reservoir, preparation of water management plan including watermeasurement and communication network to irrigate 4,550 ha of new area and 750hectares of rehabilitation area.
Municipalities of Ubay, SanMiguel and Trinidad in theProvince of Bohol
LP– 1,636,000GOP- 748,000TPC– 2,384,000

T - 8
表 2.2 農務省(DA)及び NIA が実施中の外国支援灌漑プロジェクト・プロファイル (2/3)
Project Title (Duration) / Description Project Location Fund Source /Cost (PHP1,000)
Communal Irrigation Development Project – Phase II (1991-1999)7.To rehabilitate and upgrade 117 existing CIS covering 18,016 ha and extend irrigationbenefits to 13,449 ha of new areas through the construction of 93 new CIPs. TheProject will directly benefit 30,000 farm families and irrigators of nearby 3,000 NIAassisted small schemes. I would also support development of communal irrigationassociations. The Project would cover technical assistance aimed to strengthen NIA’scapability to assess micro-catchment and improved IA financial systems.
Regions 2,4,5,6,8,9,11,12 & 13 WB-IBRD Loan3261-PH
LP – 3,723,130GOP – 1,383,400TPC – 5,106,530
Irrigation Operations Support Project II (IOSP-II: 1993-2000)8.The Project will (a) improve 17 NISs, construct 3 sediment extruders and improvedwater structures and prevent erosion in critical areas; (b) support improve system levelO&M services; (c) strengthen existing IAs and provide O&M equipment andmaterials; and (d) improve agricultural support services.
Regions 2, 3,4, 6, 9, 12 and 13 WB-IBRD Loan3607-PH
LP – 1,785,781GOP – 549,113
TPC – 2,334,894Water Resources Development Project (WRDP: 1997-2001)9.To implement a broad policy and institutional framework in the water sector;formulate a national water resources management strategy; adopt a river basinapproach, integrating land use policies and agricultural practices with watermanagement; prepare and implement catchment management plans to improveupstream watersheds for sustaining irrigation and other projects; improveperformance of existing NIS and emphasize decentralized management withparticipation of stakeholders and greater cost recovery.
Regions 2, 3,4, 6, 9, 12 and 13 WB-IBRD Loan4220-PH
LP – 1,670,148GOP – 748,075
TPC – 2,418,223
Kabulnan Irrigation and Area Development Project – Irrigation and Agri-ExtensionComponent (1992-2000)
10.
The Project will (a) improve 17 NISs, construct 3 sediment extruders and improvedwater structures and prevent erosion in critical areas; (b) support improve system levelO&M services; (c) strengthen existing IAs and provide O&M equipment andmaterials; and (d) improve agricultural support services.
Region 12Maguindanao (Ampatuan,Maganoy, Datu Piang)
ADB1136-PHI
LP – 1,128,932GOP – 642,994
TPC – 1,771,926
Irrigation Systems Improvement Project (ISIP-II: 1997-2002)11.The Project will (a) improve 17 NISs, construct 3 sediment extruders and improvedwater structures and prevent erosion in critical areas; (b) support improve system levelO&M services; (c) strengthen existing IAs and provide O&M equipment andmaterials; and (d) improve agricultural support services.
Regions 8Leyte (Alangalang, SanMiguel, Palo, Sta. Fe, Pastrana,Dagami, Tabon, Dulag,Burauen, Julita, Ormoc,Abuyog, Javier)
ADB1365/1366-PHI
LP – 750,000GOP – 422,100
TPC – 1,172,100
T - 9
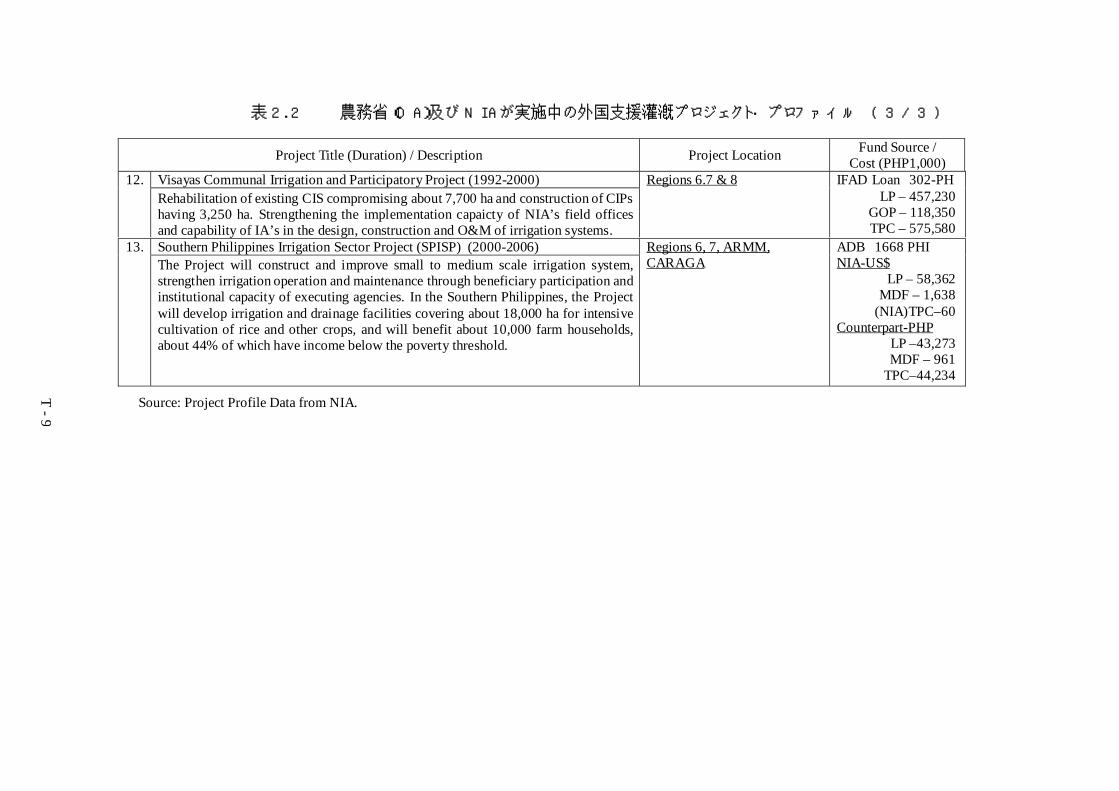
表 2.2 農務省(DA)及び NIA が実施中の外国支援灌漑プロジェクト・プロファイル (3/3)
Project Title (Duration) / Description Project Location Fund Source /Cost (PHP1,000)
Visayas Communal Irrigation and Participatory Project (1992-2000)12.Rehabilitation of existing CIS compromising about 7,700 ha and construction of CIPshaving 3,250 ha. Strengthening the implementation capaicty of NIA’s field officesand capability of IA’s in the design, construction and O&M of irrigation systems.
Regions 6.7 & 8 IFAD Loan 302-PHLP – 457,230
GOP – 118,350TPC – 575,580
Southern Philippines Irrigation Sector Project (SPISP) (2000-2006)13.The Project will construct and improve small to medium scale irrigation system,strengthen irrigation operation and maintenance through beneficiary participation andinstitutional capacity of executing agencies. In the Southern Philippines, the Projectwill develop irrigation and drainage facilities covering about 18,000 ha for intensivecultivation of rice and other crops, and will benefit about 10,000 farm households,about 44% of which have income below the poverty threshold.
Regions 6, 7, ARMM,CARAGA
ADB 1668 PHINIA-US$
LP – 58,362MDF – 1,638
(NIA)TPC–60Counterpart-PHP
LP –43,273MDF – 961
TPC–44,234
Source: Project Profile Data from NIA.
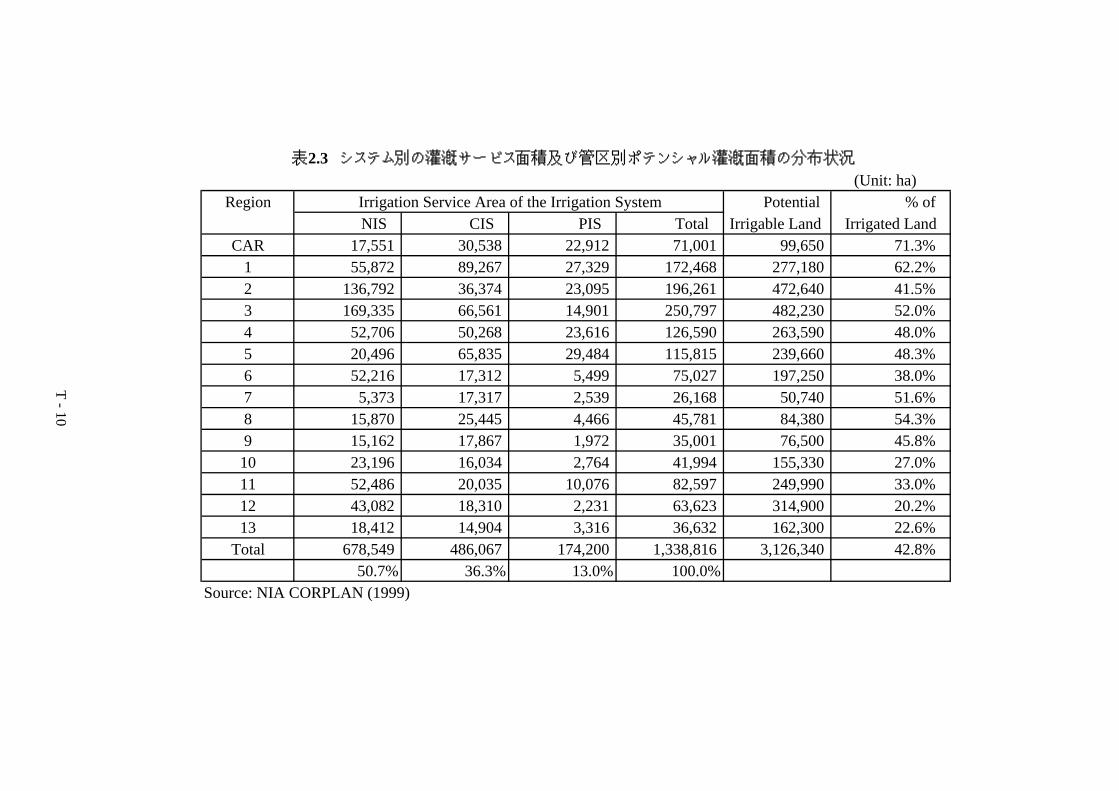
(Unit: ha)Region Irrigation Service Area of the Irrigation System Potential % of
NIS CIS PIS Total Irrigable Land Irrigated LandCAR 17,551 30,538 22,912 71,001 99,650 71.3%
1 55,872 89,267 27,329 172,468 277,180 62.2%2 136,792 36,374 23,095 196,261 472,640 41.5%3 169,335 66,561 14,901 250,797 482,230 52.0%4 52,706 50,268 23,616 126,590 263,590 48.0%5 20,496 65,835 29,484 115,815 239,660 48.3%6 52,216 17,312 5,499 75,027 197,250 38.0%7 5,373 17,317 2,539 26,168 50,740 51.6%8 15,870 25,445 4,466 45,781 84,380 54.3%9 15,162 17,867 1,972 35,001 76,500 45.8%10 23,196 16,034 2,764 41,994 155,330 27.0%11 52,486 20,035 10,076 82,597 249,990 33.0%12 43,082 18,310 2,231 63,623 314,900 20.2%13 18,412 14,904 3,316 36,632 162,300 22.6%
Total 678,549 486,067 174,200 1,338,816 3,126,340 42.8%50.7% 36.3% 13.0% 100.0%
Source: NIA CORPLAN (1999)
表2.3 システム別の灌漑サービス面積及び管区別ポテンシャル灌漑面積の分布状況
T - 10

T - 11
表 2.4 国営及び共同灌漑システムの開発状況、1964~1999年
(Unit: 1,000 ha)Year NIS CIS Total Year NIS CIS Total1964 217.5 n.a 217.5 1982 549.3 634.8 1,184.11965 217.5 n.a 217.5 1983 554.7 648.8 1,203.51966 217.5 n.a 217.5 1984 567.2 658.8 1,226.01967 288.5 n.a 288.5 1985 595.9 665.1 1,261.01968 305.7 n.a 305.7 1986 600.5 668.8 1,269.31969 336.8 n.a 336.8 1987 618.0 673.1 1,291.11970 349.0 n.a 349.0 1988 617.0 684.6 1,301.61971 349.1 n.a 349.1 1989 621.0 695.9 1,317.91972 349.1 n.a 349.1 1990 637.3 714.8 1,352.11973 350.2 429.0 779.2 1991 645.8 724.5 1,370.31974 355.0 449.0 804.0 1992 646.5 734.1 1,380.61975 396.3 470.0 866.3 1993 646.5 741.4 1,387.91976 435.9 493.0 928.9 1994 651.8 442.0 1,093.81977 455.9 519.0 947.9 1995 651.8 474.3 1,126.11978 463.7 538.0 1,001.7 1996 651.8 488.5 1,140.31979 472.1 552.0 1,024.1 1997 662.7 491.4 1,154.11980 491.7 580.0 1,071.7 1998 678.5 491.4 1,169.91981 514.3 602.1 1,116.4 1999 678.6 486.1 1,164.7
Note: * These figures might be modified after the supplemental inventory surveyconducted by JICA Study Team.
Source: Svendsen 1990 and NIA 1999. Note that there was a major reassessment offunctioning system 1994 that reduced the number of communals by 40%.

表2.5 承認予算額と実際の支出額、 1975~2000年(Unit: million PHP)
APPROVED BUDGET ACTUAL RELEASES AND AVAILMENTS Conversion Converted Year Equity/ Forex CIP Corp. Others Total Equity/ Forex CIP Corp. Others Total Rates Used Actual
GOP Approp. Funds GOP Approp. Funds $1.00= Release*
FY 75-76 174.87 124.50 60.00 - 448.03 807.40 145.17 155.88 29.96 - 447.36 778.37 P7.50 4,253.4Jul-Dec 76 100.00 129.75 40.00 - 208.81 478.56 88.00 49.85 36.46 - 206.90 381.21 P7.50 2,083.1
1977 100.00 414.00 60.00 - 690.61 1,264.61 100.00 193.14 59.14 - 536.81 889.09 P7.50 6,858.41978 100.00 937.50 15.31 - 690.61 1,743.42 25.00 222.57 15.31 - 669.41 932.29 P7.50 5,094.41979 150.00 615.53 23.25 - 1,396.24 2,185.02 100.00 820.88 23.25 - 1,363.45 2,307.58 P7.50 12,609.71980 200.00 774.45 150.00 - 1,116.50 2,240.95 349.50 761.14 134.70 - 897.34 2,142.68 P7.50 11,708.61981 671.00 864.45 120.00 - 1,084.86 2,740.31 447.20 907.10 109.52 - 798.46 2,262.28 P7.50 12,362.21982 1,145.00 1,108.95 150.00 - 460.18 2,864.13 1,559.60 663.82 124.95 - - 2,348.37 P7.50 12,832.61983 950.00 1,732.40 125.00 - - 2,807.40 760.00 1,075.20 122.50 - - 1,957.70 P10.00 8,023.41984 760.00 1,350.00 100.00 - - 2,210.00 205.00 1,494.00 88.20 - - 1,787.20 P18.00 4,070.41985 330.00 1,213.92 75.00 291.00 - 1,909.92 149.00 997.80 71.10 452.61 - 1,670.51 P18.00 3,805.31986 137.00 1,179.15 151.03 215.33 - 1,682.51 303.82 925.04 151.03 399.91 - 1,779.80 P21.00 3,476.21987 400.00 1,418.80 400.03 60.02 24.56 2,303.41 400.00 788.30 370.04 18.42 24.56 1,601.32 P20.90 3,139.81988 812.00 1,356.83 420.00 64.50 94.45 2,747.78 812.00 776.20 420.00 14.52 94.45 2,117.17 P21.00 4,135.11989 526.71 1,528.11 391.24 62.00 122.68 2,630.74 526.71 759.75 391.24 91.96 122.68 1,892.34 P21.75 3,570.51990 779.30 2,129.46 508.03 65.00 583.19 4,064.98 701.37 1,253.57 457.22 63.50 583.19 3,058.85 P22.25 5,633.21991 886.50 1,176.52 236.83 - 977.05 3,276.90 811.78 536.68 224.99 - 977.05 2,550.50 P24.90 4,201.81992 961.81 897.90 - - 552.88 2,412.59 868.26 455.10 - - 483.98 1,807.34 P30.00 2,469.01993 1,108.53 1,092.29 - - 651.72 2,852.54 1,108.53 982.25 - - 351.35 2,442.13 P30.00 3,336.21994 1,291.63 930.54 - - 472.43 2,694.60 1,121.38 989.77 - - 472.43 2,583.58 P29.00 3,654.31995 2,063.55 1,097.35 - - 1,237.64 4,398.54 1,870.12 1,107.25 - - 1,237.64 4,215.01 P25.00 6,909.91996 1,537.58 1,766.24 - - 3,018.00 6,321.82 1,387.82 1,589.61 - - 3,004.19 5,981.62 P25.00 9,805.91997 2,418.62 1,593.71 - - 1,432.04 5,444.37 2,219.41 1,425.44 - - 1,432.04 5,076.89 P28.50 7,304.91998 2,850.51 2,005.45 - - 1,693.98 6,549.94 2,230.97 1,416.84 - - 1,658.06 5,305.87 P27.57 7,895.61999 2,954.51 1,524.96 - - 1,100.90 5,580.37 2,954.51 1,524.96 - - 1,074.50 5,553.97 P40.00 5,775.72000 4,010.15 1,754.00 - - 200.00 5,964.15 3,085.15 1,754.00 - - 200.00 5,039.15 P41.00 5,039.2
Note: * is converted by using conversion rate of US$ at constant 2000. Source: MISD / CORPLAN
T - 12
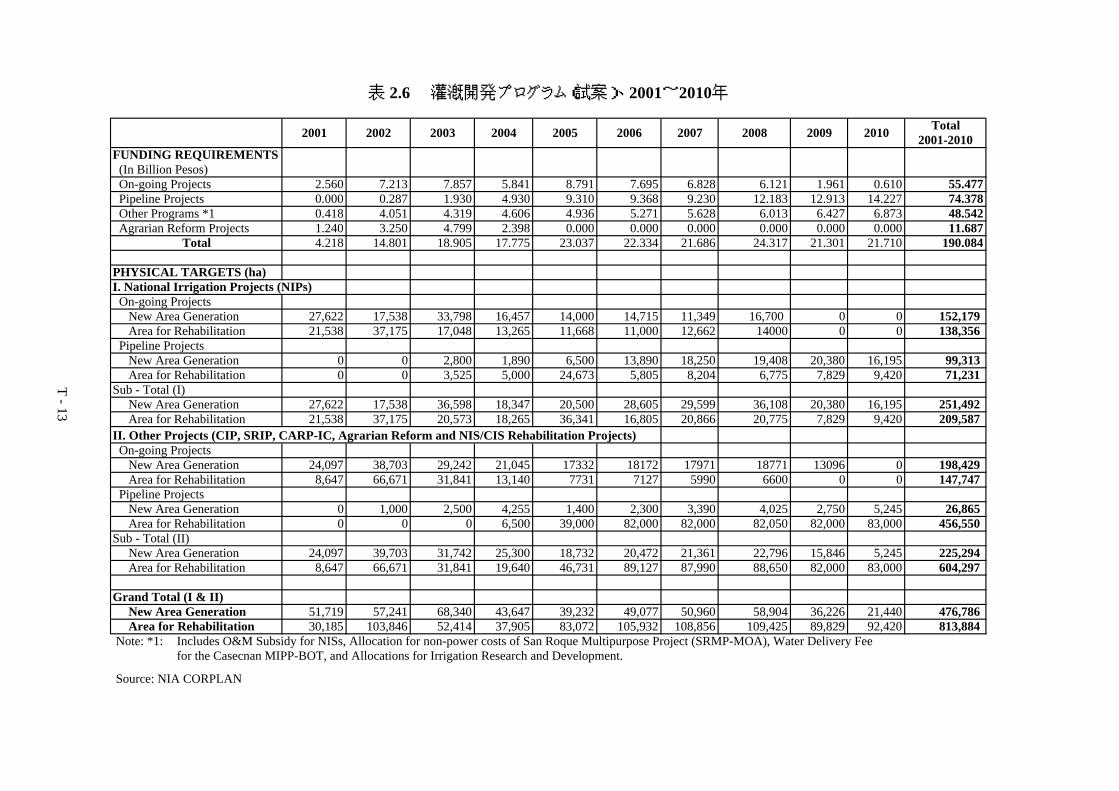
表 2.6 灌漑開発プログラム(試案)、 2001~2010年
Total2001-2010
FUNDING REQUIREMENTS (In Billion Pesos) On-going Projects 2.560 7.213 7.857 5.841 8.791 7.695 6.828 6.121 1.961 0.610 55.477 Pipeline Projects 0.000 0.287 1.930 4.930 9.310 9.368 9.230 12.183 12.913 14.227 74.378 Other Programs *1 0.418 4.051 4.319 4.606 4.936 5.271 5.628 6.013 6.427 6.873 48.542 Agrarian Reform Projects 1.240 3.250 4.799 2.398 0.000 0.000 0.000 0.000 0.000 0.000 11.687
Total 4.218 14.801 18.905 17.775 23.037 22.334 21.686 24.317 21.301 21.710 190.084
PHYSICAL TARGETS (ha)I. National Irrigation Projects (NIPs) On-going Projects New Area Generation 27,622 17,538 33,798 16,457 14,000 14,715 11,349 16,700 0 0 152,179 Area for Rehabilitation 21,538 37,175 17,048 13,265 11,668 11,000 12,662 14000 0 0 138,356 Pipeline Projects New Area Generation 0 0 2,800 1,890 6,500 13,890 18,250 19,408 20,380 16,195 99,313 Area for Rehabilitation 0 0 3,525 5,000 24,673 5,805 8,204 6,775 7,829 9,420 71,231Sub - Total (I) New Area Generation 27,622 17,538 36,598 18,347 20,500 28,605 29,599 36,108 20,380 16,195 251,492 Area for Rehabilitation 21,538 37,175 20,573 18,265 36,341 16,805 20,866 20,775 7,829 9,420 209,587II. Other Projects (CIP, SRIP, CARP-IC, Agrarian Reform and NIS/CIS Rehabilitation Projects) On-going Projects New Area Generation 24,097 38,703 29,242 21,045 17332 18172 17971 18771 13096 0 198,429 Area for Rehabilitation 8,647 66,671 31,841 13,140 7731 7127 5990 6600 0 0 147,747 Pipeline Projects New Area Generation 0 1,000 2,500 4,255 1,400 2,300 3,390 4,025 2,750 5,245 26,865 Area for Rehabilitation 0 0 0 6,500 39,000 82,000 82,000 82,050 82,000 83,000 456,550Sub - Total (II) New Area Generation 24,097 39,703 31,742 25,300 18,732 20,472 21,361 22,796 15,846 5,245 225,294 Area for Rehabilitation 8,647 66,671 31,841 19,640 46,731 89,127 87,990 88,650 82,000 83,000 604,297
Grand Total (I & II) New Area Generation 51,719 57,241 68,340 43,647 39,232 49,077 50,960 58,904 36,226 21,440 476,786 Area for Rehabilitation 30,185 103,846 52,414 37,905 83,072 105,932 108,856 109,425 89,829 92,420 813,884 Note: *1: Includes O&M Subsidy for NISs, Allocation for non-power costs of San Roque Multipurpose Project (SRMP-MOA), Water Delivery Fee for the Casecnan MIPP-BOT, and Allocations for Irrigation Research and Development.
Source: NIA CORPLAN
2001 2002 2009 20102003 2004 2005 2006 2007 2008
T - 13

表2.7 灌漑サービス面積と灌漑面積
(Unit: ha)NIS CIS PIS
Region Number Irrigation Irrigated Area Number Irrigation Irrigated Area Number Irrigation Irrigated Area Irrigation Irrigated AreaService Area Wet Season Dry Season Total Service Area Wet Season Dry Season Total Service Area Wet Season Dry Season Total Service Area Wet Season Dry Season Total
CAR 1 17,551 9,877 9,687 19,564 947 30,538 16,835 12,798 29,633 1,293 22,912 18,972 14,087 33,059 71,001 45,684 36,572 82,256
Region 1 26 55,872 38,931 22,222 61,153 1,315 89,267 71,906 30,144 102,050 799 27,329 25,305 6,906 32,211 172,468 136,142 59,272 195,414
Region 2 16 48,422 21,629 27,493 49,122 1,566 36,374 24,248 22,721 46,969 344 23,095 18,700 16,435 35,135 107,891 64,577 66,649 131,226
Region 3 13 66,803 38,657 35,307 73,964 383 66,561 25,777 19,401 45,178 116 14,901 10,321 2,830 13,151 148,265 74,755 57,538 132,293
Region 4 46 52,706 37,952 27,953 65,905 533 50,268 30,137 8,334 38,471 348 23,616 12,524 10,285 22,809 126,590 80,613 46,572 127,185
Region 5 15 20,496 16,894 17,276 34,170 669 65,835 20,305 14,455 34,760 507 29,484 11,130 9,138 20,268 115,815 48,329 40,869 89,198
Region 6 13 52,216 42,580 34,318 76,898 185 17,312 11,649 9,467 21,116 139 5,499 2,977 2,689 5,666 75,027 57,206 46,474 103,680
Region 7 1 5,373 3,200 2,775 5,975 272 17,317 10,089 5,747 15,836 121 2,539 1,938 1,184 3,122 25,229 15,227 9,706 24,933
Region 8 16 15,870 11,964 9,071 21,035 222 25,445 9,509 8,626 18,135 90 4,466 2,407 2,367 4,774 45,781 23,880 20,064 43,944
Region 9 4 15,162 11,836 11,020 22,856 184 17,867 14,253 11,824 26,077 30 1,972 1,832 1,349 3,181 35,001 27,921 24,193 52,114
Region 10 5 23,196 13,442 13,364 26,806 99 16,034 7,801 7,581 15,382 39 2,764 1,789 1,261 3,050 41,994 23,032 22,206 45,238
Region 11 15 52,486 46,024 46,024 92,048 104 20,035 12,703 11,867 24,570 53 10,076 5,052 4,320 9,372 82,597 63,779 62,211 125,990
Region 12 10 43,082 33,731 29,817 63,548 75 18,310 11,060 7,433 18,493 45 2,231 1,764 1,417 3,181 63,623 46,555 38,667 85,222
Region 13 6 18,412 13,455 13,251 26,706 138 14,904 6,973 5,254 12,227 77 3,316 802 20 822 36,632 21,230 18,525 39,755
MRIIS 4 88,370 75,272 77,214 152,486 - - - - 0 - - - - 0 88,370 75,272 77,214 152,486
UPRIIS 4 102,532 76,155 75,974 152,129 - - - - 0 - - - - 0 102,532 76,155 75,974 152,129
Total 195 678,549 491,599 452,766 944,365 6,692 486,067 273,245 175,652 448,897 4,001 174,200 115,513 74,288 189,801 1,338,816 880,357 702,706 1,583,063
Cropping Intensity 139% Cropping Intensity 92% Cropping Intensity 109% Cropping Intensity 118%
Data Source: NIA CORPLAN (1999)
Total
T - 14

表 2.8 フィリピンの米需給予測、2000~2010年
2000 2001 2002 2003 2004 2005 2006 2007 2008 2009 20101. Yield (Mt/ha)
- Irrigated 3.69 3.73 3.78 3.82 3.87 3.92 3.96 4.01 4.06 4.11 4.16- Rainfed 2.23 2.24 2.26 2.27 2.28 2.30 2.31 2.33 2.34 2.35 2.37
2. Annual Paddy Planted Area (1,000ha)- Irrigated 1,583.65 1,682.44 1,786.04 1,913.53 2,011.29 2,108.70 2,224.28 2,346.62 2,485.81 2,595.14 2,688.02- Rainfed 1,787.00 1,766.66 1,710.53 1,661.38 1,599.90 1,531.45 1,464.14 1,415.44 1,387.30 1,360.46 1,332.71
3. Paddy Production (1,000MT)- Irrigated 5,843.66 6,282.69 6,749.62 7,318.17 7,784.36 8,259.30 8,816.56 9,413.09 10,091.11 10,661.33 11,175.42- Rainfed 3,985.01 3,963.28 3,860.39 3,771.96 3,654.17 3,518.82 3,384.36 3,291.41 3,245.32 3,201.65 3,155.16 Total 9,828.67 10,245.97 10,610.01 11,090.13 11,438.53 11,778.12 12,200.92 12,704.51 13,336.44 13,862.98 14,330.58
4. Seeds, Feeds, Wastes (9.5%) 933.72 973.37 1,007.95 1,053.56 1,086.66 1,118.92 1,159.09 1,206.93 1,266.96 1,316.98 1,361.40
5. Paddy for Consumption (1,000MT) 8,894.94 9,272.60 9,602.06 10,036.57 10,351.87 10,659.20 11,041.84 11,497.58 12,069.47 12,545.99 12,969.17
6. Milling Recovery Rate (%) 0.66 0.66 0.66 0.66 0.66 0.66 0.66 0.66 0.66 0.66 0.66
7. Rice for Consumption (1,000MT) 5,870.66 6,119.92 6,337.36 6,624.14 6,832.23 7,035.07 7,287.61 7,588.40 7,965.85 8,280.36 8,559.65
8. Demand- Population (Million) 76.32 77.91 79.51 81.13 82.77 84.43 86.10 87.79 89.49 91.21 92.94- Per Capita Consumption (kg) 90.8 91.3 91.9 92.5 93.1 93.7 94.3 94.8 95.4 96.0 96.7- Total Demand (1,000MT) 6,927.43 7,116.07 7,308.42 7,504.49 7,704.32 7,907.91 8,115.30 8,326.48 8,541.49 8,760.33 8,983.02
9. Surplus/Deficit (1,000Mt) -1,056.77 -996.16 -971.06 -880.36 -872.09 -872.84 -827.68 -738.08 -575.64 -479.98 -423.37
Note: Year 2000 figures based on 1999 yearend dataSource: JICA Study Team
T - 15
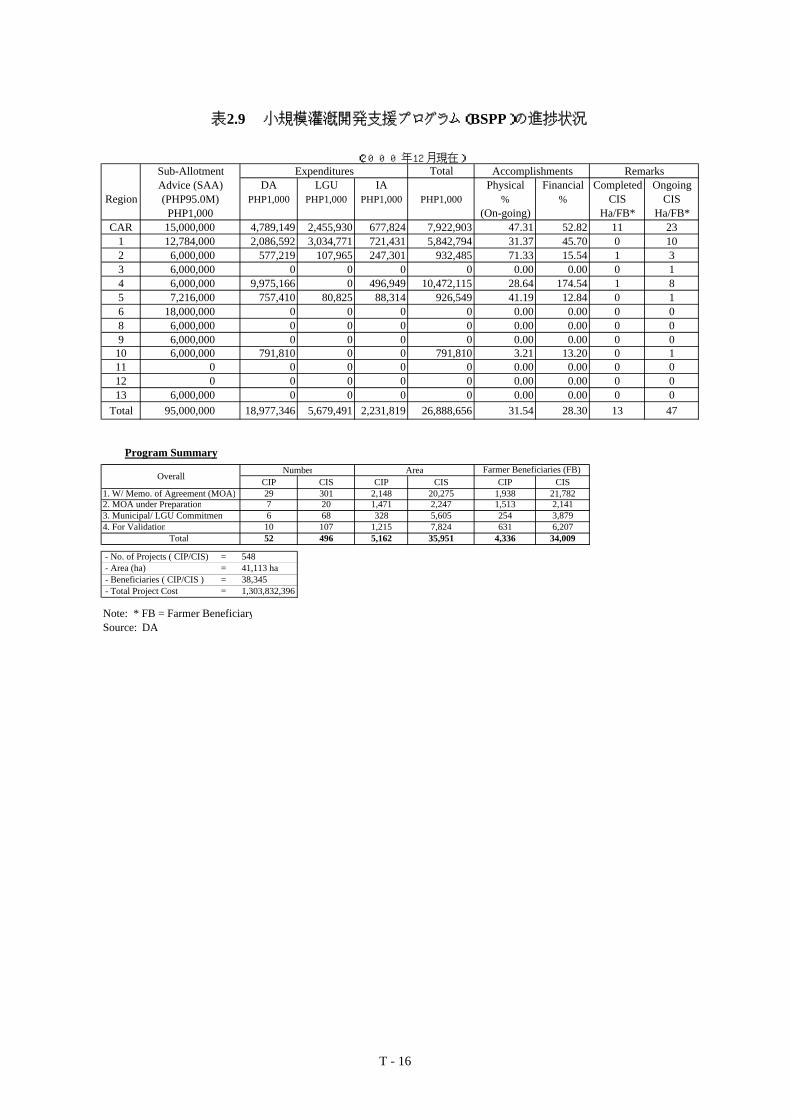
表2.9 小規模灌漑開発支援プログラム( BSPP)の進捗状況
TotalDA LGU IA Physical Financial Completed Ongoing
Region PHP1,000 PHP1,000 PHP1,000 PHP1,000 % % CIS CIS(On-going) Ha/FB* Ha/FB*
CAR 15,000,000 4,789,149 2,455,930 677,824 7,922,903 47.31 52.82 11 231 12,784,000 2,086,592 3,034,771 721,431 5,842,794 31.37 45.70 0 102 6,000,000 577,219 107,965 247,301 932,485 71.33 15.54 1 33 6,000,000 0 0 0 0 0.00 0.00 0 14 6,000,000 9,975,166 0 496,949 10,472,115 28.64 174.54 1 85 7,216,000 757,410 80,825 88,314 926,549 41.19 12.84 0 16 18,000,000 0 0 0 0 0.00 0.00 0 08 6,000,000 0 0 0 0 0.00 0.00 0 09 6,000,000 0 0 0 0 0.00 0.00 0 0
10 6,000,000 791,810 0 0 791,810 3.21 13.20 0 111 0 0 0 0 0 0.00 0.00 0 012 0 0 0 0 0 0.00 0.00 0 013 6,000,000 0 0 0 0 0.00 0.00 0 0
Total 95,000,000 18,977,346 5,679,491 2,231,819 26,888,656 31.54 28.30 13 47
Farmer Beneficiaries (FB)CIP CIS CIP CIS CIP CIS
1. W/ Memo. of Agreement (MOA) 29 301 2,148 20,275 1,938 21,7822. MOA under Preparation 7 20 1,471 2,247 1,513 2,1413. Municipal/ LGU Commitment 6 68 328 5,605 254 3,8794. For Validation 10 107 1,215 7,824 631 6,207
Total 52 496 5,162 35,951 4,336 34,009
- No. of Projects ( CIP/CIS) = 548 - Area (ha) = 41,113 ha - Beneficiaries ( CIP/CIS ) = 38,345 - Total Project Cost = 1,303,832,396
Note: * FB = Farmer BeneficiarySource: DA
(2000年12月現在)Remarks
(PHP95.0M)PHP1,000
Sub-AllotmentAdvice (SAA)
Expenditures Accomplishments
Overall
Program SummaryNumber Area
T - 16

(December 2000)
Project
I. NIA Proper1) Central Office 591 6 99 127 7242) Region 1 303 1 224 232 5363) Region 2 243 5 351 464 7124) Region 3 474 6 155 157 6375) Region 4 451 7 118 214 6726) Region 5 226 0 148 169 3957) Region 6 374 0 305 354 7288) Region 7 & 8 262 0 644 669 9319) Region 9 166 0 207 210 37610) Region 10 200 0 138 153 35311) Region 11 375 5 357 484 86412) Region 12 307 0 372 409 71613) UPRIIS 515 9 232 267 79114) MRIIS 505 12 46 218 73515) CAR 105 0 139 157 26216) CARAGA (Region 13) 126 4 30 206 236 366
Sub-Total 5,223 55 3,741 4,520 9,798
Responsibility CenterII. Projects
1) Abulog Apayao Irrig. System Irrig. Project 9 61 702) Addalam Irrigation Project 10 27 373) Balog-Balog Multi-Purpose Project 30 527 5574) Bohol Irrigation Project 11 51 625) Casecnan Multi-Purpose Irrig. Power Project 52 467 5196) Communal Development Project II 56 4 607) Comprehensive Agrarian Reform Project 187 36 2238) Irrigation Systems Improvement Project 30 39 699) Kabulnan Irrigation Area Dev't Proj. 77 290 36710) Lower Agusan Development Project 26 168 19411) Malitubog-Maridagao Irrigation Project 51 259 31012) Pampanga Delta Dev't Project-IC 89 185 27413) Rehab of Areas Affected by Mt Pntbo Eruption 7 8 1514) Southern Phils. Irrigation System Project 1 28 2914) San Roque Multi-Purpose Irrig. & Power Proj. 9 24 3315) Small River Irrigatin Project 24 145 16916) Tarlac Groundwater Irrig Sys Reactivation Proj. 6 3 917) Visayas Communal Irrig Participatory Proect. 20 115 13518) Water Resources Development Project 31 14 45
Sub-Total 726 2,451 3,177Total ( I & II ) 6,004 6,971 12,975
Source : Personnel Division, NIA.
35
Daily
17218
779
315
12737
96214925
288
1132
5,278Monthly
130
Co-Terminus
307524517105
166200380
262
Total
TotalSub-Total
597304248480458226374
表 3.1 雇用形態別のNIA人員配置状況
Responsibility CenterMonthly Daily
TemporaryPermanent COB Sub-Total
T - 17

Office/ Project Monthly Daily Total Monthly Daily Total Monthly Daily Total Monthly Daily Total Monthly Daily Total Monthly Daily Total Monthly Daily Total Monthly Daily Total1. Regular Plantilla
1) Central Office 844 138 982 915 370 1,285 920 351 1,271 914 510 1,424 859 431 1,290 869 267 1,136 835 91 926 815 66 8812) CAR - - - - - - - - - - - - - - - - - - - - - - - -3) Region 1 661 200 861 659 33 692 710 19 729 672 19 691 672 19 691 630 879 1,509 642 483 1,125 565 341 9064) Region 2 488 336 824 412 357 769 471 438 909 492 573 1,065 484 573 1,057 483 673 1,156 474 432 906 454 279 7335) MRIIS - - - 352 363 715 1,059 316 1,375 778 104 882 748 104 852 714 414 1,128 704 347 1,051 674 313 9876) Region 3 824 356 1,180 754 149 903 822 200 1,022 817 146 963 832 63 895 792 1,141 1,933 772 696 1,468 668 269 9377) UPRIIS 973 219 1,192 921 252 1,173 1,058 104 1,162 1,041 316 1,357 1,055 34 1,089 1,000 1,158 2,158 966 221 1,187 942 202 1,1448) Region 4 724 289 1,013 691 380 1,071 726 549 1,275 757 549 1,306 760 542 1,302 715 571 1,286 717 131 848 697 174 8719) Region 5 468 244 712 366 182 548 370 30 400 363 30 393 369 30 399 348 574 922 346 553 899 327 521 848
10) Region 6 648 215 863 615 158 773 635 30 665 625 607 1,232 637 742 1,379 598 1,046 1,644 464 28 492 539 356 89511) Region 7 & 8 327 374 701 348 203 551 362 292 654 363 292 655 361 452 813 350 678 1,028 327 328 655 345 1,407 1,75212) Region 9 189 156 345 225 82 307 248 31 279 252 31 283 241 30 271 219 881 1,100 220 42 262 212 122 33413) Region 10 190 409 599 239 164 403 250 164 414 260 164 424 282 164 446 279 601 880 289 299 588 280 924 1,20414) Region 11 418 381 799 263 286 549 398 349 747 399 349 748 398 348 746 362 380 742 442 909 1,351 446 49 49515) Region 12 408 805 1,213 355 161 516 377 44 421 379 44 423 374 44 418 362 1,215 1,577 357 741 1,098 342 567 909
Total 7,162 4,122 11,284 7,115 3,140 10,255 8,406 2,917 11,323 8,112 3,734 11,846 8,072 3,576 11,648 7,721 10,478 18,199 7,555 5,301 12,856 7,306 5,590 12,8962. Project Plantilla
Total 3,063 7,132 10,195 2,857 6,241 9,098 2,867 4,631 7,498 2,955 5,970 8,925 2,912 5,466 8,378 1,676 3,474 5,150 1,371 2,520 3,891 1,003 2,436 3,439Grand Total 10,225 11,254 21,479 9,972 9,381 19,353 11,273 7,548 18,821 11,067 9,704 20,771 10,984 9,042 20,026 9,397 13,952 23,349 8,926 7,821 16,747 8,309 8,026 16,335
Office/ Project Monthly Daily Total Monthly Daily Total Monthly Daily Total Monthly Daily Total Monthly Daily Total Monthly Daily Total Monthly Daily Total Monthly Daily Total1. Regular Plantilla
1) Central Office 760 71 831 726 25 751 698 24 722 684 28 712 675 53 728 634 77 711 632 98 730 597 127 7242) CAR 86 112 198 119 172 291 116 175 291 120 237 357 115 251 366 119 219 338 118 165 283 105 157 2623) Region 1 461 231 692 433 237 670 408 237 645 391 233 624 378 275 653 341 282 623 326 286 612 304 232 5364) Region 2 392 332 724 328 256 584 309 355 664 320 451 771 299 419 718 276 551 827 266 335 601 248 464 7125) MRIIS 673 270 943 647 271 918 628 268 896 606 307 913 619 335 954 561 302 863 545 283 828 517 218 7356) Region 3 630 143 773 585 186 771 546 139 685 524 137 661 522 182 704 491 218 709 497 215 712 480 157 6377) UPRIIS 879 129 1,008 811 94 905 758 101 859 717 95 812 685 98 783 609 140 749 547 363 910 524 267 7918) Region 4 633 242 875 654 417 1,071 590 99 689 552 307 859 527 275 802 487 342 829 481 263 744 458 214 6729) Region 5 312 207 519 292 192 484 274 190 464 264 234 498 260 298 558 240 274 514 234 385 619 226 169 395
10) Region 6 509 287 796 491 299 790 465 359 824 449 393 842 432 469 901 423 447 870 392 458 850 374 354 72811) Region 7 & 8 333 1,057 1,390 315 1,822 2,137 302 559 861 291 531 822 291 663 954 278 723 1,001 272 699 971 262 669 93112) Region 9 208 179 387 199 342 541 194 752 946 189 115 304 185 144 329 176 176 352 173 411 584 166 210 37613) Region 10 282 1,104 1,386 282 1,233 1,515 292 694 986 291 635 926 241 435 676 358 908 1,266 339 1,026 1,365 200 153 35314) Region 11 438 294 732 425 620 1,045 415 1,576 1,991 431 870 1,301 436 1,082 1,518 428 636 1,064 391 686 1,077 510 720 1,23015) Region 12 353 469 822 337 166 503 315 393 708 308 389 697 262 358 620 249 487 736 321 555 876 307 409 71616) MAGAPIT PIS 7 94 101 - - - - - - - - - 122 676 798 - * - * - * - * - * - * - * - * - *
Total 6,956 5,221 12,177 6,644 6,332 12,976 6,310 5,921 12,231 6,137 4,962 11,099 6,049 6,013 12,062 5,670 5,782 11,452 5,534 6,228 11,762 5,278 4,520 9,7982. Project Plantilla
Total 924 1,844 2,768 604 2,459 3,063 859 1,511 2,370 536 882 1,418 677 1,236 1,913 525 1,501 2,026 581 2,453 3,034 726 2,451 3,177Grand Total 7,880 7,065 14,945 7,248 8,791 16,039 7,169 7,432 14,601 6,673 5,844 12,517 6,726 7,249 13,975 6,195 7,283 13,478 6,115 8,681 14,796 6,004 6,971 12,975
Notes: Data as of December in each year; These data excude the personnel hired under contractual basis.* Figures of Region 13 (CARAGA) are included in those of Region 10 & 11..
Sources: Data from the Personnel Division of NIA
表 3.2 事務所・雇用形態別の人員、 1985年‐2000年
1994 1995 1996 1997
19891986
1993 2000
19921985 1987 1988
1998 1999
1990 1991
T - 18

T - 19
表 3.3 給与等級表
No. Grade Position1. 30 Administrator2. 29 [None established]3. 28 Deputy Administrator4. 27 Assistant Administrators5. 26 Department, Regional Managers & Irrigation Systems Managers (Technical)6. 25 Department, Regional Managers & Irrigation Systems Managers (Non-Technical)7. 24 Division Managers (Central Office, Regions, Irrigation Systems)8. 22-23 Division Managers (Field Projects)9. 21 District Managers (Field Irrigation Systems)10. 18-21 Irrigation Superintendent (Field)11. 18-21 Provincial Irrigation Engineer (Field)12. 21-22 Section Chiefs (Central Office – Technical)13. 21-22 Section Chiefs (Central Office – Procurement)14. 20-21 Section Chiefs (Central Office – Administration)15. 21 Section Chiefs (Central Office – Legal)16. 19-22 Section Chiefs (Central Office – Management Services)17. 18 Section Chiefs (Central Office – Printing)18. 17-21 Section Chiefs (Central Office – Accounting)19. 18-22 Section Chiefs (Field Offices)20. 16-19 Section Chiefs (Irrigation Systems – Technical)21. 14-19 Section Chiefs (Irrigation Systems – Administration)22. 14-18 Professional Technical (Central Office)23. 12-17 Professional Technical (Field Offices)24. 12 [Entry Level Professional position]25. 12 [Lowest Supervisory level position]26. 1-12 Rank and File Administration, Technical & Support Staff
Source: Data from Personnel Division, NIA
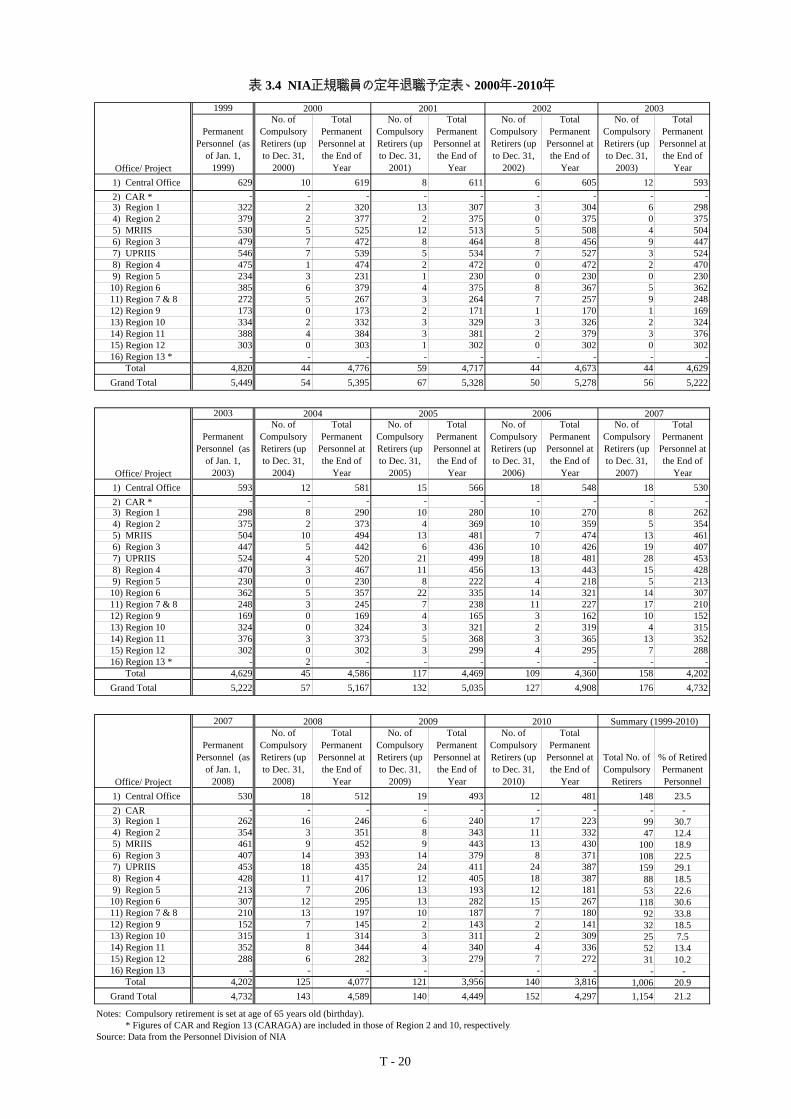
1999
PermanentPersonnel (as
of Jan. 1,1999)
No. ofCompulsoryRetirers (upto Dec. 31,
2000)
TotalPermanent
Personnel atthe End of
Year
No. ofCompulsoryRetirers (upto Dec. 31,
2001)
TotalPermanent
Personnel atthe End of
Year
No. ofCompulsoryRetirers (upto Dec. 31,
2002)
TotalPermanent
Personnel atthe End of
Year
No. ofCompulsoryRetirers (upto Dec. 31,
2003)
TotalPermanent
Personnel atthe End of
Year1) Central Office 629 10 619 8 611 6 605 12 5932) CAR * - - - - - - - - -3) Region 1 322 2 320 13 307 3 304 6 2984) Region 2 379 2 377 2 375 0 375 0 3755) MRIIS 530 5 525 12 513 5 508 4 5046) Region 3 479 7 472 8 464 8 456 9 4477) UPRIIS 546 7 539 5 534 7 527 3 5248) Region 4 475 1 474 2 472 0 472 2 4709) Region 5 234 3 231 1 230 0 230 0 230
10) Region 6 385 6 379 4 375 8 367 5 36211) Region 7 & 8 272 5 267 3 264 7 257 9 24812) Region 9 173 0 173 2 171 1 170 1 16913) Region 10 334 2 332 3 329 3 326 2 32414) Region 11 388 4 384 3 381 2 379 3 37615) Region 12 303 0 303 1 302 0 302 0 30216) Region 13 * - - - - - - - - -
Total 4,820 44 4,776 59 4,717 44 4,673 44 4,629Grand Total 5,449 54 5,395 67 5,328 50 5,278 56 5,222
2003
PermanentPersonnel (as
of Jan. 1,2003)
No. ofCompulsoryRetirers (upto Dec. 31,
2004)
TotalPermanent
Personnel atthe End of
Year
No. ofCompulsoryRetirers (upto Dec. 31,
2005)
TotalPermanent
Personnel atthe End of
Year
No. ofCompulsoryRetirers (upto Dec. 31,
2006)
TotalPermanent
Personnel atthe End of
Year
No. ofCompulsoryRetirers (upto Dec. 31,
2007)
TotalPermanent
Personnel atthe End of
Year1) Central Office 593 12 581 15 566 18 548 18 5302) CAR * - - - - - - - - -3) Region 1 298 8 290 10 280 10 270 8 2624) Region 2 375 2 373 4 369 10 359 5 3545) MRIIS 504 10 494 13 481 7 474 13 4616) Region 3 447 5 442 6 436 10 426 19 4077) UPRIIS 524 4 520 21 499 18 481 28 4538) Region 4 470 3 467 11 456 13 443 15 4289) Region 5 230 0 230 8 222 4 218 5 213
10) Region 6 362 5 357 22 335 14 321 14 30711) Region 7 & 8 248 3 245 7 238 11 227 17 21012) Region 9 169 0 169 4 165 3 162 10 15213) Region 10 324 0 324 3 321 2 319 4 31514) Region 11 376 3 373 5 368 3 365 13 35215) Region 12 302 0 302 3 299 4 295 7 28816) Region 13 * - 2 - - - - - - -
Total 4,629 45 4,586 117 4,469 109 4,360 158 4,202Grand Total 5,222 57 5,167 132 5,035 127 4,908 176 4,732
2007
PermanentPersonnel (as
of Jan. 1,2008)
No. ofCompulsoryRetirers (upto Dec. 31,
2008)
TotalPermanent
Personnel atthe End of
Year
No. ofCompulsoryRetirers (upto Dec. 31,
2009)
TotalPermanent
Personnel atthe End of
Year
No. ofCompulsoryRetirers (upto Dec. 31,
2010)
TotalPermanent
Personnel atthe End of
Year
Total No. ofCompulsory
Retirers
% of RetiredPermanentPersonnel
1) Central Office 530 18 512 19 493 12 481 148 23.52) CAR - - - - - - - - -3) Region 1 262 16 246 6 240 17 223 99 30.74) Region 2 354 3 351 8 343 11 332 47 12.45) MRIIS 461 9 452 9 443 13 430 100 18.96) Region 3 407 14 393 14 379 8 371 108 22.57) UPRIIS 453 18 435 24 411 24 387 159 29.18) Region 4 428 11 417 12 405 18 387 88 18.59) Region 5 213 7 206 13 193 12 181 53 22.6
10) Region 6 307 12 295 13 282 15 267 118 30.611) Region 7 & 8 210 13 197 10 187 7 180 92 33.812) Region 9 152 7 145 2 143 2 141 32 18.513) Region 10 315 1 314 3 311 2 309 25 7.514) Region 11 352 8 344 4 340 4 336 52 13.415) Region 12 288 6 282 3 279 7 272 31 10.216) Region 13 - - - - - - - - -
Total 4,202 125 4,077 121 3,956 140 3,816 1,006 20.9Grand Total 4,732 143 4,589 140 4,449 152 4,297 1,154 21.2
Notes: Compulsory retirement is set at age of 65 years old (birthday).* Figures of CAR and Region 13 (CARAGA) are included in those of Region 2 and 10, respectively.
Source: Data from the Personnel Division of NIA
Office/ Project
20032001
2008
Office/ Project
Office/ Project
2000
2004
表 3.4 NIA正規職員の定年退職予定表、 2000年-2010年
2009 2010 Summary (1999-2010)
2005 2006 2007
2002
T - 20

Streamling Organizational Unit Proposal
Positions Filled (No. of Pos.) No. % No. %I. Central Office1. Office of the Corporate Board Secretary 3 3 3 0 0% 0 0%2. Office of the Administrator 51 23 36 -15 -29% 13 57%3. Project Development & Implementation (PDI) 306 183 183 -123 -40% 0 0%4. Systems Operations & Equipment Mgt. (SOEM) 225 119 130 -95 -42% 11 9%5. Finance and Management (FM) 136 117 118 -18 -13% 1 1%6. Administrative Services 300 198 209 -91 -30% 11 6%
Total 1,021 643 679 -342 -33% 36 6%II. Field Offices1. Regional Irrigation Offices (RIO) 1-X111,CAR 1,447 963 744 -703 -49% -219 -23%2. Provincial Irrigation Offices (PIO) 1,564 915 693 -871 -56% -222 -24%3. National Irrigation Systems Offices (NISO) 5,251 2,024 2,571 -2,680 -51% 547 27%4. MRIIS and UPRIIS Headquarters 209 136 - -209 -100% -136 -100%5. District Offices I-IV 1,651 1,001 808 -843 -51% -193 -19%6. Dam and Reservoir Division (DRD) 342 236 208 -134 -39% -28 -12%
Total 10,464 5,275 5,024 -5,440 -52% -251 -5%Grand Total 11,485 5,918 5,703 -5,782 -50% -215 -4%
Note: Number of Filled/ Authorized as of December 2000Source: Streamlining Plan Revised January 2000
表 3.5 NIA既存人員(定員と現行就労数)と「合理化計画」提案人員数との比較表
Difference of Existing and ProposedPer No. of Pos. Per Filled Pos.
Number of Existing andAuthorized
T - 21
T - 22
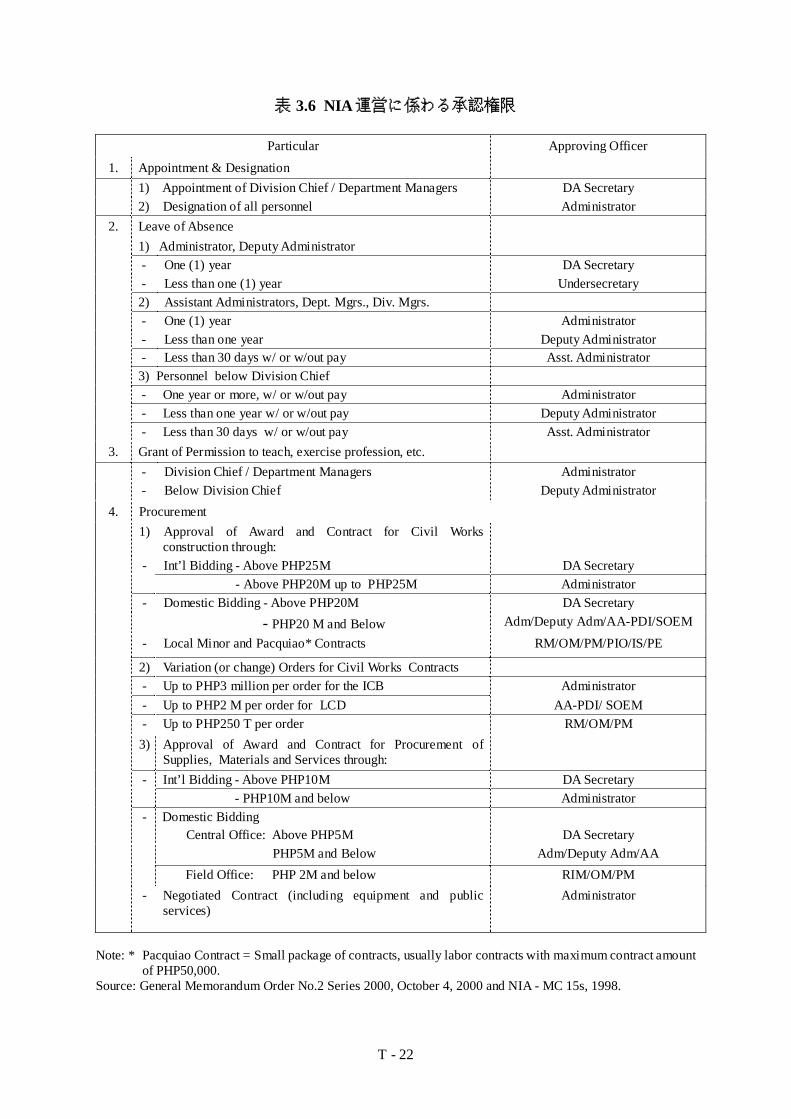
表 3.6 NIA 運営に係わる承認権限
Particular Approving Officer
1. Appointment & Designation1) Appointment of Division Chief / Department Managers DA Secretary2) Designation of all personnel Administrator
2. Leave of Absence1) Administrator, Deputy Administrator - One (1) year DA Secretary - Less than one (1) year Undersecretary2) Assistant Administrators, Dept. Mgrs., Div. Mgrs. - One (1) year Administrator - Less than one year Deputy Administrator - Less than 30 days w/ or w/out pay Asst. Administrator3) Personnel below Division Chief - One year or more, w/ or w/out pay Administrator - Less than one year w/ or w/out pay Deputy Administrator - Less than 30 days w/ or w/out pay Asst. Administrator
3. Grant of Permission to teach, exercise profession, etc. - Division Chief / Department Managers Administrator - Below Division Chief Deputy Administrator
4. Procurement1) Approval of Award and Contract for Civil Works
construction through: - Int’l Bidding - Above PHP25M DA Secretary
- Above PHP20M up to PHP25M AdministratorDomestic Bidding - Above PHP20M DA Secretary -
- PHP20 M and Below Adm/Deputy Adm/AA-PDI/SOEM
- Local Minor and Pacquiao* Contracts RM/OM/PM/PIO/IS/PE
2) Variation (or change) Orders for Civil Works Contracts - Up to PHP3 million per order for the ICB Administrator - Up to PHP2 M per order for LCD AA-PDI/ SOEM - Up to PHP250 T per order RM/OM/PM3) Approval of Award and Contract for Procurement of
Supplies, Materials and Services through:Int’l Bidding - Above PHP10M DA Secretary -
- PHP10M and below AdministratorDomestic Bidding Central Office: Above PHP5M DA Secretary
PHP5M and Below Adm/Deputy Adm/AA
-
Field Office: PHP 2M and below RIM/OM/PM - Negotiated Contract (including equipment and public
services)Administrator
Note: * Pacquiao Contract = Small package of contracts, usually labor contracts with maximum contract amountof PHP50,000.
Source: General Memorandum Order No.2 Series 2000, October 4, 2000 and NIA - MC 15s, 1998.

T - 23
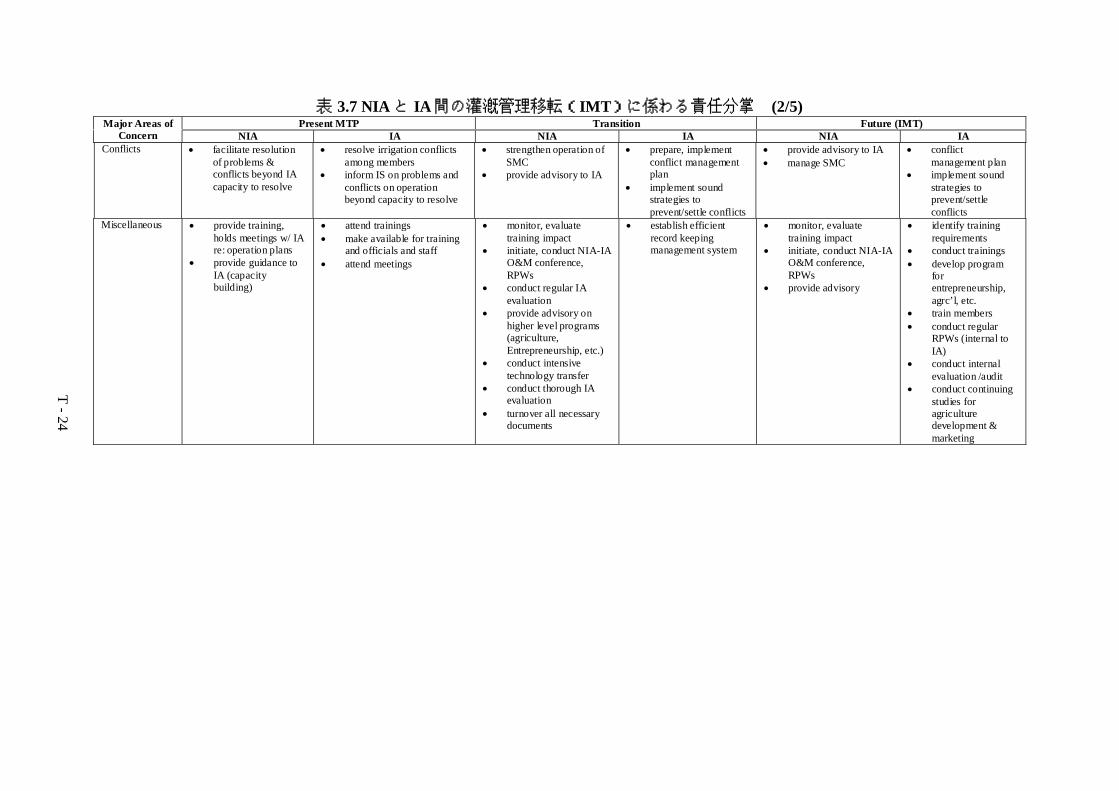
表 3.7 NIA と IA 間の灌漑管理移転(IMT)に係わる責任分掌 (1/5)Present MTP Transition Future (IMT)Major Areas of
Concern NIA IA NIA IA NIA IAMaintenance
• major repair• maintain diversion
works and parts ofMC
• maintain serviceroads along MC
• minor repair• canal clearing/cleaning• repair/maintenance
SMALLER NIS• provide technical
assistance to IAs
LARGER NIS• Provide technical
assistance to IAs• Conduct on-the-job
training• Maintain diversion
works & structures /Facilities
• Coordinate plans &programs
• canal & structuresmaintenance
• preventivemaintenance
• annual repair• provide manpower
who would beresponsible
• canal & structuresmaintenance
• preventivemaintenance
• annual repair• provide manpower
who would beresponsible
SMALLER NIS• provide technical
assistance to IAs
LARGER NIS• maintain diversion
works & structures /facilities
• provide technicalassistance to IAs
• coordinate plans &programs
• canal & structuremaintenance
• preventivemaintenance
• annual repair
• canal structuresmaintenance
• preventivemaintenance
• annual repair
Operation
• operate diversionworks
• deliver water to IA• collaborate with IA
in preparation ofO&M plan
• water distribution• monitor, record farm
activities
BOTH SMALLER LARGERNIS• conduct on-the-job
training• provide technical
assistance• provide simple manuals• provide control
structures• jointly w/ IAs, conduct
NIS asst. & test run
FOR LARGER NIS• operate diversion works
& main canals
• deliver, distributewater
• provide manpower tobe responsible
FOR SMALLER LARGERNIS• provide technical
assistance to IAs
FOR LARGER NIS• operate diversion works
& main canal
• monitor, evaluateO&M planimplementation
T - 24
表 3.7 NIA と IA 間の灌漑管理移転(IMT)に係わる責任分掌 (2/5)Present MTP Transition Future (IMT)Major Areas of
Concern NIA IA NIA IA NIA IAConflicts • facilitate resolution
of problems &conflicts beyond IAcapacity to resolve
• resolve irrigation conflictsamong members
• inform IS on problems andconflicts on operationbeyond capacity to resolve
• strengthen operation ofSMC
• provide advisory to IA
• prepare, implementconflict managementplan
• implement soundstrategies toprevent/settle conflicts
• provide advisory to IA• manage SMC
• conflictmanagement plan
• implement soundstrategies toprevent/settleconflicts
Miscellaneous • provide training,holds meetings w/ IAre: operation plans
• provide guidance toIA (capacitybuilding)
• attend trainings• make available for training
and officials and staff• attend meetings
• monitor, evaluatetraining impact
• initiate, conduct NIA-IAO&M conference,RPWs
• conduct regular IAevaluation
• provide advisory onhigher level programs(agriculture,Entrepreneurship, etc.)
• conduct intensivetechnology transfer
• conduct thorough IAevaluation
• turnover all necessarydocuments
• establish efficientrecord keepingmanagement system
• monitor, evaluatetraining impact
• initiate, conduct NIA-IAO&M conference,RPWs
• provide advisory
• identify trainingrequirements
• conduct trainings• develop program
forentrepreneurship,agrc’l, etc.
• train members• conduct regular
RPWs (internal toIA)
• conduct internalevaluation /audit
• conduct continuingstudies foragriculturedevelopment &marketing

T - 25
表 3.7 NIA と IA 間の灌漑管理移転(IMT)に係わる責任分掌 (3/5)NIA-IA Delineation of Responsibilities
Present / MTP Full (Full IMT) as per NIA Commitment to DonorMajor Areas of ConcernNIA IA NIA IA
Maintenance• major repair (w/ heavy equipment)• maintain diversion works and parts
of main canal• maintain service road along main
canal
• minor repair• canal clearing & cleaning
- grass cutting - removal, disposal of silt• repair/maintenance of farm ditches
and structures• maintenance of lateral and turnout
gates• canal re-shaping• minor repair of service
SMALL NIS• provide Technical Assistance to IAs
LARGER NIS• maintain diversion works and the
main canal• undertake major repair works at
secondary subject to negotiationswith IA/CIA
• provide technical assistance to IAs• supervise IAs• coordinate plans and programs
within NIS
• canal & structures maintenance• preventive maintenance• annual repair
• maintain IA/CIA hea dgate, and allstructures
• undertake maintenance and repairworks within lateral/IA-CIA coverage
• develop, implement policies andguidelines to ensure upkeep ofstructures, facilities
Operation• collaborate w/ IA in preparation
of CCP and operation plan• operate diversion works and
deliver water to IA• collaborate of annual O&M
budget• process weekly farm activities
• prepare CCP and operationplan
• prepare annual O&M budget• manage, undertake water
distribution to turnouts• monitoring, recording of
farming activities• LIPA preparation/submission• submit harvest report
SMALL NIS• operate diversion works and
deliver water to IA• assist IA in the preparation of
O&M plan and CCP• provide advisory to IA
LARGER NIS• operate diversion works and
main canal• prepare overall O&M plan• conduct O&M planning &
review sessions
• operate gates beyond NIAjurisdiction
• deliver/distribute water toturnouts/farmers
• prepare O&M plans & CCP• monitor/evaluate O&M plan
implementation• prepare LIPA & harvest reports• prepare annual O&M budget• prepare O&M plans and budget• operate IA/CIA hea dgate and all
gates within coverage• deliver, distribute water to
IAs/farmers• monitor, evaluate O&M plan
implementation, including LIPA &harvest reports
T - 26
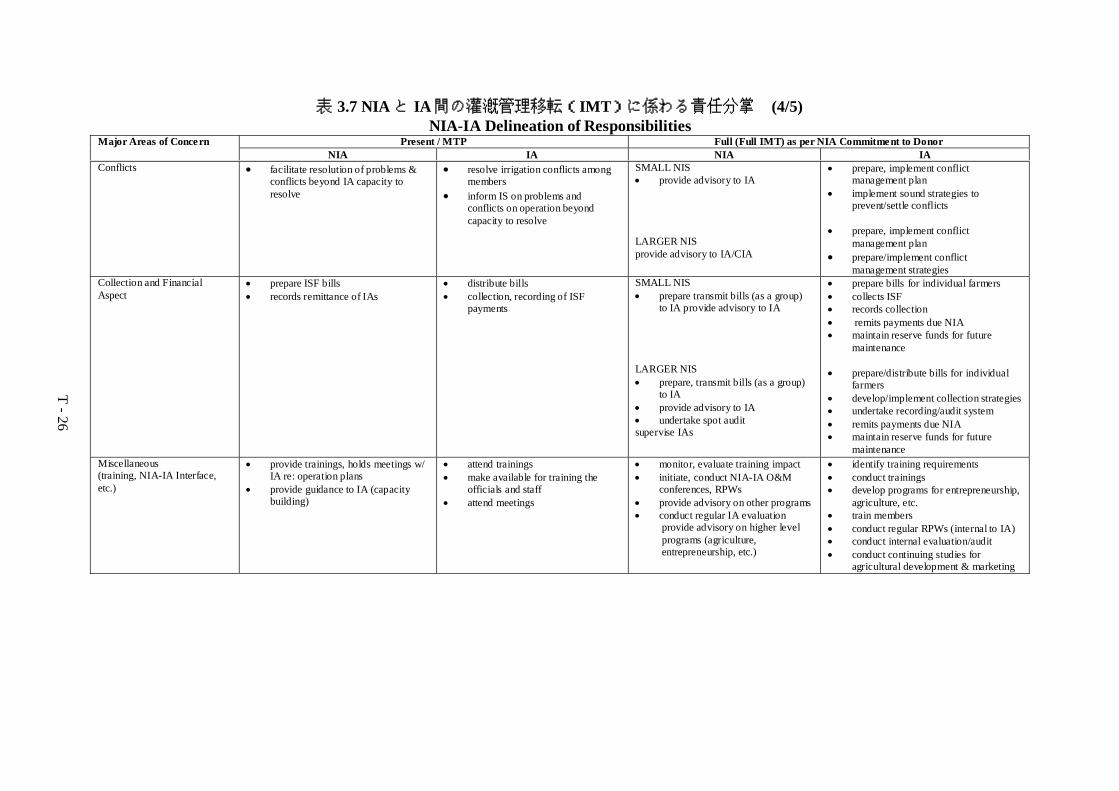
表 3.7 NIA と IA 間の灌漑管理移転(IMT)に係わる責任分掌 (4/5)NIA-IA Delineation of Responsibilities
Present / MTP Full (Full IMT) as per NIA Commitment to DonorMajor Areas of ConcernNIA IA NIA IA
Conflicts • facilitate resolution of problems &conflicts beyond IA capacity toresolve
• resolve irrigation conflicts amongmembers
• inform IS on problems andconflicts on operation beyondcapacity to resolve
SMALL NIS• provide advisory to IA
LARGER NISprovide advisory to IA/CIA
• prepare, implement conflictmanagement plan
• implement sound strategies toprevent/settle conflicts
• prepare, implement conflictmanagement plan
• prepare/implement conflictmanagement strategies
Collection and FinancialAspect
• prepare ISF bills• records remittance of IAs
• distribute bills• collection, recording of ISF
payments
SMALL NIS• prepare transmit bills (as a group)
to IA provide advisory to IA
LARGER NIS• prepare, transmit bills (as a group)
to IA• provide advisory to IA• undertake spot auditsupervise IAs
• prepare bills for individual farmers• collects ISF• records collection• remits payments due NIA• maintain reserve funds for future
maintenance
• prepare/distribute bills for individualfarmers
• develop/implement collection strategies• undertake recording/audit system• remits payments due NIA• maintain reserve funds for future
maintenanceMiscellaneous(training, NIA-IA Interface,etc.)
• provide trainings, holds meetings w/IA re: operation plans
• provide guidance to IA (capacitybuilding)
• attend trainings• make available for training the
officials and staff• attend meetings
• monitor, evaluate training impact• initiate, conduct NIA-IA O&M
conferences, RPWs• provide advisory on other programs• conduct regular IA evaluation provide advisory on higher level programs (agriculture, entrepreneurship, etc.)
• identify training requirements• conduct trainings• develop programs for entrepreneurship,
agriculture, etc.• train members• conduct regular RPWs (internal to IA)• conduct internal evaluation/audit• conduct continuing studies for
agricultural development & marketing

T - 27
表 3.7 NIA と IA 間の灌漑管理移転(IMT)に係わる責任分掌 (5/5)NIA-IA Delineation of Responsibilities
NIA IAMaintenance Same as future plus:
• Conduct on-the-job training for IAsSame as future plus:• assign manpower to be trained and to be responsible
Operation Same as future plus:• conduct OJT for IAs• provide simple operation manuals• provide control structures• jointly w/ IAs, conduct test run and NIS Assessment per annum
Same as future plus:• assign manpower to be trained and to be responsible
Collection Same as future plus:• jointly with IAs, conduct NIS Assessment• train IA participants on billing, recording, collection and audit
(modified FMST)
Same as future plus:• prepare for plan encompassing all other income generating activities
Conflict Same as future plus:• strengthen operation of SMC
Miscellaneous Same as future plus• conduct strategic planning with IAS• conduct thorough IA evaluation• turnover all necessary documents
Same as future plus:• establish efficient record keeping management system
Source: National Irrigation Administration

表 3.8 国営灌漑システム事務所( NISO)の灌漑管理移転(IMT)優先順位
No. Below 3,000 ha Service Area (ha) No. Below 3,000 ha Service Area (ha)1 Catingas 256 54 Amburayan 3,4202 Disalit 485 55 Inarihan-Tigman-Hinagyanan 3,5423 Palico 886 56 San Fabian-Dumuloc 3,5944 Pili-Bulan-San Francisco 950 57 Malatgao-Batang-Batang 3,6785 Pagbahan 1,005 58 Tago 3,7166 Colo-Caulaman 1,021 59 Ilocos Sur 3,8067 Banurbur 1,087 60 Pula Bansod 3,8308 Hindang-Hilongos-Dasay 1,106 61 Sto. Tomas(not operational) 3,9249 Agos 1,119 62 Porac-Gumain 4,00410 Bucao 1,231 63 Muleta 4,06311 San Pablo-Cabagan 1,273 64 Manupali 4,39512 Nueva Ecija PIS 1,313 65 Pinacanauan-Tumauini 4,49513 Bito 1,411 66 Saug-Libuganon(Left) 4,55014 Mambusao 1,423 67 Aklan-Panakuyan 4,81615 Masalip 1,453 68 Maranding 4,92716 Daguitan-Guinarona 1,496 69 Sta Cruz-Mabacan-Balanac 4,97717 Lumintao 1,504 70 Andanan 5,00018 Balire-Ibawon-Gibuga 1,715 71 Sibalom-San Jose 5,06519 Cagaycay 1,745 72 Bohol IP 5,37320 Pangiplan 1,756 73 Kabacan-Pagalungan 5,86821 Sta Maria-Mayor 1,773 74 Binahaan-Tibak 6,04122 Barotac Viejo 1,774 75 Mal-Padada 6,12523 Cantillan 1,785 76 Ambayaon-Dipalo 6,40224 Dummun 1,802 77 Malasila-Mlang 6,98725 Lower Chico 1,856 78 Barit-Rida-Buhi-lalo 7,20826 Bao 1,917 79 Lower Agno-Totonuguen 7,50027 MNOH 1,946 80 Baco-Bucayao-Magasawang Tubig 8,02728 Nayom-Bayto 1,948 81 Aganan-Sta Barbara 8,26229 Sibalom-Tigbauan 2,020 82 Camiling 8,58030 Zinundungan 2,045 83 Libungan 8,64531 Baggao 2,067 84 Dipolo-Salug 8,82432 Siluay-Buayan 2,116 85 Apayao-Abulog Pamplona 10,79433 Gibong 2,158 86 Magapit 10,91434 Nueva Vizcaya Bagabag 2,160 87 Pulangi-Roxas Kuya 12,23835 Mainit-Pongso 2,184 88 Agno-Sinocalan 12,66336 Libmanan-Cabusao 2,195 89 Bago 12,70037 Amnay-Patrick-Mompong 2,213 90 Cavite Friar Lands 13,08638 Iguig-Alcala-Amulung 2,306 91 Tasmoris 13,29739 Baua 2,419 92 Lambayong-Dumaguil 13,35540 Mallig 2,427 93 Jalaur-Suage Extn 14,40041 Lupon 2,450 94 Lasang-Libuganon-Kipaliku 15,76742 Rugnan 2,500 95 Ilocos Norte 17,03443 Simulao 2,540 96 Allah-Banga-Marbel 18,20944 Solana 2,777 97 MRIIS District IV 19,89045 Daet-Talisay-Matogdon 2,910 98 MRIIS District I 21,797
Sub-total 78,523 99 MRIIS District II 23,241 Above 3000 ha Sevice Area (ha) 100 MRIIS District III 23,442
46 Cagaycay 3,143 101 UPRIIS District IV 23,81147 Labangan 3,195 102 URIIS District II 23,91348 Cabadbaran-Taguibo 3,213 103 UPRIIS District I 24,96249 Laguna Friar Lands 3,250 104 URIIS District III 29,84650 Batutu 3,269 105 Angat-Maasin 31,48551 Alip-Talayan 3,300 106 Upper Chico 17,50252 Caguray 3,308 Sub-total 573,99053 Dumacaa-Hanagdong-Lagnas 3,309 TOTAL 652,513
Source: JICA Study Team
T - 28

Total1. Receipts from Income Sources
1. Irrigation Fees 3 18 32 54 22 70 32 10 23 11 8 13 44 21 10 3722. Management Fees 250 2503. Equipment Rental 0 2 7 16 20 9 15 3 5 11 7 7 12 16 12 10 1524. Interest Income 6 1 1 0 0 0 0 0 0 2 1 1 0 0 0 13
Total 256 6 26 48 74 31 85 35 15 35 20 15 26 60 33 21 7862. Receipts from Other Sources
a. Pump Amortization 0 0 2 0 0 0 0 0 0 0 1 3b. CIP Amortization 8 15 4 10 7 6 6 13 9 5 10 8 6 106c. Miscellaneous 7 2 1 5 61 9 17 1 3 1 4 1 0 1 0 1 116
Total from Other Sources 7 9 16 9 63 19 17 8 9 7 16 10 5 11 9 9 2253. Total from All Sources 263 15 42 57 137 50 103 43 24 42 36 26 31 71 42 30 1,0114. Less: Expenditures
a. Personnel Costs 139 23 54 64 116 69 100 74 46 67 55 32 39 73 50 26 1,026B. Other Operating Costs 35 2 6 39 32 8 17 3 4 3 4 2 6 21 9 3 192
Total Operating Costs 173 25 60 103 148 77 117 77 50 70 59 33 44 94 59 29 1,218
5. Net Cash (Deficit) 90 -10 -18 -45 -11 -27 -14 -34 -26 -28 -23 -8 -13 -23 -17 1 -207
a. % of ISF to Operating Costs 14% 31% 31% 36% 28% 60% 41% 21% 33% 19% 23% 29% 47% 36% 36% 31%b. % Receipts from Income Sources to Operating Costs 147% 22% 43% 47% 50% 41% 73% 45% 31% 50% 33% 46% 59% 64% 56% 73% 65%c. % of Receipts from All Sources to Operating Costs 152% 60% 70% 56% 92% 65% 88% 56% 48% 60% 60% 77% 71% 75% 71% 103% 83%
表3.9 NIAの2000年における管区別財務状況
CO CAR 1 2 MRIIS 3 UPRIIS 4 5 11 12 136 7 & 8 9 10
T - 29

LocationAudit Category Region Field Office Target Activity Man/day Budget (PHP)
1. Financial Audit 2 All National Systems ISF Collection 18* 3** 21,600.002. Financial Audit MARIIS Districts 1 - 4 ISF Collection 12* 3** 19,400.003. Financial & Property Audit CAR Ifugao, Abra, Benguet Cash count of 12* 3** 16,900.00
Kalinga-Apayao PIO Cashier, & ISF;& Upper Chico RIS and audit of
Office equipt.4. Verification 2 Solana Pump IS Pre-bidding 12* 2** 6,500.00
qualification5. Financial Audit 7&8 All Systems except ISF Collection 12* 4** 37,692.00
Das-ay RIS6. Verification/Invest 7&8 Bohol PIO Construction 6* 2** 13,988.00
Talibon DAM ( SRIP) activities7. Verification/Invest 11 Davao del Norte PIO Alleged irregularities 13* 2** 23,228.00
in the const. of canal8. Verification/Invest 9 LALIK RIS Alleged irregular 6* 2** 18,884.00
activities of IS9. Financial Audit of Irrigators Association MRIIS District I - IV Eval. of coll. 6* 2** 5,600.00
efficiency10. Verification/Investigation 12 Kabasalan Irrig. Project Alleged ver slow 6* 2** 17,552.00
implementationof the Dam
const. Project11. Financial Audit 3 Angat Maasin RIS ISF Collection 18* 3** 23,600.00
fee coll. & IA Dam Entranceviabilty fee coll. & IA
viabilty12. Financial Audit 5 Cagaycay, Lib.Cab. ISF Collection 12* 2** 13,800.00
RIIS, THRIS13. Verification/Investigation C.O., QC Contractor's claim
in the amt. ofP 280,603.95
Total 218,744.00Notes: *Duration (No. of Days) **No. of Internal Auditors involved Source: MSD, NIA
表3.10 2000年会計年度の内部監査実績
T - 30

T - 31
表 4.1 NISO の評価結果(1995 年~1999年)
Level/ Class A B C Total
1. Nationwide1.1 Number of NISO 24 53 28 1051.2 Proportion (1.1/105) 23% 50% 27% 100%1.3 Service Area (ha) 170,926 355,434 134,255 660,6151.4 Proportion (1.3/ 660,615) 26% 54% 20% 100%
2. Island Group
(1) Luzon2.1 Number of NISO 12 29 20 612.2 Proportion (2.1/1.1) 43% 58% 72% 59%2.3 Service Area (ha) 107,480 232,143 95,578 435,2012.4 Proportion (2.3/1.3) 63% 65% 71% 66%
(2) Visayas2.5 Number of NISO 2 8 7 172.6 Proportion (2.5/1.1) 8% 15% 25% 16%2.7 Service Area (ha) 2,517 34,765 36,177 73,4592.8 Proportion (2.7/1.3) 1% 10% 27% 11%
(3) Mindanao2.9 Number of NISO 10 16 1 262.10 Proportion (2.9/1.1) 42% 30% 4% 25%2.11 Service Area (ha) 60,929 88,526 2,500 151,9552.12 Proportion (2.11/1.3) 36% 25% 2% 23%
3. Total3.1 Number of NISO 24 53 28 1053.2 Percent 100% 100% 100% 100%3.3 Service Area (ha) 170,926 355,434 134,255 660,6153.4 Percent 100% 100% 100% 100%
Source: JICA Study TeamLegend: A- Good
B – Fair/AverageC - Poor

表 4.2 潅漑用水送水に係るゲート操作スケジュール(アガナン潅漑地区)
Headgate of Lateral A Checkgate for Lateral A
Engineer in Charge: Mr. Melchor I. Bajande (Operation Engineer) Engineer in Charge: Mr. Melchor I. Bajande (Operation Engineer)
Gate Operator: Mr. Paterno Talite (WRFT) Gate Operator: Mr. Paterno Talite (WRFT)
Witness: Vice President of PASAMISBA IA Witness: Vice President of PASAMISBA IA
Water Delivery to Area-A Water Delivery to Area-B & C Water Delivery to Area-B & C Water Delivery to Area-A
Month Open Month Close Month Open Month Close
Date Time Date Time Date Time Date Time
May 1 8:00 AM May 8 8:00 AM May 1 8:00 AM
24 8:00 AM 31 8:00 AM May 8 8:00 AM 24 8:00 AM
Jun. 16 8:00 AM Jun. 23 8:00 AM 31 8:00 AM Jun. 16 8:00 AM
Jul. 9 8:00 AM Jul. 16 8:00 AM Jun. 23 8:00 AM Jul. 9 8:00 AM
Aug. 1 8:00 AM Aug. 8 8:00 AM Jul. 16 8:00 AM Aug. 1 8:00 AM
24 8:00 AM 31 8:00 AM Aug. 8 8:00 AM 24 8:00 AM
Sep. 16 8:00 AM Sep. 23 8:00 AM 31 8:00 AM Sep. 16 8:00 AM
Oct. 9 8:00 AM Oct. 16 8:00 AM Sep. 23 8:00 AM Oct. 9 8:00 AM
Nov. 1 8:00 AM Nov. 8 8:00 AM Oct. 16 8:00 AM Nov. 1 8:00 AM
24 8:00 AM Dec. 1 8:00 AM Nov. 8 8:00 AM 24 8:00 AM
Dec. 17 8:00 AM 24 8:00 AM Dec. 1 8:00 AM Dec. 17 8:00 AM
Jan. 9 8:00 AM Jan. 16 8:00 AM 24 8:00 AM Jan. 9 8:00 AM
Feb. 1 8:00 AM Feb. 8 8:00 AM Jan. 16 8:00 AM Feb. 1 8:00 AM
24 8:00 AM Mar. 1 8:00 AM Feb. 8 8:00 AM 24 8:00 AM
Headgate of Lateral B Checkgate for Lateral B
Engineer in Charge: Mr. Melchor I. Bajande (Operation Engineer) Engineer in Charge: Mr. Melchor I. Bajande (Operation Engineer)
Gate Operator: Mr. Luis Ecube (WRFT) Gate Operator: Mr. Luis Ecube (WRFT)
Witness: Vice President of SAMICASA IA Witness: Vice President of SAMICASA IA
Water Delivery to Area-B Water Delivery to Area-C Water Delivery to Area-C Water Delivery to Area-B
Month Open Month Close Month Open Month Close
Date Time Date Time Date Time Date Time
May 8 8:00 AM May 16 8:00 AM May 8 8:00 AM
31 8:00 AM Jun. 8 8:00 AM May 16 8:00 AM 31 8:00 AM
Jun. 23 8:00 AM Jul. 1 8:00 AM Jun. 8 8:00 AM Jun. 23 8:00 AM
Jul. 16 8:00 AM 24 8:00 AM Jul. 1 8:00 AM Jul. 16 8:00 AM
Aug. 8 8:00 AM Aug. 16 8:00 AM 24 8:00 AM Aug. 8 8:00 AM
31 8:00 AM Sep. 8 8:00 AM Aug. 16 8:00 AM 31 8:00 AM
Sep. 23 8:00 AM Oct. 1 8:00 AM Sep. 8 8:00 AM Sep. 23 8:00 AM
Oct. 16 8:00 AM 24 8:00 AM Oct. 1 8:00 AM Oct. 16 8:00 AM
Nov. 8 8:00 AM Nov. 16 8:00 AM 24 8:00 AM Nov. 8 8:00 AM
Dec. 1 8:00 AM Dec. 9 8:00 AM Nov. 16 8:00 AM Dec. 1 8:00 AM
24 8:00 AM Jan. 1 8:00 AM Dec. 9 8:00 AM 24 8:00 AM
Jan. 16 8:00 AM 24 8:00 AM Jan. 1 8:00 AM Jan. 16 8:00 AM
Feb. 8 8:00 AM Feb. 16 8:00 AM 24 8:00 AM Feb. 8 8:00 AM
Feb. 16 8:00 AM
Headgate of Lateral C & D
Engineer in Charge: Mr. Melchor I. Bajande (Operation Engineer)
Gate Operator: Mr. Abundio Janobas (WRFT)
Witness: Vice President of MACABITU IA and SALAMBITU IA
Water Delivery to Area-C For Canal Maintenance
Month Open Month Close
Date Time Date Time
May 1 8:00 AM Mar. 1 8:00 AM
T - 32

表 4.3 水利費請求可能額( 2000年雨期作) (UPRIIS 第III区)
Division C IA: Sapang KuboTSA: 601.1-5 Lot Not Area
BSA No. Lot No. CAD No. Landowner Size Planted Planted <=2 >2 <=5 >5 <=2 >2 <=5 >5 Total1 20506 1655 E DELA CRUZ, JESSIE 1.00 1.00 75.00 675.00 675.002 20507 1655 F DELA CRUZ, ELEUTERIO 1.00 1.00 75.00 675.00 675.003 20508 1655 G DELA CRUZ, FELIX 1.75 1.75 131.25 1,181.25 1,181.254 20509 1655 H CRUZ, DEMETRIO 2.00 2.00 150.00 1,350.00 1,350.005 20510 1655 I VALERIANO, PONCIANO 2.00 2.00 150.00 1,350.00 1,350.006 20511 1655 J VILLAREAL, DAISY 3.00 3.00 375.00 2,025.00 2,025.007 20512 2235 A DELA CRUZ, DALMACIO 0.50 0.50 37.50 337.50 337.508 20513 1655 K DIAZ, FLORENCIO 3.50 3.50 437.50 2,362.50 2,362.509 20514 1655 L DELA CRUZ, DALMACIO 2.50 2.50 312.50 1,687.50 1,687.50
10 20515 1655 M PAGUIA, FLORANTE 1.00 1.00 75.00 675.00 675.0011 20516 1655 N NUNEZ, EDGARDO 3.00 3.00 375.00 2,025.00 2,025.0012 20517 2235 B DELA CRUZ, DALMACIO 1.00 1.00 75.00 675.00 675.0013141516171819202122232425262728293031
Total 22.25 0.00 22.25 768.75 1,500.00 0.00 6,918.75 8,100.00 0.00 15,018.75
ISF Collectibles (Kilos) ISF Collectibles - In PesosW. Season W. Season
T - 33

New Old Inc/(Dec) % New Old Inc/(Dec) %
1 601-1-3A 16 14 2 29.20 25.95 3.252 *601-1-3B* 14 14 0 35.25 33.75 1.503 601-1-4 21 20 1 48.85 45.65 3.204 601-1-5 11 12 -1 22.75 22.25 0.505 601-1-7 ** 7 10 -3 13.75 18.75 -5.006 601-1-6 20 19 1 47.50 45.50 2.007 601-2-1 31 30 1 63.55 54.95 8.60
Sub-Total 120 119 1 0.01 260.85 246.80 14.05 5.4%
1 601-3 11 8 3 30.60 26.50 4.102 601-4 18 16 2 25.25 21.12 4.133 601-5 14 12 2 26.50 21.60 4.904 601-6 4 4 0 20.00 20.00 0.005 601-7 23 24 -1 42.30 40.90 1.40
Sub-Total 70 64 6 0.09 144.65 130.12 14.53 10.0%
1 MC-16 6 7 -1 23.85 25.05 -1.202 MC-17 14 16 -2 34.60 40.80 -6.203 600-S 2 2 0 6.50 8.50 -2.004 601-1 12 12 0 24.80 24.90 -0.105 601-2 19 18 1 33.34 33.75 -0.416 601.1-1 34 35 -1 14.65 17.50 -2.857 601.1-2 41 40 1 70.20 66.34 3.86
Sub-Total 128 130 -1 -0.01 207.94 216.84 -8.90 -4.3%
1 600-2 13 9 4 33.60 27.00 6.602 600-3 22 21 1 30.75 24.85 5.903 600-5 32 30 2 41.15 39.95 1.204 600-S1 14 13 1 23.80 23.80 0.005 600-S1A 4 4 0 10.75 9.40 1.356 602-1 5 4 1 13.10 11.00 2.107 602-2 16 14 2 51.50 40.50 11.008 602-S2 5 5 0 13.50 13.50 0.009 602-S3 9 9 0 9.00 9.00 0.0010 MC-18 8 6 2 20.70 20.50 0.2011 MC-S6 4 4 0 6.25 7.25 -1.0012 MC-S7 4 4 0 4.35 4.20 0.1513 X602.1-1 4 4 25.00 25.0014 X602.1-2 2 7 -5 5.25 31.25 -26.0015 X602.1-6 30 30 64.50 20.80 43.7016 X602.1-7 31 31 48.95 48.45 0.50
Sub-Total 203 130 73 0.36 402.15 331.45 70.70 17.6%
1 600-4 22 21 1 31.40 27.70 3.702 600-6 17 17 0 31.95 27.00 4.953 605-1 29 31 -2 40.14 39.14 1.004 605-2 31 29 2 46.97 42.05 4.925 605-3 15 15 0 20.8 18.70 2.106 605-4 10 11 -1 20.25 25.75 -5.507 605.1-1 22 20 2 28.7 27.10 1.608 605.1-2 13 13 0 16.75 15.75 1.009 605.1-3 31 31 0 40.84 40.84 0.00
Sub-Total 190 188 2 0.01 277.80 264.03 13.77 5.0%Grand Total 711 631 80 11% 1,293.39 1,189.24 104.15 8.1%
表 4.4 能力向上計画・水利者リスト及び水利費登録簿の更新 (UPRIIS 第III区)
No. of Farm Lots Billable Area
(IAs)
Sapang Kubo
Irrigators Associations
Crisol B. Pag-asa
Rivera Borual
Pitong Gatang
San Gregorio-Soledad
T - 34

表 4.5 国営灌漑システム(NIS)リスト (1/2)
NO. REGIONNIS NO. REGION PROVINCE NISO
NO. NISO NIS LOCATION OF NISO
1 1 CAR Kalinga 1 Upper Chico Upper Chico Bulanao, Tabuk2 1 Region 1 Ilocos Norte 2 Ilocos Norte Bonga PIS-1 Teodora Alonzo St., Laoag City3 2 Bonga PIS-24 3 Bonga PIS-35 4 Laoag Vintar6 5 Nmc Pasuquin7 6 Dingras8 7 Bolo9 8 Cura10 9 Nueva Era11 10 Madongan Area12 11 Solsona Area13 12 Labugaon Area14 13 Papa Area15 14 Ilocos Sur 3 Ilocos Sur Sta. Maria-Burgos Maharlika Highway, Sta. Maria16 15 Sta. Lucia-Candon17 16 Tagudin18 17 La Union 4 Amburayan Amburayan Sudipen19 18 5 Masalip Masalip San Jose Norte, Agoo20 19 Pangasinan 6 Agno-Sinocalan Agno Bayaoas, Urdaneta City21 20 Sinocalan22 21 7 Ambayoan-Dipalo Ambayoan Tayug23 22 Ambayoan-Extension24 23 Dipalo25 24 8 Lower Agno Lower Agno Tumana, Rosales26 25 9 San Fabian-Dumuloc San Fabian Cayanga, San Fabian27 26 Dumuloc28 1 Region 2 Cagayan 10 Apayao-Abulug-Pamplona Apayao-Abulug Ballesteros29 2 Pamplona30 3 11 Baggao Baggao San Jose, Baggao31 4 12 Banurbur Creek Banurbur Creek Maddalero, Buguey32 5 13 Baua Baua Sta. Cruz, Gonzaga33 6 14 Dummun Dummun Cabacayan, Gattaran34 7 15 Iguig-Alcala-Amulung Iguig-Alcala-Amulung PIS Amulung35 8 16 Lower Chico Lower Chico Tuao36 9 17 Magapit Magapit PIS Dugo, Camalaniugan37 10 18 Solana-Pinacanauan Solana PIS Solana38 11 Pinacanauan39 12 19 Zinundungan Zinundungan Lasam40 13 Isabela 20 Mallig Mallig Mallig41 14 21 San Pablo Cabagan San Pablo Cabagan Cabagan42 15 22 Tumauini Tumauini Tumauini43 16 Nueva Vizcaya 23 Bagabag Bagabag Bagabag44 1 Region 3 Bataan 24 Colo-Caulaman Colo Layac, Dinalupihan45 2 Caulaman46 3 Bulacan 25 Angat-Maasim Angat Tambubong, San Rafael47 4 Maasim48 5 Nueva Ecija 26 NEPIS (Nueva Ecija PIS) NEPIS Cabanatuan City49 6 Pampanga 27 Porac-Gumain Porac Solib, Floridablanca50 7 Gumain51 8 Tarlac 28 Camiling Camiling Malacampa, Camiling52 9 29 Tasmoris Tasmoris Matatalaib, Tarlac53 10 Zambales 30 Bucao Bucao Carael, Botolan54 11 31 Nayom-Bayto Nayom Sta. Cruz55 12 Bayto56 13 32 Sto. Tomas Sto. Tomas San Marcelino57 1 Region 4 Aurora 33 Disalit Creek Disalit Creek Poblacion 5, San Luis58 2 Batangas 34 Palico Palico Nasugbu59 3 Cavite 35 Cavite Friar Lands Molino Ibayo Silangan, Naic60 4 Embarcadero-Baluctot61 5 Luksuhin-Makuling62 6 Pasong Kastila-Julian63 7 Bankud64 8 Butas Marcelo65 9 Plucena-Bayan66 10 Butas-Lawang Bato67 11 Navarro68 12 Matanda69 13 Balayungan70 14 Tres Cruses71 15 San Agustin-Pasong Buaya72 16 Culong-Culong73 17 Sahing74 18 Laguna 36 Laguna Friar Lands Cabuyao PIS Sala, Cabuyao75 19 San Cristobal76 20 Diezmo PIS77 21 Macabling78 22 San Juan79 23 37 Sta. Cruz-Mabacan-Balanac Sta. Cruz Pila80 24 Mabacan81 25 Balanac82 26 Lumban83 27 Malaunod84 28 38 Sta. Maria-Mayor Sta. Maria Malico, Mabitac85 29 Mayor86 30 Dambo PIS87 31 Occidental Mindoro 39 Amnay-Patrick-Mongpong Amnay-Patrick San Vicente, Sablayan88 32 Mongpong89 33 40 Caguray Caguray Magsaysay90 34 41 Lumintao Lumintao Magsikap, Rizal91 35 42 Pagbahan Pagbahan Sta. Cruz92 36 Oriental Mindoro 43 Baco Bucayao-Mag-Asawang Tubig Baco Bucayao Bayanan II, Calapan93 37 Mag-Asawang Tubig94 38 44 Pula -Bansud Pula Pinamalayan95 39 Bansud96 40 Palawan 45 Batang-Batang-Malatgao Batang-Batang Narra97 41 Malatgao98 42 Quezon 46 Agos Agos Comon, Infanta99 43 47 Dumacaa-Hanagdong-Lagnas Dumacaa Lucena City
100 44 Hanagdong101 45 Lagnas102 46 Romblon 48 Cantingas Cantingas San Fernando, Sibuyan
Source: SMD, NIA
T - 35

表 4.5 国営灌漑システム(NIS)リスト (2/2)
NO. REGIONNIS NO. REGION PROVINCE NISO
NO. NISO NIS LOCATION OF NISO
103 1 Region 5 Albay 49 Mahaba-Nasisi-Ogsong-Hibiga Mahaba Tuburan, Ligao104 2 Nasisi105 3 Ogsong106 4 Hibiga107 5 Camarines Norte 50 Daet Talisay - Matognon Daet Talisay Lag-on, Daet108 6 Matogdon109 7 Camarines Sur 51 Rinconada Integrated Barit Sta. Elena, Iriga City110 8 Rida111 9 Buhi-Lalo112 10 52 Cagaycay Cagaycay Sabang, San Jose113 11 53 Libmanan Cabusao Libmanan Cabusao PIS Libmanan114 12 54 Tigman-Hinagyanan-Inarihan Tigman-Hinagyanan San Roque, Calabanga115 13 Inarihan116 14 Sorsogon 55 Pili-Bulan-San Francisco San Francisco San Ramon, Bulan117 15 San Ramon118 1 Region 6 Aklan 56 Aklan-Panakuyan Aklan Linabuan Sur, Banga119 2 Panakuyan120 3 Antique 57 Sibalom-San Jose Sibalom-San Jose San Jose121 4 Capiz 58 Mambusao Mambusao Mambusao122 5 Iloilo 59 Aganan-Sta. Barbara Aganan Tacas, Jaro, Iloilo City123 6 Sta. Barbara124 7 60 Barotac Viejo Barotac Viejo Barotac Viejo125 8 61 Jalaur-Suague Jalaur-Proper Pototan126 9 Jalaur-Extension127 10 Suague128 11 62 Sibalom-Tigbauan Sibalom-Tigbauan Tigbauan129 12 Negros Occidental 63 Pangiplan Pangiplan Payao, Binalbagan130 13 64 Bago Bago Bago City131 1 Regions 7 Bohol 65 Bohol Bohol Pilar132 1 Regions 8 Leyte 66 Balire-Ibawon-Gibuga Balire North MacArthur133 2 Balire South134 3 Ibawon135 4 Gibuga136 5 67 Bao Bao Valencia, Ormoc City137 6 68 Binahaan-Tibak Binahaan North Calogoc, Tanauan138 7 Binahaan South139 8 Lower Binahaan140 9 Tibak141 10 69 Bito Bito Abuyog142 11 70 Daguitan-Guinarona Daguitan Julita143 12 Guinarona144 13 71 Hindang-Hilongos- Das-Ay Hindang-Hilongos Hindang145 14 Das-Ay146 15 72 Mainit-Pongso Mainit Alang-alang147 16 Pongso148 1 Region 9 Zamboanga del Sur 73 Dipolo-Salug Dipolo Dumingag149 2 Salug150 3 74 Labangan Labangan Labangan151 4 75 Sibuguey Valley Sibuguey Valley Bayog152 1 Region 10 Bukidnon 76 Manupali Manupali Valencia153 2 77 Muleta Muleta Maramag154 3 78 Pulangui-Roxas-Kuya Pulangui Valencia155 4 Roxas-Kuya156 1 Region 11 Compostela Valley 79 Batutu Batutu Compostela157 2 Davao del Norte 80 Lasang-Libuganon-Kipaliku Lasang Carmen158 3 Libuganon-Right159 4 Kipaliku160 5 81 Saug-Libuganon Left Saug Buclad, Asuncion161 6 Libuganon-Left162 7 Davao del Sur 82 Mal-Padada Mal Hagonoy163 8 Padada164 9 Davao Oriental 83 Lupon Lupon Lupon165 10 Saranggani 84 Siluay-Buayan Siluay Siluay, General Santos City166 11 Buayan167 12 South Cotabato 85 Allah-Banga-Marbel Allah Koronadal, Surallah168 13 Banga169 14 Marbel-1170 15 Marbel-2171 1 Region 12 Lanao del Norte 86 Maranding Maranding Maranding, Lala172 2 Maguindanao 87 Alip-Talayan Alip Alip, Datu Paglas173 3 Talayan174 4 North Cotabato 88 Kabacan-Pagalungan Kabacan Katidtuan, Kabacan175 5 Pagalungan176 6 89 Libungan Libungan Villarica, Midsayap177 7 90 Mlang-Malasila Mlang Buayan, Mlang178 8 Malasila179 9 Sultan Kudarat 91 Lambayong-Dumaguil Lambayong Lambayong180 10 Dumaguil181 11 Lanao del Sur 92 Rugnan Rugnan Taraka, Marawi City182 1 Region 13 Agusan del Norte 93 Cabadbaran-Taguibo Cabadbaran-Taguibo Sanghan, Cabadbaran183 2 Agusan del Sur 94 Andanan Andanan Bayugan I184 3 95 Gibong Gibong Prosperidad185 4 96 Simulao Simulao Trento186 5 Surigao del Sur 97 Cantillan Cantillan Madrid187 6 98 Tago Tago Tabon-Tabon, Tago188 1 MRIIS Isabela 99 MRIIS District I MRIIS District I Batal, Santiago City189 2 100 MRIIS District II MRIIS District II San Mateo190 3 101 MRIIS District III MRIIS District III San Manuel191 4 102 MRIIS District IV MRIIS District IV Minante, Cauayan192 1 UPRIIS Nueva Ecija 103 UPRIIS District I UPRIIS District I Munoz193 2 104 UPRIIS District II UPRIIS District II Talavera194 3 105 UPRIIS District III UPRIIS District III Cabanatuan City195 4 106 UPRIIS District IV UPRIIS District IV Gapan
Source: SMD, NIA
T - 36

表4.6 国営灌漑プロジェクト(NIP) (1/2)
National Irrigation Projects (NIPs) (Recently Completed and On-Going NIPs)Recently On-Going Total
No. Name of Projects Schedule Region Province Completed Area Area (ha) Target Area (ha) as of 1999 (ha)
1 San Roque Multipurpose Irrigation Project 1999-2007 Region 1 Pangasinan 0 23,700 23,700
2 Apayao-Abulug Irrigation Systems Improvement Project 1996-2001 Region 2 Cagayan/ Isabela 0 6,465 6,465
3 Addalam River Irrigation Project 1997-2004 Region 2 Quirino 0 5,830 5,830
4 Pampanga Delta Development Project-IC 1992-2002 Region 3 Pampanga 1,076 6,133 7,209
5 Casecnan Multipurpose Irrigation and Power Project-IC 1997-2004 Region 3 Nueva Ecija 1,641 33,359 35,000
6 Balog-Balog Multipurpose Project 1999-2006 Region 3 Tarlac 0 24,849 24,849
7 Bago RIS Rehabilitation & Improvement Project 2000-2005 Region 6 Negros Occidental 0 2,500 2,500
8 Bohol Irrigation Project II 2000-2005 Region 7 Bohol 0 4,550 4,550
9 Basey Irrigation Project 1996-2004 Region 8 Western Samar 0 3,000 3,000
10 Irrigation Systems Improvement Project (ISIP) II 1997-2002 Region 8 Leyte 0 809 809
11 Bubunawan Irrigation Project 1996-2003 Region 10 Bukidnon 0 2,000 2,000
12 Rural Development Pilot Project for Muslim Mindanao 2000-2002 Region 12 Lanao del Sur 0 2,800 2,800
13 Malitubog-Maridagao Irrigation Project I 1989-2002 Region 12 North Cotabato 632 10,208 10,840
14 Kabulnan Irrigation & Area Development Project 1992-2000 Region 12 Maguindanao 4,636 6,394 11,030
15 Lower Agusan Development Project - IC 1996-2002 Region 13 Agusan del Norte 0 7,082 7,082
16 Southern Philippines Irrigation Sector Project (SPISP) 2000-2006 Southern Philippines Southern Philippines 0 15,500 15,500
17 Water Resources Development Project (WRDP) 1997-2002 Nationwide Nationwide 139 6,857 6,996
Total 8,124 162,036 170,160Source: CORPLAN, NIA (As of February 2001)
T - 37

表4.6 国営灌漑プロジェクト(NIP) (2/2)
National Irrigation Projects (NIPs) (Proposed NIPs to be implemented up to 2004)Total
No. Name of Projects Schedule Region Province Target Area (ha)
1 Rizal (Aliog) Irrigation Project 2002-2003 CAR Kalinga 1,500
2 Tineg River Irrigation Project 2004-2005 CAR Abra 3,200
3 Infanta Impounding Irrigation Project 2003-2004 Region 1 Pangasinan 560
4 Ilocos Norte Irrigation Project Phase II (Palsiguan) 2001-2010 Region 1 Ilocos Norte 12,400
5 Banaoang Irrigation Project 2002-2004 Region 1 Ilocos Sur 6,000
6 Tumauini Reservoir Project 2003-2008 Region 2 Cagayan / Isabela 2,385
7 North Lawis Irrigation Project 2000-2003 Region 3 Zambales 1,270
8 Mapanuepe Lake Irrigation Project 2003-2004 Region 3 Zambales 1,900
9 Quipot Irrigation Project Phase I and II 2000-2005 Region 4 Quezon 3,410
10 Bicol River Basin Flood Control & Irrigation Development Project-IC 2004-2010 Region 5 Camarines Norte 6,100
11 Help for Catubig Agricultural Advancement Project Stage I 2001-2006 Region 8 Northern Samar 4,550
12 Marabong-Upper Daguitan Irrigation Project 2004-2005 Region 8 Northern Leyte 2,400
13 Titay Valley Irrigation Project 2003-2006 Region 9 Zamboanga del Norte & Sur 3,800
14 Sibuguey RIS Extension Project 2003-2005 Region 9 Zamboanga del Sur 3,000
15 Kadingilan Irrigation Project 2002-2005 Region 10 Bukidnon 6,000
16 Muleta Reservoir Irrigation Project 2002-2007 Region 10 Bukidnon 2,400
17 Talakag Irrigation Project 2003-2004 Region 10 Bukidnon 2,800
18 Balingasag Irrigation Project 2003-2005 Region 10 Misamis Oriental 2,000
19 Saug Reservoir Project 2002-2007 Region 11 Davao del Norte 5,000
20 Talayan River Irrigation System Rehabilitation Project 2002 Region 12 Maguindanao 388
21 Alip River Irrigation System Rehabilitation Project 2002 Region 12 Maguindanao 300
22 Pagalungan River Irrigation System Rehabilitation Project 2003-2005 Region 12 Maguindanao 380
23 Malitubog-Libungan Transbasin Irrigation Project 2002-2008 Region 12 Maguindanao / North Cotabato 5,000
24 Adgaoan-Umayan Irrigation Project 2003-2008 Region 13 Agusan del Sur 16,000
25 Grain Sector Development Program - IC 2001-2005 Nationwide Nationwide 908
Total 93,651Source: CORPLAN, NIA (As of February 2001)
T - 38
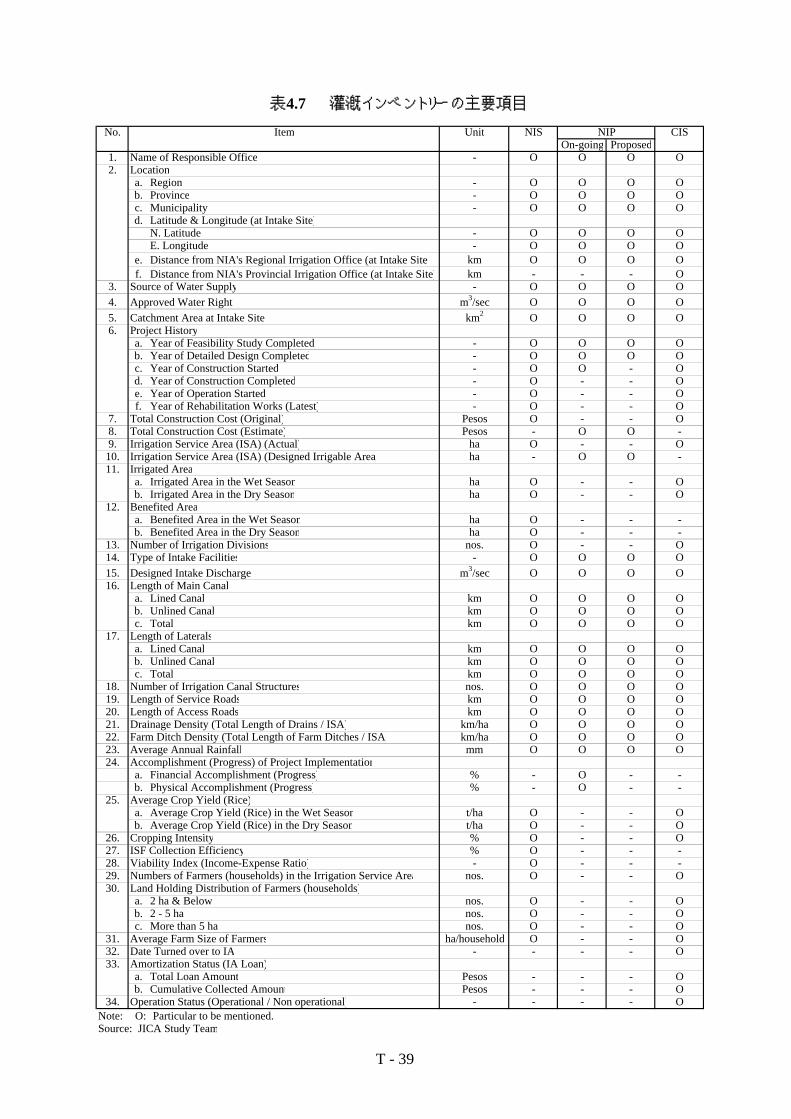
表4.7 灌漑インベントリーの主要項目
No. Item Unit NIS NIP CISOn-going Proposed
1. Name of Responsible Office - O O O O2. Location
a. Region - O O O Ob. Province - O O O Oc. Municipality - O O O Od. Latitude & Longitude (at Intake Site)
N. Latitude - O O O OE. Longitude - O O O O
e. Distance from NIA's Regional Irrigation Office (at Intake Site) km O O O Of. Distance from NIA's Provincial Irrigation Office (at Intake Site) km - - - O
3. Source of Water Supply - O O O O4. Approved Water Right m3/sec O O O O5. Catchment Area at Intake Site km2 O O O O6. Project History
a. Year of Feasibility Study Completed - O O O Ob. Year of Detailed Design Completed - O O O Oc. Year of Construction Started - O O - Od. Year of Construction Completed - O - - Oe. Year of Operation Started - O - - Of. Year of Rehabilitation Works (Latest) - O - - O
7. Total Construction Cost (Original) Pesos O - - O8. Total Construction Cost (Estimate) Pesos - O O -9. Irrigation Service Area (ISA) (Actual) ha O - - O10. Irrigation Service Area (ISA) (Designed Irrigable Area) ha - O O -11. Irrigated Area
a. Irrigated Area in the Wet Season ha O - - Ob. Irrigated Area in the Dry Season ha O - - O
12. Benefited Areaa. Benefited Area in the Wet Season ha O - - -b. Benefited Area in the Dry Season ha O - - -
13. Number of Irrigation Divisions nos. O - - O14. Type of Intake Facilities - O O O O15. Designed Intake Discharge m3/sec O O O O16. Length of Main Canal
a. Lined Canal km O O O Ob. Unlined Canal km O O O Oc. Total km O O O O
17. Length of Lateralsa. Lined Canal km O O O Ob. Unlined Canal km O O O Oc. Total km O O O O
18. Number of Irrigation Canal Structures nos. O O O O19. Length of Service Roads km O O O O20. Length of Access Roads km O O O O21. Drainage Density (Total Length of Drains / ISA) km/ha O O O O22. Farm Ditch Density (Total Length of Farm Ditches / ISA) km/ha O O O O23. Average Annual Rainfall mm O O O O24. Accomplishment (Progress) of Project Implementation
a. Financial Accomplishment (Progress) % - O - -b. Physical Accomplishment (Progress) % - O - -
25. Average Crop Yield (Rice)a. Average Crop Yield (Rice) in the Wet Season t/ha O - - Ob. Average Crop Yield (Rice) in the Dry Season t/ha O - - O
26. Cropping Intensity % O - - O27. ISF Collection Efficiency % O - - -28. Viability Index (Income-Expense Ratio) - O - - -29. Numbers of Farmers (households) in the Irrigation Service Area nos. O - - O30. Land Holding Distribution of Farmers (households)
a. 2 ha & Below nos. O - - Ob. 2 - 5 ha nos. O - - Oc. More than 5 ha nos. O - - O
31. Average Farm Size of Farmers ha/household O - - O32. Date Turned over to IA - - - - O33. Amortization Status (IA Loan)
a. Total Loan Amount Pesos - - - Ob. Cumulative Collected Amount Pesos - - - O
34. Operation Status (Operational / Non operational) - - - - ONote: O: Particular to be mentioned. Source: JICA Study Team
T - 39

SURFACE & OVERALL
HEAVY LIGHT OTHER EQUIPMENT SPECIAL EQUIPMENT DEEPWELL TOTAL PERCENT OPERABLE (%) PERCENT
REGION EQUIPMENT EQUIPMENT ( L ) ( O ) ( S ) IRRIGATION A1+A2+R A1/(A1+A2)*100 OPERABLE
( H ) PUMPS ( F )
A1 A2 R A1 A2 R A1 A2 R A1 A2 R A1 A2 R H L O S P TOTAL DISTRIBUTION H L O S P TOTAL
1 61 8 18 260 12 16 136 16 15 16 1 48 28 5 87 288 167 17 81 640 5.80 88 96 89 94 63 89
2 69 12 17 281 28 37 129 28 53 9 4 10 39 5 98 346 210 23 44 721 6.53 85 91 82 69 89 87
3 67 24 19 429 38 77 191 53 32 40 9 2 131 38 110 544 276 51 169 1150 10.42 74 92 78 82 78 84
4 58 32 25 379 78 137 90 67 90 14 3 1 21 31 1 115 594 247 18 53 1027 9.31 64 83 57 82 40 73
5* 44 7 47 200 16 202 64 15 167 5 3 17 1 98 418 246 8 18 788 7.14 86 93 81 100 94 89
6* 57 30 36 236 34 97 111 28 74 4 123 367 213 0 4 707 6.41 66 87 80 0 82
7 & 8 66 31 18 237 42 80 147 21 159 1 1 9 115 359 327 11 0 812 7.36 68 85 88 50 83
9 20 11 18 64 6 46 59 9 47 1 1 49 116 115 2 0 282 2.56 65 91 87 100 85
10 50 10 37 143 14 122 87 25 160 97 279 272 0 0 648 5.87 83 91 78 85
11 83 21 86 296 42 123 130 10 82 9 13 5 190 461 222 22 5 900 8.15 80 88 93 100 88
12* 78 27 23 323 45 46 149 65 27 3 128 414 241 3 0 786 7.12 74 88 70 100 80
13 75 21 146 180 33 273 125 22 284 37 4 115 242 486 431 156 0 1315 11.91 78 85 85 90 84
MRIIS 46 10 24 243 14 41 58 6 14 14 4 4 80 298 78 22 0 478 4.33 82 95 91 78 91
UPRIIS 23 21 9 234 33 25 44 21 4 10 2 9 53 292 69 21 0 435 3.94 52 88 68 83 80
CAR 29 5 9 88 15 46 74 18 9 43 149 101 0 0 293 2.65 85 85 80 83
C.O. 46 4 2 3 0 52 3 0 0 55 0.50 92 100 92
TOTAL 826 270 532 3,639 454 1,370 1,597 404 1,217 159 28 167 265 103 6 1,628 5,463 3,218 354 374 11,037 100.00 75 89 80 85 72 84
% 7.48 2.45 4.82 32.97 4.11 12.41 14.47 3.66 11.027 1.44 0.25 1.51 2.4 0.93 0.1 14.75 49.50 29.16 3.21 3.39 100
NOTE: HEAVY EQUIPMENT (H) …………………………………… 14.75A1 - Operable Equipment …………………….. 58.77 9.53% A1 Within economic life Cranes, Bulldozers, Excavators, etc.A2 - Non-Operable Equipment/ 90.47% A1 Beyond economic life LIGHT EQUIPMENT (L) ……………………………………. 49.50 Equipment under repair ………………… 11.41 Services Vehicles, Motorcycles, etc.R - Equipment recommended OTHER EQUIPMENT (O) …………………………………… 29.16 for disposal ……………………………….. 29.827 Chainsaws, Motorboats, etc.
100.00 SPECIALLY EQUIPMENT (S) ………………………………. 3.21Note: * As of March 31, 2000 Report Drilling, Rigs, Rice Threshers
* Foreign & locally assisted projects included PUMPS (P) ……………………………………………………….. 3.39
100.00
表 6.1 NIA機材の配置状況
(2000年6月30日現在)
T - 40
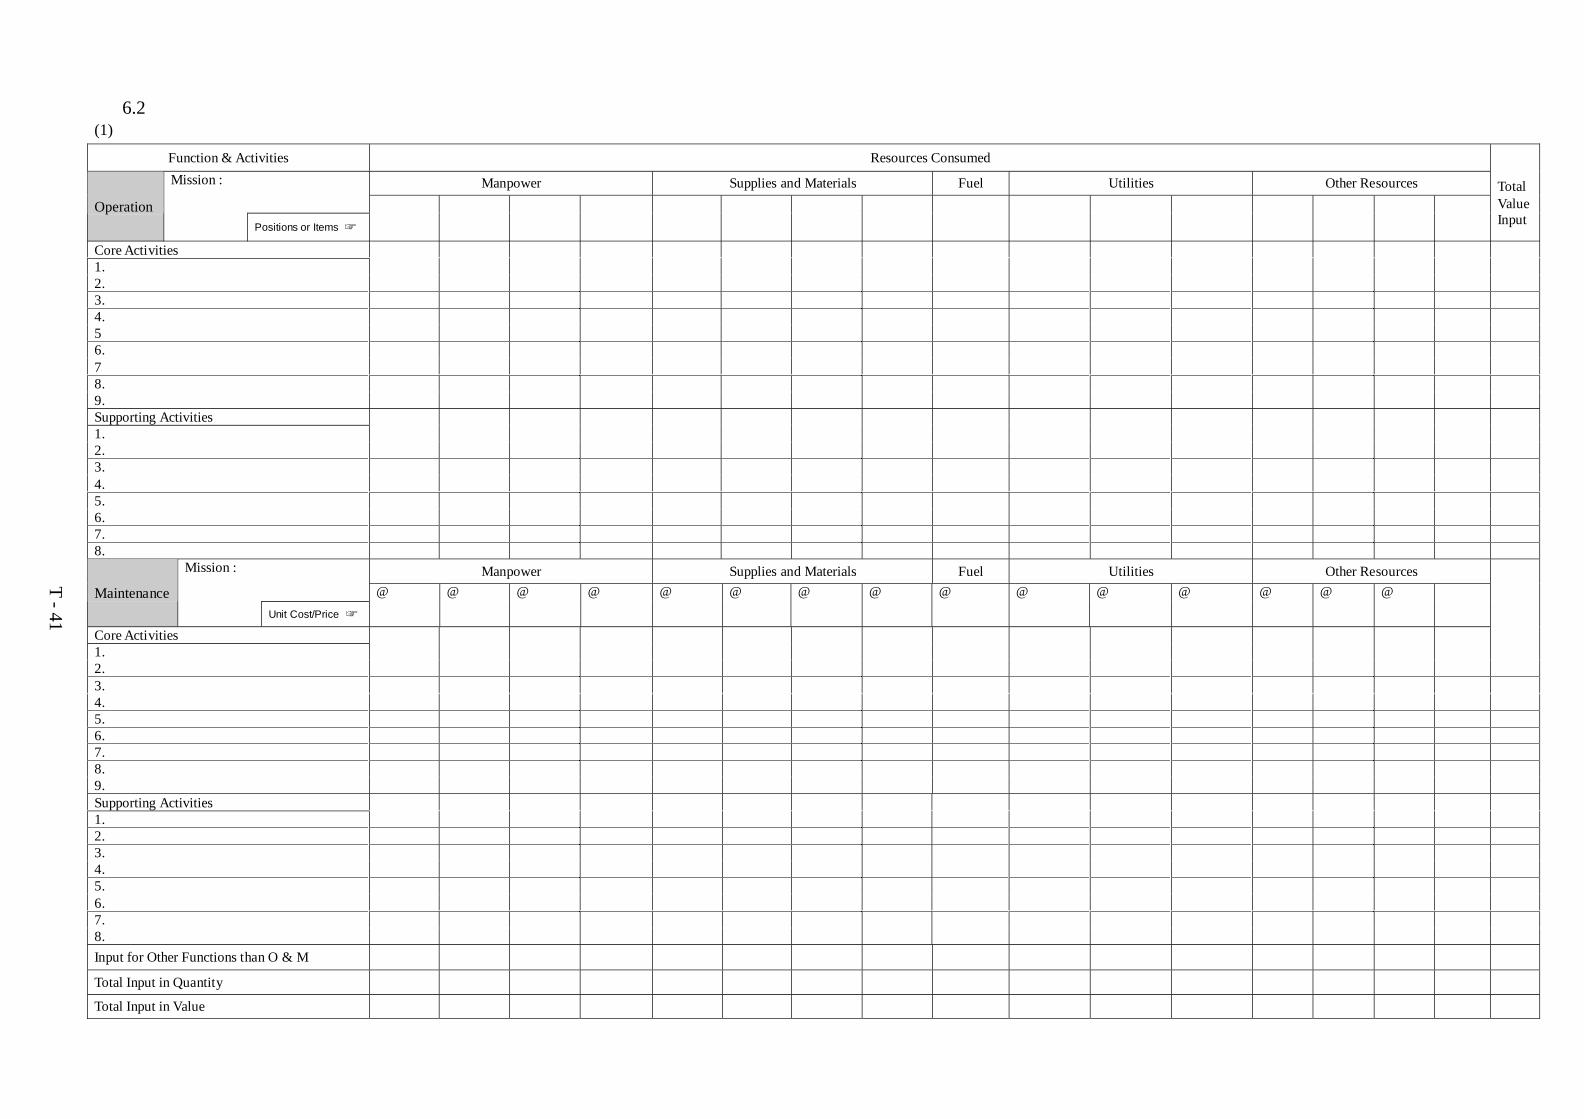
表 6.2 監査活動分析シート(1) 維持管理用
T - 41
Function & Activities Resources ConsumedMission : Manpower Supplies and Materials Fuel Utilities Other Resources Total
OperationPositions or Items ☞
ValueInput
Core Activities1.2.3.4.56.78.9.Supporting Activities1.2.3.4.5.6.7.8.
Mission : Manpower Supplies and Materials Fuel Utilities Other ResourcesMaintenance
Unit Cost/Price ☞
@ @ @ @ @ @ @ @ @ @ @ @ @ @ @
Core Activities1.2.3.4.5.6.7.8.9.Supporting Activities1.2.3.4.5.6.7.8.Input for Other Functions than O & M
Total Input in Quantity
Total Input in Value

表 6.3 監査活動分析シート(2) 維持管理-要員
T - 42
Function & Activities Comparison between Actual and Normative Input
Chief of O&M SWRFT Ditchtender (WRFTB) Gatekeeper Operator
Actual Input Normative Input Actual Input Normative Input Actual Input Normative Input Actual Input Normative Input Actual Input Normative InputO&M at National Irrigation SystemNumber
of Staff
HoursNumber
of Staff
HoursNumber
of Staff
HoursNumber
of Staff
HoursNumber
of Staff
HoursNumber
of Staff
HoursNumber
of Staff
HoursNumber
of Staff
HoursNumber
of Staff
HoursNumber
of Staff
Hours
Core Activities
Information Collection
1.Travelling
2.Communications with Farmers
3.Observation and Investigation
4.Communications with Operators
Water Flow Control and Management1.Gate Control & Operation of Other
StructuresControl Structure
Intake Structure
Bifurcation Structure
Diversion Dams
Check Gates
Siphon Structure
Main Gates
Lateral Gates
Turnouts
2.Clearing Canals and Embankments
Maintenance
1.Minor Repairs
2.Disilting
3.Olther Major Repairs
Supporting Activities
1.Planning
2.Recording
3.Reporting
Other Activities for O&M
Other Activities than O&M
Total Input

表 6.4 監査活動分析シート(3) 維持管理-重機
T - 43
Function & Activities Comparison between Actual and Normative Input
Dozer, Crawler Loader, Wheeled Loader W / Backhoe, Crawler
Actual Input Normative Input Actual Input Normative Input Actual Input Normative Input Actual Input Normative Input Actual Input Normative InputO&M at National Irrigation System
Number Hours Number Hours Number Hours Number Hours Number Hours Number Hours Number Hours Number Hours Number Hours Number Hours
Core Activities
Information Collection
1.Travelling
2.Communications with Farmers
3.Observation and Investigation
4.Communications with Operators
Water Flow Control and Management1.Gate Control & Operation of Other
StructuresControl Structure
Intake Structure
Bifurcation Structure
Diversion Dams
Check Gates
Siphon Structure
Main Gates
Lateral Gates
Turnouts
2.Clearing Canals and Embankments
Maintenance
1.Minor Repairs
2.Disilting
3.Olther Major Repairs
Supporting Activities
1.Planning
2.Recording
3.Reporting
Other Activities for O&M
Other Activities than O&M
Total Input

(1) 機材
E Q U I P M E N T L E D G E R C A R D
Equipment Propert No. Classification
Description Unit Est. Life ( In years)
RECEIPT ISSUANCE BALANCEDate Reference/ Unit QTY. Value QTY. Value QTY. Value
Particulars Price
I S S U E D RETURNED/TRANSFERRED CUSTODIAN OR OFFICE
Date Qty. File No. ACCOUNTABLE OFFICER LOCATION DATE QUANTITY
表6.5 資産台帳カード
T - 44

(2) 備品
S U P P L I E S L E D G E R C A R DItem Code
Description Unit RECEIPTS ISSUES BALANCES
DATE REFERENCE QTY. UNIT TOTAL QTY. UNIT TOTAL QTY. UNIT TOTALCOST COST COST COST COST COST
Balance Carried Forward
表6.5 資産台帳カード
T - 45

T - 46
表 7.1 組織改革シナリオの比較・分析結果
CharacteristicsScenario-1
Integrated RIOs with SmallerCentral Office (CO)
Scenario-2Island-Based Corporation
Scenario-3CO-NISO Directly Linked
OrganizationOrganizationalFeatures
- Central Office (CO) :Significant downsizingcorresponding todiminution of functions topolicy, planning,programming andmonitoring and evaluation
- Regional Irrig. Offices(RIOs):Reduction of the number ofRIOs from 13 to 6 resultingfrom integration
- Field Offices (FOs):Merger of PIO and NISO ina Province into PIMO
- Central Office (CO) :Smaller CO for major policydirection, monitoring andevaluation to ensure theminimal adjustments/arrangements
- Regional Irrig. Office (RIOs):3 Corporate Offices (one eachfor Luzon, Visayas andMindanao)
- Field Offices (FOs):Integration of NISO and PIOfunctions into PIMO
- Central Office (CO) :Lean but strong CO to bemanagerial nucleus of theoperations
- Regional Irrig. Offices(RIOs):Abolition of RIOs (Directcontrol of Field Offices byCO)
- Field Offices (FOs):Integration of NISO andPIO functions into PIMO
BASICSTRATEGY
- Transfer of CO functions toRIO
- Significantly increasedelegated authorities fromCO to the integrated RIOs(AIOOs) & PIMOs
- Rationalize the NIA’smanagement system tominimize overheadexpenses by eliminatingduplication andoverlapping of functions
- Divide the NIA CO into threecorporations; one each for・Luzon・ Visayas and・ Mindanao
‐to promote extensivedecentralization and costreduction
- Abolish RIOs and create aPIMO by integrating thefunctions of NISOs andPIOs.
- The PIMO is to be placedunder the direct control ofthe CO
Advantages (+)andDisadvantages(-)
+ Effective to tackle anoverhead cost reduction
+ Instrumental to solve thecurrent personnelredundancy issue
- Possibility to createregional disparities
- Difficulty in coordinationwith other governmentagencies
+ Effective location-specificplanning
+ Huge cost reduction
- Difficulty of handling largedismissals and relocation ofmanpower in the CO
- Difficulty in policy andstrategy adjustments
- Difficulty in promotingprojects for foreign assistance
- Difficulty of reducing gapsamong three islands
+ Significant reduction inadministrative cost
- Huge fund requirement tofinance and attractiveretirement package
- Difficulty of coordinatingwith other governmentagencies particularly onplanning and adjustmentsof plans
- Possibility of centralizingthe system during thetransition
Orientation ofLong TermDirection
- Improvement of operationalsystems based on existingstructural framework
- Privatization (ex. NPC,MWSS, etc.)
- Autonomy of NISO withenhanced cooperation ofthe IAs
- Elimination/ Reduction ofcurrent problems
- Balanced and responsivepolicy in irrigationdevelopment in three islandgroups
- Regional equity
- Effective implementationof IMT and strengtheningof IA capability
-Networking of autonomousNISO and theirsustainability
Consistency in Policy / Leadership of the Top Management / Ownership at Each Level
Key Issues orRequirements
Restoration of Financial Viability / Securing the Required Funds
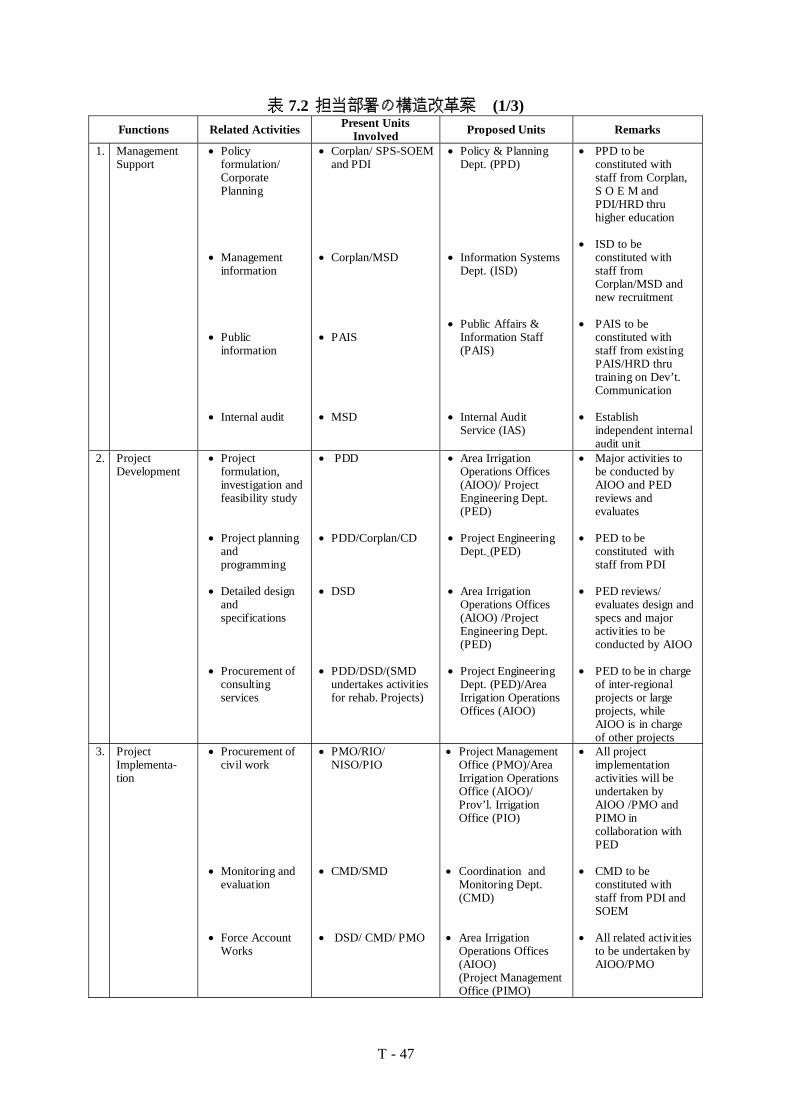
T - 47
表 7.2 担当部署の構造改革案 (1/3)Functions Related Activities Present Units
Involved Proposed Units Remarks
1. ManagementSupport
• Policyformulation/CorporatePlanning
• Managementinformation
• Publicinformation
• Internal audit
• Corplan/ SPS-SOEMand PDI
• Corplan/MSD
• PAIS
• MSD
• Policy & PlanningDept. (PPD)
• Information SystemsDept. (ISD)
• Public Affairs &Information Staff(PAIS)
• Internal AuditService (IAS)
• PPD to beconstituted withstaff from Corplan,S O E M andPDI/HRD thruhigher education
• ISD to beconstituted withstaff fromCorplan/MSD andnew recruitment
• PAIS to beconstituted withstaff from existingPAIS/HRD thrutraining on Dev’t.Communication
• Establishindependent internalaudit unit
2. ProjectDevelopment
• Projectformulation,investigation andfeasibility study
• Project planningandprogramming
• Detailed designandspecifications
• Procurement ofconsultingservices
• PDD
• PDD/Corplan/CD
• DSD
• PDD/DSD/(SMDundertakes activitiesfor rehab. Projects)
• Area IrrigationOperations Offices(AIOO)/ ProjectEngineering Dept.(PED)
• Project EngineeringDept. (PED)
• Area IrrigationOperations Offices(AIOO) /ProjectEngineering Dept.(PED)
• Project EngineeringDept. (PED)/AreaIrrigation OperationsOffices (AIOO)
• Major activities tobe conducted byAIOO and PEDreviews andevaluates
• PED to beconstituted withstaff from PDI
• PED reviews/evaluates design andspecs and majoractivities to beconducted by AIOO
• PED to be in chargeof inter-regionalprojects or largeprojects, whileAIOO is in chargeof other projects
3. ProjectImplementa-tion
• Procurement ofcivil work
• Monitoring andevaluation
• Force AccountWorks
• PMO/RIO/NISO/PIO
• CMD/SMD
• DSD/ CMD/ PMO
• Project ManagementOffice (PMO)/AreaIrrigation OperationsOffice (AIOO)/Prov’l. IrrigationOffice (PIO)
• Coordination andMonitoring Dept.(CMD)
• Area IrrigationOperations Offices(AIOO)(Project ManagementOffice (PIMO)
• All projectimplementationactivities will beundertaken byAIOO /PMO andPIMO incollaboration withPED
• CMD to beconstituted withstaff from PDI andSOEM
• All related activitiesto be undertaken byAIOO/PMO

T - 48
表 7.2 担当部署の構造改革案 (2/3)Functions Related Activities Present Units
Involved Proposed Units Remarks
• SSIP/ CIP • PIO • PIMO • Small-scaleirrigation projectsgiven by the nationalgovernment to NIAare to be undertakenby PIMO
4. O&M of NISs • Monitoring andevaluation onO&M
• EquipmentManagement
• Support onO&M
• IA dev’t. supportand supervision
• O&M of NISs
• SMD
• SMD/RIO
• SMD/RIO
• SMD/IDD
• SMD/NISO /RIO
• Coordination &Monitoring Dept.(CMD)
• Area IrrigationOperations Offices(AIOO)
• Area IrrigationOperations Offices(AIOO)
• Area IrrigationOperations Offices(AIOO)
• Prov’l. IrrigationManagement Office(PIMO)
• CMD to beconstituted with
staff from SMD
• All related functionsto be transferred toAIOO
• All O&M functionsto be undertaken byPIMO under
technical support of AIOO
• All related functionsto be transferred toAIOO
• All related functionsto be transferred toPIMO
5. FinancialManagement
• Accounting
• CastManagement
• Budgeting
• ISF Collectionand CISAmortization
• CD/RIOs
• TD
• CD/RIOs
• CD/TD
• NISO/PIO
• FinancialManagementDept.(FMD)/AreaIrrig. OperationsOffices (AIOO)/Prov’l. Irrig. Mgt.Office (PIMO)
• FinancialManagementDept.(FMD)/AreaIrrig. OperationsOffices (AIOO)/Prov’l. Irrig. Mgt.Office (PIMO)
• FinancialManagementDept.(FMD)/AreaIrrig. OperationsOffices (AIOO)/Prov’l. Irrig. Mgt.Office (PIMO)
• Provincial IrrigationManagement Office(PIMO)
• Decentralization ofthe accountingfunctions to thelevel of PIMO
• FMD-CO shallcoordinate andprovide project fundto the AIOO
• AIOO and PIMOshall have greaterautonomy inmanaging theirrevenues
• PIMO will beresponsible forcollection andreconciliation

T - 49
表 7.2 担当部署の構造改革案 (3/3)Functions Related Activities Present Units
Involved Proposed Units Remarks
6. Administra-tiveSupport
• Organization &PersonnelManagement of& HRD
• Procurement ofmaterials,supplies &equipment
• Disposal ofunserviceableequipment
• General andsecurity services
• Monitoring ofNIA Resources
• PRMD/MSD
• PPRD/RIO/NISO/PIO
• PPRD/EMD
• PRMD
• PRMD/MSD
• Admin. ServiceDept. (ASD)/AreaIrrig. Oper. Office(AIOO)
• Admin. ServiceDept.(ASD)/AreaIrrig.. OperationsOffices (AIOO)/Prov’l Irrig. Mgt.Office (PIMO)
• Area IrrigationOperation Office(AIOO)
• Admin. ServiceDept. (ASD)/AreaIrrigation OperationOffice (AIOO)/Prov’l. Irrig. Mgt.Office (PIMO)
• Admin. ServiceDept (ASD)
• CO and AIOO to begiven semi-autonomy in HRmgt. and dev’t. COmay undertake NIA-wide HRD prog.
• CO, AIOO andPIMO to be givenautonomy inprocurement
• AIOO to be givenautonomy indisposal ofunserviceableequipment system
• CO, AIOO, PIMOto be givenautonomous
• ASD to monitor
7. InformationSystems andTechnologyDev’t.
• Infrastructuredev’t. andsupport
• Informationmanagement
• EDP-MISD • Information SystemsDept.(ISD)/Planning &Monitoring Unit ofAIOO
• Central support tobe provided by theCO
Source: JICA Study Team
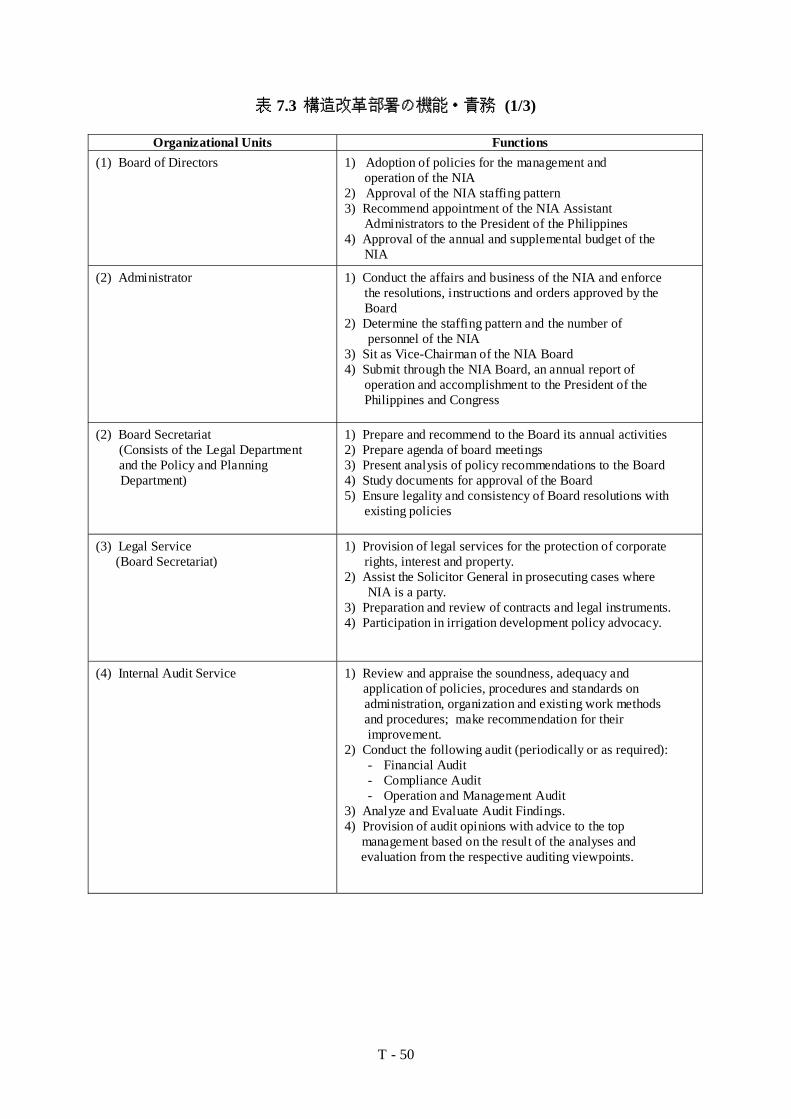
T - 50
表 7.3 構造改革部署の機能・責務 (1/3)
Organizational Units Functions(1) Board of Directors 1) Adoption of policies for the management and
operation of the NIA2) Approval of the NIA staffing pattern3) Recommend appointment of the NIA Assistant Administrators to the President of the Philippines4) Approval of the annual and supplemental budget of the NIA
(2) Administrator
1) Conduct the affairs and business of the NIA and enforce the resolutions, instructions and orders approved by the Board2) Determine the staffing pattern and the number of personnel of the NIA3) Sit as Vice-Chairman of the NIA Board4) Submit through the NIA Board, an annual report of operation and accomplishment to the President of the Philippines and Congress
(2) Board Secretariat (Consists of the Legal Department and the Policy and Planning Department)
1) Prepare and recommend to the Board its annual activities2) Prepare agenda of board meetings3) Present analysis of policy recommendations to the Board4) Study documents for approval of the Board5) Ensure legality and consistency of Board resolutions with existing policies
(3) Legal Service (Board Secretariat)
1) Provision of legal services for the protection of corporate rights, interest and property.2) Assist the Solicitor General in prosecuting cases where NIA is a party.3) Preparation and review of contracts and legal instruments.4) Participation in irrigation development policy advocacy.
(4) Internal Audit Service 1) Review and appraise the soundness, adequacy and application of policies, procedures and standards on administration, organization and existing work methods and procedures; make recommendation for their improvement.2) Conduct the following audit (periodically or as required):
- Financial Audit- Compliance Audit- Operation and Management Audit
3) Analyze and Evaluate Audit Findings.4) Provision of audit opinions with advice to the top management based on the result of the analyses and evaluation from the respective auditing viewpoints.
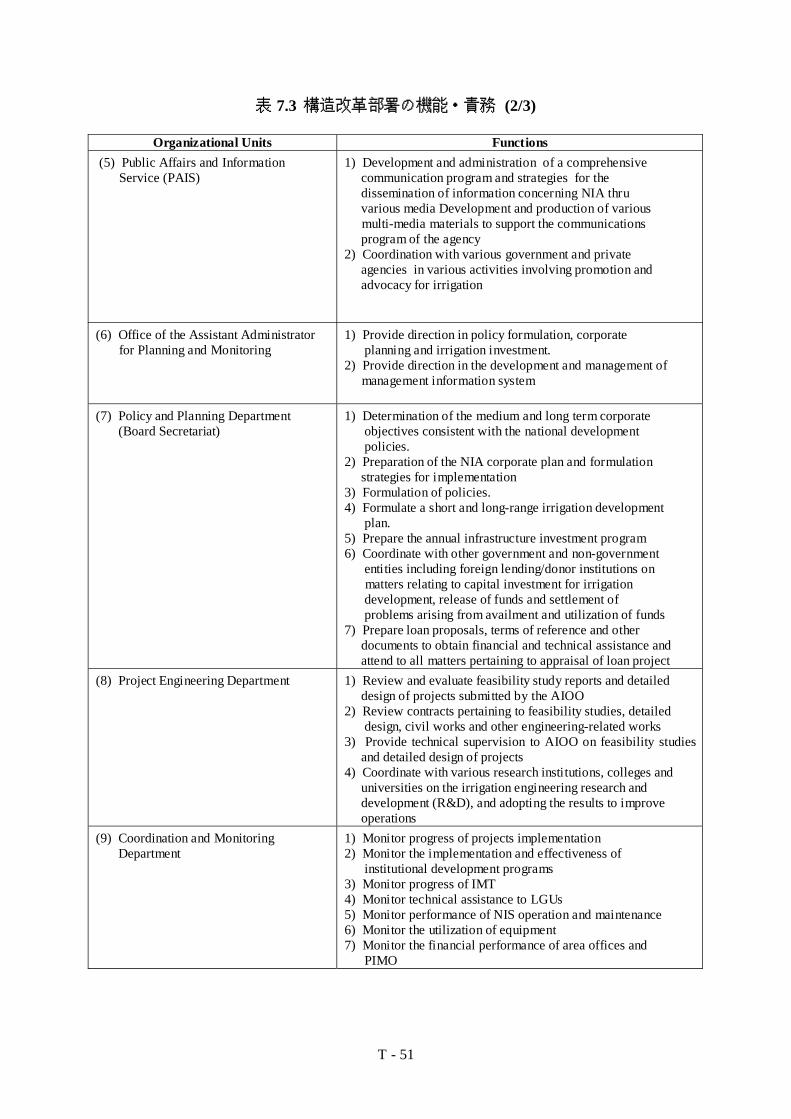
T - 51
表 7.3 構造改革部署の機能・責務 (2/3)
Organizational Units Functions (5) Public Affairs and Information Service (PAIS)
1) Development and administration of a comprehensive communication program and strategies for the dissemination of information concerning NIA thru various media Development and production of various multi-media materials to support the communications program of the agency2) Coordination with various government and private agencies in various activities involving promotion and advocacy for irrigation
(6) Office of the Assistant Administrator for Planning and Monitoring
1) Provide direction in policy formulation, corporate planning and irrigation investment.2) Provide direction in the development and management of management information system
(7) Policy and Planning Department (Board Secretariat)
1) Determination of the medium and long term corporate objectives consistent with the national development policies.2) Preparation of the NIA corporate plan and formulation strategies for implementation3) Formulation of policies.4) Formulate a short and long-range irrigation development plan.5) Prepare the annual infrastructure investment program6) Coordinate with other government and non-government entities including foreign lending/donor institutions on matters relating to capital investment for irrigation development, release of funds and settlement of problems arising from availment and utilization of funds7) Prepare loan proposals, terms of reference and other documents to obtain financial and technical assistance and attend to all matters pertaining to appraisal of loan project
(8) Project Engineering Department 1) Review and evaluate feasibility study reports and detaileddesign of projects submitted by the AIOO
2) Review contracts pertaining to feasibility studies, detailed design, civil works and other engineering-related works3) Provide technical supervision to AIOO on feasibility studies
and detailed design of projects4) Coordinate with various research institutions, colleges and universities on the irrigation engineering research and development (R&D), and adopting the results to improve
operations(9) Coordination and Monitoring
Department1) Monitor progress of projects implementation2) Monitor the implementation and effectiveness of institutional development programs3) Monitor progress of IMT4) Monitor technical assistance to LGUs5) Monitor performance of NIS operation and maintenance6) Monitor the utilization of equipment7) Monitor the financial performance of area offices and PIMO
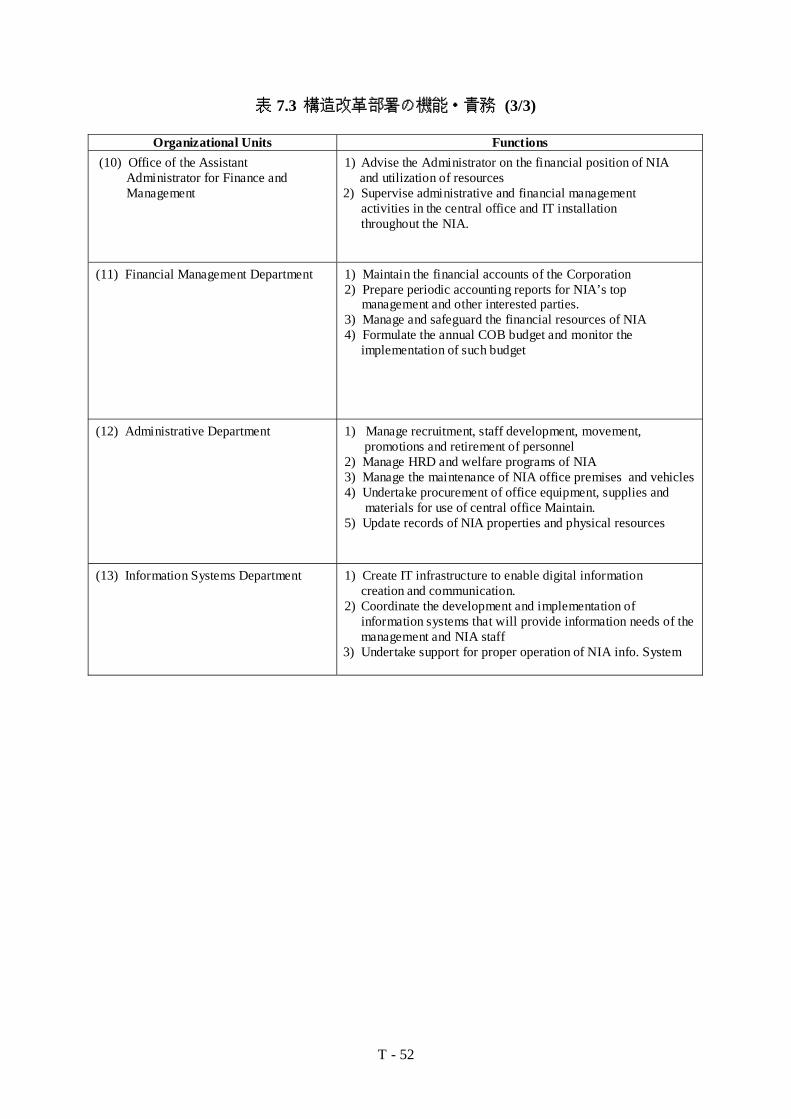
T - 52
表 7.3 構造改革部署の機能・責務 (3/3)
Organizational Units Functions (10) Office of the Assistant Administrator for Finance and
Management
1) Advise the Administrator on the financial position of NIA and utilization of resources2) Supervise administrative and financial management activities in the central office and IT installation throughout the NIA.
(11) Financial Management Department 1) Maintain the financial accounts of the Corporation2) Prepare periodic accounting reports for NIA’s top management and other interested parties.3) Manage and safeguard the financial resources of NIA4) Formulate the annual COB budget and monitor the implementation of such budget
(12) Administrative Department 1) Manage recruitment, staff development, movement, promotions and retirement of personnel2) Manage HRD and welfare programs of NIA3) Manage the maintenance of NIA office premises and vehicles4) Undertake procurement of office equipment, supplies and materials for use of central office Maintain.5) Update records of NIA properties and physical resources
(13) Information Systems Department 1) Create IT infrastructure to enable digital information creation and communication.2) Coordinate the development and implementation of
information systems that will provide information needs of themanagement and NIA staff
3) Undertake support for proper operation of NIA info. System

表7.4 NIAの管区別財務実績、2000年
(Unit: million pesos)
CO CAR I II MRIIS III UPRIIS IV V VI VII &VIII IX X XI XII XIII
1) Receipts
- Receipts from Income Sources 256 6 26 48 74 31 85 35 15 35 20 15 26 60 33 21
- Receipts from Other Sources 7 9 6 9 63 19 17 8 9 7 16 10 5 11 9 9
- Total Recipts 263 15 43 57 137 50 102 43 24 42 36 25 31 71 42 30
2) Expenditures
- Personnel Cost 139 23 54 64 116 69 100 74 46 67 55 32 39 73 50 26
- CIP Amortization 35 2 6 39 32 8 17 3 4 3 4 2 6 21 9 3
- Total Operating Costs 174 25 60 103 148 77 117 77 50 70 59 34 45 94 59 29
s
3) Net Cash (Deficit) 89 -10 -17 -46 -11 -27 -15 -34 -26 -28 -23 -9 -14 -23 -17 1
4) % of ISF Revenue to Operating Cost 14 31 31 36 28 60 41 21 33 19 23 29 47 36 36
Source: JICA Study Team, Interim Report March 2001
Particulars
T - 53

(1) Present Regional Group
1. I 70,800 38,787 109,5872. CAR* 0 4,700 4,7003. II 22,330 6,000 28,3304. III 100,642 4,270 104,9125. IV* 0 4,180 4,1806. V 0 10,404 10,4047. VI 15,200 35,985 51,1858. VII* 5,300 0 5,3009. VIII* 3,000 6,950 9,95010. IX 0 19,100 19,10011. X 2,000 20,800 22,80012. XI* 0 6,730 6,73013. XII 19,402 27,088 46,49014. XIII 7,922 38,972 46,894
246,596 223,966 470,562
Note: * Low irrigation potential with about 6,000 ha
(2) Proposed Regional Group (AIOO)(Unit: hectare)
On-going Proposed Total1. Northern Luzon 93,130 49,487 142,617 2. Central Luzon 100,642 4,270 104,912 3. Southern Luzon 0 14,584 14,584 4. Visayas 23,500 42,935 66,435 5. Eastern Mindanao 9,922 66,502 76,424 6. Western Mindanao 19,402 46,188 65,590
246,596 223,966 470,562
On-goingRegion
Region
Total
表 7.5 国営灌漑プロジェクト (NIP)の開発状況、2000-2009年
Source: Corplan, NIA
Proposed Total(Unit: hectare)
Total
T - 54

1. I 1 1,453 8 71,921 73,3742. II 11 22,219 7 114,573 136,7923. III 4 5,513 9 163,822 169,3354. IV 8 9,241 8 43,465 52,7065. V 5 9,746 2* 10,750 20,4966. VI 4 6,973 5 45,243 52,2167. VII & VIII 6 9,829 2* 11,414 21,2438. IX 0 0 3* 15,162 15,1629. X 0 0 3* 20,696 20,696
10. XI 2 4,566 4 29,711 34,27711. XII 2 5,100 6 58,308 63,40812. XIII 3 6,483 3* 11,929 18,412
46 81,123 60 596,994 678,117
Note: * Two or three NISOs whose total service area ranges from 15,000 to 21,000 ha may be too small to maintain as a separate office.
After Integration of NISO by AreaNISO Area
1. Northern Luzon 15 186,494 2. Central Luzon 9 163,822 3. Southern Luzon 10 54,215 4. Visayas 7 56,657 5. Eastern Mindanao 10 62,336 6. Western Mindanao 9 73,470 Total: 60 596,994
Source: JICA Study Team
Total Area (ha)Area (ha)Area (ha)
Below 3,000 ha Above 3,000 ha
No. of NISO
表7.6 管区別国営灌漑システム事務所( NISO)の分布状況
No. of NISORegion
Total
No.
T - 55
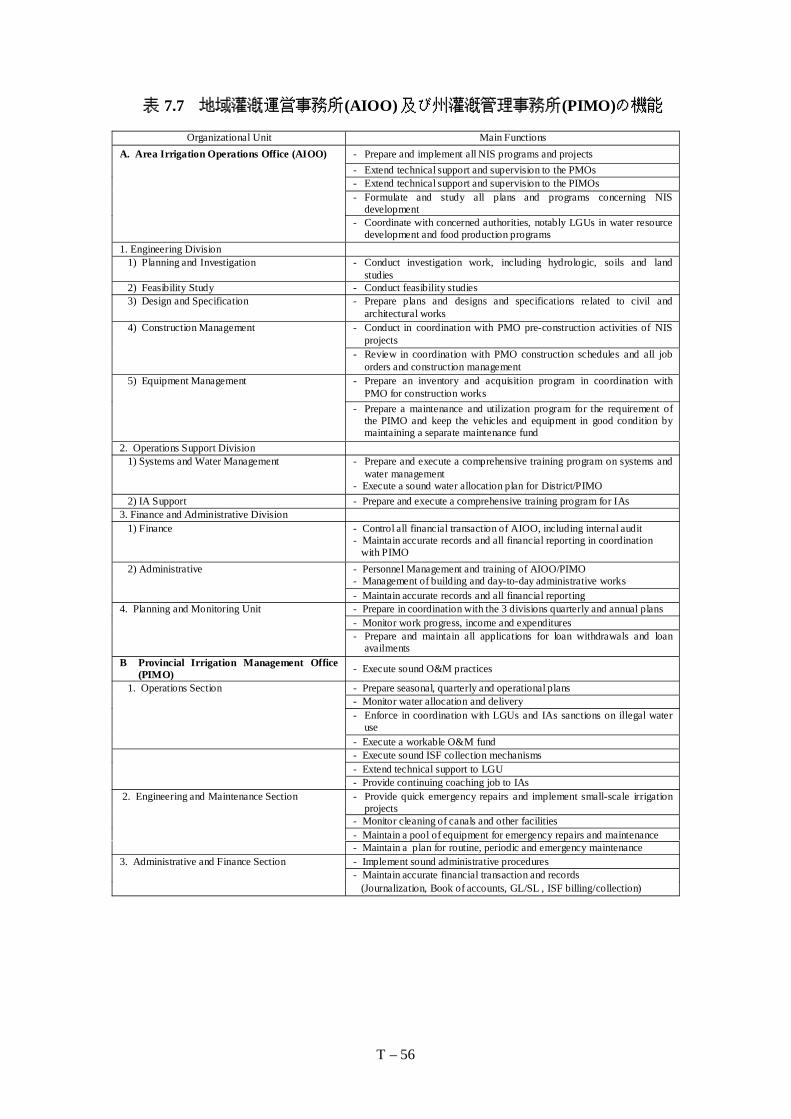
T – 56
表 7.7 地域灌漑運営事務所(AIOO) 及び州灌漑管理事務所(PIMO)の機能
Organizational Unit Main FunctionsA. Area Irrigation Operations Office (AIOO) - Prepare and implement all NIS programs and projects
- Extend technical support and supervision to the PMOs- Extend technical support and supervision to the PIMOs- Formulate and study all plans and programs concerning NIS
development- Coordinate with concerned authorities, notably LGUs in water resource
development and food production programs1. Engineering Division 1) Planning and Investigation - Conduct investigation work, including hydrologic, soils and land
studies 2) Feasibility Study - Conduct feasibility studies 3) Design and Specification - Prepare plans and designs and specifications related to civil and
architectural works 4) Construction Management - Conduct in coordination with PMO pre-construction activities of NIS
projects- Review in coordination with PMO construction schedules and all job
orders and construction management 5) Equipment Management - Prepare an inventory and acquisition program in coordination with
PMO for construction works- Prepare a maintenance and utilization program for the requirement of
the PIMO and keep the vehicles and equipment in good condition bymaintaining a separate maintenance fund
2. Operations Support Division 1) Systems and Water Management - Prepare and execute a comprehensive training program on systems and
water management- Execute a sound water allocation plan for District/PIMO
2) IA Support - Prepare and execute a comprehensive training program for IAs3. Finance and Administrative Division 1) Finance - Control all financial transaction of AIOO, including internal audit
- Maintain accurate records and all financial reporting in coordination with PIMO
2) Administrative - Personnel Management and training of AIOO/PIMO- Management of building and day-to-day administrative works- Maintain accurate records and all financial reporting
4. Planning and Monitoring Unit - Prepare in coordination with the 3 divisions quarterly and annual plans- Monitor work progress, income and expenditures- Prepare and maintain all applications for loan withdrawals and loan
availmentsB Provincial Irrigation Management Office
(PIMO) - Execute sound O&M practices
1. Operations Section - Prepare seasonal, quarterly and operational plans- Monitor water allocation and delivery- Enforce in coordination with LGUs and IAs sanctions on illegal water
use- Execute a workable O&M fund- Execute sound ISF collection mechanisms- Extend technical support to LGU- Provide continuing coaching job to IAs
2. Engineering and Maintenance Section - Provide quick emergency repairs and implement small-scale irrigationprojects
- Monitor cleaning of canals and other facilities- Maintain a pool of equipment for emergency repairs and maintenance- Maintain a plan for routine, periodic and emergency maintenance
3. Administrative and Finance Section - Implement sound administrative procedures- Maintain accurate financial transaction and records (Journalization, Book of accounts, GL/SL , ISF billing/collection)

Number of SalaryPositions Grade Monthly Salary Total
(1) Board of Directors (BOD) - - - -
(2) Office of the Administrator - Administrator 1 30 27,500.00 330,000.00 - Head Executive Assistant 1 23 19,067.00 228,804.00 - Technical Assistant 2 22 18,334.00 440,016.00 - Executive Secretary 1 15 12,667.00 152,004.00 - Stenographer 1 9 8,874.00 106,488.00 - Driver/Mechanic A 1 9 8,874.00 106,488.00
7(3) Legal Service - Director III 1 27 22,865.00 274,380.00 - Legal Officer IV 5 22 18,334.00 1,100,040.00 - Driver/Mechanic A 1 9 8,874.00 106,488.00
7(4) Internal Audit Service - Director III 1 27 22,865.00 274,380.00 - Mgt. Systems Dev't. Chief A 3 22 18,334.00 660,024.00 - Mgt. Systems Design Spec.B 3 18 15,850.00 570,600.00 - Sr. Mgt. Systems Analyst 3 16 14,106.00 507,816.00 - Principal Engineer A 2 22 18,334.00 440,016.00 - Principal Engineer C 1 20 16,951.00 203,412.00 - Driver/Mechanic A 1 9 8,874.00 106,488.00 - Clerk-Processor 1 8 8,294.00 99,528.00
15(5) Public Affairs and Information Service - Director II 1 26 21,985.00 263,820.00 - Public Relations Chief 1 20 16,951.00 203,412.00 - Public Relations Officer A 2 15 12,667.00 304,008.00 - Information Officer A 1 15 12,667.00 152,004.00 - Senior Artist Illustrator 1 12 11,174.00 134,088.00 - Head Photographer 1 12 11,174.00 134,088.00 - Audio Visual Sys. Technician 1 8 8,294.00 99,528.00 - Clerk-Processor 1 8 8,294.00 99,528.00
9Sub-Total 38 7,097,448.00
(6) Office of the Asst. Adm. for Planning & Monitoring - Asst. Administrator 1 27 22,865.00 274,380.00 - Technical Assistant 1 20 16,951.00 203,412.00 - Secretary 1 11 10,033.00 120,396.00 - Driver/Mechanic A 1 9 8,874.00 106,488.00
4(7) Policy and Planning Department - Director III 1 27 22,865.00 274,380.00 - Driver/Mechanic A 1 9 8,874.00 106,488.00 - Clerk-Processor 1 8 8,294.00 99,528.00
3 (7-1) Corporate Planning Div. - Director II 1 26 21,985.00 263,820.00 - Planning Officer V 3 24 20,835.00 750,060.00 - Principal Engineer A 2 22 18,334.00 440,016.00 - Principal Engineer C 2 20 16,951.00 406,824.00 - Sr. Corplan Specialist 3 19 16,801.00 604,836.00 - Chief Economist A 3 22 18,334.00 660,024.00 - Chief Statistician 3 15 12,667.00 456,012.00 - Clerk-Processor 1 8 8,294.00 99,528.00
18 (7-2) Policy Formulation Division - Director II 1 26 21,985.00 263,820.00 - Chief Economist A 2 22 18,334.00 440,016.00 - Principal Engineer A 4 22 18,334.00 880,032.00 - Sr. Corplan Specialist 2 19 16,801.00 403,224.00 - Chief Economist C 2 18 15,850.00 380,400.00 - Clerk-Processor 1 8 8,294.00 99,528.00
12
表 7.8 NIA中央の人員構成(試案)とその必要経費 (CO) (1/4)
Annual Financial RequirementOffice/Positions
T - 57
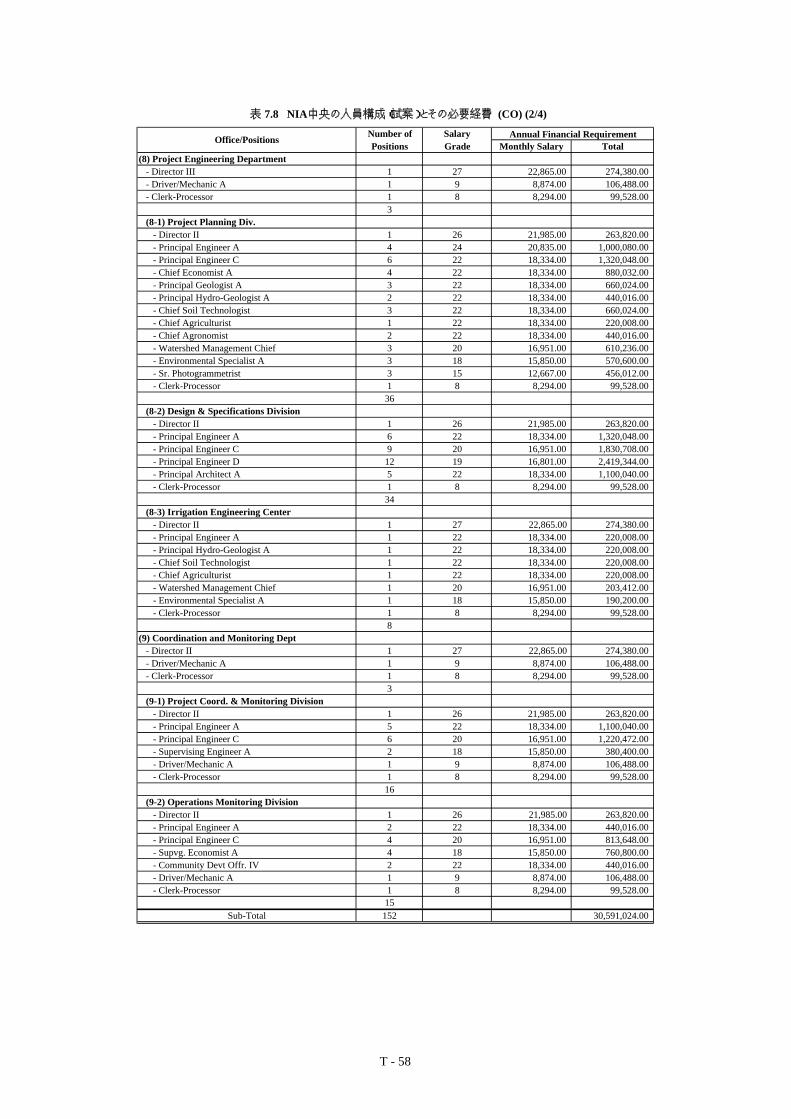
Number of SalaryPositions Grade Monthly Salary Total
(8) Project Engineering Department - Director III 1 27 22,865.00 274,380.00 - Driver/Mechanic A 1 9 8,874.00 106,488.00 - Clerk-Processor 1 8 8,294.00 99,528.00
3 (8-1) Project Planning Div. - Director II 1 26 21,985.00 263,820.00 - Principal Engineer A 4 24 20,835.00 1,000,080.00 - Principal Engineer C 6 22 18,334.00 1,320,048.00 - Chief Economist A 4 22 18,334.00 880,032.00 - Principal Geologist A 3 22 18,334.00 660,024.00 - Principal Hydro-Geologist A 2 22 18,334.00 440,016.00 - Chief Soil Technologist 3 22 18,334.00 660,024.00 - Chief Agriculturist 1 22 18,334.00 220,008.00 - Chief Agronomist 2 22 18,334.00 440,016.00 - Watershed Management Chief 3 20 16,951.00 610,236.00 - Environmental Specialist A 3 18 15,850.00 570,600.00 - Sr. Photogrammetrist 3 15 12,667.00 456,012.00 - Clerk-Processor 1 8 8,294.00 99,528.00
36 (8-2) Design & Specifications Division - Director II 1 26 21,985.00 263,820.00 - Principal Engineer A 6 22 18,334.00 1,320,048.00 - Principal Engineer C 9 20 16,951.00 1,830,708.00 - Principal Engineer D 12 19 16,801.00 2,419,344.00 - Principal Architect A 5 22 18,334.00 1,100,040.00 - Clerk-Processor 1 8 8,294.00 99,528.00
34 (8-3) Irrigation Engineering Center - Director II 1 27 22,865.00 274,380.00 - Principal Engineer A 1 22 18,334.00 220,008.00 - Principal Hydro-Geologist A 1 22 18,334.00 220,008.00 - Chief Soil Technologist 1 22 18,334.00 220,008.00 - Chief Agriculturist 1 22 18,334.00 220,008.00 - Watershed Management Chief 1 20 16,951.00 203,412.00 - Environmental Specialist A 1 18 15,850.00 190,200.00 - Clerk-Processor 1 8 8,294.00 99,528.00
8(9) Coordination and Monitoring Dept - Director II 1 27 22,865.00 274,380.00 - Driver/Mechanic A 1 9 8,874.00 106,488.00 - Clerk-Processor 1 8 8,294.00 99,528.00
3 (9-1) Project Coord. & Monitoring Division - Director II 1 26 21,985.00 263,820.00 - Principal Engineer A 5 22 18,334.00 1,100,040.00 - Principal Engineer C 6 20 16,951.00 1,220,472.00 - Supervising Engineer A 2 18 15,850.00 380,400.00 - Driver/Mechanic A 1 9 8,874.00 106,488.00 - Clerk-Processor 1 8 8,294.00 99,528.00
16 (9-2) Operations Monitoring Division - Director II 1 26 21,985.00 263,820.00 - Principal Engineer A 2 22 18,334.00 440,016.00 - Principal Engineer C 4 20 16,951.00 813,648.00 - Supvg. Economist A 4 18 15,850.00 760,800.00 - Community Devt Offr. IV 2 22 18,334.00 440,016.00 - Driver/Mechanic A 1 9 8,874.00 106,488.00 - Clerk-Processor 1 8 8,294.00 99,528.00
15Sub-Total 152 30,591,024.00
表 7.8 NIA中央の人員構成(試案)とその必要経費 (CO) (2/4)
Office/Positions Annual Financial Requirement
T - 58

Number of SalaryPositions Grade Monthly Salary Total
(10) Office of the Asst. Adm. for Finance & Management - Assistant Administrator 1 28 23,199.00 278,388.00 - Technical Assistant 1 20 16,951.00 203,412.00 - Secretary 1 11 10,033.00 120,396.00 - Driver/Mechanic A 1 9 8,874.00 106,488.00
4(11) Financial Management Department - Director III 1 27 22,865.00 274,380.00 - Driver/Mechanic A 1 9 8,874.00 106,488.00 - Clerk-Processor 1 8 8,294.00 99,528.00
3 (11-1) Budget Division - Director II 1 26 21,985.00 263,820.00 - Corporate Financial Serv. Chief 1 22 18,334.00 220,008.00 - Corporate Budget Specialist A 2 18 15,850.00 380,400.00 - Corporate Budget Officer B 3 15 12,667.00 456,012.00 - Corporate Budget Analyst B 4 12 11,174.00 536,352.00 - Clerk-Processor 1 8 8,294.00 99,528.00
12 (11-2) Accounting Division - Director II 1 26 21,985.00 263,820.00 - Corprorate Finance Serv. Chief 3 22 18,334.00 660,024.00 - Sr. Corporate AccountantA 3 18 15,850.00 570,600.00 - Sr. Corporate Accts. Analyst 6 15 12,667.00 912,024.00 - Sr. Accounting Processor A 7 12 11,174.00 938,616.00 - Clerk-Processor 1 8 8,294.00 99,528.00
21 (11-3) Treasury Division - Director II 1 26 21,985.00 263,820.00 - Cashiering Services Chief A 2 22 18,334.00 440,016.00 - Sr. Cashier 3 18 15,850.00 570,600.00 - Sr. Financial Plng Specialist 3 20 16,951.00 610,236.00 - Sr. Financial Plng Analyst A 3 15 12,667.00 456,012.00 - Clerk-Processor 1 8 8,294.00 99,528.00
13(12) Administrative Service Department - Director III 1 27 22,865.00 274,380.00 - Driver/Mechanic A 1 9 8,874.00 106,488.00 - Clerk-Processor 1 8 8,294.00 99,528.00
3 (12-1) HR Mgt. & Devt Division - Director II 1 26 21,985.00 263,820.00 - HRM Officer V 4 22 18,334.00 880,032.00 - Ind. Relations Mgt. Officer A 5 18 15,850.00 951,000.00 - Ind. Relations Mgt. Officer C 4 15 12,667.00 608,016.00 - Clerk-Processor 1 8 8,294.00 99,528.00
15 (12-2) Physical Resources Division - Director II 1 26 21,985.00 263,820.00 - Procurement Services Chief 1 22 18,334.00 220,008.00 - Storekeeper B 2 9 8,874.00 212,976.00 - Supvg. Property Officer A 3 18 15,850.00 570,600.00 - Property Officer A 4 14 11,949.00 573,552.00 - Clerk-Processor 1 8 8,294.00 99,528.00
12 (12-3) General Services Division - Director II 1 26 21,985.00 263,820.00 - Records Mgt. Chief 1 22 18,334.00 220,008.00 - Records Officer B 3 14 11,949.00 430,164.00 - Bldg. & Grnds Maintenance Hd. 1 18 15,850.00 190,200.00 - Head Carpenter 1 10 9,945.00 119,340.00 - Mason A 1 5 6,708.00 80,496.00 - Senior Painter 1 8 8,294.00 99,528.00 - Plumber A 1 8 8,294.00 99,528.00 - Sr. Building Electrician A 1 12 11,174.00 134,088.00 - Sr. Librarian A 1 - Clerk-Processor 1 8 8,294.00 99,528.00
13
Annual Financial Requirement
表 7.8 NIA中央の人員構成(試案)とその必要経費 (CO) (3/4)
Office/Positions
T - 59
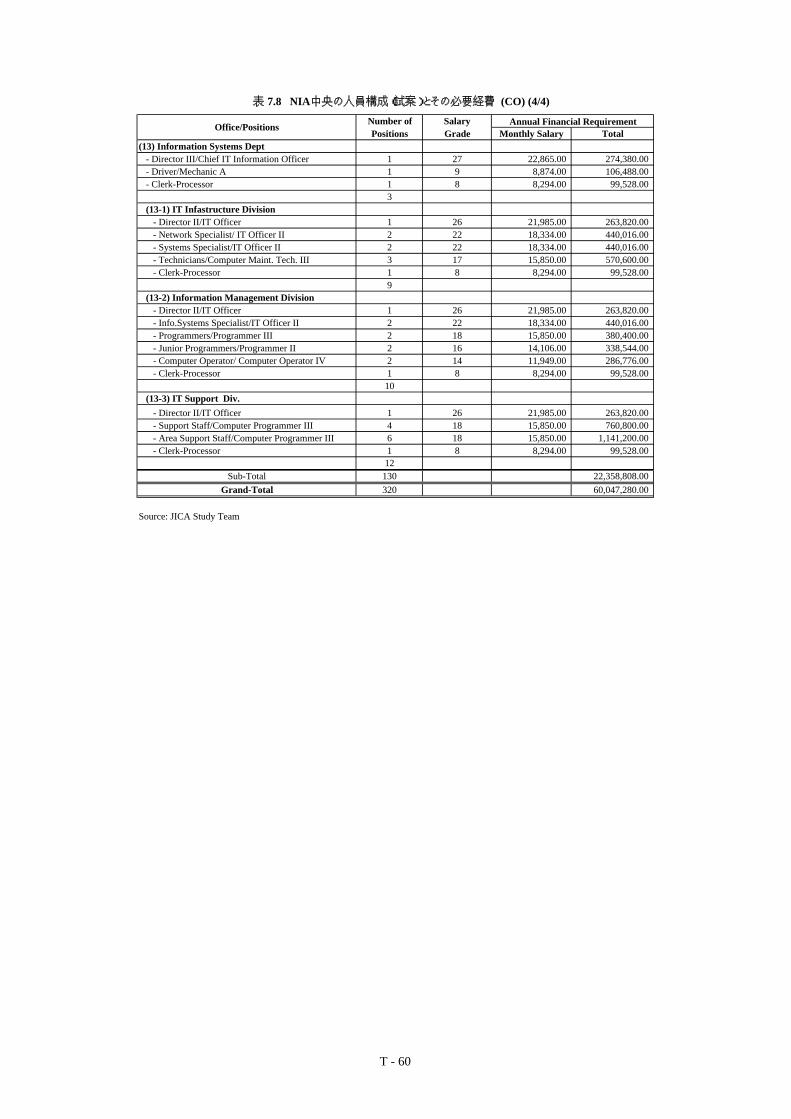
Number of SalaryPositions Grade Monthly Salary Total
(13) Information Systems Dept - Director III/Chief IT Information Officer 1 27 22,865.00 274,380.00 - Driver/Mechanic A 1 9 8,874.00 106,488.00 - Clerk-Processor 1 8 8,294.00 99,528.00
3 (13-1) IT Infastructure Division - Director II/IT Officer 1 26 21,985.00 263,820.00 - Network Specialist/ IT Officer II 2 22 18,334.00 440,016.00 - Systems Specialist/IT Officer II 2 22 18,334.00 440,016.00 - Technicians/Computer Maint. Tech. III 3 17 15,850.00 570,600.00 - Clerk-Processor 1 8 8,294.00 99,528.00
9 (13-2) Information Management Division - Director II/IT Officer 1 26 21,985.00 263,820.00 - Info.Systems Specialist/IT Officer II 2 22 18,334.00 440,016.00 - Programmers/Programmer III 2 18 15,850.00 380,400.00 - Junior Programmers/Programmer II 2 16 14,106.00 338,544.00 - Computer Operator/ Computer Operator IV 2 14 11,949.00 286,776.00 - Clerk-Processor 1 8 8,294.00 99,528.00
10 (13-3) IT Support Div. - Director II/IT Officer 1 26 21,985.00 263,820.00 - Support Staff/Computer Programmer III 4 18 15,850.00 760,800.00 - Area Support Staff/Computer Programmer III 6 18 15,850.00 1,141,200.00 - Clerk-Processor 1 8 8,294.00 99,528.00
12Sub-Total 130 22,358,808.00
Grand-Total 320 60,047,280.00
Source: JICA Study Team
表 7.8 NIA中央の人員構成(試案)とその必要経費 (CO) (4/4)
Office/Positions Annual Financial Requirement
T - 60

表7.9 地域灌漑運営事務所(AIOO)の人員構成(試案)と
その必要経費Size of AOO Service Area (ha) >150000 50000-150000 Annual Financial Requirement
Staff Staff Salary Salary/mo >150000 50000-150000AIOO Head Office No No Grade Pesos Pesos Pesos1. Regional Administrator 1 1 28 22,000 264,000 264,000 2. Deputy Regional Administrator 1 1 27 21,300 255,600 255,600 3. Secretary 2 2 11 9,580 229,920 229,920 Sub-total 4 4 749,520 749,520 Planning and Monitoring Unit4. Sr Engineer 3 2 16 12,820 461,520 307,680 5. Sr Economist 3 2 16 12,820 461,520 307,680 6. Sr Finance/Accountant 2 2 16 12,820 307,680 307,680 7. Clerk 1 1 9 7,900 94,800 94,800 Sub-total 9 7 1,325,520 1,017,840 Engineering Division8. Division chief 1 1 25 19,700 236,400 236,400 9. Clerk 1 1 9 7,900 94,800 94,800 Sub-total 2 2 331,200 331,200 Investigation and Survey10. Principal Engineer 1 1 22 17,500 210,000 210,000 11. Supervising Engineer 4 3 18 14,400 691,200 518,400 12. Sr Engineer 5 4 16 12,820 769,200 615,360 Sub-total 10 8 1,670,400 1,343,760 Planning and Design Section13. Principal Engineer 1 1 22 17,500 210,000 210,000 14. Supervising Engineer 4 3 18 14,400 691,200 518,400 15. Sr Engineer 6 5 16 12,820 923,040 769,200 16. Sr Draftsman 2 2 11 9,600 230,400 230,400 Sub-total 13 11 2,054,640 1,728,000 Feasibility Study17. Principal Engineer 1 1 22 17,500 210,000 210,000 18. Supervising Engineer 2 2 18 14,400 345,600 345,600 19. Sr. Engineer 2 2 16 12,820 307,680 307,680 20. Sr Economist 2 1 16 12,820 307,680 153,840 Sub-total 7 6 1,170,960 1,017,120 Construction Management Section21. Principal Engineer 1 1 22 17,500 210,000 210,000 22. Supervising Engineer 4 3 18 14,400 691,200 518,400 23. Sr Engineer 4 3 16 12,820 615,360 461,520 24. Engineer 2 2 14 11,000 264,000 264,000 Sub-total 11 9 1,780,560 1,453,920 Equipment and Management 25. Principal Engineer 1 1 22 17,500 210,000 210,000 26. Supervising Engineer 1 1 18 14,400 172,800 172,800 27. Sr Engineer 2 2 16 12,820 307,680 307,680 28. Drivers 5 3 7 7,400 444,000 266,400 29. Equipment Operators 3 2 9 7,900 284,400 189,600 30. Auto-Mechanic 3 2 9 7,900 284,400 189,600 Sub-total 15 11 1,703,280 1,336,080 Operations Support Division31. Division Chief 1 1 25 19,700 236,400 236,400 32. Clerk 1 1 9 7,900 94,800 94,800 Sub-total 2 2 331,200 331,200 Systems and Water Management Section33. Principal Engineer 1 1 22 17,500 210,000 210,000 34. Supervising Engineer 4 3 18 14,400 691,200 518,400 35. Sr Engineer 6 5 16 12,820 923,040 769,200 36. Soil and Water Specialist 2 2 16 12,820 307,680 307,680 Sub-total 13 11 2,131,920 1,805,280 Institutional Section37. Irrigators Development chief 1 1 22 17,500 210,000 210,000 38. Supervising IDO 4 3 18 14,400 691,200 518,400 39. Sr IDO 4 3 16 12,820 615,360 461,520 Sub-total 9 7 1,516,560 1,189,920 Administrative & Finance Division40. Division Chief 1 1 25 17,500 210,000 210,000 41. Clerk 1 1 9 7,900 94,800 94,800 Sub-total 2 2 304,800 304,800 Personnel, Records & Gen. Services42. Administrative Services chief 1 1 22 17,500 210,000 210,000 43. Personnel Officer 1 1 16 12,820 153,840 153,840 44. Records Officer 1 1 16 12,820 153,840 153,840 45. Procurement and Supply Officer 1 1 16 12,820 153,840 153,840 46. General Services Officer 1 1 16 12,820 153,840 153,840 47. Legal Officer 1 1 22 17,500 210,000 210,000 48. Industrial Security Guards 2 2 7 7,400 177,600 177,600 49. Utility Workers 2 2 7 7,400 177,600 177,600 Sub-total 10 10 1,390,560 1,390,560 Finance and Accounting Section50. Chief Accountant 1 1 22 17,500 210,000 210,000 51. Sr Accountant 3 2 16 12,820 461,520 307,680 52. Sr Financial Analyst 3 2 16 12,820 461,520 307,680 53. Sr Cashier 1 1 16 12,820 153,840 153,840 54. Accountants 5 4 15 12,100 726,000 580,800 Sub-total 13 10 2,012,880 1,560,000
TOTAL 120 100 18,474,000 15,559,200
Service Area of AOO (ha) >150000 50000-150000 TotalManpower output ratio (ha/staff) 1250 1176Number of AIOO 2 4 6 Staff Requirement 120 100Total Manpower 240 400 640 Existing Manpower (13 Regions, UPRIIS &MARIIS) 1,152 Extent of reduction -44%
T - 61

Size of PIMO Service Area (ha) 3000-5000 5001-20000 >20000 Salary Actual Financial RequirementStaff No. Staff No. Staff No. Grade Monthly 3000-5000 5001-20000 >20000
PIMO Head Office Pesos Pesos Pesos1 Provincial Administrator 1 1 1 25 19,700 236,400 236,400 236,400 2 Clerk 1 1 1 9 7,900 94,800 94,800 94,800 Sub-total 2 2 2 331,200 331,200 331,200 Operations Section3 Supvg Engineer 1 1 1 18 14,400 172,800 172,800 172,800 4 Sr Engineer 1 3 4 16 12,820 153,840 461,520 615,360 5 Sr WRFT/IDOs* 5 14 19 16 12,820 769,200 2,153,760 2,922,960 6 WRFT(Operator) 2 8 9 12 10,160 243,840 975,360 1,097,280 7 Agronomist 1 2 2 14 11,000 132,000 264,000 264,000 8 Soils Specialist 1 2 2 14 11,000 132,000 264,000 264,000 9 Utility worker 1 2 2 7 7,400 88,800 177,600 177,600 Sub-total 12 32 39 1,692,480 4,469,040 5,514,000 Repair and Maintenance Section10 Supvg Engineer 1 1 1 18 14,400 172,800 172,800 172,800 11 Sr Engineer 2 3 4 16 12,820 307,680 461,520 615,360 12 Engineer 2 3 3 14 11,000 264,000 396,000 396,000 13 Auto Mechanic 1 2 3 9 7,900 94,800 189,600 284,400 14 Driver Mechanic 1 2 2 9 7,900 94,800 189,600 189,600 15 HE Operator 1 2 2 9 7,900 94,800 189,600 189,600 16 Survey Aide 1 2 2 9 7,900 94,800 189,600 189,600 Sub-total 10 15 17 1,123,680 1,788,720 2,037,360 Administrative & Finance Section17 Administrative Services Officer 1 1 1 18 14,400 172,800 172,800 172,800 18 Cashier 1 1 1 16 12,820 153,840 153,840 153,840 19 Sr Accountant 1 1 1 16 12,820 153,840 153,840 153,840 20 Property Officer 1 1 1 16 12,820 153,840 153,840 153,840 21 Records Officer 1 1 1 16 12,820 153,840 153,840 153,840 22 IRM/Personnel Officer 1 1 1 16 12,820 153,840 153,840 153,840 23 Collection Representative 1 1 2 12 10,160 121,920 121,920 243,840 24 Accountants 2 4 5 15 12,100 290,400 580,800 726,000 25 Clerk 1 1 1 9 7,900 94,800 94,800 94,800 26 Security Guards 1 2 2 7 7,400 88,800 177,600 177,600 27 Utility Worker 1 2 2 7 7,400 88,800 177,600 177,600 Sub-total 12 16 18 1,626,720 2,094,720 2,361,840 Total 36 65 76 4,774,080 8,683,680 10,244,400
* Ratio of 1 IDO/750-1000 ha PIMO Staff Total
3000-5000 27 36 9725001-20000 24 65 1560>20000 9 76 684Dam & Res** 2 62** 124TOTAL 62 3340
Existing StaffPIO 964NISO 2086Dam & Res 286D I-IV 944Total 4280Extent of Reduction -22%
** See Table 7.11
表7.10 州灌漑管理事務所(PIMO)の人員構成(試案)とその必要経費
T - 62

Dam and Reservoir No SG Monthly Annual
Head Office OF UPRIIS D&R Division1 Division Manager 1 25 19,700 236,400 2 Clerk 1 9 7,900 94,800
2 331,200 Pantabangan Dam SectionHead Unit3 Principal Engineer 1 22 17,500 210,000 4 Clerk 1 9 7,900 94,800
2 304,800 Electrical/Mechanical Unit5 Supervising Engineer 1 18 14,400 172,800 6 Sr Engineer 2 16 12,820 307,680 7 Engineer 2 14 11,000 264,000 8 Plant Electrician 2 10 8,600 206,400 9 Plant Mechanic 2 10 8,600 206,400
9 1,157,280 Maintenance Unit10 Supervising Engineer 1 18 14,400 172,800 11 Sr Engineer 2 16 12,820 307,680 12 Engineer 2 14 11,000 264,000 13 HE Operator 1 9 7,900 94,800 14 Auto-Mechanic 1 9 7,900 94,800 15 Driver-Mechanic 2 9 7,900 189,600 16 WRF Operator 2 9 7,900 189,600 17 Other skilled/utility worker 2 9 7,900 189,600
13 1,502,880 Canili-Diayo Dam SectionHead Unit18 Principal Engineer 1 22 17,500 210,000 19 Clerk 1 9 7,900 94,800
2 304,800 Electrical/Mechanical Unit20 Supervising Engineer 1 18 14,400 172,800 21 Sr Engineer 1 16 12,820 153,840 22 Engineer 1 14 11,000 132,000 23 Plant Electrician 1 10 8,600 103,200 24 Plant Mechanic 1 10 8,600 103,200
5 665,040 Maintenance Unit25 Supervising Engineer 1 18 14,400 172,800 26 Sr Engineer 1 16 12,820 153,840 27 Engineer 1 14 11,000 132,000 28 HE Operator 1 9 7,900 94,800 29 Auto-Mechanic 1 9 7,900 94,800 31 Driver-Mechanic 1 9 7,900 94,800 32 WRF Operator 1 9 7,900 94,800 33 Other skilled/utility worker 2 9 7,900 189,600
9 1,027,440 Watershed Management SectionHead Unit34 Watershed Mgt. Chief 1 22 17,500 210,000 35 Clerk 1 9 7,900 94,800
2 304,800 Maintenance Unit36 Forester 2 16 12,820 307,680 37 Agriculturist 1 16 12,820 153,840 38 Forest Assistant 6 10 8,600 619,200 39 Driver-Mechanic 1 9 7,900 94,800
10 1,175,520 Administrative Section40 Administrative Services chief 1 22 17,500 210,000 41 Property & Suply Officer 1 16 12,820 153,840 42 Personnel Officer 1 16 12,820 153,840 43 Sr Accountant 1 16 12,820 153,840 44 Cashier 1 16 12,820 153,840 45 Clerk 1 9 7,900 94,800 46 Security Guard 1 7 7,400 88,800 47 Utility worker 1 7 7,400 88,800
8 1,097,760 TOTAL 62 7,871,520
Source: JICA Study Team
表7.11 UPRIISダム・貯水池部の人員構成(試案)とその必要経費
T - 63

T - 64
表 7.12 特定政府機関の解雇/退職プログラムの特徴
PARTICULARS NATIONAL POWERCORP. (NPC)
GOVERNMENTSERVICE INSURANCE
SYSTEM (GSIS)
DEVELOPMENTBANK OF THE PHILS.
(DBP)
PHILIPPINE NATIONAL BANK(PNB)
LAND BANK OF THEPHILIPPINES
(LBP)
METROPOLITANWATERWORKS &
SEWERAGE SYSTEM(MWSS & LWUA)
Name of theGrant
Special DisengagementProgram (SDP)
1997 GSIS EarlyRetirement/SeparationIncentive Plan (GERSIP)
Early RetirementIncentive Program III(ERIP II)
Special Separation Incentive Plan(SSIP)
Separation IncentiveProgram (SIP)
Early RetirementIncentive Program
Coverage Perm. Co-terminus w/theProj./Perm. Co-terminusw/the AppointingAuthority /Position Co-terminus w/ theincumbent, HumanResources PoolPositions deemed ofabsence due to illnessEndorsed by Cost CenterHeads/Functional Group/Vice PresidentCasual Qualified to retire
All employees regardlessof statusEmployees with pendingcaseEmployees of COA whoare assigned to the GSIS asof the availment ofGERSIP subject toapproval of COA-Chairman
Voluntary basis forofficials and employees
Involuntary Separation, subject toendorsement
Positions that consideredredundantQualified retirees; RA660/1616/8291Rank & File with 50years of ageThose with at least 20years in serviceEmployees sufferingfrom illness
All regular/permanentofficials/employees andcasuals who have servedfor at least one (1) year.
Entitlement Highest Basic Salary XGratuity Months x 1.5LESS: Retirement Gratuity/Lump-sum Benefits from existing retirement plans
150% of the gratuity/lump-sum benefits from existingretirement plans
15 and above = Basic Salary X 1.75 X GM10 < 15 years = Basic Salary X 1.5 X GMBelow 10 years = Basic Salary XYOS X GM
Plus PHP 3,000 forevery governmentservices
Before Privatization (05/26/96)10>15 = [100% x SSL Rate x Years of Service (YOS)]15>20 = [175% x SSL Rate x (YOS)]20>25 = [225% x SSL Rate x (YOS)] PlusAfter Privatization10>15 = [100% x Latest Rate + Allow. x YOS]15>20 = [175% x Latest Rate + Allow. x YOS]20>25 = [225% x Latest Rate + Allow. x YOS]25 and above = [250% x + Latest Rate + Allow x YOS] LessGSIS Gratuity under RA 1616for services rendered in PNB
1.5 = for the first 20years1.75 = for 21-30 years2.00 = for 31 and above
Payment is subject toissuance of GSISclearance.
PLUS: PHP3,000 forevery service in LBP(Given before theirexemption from SSL)
First 20 years = 1.5 peryear20-30 years = 2.0 peryearOver 30 years = 2.5 peryear
Condition ofEntitlement
In the government service Incentive program coversthose who have renderedan aggregate service
In the governmentservice. Available onlyfor retirees of at least 50years old.
Applicable only to those with atleast 10 years service in PNBregardless of age
With at least 5 years inLBP
At least one year inservice
Basic MonthlySalary
NPC Pay Plan GSIS Pay Plan Salary StandardizationRate
SSL Rate before PrivatizationPNB New Pay Plan afterPrivatization
LBP Pay Plan(Exempted from SSL)
Salary StandardizationRate

2001 2002 2003 2004 2005 2006 2007 2008 2009 2010Revenues 1. Irrigation Service Fee Current Accounts 337 351 365 380 415 430 445 460 475 490 Back Accounts 150 158 166 175 183 193 203 213 224 234 Total 487 509 532 554 598 623 648 673 698 724 2. Management Fee 164 299 317 236 326 342 335 307 220 241 3. Equipment Rental 159 159 159 159 159 159 159 159 159 159 4. CIS Equity and Amortization 162 123 99 85 77 72 69 67 66 65 Total Receipts 972 1,090 1,107 1,035 1,160 1,195 1,210 1,206 1,143 1,189 Expenditures1. Personnel Services 1,041 1,083 1,126 1,170 1,198 1,228 1,245 1,270 1,294 1,3152. Other Adinistrative Expenses 195 203 211 219 224 230 233 238 242 2463. Maintenance - Irrigation Facilities (PHP 1000/ha) 709 739 769 799 829 859 889 919 949 979 Total Operating & Maintenance Costs 1944 2024 2105 2187 2251 2316 2366 2426 2485 2540Net Operating Income (Deficit) -972 -934 -997 -1,152 -1,091 -1,121 -1,156 -1,220 -1,342 -1,350 -1,213
Sensitivity Analysis
1. Level of O&M Expenditure @ PHP/Hectare 1,000 1,000 1,000 1,000 1,000 1,000 1,000 1,000 1,000 1,000 1,0002. Level of Collection Efficiency 45% 45% 45% 45% 45% 45% 45% 45% 45% 45%3. Amount of O&M that can be funded from COB -372 -265 -298 -443 -316 -305 -301 -328 -414 -380 -3414. Ratio of Available Income to O&M Requirement -37% -27% -30% -44% -32% -31% -30% -33% -41% -38% -34%
Assumptions: (1) 1975 ISF rates.(2) ISF collection efficiency at 45% (2001 - 2010)(3) Management fee at 5% (2001 - 2010).(4) No early retirement program; retirement only through natural attrition. (Permanent: 1100 spread over ten years)
(Scenario 1 - AO17 ISF Rates - Compulsory Retirement Only)
表8.1 収支分析表、 2001 - 2010 年(シナリオ1)
T - 65
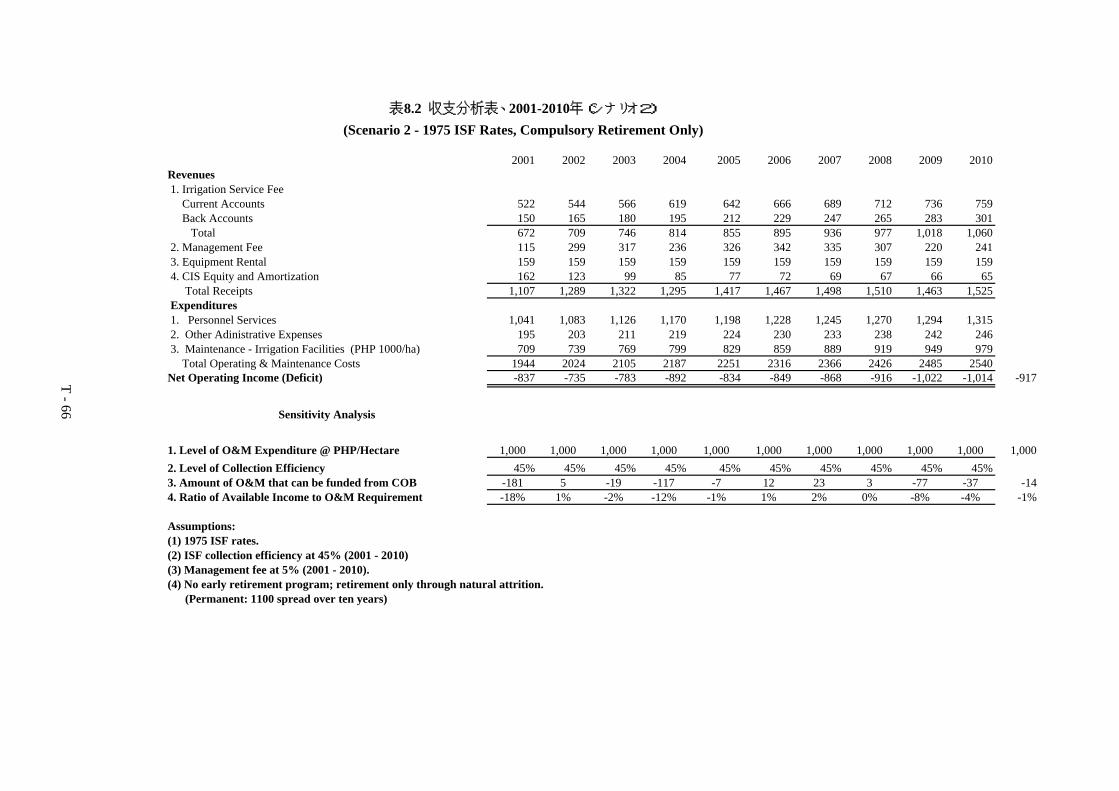
2001 2002 2003 2004 2005 2006 2007 2008 2009 2010Revenues 1. Irrigation Service Fee Current Accounts 522 544 566 619 642 666 689 712 736 759 Back Accounts 150 165 180 195 212 229 247 265 283 301 Total 672 709 746 814 855 895 936 977 1,018 1,060 2. Management Fee 115 299 317 236 326 342 335 307 220 241 3. Equipment Rental 159 159 159 159 159 159 159 159 159 159 4. CIS Equity and Amortization 162 123 99 85 77 72 69 67 66 65 Total Receipts 1,107 1,289 1,322 1,295 1,417 1,467 1,498 1,510 1,463 1,525 Expenditures 1. Personnel Services 1,041 1,083 1,126 1,170 1,198 1,228 1,245 1,270 1,294 1,315 2. Other Adinistrative Expenses 195 203 211 219 224 230 233 238 242 246 3. Maintenance - Irrigation Facilities (PHP 1000/ha) 709 739 769 799 829 859 889 919 949 979 Total Operating & Maintenance Costs 1944 2024 2105 2187 2251 2316 2366 2426 2485 2540Net Operating Income (Deficit) -837 -735 -783 -892 -834 -849 -868 -916 -1,022 -1,014 -917
Sensitivity Analysis
1. Level of O&M Expenditure @ PHP/Hectare 1,000 1,000 1,000 1,000 1,000 1,000 1,000 1,000 1,000 1,000 1,0002. Level of Collection Efficiency 45% 45% 45% 45% 45% 45% 45% 45% 45% 45%3. Amount of O&M that can be funded from COB -181 5 -19 -117 -7 12 23 3 -77 -37 -144. Ratio of Available Income to O&M Requirement -18% 1% -2% -12% -1% 1% 2% 0% -8% -4% -1%
Assumptions:(1) 1975 ISF rates.(2) ISF collection efficiency at 45% (2001 - 2010)(3) Management fee at 5% (2001 - 2010).(4) No early retirement program; retirement only through natural attrition. (Permanent: 1100 spread over ten years)
表8.2 収支分析表、2001-2010年(シナリオ2)
(Scenario 2 - 1975 ISF Rates, Compulsory Retirement Only)
T - 66

2001 2002 2003 2004 2005 2006 2007 2008 2009 2010Revenues 1. Irrigation Service Fee Current Accounts 522 574 629 722 791 863 938 1,016 1,097 1,181 Back Accounts 150 220 296 375 457 536 610 677 732 775 Total 672 794 925 1,097 1,248 1,399 1,548 1,692 1,829 1,956 2. Management Fee 115 299 444 331 457 478 469 430 308 337 3. Equipment Rental 159 159 159 159 159 159 159 159 159 159 4. CIS Equity and Amortization 162 123 99 85 77 72 69 67 66 65 Total Receipts 1,107 1,375 1,627 1,672 1,940 2,108 2,245 2,348 2,362 2,518 Expenditures 1. Personnel Services 1,053 1,106 1,161 1,219 1,280 1,344 1,411 1,482 1,556 1,634 2. Other Adinistrative Expenses 197 207 217 228 240 252 264 277 291 306 3. Maintenance - Irrigation Facilities (PHP 1000/ha) 709 739 769 799 829 859 889 919 949 979 Total Operating & Maintenance Costs 1959 2051 2147 2246 2348 2454 2564 2678 2796 2918Net Operating Income (Deficit) -852 -677 -520 -574 -408 -346 -319 -330 -434 -401 -373
Sensitivity Analysis
1. Level of O&M Expenditure @ PHP/Hectare 1,000 1,000 1,000 1,000 1,000 1,000 1,000 1,000 1,000 1,000 1,0002. Level of Collection Efficiency 45% 48% 50% 53% 55% 58% 61% 64% 67% 70%3. Amount of O&M that can be funded from COB -202 84 324 281 507 597 641 641 542 591 5874. Ratio of Available Income to O&M Requirement -20% 8% 32% 28% 51% 60% 64% 64% 54% 59% 59%
Assumptions: (1) 1975 ISF rates.(2) ISF collection efficiency will increase from 45% (2001) to 70% (2010)(3) Management fee will increase to 7% from 2004.(4) No Early Retirement Program included.
表8.3 収支分析表、2001-2010年(シナリオ3)
(Scenario 3 - 1975 ISF Rates without ERP*)
T - 67
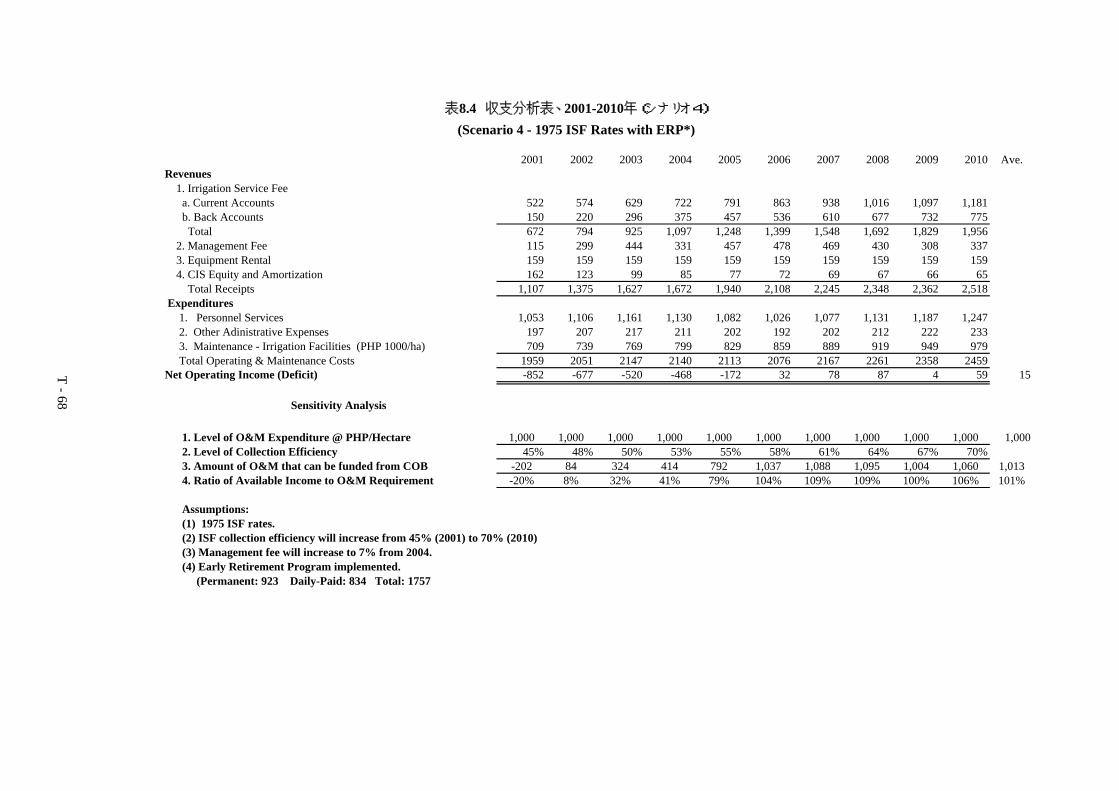
2001 2002 2003 2004 2005 2006 2007 2008 2009 2010 Ave.Revenues 1. Irrigation Service Fee
a. Current Accounts 522 574 629 722 791 863 938 1,016 1,097 1,181b. Back Accounts 150 220 296 375 457 536 610 677 732 775 Total 672 794 925 1,097 1,248 1,399 1,548 1,692 1,829 1,956
2. Management Fee 115 299 444 331 457 478 469 430 308 337 3. Equipment Rental 159 159 159 159 159 159 159 159 159 159 4. CIS Equity and Amortization 162 123 99 85 77 72 69 67 66 65 Total Receipts 1,107 1,375 1,627 1,672 1,940 2,108 2,245 2,348 2,362 2,518 Expenditures 1. Personnel Services 1,053 1,106 1,161 1,130 1,082 1,026 1,077 1,131 1,187 1,247 2. Other Adinistrative Expenses 197 207 217 211 202 192 202 212 222 233 3. Maintenance - Irrigation Facilities (PHP 1000/ha) 709 739 769 799 829 859 889 919 949 979 Total Operating & Maintenance Costs 1959 2051 2147 2140 2113 2076 2167 2261 2358 2459Net Operating Income (Deficit) -852 -677 -520 -468 -172 32 78 87 4 59 15
Sensitivity Analysis
1. Level of O&M Expenditure @ PHP/Hectare 1,000 1,000 1,000 1,000 1,000 1,000 1,000 1,000 1,000 1,000 1,0002. Level of Collection Efficiency 45% 48% 50% 53% 55% 58% 61% 64% 67% 70%3. Amount of O&M that can be funded from COB -202 84 324 414 792 1,037 1,088 1,095 1,004 1,060 1,0134. Ratio of Available Income to O&M Requirement -20% 8% 32% 41% 79% 104% 109% 109% 100% 106% 101%
Assumptions:(1) 1975 ISF rates.(2) ISF collection efficiency will increase from 45% (2001) to 70% (2010)(3) Management fee will increase to 7% from 2004.(4) Early Retirement Program implemented. (Permanent: 923 Daily-Paid: 834 Total: 1757
表8.4 収支分析表、2001-2010年(シナリオ4)
(Scenario 4 - 1975 ISF Rates with ERP*)
T - 68

2001 2002 2003 2004 2005 2006 2007 2008 2009 2010 Ave.Revenues 1. Irrigation Service Fee
a. Current Accounts 522 574 629 722 791 863 938 1,016 1,097 1,181b. Back Accounts 150 220 296 375 457 536 610 677 732 775 Total 672 794 925 1,097 1,248 1,399 1,548 1,692 1,829 1,956
2. Management Fee 115 299 444 331 457 478 469 430 308 337 3. Equipment Rental 159 159 159 159 159 159 159 159 159 159 4. CIS Equity and Amortization 162 123 99 85 77 72 69 67 66 65 Total Receipts 1,107 1,375 1,627 1,672 1,940 2,108 2,245 2,348 2,362 2,518 Expenditures 1. Personnel Services 1,053 1,106 1,161 1,130 1,131 1,129 1,186 1,245 1,307 1,373 2. Other Adinistrative Expenses 197 207 217 211 212 211 222 233 245 257 3. Maintenance - Irrigation Facilities (PHP 1000/ha) 709 739 769 799 829 859 889 919 949 979 Total Operating & Maintenance Costs 1959 2051 2147 2140 2171 2199 2296 2397 2500 2608Net Operating Income (Deficit) -852 -677 -520 -468 -231 -91 -51 -48 -138 -90 -108
Sensitivity Analysis
1. Level of O&M Expenditure @ PHP/Hectare 1,000 1,000 1,000 1,000 1,000 1,000 1,000 1,000 1,000 1,000 1,0002. Level of Collection Efficiency 45% 48% 50% 53% 55% 58% 61% 64% 67% 70%3. Amount of O&M that can be funded from COB -202 84 324 414 721 894 942 947 854 908 8784. Ratio of Available Income to O&M Requirement -20% 8% 32% 41% 72% 89% 94% 95% 85% 91% 88%
Assumptions: (1) 1975 ISF rates.(2) ISF collection efficiency will increase from 45% (2001) to 70% (2010)(3) Management fee will increase to 7% from 2004.(4) Early Retirement Program implemented. (Permanent: 489 Daily-Paid: 834 Total: 1,323)
表8.5 収支分析表、2001-2010年(シナリオ5)
(Scenario 5 - 1975 ISF Rates with ERP*)
T - 69